
ISSN 0732 507X
Metropolitan Studies Program SeriesOccasional Paper No. 191
WHERE DOES THE MONEY COME FROM? THE FINANCING OF SMALL
ENTREPRENEURIAL ENTERPRISES
Zsuzsanna Fluck, Douglas Holtz-Eakin, and Harvey Rosen
Center for Policy ResearchMaxwell School of Citizenship and Public Affairs
Syracuse UniversitySyracuse, New York 13244-1020
July 1998
$5.00
We thank Esther Gray, Mary Santy, and Ann Wicks for their undying patience inpreparing the manuscript and Donald Bruce for his superb research assistance. Weare grateful to Yakov Amihud, William Gentry, Paul Gompers, Laurie Hodrick,Steve Kaplan, Josh Lerner, Burton Malkiel, Tim Opler, Mitchell Petersen, JamesPoterba, Raghu Rajan, Roberta Romano, Tony Saunders, Greg Udell, DavidYermack, Luigi Zingales, and seminar participants at Columbia University and theNBER Corporate Finance Winter 1997 Meetings for useful comments. Thisresearch was supported in part by Princeton University’s Center for EconomicPolicy Studies and Syracuse University’s Center for Policy Research. Rosen was aVisiting Scholar at the Sage Foundation when this research was being conducted.

CENTER FOR POLICY RESEARCH - SPRING 1998
Timothy M. Smeeding, DirectorProfessor of Economics & Public Administration
Associate Directors
Margaret M. Austin Douglas Holtz-EakinAssociate Director, Professor of Economics
Budget and Administration Associate Director, Center for Policy Research
Richard V. Burkhauser John YingerProfessor of Economics Professor of Public Administration & Economics
Associate Director, Aging Studies Program Associate Director, Metropolitan Studies Program
SENIOR RESEARCH ASSOCIATES
William Duncombe . . . . . . . Public AdministrationThomas Dunn . . . . . . . . . . . . . . . . . . . EconomicsJames Follain . . . . . . . . . . . . . . . . . . . EconomicsVernon Greene . . . . . . . . . . Public AdministrationDavid Greytak . . . . . . . . . . . . . . . . . . . EconomicsLeah Gutierrez . . . . . . . . . . Public AdministrationChristine Himes . . . . . . . . . . . . . . . . . . . SociologyDouglas Holtz-Eakin . . . . . . . . . . . . . . EconomicsJacqueline Johnson . . . . . . . . . . . . . . . . SociologyBernard Jump . . . . . . . . . . . Public AdministrationDuke Kao . . . . . . . . . . . . . . . . . . . . . . Economics
Jeff Kubik . . . . . . . . . . . . . . . . . . . . . . EconomicsMadonna Harrington Meyer . . . . . . . . . . SociologyJerry Miner . . . . . . . . . . . . . . . . . . . . . EconomicsJan Ondrich . . . . . . . . . . . . . . . . . . . . . EconomicsJohn Palmer . . . . . . . . . . . . Public AdministrationGrant Reeher . . . . . . . . . . . . . . . Political ScienceJodi Sandfort . . . . . . . . . . . . Public AdministrationMichael Wasylenko . . . . . . . . . . . . . . . EconomicsDouglas Wolf . . . . . . . . . . . . Public AdministrationAssata Zerai . . . . . . . . . . . . . . . . . . . . . Sociology
RESEARCH ASSOCIATES
Stacy Dickert-Conlin . . . . . . . . . . . . . . . . . . . . . . . . . . . . . . . . . . . . . . . . . . . . . . . . . . . . . . . . . . . . EconomicsDiane Macunovich . . . . . . . . . . . . . . . . . . . . . . . . . . . . . . . . . . . . . . . . . . . . . . . . . . . . . . . . . . . . . . EconomicsAndrew Houtenville . . . . . . . . . . . . . . . . . . . . . . . . . . . . . . . . . . . . . . . . . . . . . . . . . . . . . . . . . . . . . Economics
GRADUATE ASSOCIATES
Andrea Abernathy . . . . . . . . Public AdministrationHakan Aykan . . . . . . . . . . . . Public AdministrationElizabeth Bernhardt . . . . . . . Public AdministrationRobert Bifulco . . . . . . . . . . . Public AdministrationLloyd Blanchard . . . . . . . . . . Public AdministrationDon Bruce . . . . . . . . . . . . . . . . . . . . . . EconomicsMohua Das . . . . . . . . . . . . . . . . . . . . . EconomicsDeb Dougherty . . . . . . . . . . . . . . . . . . . SociologyJamie Emerson . . . . . . . . . . . . . . . . . . EconomicsMarcia Fulvi . . . . . . . . . . . . . . . . . . . . . SociologySeth Giertz . . . . . . . . . . . . . . . . . . . . . EconomicsTess Heintze . . . . . . . . . . . . Public Administration
Gretchen Olson Kopp . . . . . Public AdministrationChunling Lu . . . . . . . . . . . . . . . . . . . . . EconomicsAnna Lukemeyer . . . . . . . . . Public AdministrationMathew Lyon . . . . . . . . . . . . Public AdministrationDonald Marples . . . . . . . . . . . . . . . . . . EconomicsMark Robbins . . . . . . . . . . . Public AdministrationKatherin Ross . . . . . . . . . . . . . . . . Social ScienceIra Singh . . . . . . . . . . . . . . . Public AdministrationRobert Weathers . . . . . . . . . . . . . . . . . EconomicsKristina Wolff . . . . . . . . . . . . . . . . . . . . SociologyWilson Wong . . . . . . . . . . . . Public Administration
STAFF
Martha W. Bonney . . . . . . . . . . . Publications andEvents Coordinator Anne Metzger-Wormuth . . . . . . . . . . Receptionist
Barbara Butrica . . . . . . . . . . . . . . . . Data ManagerKaren Cimilluca . . . . . Librarian/Office CoordinatorKati Foley . . . . . . . . Administrative Assistant, LISEsther Gray . . . . . . . . . . Administrative SecretaryGina Husak . . . . . . . . . . . Secretary to the Director
Detlef Jurkat . . . . . . . . . . . . . . . . . . . . . Translator
Annie Pennella . Editorial Assistant, GerontologistMary Santy . . . . . . . . . . . . . . . . . . . . . . SecretaryAnn Wicks . . . . . . . . . . . Administrative SecretaryLobrenzo Wingo . . . . . . . . . Computor Consultant

Where Does the Money Come From?The Financing of Small Entrepreneurial Enterprises
ABSTRACT
Using data from the Wisconsin Entrepreneurial Climate Study, we study the sources of
firms’ finance during the very early stages of their lives. Our focus is the evolution of the mix of
financial capital from “insiders” and “outsiders” as firms age. We find that at the beginning of
firms’ life cycles, the proportion of funds from internal sources increases with age, while the
proportion from banks, venture capitalists, and private investors declines. There is also evidence
that these patterns eventually reverse themselves, with the proportion of insider finance ultimately
declining and the proportion of outsider finance increasing with age. We argue that these findings
are consistent with elements of both reputation-based and monopoly-lender theories of firm
finance.
Zsuzsanna Fluck Douglas Holtz-Eakin Harvey S. RosenStern School of Business Department of Economics Department of EconomicsNew York University Center for Policy Research Princeton University44 West 4th Street Syracuse University Princeton, NJ 08544New York, NY 10012 Syracuse, NY 13244-1020(212) 998-0341 (315) 443-3115 (609) [email protected] [email protected] [email protected]

1. Introduction
Obtaining enough capital to finance business growth and expansion is a perennial concern
of entrepreneurs. In recent years the public and policymakers have also become increasingly
interested in the financing of small businesses. For example, Hillary Rodham Clinton has helped
put the problem of improving small firms’ access to capital in the spotlight, observing that
“Microcredit is an invaluable tool in alleviating poverty, promoting self-sufficiency, and
stimulating economic activity.”1
Financial economics has made significant progress in explaining the incentives that lead
entrepreneurs and investors to enter into particular financing arrangements. There is a rich
theoretical literature on the role of market imperfections in affecting the selection and financing of
entrepreneurial firms’ investment opportunities. This literature identifies transaction costs,2
asymmetric information, and agency conflicts as the sources of market imperfections and seeks to
explain how bank financing, venture capital and private equity facilitate the financing of positive
net present value projects. It shows that banks and venture capitalists alleviate asymmetric
information and agency problems by gathering and processing information (Diamond [1984,
1991], Ramakrishnan and Thakor [1984], Boyd and Prescott [1984]), by setting covenants and
collaterals into loan contracts (Myers [1977], Boot and Thakor [1994]), and by staging venture
capital financing (Chan [1983], Admati and Pfleiderer [1994]).
Most of the empirical work on the sources of firm finance has focused on relatively large
enterprises. The ways in which large and small firms obtain funds differ significantly, and there
have been only a few empirical studies investigating the financing of small entrepreneurial firms.
These important studies focus primarily on how various financial arrangements are structured.
Petersen and Rajan [1994, 1995] analyze the bank-creditor relationship, and report that the
primary benefit to an entrepreneur of close ties with a single financial intermediary is an increase

-2-
in the availability of credit. Focusing on a particular type of bank arrangement, bank lines of
credit, Berger and Udell [1995] find that borrowers with longer banking relationships pay lower
interest rates and are less likely to pledge collateral. Gompers [1995] analyzes the arrangements
between venture capitalists and small firms and finds that the frequency of monitoring by venture
capitalists increases as assets become less tangible, growth options increase, and asset specificity
rises. Studying the long-run effectiveness of public programs to provide early-stage financing to3
firms, Lerner [1997] finds that Small Business Innovation Research (SBIR) awardees grew
significantly faster than a matched set of firms over a ten-year period.
This paper abstracts from the details of particular financial arrangements, and seeks to
augment our understanding of entrepreneurs’ choices among these arrangements. Our starting
point is an implication of much of the modern theorizing on the evolution of entrepreneurial
finance— at some point in its life-cycle, a young enterprise “turns the corner” and is able to obtain
external finance. Is there really such a turning point, and if so, why and at what age does it occur?
Furthermore, from then onward, do we see a gradual increase in funds provided by banks, venture
capitalists, and outside investors?
To answer these questions, we utilize a unique data set collected by Marquette University
to analyze the life-cycle of the financial structure of small entrepreneurial firms. The survey
provides us with valuable information about firm characteristics, personal attributes of the
entrepreneur, the nature of product market competition, and the financial structure of the
enterprise. The firms in this survey are substantially smaller and younger than those in the
National Survey of Small Business Finances used by Petersen and Rajan [1994, 1995] and Berger
and Udell [1995]. A distinctive feature of this data set is that it contains information that is
typically unavailable to outside observers of small firms, including the entrepreneur’s assessment

-3-
of the growth opportunities of the firm, the financial constraints facing the firm, the funds needed
for expansion, and the uniqueness of the product.
We find evidence of a nonmonotonic relationship between capital structure and the age of
the firm. In the early years of operation the proportion of financing from insiders (the
entrepreneur, friends and family, business associates) increases. After reaching a peak, the
proportion of insider finance declines, and the fraction of external financing (bank, venture capital,
private investors) rises. While it is difficult to estimate the precise age at which the proportion of
insider finance begins to fall, it appears to take place relatively early in the life cycle— between
two and nine years, depending on the specification of the statistical model.
Our evidence supports a combination of the monopoly-lender theory of Rajan [1992], and
the reputation theory of Diamond [1991]. We consider and reject several other possible
explanations for the observed life-cycle pattern of financing. In particular, we argue that the
increase in the fraction of insider finance in the early years of the firm’s operation is unlikely to be
a consequence of the build-up of sweat equity. Neither can this phenomenon be attributed to a
“portfolio” story, in which the entrepreneur invests more in his firm because as it ages the
expected return of the project increases, and/or its perceived risk declines. By appealing to
Myers’ [1984] pecking order theory of finance we show further that the composition of finance in
our data cannot be explained by a buildup of retained earnings.
The paper is organized as follows. In Section 2 we discuss the theories related to our
study. Section 3 contains a description of the data. Section 4 discusses our econometric methods
and empirical findings. Section 5 presents our conclusions.

-4-
2. Theories
In a perfect capital market, funds are always available for projects that have a positive net
present value. In the presence of market frictions, however, investors ration capital. The
underlying sources of these market imperfections and the mechanisms developed to overcome
them form the bases of various theories on the financing choices of entrepreneurs.
Capital market frictions are induced when project choices and entrepreneurial ability are
unobservable or costly to verify, or when entrepreneurs have the ability to misrepresent cash
flows, to shirk or to follow suboptimal investment policies. In the presence of capital market
frictions, profitable projects may be denied funding, or only be able to obtain certain types of
funding. To the extent that the firm can establish a mechanism for transmitting information to4
investors, it can attenuate some of the asymmetric information problems and obtain external
financing (Stiglitz and Weiss [1981]).
One way of doing so is to build a relationship with an informed investor such as a bank or
a venture capitalist. Banks and venture capitalists monitor the firm closely and learn about the
entrepreneur’s abilities. Indeed, a fundamental element of venture capital financing is the
maintenance of close relationships with entrepreneurs. As the manager of one venture capital
fund noted, “We are more likely to back a guy we’ve backed before or give him the benefit of the
doubt because we know him” (Selz [1996]). The monopoly-lender theory associated with Rajan
[1992] stresses the fact that the information obtained by the bank or venture capitalist is its
private information. By virtue of this fact, over time these financiers acquire an informational
monopoly over the firm, enabling them to earn substantial profits from their lending relationships
with the entrepreneur (Greenbaum et al. [1989], Sharpe [1990], and Rajan [1992]).

-5-
In contrast, Diamond’s [1991] reputation-based theory argues that even if the initial
financier’s information is private, outside investors can observe the firm’s track record, examine
its long-term interaction with its financiers, and assess its creditworthiness. This enables firms
with good reputations to access cheaper financing from public debt holders and equity holders.
Diamond’s analysis suggests a life-cycle pattern of the financing of small entrepreneurial
enterprises. Initially, bank and venture capital financing increases while firms reduce their
dependence on personal funds. As they develop a solid reputation, firms reduce their dependence
on bank and venture capital financing and access the public debt and equity markets.
According to Myers’ [1984] pecking order theory of finance, asymmetric information
induces firms to sequence financing. Capital structure decisions may be driven by firms’ desire to
finance new investment first by retained earnings, then by low risk debt, and finally by equity.
Since the firm’s ability to generate more retained earnings increases as it grows, the entrepreneur
will use these internally generated funds to finance the next project, turning to external finance
only as retained earnings are exhausted. At the same time, firms with attractive growth prospects
can employ more funds and exhaust their retained earnings faster. By virtue of this fact, these
firms need more external finance. Thus, the pecking order theory implies that the proportion of
financing from insiders increases with the size and decreases with the growth opportunities of the
firm.
A common theme in all these theories is that the extent of uncertainty about the firm’s
cash flows affects both investors’ willingness to finance the project and the entrepreneur’s choice
of how to finance it. Holding constant the expected rate of return, a rise in the variability of cash
flows increases the likelihood of being denied certain types of financing (Myers [1977],

-6-
Fluck [ 1997, 1998]). In Myers [1977], stockholders have incentives to reject positive net present
value projects when most of the benefits would accrue to bondholders. In Fluck [1998], positive
net present value projects may be denied debt financing due to agency conflicts between the
entrepreneur-manager and potential claimholders. Alternatively, to the extent that investors have
limited liability, increased uncertainty may actually enhance the attractiveness of the project. With
losses limited, the upside associated with increased uncertainty is not accompanied by a
countervailing increase in risk. As The Economist [1997, p. 11] noted “Actively seeking risk
makes sense for venture capitalists. Many of their gambles do not come off, but some of those
that make it deliver huge rewards.” Although the theories disagree with respect to how financing
will be affected when uncertainty increases, they agree that variability of cash flows does have an
impact on financial structure.
When thinking about pitting the various theories against each other, it is important to
realize that certain key constructs are simply unobservable. For example, in the theories based on
asymmetric information, the entrepreneur’s reputation plays a critical role, but cannot be
observed. What we can see is the age of the firm. Our empirical strategy, outlined below, is to5
rely on observables such as the composition of firm financing and the age and various
characteristics of the firm, to make inferences about which theories are more consistent with
reality. In this context, it should be noted that our sample is particularly well suited for this
purpose, because it contains a number of variables relating to the status of the enterprise that are
not available in other surveys (see Section 3.3 below).

-7-
3. Data
3.1 General Description
Our empirical work is based upon data from the Wisconsin Entrepreneurial Climate Study,
a Marquette University survey of active young firms in that state. Developing the sample
involved three steps. The first was to compile a list of all new entries into the Wisconsin6
unemployment insurance (UI) file between 1986 and 1991. (In Wisconsin, as in every state, all
firms with employees must make payments into the state unemployment insurance system.)
About 27,000 firms entered Wisconsin’s UI system during this period. An important consequence
of drawing the sample in this fashion is that, by definition, it consists only of firms with
employees— enterprises that are entirely owner-operated are excluded. Second, a sample was7
selected and the principal of each firm was contacted to determine whether it was an autonomous
startup (as opposed, for example, to a subsidiary of some other company), and whether the firm’s
first sales were made between one and six years prior to the interview. On this basis, about half8
the firms qualified for the survey. The survey writers did not exclude entrepreneurs who were no9
longer in business (active) at the time the survey was conducted. We do not know how many
such firms were included in the survey. Third, of the firms that qualified, 541 were interviewed.
These firms serve as our basic sample. However, a substantial number of observations were10
missing data on variables that are central to this study; as noted below, a typical regression has
about 200 observations.11
We have grouped the firms into six industrial categories. The largest number, 69, are in
business services and health; the smallest, 10, are in finance, insurance, and real estate. With
respect to organizational form, 35 percent are sole proprietorships, 9 percent partnerships and 54
percent corporations. 12

-8-
Table 1 contains summary statistics by industry on total assets of each firm. Mean assets
differ substantially, ranging from $86,000 in construction to $733,000 in manufacturing. Further,
as evidenced by the large standard deviations, there is enormous heterogeneity within industry
classes as well. The table also provides information on the ages of our firms, defined as the
number of months since the initial legal form of the firm was established. The average age for the
sample as a whole is about 58 months. This does not vary substantially across industries,
although, again as evidenced by large standard deviations, there is considerable variation within
industries.
These data provide a unique opportunity to look at the early stages of businesses’ lives as
our firms are substantially smaller (as measured by total assets) and younger than those in other
“small business” data sets. For example, in the National Survey of Small Business Finances
(NSSBF) conducted by the Board of Governors of the Federal Reserve System, the mean assets
for manufacturing firms are $2,839,000 and for construction firms $708,000, as compared to our
figures of $733,000 and $86,000, respectively. Similarly, in the NSSBF data, there is no
industrial category in which the mean age is less than 12 years (see Petersen and Rajan [1994]).
These differences are not surprising. The NSSBF data are meant to be representative of all small
businesses, while the Wisconsin data are based only on young firms.
3.2 Sources of Financing
Our data set provides detailed information about the firms’ sources of finance. The key
question asks how much of the firms’s financing comes from (1) the respondent’s own funds;
(2) other start-up team members; (3) family members (spouses, parents, etc.); (4) friends or
business associates; (5) banks or other lending institutions; (6) venture capitalists; (7) private

-9-
investors; (8) government; (9) stockholders; and (10) bondholders. A detailed summary of the13
financing for sources 1 through 7, by the age of the firm, is shown in Table 2.
To keep the analysis manageable, we grouped sources of finance into five categories: i)
insiders: people with close relations to the owner (respondent, other members of the start-up
team, family members, friends and business associates); ii) outside financiers who monitor the
activities of the firm very closely (banks, venture capitalists, private investors); iii) stockholders;
iv) bondholders; and v) government and others. Importantly, our categories refer to the source of
finance, not the contractual nature of the arrangement (e.g., debt versus equity). Note also that
this classification includes retained earnings and trade credit among insider sources of finance.14
Table 3 shows how the proportions of financing from each source are distributed across
our firms. It is clear that hardly any firms in our sample rely on stockholders, bondholders,
government, and “other.” This is not surprising since most of our firms are small entrepreneurial
companies, and typically small businesses do not get financing from stock and bond issues (see
Fenn, Liang, and Prowse [1996]). Since there is no point in trying to explain variables whose15
values are practically all zero, from here on, the focus of our attention will be on the first two
categories, which we will refer to as “insider” and “outsider” sources of finance, respectively.
Another observation from Table 3 is that the distributions of the proportions of both insider and
outsider finance exhibit substantial pile-ups of density at one and zero, respectively. This fact will
be important later when we are formulating an econometric strategy to analyze the variation in
these proportions across firms.

-10-
3.3 Characteristics of the Firms
The survey contains information that allows us to generate a set of variables relating to
characteristics of the firms. To begin, along the lines suggested in Table 1, we construct a set of
dichotomous variables representing the industry in which the firm operates. (The omitted
industrial category is consumer and business services.) As suggested by Shleifer and Vishny
[1992] and others, investment opportunities within industries tend to move together, suggesting
that a firm’s industrial classification is a useful proxy for its investment prospects.
Our discussion in Section 2 indicated that the uncertainty associated with the firm’s
revenue stream affects its access to capital. The survey allows us to create several variables to
characterize the riskiness of the enterprise. As noted above, the firms in our sample are asked to
describe themselves as being high-tech or not. Since the cash flows of high-tech firms typically
vary more than those of others, we create a variable HITECH which takes a value of one if the
entrepreneur has classified his or her firm as being high-tech. As indicated in Table 4, 3316
percent of our firms fall into this category. The relatively large fraction of our firms classifying
themselves as “hi-tech” reflects the survey design, which deliberately oversampled firms among 57
4-digit SIC industries deemed to be hi-tech. 17
Second, having a unique product might expose a firm to higher business risk, since
entering a new market without a well-defined customer base is inherently risky. Hence, we
introduce a variable UNIQUE that takes a value of one if the entrepreneur answered yes when
asked whether his or her firm has a “unique product, source of supply or method of distribution.”
Uniqueness, of course, is a subjective attribute. It is hard to know whether or not the 75 percent
of our firms who characterize themselves this way are “truly” unique. Our inclination is to take
-11-
advantage of this (and other) subjective measures in the survey, and let the data tell us whether or
not they have any explanatory power.
Since stable firms are likely to face lower business risk, we are also interested in whether
the entrepreneur views his or her business situation as being stable. The respondents were asked
whether they thought their firms would “continue to operate pretty much as [they] have.” We
create a third variable, STABLE, which takes a value of 1 if the answer is affirmative.
The survey also includes some useful information about the firm’s market environment, in
particular, how concentrated its customer base is. The variable TOP3% gives the percentage of
1991 sales that went to the firm’s three largest customers. This variable may be another indicator
of the degree of uncertainty facing the firm— the greater the value of TOP3%, the more danger it
faces if a single customer or two decide to take their business elsewhere.
The scale of the enterprise is another relevant characteristic of the firm. On one hand, size
is another potential proxy for the firm’s investment opportunities. Small firms tend to have
greater investment opportunities than their counterparts (Fenn, Liang, and Prowse [1996]). On
the other hand, both theoretical and empirical work suggest that firm size exerts an independent
effect on financing choices , see e.g., Myers [1984]. (Large firms, for example, might have more
retained earnings.) Our scale variable for this purpose is the firm’s total employment
(TOTEMP)— the sum of full-time and part-time employees.18
In addition to industrial classification and firm size, the survey provides another measure
of investment opportunities. Entrepreneurs are asked a series of questions relating to the growth
prospects of their firms. Rather than arbitrarily choosing one of these questions, we construct an
expected growth variable that is a composite. Specifically, we created the variable GROWTH, a
dichotomous variable that indicates whether the firm has attractive growth prospects, as follows:
GROWTH is equal to one if the owner agrees with the statement that “right now our firm is

-12-
growing so fast that it’s almost impossible to plan and control the way we would like” or if the
annual sales growth rate from 1990 to 1991 or 1991 to 1992 was greater than 15 percent or if the
entrepreneur indicated that in the next two to three years, he or she planned to increase
significantly the number of employees. The firms’ growth prospects are relevant to its financial19
structure because firms with attractive growth opportunities typically need to supplement retained
earnings with outside funds in order to finance their expansions.
Expected returns are likely to be low for a firm that is struggling to survive. To measure
economic distress, we create the variable SURVIVE that takes a value of one if the entrepreneur
agrees with the statement “I’d have to say that business survival is our main goal at the moment.”
The survey has several questions asking the entrepreneur whether he or she can obtain
“necessary” funds. This information is valuable because a common implication of almost all
theories of firm financing is that some projects may fail to receive financing, despite the fact that
they have positive net present value. Two variables from the survey address directly the question
of whether the entrepreneur faces capital constraints. In the first, the entrepreneur is asked to
specify the additional funds needed in order to survive. The variable AFN is the response. Insurvive
contrast, the variable AFN is the entrepreneur’s estimate of the additional funds that the firmexpand
could invest and still provide a competitive return to investors. To be sure, there are difficulties in
the interpretation of these variables. The question does not specify the time period over which the
funds are not needed, and it is a possibility that the entrepreneurs are exaggerating their ability to
employ capital. On the other hand, self-reported measures of liquidity constraints have been used
in other studies (Kaplan and Zingales [1997]), and may potentially be more reliable than weakly
related “objective” measures. Our view is that it is worth seeing whether or not these variables
have any explanatory power. After all, if they are meaningless pronouncements of the
entrepreneurs, then they will show up as insignificant in the equations.
-13-
3.4 Characteristics of the Entrepreneurs
Our sample has some potentially useful information about personal characteristics of the
entrepreneurs that might affect their propensity to obtain and provide different types of financing.
Older and better educated entrepreneurs may have greater wealth, enhancing both their ability to
self-finance and their access to external sources of capital. (Unfortunately, we do not have any20
direct measure of the entrepreneur’s wealth in our data.) Hence, we include EAGE, the
entrepreneur’s age, and COLLEGE, a dichotomous variable that takes a value of one if the
entrepreneur has a college (or greater) degree. Gender and race are also correlated with
individual wealth (see Blau and Graham [1990]). Further, women and minorities may have
limited access to capital lending networks, or certain kinds of lenders might discriminate against
them. Hence, we include the variable FEMALE, which is equal to one if the entrepreneur is a
woman, and zero otherwise. Twenty-three percent of our entrepreneurs are female. Finally, the
variable MINORITY is equal to one if the individual is not white; because the survey oversamples
nonwhites, about 15 percent of our sample falls into this category. This contrasts with the21
NSSBF data set described above, in which only 12 percent of the businesses are owned by women
and 7 percent by minorities.
4. Econometric Specification and Results
4.1. Econometric Issues
Our goal is to see whether we can isolate any life-cycle pattern in the financing choices of
our entrepreneurial firms. Hence, we investigate how the proportions of “insider” and “outsider”
sources of funds vary with the age of the firm, holding constant the nature of the environment in
which the firm operates and the characteristics of the entrepreneur. A natural strategy is to
estimate regressions of the proportions of “insider” (INSIDER) and “outsider” (OUTSIDER)

-14-
financing on some function of AGE, and the covariates listed in Table 4. We chose a quadratic in
AGE because it is the simplest function that allows for the possibility of a nonmonotonic
relationship. A complication arises because INSIDER and OUTSIDER are proportions, and as
shown in Table 3, there is a substantial concentration of the densities of these variables at either
zero or one. Under such circumstances, ordinary least squares regression does not generate
consistent parameter estimates. Instead we use a two-limit Tobit estimator, which explicitly
allows for the fact that the dependent variable is bounded above and below.22
4.2 Basic Results
The results are reported in Table 5, which shows the two-limit Tobit estimates and their
standard errors. We begin our discussion of the results by considering the coefficients on AGE
and AGE in the equation for INSIDER sources of financing (column (1)). Both the linear and2
quadratic terms are significant at conventional levels; the linear term is positive and the quadratic
term is negative. Hence, the relationship between the proportion of financing from insider sources
and age of the enterprise is nonmonotonic. The coefficients imply that INSIDER increases until
the firm is 108 months old, at which point it decreases. The qualitative results for OUTSIDER23
finance, in column (2), are just the opposite— the proportion decreases and then increases with
age. The point at which OUTSIDER finance starts to increase is 142 months. Recall from our
discussion in Section 3.3 that the sum of financing from insider sources (INSIDER) and from
banks, venture capital and private investors (OUTSIDER) does not exhaust all the sources of
finance, so there is no need for their life-cycle patterns to be mirror images of each other.
For purposes of easy reference, we graph the implied relations between AGE and sources
of finance in Figure 1. Specifically, we graph the relationship between AGE and observed insider
and outsider financing. To do so, for each value of AGE, we compute the expected value of

-15-
INSIDER and OUTSIDER, evaluated at the means of the other right-hand side variables. Our
graph thus takes into account the restriction that INSIDER and OUTSIDER may not fall outside
of the [0,1] interval. Figure 1 also shows standard error bands around the predicted values. 24
Specifically, the bounds in the figure show the effect of adding or subtracting one standard
deviation of the prediction variance from the expected value for each AGE.25
How does one explain the patterns in this figure? Our preferred explanation contains
elements of both the reputation-based theory and monopoly-lender theory outlined in Section 2.
Imagine a start-up firm that is entering into a relationship with a venture capitalist or a bank. That
venture capitalist or bank monitors the firm. As time moves on, it obtains valuable private
information about the firm. This information cannot be passed on to other potential lenders
because of a potential conflict of interest. Without the information, such lenders may be hesitant
to provide funds to the firm. Indeed, other lenders may believe that the main reason that the firm
is approaching them is that their original lender has rejected them. As emphasized by Rajan
[1992], this reduces even further the likelihood that other lenders will be forthcoming with
financing. All of this, in effect, gives some monopoly power to the current lender.
The monopoly lender may try to exploit his position by extracting rents from the
entrepreneur. High interest payments may be an impediment to the entrepreneur’s ability to
obtain sufficient external financing for certain positive net present value projects. Unless insiders
finance these projects, they will not be undertaken. Hence, the proportion of insider financing
increases and the proportion of bank/venture capital financing falls. To the extent that the number
of positive net present value projects increases with the age of the firm, so does the extent to
which the constraint imposed by the monopoly lender is binding, and the proportion of financing
from insiders grows commensurately.

-16-
Now, as time goes on, the firm develops a reputation among market participants. Indeed,
the mere fact that the firm survives for a substantial number of years may serve as a signal that the
firm is a good investment. As Diamond [1991] stresses, at this point other financiers become26
willing to supply additional funds, breaking the monopoly of the initial lender and enabling the
firm to obtain cheaper financing. In time, this can be expected to reverse the positive relationship
between the proportion of insider finance and the age of the firm. As noted above, for the oldest
firms in our data there is some evidence that this is the case. The focus of our data set, however,
is on very young firms, so it is not ideally suited for exploring this reversal phenomenon. In this
context, it is important to note that when Petersen and Rajan studied the NSSBF data, which is
dominated by firms that are substantially older than ours, they found that the proportion of
outside financing increased with age. Their results can thus be viewed as complementary to our
own.
4.3 Alternative Interpretations
As noted in Section 2, there are several alternative explanations for the positive
relationship between the fraction of insider financing and firm age. The first is that members of
the start-up team defer their compensation so that more funds can be plowed back into the firm
(sweat equity). As the firm ages, so grows the proportion of insider financing, ceteris paribus. If
this hypothesis is correct, then one would expect that the increase in financing from the
respondent and other start-up team members would be driving the increase in the fraction of
insider financing. To see whether this is the case, we decomposed INSIDER into two parts— one
due to the respondent and other members of the start-up team; and the other due to relatives and
friends. We then re-estimated the equation separately for each of the two components. On the
basis of a Wald test comparing the coefficients of the two equations, we were unable to reject the

-17-
hypothesis that the patterns with respect to age are the same. This makes it difficult to sustain the
deferred compensation story.
A second alternative explanation is based on the portfolio behavior of a risk-averse
entrepreneur. At the outset, a project may be very risky, so that insiders are willing to invest little
in the firm. As time goes on, more becomes known about the project, the risk decreases, and the
insiders are willing to invest more. Further, their funds may be cheaper than external funds for
agency or informational reasons. A shortcoming with the portfolio story is that it could also27
“explain” the opposite pattern. As the firm ages and becomes successful, the owner presumably
draws more and more labor income from it, and may therefore seek to diversify his other wealth
away from the source of his labor income.
In evaluating the portfolio explanation, a central issue is whether the age of the enterprise
is systematically related to its risk. Recall that our data set includes several proxies for business
risk— HITECH, UNIQUE, and STABLE. Each variable is statistically significant in at least one
equation; we defer until section 4.4 a discussion of their coefficients. The key point in the present
context is that the multiple correlation coefficient between these three variables and AGE is only
0.03. Assuming that these variables are indeed reasonable indicators of the firm’s business risk,
this result suggests that AGE is reflecting something more than business risk.
Another implication of the portfolio story is that entrepreneurs invest more in firms with
higher expected returns. One possible concern is that older firms have higher expected returns, so
that the coefficient on AGE is merely a proxy for the effect of expected returns. However, the
correlation between SURVIVE (our proxy for the expected returns of the firm) and AGE is quite
low (-0.14). To the extent that SURVIVE provides information on expected returns, the
coefficient on AGE reflects something other than expected returns. Thus, our finding of an

-18-
insignificant coefficient on SURVIVE in the INSIDE equation does not support the portfolio
hypothesis. 28
Can the increase in INSIDER be entirely attributed to retained earnings? A third possible
explanation for the financing patterns we observe arises from considerations related to Myers’
pecking order theory of finance. An implication of this theory is that as the firm starts generating
retained earnings, it uses them for investment, and the proportion of insider finance goes up and
the proportion of outsider finance goes down. If this were the driving force behind the patterns
that we observe in the data, then we would expect to see firms with high expected growth relying
more on external finance than other firms, ceteris paribus. This is because such firms do not
generate sufficient earnings to cover their investment requirements. However, to the contrary, we
find that firms with high expected growth are less likely to rely on outsider finance. Hence, a
retained earnings explanation based on Myers’ pecking order theory does not explain the life-
cycle pattern that we have isolated.
Indeed, the fact that firms with high growth prospects rely more on insider financing and
less on outsider financing, ceteris paribus, provides further evidence that is consistent with the
monopoly lender explanation. The negative coefficient on GROWTH in the outsider finance
equation is consistent with the presence of financial constraints. High expected-growth firms,
even after mobilizing all available funds from insiders, will typically seek financing from outsiders.
The negative coefficient suggests that firms are denied the external funds to match their needs.
And the presence of financial constraints is one of the key elements of the monopoly-lender
theory.

-19-
4.4 Other Right Hand Side Variables
While our main focus is on the effects of firm age on financing sources, the coefficients on
a number of the other right hand side variables are also interesting. First, we observe that29
several of the industry indicator variables are significant in the equations for insider and outsider
finance. That is, financing opportunities do vary significantly at the industry-wide level. Perhaps
the most interesting finding in this context is that manufacturing has a positive and statistically
significant coefficient in both the insider and outsider equations. Moreover, the quantitative
impact is large; changing its value from 0 to 1 raises INSIDER by 0.19 and OUTSIDER by
0.25. We conjecture that small manufacturing firms are particularly unlikely candidates for30
receiving financing from governmental entities, a source that is excluded from our definitions of
both INSIDER and OUTSIDER. At the same time, these are the firms that may have physical
assets to secure outside borrowing.
The coefficients on HI-TECH suggest that hi-tech firms receive a larger proportion of
their financing from outsider sources and a smaller proportion from insider sources, ceteris
paribus. Again, the effect is substantial— changing the value of HI-TECH from zero to one
reduces the expected value of INSIDER by 0.08, and increases the expected value of OUTSIDER
by 0.13. The importance of this variable is consistent with anecdotal evidence that venture
capitalists and private investors find hi-tech firms particularly attractive. A recent article in the
Wall Street Journal noted that most of the “$10 billion that venture funds invested in 1996...went
to high-tech or health-care companies that have fast growth potential” (Mehta [1996]). As
suggested in Section 2, from the venture capitalist’s point of view, such a preference may make
sense if he or she is interested in high-variance projects that offer the possibility of obtaining very
high returns. This observation might also explain the positive and significant coefficients on
UNIQUE and TOP3%, as well as the negative, significant coefficient on STABLE, in the
-20-
equation for outsider financing. Firms with unique products offer the prospect of high returns,31
albeit with high variance as well. Firms with a high percentage of output going to their top
customers may become very successful indeed if their customers stick with them, but are exposed
to a high risk if they lose any of their customers. Stable entrepreneurial firms, almost by
definition, are likely to yield predictable returns. It is interesting to note that all of our32
uncertainty variables are consistent with the notion that financiers are attracted by the prospect of
picking winners.
The coefficient on our measure of economic distress, SURVIVE, is not significant in the
equation for insider finance. Hence, in our data, there is no statistically discernible relationship
between this measure of expected returns and the proportion of financing from insiders. In the
outsider finance equation the coefficient on SURVIVE is highly significant, however, and lowers
the mean share by 0.09. As noted earlier, this suggests that the AGE variable is doing more than
proxying for the fact that expected returns vary with the firm’s age. Consistent with theoretical
predictions, the negative sign of the coefficient on SURVIVE in the outsider finance equation
implies that businesses that are struggling to survive face difficulty in obtaining external financing.
Turning now to the additional funds needed (AFN) variables, the only one that is
statistically significant is AFN , which has a positive coefficient in the OUTSIDER equation. survive33
That is, the more money that the entrepreneur believes is needed for the firm to survive, the larger
the proportion of external finance. Perhaps when the entrepreneur knows that his business may
fail due to insufficient funding, he pulls his own money out of the enterprise. To the extent that
financiers are unable to assess the financial needs of the firm, they do not withdraw their support,
so the proportion of external finance increases. This explanation can be reconciled with our
finding of a negative coefficient on SURVIVE in the OUTSIDER equation. SURVIVE is related
to the general economic distress of the firm, which may be easier for financiers to recognize than

-21-
it is to estimate the likelihood of financial distress. This variable is particularly subject to agency
problems (Bhide [1992]).
Of the variables relating to the entrepreneurs’ personal characteristics, the only one that is
significant in both equations is EAGE, the entrepreneur’s age. The older the entrepreneur the34
greater the proportion of insider financing; the pattern is just the opposite for outsider financing.
As noted earlier, there is a well-documented link between an individual’s age and his or her
wealth. Given that older individuals have more resources, it is not surprising that they are able to
invest more in their own enterprises. The MINORITY variable indicates that minorities have a
higher proportion of outsider finance than whites, other things being the same. Perhaps this is a
consequence of the fact that, as noted above, minority communities have relatively low levels of
wealth and therefore a lower potential to provide insider financing (see Blau and Graham [1990]).
Clearly, however, our data are not ideally suited for exploring racial differences in financing
patterns.
4.5 Alternative Specifications
An important question is whether our substantive results are sensitive to changes in the
basic model. To investigate this matter, we modified the specification in Table 5 in several ways.
First, previous research suggests that some aspects of entrepreneurial decision-making depend on
the entrepreneur’s age in a nonlinear fashion. For example, the probability that an entrepreneur
hires labor or purchases capital is a quadratic function of his or her age (see Carroll, Holtz-Eakin,
Rider, and Rosen [1996], and Holtz-Eakin, Joulfaian, and Rosen [1994]). This observation is
important in our context because Table 5 indicates that the entrepreneur’s age is the only
individual characteristic significantly correlated with both INSIDER and OUTSIDER. One must
therefore consider the possibility that our nonlinear relationship with firm’s age is really picking

-22-
up nonlinearities between financing sources and the entrepreneur’s age (EAGE). Hence, we
augmented our basic specification with the square of EAGE.
We found that, in the INSIDER equation, EAGE is statistically insignificant (t = -0.629). 2
In contrast, in the OUTSIDER equation, EAGE is significant (t = 5.888), but both the age of the2
firm and its square remain jointly significant. (The chi-square test statistic, with two degrees of
freedom, is 25.9, which is significant at the 0.01 level.) The coefficient on AGE is -0.00216 and
on AGE it is 0.00225. This implies the same curvature in the relation between OUTSIDER and2
AGE as depicted in Figure 1, but the proportion of outsider finance turns upward sooner— at
about 48 months. Hence, allowing for a quadratic in the entrepreneur’s age does not eliminate
our nonmonotonicity result. Indeed, it strengthens the result in the sense that a greater proportion
of the firms lie along the portion of the curve with a positive slope.
Another concern along the same lines is that the quadratic in AGE in Table 5 is really
picking up a nonlinearity in the relationship between the financing structure and the scale variable,
TOTEMP. When we augmented our basic equations with TOTEMP , we found that it is indeed2
statistically significant. In the INSIDER equation its t-statistic is 6.22; in the OUTSIDER
equation it is -3.50. However, in both equations, the age of the firm and its square remain jointly
significant (the chi-squared test in the INSIDER equation is 17.5 and in the OUTSIDER equation
it is 20.3; both significant at the 0.01 level). Further, the life-cycle patterns are qualitatively the
same as those depicted in Figure 1. In the INSIDER equation, where the coefficient on AGE
becomes 0.000827 and on AGE -0.00147, the turning point is 28.1 months, which is quite a bit2
sooner than in Figure 1. In the OUTSIDER equation, the coefficient on AGE is -0.00847 and on
AGE , 0.002863, which implies that the relation turns up at 148 months, a somewhat longer2
period of time than that in the basic specification.

-23-
Another concern is how well the GROWTH variable captures the enterprise’s growth
opportunities. As noted earlier, GROWTH is a composite of three dichotomous variables: it
equals one if the entrepreneur agrees with the statement that “right now we are growing so fast
that it is impossible to plan and control the way we would like,” or if the entrepreneur suggests
that he or she plans a significant increase in the number of employees in the next few years, or if
the firm’s 1991 or 1992 sales growth exceeded 15 percent. While in general past sales growth is
probably a useful proxy for expected future growth, there might be some companies that grew
rapidly in the past but whose opportunities for growth were then exhausted. To address this
concern, we create an alternative measure of growth opportunities, GROWTH-OPPTY, which is
obtained by replacing past sales growth by the interaction of past sales growth and STABLE.35
When we re-estimated the model replacing GROWTH with GROWTH-OPPTY, the basic
results were unchanged. Specifically, the implied life-cycle of firm finance has the same general
pattern as in Figure 1. Further, as was true of its counterpart in Table 5, the new growth variable
is positive in the INSIDER equation and negative in the OUTSIDER equation, and in both cases
the coefficients are statistically significant.36
Thus far we have maintained the hypothesis that AGE enters the model quadratically. This
raises the possibility that our results are being driven by an imposed functional form. There are
several ways one could investigate this issue. One tack is to estimate a piecewise linear
specification, but this is quite cumbersome to implement in the context of a two-limit Tobit
analysis and some arbitrariness is involved in choosing the breakpoints. A simpler approach is to
make the specification less restrictive through the addition of a cubic term, and see whether or not
it is statistically significant. When we did so, we discovered that AGE-cubed was not significant
in the OUTSIDER equation— the t-statistic was only -0.212— and its presence did not
substantively affect the estimates of the linear and quadratic components.

-24-
In the equation for INSIDER finance, however, the cubic term was marginally significant
(t=1.94). Again, however, the linear and quadratic terms were essentially unaffected as both
remained significant and retained their characteristic sign pattern. Moreover, the implied life-
cycle pattern was virtually identical to that of the quadratic specification. The turning points of
the cubic occur at 128 months and 304 months. The former is quite close to the result in
Figure 1, while the latter is so far out of the sample range of AGE as to be unimportant. In short,
adopting a more flexible approach to the specification of AGE highlights that our results are not
driven by the quadratic functional form.
Another specification issue relates to the fact that some of our right hand side variables
might be simultaneously determined with the sources of financing. Firm characteristics such as
growth prospects and additional funds needed to survive come to mind in this context. Further,
as noted above, certain subjective assessments of the firms’ attributes (e.g., the uniqueness of the
product) may be difficult to interpret. We therefore reestimated the model including a smaller set
of right hand side variables that could more convincingly be viewed as exogenous and well-
measured: AGE, AGE-SQUARED, TOTEMP, EAGE, COLLEGE, FEMALE, and MINORITY,
and the industry classification dichotomous variables. (See Table 4 for definitions.) The results,
which are reported in Table 6, leave unchanged Table 5’s basic implications with respect to the
life-cycle pattern of firm finance. Specifically, the coefficients on AGE and AGE-squared have the
same signs as in Table 5, and they are statistically significant. In the INSIDER equation, the
turning point is 95 months, and in the OUTSIDER equation it is 80 months. In both cases these
are earlier than the turning points depicted in Figure 1. The implied life-cycle pattern of financial
sources is graphed in Figure 2.
In a more extreme version of this exercise, we eliminated all the right hand side variables
except AGE, AGE-squared, and the constant. We found that, while the age variables were not

-25-
estimated precisely, they implied the same pattern of life-cycle finance that we have already seen.
In this specification, the proportion of insider finance increases until 106 months, and the
proportion of outsider finance decreases until 75 months. Our basic findings, then, do not appear
to be sensitive to the inclusion of variables that might be correlated with the error term in the
model.
Where does all this leave us? It is clear that our data do not allow us to pin down
precisely the ages at which young firms start decreasing the proportion of their financing that
comes from insider sources and increasing the proportion from outsider sources. Importantly, in37
some of our variants, the turning points come earlier than in Figure 1, indicating that the
nonmonotonicities are not associated with just a few outliers. In any case, the key finding is that
our qualitative result appears to be quite robust— at the beginning of their lives, entrepreneurial
enterprises increase the proportions of their insider funding as they age and decrease the
proportions of outsider funding, but at some point, these relationships reverse. As noted earlier,
this result is consistent with the notion that the evolution of firm finance is driven by the need to
overcome informational asymmetries.
5. Conclusion
Policymakers have become increasingly conscious of issues associated with the capital
needs of entrepreneurial enterprises, but there has been little analysis of the financing of firms at
the very early stages of their life cycles. Using data from the Wisconsin Entrepreneurial Climate
Study, we examine the evolution of the mix of financial capital from “insiders” and “outsiders” as
firms age. Our basic finding is that the proportion of funds from insiders rises during the early
stages of the firms’ life cycles, while the proportion from outsiders (banks, venture capitalists,
private investors) declines. These patterns eventually reverse themselves; the proportion of

-26-
insider finance ultimately declines and the proportion of outsider finance increases. We argue that
these findings are consistent with theories that view capital market frictions as arising from
information asymmetries. In particular, elements of both reputation-based and monopoly-lender
theories of firm finance are consistent with the notion that at some stage in the young firm’s life
cycle, the firm develops enough of a reputation that it is able to obtain cheaper sources of external
finance (or easier access to additional sources of external finance). Our evidence suggests that
this turning point occurs relatively early in the firm’s life, perhaps two to nine years after the time
of first sale.
More generally, our finding that financing from insiders is critical to small entrepreneurial
enterprises confirms and reinforces results that have been found in previous econometric work as
well as historical accounts and numerous case studies (see Bhide [1992] and Rosenberg and
Birdzell [1987]). It is hard to imagine that there will be any innovations in the structure of credit
markets, or the instruments traded therein, that will change the dominant role of insider finance in
the near or medium term future. In this context, it is interesting to note that most of the
discussion of tax policy and its effects on entrepreneurship has focused on venture capitalists and
their tax environments (see, e.g., Poterba [1989]). Surely venture capital is very important, but
our results suggest that more attention should be focused on the tax situations of the
entrepreneurs themselves.

-27-
1. “First Lady Talks of Mice and Men on ‘Rosie’ Show,” by James Bennet, New York Times,February 4, 1997, pp. A14.
2. See, for example, Harris and Raviv [1991] and references therein.
3. Helwege and Liang [1996] study the debt-equity choices of post-IPO firms. These firmsare at a much later stage in their life-cycles than those in our sample, and face differenttypes of constraints.
4. See Myers [1977, 1984], Fluck [forthcoming, 1997], and Fluck and Lynch [1996].
5. One can imagine other observable variables that could be related to reputation: entrepreneur’s position in a professional association, national advertising campaigns,entrepreneur’s previous ventures, and so on. Such variables are not included in our data.
6. Reynolds and White [1993] provide details.
7. Among the self-employed, relatively few hire additional workers (see Carroll, Holtz-Eakin, Rider, and Rosen [1996]), a pattern common among OECD countries (see Lindhand Ohlsson [1994]). Because the level and growth of employment are observable, ourfocus on firms with employees may mean that these firms are easier to monitor than arandom sample of small enterprises.
8. At the time of the construction of the sample, the firm had to be active. However, at thetime of the actual interview, there was no restriction of this sort.
9. Presumably, a number of the excluded “firms” are individuals who employ outside help athome and never intend to make any sales.
10. Some entrepreneurs received written surveys, and others were interviewed by telephone.The response rate for the written questionnaires was about 50 percent, and that for thephone interviews about 80 percent. For further details, see Reynolds and White [1993].
11. We examined the source of the lost observations to check whether there appeared to be asystematic pattern in the missing data. None emerged. The number of observations “lost”because of missing data on a particular variable is inherently ambiguous since any givenobservation may have more than one missing variable. We note, however, that regardingour core variables, sources of financing, age of firm, industry category, 1991 sales, andentrepreneur's age and gender, missing data account for the loss of 105, 49, 7, 155, 54 and47 observations, respectively.
12. A few franchises and “no answer” responses make up the remaining 2 percent of the firms.
13. See the Appendix for the exact wording of the question regarding financing.
Endnotes

-28-
14. Several papers have noted the importance of trade credit (see, e.g., Petersen and Rajan[1997]) and retained earnings (see, e.g., Bhide [1992]) in the context of smallentrepreneurial firms. In our sample, however, neither is an important issue. Respondentswere asked how much financing they received from business associates. There were only15 non-zero values, and of these, only 6 indicated that trade credit was more than 20percent of their total financing. As suggested above, we classify such financing as“insider.” We also re-estimated our model classifying business associates as “outsiders,”and found that the results were barely affected. For retained earnings there is no separatecategory in the survey. The categories on owners' equity definitively include retainedearnings. By appealing to Myers' [1984] pecking order theory of finance, we test whetherthe increase in insider finance can be attributed entirely to an increase in retained earningsand reject this notion.
15. This finding is also consistent with Bhide’s [1992] interviews with the founders of 100fast-growing private companies, which indicated that “For the great majority of would-befounders, the biggest challenge is not raising money but having the wits and hustle to dowithout it” (p. 110).
16. In our data, hi-tech firms appear to face more uncertain prospects than other firms in thesense that the average variance in their year-to-year sales growth is greater than for others.
17. More than 80 percent of our HITECH firms belong to 3 industrial categories: manufacturing, consumer and business services and health, and mining, agriculture,transportation and communications. This is not surprising since these categories includefirms in hardware and software development, in medical and biotechnology, chemical andagrotechnology, and communications.
18. We also considered total assets and total sales as scale variables; total employmentprovided the best fit to the data in the sense that it had the largest t-statistic.
19. The great majority of firms— 87 percent— for whom GROWTH = 1 experienced salesgrowth of 15 percent or more during 1990-91 or 1991-92. As shown in Table 3, almost90 percent of our firms characterize themselves as growth firms by these criteria. This isunsurprising, given that our sample consists largely of firms that recently made their firstsales. Note that 79 percent of our firms are STABLE and 90 percent of our firms are highGROWTH, implying a substantial fraction of these firms are experiencing high growth andare expecting to continue to do so in the future.
20. See Blau and Graham [1990] for evidence that wealth increases with age and education,ceteris paribus.
21. The survey included a breakdown of the non-white category, but there were not enoughobservations in any of these groups to allow meaningful analysis of ethnic differences.
22. For a description of the two-limit Tobit estimator, see Maddala [1983]. The standarderrors are corrected for heteroskedasticity via a maximum likelihood procedure in whichthe logarithm of the variance is a linear function of the covariates. Note that we cannot

-29-
investigate the ratio of INSIDER to OUTSIDER because of the presence of zeroes in boththe numerator and denominator.
23. Only 6 percent of our sample firms are older than 108 months, which may raise concernswith respect to the economic significance of the quadratic term. For present purposes, thenon-monotonic nature of the pattern is more important than the precise location of theturning point. As we will see later, under some variants of the model, the downward turnoccurs substantially earlier in the firm’s life.
24. Maddala [1983, p. 161] provides the transformation from the estimated coefficients to theexpected value.
25. We compute the respective variances of the predicted values of INSIDER andOUTSIDER using a linear approximation to the expected value and the estimatedcovariance matrices of the parameters.
26. The failure rate among entrepreneurial enterprises is very high. Quadrini’s [1996]tabulations from the Panel Study of Income Dynamics over the period 1973-92 indicatethat the exit rate for new entrepreneurs is about 45 percent. Of those with two years ofexperience as entrepreneurs, the failure rate is 31 percent.
27. The financial market optimum may involve less than 100 percent ownership of the firm bythe entrepreneur. This optimum is found by trading off the managerial entrenchment effectand the alignment of interest effect, as shown by Stulz [1988], Morck, Shleifer and Vishny[1988], and Fluck [1997b].
28. Growth may be another measure of expected returns. Again, however, the correlationbetween AGE and GROWTH is too low for AGE to be proxying for expected returns inthis way.
29. While these variables are interesting in their own right, they are also essential touncovering the relationship between age and the structure of finance. In univariateregressions of financial source on age, no significant relationship appears.
30. We compute the quantitative effects of this and other coefficients on dichotomousvariables as follows: First, we calculate the predicted values of INSIDER andOUTSIDER for each observation using the actual data, but with the manufacturingdichotomous variable set equal to zero. We then calculate the mean value of the predictedprobabilities in the sample. Next, we repeat the procedure, except that this time eachvalue of the manufacturing variable is set equal to 1.0. Our estimate of the quantitativeimpact is the change in the mean predicted proportion.
31. The quantitative impacts of UNIQUE and STABLE in the OUTSIDER equation arenearly identical in magnitude; 0.14 and -0.13, respectively. In contrast, the impact ofUNIQUE (-0.01) is quite small in the INSIDER equation, while STABLE raises the meanshare of INSIDER by 0.05.

-30-
32. The coefficients on STABLE are consistent with the pecking order story. STABLE firmshave limited growth prospects, and hence, according to this theory, are able to meet arelatively high fraction of their investment targets using retained earnings.
33. A test of the joint significance of the AFN variables shows they are significant only in theOUTSIDER equation.
34. The fact that most of the indicators of the individual’s demographic situation do not exerta statistically significant impact is consistent with earlier studies of the evolution ofentrepreneurial enterprises (Carroll, Holtz-Eakin, Rider, and Rosen [1996], Holtz-Eakin,Joulfaian, and Rosen [1994], and von Praag [1994]). While most demographic variablesdo not seem to be strongly correlated with the evolution of various characteristics of smallfirms, these variables are correlated with the probability that a particular individual is anentrepreneur at a given point in time. See, e.g., Meyer [1990].
35. Hence, GROWTH-OPPTY takes the value of one if the entrepreneur agrees with thestatement that “right now we are growing so fast that it is impossible to plan and controlthe way we would like,” or if the entrepreneur suggests that he or she plans a significantincrease in the number of employees in the next few years, or if the firm’s 1991 or 1992sales growth exceeded 15 percent, and STABLE equals one. Since STABLE equals oneonly if the entrepreneur believes that in the next few years the firm will continue to operatepretty much as in the past, GROWTH-OPPTY may reflect more precisely whether highgrowth is expected.
36. In the INSIDER equation, the coefficient on AGE is 0.0126 (s.e.=0.003356), on AGE-squared -0.00655 (s.e. = 0.00136), and on GROWTH-OPPTY 0.355 (s.e.=0.180). In theOUTSIDER equation, the corresponding coefficients are -0.00632 (s.e.=0.00274),0.00377 (s.e.=0.00122), and -0.363 (s.e.=0.145).
37. For the same reason, we are unable to examine whether there exists a different life-cycleprofile for firms with different characteristics.

-31-
References
Admati, Anat and Paul Pfleiderer, “Robust Financial Contracting and the Role of VentureCapitalists,” Journal of Finance, 49, 1994, pp. 371-402.
Berger, A. and G. Udell, “Relationship Lending and Lines of Credit in Small Firm Finance,”Journal of Business, 68, 1995, pp. 351-381.
Bhide, Amar, “Bootstrap Finance: The Art of Start-Ups,” Harvard Business Review, November-December, 1992, pp. 106-117.
Blau, F. and D. Graham, “Black-White Differences in Wealth and Asset Composition,” QuarterlyJournal of Economics, 1990, pp. 321-339.
Boot, A. and A. Thakor, “Moral Hazard and Secured Lending in an Infinitely Repeated CreditMarket Game,” International Economic Review, 35, 1994, pp. 899-920.
Boyd, J. and E.C. Prescott, “Financial Intermediary-Coalitions,” Journal of Economic Theory, 38,1986, pp. 211-232.
Carroll, Robert, Douglas Holtz-Eakin, Mark Rider, and Harvey S. Rosen, “Income Taxes andEntrepreneurs’ Use of Labor,” mimeo, Syracuse University, 1996.
Chan, Y., “On the Positive Role of Financial Intermediation in Allocation of Venture Capital in aMarket with Imperfect Information,” Journal of Finance, 38, 1983, pp. 1543-1568.
Diamond, Douglas, “Financial Intermediation and Delegated Monitoring,” Review of EconomicStudies, 51, 1984, pp. 393-414.
Diamond, Douglas, “Monitoring and Reputation: The Choice between Bank Loans and DirectlyPlaced Debt,” Journal of Political Economy, 99, 1991, pp. 688-710.
Economist, “Vital Intangibles,” March 29, 1997, pp. 7-11.
Fenn, George W., Nellie Liang, and Stephen Prowse, “The Economics of the Private EquityMarket,” Federal Reserve Bulletin, January 1996, pp. 1-34.
Fluck, Zsuzsanna, “Control Rights and Maturity: The Design of Optimal Securities,” mimeo, NewYork University, 1997.
Fluck, Zsuzsanna, “The Dynamics of the Management-Shareholder conflict,” mimeo, New YorkUniversity, 1997b.
Fluck, Zsuzsanna, “Optimal Financial Contracting: Debt Versus Outside Equity,” Review ofFinancial Studies, 11, 1998, pp. 383-419.

-32-
Fluck, Zsuzsanna and Anthony Lynch, “Why Firms Merge and Then Divest: A Theory ofFinancial Synergy,” Working Paper, New York University, 1996.
Gompers, Paul, “Optimal Investment, Monitoring and the Staging of Venture Capital,” Journal ofFinance, 50, 1995, pp. 1461-1489.
Greenbaum, Stuart, George Kanatos, and Itzhak Venezia, “Equilibrium Loan Pricing Under theBank Client Relationship,” Journal of Banking and Finance, 13, pp. 221-235.
Harris, Milton and Arthur Raviv, “The Theory of Capital Structure,” Journal of Finance, XLVI,No. 1, March 1991, pp. 297-355.
Helwege, Jean and Nellie Liang, “Is There a Pecking Order? Evidence from a Panel of IPOFirms,” Journal of Financial Economics, 40, 1996, pp. 429-458.
Holtz-Eakin, Douglas, David Joulfaian, and Harvey S. Rosen, “Sticking it Out: EntrepreneurialSurvival and Liquidity Constraints,” Journal of Political Economy, February 1994, pp.53-75.
Kaplan, Steven N. and Luigi Zingales, “Do Investment-Cash Flow Sensitivities Provide UsefulMeasures of Financing Constraints?” Quarterly Journal of Economics, CXII, 1997,pp. 169-216.
Lerner, Josh, “The Government is Venture Capitalist: The Long-Run Impact of the SBIRProgram,” mimeo, Harvard University, 1997.
Lindh, Thomas and Henry Ohlsson, “Self-Employment and Self-Financing,” mimeo, UppsalaUniversity, 1994.
Maddala, G.S., Limited-Dependent and Qualitative Variables in Econometrics, Cambridge:Cambridge University Press, 1983.
Mehta, Stephanie N., “Stressful Quest: Entrepreneurs Struggle to Fund a Spa,” Wall StreetJournal, June 30, 1996, pp. B1-B2.
Meyer, Bruce, “Why Are There So Few Black Entrepreneurs?” National Bureau of EconomicResearch, Working Paper No. 3537, 1990.
Morck, Randall, Andrei Shleifer, and Robert Vishny, “Management Ownership and MarketValuation: An Empirical Analysis,” Journal of Financial Economics, 20, 1988,pp. 293-315.
Myers, Stewart, “Determinants of Corporate Borrowing,” Journal of Financial Economics, 5,1977, pp. 147-175.
Myers, Stewart, “The Capital Structure Puzzle,” Journal of Finance, 39, 1984, pp. 575-592.

-33-
Myers, Stewart and Nicholas Majluf, “Financing Decisions When Firms Have Information ThatInvestors Do Not Have,” Journal of Financial Economics, 13, 1984, pp. 187-221.
Petersen, Mitchell and Raghuram Rajan, “The Benefits of Lending Relationships: Evidence fromSmall Business Data,” Journal of Finance, XLIX, 1994, pp. 169-200.
Petersen, Mitchell and Raghuram Rajan, “The Effect of Credit Market Competition on Firm—Creditor Relationship,” Quarterly Journal of Economics, 110, pp. 407-443, 1995.
Petersen, Mitchell and Raghuram Rajan, “Trade Credit: Some Theories and Evidence,” Review ofFinancial Studies, 10, 1997, pp.661-692.
Poterba, James M., “Venture Capital and Capital Gains Taxation,” in Lawrence Summers, editor,Tax Policy and the Economy. MIT Press, Cambridge, MA, 1989.
Quadrini, Vincenzo, “Entrepreneurship, Saving and Social Mobility,” mimeo, University ofPennsylvania, 1996.
Rajan, Raghuram, “Insiders and Outsiders: The Choice Between Informed and Arm’s LengthDebt,” Journal of Finance, XLVII, 1992, pp. 1367-1400.
Ramakrishnan, S. and A. Thakor, “Information Reliability and a Theory of FinancialIntermediation,” Review of Economic Studies, 51, 1984, pp. 415-432.
Reynolds, Paul and Sammis White, “Wisconsin’s Entrepreneurial Climate Study,” MarquetteUniversity Center for the Study of Entrepreneurship, 1993.
Rosenberg, Nathan and L. Birdzell, How the West Grew Rich, Basic Books, 1987.
Selz, Michael, “For Start-Up Stars, Coming Up with Seed Capital Is No Problem,” Wall StreetJournal, October 2, 1996, p. B1.
Sharpe, Steven, “Asymmetric Information, Bank Lending, and Implicit Contracts: A StylizedModel of Customer Relationships,” Journal of Finance, 45, 1990, pp. 1069-1087.
Shleifer, Andrei and Robert Vishny, “Liquidation Value and Debt Capacity: A Market EquilibriumApproach,” Journal of Finance, 47, 1992, pp. 1343-1366.
Stiglitz, Joseph and Andrew Weiss, “Credit Rationing in Markets with Imperfect Information,”American Economic Review, 71, 1981, pp. 393-410.
Stulz, René, “Managerial Control of Voting Rights,” Journal of Financial Economics, 20, 1988,pp. 20-59.
van Praag, C. Mirjam, “Determinants of Self-Employment Duration,” mimeo, University ofAmsterdam, 1994.
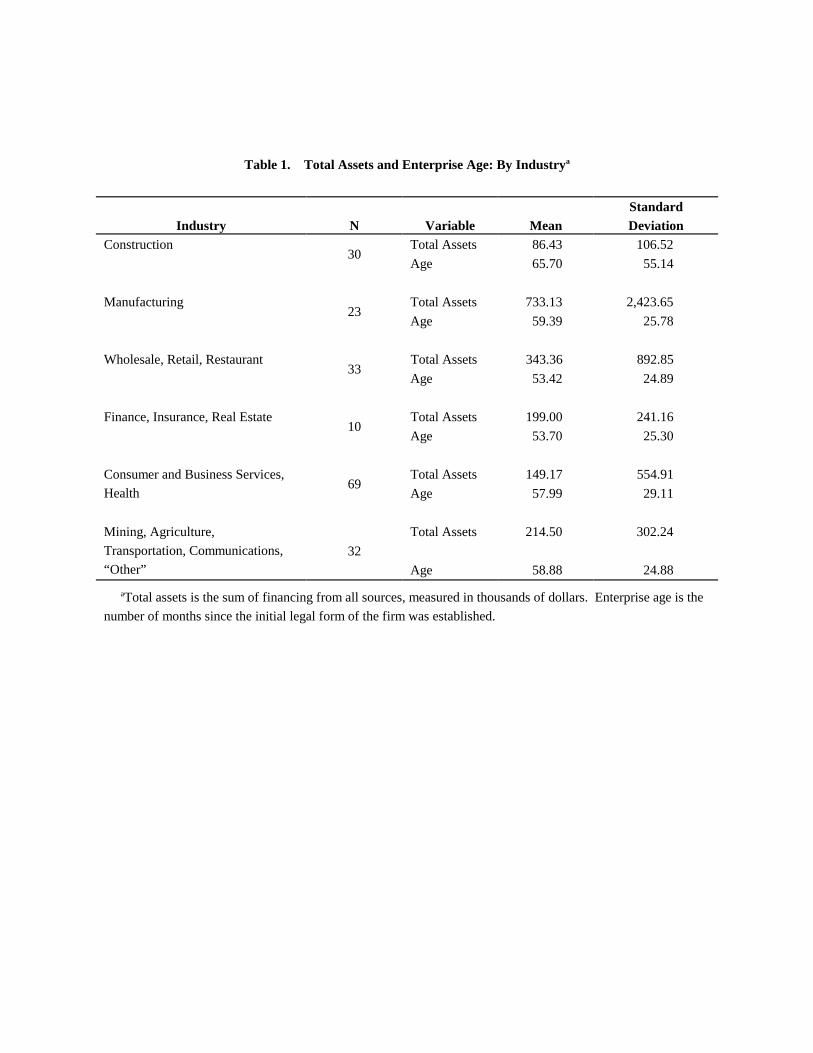
Table 1. Total Assets and Enterprise Age: By Industrya
Industry N Variable Mean DeviationStandard
Construction Total Assets 86.43 106.5230
Age 65.70 55.14
Manufacturing Total Assets 733.13 2,423.6523
Age 59.39 25.78
Wholesale, Retail, Restaurant Total Assets 343.36 892.8533
Age 53.42 24.89
Finance, Insurance, Real Estate Total Assets 199.00 241.1610
Age 53.70 25.30
Consumer and Business Services, Total Assets 149.17 554.91
Health69
Age 57.99 29.11
Mining, Agriculture, Total Assets 214.50 302.24
Transportation, Communications,
“Other”32
Age 58.88 24.88
Total assets is the sum of financing from all sources, measured in thousands of dollars. Enterprise age is thea
number of months since the initial legal form of the firm was established.

Table 2. Age of Enterprise and Sources of Finance
Age Group Venture Private(months) N Own Team Family Friends Banks Capitalists Investors
Number of Firms That Use a Number of Firms That Use aParticular Source of Insider Finance Particular Source of Outsider Finance
11to 20 3 3 2 0 1 0 0 0
21 to 30 26 22 11 1 1 11 0 2
31 to 40 28 24 9 7 2 16 0 1
41 to 50 31 28 11 8 3 18 0 6
51 to 60 30 27 7 5 3 11 1 1
61 to 70 29 24 3 4 1 9 1 1
71 to 80 18 18 4 3 0 10 0 0
81 to 90 13 12 1 3 2 8 0 0
91 to 100 9 7 4 2 2 3 0 1
101 to 110 3 3 1 0 0 1 0 0
111 to 120 1 1 0 0 0 0 0 0
> 120 6 5 0 2 0 4 0 0

Table 3. Distribution of Financing Sourcesa
Source 1 Source 2 Source 3Frequency Percent Frequency Percent Frequency Percent
< 0.1 27 13.7 105 53.3 181 91.9
0.2 14 7.11 11 5.58 3 1.52
0.3 10 5.08 9 4.57 1 0.51
0.4 7 3.55 16 3.12 3 1.52
0.5 10 5.08 8 4.06 3 1.52
0.6 5 2.54 9 4.57 2 1.02
0.7 13 6.60 7 3.55 0 0.00
0.8 9 4.57 8 4.06 0 0.00
0.9 9 4.57 12 6.09 0 0.00
1.0 < 93 47.2 12 6.09 4 2.03
Source 4 Source 5Frequency Percent Frequency Percent
< 0.1 195 99.0 184 93.4
0.2 2 1.02 0 0.00
0.3 0 0.00 3 1.52
0.4 0 0.00 2 1.02
0.5 0 0.00 3 1.52
0.6 0 0.00 4 2.03
0.7 0 0.00 1 0.51
0.8 0 0.00 0 0.00
0.9 0 0.00 0 0.00
1.0 < 0 0.00 0 0.00
This table shows how the proportion of total financing attributable to each source is distributed across thea
firms in our sample.
Source 1: respondent, other members of start-up team, family members.
Source 2: banks, venture capitalists, private investors.
Source3: stockholders.
Source 4: bond holders.
Source 5: government and other.

Table 4. Means and Standard Deviations
Mean DeviationStandard
AGE (months since initial legal form established) 58.49 32.57
AGE (age -squared/100) 44.75 72.722
CONSTRUCTION (=1 if construction) 0.1522 0.3602
MFG (=1 if manufacturing) 0.1168 0.3219
WHOLESALE (=1 if wholesale, retail, restaurants) 0.1675 0.3744
FINANCE (=1 if finance insurance real estate) 0.05076 0.2201
MISC (=1 if mining, agriculture, other) 0.1624 0.3698
HITECH (=1 if a high-tech firm) 0.3350 0.4732
STABLE (=1 if firm continues to operate pretty much as it has) 0.7970 0.4033
SURVIVE (=1 if business survival is the main concern of the firm) 0.6396 0.4813
UNIQUE (=1 if firm has a unique product) 0.7513 0.4334
TOP3 % (percentage of 1991 sales to 3 largest customers) 44.35 34.21
TOTEMP (number of employees) 6.203 8.5720
GROWTH (=1 if firm was growing) 0.8883 0.3158
AFN (additional funds needed to survive (thousands)) 46.71 219.4survive
AFN (beyond survival, additional funds firm could invest 174.9 826.6expand
and provide a competitive return (thousands))
EAGE (entrepreneur’s age) 40.55 9.779
COLLEGE (=1 if attended college) 0.4873 0.5011
FEMALE (=1 if female) 0.2284 0.4209
MINORITY (=1 if minority) 0.1472 0.3552
N 197

Table 5. Parameter Estimates
Variable Estimate Standard Error Estimate Standard Error
Insider Outsider(1) (2)
AGE 0.01154 0.002549 -0.00449 0.001882
AGE-squared/100 -0.005322 0.001086 0.001573 0.0006385
CONSTRUCTION 0.03640 0.1407 0.8083 0.09999
MFG 0.7729 0.2629 0.4873 0.07927
WHOLESALE -0.5207 0.1084 1.061 0.1468
FINANCE -0.0007194 0.1450 0.6627 0.1459
MISC -0.3864 0.1072 0.7171 0.1071
HITECH -0.2947 0.06281 0.2789 0.05850
STABLE 0.18168 0.07698 -0.2657 0.07251
SURVIVE -0.04163 0.1314 -0.1943 0.06638
UNIQUE -0.02578 0.06921 0.3166 0.1124
TOP3% -0.0006998 0.001037 0.004137 0.0008596
TOTEMP -0.03657 0.004046 0.01129 0.002259
GROWTH 0.3911 0.08331 -0.1422 0.06967
AFN /100 -0.02463 0.04955 0.08037 0.04085survive
AFN /100 -0.6413 1.240 -0.00851 0.1543expand
EAGE 0.02861 0.003766 -0.01653 0.003065
COLLEGE 0.1018 0.0910 -0.01173 0.05907
FEMALE 0.1054 0.09244 -0.01303 0.0962
MINORITY 0.1635 0.1089 0.1652 0.10902
Constant -0.6139 0.2717 0.2398 0.1843
Observations 197 197
Loglikelihood -122.6 -68.5
*The parameter estimates in this table give the effect of each variable on the latent variable in a two-limit
Tobit model. In column (1), the left hand side variable is the proportion of financing from “insider” sources:
respondent, team members, family members, and friends. In column (2), it is the proportion from “outsiders”:
banks, venture capitalists, and private investors. Variables are defined in Table 4.

Table 6. Parameter Estimates(Reduced Set of Right Hand Side Variables)
Variable Estimate Standard Error Estimate Standard Error
Insider Outsider(1) (2)
AGE 0.008167 0.003962 -0.007829 0.003426
AGE-squared/100 -0.004277 0.001633 0.004922 0.001596
CONSTRUCTION 0.1759 0.2379 -0.03510 0.2264
MFG 0.1281 0.1984 0.1577 0.1155
WHOLESALE 0.09180 0.2027 0.02887 0.1775
FINANCE -0.3137 0.2106 0.4068 0.1596
MISC -0.1207 0.1670 0.1504 0.1178
TOTEMP -0.03390 0.01154 0.02337 0.006567
EAGE 0.01746 0.005745 -0.009717 0.004356
COLLEGE 0.07137 0.1152 0.07157 0.09349
FEMALE 0.3223 0.1981 -0.2464 0.1269
MINORITY 0.1842 0.1815 -0.8849 0.3566
Constant -0.03509 0.2977 0.5313 0.2378
Observations 197 197
Loglikelihood -164.4 -136.8
*The parameter estimates in this table give the effect of each variable on the latent variable in a two-limit
Tobit model. In column (1), the left hand side variable is the proportion of financing from “insider” sources:
respondent, team members, family members, and friends. In column (2), it is the proportion from “outsiders”:
banks, venture capitalists, and private investors. Variables are defined in Table 4.

Appendix
Our information on the financial structure of the firms is drawn from the responses to the followingquestion:
“What is the current status of the financial support for the firm. That is, what are themajor sources of ownership investments and debt for this new firm?”
Source of Financing Ownership (Equity) Debt (Loans)Investments (Total Borrowed)
Respondent’s own $ , ,000 $ , ,000
Other start up team members $ , ,000 $ , ,000
Any family members (spouses, parents, etc.) $ , ,000 $ , ,000
Friends or business associates $ , ,000 $ , ,000
Banks or other lending institutions $ , ,000 $ , ,000
Venture capitalists $ , ,000 $ , ,000
Private investors $ , ,000 $ , ,000
Government agencies or governmentguaranteed loan funds (SBA, etc.) $ , ,000 $ , ,000
Stockholders (share ownership) $ , ,000
Bondholders or other formal sources of debt(must be paid back) $ , ,000
Other: $ , ,000 $ , ,000
TOTALS $ , ,000 $ , ,000
How much more of an investment does the firm now need, or did it need before it wasdiscontinued, in order to survive? $ , ,000
Beyond what is needed for survival, how much money could the firm employ and providea competitive return to investors? $ , ,000

Figure 1Projected Insider and Outsider Financing by Age of Firm
0
0.1
0.2
0.3
0.4
0.5
0.6
0.7
0.8
0.9
1
10 20 30 40 50 60 70 80 90 100 110 120 130 140 150 160 170 180
Age (Months)
Prop
ortio
n of
Tot
al F
inan
cing
InsiderOutsider

Figure 2Projected Insider and Outsider Financing by Age of Firm
Reduced Specification
0
0.1
0.2
0.3
0.4
0.5
0.6
0.7
0.8
0.9
1
10 20 30 40 50 60 70 80 90 100 110 120 130 140 150 160 170 180
Age (Months)
Prop
ortio
n of
Tot
al F
inan
cing
InsiderOutsider

METROPOLITAN STUDIES PROGRAM OCCASIONAL PAPER SERIES($5.00 each)
Recent papers are available in .pdf format on our website athttp://www-cpr.maxwell.syr.edu
177. 185.James R. Follain, Jan Ondrich, and Gyan P. Sinha William Duncombe and Bernard Jump, Jr.Ruthless Prepayment? Evidence from Multifamily The Outlook for Onondaga County’s Finances: BaselineMortgages, March 1996, 35 pp. Scenario, August 1997, 66 pp.
178. 186.Amy D. Crews William Duncombe, Shannon Felt, James R. FollainDo Housing Programs for Low Income Households and Bernard Jump, Jr.Improve Their Housing? April 1996, 53 pp. The Economic and Fiscal Impact of Lake Remediation
179.Robert M. Dunsky and James R. Follain 187.The Demand for Home Mortgage Debt and the Income John YingerTax, April 1996, 60 pp. Placing a Lid on Marginal Tax Rates: A New Way to
180.Amy S. Bogdon and James R. Follain 188.An Examination of Three Sets of Indicators of Financial Jan Ondrich, Alex Stricker, and John YingerRisk among Multifamily Properties, May 1996, 43 pp. Discrimination in Qualitative Actions by Real Estate
181.Thomas Dunn and Douglas Holtz-Eakin 189.Financial Capital, Human Capital, and the Transition to Donald Bruce and Douglas Holtz-EakinSelf-Employment: Evidence from Intergenerational Links Apocalypse Now? Fundamental Tax Reform andJune 1996, 30 pp. Residential Housing Values, July 1998, 35 pp.
182.Stephen Ross and John Yinger 190.Where do the Rents Go? Land Ownership in an Urban Thomas Dunn and Douglas Holtz-EakinModel, November 1996, 33 pp. Financial Capital, Human Capital, and the
183. from Intergenerational Links, July 1998, 32 pp.William Duncombe and Wilson WongOnondaga County’s Economic Performance since 1980 191.and Prospects for the Next Decade, February 1997, Zsuzsanna Fluck, Douglas Holtz-Eakin, and Harvey79 pp. Rosen
184. Small Entrepreneurial Enterprises , July 1998, 42 pp.Shannon Felt, James R. Follain, and SuzanneMcCoskeyA Review and Forecast of the Onondaga CountyEconomy, March 1997, 50 pp.
on Onondaga County, August 1997, 45 pp.
Simplify the Income Tax Structure, 1997, 32 pp.
Brokers, May 1998, 35 pp.
Transition to Self-Employment: Evidence
Where Does the Money Come From? The Financing of
Publications OfficerCenter for Policy ResearchThe Maxwell School - Syracuse University426 Eggers HallSyracuse, New York 13244-1020Please send me _____ copies of Occasional Paper No. _____ at $5.00 each.NAME ADDRESS CITY, STATE, ZIP CODE


