
i
Where the Minimum Wage Bites Hard: The Introduction of the UK National Minimum
Wage to a Low Wage Sector
Stephen Machin*, Alan Manning** and Lupin Rahman***
May 2002 November 2002 - Revised
* Department of Economics, University College London and Centre for Economic Performance, London School of Economics
** Department of Economics and Centre for Economic Performance, London School of
Economics *** STICERD, London School of Economics Abstract Between 1993 and April 1999 there was no minimum wage in the UK (except in agriculture). In this paper we study the effects of the introduction of a National Minimum Wage (NMW) in April 1999 on one heavily affected sector, the residential care homes industry. This sector contains a large number of low paid workers and as such can be viewed as being very vulnerable to minimum wage legislation. We look at the impact on both wages and employment. Our results suggest that the minimum wage raised the wages of a large number of care homes workers, causing a very big wage compression of the lower end of the wage distribution, thereby strongly reducing wage inequality. There is some evidence of employment and hours reductions after the minimum wage introduction, though the estimated effects are not that sizable given how heavily the wage structure was affected. Acknowledgements We are very grateful to the numerous students who punched the care homes data in to the computer, together with Thomas Metcalf and Danny Goldup who helped with the questionnaires. We would also like to thank the Editor, two anonymous referees, Daron Acemoglu, Josh Angrist, Paul Gregg, Dan Hamermesh, Jim Heckman, Steve Levitt, David Metcalf, Nicole Fortin, John Pencavel and participants in seminars or conferences at Chicago, the IMF, MIT, the Reserve Bank of Australia, the SoLE meetings in Baltimore, STICERD (LSE), Southampton, Warwick and Yale for a number of comments and suggestions. Some of the work on this paper was done during the first author’s leave during the 2001/2 academic year in the Economics Department at MIT, whose hospitality and support are gratefully acknowledged.

ii
Author Details Stephen Machin Department of Economics, University College London, Gower Street, London, WC1E 6BT, UK and Centre for Economics of Education and Centre for Economic Performance London School of Economics Houghton Street London, WC2A 2AE, UK Email: [email protected] Telephone: + 44 (0)2076795870 Alan Manning Department of Economics and Centre for Economic Performance London School of Economics Houghton Street London, WC2A 2AE, UK Email: [email protected] Telephone: + 44 (0)2079556078 Lupin Rahman STICERD London School of Economics Houghton Street London, WC2A 2AE, UK Email: [email protected] Telephone: + 44 (0)2079556677
iii
Contents I. Introduction II. Minimum Wages in the UK and the Care Homes Sector III. Data Issues and Descriptive Statistics IV. Wages and the Minimum Wage V. Employment and the Minimum Wage VI. Conclusions References Tables Figures Appendix 1a: Pre-Introduction Survey Appendix 1b: Post-Introduction Survey Appendix 2: Representativeness of the Sample

4
I. Introduction The debate on the economic effects of minimum wages remains a controversial and heavily
researched question. In fact there currently appears to be something of a methodological
divide amongst economists about what minimum wages actually do to economic outcomes.
Some researchers choose to stick to what used to be the orthodoxy, at least since Brown,
Gilroy and Kohen’s (1982) influential survey of the evidence available up to the late 1970s,
that minimum wages are bad for employment, especially teenage employment. Others have
been more swayed by the recent ‘before and after’ micro work (Card, 1992, Card and
Krueger, 1994, 1995) which finds it hard to identify any employment effect at all and moves
the question on from ‘how negative is the minimum wage employment effect?’ to ‘is there
any impact on employment at all?’ The vast majority of work used to inform this debate is
based upon US data (Brown, 1999). Some fresh evidence, from a different context, probably
needs to be cast on these questions.1 We attempt to offer some evidence of this sort in this
paper, where we have a unique design setting induced by the introduction of a minimum
wage to a labour market previously unregulated by minimum wage legislation.
In April 1999 a National Minimum Wage (NMW) was introduced to the UK labour
market. This is the first time that the UK has had an economy wide minimum wage.
Furthermore, because the old industry-based Wages Council system that used to regulate pay
in some sectors was abolished in 1993, the NMW was introduced into a labour market with
no minimum wage legislation in operation.2 Given these circumstances one can think of the
introduction of the UK NMW as providing a very good testing ground for evaluating the
economic effects of minimum wages. In fact one can plausibly argue that it provides a better
testing ground than much of the ‘before and after’ US work on minimum wage effects (see
1 Indeed, one of Hamermesh’s (2002) prime examples of where international empirical work in labour economics is required to inform the US debate is the research area on minimum wages. 2 Except in agriculture. The Agricultural Wages Board was not abolished along with the other Wages Councils.

5
the discussion in Card and Krueger, 1995) as they are all based upon minimum wage
increases where a minimum wage floor was already in place.
In this paper we look at what happened when the UK minimum wage was introduced
in a low wage sector one can view as being particularly vulnerable to minimum wages, the
UK residential care homes industry. Our analysis is based upon a large-scale survey that we
carried out before and after the introduction of the NMW. The survey focused upon the
whole population of residential care homes in Britain, collecting information on all workers
in the homes, and on an array of home characteristics.
We chose to look at this sector for several reasons. First, it contains many low-wage
workers, so the minimum wage has real potential to have a noticeable impact on outcomes.3
Second, we chose this sector because it is not unionised. Thirdly, it consists of large numbers
of small firms (average employment being somewhere in the range of 15-20 workers) doing a
very homogeneous activity in geographically concentrated markets. The small size of these
firms means that monitoring problems are unlikely to be severe because the owner normally
also works in the home and also that collection of good quality data on all workers is feasible.
Finally, the product market side of this sector is interesting. An important fraction of the
residents of these homes have their care paid for by the Department for Social Security
(DSS). But, the amount they pay is capped and was not increased when the minimum was
introduced.4 Homes whose residents are paid for by the DSS are then in a situation where
they are not able to pass any of their cost increases on to prices: this is likely to increase the
scope for identifying employment effects from minimum wage introduction.
3 This logic is, of course, similar in spirit to Castillo-Freeman and Freeman’s (1991) study of Puerto Rico. Focusing on situations where more low paid workers are present obviously heightens the chance of finding employment effects of minimum wages. 4 One may worry that other regulatory changes occurred at the same time as the introduction of the minimum wage. We were not able to find any such changes so ensuring our before and after analysis of wage and employment effects associated with minimum wage introduction are not contaminated by other coincident policy changes.
6
There is, of course, one disadvantage to looking at a sector in which minimum wages
really ‘bite’, namely that one is more likely to find negative effects of minimum wages on
employment. While labour economists have debated the relative merits of perfect competition
or monopsony as models to explain the negative, positive or non-existent effects of minimum
wages on employment (see, for example, Brown, 1999, for a recent review of this), all
models of the labour market predict that a high enough minimum wage will reduce
employment. So, one must be careful not to extrapolate from studies of one sector (especially
the kind of sector we study) to conclusions about the economy as a whole.
We consider what happened to wages and employment in the care homes sector in the
period surrounding the introduction of the NMW. The analysis confirms that the choice of
sector is a good one for studying the likely impact of minimum wages. Pay is very low, with
the average hourly wage being around £4 just before the minimum wage introduction.
Before its introduction around 1 in 3 workers were paid less than the minimum wage. In
April 1999 we see a spike in the wage distribution of around 30 percent at the minimum
wage. The minimum wage clearly ‘bit hard’ in this sector. It therefore provides a very good
environment for looking at the impact of the minimum wage on employment.
We look at the employment effects of the minimum wage by considering what is now
a standard technique in the empirical literature on minimum wages and employment. This
relates changes in employment before and after the minimum wage introduction to the
fraction of low paid workers in the pre-minimum wage period (see, for example, Card’s,
1992, state based study of an increase in the US federal minimum wage in the early 1990s).
In summary we find a sizable wage impact, together with moderate employment and hours
reductions following the introduction of the minimum wage.
The rest of the paper is structured as follows. Section II presents a brief history of
minimum wage legislation in the UK and some summary statistics on employment over time

7
in the sector upon which we focus. Section III describes our data collection process and
presents some descriptive statistics. Section IV reports empirical findings on the wage effects
of the minimum wage. Section V then moves on to consider the employment and hours
effects, together with a brief investigation of other possible outcomes. Section VI then
concludes.
II. Minimum Wages in the UK and the Care Homes Sector
Minimum Wages in the UK
Unlike many other countries, minimum wages have historically not had a very important role
to play in the UK labour market. This is certainly true at the national level where there has
never been an economy wide minimum wage floor. But minimum wages used to be a factor
in some low wage sectors. There used to be an industry-based system of minimum wage
floors, the Wages Councils, which operated from 1909 to their abolition in 1993. These
Wages Councils covered around 12 percent of the workforce at the time of their abolition. In
some earlier work we have studied the impact of the Wages Councils, concluding that their
activities did little to harm employment, but that they compressed the wage structures of the
sectors in which they operated (Dickens, Machin and Manning, 1999; Dolado et al, 1996).
Following its election in 1997, Tony Blair’s Labour Government was committed to
introducing a National Minimum Wage (as the Labour Party had been in earlier elections that
they lost). It set up a Low Pay Commission consisting of academics and representatives of
employers and workers to report on a suitable form and level (see Low Pay Commission,
1998). Eventually, a minimum wage of £3.60 per hour was introduced in April 1999 for those
aged 22 or older, with a lower youth rate of £3 per hour for those aged 18-21 inclusive (those
aged less than 18 were not covered). The Low Pay Commission expected that around 9
percent of workers would be directly affected and those workers would, on average, receive a

8
30 percent boost to their pay (Metcalf, 1999). These numbers have subsequently been revised
down, with it seeming more likely that about 6 percent of workers’ wages were raised up to
the minimum (Dickens and Manning, 2002). This, of course, still amounts to a potentially
large impact on the labour market.
Moreover, it is also clear that there is systematic variation in who benefited from
minimum wage introduction. Metcalf (1999) also notes the increased importance of the
minimum wage for part-time female workers. Of the workers he estimates to be directly
affected by the introduction of the minimum wage, around 55 percent were women working
part-time. The sector upon which we focus, the care homes sector, and particularly its
principal occupation, that of care assistant, is very female intensive and has many part-time
workers. Furthermore, as we will see when we describe our data more fully below, the
majority of workers in this sector possess few formal qualifications and wages are very low.
As such this is very much a sector that had the potential to be hit hard by the minimum wage.
The Labour Market for Care Assistants
The occupation of care assistant is not only one of the lowest paid occupations5 but
also is an increasingly important one in the UK. Indeed, not surprisingly given the aging of
the population, the employment of care assistants has risen in recent years in the UK. One can
gain some idea about the aggregate picture from looking at the number of care assistants in
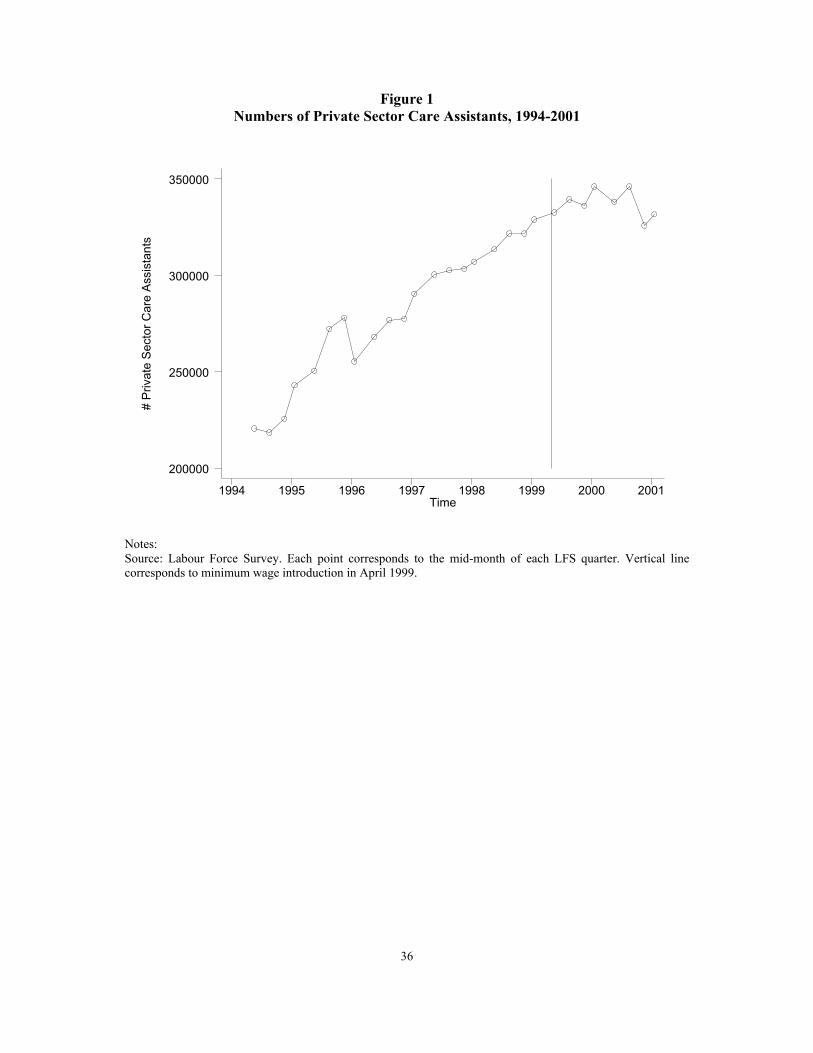
the quarterly Labour Force Survey (LFS). Figure I shows total employment of care assistants
in the private sector between 1994 and 2001.6 The vertical line on the Figure refers to the date
of minimum wage introduction.
The Figure shows a rise in the number of private sector care assistants from around
220000 in 1994 to 330000 by 2001. But closer scrutiny of the Figure shows that, according to
5 Taking a look at the occupational breakdowns in the published New Earnings Survey Tables each year normally finds the lowest paid occupation in the UK to be either hairdressers or care assistants.

9
these aggregate numbers, there appears to be a moderate slowing down of employment
growth in the later time period after minimum wage introduction. Of course, this can only be
suggestive as business cycle factors may be at play here. However, looking at the temporal
pattern of residuals from a regression of care assistant employment on the aggregate
unemployment rate (or on GDP) still reveals the slower increases occurring post-minimum
wage introduction (especially into the year 2000).7
This is illustrative of general employment trends for care assistants.8 However, to
properly consider the question of employment effects of minimum wage introduction in a
more systematic and rigorous fashion one really requires micro-data on a big enough sample
of care assistants before and after minimum wage introduction. This is therefore what we turn
to next.
III. Data Issues and Descriptive Statistics
Most existing UK data sources are really not well suited to carrying out a detailed before and
after evaluation of the economic impact of the introduction of the UK minimum wage.9 We
therefore decided to collect our own data. We wanted to focus on a situation where the
6 Each point on Figure corresponds to the mid-month of each LFS quarter (which respectively cover the months March-May, June-August, September-November, December-February). 7 Separate regressions of the log of the number care assistants on log(unemployment rate) and log(gdp) produced coefficients (standard errors) of -.68 (.04) and 1.18 (.07). Both regressions had an R-squared of .91. 8 It also squares up with the demand side in that the size of the older age population was trending upwards as well. For example, the number of people aged 75 and over in the UK rose steadily year on year from 1996 onwards as follows: 1996 – 4.17 million; 1997 – 4.24 million; 1998 – 4.29 million; 1999 – 4.33 million; 2000 – 4.36 million (Source: Office for National Statistics). 9 For example the survey containing the best wage data, and which covers the largest sample of workers, is the New Earnings Survey (NES). This has several serious shortcomings if one wished to try and evaluate the impact of minimum wage introduction. First, it is carried out in April of each year which is unfortunate as the minimum wage was introduced in April 1999. Wages contained in the survey are therefore a mish mash of pre- and post-introduction wages. Second, and even more important, it undersamples low wage part-time workers (as workers below the National Insurance weekly earnings lower limit are not well picked up). The other commonly used micro-data suffer from other problems. First most (like the General Household Survey or the Family Expenditure Survey) simply do not contain enough low wage workers. Second as they are employee, rather than employer, surveys they are likely to be characterised by measurement errors in wages (see Dickens and Manning’s, 2002, analysis of Labour Force Survey data).

10
minimum wage had the potential to have an important impact and so chose to collect data on
employers and workers in residential care homes.
As already noted, there are several compelling reasons for choosing this sector. First,
it is a leading employer of many low wage workers. As already noted, the principal
occupation, care assistants, is one of the lowest paid occupations in the UK. Second, most
homes are reasonably small (average employment size < 20; median employment size = 15)
and this enables us to collect data on all workers within the homes. Third, there are basically
no trade unions to distort wage-setting procedures in this sector.
Sample Design
Our sample design was to sample the population of UK care homes before and after
the introduction of the minimum wage. We obtained lists of all homes from the Yellow
Pages Business Database in July 1998 (for the pre-minimum sampling) and in May 1999 (for
the post-minimum sampling). There were 11635 care homes in the former and 11036 homes
in the latter. As one of the things one might be interested in is the extent to which employers
adjusted wages before the minimum wage introduction we sampled (based on area
stratification) one-ninth of the homes in each of the nine months before minimum wage
introduction, and then we re-sampled the homes (including new homes), again one-ninth at a
time, in the nine months following the introduction of the wage floor. We also identified
home closures that occurred over this time period.
11
The questionnaire was mailed to the manager of the care homes and asked a range of
questions about the home and about the views managers (who are often home owners) had
about the minimum wage. For obvious reasons, the precise nature of the attitudinal questions
was different for questionnaires sent out before and after the introduction of the minimum
wage.10 Managers were also asked to provide data on job title, sex, age, length of service,
possession of a nursing qualification, weekly hours and hourly wages for all workers.
For a postal survey we achieved a reasonable response rate (of the order of around 20
percent). One may however worry about the representativeness of the achieved sample. The
Appendix therefore compares the sample we analyse with data on care assistants from the
Labour Force Survey. The correspondence is reassuringly very close, giving a lot of
confidence that the responses we received are representative, at least in terms of the variables
we compare (age, hours, tenure and wages). One should also note that in a small number of
homes managers were less likely to complete all the information on worker characteristics. In
these cases where there was missing information on hourly wages and/or hours we imputed
them using the average for that job within that firm. We report both results including and
excluding imputed figures below.
Descriptive Statistics
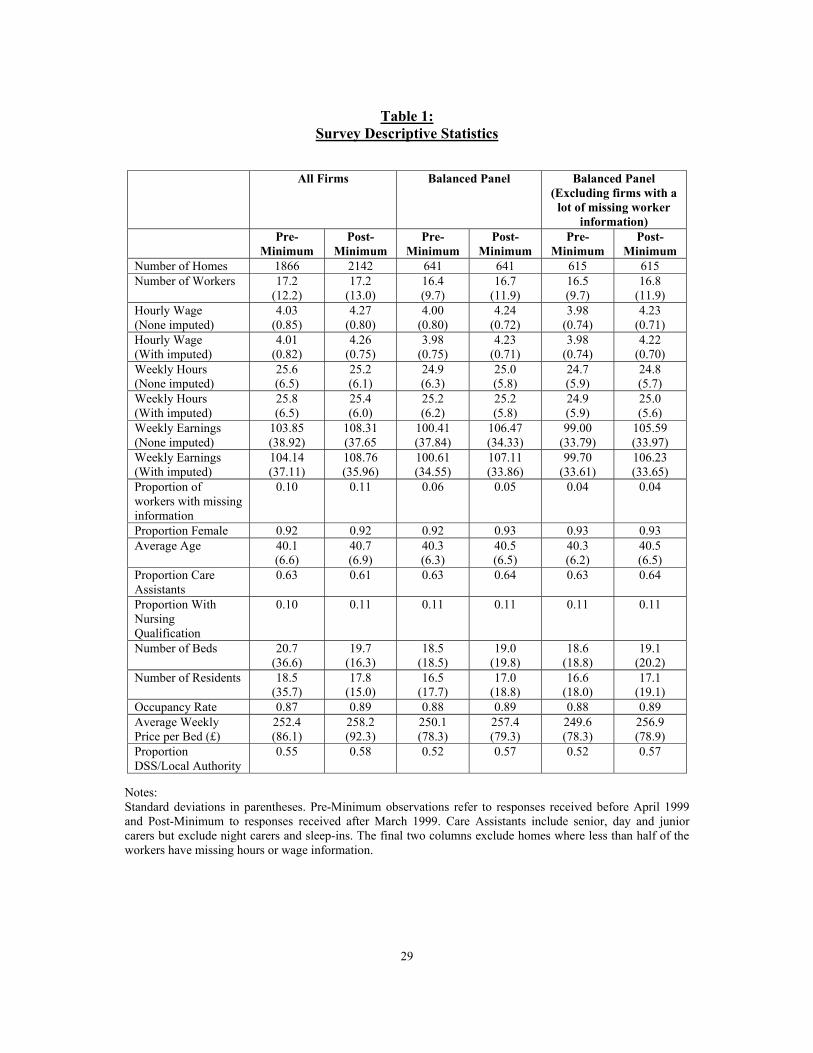
Some features of the sample are described in Table 1. The first two columns show the
characteristics of the total sample of workers and homes pre and post minimum wage
introduction, the middle two for all homes that we obtained some responses on worker
characteristics in both sampling periods (the balanced panel of homes) and the final two
columns further exclude homes where worker information supplied was very patchy.11
10 The actual questionnaires are available on request from the authors. 11 More specifically we exclude homes where less than half of the workers have missing hours or wage information.
12
The Table reveals a number of pertinent features of the labour market under study.
First, and probably most striking, wages really are very low in the care homes sector. Before
the introduction of the minimum wage average wages were about £4 per hour (whether or not
we include imputed wages does not make much difference). This sector therefore clearly
satisfies one of the criteria we wanted to emphasise in a study of the impact of minimum
wage introduction, namely that the imposition of the minimum wage floor had the potential
to affect a large number of workers.
The second clear feature of the wages data is that they rose sharply after minimum
wage introduction. Average wages went up by somewhere around 24 pence per hour (or by
around 6 percent). We consider this in much more detail in the next Section where we discuss
the ‘bite’ of the minimum wage introduction. Of course, the requirement that the minimum
wage introduction significantly affected wages and their distribution is a pre-requisite for
going on to look at employment effects.
The Table also documents other characteristics of the sample. Average home size is
fairly small, both in terms of workers and residents. Mean employment is in the range of 16
to 17 workers, and the average number of residents is around 17 to 18 per home. They both
remain fairly constant before and after the minimum wage introduction.
As stated earlier the principal occupation in this sector is care assistants. This
occupational group comprises over 60 percent of the workers in the sample. The workers are
typically older workers (average age about 40), overwhelmingly female, working an average
of 25 hours per week. Only around 1 in 10 possess a nursing qualification (other educational
qualifications are not relevant in this sector).
Finally, we have collected other home level information on the occupancy rate of beds
and, since the sector has price regulation operating through local authorities, on the percent of
residents who pay local authority prices for beds. This latter feature of the sector is, of course,

13
very interesting in the context of minimum wage effects. One argument sometimes put
forward in the literature is that one may not observe employment responses to minimum
wages if employers are able to pass minimum wage increases on to consumers in the form of
higher prices. This seems unlikely to happen in the care homes sector as prices are, in many
cases, regulated by local authorities. We return to look at possible price responses later, after
considering the wage and employment effects of the minimum wage introduction.
IV. Wages and the Minimum Wage
Before considering the employment consequences of minimum wage introduction, one
clearly needs to establish that the minimum wage had the effect one expects on wages and the
distribution of wages. As noted above, confirming that the minimum wage introduction had
real ‘bite’ and affected the wages of low wage workers in the expected direction is clearly a
prerequisite before one goes on to look at the impact on employment.
The ‘Bite’ of The Minimum Wage Introduction
The UK National Minimum Wage was introduced in April 1999 at £3.60 per hour for
workers aged 22 or more, and at £3.00 per hour for 18-21 year olds. When presenting
measures of the impact of the minimum wage we sometimes use these age-specific minimum
wages and sometimes just the adult minimum: the reason for this is that there is a spike in the
youth wage distribution at the adult minimum after the introduction so that one could argue
that the adult minimum is the effective minimum.12
Table 2 reports on our investigations of the impact of minimum wage introduction on
wages. The numbers in the Table demonstrate a clear importance of minimum wage
introduction for care home workers. The Table shows the percentage of workers paid less
than the minimum wage prior to its introduction, how far wages would have to be increased if
12 See Katz and Krueger (1992) for evidence that in the US the youth sub-minimum is rarely used.

14
these workers’ wages were raised to the minimum and the percentage paid at exactly the
minimum (the size of the minimum wage spike in the wage distribution). As with Table 1
statistics are reported for all care homes, for the balanced panel and then for the balanced
panel that excludes homes with limited worker information.
The first thing to notice in the Table is that the sector we are studying is one that,
conditional on the minimum wage introduction being binding, had the potential to be very
heavily affected by the national minimum wage. Around 32 percent of workers were paid
below the (age-specific) minimum wage before it was introduced. Around 38 percent were
paid below the adult minimum rate.
Table 2 also presents measures of the ‘wage gap’, namely the average increase in
wages needed to bring workers beneath the mandated minimum up to the minimum. The
wage gap in firm i is computed as ∑
∑ −=
jjiji
jji
minjiji
i Wh
)0,Wmax(WhGAP where hji is the weekly
hours worked by worker j in firm i, Wji is the hourly wage of worker j in firm i, and Wjimin is
the minimum wage relevant for worker j in firm i (this might be the age-specific or the adult
minimum). Table 2 shows that the wage gap averages 4 percent using the age-specific
minimum and 4.7 percent using the adult minimum. Again this confirms a potentially very
large impact of the minimum wage introduction on the sector.
That the minimum wage impacted hard on the wage structure of care homes is borne
out by looking at the post-minimum columns of the Table. First, there seems to be very little
under-payment (around 1 percent for all homes or slightly lower in the balanced panels).
However, something one might be concerned about here is that firms that subsequently pay
illegally below the minimum wage do not respond to our survey. But were this to be true we
would expect to see the initial wage levels in our sample as a whole being below those in the
balanced panel as the latter homes respond to the survey both before and after the minimum
15
wage was introduced. However, Table 1 shows initial pre-minimum wage introduction wages
to actually be slightly higher in the full sample as compared to the balanced panel, so there is
no evidence that this is the case.13
The second feature of Table 2 that shows the minimum wage ‘bit’ hard is the very
noticeable spike at the minimum after April 1999. Something like 28 or 29 percent of
workers were paid the age-specific minimum after introduction and around 30 to 31 percent
were paid the adult minimum. One should notice here that the spike is measured at exactly
the minimum wage (not as plus or minus a small range around the minimum as in some other
studies).
Not surprisingly the minimum wage introduction therefore had a sizable impact on
wage dispersion. The gap between the 50th and 10th percentiles of the log(hourly wage)
distribution narrowed from .21 to .09. At the same time the upper half of the distribution was
unaffected with the gap between the 90th and 50th percentiles of the distribution not changing.
The 90-50 gap was .34 in both pre- and post-minimum time periods.14
Minimum Wage Introduction and Care Home Wages
The numbers in Table 2 show a strong impact of minimum wage introduction on the
care homes wage distribution. But, for our empirical analysis, we would also like evidence
that the homes we would most expect to be affected were, indeed, the most affected. This is
the purpose of this sub-section. More specifically the basic wage change equations we
estimate are of the form:
∆lnWit = α1+ β1MINi,t-1 + δ1Xi,t-1 + εit (1)
where ∆lnWit is the change in wages for home i in the period surrounding minimum wage
introduction (t-1 denotes the period before, t the post-minimum period), MINi, t-1 is a measure
13 We also investigated whether the sample response rates fell disproportionately in the low-wage regions where the minimum wage had more bite. There was no evidence of this either.

16
of the importance of the minimum wage for home i (defined below), Xi,t-1 is the (t-1) level
home and worker characteristics15 and εit is an error term. The key parameter of interest is β1
which measures the relation between wage changes and the minimum holding constant the
other factors we control for.
There are some practical concerns with this kind of equation. The first issue is how
one measures MINi, t-1. We use the two measures of the impact of the minimum wage already
discussed in Table 2: the proportion of workers paid less than the minimum wage in the
period before its introduction, and the wage gap. It is not clear which is the better measure.
For example, if the minimum wage caused all workers initially paid below it to lose their
jobs, then the headcount might be the better measure, but if it is more difficult to raise the
productivity of those a long way below the minimum wage than those near it, then the wage
gap measure might be better.
The second main modeling issue concerns identification. Because the minimum wage
introduction in the UK was at national level the variation across homes in the impact of the
minimum wage all comes from variation in the initial level of wages. β1 is then only a true
measure of the impact of the minimum wage if, in the absence of the minimum wage, there
would be no relationship between the initial level of wages and the change in wages (i.e. if
wages follow a random walk). This is the implicit identification assumption in using an
equation like (1) to estimate the impact of the minimum wage.
We test this identifying assumption in two related ways that consider whether the
relationship between wage changes and their initial level shifted in the period surrounding
minimum wage introduction relative to an earlier period when no minimum wage was in
14 See Dickens and Manning (2002) for an in-depth analysis of the impact of minimum wage introduction on wage inequality in the UK. 15 We also considered models where, rather than entering the initial period home and worker characteristics as controls, the change in X, ∆Xit, was entered. This made very little difference to the reported pattern of results throughout our analysis.
17
place. We first look at the relationship between wage changes and initial wages in the
minimum wage introduction period (1998/99) as compared to the relationship estimated from
some data we collected in an earlier time period (1992/93) for care homes on the south coast
of England.16 Second we consider whether the relationship between wage changes and the
minimum wage variable altered across these two time periods by constructing a counter-
factual minimum wage variable (placing the minimum at the same percentile point of the
initial wage distribution17) in the earlier non-minimum wage time period. We do this for both
the headcount and wage gap measures. The two approaches thereby enable us to consider
whether one observes a different association in the period surrounding minimum wage
introduction as compared to an earlier time period where no such policy was in place.
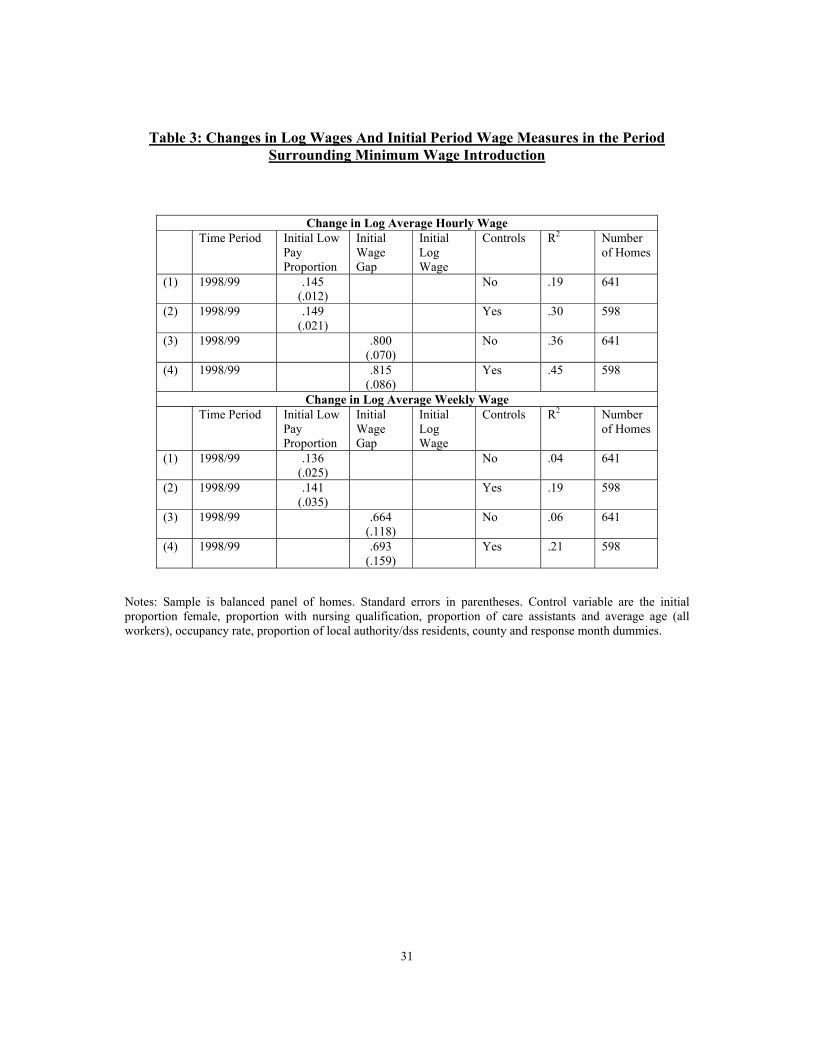
Estimates of Wage Change Equations
Table 3 reports estimates of home-level wage change equations for hourly wages
(upper panel) and for weekly wages (lower panel) in the period surrounding minimum wage
introduction. Four specifications are reported in each case. Rows (1) and (2) present estimates
of wage equations including the initial low pay proportion to measure MINi, t-1. They differ in
that the first specification excludes and the second specification includes a set of control
variables. Rows (3) and (4) then present analogous specifications using the wage gap measure
as an independent variable.
In all cases there is evidence of bigger wage increases in homes with more low-wage
workers in the pre-minimum wage period. The associations are strong in statistical terms and
are sizable. They also look rather similar for hourly and weekly wages. For example,
16 See Machin, Manning and Woodland (1993) for more detail on this earlier survey and Machin and Manning (2002) for an analysis of wage structure in care homes in the earlier time period. This 1992/93 survey was carried out for the same reason as the current one, namely to evaluate the impact of minimum wage introduction on care homes. The first wave of the survey was carried out before the April 1992 election as the Labour Party manifesto had committed to introduce a minimum wage if they were elected. Their loss of the election meant our plan to carry out a before and after analysis of minimum wage introduction was scuppered. We still, however, collected data after the election period and so can look at before and after changes with these data as well.

18
according to row (2) of the upper panel of Table 3 a home with one third of its workers paid
less than the minimum saw average wage growth of 3.3 percent higher than one which had
one tenth of its workers paid less than the minimum.18 This is large given that average wage
growth was around 6 percent in this time period
These results appear to establish an important impact on wages of the minimum wage
but, as noted above, it may merely be because there has always been a link between wage
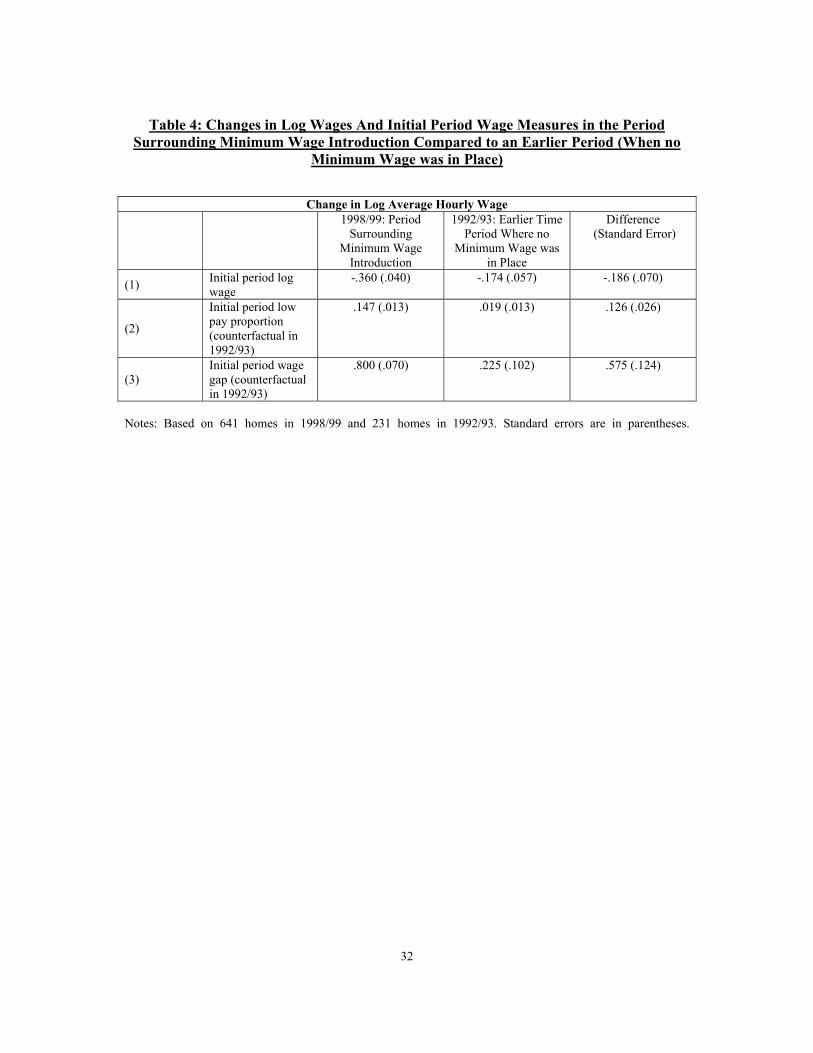
growth and initial low pay. So we investigate this in some detail in Table 4. We do so in the
two main ways already mentioned above. First, we estimate equations relating wage change
to the initial period average wage in the periods surrounding minimum wage introduction and
in the earlier 1992/93 time period for which we have data where no minimum wage was in
place. This equation takes the form:
∆lnWit = α2 + β2lnWi,t-1 + υit (2)
where the focus is now on estimating the association between wage changes and the initial
average wage, namely the parameter β2 (υ is an error term).
The second way in which we benchmark our results against the earlier time period is
to return to equation (1) and specify a counter-factual minimum wage in the earlier non-
minimum wage period so as to compute measures of the initial low pay proportion and wage
gap variables. We do so by placing this counter-factual minimum at the same percentile point
of the wage distribution.
Table 4 reports these results for hourly wages. For all three specifications there is a
clear shift in the relationship between wage changes and the initial wage measures in the
period surrounding minimum wage introduction as compared to the earlier time period. The
significantly negative coefficient on the initial wage in the 1998/99 model in row (1) of the
17 This corresponds to £2.75 per hour. 18 The calculation is .145*(.33 - .10) = .033.

19
Table demonstrates very clearly that, in the period surrounding minimum wage introduction,
wage growth was higher in firms with lower wages in the initial period. In the earlier non-
minimum wage period (1992/93) there is also a negative coefficient on the initial wage, but it
is clear that its magnitude is much smaller (in absolute terms) than in 1998/99. The final
column reports the gap between the two and it is very clear that the relationship shifted
markedly between the two time periods.
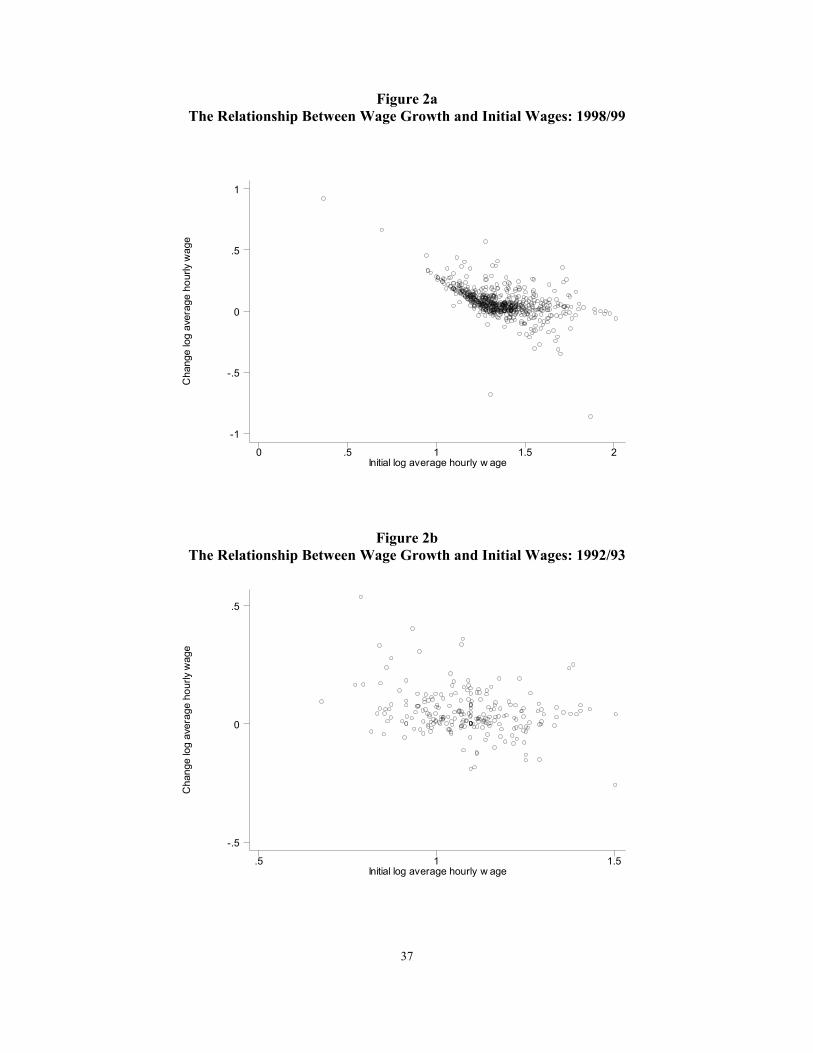
Some graphs also serve to make the same point. Figure 2a plots the relationship
between average wage growth and the initial log wage in 1998/99 and Figure 2b does the
same for the 1992/93 data. While it is very clear that there is a negative relationship in both
periods, the strong diagonal effect on homes with initial low wages is very apparent in the
1998/99 data. This reveals a clear impact of the minimum wage.
In rows (2) and (3) of Table 4 we also report results of wage growth equations
including the initial minimum wage variables for the 1998/99 data and the counter-factual
initial minimum wage variables for the 1992/93 data. These very much reconfirm the pattern
from the row (1) models. There is a marked shift between periods for both measures as one
can see a much stronger positive impact of the initial minimum wage variables in the period
surrounding minimum wage introduction. Indeed, there is no relationship between wage
changes and the initial low pay proportion in the earlier non-minimum wage period and a
much smaller association with the initial wage gap measure. This shift is borne out by the
positive, statistically significant gaps given in the final column of the Table.
All in all, the evidence of this Section has established a clear and important effect of
minimum wage introduction on care home wages. We turn to investigate the possible
employment effects in the next section.
20
V. Employment and the Minimum Wage
We analyse the employment consequences of the minimum wage introduction using
the same kind of methodology as the wage analysis. We estimate home-level equations that
relate changes in employment or hours in the period surrounding minimum wage introduction
to headcount and wage measures of the extent of initial low pay. And, because of the
identification questions already raised, we look at the relationship between changes in
employment and initial wage levels in the period of minimum wage introduction and the
period where no minimum wage was in place. We begin with the latter in the next sub-
section, and then move on to the former after that.
Changes in Employment and Initial Wages
As before, the implicit identification assumption here is that, in the absence of the
minimum wage, there would be no relationship between employment growth and the initial
level of wages. It is not obvious this is the case (e.g. homes that are doing less well might
pay lower wages and have lower employment growth) so we start by investigating the
relationship between employment growth and initial wages.
Table 5 reports the results of carrying out this exercise for the period surrounding
minimum wage introduction (1998/99) and for the earlier period (1992/93) where no such
policy intervention occurred. The upper panel of the Table reports models where changes in
log total employment are related to the initial period wage measures, whilst the lower panel
reports results where the dependent variable is the change in log total hours.
The first thing to note is that the correlations of employment changes with initial wage
measures tend to be weaker than the correlations with wage changes considered earlier. That
said, there is some evidence (of varying strength depending on specification) of shifts
occurring between the ‘policy on’ and ‘policy off’ time periods. In all cases but one, the sign

21
of the relationship switches between periods, revealing a tilt in the relationship so that, in the
period surrounding minimum wage introduction, employment growth tended to be reduced in
homes that were impacted more by minimum wage introduction. And some of the gaps in the
final column are statistically significant (or on the borders of significance, the one exception
being the initial period low proportion in the upper panel of the Table). We take this as some
preliminary evidence that the relationship between employment and low wages may have
shifted in the period surrounding minimum wages.
Changes in Employment And Initial Minimum Wage Variables
In this sub-section we consider in more detail the relationship between home-level
employment and hours changes and the minimum wage variables in the period surrounding
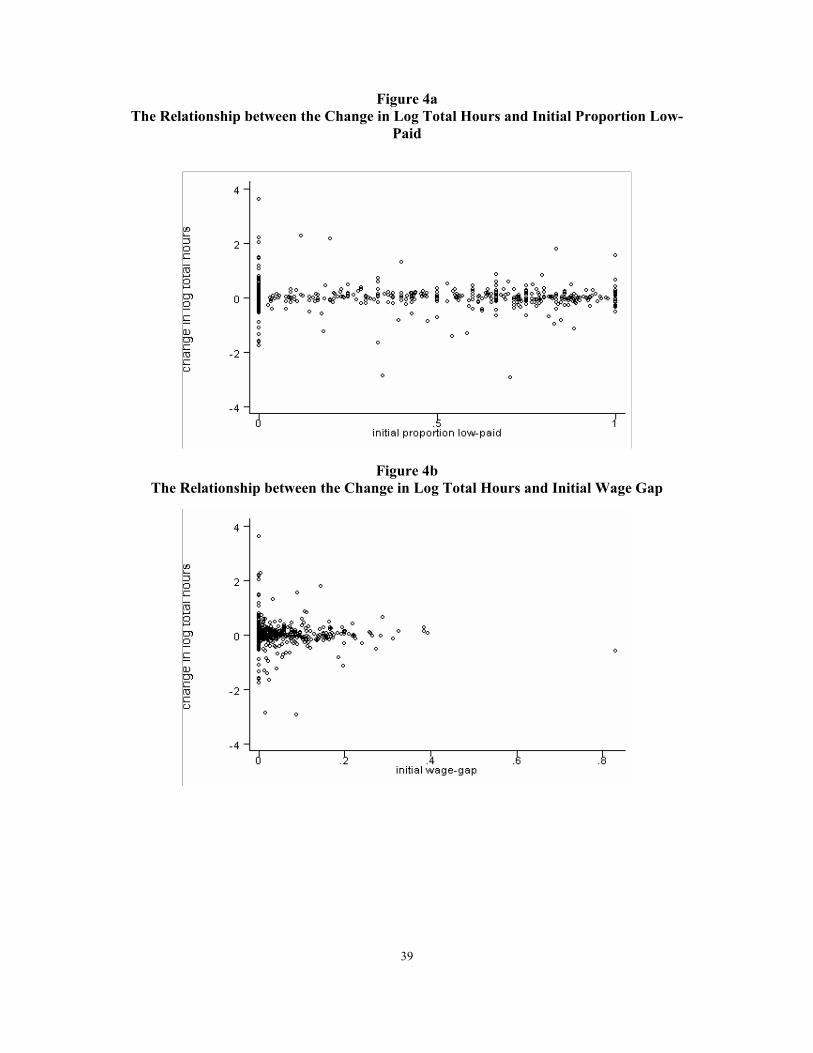
minimum wage introduction. Figures 3 and 4 plot the basic data we use to look at these. The
change in log total employment is plotted against the initial proportion low-paid in Figure 3a
and against the initial wage-gap in 3b. Figures 4a and 4b do the same but with the change in
log total hours on the left-hand axis. Eyeballing these scatterplots does not reveal any distinct
pattern, despite the very clear wage evidence presented earlier.
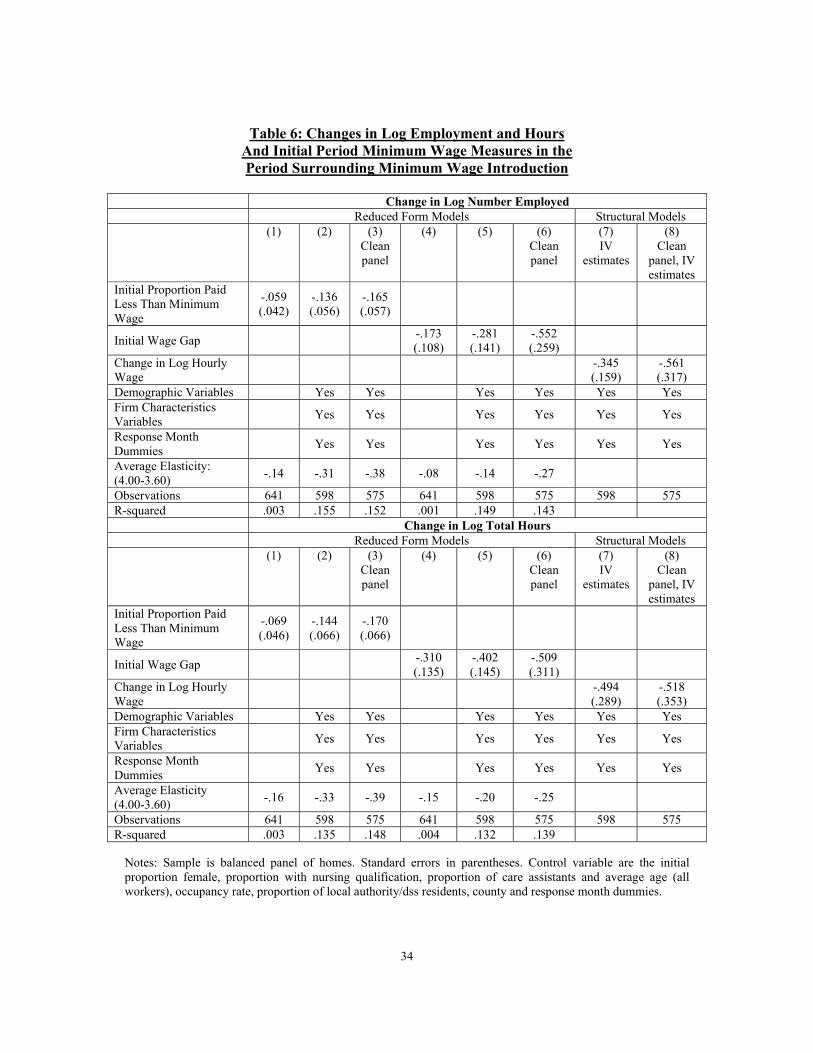
In the first instance we estimate reduced form employment change equations of the
form:
∆lnNit = α3 + β3 MINi,t-1 + δ3Xi,t-1 + ζit (3)
Various estimates of equation (3) are given in columns (1) through (6) of Table 6, for
changes in total employment in the upper panel and for changes in total hours in the lower
panel of the Table. In the final two columns of the Table we also present structural estimates
of labour demand equations from a simple structural model of the following form (equation
(1) is reproduced from above):
∆lnNit = α4 + β4 ∆lnWit + δ4Xi,t-1 + ωit (4)
∆lnWit = α1+ β1MINi,t-1 + δ1Xi,t-1 + εit (1)

22
We are able to estimate β4, the wage elasticity of labour demand, by using MINi,t-1 as an
instrumental variable for the wage change (equation (1) can thus be thought of as the first
stage regression in the IV procedure). It is also straightforward to see how this relates to the
reduced form models (1) and (3) where the labour demand elasticity β4 is given by β3/β1.
Turning to the results in the Table, columns (1) and (4) report the coefficient on the
initial low pay proportion and the initial wage gap respectively in a regression where the
dependent variable is the change in log employment or log hours and there are no other
controls. In these basic models the estimated impact of the minimum wage is negative,
though not significantly different from zero. However the addition of controls and restriction
of the sample to those with relatively complete information on worker characteristics
(columns (2) and (3) for the headcount, columns (5) and (6) for the wage gap) makes the
coefficients both larger in absolute terms and more significant. In these specifications we are
able to pin down a significant negative effect on employment growth.
The Table also reports implicit elasticities calculated on the basis of a minimum wage
increase of 40p (the adult rate going from £3.60 to £4.00). These ask the question: what
would the additional effect on employment have been if the minimum wage had been
introduced at a higher level? In the models with controls these elasticities are in the range of
–.15 to –.40. These are reasonably sizable in the context of the minimum wage literature,
though are not so big given the very large impact of minimum wage introduction on the
wages and wage distribution of care home workers.
The other, related, way to look at the employment response to wage changes is to
directly compute the elasticity of employment with respect to the wage, using the initial wage
gap variable as an instrument for the change in average wages. Structural estimates of
employment change equations are reported in columns (7) and (8). They reveal a well
23
determined negative wage effect that is moderate in size19, ranging from about -.35 to -.55,
depending on the specification.
One issue of possible importance is the speed at which employers may adjust in
response to minimum wages. It is hard to do anything very convincing here given we only
follow homes nine months before and after minimum wage introduction. But, from what we
can look at, it seems that wage adjustment was very rapid and the wages clearly adjusted at
the time of introduction and barely at all before (i.e. there seems no evidence of ‘anticipation’
effects on wages). Employment adjustment may be slower, but one should note that this is a
very high employee turnover sector (presumably in part due to the very low wages).
Furthermore a study of what happened to wages and employment in care homes before and
after the more recent uprating of the minimum wage (up to £4.10 for adults and £3.50 for 18-
21 year olds in October 2001) finds employment effects of much the same magnitude, and no
stronger, than those reported here (Allison, 2002).
While the estimated employment effects are clearly not as strong as the wage effects
considered in the previous section of the paper, they do suggest that employers cut
employment and hours in response to the minimum wage.20 One might wonder how this is
possible in this sector as these firms are regulated and there are minimum standards of care
for the residents that are mandated. However, inspection of these homes is far from perfect
and the sector is notorious for examples of homeowners providing inadequate standards of
care (for example, they have been the subject of several TV documentaries). It seems
19 See Hamermesh (1993) for a very detailed consideration of the large body of work that estimates labour demand elasticities. 20 The analysis is based upon the balanced panel of homes. Given our data we can also look at closures, although only in the window very recently after minimum wage introduction (since our second wave is based on a sample of homes in May 1999). Running probit models of closure on the two minimum wage variables, and either including or excluding the control variables, resulted in positive, but very small estimated marginal effects (all of which were statistically insignificant). Whilst it is clear that effects may differ if one looks at a longer period, this short run analysis finds no evidence that rising wage costs ensuing from minimum wage introduction resulted in home closure. The same conclusions were reached for a county-level analysis of entry

24
plausible that managers face a trade-off between the fraction of the time they are in breach of
care guidelines (which is determined by employment) and the probability of being fined
when inspected in that situation. In addition, owner-managers often work considerable hours
in the homes themselves and may have the ability to substitute their labour for that of paid
help.
Other Outcomes and the Minimum Wage
This section briefly investigates the impact of the minimum wage on other outcomes.
It is possible that they may have ‘passed on’ increased wage costs from the minimum wage
introduction through higher prices though the extent to which this is possible may be limited
by the price regulation in place. Second, there may have had to be re-organizations that could
raise productivity (e.g. quality of care improvements, or increases in care worker
productivity, or simply making people work harder for their higher wages).
We consider these possibilities in Table 7. The upper panel reports price change
equations and the lower two panels consider two productivity measures, using the same kind
of models as for wages and employment. The first productivity measure used is changes in
residents per worker hour, the second comes from managers’ responses to a question about
whether they think worker effort went up, stayed the same, or fell in the period around
minimum wage introduction.
Perhaps not surprisingly given the nature of price regulation in the care homes sector
we find no evidence that prices rose by more in the initial low wage firms. All the estimated
coefficients in the upper panel are small and none of the coefficients approach anything near
statistical significance (all have t-ratios < 1). As such there seems to be no evidence that
minimum wage increases might have been passed on through higher prices in this sector.
and closure using Labour Force Survey data. All of these results are presented in the earlier Discussion Paper version of this paper (Machin, Manning and Rahman, 2002).

25
There is also not much evidence in line with the re-organization/productivity
improvement idea considered in the lower panels of Table 9. While the estimated coefficients
on the minimum wage variables in both the change in residents per worker hour and
subjective effort change equations are all estimated to be positive, none are significantly
different from zero when the control variables are included.
VI. Conclusions
In this paper we have presented empirical work on the wage and employment consequences
of the recent introduction of the UK national minimum wage for a specific sector of the UK
labour market. As we argued in the introduction to the paper we think examination of the
economic effects of this minimum wage introduction provides a good testing ground for
looking at minimum wage effects and provides an ideal opportunity for presenting some fresh
evidence on the debate about what minimum wages do. We implement our empirical study
by focusing on workers in the care homes industry, a low wage sector that was highly
vulnerable to minimum wage introduction. In the absence of suitable data from existing
sources we chose to examine the minimum wage impact by carrying out our own survey
before and after the minimum wage was introduced.
From our analysis of these data we find there to have been a very important wage
compression effect on the bottom half of the wage distribution in this low wage sector.
Before its introduction around 1 in 3 care home workers were paid less than the minimum
wage. In April 1999 we see a spike in the wage distribution of around 30 percent at exactly
the minimum wage (and little evidence of non-compliance). This resulted in wage growth
being considerably higher in the period surrounding minimum wage workers in homes who
had more low-paid workers before the minimum came in. This seems to establish that the

26
minimum wage had considerable ‘bite’ on wages and this substantially altered the structure
of wages of this sector.
Turning to the employment consequences, we are able to find some evidence of
employment and hours reductions occurring in homes after minimum wage introduction. This
seems to be in line with the aggregate behaviour of the labour market for care assistants,
where the fast employment increases of the pre-minimum wage period slowed down in 1999
and 2000.
Of course, one should be very careful to note that the sector we have examined is
particularly vulnerable to the minimum wage as it has very many low-paid workers. It is also
rather special in that its product market structure means homes are constrained in their ability
to pass higher wage costs on into higher prices. Given this, and the fact that studies of the
impact of minimum wage introduction on the overall UK labour market uncover little
evidence of job loss (Stewart, 2001), one should remain cautious in drawing conclusions
from this study about the impact of the introduction of the National Minimum Wage on the
UK as a whole.

27
References
Allison, Nicola (2002) The Effect of the National Minimum Wage in the UK, unpublished MSc Dissertation, University College London.
Brown, Charles (1999) Minimum Wages, Employment, and the Distribution of Income,
Chapter 32 in Orley Ashenfelter and David Card (eds.) Handbook of Labor Economics, North Holland Press.
Brown, Charles, Curtis Gilroy and Andrew Kohen (1982) The Effect of the Minimum Wage
on Employment and Unemployment, Journal of Economic Literature, 20, 487-528. Burkhauser, Richard, Kenneth Couch and David Wittenburg (2000) A Reassessment of the
new Economics of the Minimum Wage Literature With Monthly Data From the Current Population Survey, Journal of Labor Economics, 18,653-80.
Card, David (1992) Using Regional Variation in Wages to Measure the Effects of the Federal
Minimum Wage, Industrial and Labor Relations Review, 46, 22-37. Card, David and Alan Krueger (1994) Minimum Wages and Employment: A Case Study of
the Fast-Food Industry in New Jersey, American Economic Review, 84, 772-93. Card, David and Alan Krueger (1995) Myth and Measurement: The New Economics of the
Minimum Wage, Princeton: Princeton University Press. Castillo-Freeman, Alida and Richard Freeman (1991) Minimum Wages and Employment in
Puerto Rico. Textbook Case of a Wage Floor?, Industrial Relations Research Association 43rd Annual Proceedings, 243-53.
Dickens, Richard, Stephen Machin and Alan Manning (1999) The Effects of Minimum
Wages on Employment: Theory and Evidence From Britain, Journal of Labor Economics, 17, 1-22.
Dickens, Richard, Stephen Machin, Alan Manning, David Metcalf, Jonathan Wadsworth and
Stephen Woodland (1995) Minimum Wages and UK Agriculture, Journal of Agricultural Economics, 49, 1-19.
Dickens, Richard and Alan Manning (1995) After Wages Councils, New Economy, 2, 223-
27. Dickens, Richard and Alan Manning (2002) Has the National Minimum Wage Reduced
Wage Inequality?, Centre for Economic Performance Discussion Paper Number 533. Dolado, Juan, Francis Kramarz, Stephen Machin, Alan Manning, David Margolis and Coen
Teulings (1995) The Economic Impact of Minimum Wages in Europe, Economic Policy, 23, 317-72.
Hamermesh, Daniel (1993) Labor Demand, Princeton University Press.

28
Hamermesh, Daniel (2002) International Labor Economics, National Bureau of Economic Research Working Paper 8757.
Katz, Lawrence and Alan Krueger (1992) The Effects of Minimum Wages on the Fast-Food
Industry, Industrial and Labor Relations Review, 46, 6-21. Low Pay Commission (1998) The National Minimum Wage, Cmd 3976, London: Stationery
Office. Machin, Stephen and Alan Manning (2002) The Structure of Wages in What Should be a
Competitive Labour Market, Centre for Economic Performance Discussion Paper Number 532.
Machin, Stephen, Alan Manning and Lupin Rahman (2002) Where the Minimum Wage Bites
Hard: The Introduction of the UK National Minimum Wage to a Low Wage Sector, Centre for Economic Performance Discussion Paper Number 544.
Machin, Stephen, Alan Manning and Stephen Woodland (1993) Are Workers Paid Their
Marginal Product? Evidence From a Low Wage Labour Market, Discussion Paper No.93-09, University College London.
Metcalf, David (1999) The Low Pay Commission and the National Minimum Wage,
Economic Journal Features, 109, F46-F66.
Stewart, Mark (2001) The Impact of the Introduction of the UK Minimum Wage on the Employment Probabilities of Low Wage Workers, University of Warwick mimeo.
29
Table 1:
Survey Descriptive Statistics
All Firms Balanced Panel Balanced Panel (Excluding firms with a
lot of missing worker information)
Pre-Minimum
Post-Minimum
Pre-Minimum
Post-Minimum
Pre-Minimum
Post-Minimum
Number of Homes 1866 2142 641 641 615 615 Number of Workers 17.2
(12.2) 17.2
(13.0) 16.4 (9.7)
16.7 (11.9)
16.5 (9.7)
16.8 (11.9)
Hourly Wage (None imputed)
4.03 (0.85)
4.27 (0.80)
4.00 (0.80)
4.24 (0.72)
3.98 (0.74)
4.23 (0.71)
Hourly Wage (With imputed)
4.01 (0.82)
4.26 (0.75)
3.98 (0.75)
4.23 (0.71)
3.98 (0.74)
4.22 (0.70)
Weekly Hours (None imputed)
25.6 (6.5)
25.2 (6.1)
24.9 (6.3)
25.0 (5.8)
24.7 (5.9)
24.8 (5.7)
Weekly Hours (With imputed)
25.8 (6.5)
25.4 (6.0)
25.2 (6.2)
25.2 (5.8)
24.9 (5.9)
25.0 (5.6)
Weekly Earnings (None imputed)
103.85 (38.92)
108.31 (37.65
100.41 (37.84)
106.47 (34.33)
99.00 (33.79)
105.59 (33.97)
Weekly Earnings (With imputed)
104.14 (37.11)
108.76 (35.96)
100.61 (34.55)
107.11 (33.86)
99.70 (33.61)
106.23 (33.65)
Proportion of workers with missing information
0.10 0.11 0.06 0.05 0.04 0.04
Proportion Female 0.92 0.92 0.92 0.93 0.93 0.93 Average Age 40.1
(6.6) 40.7 (6.9)
40.3 (6.3)
40.5 (6.5)
40.3 (6.2)
40.5 (6.5)
Proportion Care Assistants
0.63 0.61 0.63 0.64 0.63 0.64
Proportion With Nursing Qualification
0.10 0.11 0.11 0.11 0.11 0.11
Number of Beds 20.7 (36.6)
19.7 (16.3)
18.5 (18.5)
19.0 (19.8)
18.6 (18.8)
19.1 (20.2)
Number of Residents 18.5 (35.7)
17.8 (15.0)
16.5 (17.7)
17.0 (18.8)
16.6 (18.0)
17.1 (19.1)
Occupancy Rate 0.87 0.89 0.88 0.89 0.88 0.89 Average Weekly Price per Bed (£)
252.4 (86.1)
258.2 (92.3)
250.1 (78.3)
257.4 (79.3)
249.6 (78.3)
256.9 (78.9)
Proportion DSS/Local Authority
0.55 0.58 0.52 0.57 0.52 0.57
Notes: Standard deviations in parentheses. Pre-Minimum observations refer to responses received before April 1999 and Post-Minimum to responses received after March 1999. Care Assistants include senior, day and junior carers but exclude night carers and sleep-ins. The final two columns exclude homes where less than half of the workers have missing hours or wage information.

30
Table 2: The “Bite” of the Minimum Wage Introduction
All Firms Balanced Panel Balanced Panel (Excluding firms with a lot
of missing worker information)
Pre-Minimum
Post-Minimum
Pre-Minimum
Post-Minimum
Pre-Minimum
Post-Minimum
% Paid Less Than Minimum Wage
32.3 1.0 31.2 0.8 31.6 0.7
% Paid Less Than Adult Minimum Wage
38.2 4.2 37.7 4.3 38.2 4.3
Wage Gap 0.039 0.002 0.041 0.003 0.039 0.002 Adult Wage Gap
0.047 0.006 0.049 0.007 0.047 0.007
% Paid Exactly Minimum Wage
8.7 27.7 9.3 28.4 9.5 28.7
% Paid Exactly Adult Minimum Wage
8.6 30.0 9.0 30.6 9.3 31.0
Number of Homes
1866 2142 641 641 615 615
Notes: Pre-Minimum observations refer to responses received before April 1999 and Post-Minimum to responses received after March 1999. The final two columns exclude homes where less than half of the workers have missing hours or wage information.
31
Table 3: Changes in Log Wages And Initial Period Wage Measures in the Period Surrounding Minimum Wage Introduction
Change in Log Average Hourly Wage Time Period Initial Low
Pay Proportion
Initial Wage Gap
Initial Log Wage
Controls R2 Number of Homes
(1) 1998/99 .145 (.012)
No .19 641
(2) 1998/99 .149 (.021)
Yes .30 598
(3) 1998/99
.800 (.070)
No .36 641
(4) 1998/99
.815 (.086)
Yes .45 598
Change in Log Average Weekly Wage Time Period Initial Low
Pay Proportion
Initial Wage Gap
Initial Log Wage
Controls R2 Number of Homes
(1) 1998/99 .136 (.025)
No .04 641
(2) 1998/99 .141 (.035)
Yes .19 598
(3) 1998/99
.664 (.118)
No .06 641
(4) 1998/99
.693 (.159)
Yes .21 598
Notes: Sample is balanced panel of homes. Standard errors in parentheses. Control variable are the initial proportion female, proportion with nursing qualification, proportion of care assistants and average age (all workers), occupancy rate, proportion of local authority/dss residents, county and response month dummies.
32
Table 4: Changes in Log Wages And Initial Period Wage Measures in the Period Surrounding Minimum Wage Introduction Compared to an Earlier Period (When no
Minimum Wage was in Place)
Change in Log Average Hourly Wage 1998/99: Period
Surrounding Minimum Wage
Introduction
1992/93: Earlier Time Period Where no
Minimum Wage was in Place
Difference (Standard Error)
(1) Initial period log wage
-.360 (.040) -.174 (.057) -.186 (.070)
(2)
Initial period low pay proportion (counterfactual in 1992/93)
.147 (.013) .019 (.013) .126 (.026)
(3) Initial period wage gap (counterfactual in 1992/93)
.800 (.070) .225 (.102) .575 (.124)
Notes: Based on 641 homes in 1998/99 and 231 homes in 1992/93. Standard errors are in parentheses.

33
Table 5: Changes in Log Employment and Hours
And Initial Period Wage Measures in the Period Surrounding Minimum Wage Introduction Compared to an Earlier Period (When no Minimum Wage was in Place)
Change in Log Number Employed
1998/99: Period Surrounding
Minimum Wage Introduction
1992/93: Earlier Time Period Where no
Minimum Wage was in Place
Difference (Standard Error)
(1) Initial period log wage
.108 (.082) -.190 (.147) .299 (.168)
(2)
Initial period low pay proportion (counterfactual in 1992/93)
-.059 (.042) -.022 (.044) -.037 (.061)
(3) Initial period wage gap (counterfactual in 1992/93)
-.173 (.108) .053 (.137) -.226 (.174)
Change in Log Total Hours
1998/99: Period Surrounding
Minimum Wage Introduction
1992/93: Earlier Time Period Where no
Minimum Wage was in Place
Gap (Standard Error)
(1) Initial period log wage
.153 (.093) -.220 (.165) .375 (.189)
(2)
Initial period low pay proportion (counterfactual in 1992/93)
-.069 (.046) .028 (.053) -.097 (.069)
(3) Initial period wage gap (counterfactual in 1992/93)
-.313 (.135) .365 (.180) -.678 (.224)
Notes: Based on 641 homes in 1998/99 and 231 homes in 1992/93. Standard errors are in parentheses.
34
Table 6: Changes in Log Employment and Hours And Initial Period Minimum Wage Measures in the Period Surrounding Minimum Wage Introduction
Change in Log Number Employed Reduced Form Models Structural Models (1) (2) (3)
Clean panel
(4) (5) (6) Clean panel
(7) IV
estimates
(8) Clean
panel, IV estimates
Initial Proportion Paid Less Than Minimum Wage
-.059 (.042)
-.136 (.056)
-.165 (.057)
Initial Wage Gap -.173 (.108)
-.281 (.141)
-.552 (.259)
Change in Log Hourly Wage -.345
(.159) -.561 (.317)
Demographic Variables Yes Yes Yes Yes Yes Yes Firm Characteristics Variables Yes Yes Yes Yes Yes Yes
Response Month Dummies Yes Yes Yes Yes Yes Yes
Average Elasticity: (4.00-3.60) -.14 -.31 -.38 -.08 -.14 -.27
Observations 641 598 575 641 598 575 598 575 R-squared .003 .155 .152 .001 .149 .143 Change in Log Total Hours Reduced Form Models Structural Models
(1) (2) (3) Clean panel
(4) (5) (6) Clean panel
(7) IV
estimates
(8) Clean
panel, IV estimates
Initial Proportion Paid Less Than Minimum Wage
-.069 (.046)
-.144 (.066)
-.170 (.066)
Initial Wage Gap -.310 (.135)
-.402 (.145)
-.509 (.311)
Change in Log Hourly Wage -.494
(.289) -.518 (.353)
Demographic Variables Yes Yes Yes Yes Yes Yes Firm Characteristics Variables Yes Yes Yes Yes Yes Yes
Response Month Dummies Yes Yes Yes Yes Yes Yes
Average Elasticity (4.00-3.60) -.16 -.33 -.39 -.15 -.20 -.25
Observations 641 598 575 641 598 575 598 575 R-squared .003 .135 .148 .004 .132 .139
Notes: Sample is balanced panel of homes. Standard errors in parentheses. Control variable are the initial proportion female, proportion with nursing qualification, proportion of care assistants and average age (all workers), occupancy rate, proportion of local authority/dss residents, county and response month dummies.

35
Table 7: Prices, Productivity and the Minimum Wage
Change in Log Average Price (1) (2) (3) (4) Initial Proportion Paid Less Than Minimum Wage -0.001
(0.024) -0.013 (0.027)
Initial Wage Gap
0.116 (0.145)
0.048 (0.155)
Demographic Variables Yes Yes Home Characteristics Variables Yes Yes Response Month Dummies Yes Yes R-Squared 0.00 0.11 0.00 0.11 Number of Homes 572 501 572 501 Change in Log Residents Per Worker Hour (5) (6) (7) (8) Initial Proportion Paid Less Than Minimum Wage 0.103
(0.044) 0.068
(0.047) Initial Wage Gap
0.334
(0.275) 0.111
(0.273) Demographic Variables Yes Yes Home Characteristics Variables Yes Yes Response Month Dummies Yes Yes R-Squared 0.01 0.21 0.00 0.20 Number of Homes 586 514 586 514 Subjective Responses on Change in Worker Effort (9) (10) (11) (12) Initial Proportion Paid Less Than Minimum Wage 0.063
(0.183) 0.100
(0.201) Initial Wage Gap
0.530
(1.085) 0.922
(1.166) Demographic Variables Yes Yes Home Characteristics Variables Yes Yes Response Month Dummies Yes Yes Log-Likelihood -245.24 -210.91 -245.18 -210.72 Number of Homes 561 486 561 486
Notes: As for Table 6. Effort variable coded as an ordered response based on answers to the question “Has the minimum wage had an impact on work effort in your business? No/Yes – Decrease/Yes-Increase”. It is ordered from 0 (decrease), 1 (no change), to 2 (increase). Ordered probit coefficients (and associated standard errors) reported for this variable.
36
Figure 1 Numbers of Private Sector Care Assistants, 1994-2001
# P
rivat
e S
ecto
r Car
e A
ssis
tant
s
Time1994 1995 1996 1997 1998 1999 2000 2001
200000
250000
300000
350000
Notes: Source: Labour Force Survey. Each point corresponds to the mid-month of each LFS quarter. Vertical line corresponds to minimum wage introduction in April 1999.
37
Figure 2a The Relationship Between Wage Growth and Initial Wages: 1998/99
Cha
nge
log
aver
age
hour
ly w
age
Initial log average hourly w age0 .5 1 1.5 2
-1
-.5
0
.5
1
Figure 2b The Relationship Between Wage Growth and Initial Wages: 1992/93
Cha
nge
log
aver
age
hour
ly w
age
Initial log average hourly w age.5 1 1.5
-.5
0
.5

38
Figure 3a The Relationship Between the Change in Log Total Employment and Initial Proportion
Low-Paid
Figure 3b The Relationship Between the Change in Log Total Employment and Initial Wage Gap
39
Figure 4a The Relationship between the Change in Log Total Hours and Initial Proportion Low-
Paid
Figure 4b The Relationship between the Change in Log Total Hours and Initial Wage Gap
40
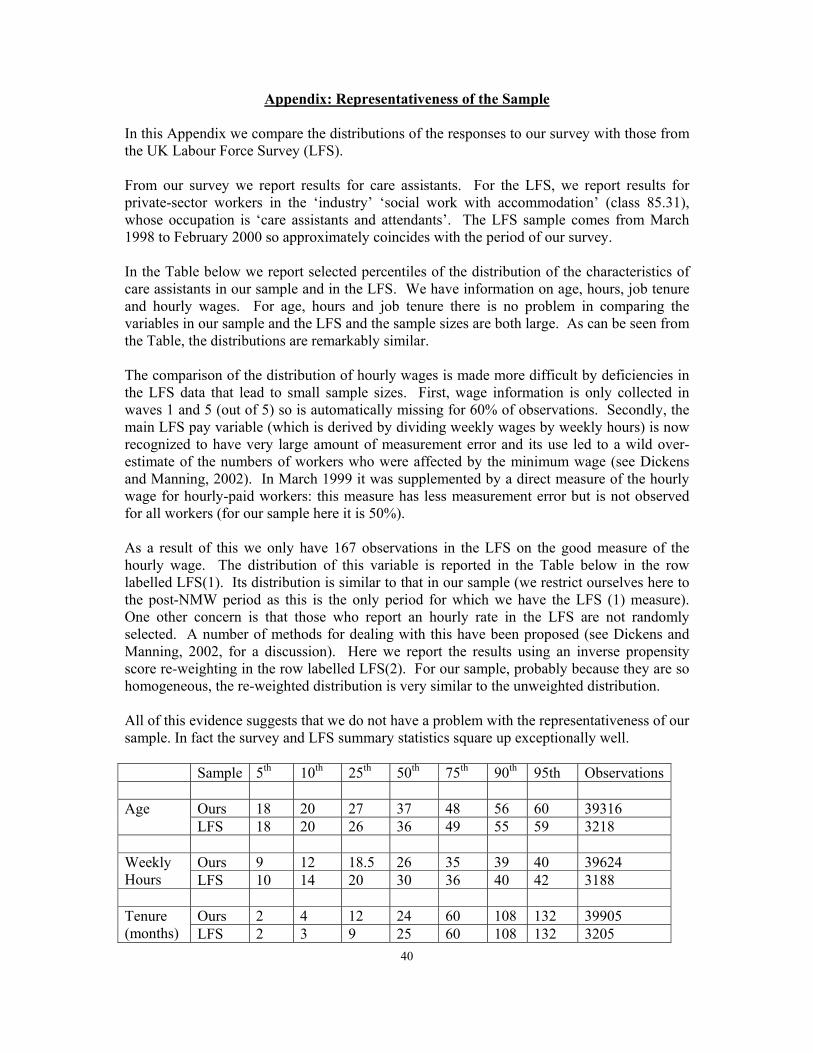
Appendix: Representativeness of the Sample
In this Appendix we compare the distributions of the responses to our survey with those from the UK Labour Force Survey (LFS). From our survey we report results for care assistants. For the LFS, we report results for private-sector workers in the ‘industry’ ‘social work with accommodation’ (class 85.31), whose occupation is ‘care assistants and attendants’. The LFS sample comes from March 1998 to February 2000 so approximately coincides with the period of our survey. In the Table below we report selected percentiles of the distribution of the characteristics of care assistants in our sample and in the LFS. We have information on age, hours, job tenure and hourly wages. For age, hours and job tenure there is no problem in comparing the variables in our sample and the LFS and the sample sizes are both large. As can be seen from the Table, the distributions are remarkably similar. The comparison of the distribution of hourly wages is made more difficult by deficiencies in the LFS data that lead to small sample sizes. First, wage information is only collected in waves 1 and 5 (out of 5) so is automatically missing for 60% of observations. Secondly, the main LFS pay variable (which is derived by dividing weekly wages by weekly hours) is now recognized to have very large amount of measurement error and its use led to a wild over-estimate of the numbers of workers who were affected by the minimum wage (see Dickens and Manning, 2002). In March 1999 it was supplemented by a direct measure of the hourly wage for hourly-paid workers: this measure has less measurement error but is not observed for all workers (for our sample here it is 50%). As a result of this we only have 167 observations in the LFS on the good measure of the hourly wage. The distribution of this variable is reported in the Table below in the row labelled LFS(1). Its distribution is similar to that in our sample (we restrict ourselves here to the post-NMW period as this is the only period for which we have the LFS (1) measure). One other concern is that those who report an hourly rate in the LFS are not randomly selected. A number of methods for dealing with this have been proposed (see Dickens and Manning, 2002, for a discussion). Here we report the results using an inverse propensity score re-weighting in the row labelled LFS(2). For our sample, probably because they are so homogeneous, the re-weighted distribution is very similar to the unweighted distribution. All of this evidence suggests that we do not have a problem with the representativeness of our sample. In fact the survey and LFS summary statistics square up exceptionally well. Sample 5th 10th 25th 50th 75th 90th 95th Observations
Ours 18 20 27 37 48 56 60 39316 Age LFS 18 20 26 36 49 55 59 3218
Ours 9 12 18.5 26 35 39 40 39624 Weekly
Hours LFS 10 14 20 30 36 40 42 3188
Ours 2 4 12 24 60 108 132 39905 Tenure (months) LFS 2 3 9 25 60 108 132 3205

41
Ours 3.6 3.6 3.6 3.80 4.25 5.04 5.57 21313 LFS(1) 3.3 3.6 3.6 3.77 4.20 4.75 5.00 167
Hourly Wage
LFS(2) 3.3 3.6 3.6 3.77 4.15 4.70 5.00 166


