
Why Quality Depends on Big Data
Korea Test Conference
Michael Schuldenfrei, CTO
© Optimal+ 2015, All Rights Reserved

Who are Optimal+?
2© Optimal+ 2015, All Rights Reserved

© Optimal+ 2015, All Rights Reserved 3
Company Overview
Optimal+ provides Manufacturing Intelligence™ software that delivers real-time, big data analytics for distributed semiconductor manufacturing operations
Our solutions transform manufacturing test data into actionable intelligence that improves yield, quality and productivity with full supply chain visibility

© Optimal+ 2015, All Rights Reserved 4
Top Companies Run Optimal+
Ten years managing Big Data for the world’s leading semiconductor manufacturers
© Optimal+ 2015, All Rights Reserved 5
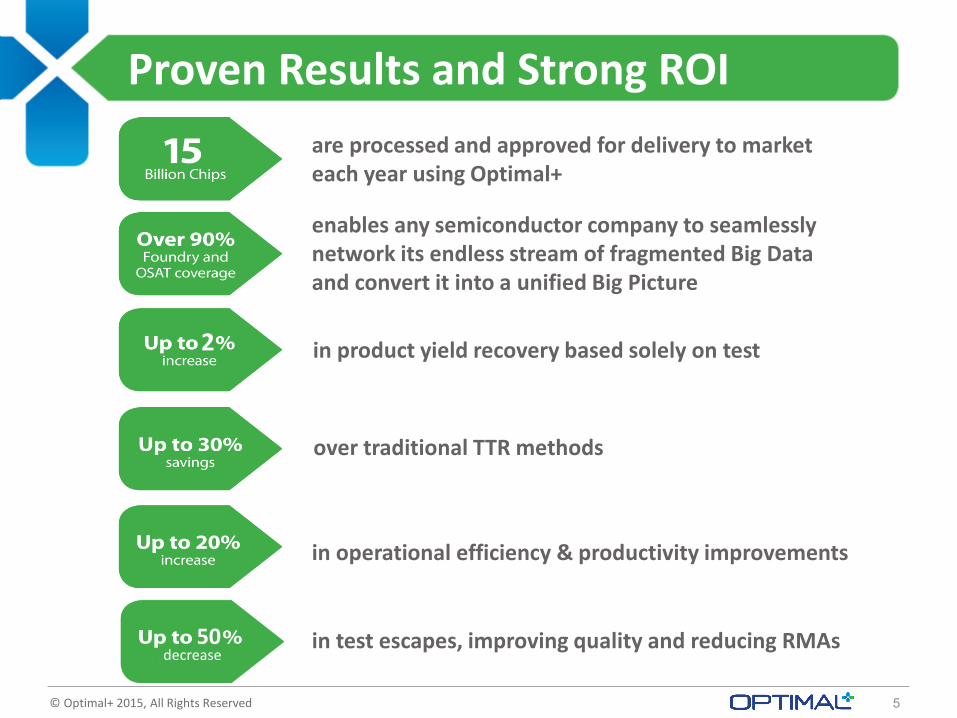
Proven Results and Strong ROI
are processed and approved for delivery to market each year using Optimal+
in operational efficiency & productivity improvements
2
enables any semiconductor company to seamlessly network its endless stream of fragmented Big Data and convert it into a unified Big Picture
50decrease
in test escapes, improving quality and reducing RMAs
in product yield recovery based solely on test
over traditional TTR methods

Big DataIT Industry Perspective
6© Optimal+ 2015, All Rights Reserved

7
The “Big Data” Revolution – Three V’s
• The amount of data being handled is orders of magnitude larger than the amount of data traditional databases can handle.
Volume
• Data arrives fast and needs to be processed quickly. It is most useful when decision making can be performed on the data in real-time.
Velocity
• A wide variety of sources contain information that is useful to organizations. This goes beyond traditional “structured” data in databases and includes media files, log files, sensor data and much more.
Variety
• What can you do with the data and does the value you get justify the cost to store and manage the data?
Value
© Optimal+ 2015, All Rights Reserved

Big Data Sources…
Big Data
Mobile
Web
Social
Audio
VideoLogs
Sensor
CRM
ERP
© Optimal+ 2015, All Rights Reserved

9
…And What Is It Used For?
Marketing
Advertising
Fraud Detection
Intelligence
Tax Evasion
Research
…and Engineering?
9/3/2015© Optimal+ 2015, All Rights Reserved

10
Big Data Solutions – Many Players
NoSQLMap /
ReduceHadoop Vertica Mongo DB Cloudera
Column Oriented
Horton-works
HBase Cassandra Redis Exasol
ParAccel ImpalaIBM
InfospherePig
Shared Nothing
Voldemort
Memory Grid
Sybase IQ TeradataCommodity
Servers
HorizontalScalability
HDFS
SAP Hana B.A.S.E.Shared
EverythingSplunk Key-Value
Graph Stores
© Optimal+ 2015, All Rights Reserved

Big Datafor Semiconductor Test
11© Optimal+ 2015, All Rights Reserved

Current databases are large• Up to 100TB/Year at large customers
• x4 growth in the last 2 years
Seeing rapid increase in database size due to:• Longer retention periods (e.g. for RMA)
• More operations (E-test, SLT)
• Data log growth
Expecting more complex queries• Data mining
• Cross operation analysis
12
Why does it Matter to Us?
© Optimal+ 2015, All Rights Reserved

>10,000 tester data logs per day
>3,000 additional files from other sources
~2,000 parts tested in each data log
~3,000 parametric measurements per part
~100 GB per day raw data
~50 GB compressed data loaded/purged a day
13
Some Numbers (One Large Fabless/IDM)
© Optimal+ 2015, All Rights Reserved
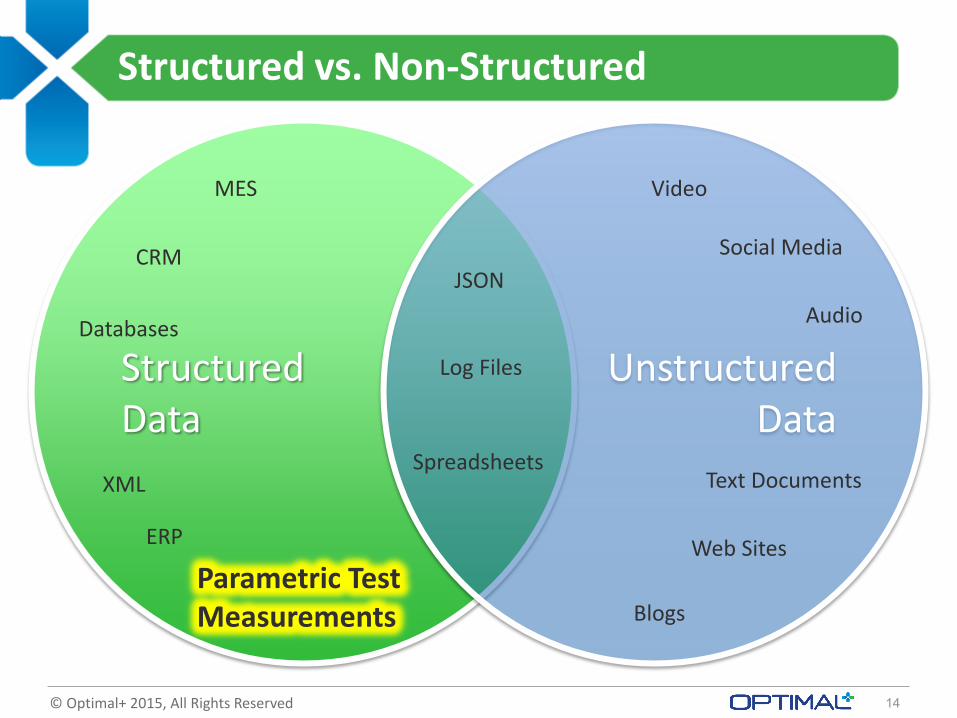
StructuredData
MES
CRM
Databases
XML
ERP
14
Structured vs. Non-Structured
UnstructuredData
Video
Social Media
Audio
Text Documents
Web Sites
Blogs
JSON
Log Files
Spreadsheets
Parametric TestMeasurements
© Optimal+ 2015, All Rights Reserved

FT1Burn in
FT2
WATWS1
WATWS1WS2
WATWS1
WATWS1
WATWS1
15
How Big is “Big”?
Example: One package contains:5 dicex ~1.2 WS operations per diex ~1.2 iterations per operationx 3000 parametric measurements+ 1000 per-site WAT measurements+ 3000 FT measurements
A DNA consisting ~25K measurements!
An SLT lot with 5000 parts could have 100M historical measurements from hundreds of
wafers & FT lots
ECID
ECID
ECID
ECID
ECID
© Optimal+ 2015, All Rights Reserved

16
What Could You Do With It? Examples…
• Identify predictors for FT, SLT or RMA fallout
• Perform bivariate correlations on all possible combinations of tests to identify bivariate outliers
• Define a rule to use the results to prevent fallout
RMA Analysis
• Monitor every test parameter to detect unstable results or drifts (e.g. using Cpk) which are typically masked when looking solely at binning results
Parametric Stability Monitor
• Include additional dimensions in analysis such as test conditions or custom attributes both in characterization and production phases of a product’s life cycle
Characterization and Test Conditions
• Filter large volumes of parametric measurements to focus on the parameters which matter. For example, filter out low entropy, bi-modal or low Cpk tests before performing complex analysis
Smart Filtering
• Search across multiple dimensions to detect outlier equipment, tests, bins, etc.
ANOVA
© Optimal+ 2015, All Rights Reserved

The Challenges
17© Optimal+ 2015, All Rights Reserved
The “3 C’s” for data collection
Complete
Clean
Consistent
18
“Garbage In – Garbage Out”
© Optimal+ 2015, All Rights Reserved

To be Actionable, data must:
Be available quickly
Be processed immediately and automatically
Be connected to business processes
19
Making it Actionable
© Optimal+ 2015, All Rights Reserved

Many analyses require billions of data points• Example: Find correlations between 1000 wafer
sort parameters and 1000 final test parameters over 1000 lots
Engineers complain that their biggest problem is GETTING the data they need for analysis
Relationships in data are complex• Example: Using chip IDs to relate data across
multiple operations
• Example: Correct interpretation of retests
20
Processing Raw Data
© Optimal+ 2015, All Rights Reserved

Example: Correlation
21© Optimal+ 2015, All Rights Reserved

22
Correlation Analysis – The Old Way
© Optimal+ 2015, All Rights Reserved

23
Correlation Analysis – Big Data
© Optimal+ 2015, All Rights Reserved

Big Data &
Quality
24© Optimal+ 2015, All Rights Reserved

25
The Need
Shifting from “Defects per Million” to “Defects per Billion”
© Optimal+ 2015, All Rights Reserved

26
The Problem – RMA & Failure Analysis
No Problem Found32%
Fab Process28%
Test Program10%
Test Operation4%
Test Equipment26%
No Problem Found Fab Process Test Program Test Operation Test Equipment
© Optimal+ 2015, All Rights Reserved

27
The Challenge
BIG
DATA
EX
PER
TISE
CO
STTIM
E
© Optimal+ 2015, All Rights Reserved

28
Back to Basics
© Optimal+ 2015, All Rights Reserved

29
Escape Prevention – ATE Freeze
A freeze occurs when a tester instrument becomes “stuck” and repeatedly returns the same or similar result for a sequence of parts
© Optimal+ 2015, All Rights Reserved

30
Escape Prevention – ATE / TP
30
The STDF “PRR.NUM_TESTS” field tells us the number of tests executed on the part. It should be relatively stable throughout the lot
© Optimal+ 2015, All Rights Reserved
31
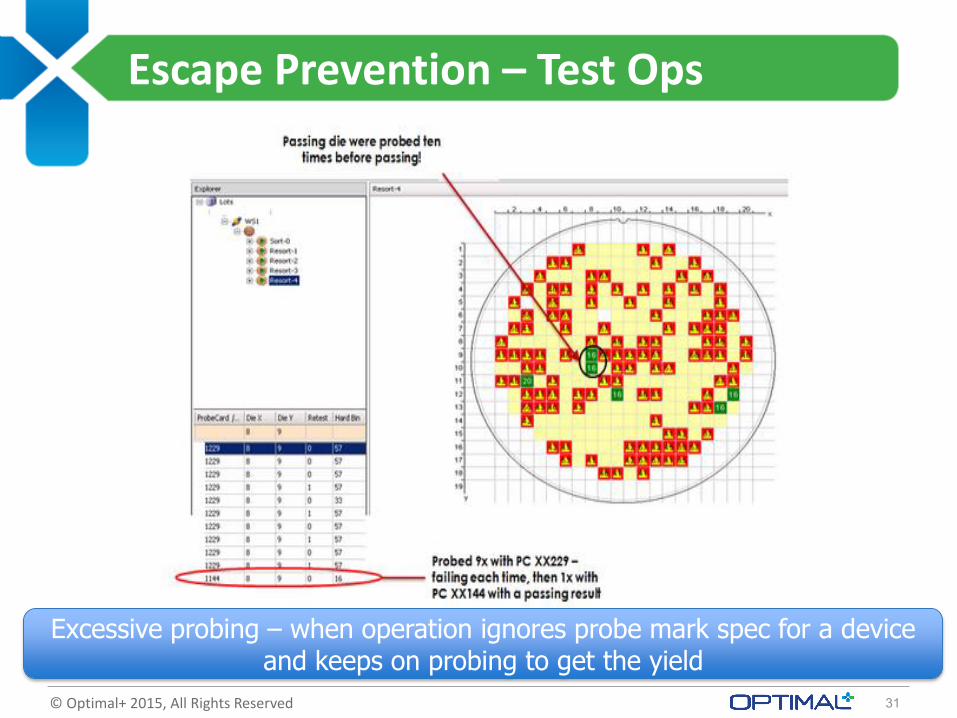
Escape Prevention – Test Ops
Excessive probing – when operation ignores probe mark spec for a device and keeps on probing to get the yield
© Optimal+ 2015, All Rights Reserved
32
Escape Prevention – Test Program
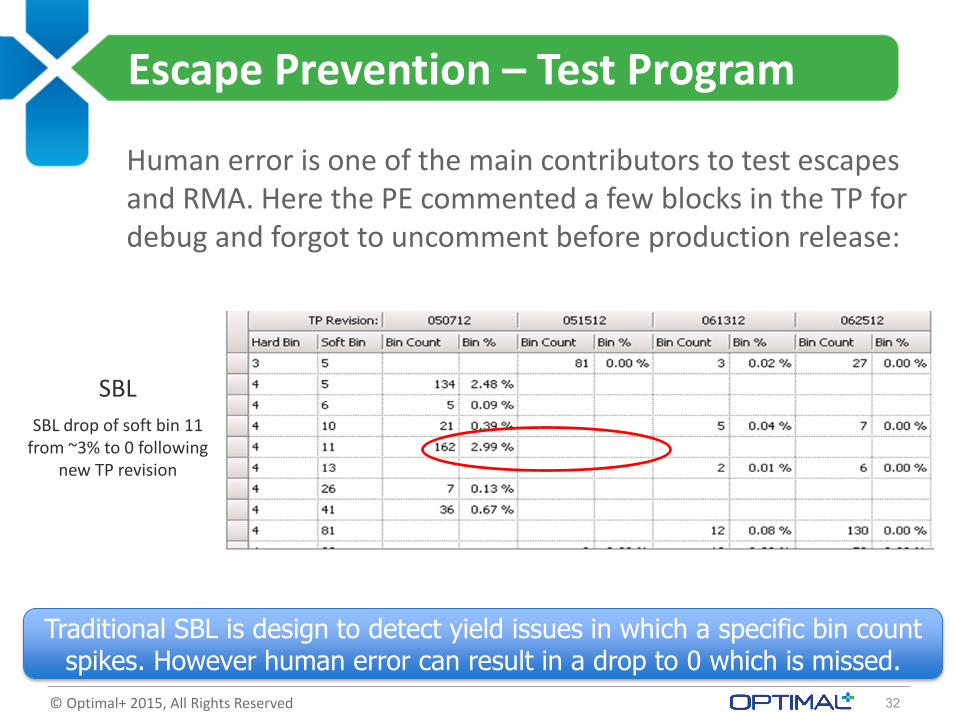
Human error is one of the main contributors to test escapes and RMA. Here the PE commented a few blocks in the TP for debug and forgot to uncomment before production release:
Traditional SBL is design to detect yield issues in which a specific bin count spikes. However human error can result in a drop to 0 which is missed.
SBL
SBL drop of soft bin 11 from ~3% to 0 following
new TP revision
© Optimal+ 2015, All Rights Reserved

33
Escape Prevention – Test Program
Extremely loose test limits may mask real test performance problems
~95 Sigmas
~95 Sigmas
© Optimal+ 2015, All Rights Reserved

One or more numeric values representing the perceived quality of a part based on:
Wafer geography (e.g. edge vs. center)
Outlier detection rule inputs (e.g. GDBN, Z-PAT, D-PAT, etc.)
Number of iterations to PASS
Overall lot/wafer yield
Equipment health during test
Parametric test results from multiple operations
Etc…
34
Quality Index
Quality Index
Lot/Wafer Yield etc.
Quality Rule
Inputs
Wafer Geography
© Optimal+ 2015, All Rights Reserved

Implementations:Within the same test area (e.g. WS, FT, etc.)Between test areas (e.g. from WAT to WS to FT)Within a single subconBetween multiple subcons (hub and spoke)Real-time (test program integration)Offline bin-switching
Example scenarios:Outlier Detection – drift analysisPairing – cherry-picking for power & speed combinationsTest program tuningSLT / Burn-in reduction
35
Data Feed Forward
© Optimal+ 2015, All Rights Reserved

36
Data Feed Forward – Drift
Database at subconTester
1. ECID Data
2. FT1 Measurements
Test Program running
FT2 operationReal-time data!
No test time impact!
© Optimal+ 2015, All Rights Reserved

37
“No Problem Found”
Combinations of chips causing issues:
IC3
IC2
PCB
IC1
© Optimal+ 2015, All Rights Reserved

38
Smart Pairing
• New methodology to pair IC’s for optimal compatibility
• Customer and suppliers agree on recipe for “Best Match” between IC’s (e.g. based on power consumption and speed)
• “Quality Index” created based on manufacturing and test data to categorize chips
• Data fed-forward to assembly to ensure IC’s pre-sorted into “buckets” based on Quality Index
• MCPs and boards are assembled with well-matched components
Grade A
Grade B
Grade C
Grade A
Grade B
Grade C
© Optimal+ 2015, All Rights Reserved

Big Data has arrived to semiconductor test
Are YOU ready for the challenge?
39
Conclusion
© Optimal+ 2015, All Rights Reserved

Thank You!
40© Optimal+ 2015, All Rights Reserved


