Why should we care about care?
Supply and Demand Assessment of Care Services in
Georgia: A Mixed Methods Study1
South Caucasus Gender Program (P160432)
January 2019
Poverty and Equity Global Practice
Europe and Central Asia Region
1 Team: Paola Buitrago-Hernandez (Consultant, Poverty Global Practice) and Ana Maria Munoz Boudet (Senior
Social Scientist, Poverty Global Practice, TTL). The team received valuable comments from Lourdes Rodriguez
(Economist, Poverty Global Practice) and Miriam Muller (Social Scientist, Poverty Global Practice).
Pub
lic D
iscl
osur
e A
utho
rized
Pub
lic D
iscl
osur
e A
utho
rized
Pub
lic D
iscl
osur
e A
utho
rized
Pub
lic D
iscl
osur
e A
utho
rized

Table of Contents
Summary ............................................................................................................................................................... 3
Motivation: Why Should We Care about Care? ...................................................................................................... 5
Data and Methodology: An Independent, Mixed Methods Survey ........................................................................ 8
Use of Formal and Informal Care ......................................................................................................................... 11
Policy and Legal Framework of Care Services in Georgia ...................................................................................... 16
Childcare Supply .................................................................................................................................................. 18
Availability is limited, childcare facilities operate at overcapacity, and wait lists are prevalent ............................ 18
Main challenges for quality childcare provision are high child-staff ratios and staff’s training ............................. 23
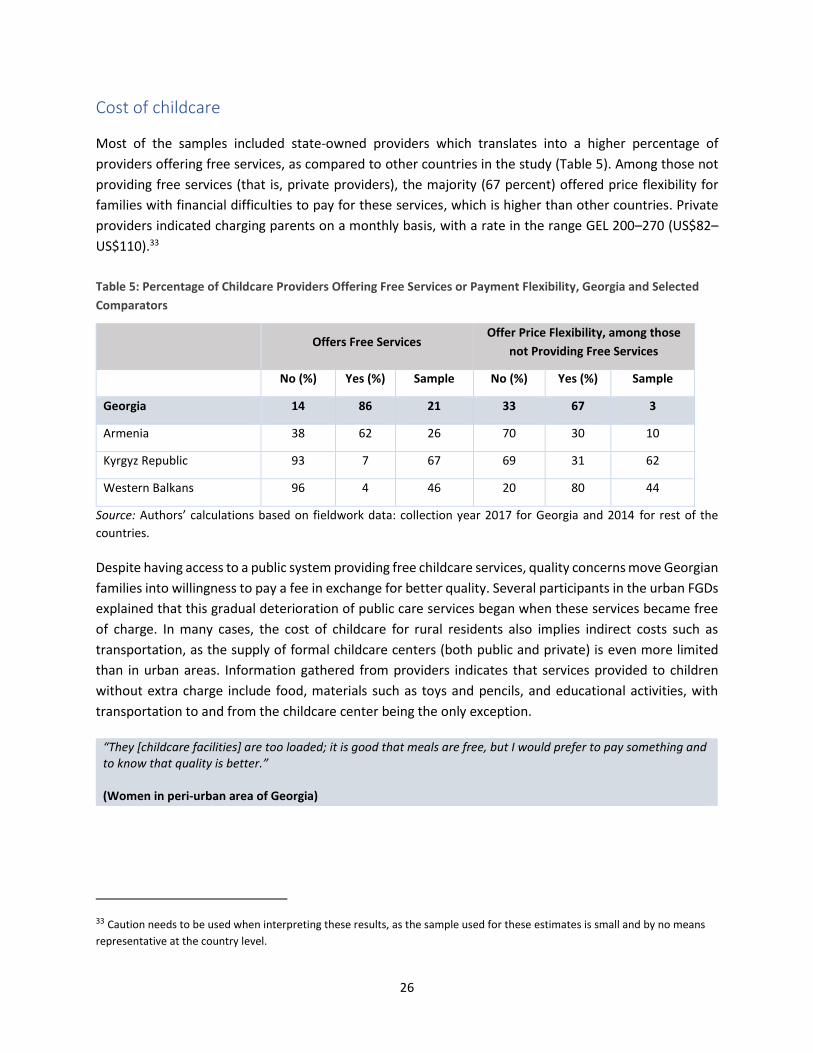
Cost of childcare ...................................................................................................................................................... 26
Demand for Childcare .......................................................................................................................................... 27
Main determinants of demand are awareness about benefits to children’s development and need of support for
working mothers ..................................................................................................................................................... 27
Social norms play a significant role in shaping negative perceptions about childcare use ..................................... 27
Eldercare Supply .................................................................................................................................................. 29
Availability of residential care is limited, most private options are expensive, and there is lack of flexible
arrangements ......................................................................................................................................................... 29
Human resources are the main challenge for quality provision of eldercare ......................................................... 32
Cost of eldercare ..................................................................................................................................................... 33
Demand for Eldercare .......................................................................................................................................... 33
Filial obligations and social norms are strong deterrents for use of formal eldercare, particularly residential care
................................................................................................................................................................................ 33
Daycare centers and home-based formal eldercare formats are more compatible with social norms .................. 36
Conclusions and Policy Recommendations .......................................................................................................... 37
References ........................................................................................................................................................... 40
Annex 1: List of Variables Used in the Construction of the Childcare Quality Subindexes .................................... 43
Annex 2: List of Variables Used in the Construction of the Eldercare Quality Subindexes .................................... 45

3
Summary
Only 58 percent of Georgian women ages 15 and above participate in the labor market, a slightly higher
share than the Europe (51 percent) and Organisation for Economic Co-operation and Development (OECD)
(51.3 percent) average but 20 percentage points lower than the share among men in the country. 2
Moreover, the gender gap in labor force participation has been constant and around 18 to 20 percentage
points over the last decade. Married women living in households with children under age six are at a
higher disadvantage in the labor market; only 50 percent of them participate in the labor force compared
to 84 percent of men with similar characteristics.3
The conflicting demand on women’s time for care and work activities represents a fundamental barrier to
economic participation and generates a vicious circle of low labor market attachment and prominence of
the care provider role that leads to increased vulnerability and gender-based inequalities. About 60
percent of working-age women not looking for a job in Georgia cite family responsibilities as the main
reason (the share is 67 percent among married ones). In the case of men, this percentage is 21 percent.4
Georgia cannot afford to underutilize a large share of women whose lifetime productivity in the labor
market is currently reduced by informal and at-home care provision. In fact, for Georgia, it has been
estimated that differences in labor market activity rates between men and women amount to potential
economic losses in gross domestic product per capita of approximately 11 percent (Cuberes and Teignier
2016a, 2016b).
International evidence shows that support for childcare and eldercare affects women’s labor market
participation.5 This note examines the care needs of families with children and/or elderly household
members and the provision of formal care services in Georgia with an emphasis on the availability, quality,
and price characteristics. Based on the analysis of an independent mixed methods data set collected in
the country, which is part of a broader study conducted in several other countries of Europe and Central
Asia, this note documents the perceptions and barriers in the use of quality formal care in the country.
Five main messages emerge from the assessment of supply and demand of formal childcare and eldercare
in Georgia:
2 WDI (2017). 3 HIS (2016). 4 LiTS III (2016). According to LiTS III, the shares of economically inactive women 18-64 who claim family responsibilities as the
main reason for not working is also high in the South Caucasus peers: 44 percent in Armenia (16 percent men) and 54 percent
in Azerbaijan (2 percent men). Note that the LiTS indicator correspond to primary respondents only, and figures differ from
those produced using LFS data. 5 There is rich evidence that increased availability of formal childcare options results in improved labor force participation of
women in many different contexts—in Brazil (Deutsch 1998; Paes de Barros et al. 2011); in rural Colombia (Attanasio and Vera-
Hernandez 2004); in urban Argentina (Berlinski and Galiani 2007); in Japan (Asai, Kambayashi, and Yamaguchi 2015); in Canada
(Lefebvre and Merrigan 2008). Closer to the region, in the European Union (Del Boca and Locatelli 2006); in Romania (Fong and
Lokshin 2000); in the Russian Federation (Lokshin 2000); and in Turkey (World Bank 2015). Greater availability of formal
eldercare options can be expected to affect female labor force participation, although evidence on this topic is so far limited.
See Geyer and Korfhage (2014); Heger (2014); Loken, Lundberg, and Riise (2014); and Viitanen (2007).
4
1. Although social norms strongly highlight the role of women as caregivers, there is scope for policy
aimed at increasing the capacity, quality, and availability of childcare and early education as
complementary of home-based care and for women who need childcare support.
2. Increased demand for formal childcare, caused in part by the abolition of fees in public early and
preschool institutions, has resulted in excessive number of children in a limited physical space,
with challenges to the infrastructure capacity of public kindergartens. The demand has also made
waiting lists prevalent in childcare centers.
3. Demand of formal childcare services is voiced predominantly by parents perceiving benefits for
child’s development and need of support for working (or willing to work) mothers.
4. Filial obligations and social norms are a strong deterrent for use of residential eldercare while use
of daycare centers and home-based formats—if available and affordable—would be more
compatible with prevailing standards of care for the elderly.
5. Quality is important for potential users of formal care services and the main challenges of the
existing supply involve child-staff ratios and staff’s qualifications for childcare and the human
resource component in general for eldercare.
A rising demand for care services in Georgia provides an opportunity to further develop the formal care
sector and increase labor force participation and productivity. The care sector does not only provide with
solutions to households but also generates employment opportunities and expands markets for the
economy. Furthermore, under the current demographic context, the improvement of availability,
affordability, and quality of formal care options is a crucial element for economic growth. Enhanced formal
care options can allow current and would-be informal family caregivers (who are mostly women) to
reallocate their time to formal labor market activities, thereby contributing directly to economic output
and providing tax revenues that can ease the fiscal burden commonly associated with aging population.
In addition, an expanded care system is also instrumental, as documented for other countries, in
facilitating parent’s choice to have children and keeping fertility rates at replacement level. 6
Policy options to appropriately address the challenges identified in this note include the expansion of
publicly and privately provided childcare centers in both urban and rural areas, establishment of
education and accreditation programs to prepare caregivers and care entrepreneurs, development of a
plan to increase quality of services with attention to costs, and design of eldercare system considering the
impacts on care recipients, the active aging promotion objective of age-related policies, as well as the
impacts on informal and family care providers and their ability to contribute to sustained economic
growth.
6 Luci-Greulich and Thevenon (2013) examine the response of fertility trends to family policies in OECD countries. The authors
find that, among other policy instruments, the provision of childcare (spending and coverage) under age three have a larger
potential influence on fertility.
5
Motivation: Why Should We Care about Care?
Within families, the demand for time devoted to informal and at-home care falls disproportionately on
women of all ages, and Georgia is not the exception. According to data from the latest Life in Transition
Survey (2016), about 316,500 Georgian women aged 18-64 years cite family responsibilities (that is,
looking after the family or house) as the reason for not working; this represents 60 percent of the total
female population ages 18-64 not participating in the labor market. 7 In the case of eldercare,
responsibilities are commonly perceived as filial obligations—more than 50 percent feel care for the old
in their homes is mainly a family responsibility, while less than 5 percent think it is more a societal duty—
and might rest equally on daughters and sons. Almost 90 percent agree that adult children should have
their parents live with them when they can no longer look after themselves.8 Yet, those more likely to act
upon it are daughters and daughters-in-law: the latest round of the Generations and Gender Survey (GGS)
for Georgia showed that 32 percent of people older than 65 years and in need of personal care received
regular help from their daughters compared to 11 percent who did so from their sons.9
Research carried out by the World Bank (2014) showed that childcare responsibilities are associated with
greatly reduced female labor force participation in Georgia but not male labor force participation: a rise
in the share of under-14-year-olds in the household lowers the probability of female labor force
participation by 30 percent and raises male participation by 12 percent. 10 Moreover, this negative
association is large enough to swamp the positive impact of more education on women’s labor activity.11
There is a substantial body of evidence, from a variety of contexts, that intensive, time-demanding care,
such as that requiring more than 20 hours per week, has significant negative effect on the likelihood of
staying in the labor force (Bolin, Lindgren, and Lundborg 2008; Carmichael and Charles 1998; Gabriele,
Tanda, and Tediosi 2011; Heitmueller and Inglis 2007; Henz 2006; Jacobs et al. 2014; Johnson and Lo Sasso
2000; Lilly, Laporte, and Coyte 2010; OECD 2011; Sarasa 2006) (see Box 1).
Georgia cannot afford to underutilize a large share of women whose lifetime productivity in the labor
market is currently reduced by informal care provision. Moreover, about 58 percent of working-age
women participate in the labor market compared to 78 percent of men,12 and the gender gap in labor
7 In contrast, in the case of men this figure is only 21 percent. According to LiTS III, the shares of economically inactive women 18-64 who claim family responsibilities as the main reason for not working is also high in the South Caucasus peers: 44 percent in Armenia (16 percent men) and 54 percent in Azerbaijan (2 percent men). Note that the LiTS indicator correspond to the primary respondents only, and figures can therefore differ from those produced using LFS data; LFS collects information for all household members aged 15+. In Armenia, for example, LFS data indicates 40 percent of women and 0.5 percent of men of working age population not in the labor force indicates family responsibilities as the main reason. Starting in 2017, the government introduced a LFS to produce more detailed data on labor market. 8 Herlofson et al. (2011) using data from the Generations and Gender Survey (GGS), wave 2009 for Georgia. The GGS is a panel survey of nationally representative samples of 18-79-year-old resident population in each participating country. 9 Correspond to people older than 65 years with care needs who do not receive any help from a professional caregiver. 10 Georgia Poverty Assessment 2014. World Bank. 11 Georgia Country Gender Assessment 2016. Poverty and Equity Global Practice, World Bank. 12 National Statistics Office of Georgia, using data from the Integrated Household Survey 2016.
6
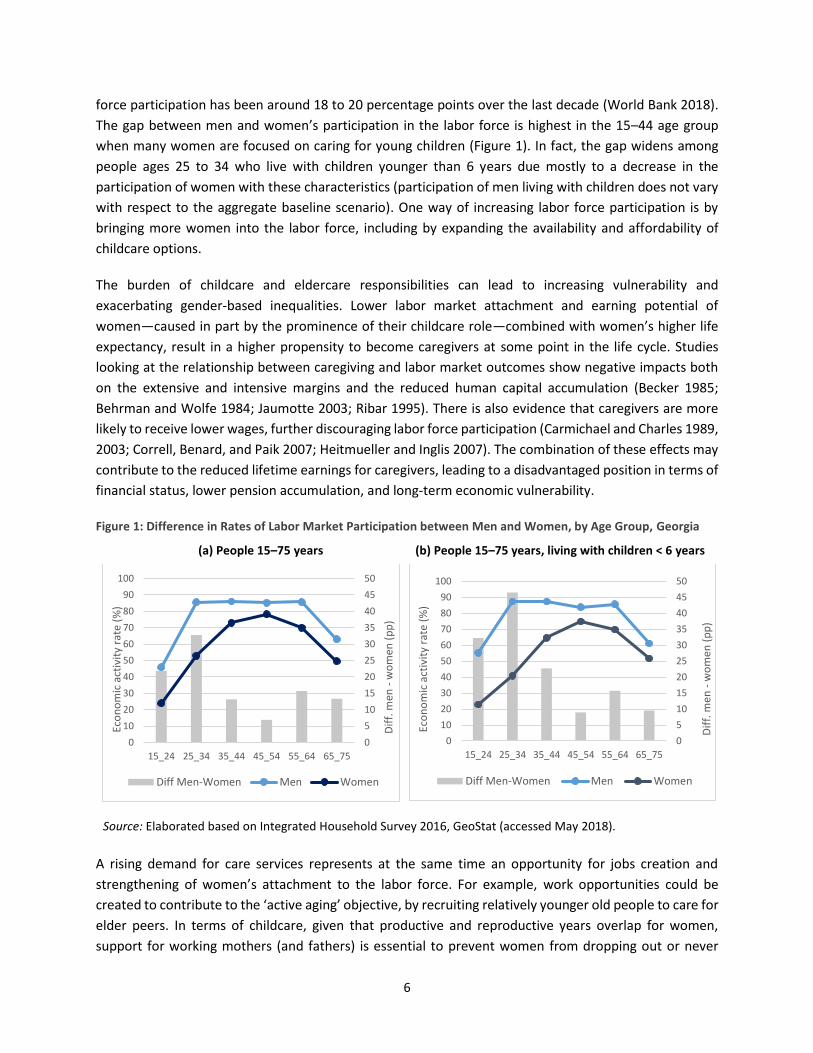
force participation has been around 18 to 20 percentage points over the last decade (World Bank 2018).
The gap between men and women’s participation in the labor force is highest in the 15–44 age group
when many women are focused on caring for young children (Figure 1). In fact, the gap widens among
people ages 25 to 34 who live with children younger than 6 years due mostly to a decrease in the
participation of women with these characteristics (participation of men living with children does not vary
with respect to the aggregate baseline scenario). One way of increasing labor force participation is by
bringing more women into the labor force, including by expanding the availability and affordability of
childcare options.
The burden of childcare and eldercare responsibilities can lead to increasing vulnerability and
exacerbating gender-based inequalities. Lower labor market attachment and earning potential of
women—caused in part by the prominence of their childcare role—combined with women’s higher life
expectancy, result in a higher propensity to become caregivers at some point in the life cycle. Studies
looking at the relationship between caregiving and labor market outcomes show negative impacts both
on the extensive and intensive margins and the reduced human capital accumulation (Becker 1985;
Behrman and Wolfe 1984; Jaumotte 2003; Ribar 1995). There is also evidence that caregivers are more
likely to receive lower wages, further discouraging labor force participation (Carmichael and Charles 1989,
2003; Correll, Benard, and Paik 2007; Heitmueller and Inglis 2007). The combination of these effects may
contribute to the reduced lifetime earnings for caregivers, leading to a disadvantaged position in terms of
financial status, lower pension accumulation, and long-term economic vulnerability.
Figure 1: Difference in Rates of Labor Market Participation between Men and Women, by Age Group, Georgia
(a) People 15–75 years (b) People 15–75 years, living with children < 6 years
Source: Elaborated based on Integrated Household Survey 2016, GeoStat (accessed May 2018).
A rising demand for care services represents at the same time an opportunity for jobs creation and
strengthening of women’s attachment to the labor force. For example, work opportunities could be
created to contribute to the ‘active aging’ objective, by recruiting relatively younger old people to care for
elder peers. In terms of childcare, given that productive and reproductive years overlap for women,
support for working mothers (and fathers) is essential to prevent women from dropping out or never
0
5
10
15
20
25
30
35
40
45
50
0
10
20
30
40
50
60
70
80
90
100
15_24 25_34 35_44 45_54 55_64 65_75
Dif
f. m
en -
wo
men
(p
p)
Eco
no
mic
act
ivit
y ra
te (
%)
Diff Men-Women Men Women
0
5
10
15
20
25
30
35
40
45
50
0
10
20
30
40
50
60
70
80
90
100
15_24 25_34 35_44 45_54 55_64 65_75
Dif
f. m
en -
wo
men
(p
p)
Eco
no
mic
act
ivit
y ra
te (
%)
Diff Men-Women Men Women
7
joining the labor force due to childcare demands. A growing and developed care system can also promote
employment for women in the care industry. However, these objectives cannot be attained without
improved care services that not only free women to take part in paid work but also ensure adequate
human capital investment in the young generations and dignity and quality care for the elderly (see Box 1
for a summary of literature review on care and female labor participation).
This study examines the provision of childcare and eldercare in Georgia with an emphasis on the
availability, price, and quality of care and suggests some policy priorities that address the identified
challenges. The note is structured as follows: Section 2 introduces the independent mixed methods data
set that is the basis for this report. Section 3 describes the use of formal and informal care in Georgia.
Section 4 presents a brief explanation of the policy and legal framework for care services in Georgia.
Sections 5 and 6 describe the supply of childcare and eldercare, including perspectives both from families
with care needs and from care providers. Sections 7 and 8 discuss the demand side for childcare and
eldercare, respectively. Section 9 concludes the paper by presenting policy recommendations.
Box 1: Summary of Literature Review on Care and Female Labor Participation
The impact of rising care duties on the time women devote to paid work can take the form of lower labor force participation or lower work intensity. The effect of rising care duties on female labor supply can take on numerous forms. Women can decide not to enter the labor force to attend to care demands or they can enter and at a later stage withdraw from the labor force altogether, thereby being affected on the extensive margin, or they can reduce working hours (for example, by starting to work part time or by requesting flexible work arrangements) or switch to jobs that are less time intensive and oftentimes more precarious, implying an intensive margin effect. In Central European countries, caregiving has an impact on the number of hours women work but not on their labor force attachment (Bolin, Lindgren, and Lundborg 2008). Spiess and Schneider (2003) demonstrate that a negative effect on work hours for women who start or increase caregiving does not reverse when caregiving is reduced.
There is rich evidence that increased availability of formal childcare options results in improved labor force participation of women in many different contexts—in Brazil (Deutsch 1998; Paes de Barros et al. 2011); in rural Colombia (Attanasio and Vera-Hernandez 2004); in urban Argentina (Berlinski and Galiani 2007); in Japan (Asai, Kambayashi, and Yamaguchi 2015); and in Canada (Lefebvre and Merrigan 2008). Closer to the region, Del Boca and Locatelli (2006) used data from the European Community Household Panel to show that female labor force participation is affected by the availability, and even more importantly, affordability of childcare. Fong and Lokshin (2000) examined the relationship between female labor supply and the cost of paid childcare in Romania between 1989 and 1995 and found that both female labor force participation and the decision to use paid childcare were sensitive to the price of childcare. In the Russian Federation, Lokshin (2000) used policy simulations based on panel household survey data to show that providing subsidies for paid childcare increased maternal employment by almost twice as much as comparable wage subsidies. In Turkey, a World Bank study (2015) also finds that mothers with low education have limited willingness to pay and will prefer a more basic provision of childcare—but of good quality—than a costlier system providing an expanded range of services within the childcare centers. Besides this extensive margin effect, childcare subsidies increased the amount of time working mothers spent at work and were more effective in raising the overall family income than any other policy intervention examined in the study. It is important to note that access to childcare can affect male labor market outcomes as well as female labor supply. Calderon (2014) examined the impacts of a Mexican government-provided childcare program and found that it not only increased female labor employment rates and earnings but also enabled men to spend time searching for better paid jobs.
8
Greater availability of formal eldercare options can be expected to affect female labor force participation, although evidence on this topic is so far limited. Heger (2014) uses SHARE data to look at caregivers’ employment and finds caregiving decreases employment rates in countries with low supply of formal care (or ‘family care countries’) by 34 to 60 percentage points depending on the frequency of care but has no impact on caregivers’ employment probability in countries with more established care systems. Earlier, Viitanen (2007), using the European Community Household Panel to simulate the effect of greater public expenditure on formal residential care and home-help services for the elderly, found a positive effect on the employment rate of 45–59-year-old women by 9–13 percentage points across Europe. Loken, Lundberg, and Riise (2014) examine a 1998 expansion of local, home-based care for the elderly in Norway, which resulted in a significant reduction of extended absences from work for adult daughters of single elderly. Geyer and Korfhage (2014) examine long-term care support in Germany and conclude that cash benefits discourage care providers from engaging in paid work, while benefits given in kind (and as such better substituting for the specific time commitment of the informal caregiver) provide incentives to already caring household members to increase labor supply. These findings confirm analysis by Todd (2013) showing that there are still few acceptable market-based options for eldercare in developing countries compared with childcare.
Data and Methodology: An Independent, Mixed Methods Survey
The present study is part of a mixed methods supply and demand-side assessment of childcare and elderly
care services in Eastern Europe and Central Asia. This assessment seeks to investigate the changing care
burden—specifically, childcare and eldercare—and its interaction with female labor force participation
outcomes. It started in 2014 when the World Bank collected a new, independent mixed methods data set
in seven countries: one in the South Caucasus region – Armenia; four countries from the Western
Balkans—the former Yugoslav Republic of Macedonia (FYR Macedonia), Kosovo, Bosnia and Herzegovina,
and Serbia; and Ukraine and the Kyrgyz Republic.13 Later, in 2015–2016 a similar effort was replicated for
eldercare in Poland and for childcare in Turkey. During 2017, data collection took place in Georgia and it
followed a similar mixed method approach from the previous collection.
The aim of this initiative is to better understand the context of childcare and eldercare provision in the
region and the distribution of formal and informal care in Eastern Europe and Central Asia. It seeks to
collect new evidence and document practices, norms, and behaviors around care needs, focusing on the
role of women as caregivers and care providers. The information can serve to identify potential areas of
intervention to reduce the burden of care for families and to support care-friendly female employment.
In the case of Georgia, the preparation work was conducted during 2017, and the fieldwork took place
between July 2017 and January 2018 and was divided broadly into two components:
• Supply assessment of available care services. Carried out as a census-type study, it investigated
the types of childcare and eldercare services available to households, both public and private, and
13 See regional report: World Bank. 2015. Europe and Central Asia - Why should we care about care? The role of informal
childcare and eldercare in aging societies in the ECA region (English). Washington, DC: World Bank Group.
http://documents.worldbank.org/curated/en/687741468257352228/Europe-and-Central-Asia-Why-should-we-care-about-
care-the-role-of-informal-childcare-and-eldercare-in-aging-societies-in-the-ECA-region
9
explored their accessibility, affordability, and quality. This included site visits, mixed methods
interviews, and, when appropriate, quantitative observational checklists.
• Household and demand assessment. The assessment targeted households with children and/or
elders and also included an investigation of time use, care needs, perceptions, and preferences
about care responsibilities, as well as barriers in access to formal childcare or eldercare services.
Whenever possible, it followed the dynamics of care demand and supply at the household level,
with women and their labor force engagement at the center. This assessment included
quantitative individual-level questionnaires and qualitative focus group discussions (FGDs).
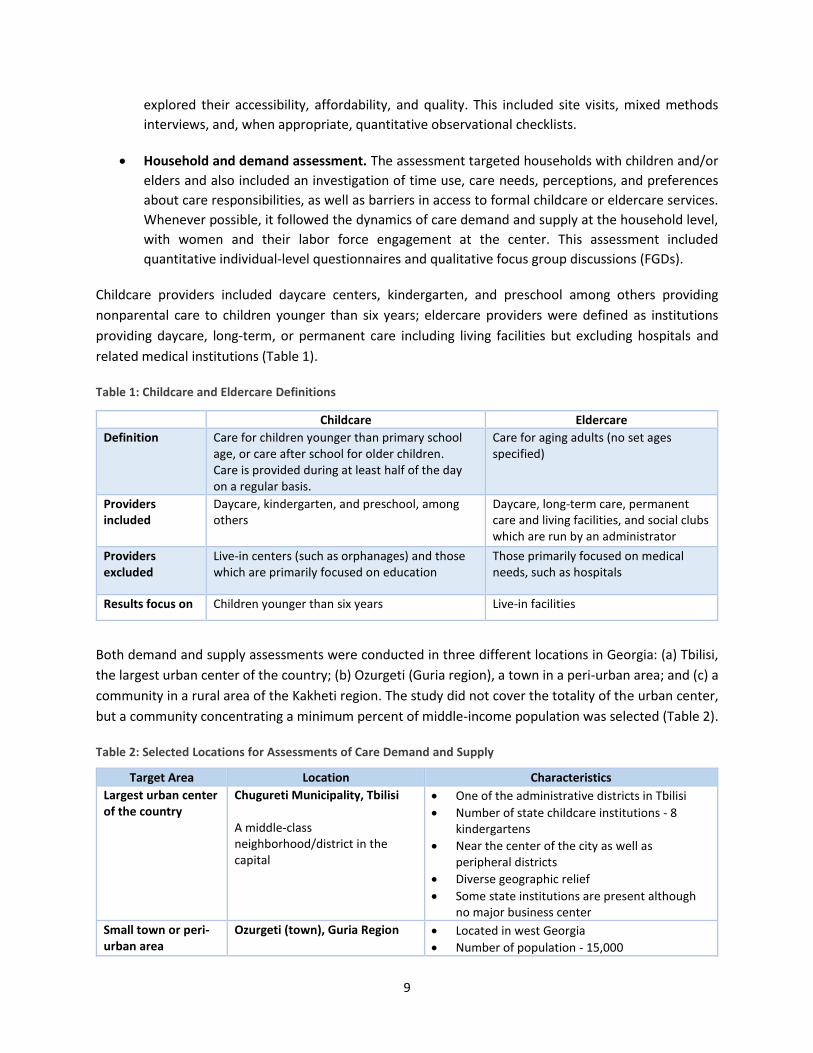
Childcare providers included daycare centers, kindergarten, and preschool among others providing
nonparental care to children younger than six years; eldercare providers were defined as institutions
providing daycare, long-term, or permanent care including living facilities but excluding hospitals and
related medical institutions (Table 1).
Table 1: Childcare and Eldercare Definitions
Childcare Eldercare
Definition Care for children younger than primary school age, or care after school for older children. Care is provided during at least half of the day on a regular basis.
Care for aging adults (no set ages specified)
Providers included
Daycare, kindergarten, and preschool, among others
Daycare, long-term care, permanent care and living facilities, and social clubs which are run by an administrator
Providers excluded
Live-in centers (such as orphanages) and those which are primarily focused on education
Those primarily focused on medical needs, such as hospitals
Results focus on Children younger than six years Live-in facilities
Both demand and supply assessments were conducted in three different locations in Georgia: (a) Tbilisi,
the largest urban center of the country; (b) Ozurgeti (Guria region), a town in a peri-urban area; and (c) a
community in a rural area of the Kakheti region. The study did not cover the totality of the urban center,
but a community concentrating a minimum percent of middle-income population was selected (Table 2).
Table 2: Selected Locations for Assessments of Care Demand and Supply
Target Area Location Characteristics
Largest urban center of the country
Chugureti Municipality, Tbilisi A middle-class neighborhood/district in the capital
• One of the administrative districts in Tbilisi
• Number of state childcare institutions - 8 kindergartens
• Near the center of the city as well as peripheral districts
• Diverse geographic relief
• Some state institutions are present although no major business center
Small town or peri-urban area
Ozurgeti (town), Guria Region
• Located in west Georgia
• Number of population - 15,000

10
Target Area Location Characteristics
A small town with average number of population
• Main educational and health care institutions are present in the town
• Presence of state-funded childcare institutions
Rural area Nukriani Sakrebulo community in Sighnaghi, Kakheti Region A rural community with minimum access to childcare institutions
• Located in the eastern side of the country
• Minimum access to childcare institutions
• Less developed infrastructure
For the demand assessment, individual interviews were conducted with 108 individuals selected based
on the following criteria: i) were between 25 and 65 years of age; ii) had care needs in their households,
including childcare (young and older children), eldercare, or both; iii) had different levels of care
responsibilities (for example, full-time or part-time or for individuals with severe or moderate disabilities);
and iv) had different levels of engagement in the labor market (employed, unemployed, economically
inactive). Employed respondents had different levels of work arrangements and-or intensities (part-time
and full-time), and they comprised both self-employed or wage workers. The Individual Questionnaire
investigated basic demographic information and the way care responsibilities are managed within the
respondent’s household and family.
All respondents of demand assessment interviews were invited to one of the 9 FGDs conducted (3 in each
site). 14 These discussions investigated how care works in participants’ households, how care
responsibilities influence their time and other work, how gender norms factor into decision-making, and
what care services they use or what they think of these services. The three FGDs per site were organized
as follows: (a) women in the labor force with care needs in the household (employed, self-employed, or
unemployed), (b) women not in the labor force and with care needs in the household (economically
inactive), and (c) men with care needs in the household (in and out of the labor force).15 FGDs had
between 8 to 10 respondents each. Transcripts and summary reports from FDGs were produced and
translated into English. Interviewers conducted the individual interviews when scouting for and inviting
respondents, and they oversampled the invitations to ensure completed questionnaires for more people
than may attend the FGDs.
The supply assessment was a census-type study of all childcare and eldercare services available in the sites
targeted for the demand assessment.16 It included public, private, and community-based care providers.
Official documentation from local municipalities, snowball sampling,17 Internet search, and providers
mentioned in the FGDs were included. In some cases, providers were not necessarily in the sampled areas
of the study, but they satisfied the condition of servicing households within the target areas. A total of 21
childcare, 9 eldercare, and 5 intermediary facilities (daycare agencies mostly, covering childcare and
14 A limited number of respondents (seven) refused to participate in the FGDs and lack of time was the main reason for refusal. 15 Individual questionnaires took about 1.5 to 2 hours on average to be completed, and the approximate duration of the FGDs
was 2.5 hours. 16 Interviews at provider facilities lasted 2.5 to 3 hours on average including the observation portion. 17 Snowball sampling, also called chain-referral sampling, refers to the non-probability sampling technique where existing study subjects recruit future subjects from among their acquaintances.
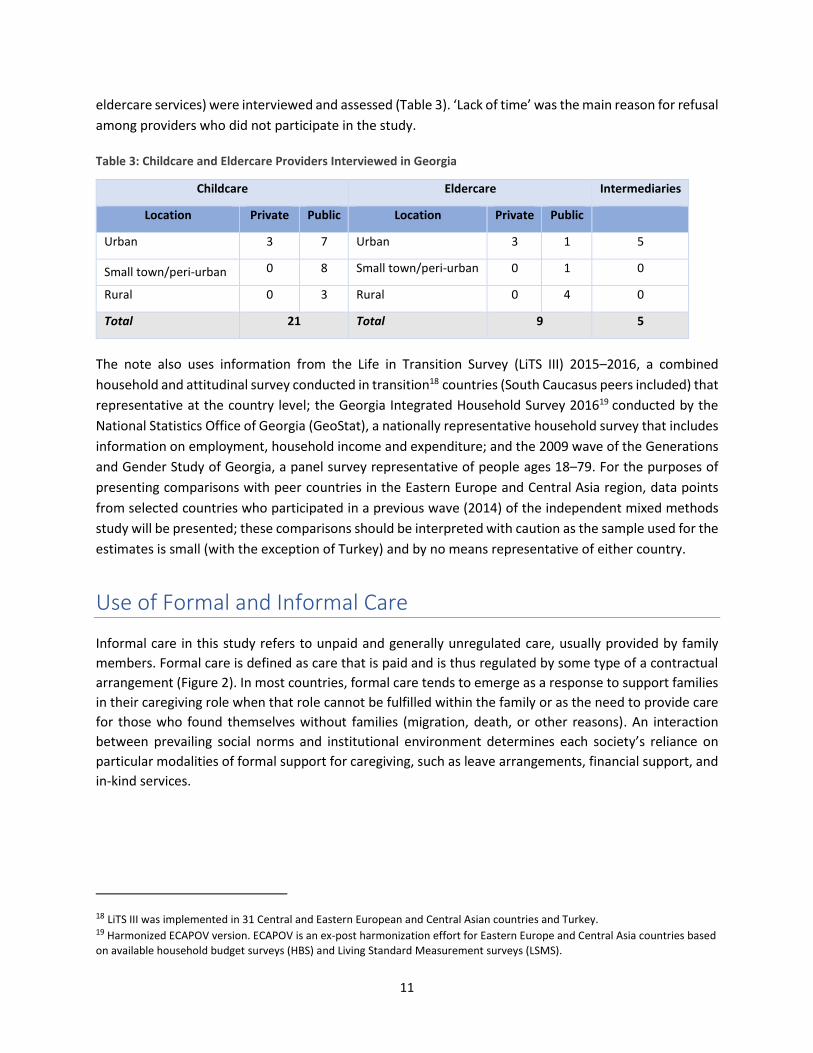
11
eldercare services) were interviewed and assessed (Table 3). ‘Lack of time’ was the main reason for refusal
among providers who did not participate in the study.
Table 3: Childcare and Eldercare Providers Interviewed in Georgia
Childcare Eldercare Intermediaries
Location Private Public Location Private Public
Urban 3 7 Urban 3 1 5
Small town/peri-urban 0 8 Small town/peri-urban 0 1 0
Rural 0 3 Rural 0 4 0
Total 21 Total 9 5
The note also uses information from the Life in Transition Survey (LiTS III) 2015–2016, a combined
household and attitudinal survey conducted in transition18 countries (South Caucasus peers included) that
representative at the country level; the Georgia Integrated Household Survey 201619 conducted by the
National Statistics Office of Georgia (GeoStat), a nationally representative household survey that includes
information on employment, household income and expenditure; and the 2009 wave of the Generations
and Gender Study of Georgia, a panel survey representative of people ages 18–79. For the purposes of
presenting comparisons with peer countries in the Eastern Europe and Central Asia region, data points
from selected countries who participated in a previous wave (2014) of the independent mixed methods
study will be presented; these comparisons should be interpreted with caution as the sample used for the
estimates is small (with the exception of Turkey) and by no means representative of either country.
Use of Formal and Informal Care
Informal care in this study refers to unpaid and generally unregulated care, usually provided by family
members. Formal care is defined as care that is paid and is thus regulated by some type of a contractual
arrangement (Figure 2). In most countries, formal care tends to emerge as a response to support families
in their caregiving role when that role cannot be fulfilled within the family or as the need to provide care
for those who found themselves without families (migration, death, or other reasons). An interaction
between prevailing social norms and institutional environment determines each society’s reliance on
particular modalities of formal support for caregiving, such as leave arrangements, financial support, and
in-kind services.
18 LiTS III was implemented in 31 Central and Eastern European and Central Asian countries and Turkey. 19 Harmonized ECAPOV version. ECAPOV is an ex-post harmonization effort for Eastern Europe and Central Asia countries based
on available household budget surveys (HBS) and Living Standard Measurement surveys (LSMS).

12
Figure 2: Typologies of Care Arrangements
Source: Authors’ based on Krauss et al. (2010).
Data from the latest LiTS (round 2015–2016) indicate that use of formal childcare services in Georgia (19
percent), as well as in most countries in the Eastern Europe and Central Asia region, is very low. Household
members are the primary source of care providers for childcare (Figure 3). In contrast, in the Western
Europe comparator—Germany—while informal childcare is still the most common arrangement, the use
of formal services reaches a higher 29 percent. Compared to its South Caucasus peers, in Georgia,
institutional public is the second most prevalent arrangement (12 percent, after informal care) whereas
in Armenia it is a combination of formal and informal (18 percent, including mixed-type, nannies, and
friends/relatives not living in the household). The prevalence in use of formal public arrangements in
Georgia is partly explained by the Georgian Parliament’s decision to abolish parental fees for public early
and preschool education establishments since September 2013, which probably played a crucial role in
raising kindergarten enrollments from 46 percent in 2012 to 66 percent in 2013.20
20 Georgia Country Gender Assessment 2016. Poverty and Equity Global Practice, World Bank. This was part of a broader reform
after the change in government in 2012 which marked a shift in fiscal policy with prioritization of recurrent social expenditures.
During 2012–2013, the government raised the benefit levels under the targeted social assistance (TSA) and pensions and
introduced universal health care (UHC).
Formal Care
Refers to care for which recipients or family
members pay. It can include institutional (center-
based) care, as well as residential (at-home) care.
Institutional Care
Also referred to as
center-based care, this
is a type of formal care.
It includes paid care
which occurs out of the
home.
Childcare: Examples
include kindergartens
and daycare facilities.
Eldercare: Examples
include nursing homes.
Residential Care
Also referred to as at-
home care, this is a
type of formal care. It
includes paid care
which occurs at home.
Childcare: Examples
include a nanny or
babysitter.
Eldercare: Examples
include an at-home
nurse.
Informal Care
Refers to unpaid care. Informal caregivers
are usually family members, friends, or
relatives of the care recipient.
Childcare: Mothers are seen as ‘natural’
primary caregivers. Others, such as
grandparents, fathers, and siblings, can also
be informal caregivers.
Eldercare: Unlike informal childcare, there is
no ‘natural’ primary caregiver for eldercare.
This role is often, though not always, taken
by the elder’s children, spouse, and/or
household members.

13
Figure 3: Childcare Type in the Household (%), Georgia and Selected Regional Comparators
Source: LiTS III, 2016. Note: Sample of primary respondents. ‘Other’ includes nanny, relatives, and friends not living in the household.
According to administrative data for the academic year 2017–2018 (GeoStat), about 44 percent of
children ages six and younger are enrolled in formal public preschool education and care (PEC) (Figure
4). Moreover, enrollment is significantly higher in the urban center—Tbilisi—and is lower in regions that
are predominantly rural such as Kvemo Kartli and Samegrelo-Zemo Svaneti, with the latter having more
PEC institutions available than Tbilisi itself (no official records available for enrollment in private
institutions).
Figure 4: Enrollment in PEC, by Region (as percentage of children ages six and younger)
Source: National Statistics Office of Georgia (2018) for enrollment data (academic year 2017–2018) http://www.geostat.ge/index.php?action=page&p_id=2603&lang=eng (accessed May 2018); and Integrated Household Survey 2016 (harmonized ECAPOV) for population six years and younger.
Although not representative at the country level, data from the fieldwork carried out for this study show
that, for families with children ages six and younger, the combination of informal and formal childcare
arrangements as well as exclusive use of informal care are the most common arrangement among
0
10
20
30
40
50
60
70
80
90
100
Azerbaijan Armenia Georgia Rest of ECA Germany
% o
f p
op
ula
tio
n li
vin
g in
ho
use
ho
lds
wit
h c
hild
car
e n
ee
d
Informal (only household members)
Only formal (institutional private)
Only formal (institutional public)
Formal and/or other type of care
Other
-
50
100
150
200
250
300
0
10
20
30
40
50
60
70
# P
EC in
stit
uti
on
s
Enro
llmen
t (a
s %
of
child
ren
0-6
)
Number of PEC InstitutionsEnrollment
14
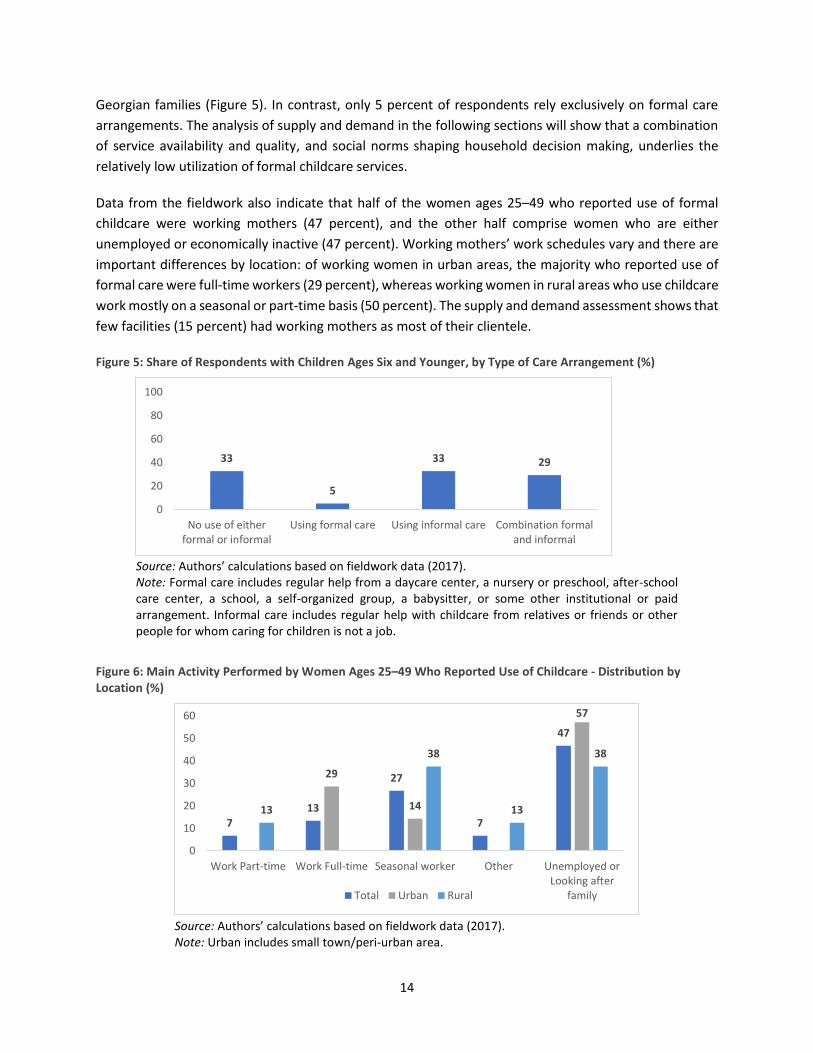
Georgian families (Figure 5). In contrast, only 5 percent of respondents rely exclusively on formal care
arrangements. The analysis of supply and demand in the following sections will show that a combination
of service availability and quality, and social norms shaping household decision making, underlies the
relatively low utilization of formal childcare services.
Data from the fieldwork also indicate that half of the women ages 25–49 who reported use of formal
childcare were working mothers (47 percent), and the other half comprise women who are either
unemployed or economically inactive (47 percent). Working mothers’ work schedules vary and there are
important differences by location: of working women in urban areas, the majority who reported use of
formal care were full-time workers (29 percent), whereas working women in rural areas who use childcare
work mostly on a seasonal or part-time basis (50 percent). The supply and demand assessment shows that
few facilities (15 percent) had working mothers as most of their clientele.
Figure 5: Share of Respondents with Children Ages Six and Younger, by Type of Care Arrangement (%)
Source: Authors’ calculations based on fieldwork data (2017). Note: Formal care includes regular help from a daycare center, a nursery or preschool, after-school care center, a school, a self-organized group, a babysitter, or some other institutional or paid arrangement. Informal care includes regular help with childcare from relatives or friends or other people for whom caring for children is not a job.
Figure 6: Main Activity Performed by Women Ages 25–49 Who Reported Use of Childcare - Distribution by Location (%)
Source: Authors’ calculations based on fieldwork data (2017). Note: Urban includes small town/peri-urban area.
33
5
33 29
0
20
40
60
80
100
No use of eitherformal or informal
Using formal care Using informal care Combination formaland informal
7
13
27
7
47
29
14
57
13
38
13
38
0
10
20
30
40
50
60
Work Part-time Work Full-time Seasonal worker Other Unemployed orLooking after
familyTotal Urban Rural
15
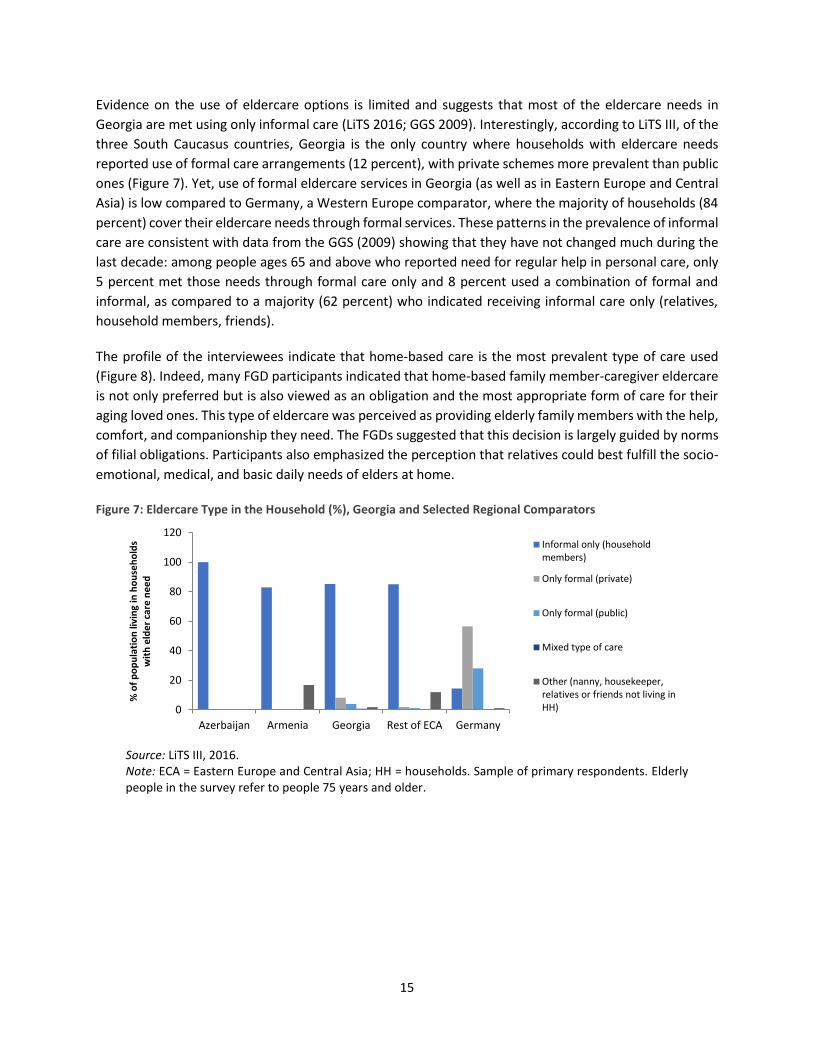
Evidence on the use of eldercare options is limited and suggests that most of the eldercare needs in
Georgia are met using only informal care (LiTS 2016; GGS 2009). Interestingly, according to LiTS III, of the
three South Caucasus countries, Georgia is the only country where households with eldercare needs
reported use of formal care arrangements (12 percent), with private schemes more prevalent than public
ones (Figure 7). Yet, use of formal eldercare services in Georgia (as well as in Eastern Europe and Central
Asia) is low compared to Germany, a Western Europe comparator, where the majority of households (84
percent) cover their eldercare needs through formal services. These patterns in the prevalence of informal
care are consistent with data from the GGS (2009) showing that they have not changed much during the
last decade: among people ages 65 and above who reported need for regular help in personal care, only
5 percent met those needs through formal care only and 8 percent used a combination of formal and
informal, as compared to a majority (62 percent) who indicated receiving informal care only (relatives,
household members, friends).
The profile of the interviewees indicate that home-based care is the most prevalent type of care used
(Figure 8). Indeed, many FGD participants indicated that home-based family member-caregiver eldercare
is not only preferred but is also viewed as an obligation and the most appropriate form of care for their
aging loved ones. This type of eldercare was perceived as providing elderly family members with the help,
comfort, and companionship they need. The FGDs suggested that this decision is largely guided by norms
of filial obligations. Participants also emphasized the perception that relatives could best fulfill the socio-
emotional, medical, and basic daily needs of elders at home.
Figure 7: Eldercare Type in the Household (%), Georgia and Selected Regional Comparators
Source: LiTS III, 2016. Note: ECA = Eastern Europe and Central Asia; HH = households. Sample of primary respondents. Elderly people in the survey refer to people 75 years and older.
0
20
40
60
80
100
120
Azerbaijan Armenia Georgia Rest of ECA Germany
% o
f p
op
ula
tio
n li
vin
g in
ho
use
ho
lds
wit
h e
lde
r ca
re n
ee
d
Informal only (householdmembers)
Only formal (private)
Only formal (public)
Mixed type of care
Other (nanny, housekeeper,relatives or friends not living inHH)

16
Figure 8: Share of Respondents by Type of Care Arrangement for the Elderly (%)
Source: Authors’ calculations based on fieldwork data (2017–2018). Note: The category ‘No use of either formal or informal care’ indicates that the respondent is not getting any help to take care of the needs for the elder family member.
Policy and Legal Framework of Care Services in Georgia
The existence, type, quality and cost of care-related services, and their use, are by a good part determined
by the regulatory framework they ascribe to. These frameworks cover who can provide the services, to
whom, under what circumstances, who and how are costs covered, and so on. For the case of Georgia,
the assessment of the regulatory environment was done in preparation of the data collection and shed
light on important elements to inform further policy discussions on the topic.
Children and the elderly have traditionally been target groups of Georgian social policies with care services
for these groups representing a significant portion of the state’s social budget. In 2013, the Georgian
Parliament, in the context of a broader reform promoted by the government to increase state social
expenditures, abolished parental fees to public early and preschool education establishments.21 As a
result of this policy, an increased demand for children’s enrollment into preschools could be observed,
which, in turn, resulted in excessive number of children in limited physical space and infrastructure of
public kindergartens (UNESCO 2015).
As for the needs of elderly people, social policy is mostly limited to pension which is the only old age
benefit currently in Georgia. Up until 2012, there were no public health care programs for the elderly
(excluding the socially vulnerable category) and they had limited access to specialized or differentiated
medical services. With the 2012 reform, a State Health Care Program was launched to provide health care
services for pension-age population (women above 60 years and men above 65 years); however, the
program did not include any home care services except for a palliative care program that provides
temporary home care for incurable patients (Illya State University 2015). State programs focus on social
21 That same reform impulse led to a raise in the benefit levels under the TSA and pensions and introduced UHC (World Bank
2014). http://documents.worldbank.org/curated/en/779561468275119198/Strategic-issues-and-reform-agenda.
1
48
0
51
0
20
40
60
80
100
Uses only formal care Uses only informal care Uses both formal andinformal care
Only household femalecaregiver; no use of either
formal or informal care

17
integration of elderly people and on providing them with ancillary appliances (wheelchairs, hearing
equipment, and so on).
The regulatory framework for the care of children and the elderly is provided by the Ministry of Labour,
Health, and Social Affairs (MoLHSA), which is in charge of developing the regulatory framework and
standards for social rehabilitation and childcare services. A ‘State Program for Social Rehabilitation and
Childcare’ is approved on a yearly basis22 to provide a framework for service delivery for all entities—both
state and public—offering social and health care services for people with rehabilitation and care needs,
including persons and children in the 0–18 age group with disabilities, elderly people (women above 60
years and men above 65 years), and children receiving childcare (other than preschool education/school
readiness services, see more details on legal framework for preschool below).23 While the state has
attempted to maximally outsource the service delivery, and municipalities play the most active role in the
delivery of childcare services, there are still a number of state institutions providing care services. For
instance, there are two state-run elderly boarding houses and a large number of state kindergartens.
Services under the abovementioned programs are administered by the Social Service Agency (SSA), a legal
entity of public law under the MoLHSA. The SSA maintains the registry of service providers, assesses their
compliance with state requirements, and defines the procedures for registration of providers of elderly
care and childcare.24 No other procedures—licensing or accreditation—apply to providers and, once
registered, they are allowed to start operation. The state has defined technical standards that apply only
for childcare and eldercare—public and private—providers offering 24 hours of continuous care (for
example. 24-hour shelters for children, boarding houses for elders) therefore excluding daycare centers.
All standards are set nationwide and there are no municipal-level standards or regulations of any social
services. Monitoring of service provision takes place through site visits (at least one per year) and through
the obligation of providers to report compliance on a periodic basis.
In the case of early (under the age of two) and preschool education (from the age of two and before entry
to first grade of primary), there have been ongoing efforts to create a more complete regulatory
framework. The Constitution of Georgia states that preschool education shall be guaranteed by the state
(Article 35, point 3, Constitution of Georgia; Adopted on August 24, 1995). More recently, adopted by the
Parliament of Georgia in June 2016 and with the technical support from UNICEF, the Law on Early and
Preschool Education (EPE), sets the regulatory ground and national standards for “ensuring universal
accessibility to, and the development and quality assurance of, early and preschool education in Georgia”
and defines “the obligations, functions and responsibilities of state bodies and municipalities.”25
22 As such, in March 2017, the MoLHSA approved the ‘State Program for Social Rehabilitation and Child Care 2017’ which was
valid until December that year.
23 Early childhood interventions are part of the state program and comprises children under three years and, for children with
development disorder, children up to seven years.
24 Applicants registering for childcare service provision must provide information on services offered, cost of services, infrastructure, and staff. The application for registration is processed by the SSA within 10 days from the application. 25 Available in English at https://matsne.gov.ge/en/document/download/3310237/0/en/pdf.

18
Among the major achievements introduced by the EPE Law are the mandate that every child has the right
to receive preschool education, the establishment of mandatory cross-sectoral national standards, a
standard-based authorization system applicable to both public and private institutions who want to
operate, the introduction of mechanisms for the prevention of violence and strengthening the governance
capacities of municipalities to improve the quality and access in early childhood education (ECE) services.
Notably, the EPE Law mandates the establishment of a national system for pre- and in-service training of
preschool educators, which to date is not regulated by any authoritative entity. The EPE Law entered into
force on April 2017 and its implementation is expected to be completed by 2020.26
Kindergartens are mainly accountable to preschool institution management agencies (PIMAs) in the
respective municipalities. The PIMA is responsible for the management of kindergartens. However, there
are some exceptions where the kindergartens are administered directly by the municipal authorities. Its
main functions are assessment, monitoring, analyses of educational processes, and methodological
support of kindergartens. It also has responsibility for issues such as improvement of staff members’
knowledge and provision of standards.27 Aspects such as establishing the kindergarten, elaboration of
curriculum, and authorization of funding happen at the local level. In addition, as the EPE law mandates,
the central level -Ministry of Education and Science, mostly - will have increased responsibilities in
developing and monitoring national standards28 for all public and private preschool institutions, and in
supporting municipalities to improve governance.
Childcare Supply
Availability is limited, childcare facilities operate at overcapacity, and wait lists are prevalent
Data from GeoStat indicate that in the school year 2017–2018, there were 1,438 operational units
providing PEC services in Georgia with a staff of 12,394 caregivers (including pedagogues, caregivers, or
assistant caregivers), serving a total of 153,230 children. This translates into a national average of 12
children-to-staff. Moreover, according to a recent report on PEC from UNICEF (2018), total enrollment of
children ages 2 to 5 years in Georgia is 69.5 percent, and enrollment rates are even lower for children of
ethnic minorities (33 percent), those classified as socially vulnerable (39.7 percent) and those living in
rural areas (47 percent).
According to UNESCO (2015), the policy initiative to abolish early and preschool education fees increased
the demand for children’s enrollment into preschools; data from UNICEF indicates that enrollment in early
childhood education during the period 2005-2012 was 43.2 percent, compared to 69.5 percent in 2017.
This resulted in excessive number of children in limited physical space and infrastructure of public
26 As established in the law, most of the articles entered into force starting April 2017, some others in April 2018, and the remaining ones will do so in April 2020. United Nations Children's Fund (UNICEF) has provided technical assistance to the government in the drafting and implementation of the law. 27 UNICEF (2015). http://unicef.ge/uploads/UNICEF_Preschool_Census_ENG_FINAL.PDF. 28 National standards will set quality targets for education; nutrition; water, sanitation, and hygiene (WASH); and infrastructure.

19
kindergartens. In Tbilisi, for example, the number of children per PEC caregiver is 14, and the average
number of children per PEC institution is three times higher (358 children per institution) than the national
average of 107 (Figure 9). Rural regions such as Kvemo Kartli have child-staff ratios as high as 16, and the
capacity per institution appears to be lower (average children served by institutions is 130). This suggests
that regions do not have sufficient space and facilities to respond to the existing demand. The
overcrowding also raises concerns about the quality of preschool facilities to accommodate and serve the
children. There is no official record regarding private supply, that is, providers and enrollment in private-
owned childcare. Further research on the evolution of enrollment rates ex ante and ex post the legislation
change would shed light on whether the abolition of fees in 2012 may be related to an increase in
enrollment.
Figure 9: Number of PEC Providers and Beneficiary Children in Georgia
Source: National Statistics Office of Georgia (2018). http://www.geostat.ge/index.php?action=page&p_id=2603&lang=eng (accessed May 2018). Note: Refers to the beginning of the school year 2017–2018. Caregiver includes pedagogues, caregivers, or assistant caregivers.
The information on capacity gathered for the study, although not representative at the country level,
supports the existence of gaps between supply—both public and private—and demand for childcare in
Georgia, with higher children-caregiver and children-per-institution ratios in urban and peri-urban areas.
In rural areas, the capacity is rather lower. Private providers, while having a smaller service capacity
compared to public ones, seem to have smaller and more adequate children-staff ratios (Table 4).
Table 4: Childcare Provision as Observed from Mixed Methods Study
Number of providers
Total children served
Average children served per provider
Children to caregiver ratio
Urban 10 1,317 132 10
Small town/peri-urban 8 1,117 140 14
Rural 3 78 26 9
Public 18 2,437 135 13
-
2
4
6
8
10
12
14
16
18
20
-
50
100
150
200
250
300
350
400
Ch
ildre
n t
o S
taff
rat
io
Ch
ildre
n t
o In
stit
uti
on
rat
io
Children per PEC CaregiverChildren per PEC institution
National avg children per PEC caregiver = 12National avg children per PEC Inst = 107

20
Private 3 75 25 4
Total Providers 21 2,512 120 11
Source: Authors’ calculations based on fieldwork data (2017).
Note: Total children served = total capacity of all providers in the location or by type.
While the FGD participants voiced concerns regarding quality, issues related to capacity of childcare
providers and overcrowding in existing facilities appear to be the most pressing problems regarding
childcare. There are indications through the focus groups’ conversations with parents that existing
facilities, particularly public centers, are overcrowded. Parents also agree with the assessment that the
increased interest in these services stems from both the gap between supply and demand of these
services and the abolition of fees. When asked about supply of care services, group conversation
participants explained that there are kindergartens, but enrollment is managed by long queues and actual
waiting lists, and oftentimes families’ turn might never arrive.
“There are free centres but they are limited in number and you will never get there.”
(Woman in urban area of Georgia)
Some participants also referred to the (online, in most cases) process of registering children in a public
facility and expressed that, due to the supply and demand gap, oftentimes families are not even able to
go through registration because the facility is already full. They explained that in most cases, public
facilities give priority to children beneficiaries of social assistance (or their siblings, if already enrolled) and
children of war veterans, which fills their capacity. Families coming after in terms of priority are placed on
a waiting list. In some instances, families report having considered the idea to relocate to areas where a
new childcare facility is known to have recently open to increase their probability of enrollment.
“My children grew up in the 90s and there were lots of kindergartens by then, and they were searching for children to attend. Then this registration thing started. We could not register my first grandchild, not because we were lazy (…) there were no places available. Then they put us in the reserve list and after one month the place was available in other district (Avlabari) and we wanted to attend the kindergarten so much that we went in Avlabari for a year.”
(Woman in urban area of Georgia)
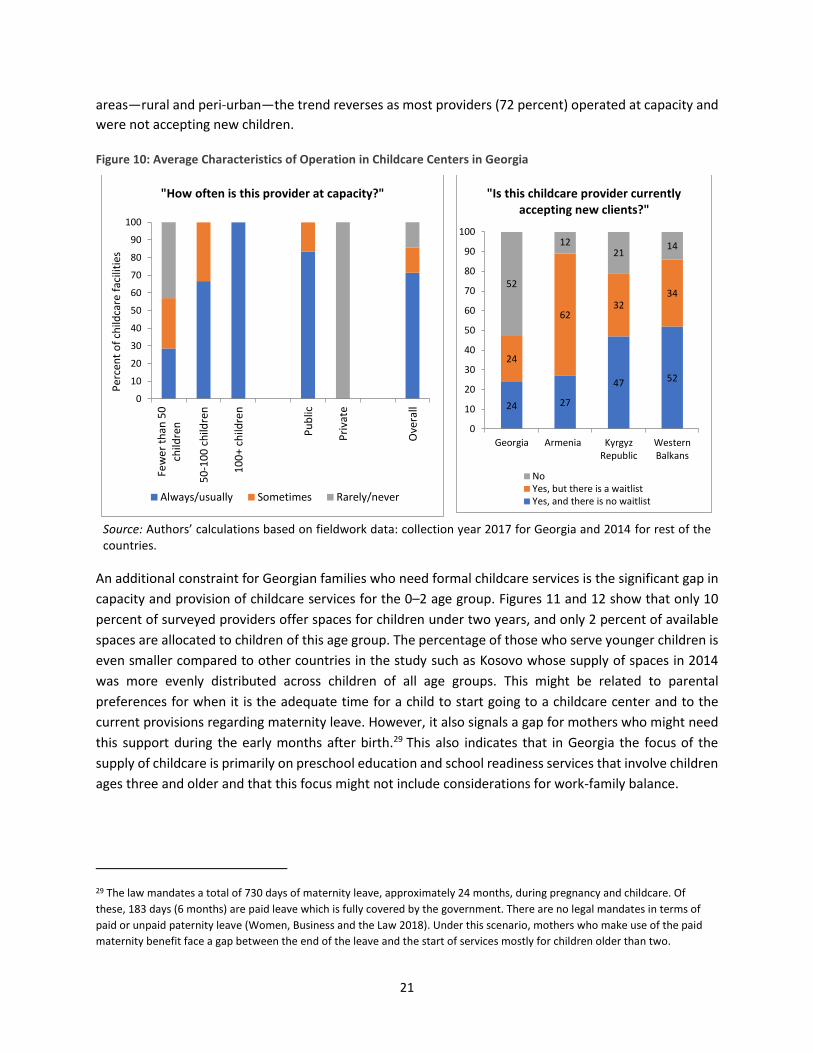
The data collected from providers in the independent study confirm the concerns expressed in the FGDs.
Half of the surveyed providers were operating at full capacity and were not accepting new children, one
quarter declared accepting new clients but currently having a wait list, and the remaining quarter declared
receiving children without putting them in a wait list (Figure 10). Most providers (71 percent) reported
that they are ‘Always/usually’ at capacity, including the ones with bigger capacity to enroll 100+ children
as well as the state-owned ones, and less than 15 percent reported that they are ‘Rarely/never’ at capacity
(Figure 4). The vacancies in service providers are mainly found in private facilities as all private providers
reported ’Rarely/never” being at capacity.
Analysis by location reveals important differences: in Tbilisi, the urban center, there is a higher probability
of finding providers accepting new clients (30 percent with wait lists and 40 percent without); in other
21
areas—rural and peri-urban—the trend reverses as most providers (72 percent) operated at capacity and
were not accepting new children.
Figure 10: Average Characteristics of Operation in Childcare Centers in Georgia
Source: Authors’ calculations based on fieldwork data: collection year 2017 for Georgia and 2014 for rest of the countries.
An additional constraint for Georgian families who need formal childcare services is the significant gap in
capacity and provision of childcare services for the 0–2 age group. Figures 11 and 12 show that only 10
percent of surveyed providers offer spaces for children under two years, and only 2 percent of available
spaces are allocated to children of this age group. The percentage of those who serve younger children is
even smaller compared to other countries in the study such as Kosovo whose supply of spaces in 2014
was more evenly distributed across children of all age groups. This might be related to parental
preferences for when it is the adequate time for a child to start going to a childcare center and to the
current provisions regarding maternity leave. However, it also signals a gap for mothers who might need
this support during the early months after birth.29 This also indicates that in Georgia the focus of the
supply of childcare is primarily on preschool education and school readiness services that involve children
ages three and older and that this focus might not include considerations for work-family balance.
29 The law mandates a total of 730 days of maternity leave, approximately 24 months, during pregnancy and childcare. Of
these, 183 days (6 months) are paid leave which is fully covered by the government. There are no legal mandates in terms of
paid or unpaid paternity leave (Women, Business and the Law 2018). Under this scenario, mothers who make use of the paid
maternity benefit face a gap between the end of the leave and the start of services mostly for children older than two.
0
10
20
30
40
50
60
70
80
90
100
Few
er
than
50
child
ren
50
-10
0 c
hild
ren
10
0+
child
ren
Pu
blic
Pri
vate
Ove
rall
Per
cen
t o
f ch
ildca
re f
acili
ties
"How often is this provider at capacity?"
Always/usually Sometimes Rarely/never
24 27
47 52
24
6232
3452
1221
14
0
10
20
30
40
50
60
70
80
90
100
Georgia Armenia KyrgyzRepublic
WesternBalkans
"Is this childcare provider currently accepting new clients?"
NoYes, but there is a waitlistYes, and there is no waitlist

22
Figure 11: Percent of Childcare Facilities Serving Various Age Groups, Georgia and Selected Comparators
Figure 12: Total Number of Spaces Available by Age Group, Georgia and Selected Comparators
Source: Authors’ calculations based on fieldwork data: collection year 2017 for Georgia and 2014 for rest of the countries. Note: Facilities assessed in Georgia: 21 and in Kosovo: 9.
Data also indicate that service offering is not consistent across the calendar year. The availability of
services decreases sharply during the summer months, with only 10 percent of facilities being operational
and open in July (75 percent of these in urban Tbilisi) and August (none of which are in the rural area).
While this coincides with the school holidays calendar, from an accessibility point of view, when access to
services is key for consistent labor involvement of parents, this can become a barrier (Figure 13). These
numbers contrast with the 2014 estimates for its neighbor Armenia, which offers more consistent services
throughout the year, with still some decline during the summer months, but a system of year-round and
summer-only care for parents who require it.
With regard to hours of operation, the FGD participants voiced that public kindergartens close at 6:00
p.m., exactly the time most of the jobs do, whereas the private ones have longer working hours but at the
expense that these are not free of charge. Information gathered from providers supports these views: on
average, centers in Georgia commonly open around 9:00 a.m. and close around 6:00 p.m., providing
services for an average of 9 hours per day (only one center, public, in Tbilisi, close around 7:00 p.m.).
Georgian childcare centers, along with Armenian ones, seem to operate during a shorter number of hours
than for example surveyed centers in the Balkans.
0102030405060708090
100
Under 2years
2 years 3 years 4 years 5 years% o
f ch
ildca
re f
acili
ties
ser
vin
g ag
e gr
ou
p
Georgia Armenia Kosovo
0
100
200
300
400
500
600
700
800
900
Under 2 yearsold
2-3 years old 4-5 years old
Spac
es f
or
child
ren
Georgia Kosovo

23
Figure 13: Months of Operation of Childcare Centers, Georgia and Selected Regional Comparators
Source: Authors’ calculations based on fieldwork data: collection year 2017 for Georgia and 2014 for rest of the countries.
Main challenges for quality childcare provision are high child-staff ratios and staff’s training
Given that free childcare services are available, Georgian families’ additional concerns, other than limited
availability, appear to be their access to higher quality services. In general, private childcare providers are
perceived as offering higher-quality services and to be more beneficial for children’s developmental
outcomes; however, high costs make them unaffordable for most of the population. Despite parents’ clear
recognition of the benefits of early childhood education, many Georgian families decided not to use
childcare services because of quality concerns. Participants mentioned that while many people use
municipal kindergartens, some others are waiting for a new (and closer) center to open.
Among the positive views regarding kindergartens’ services highlighted by the FGD participants are the
food service which parents rate as satisfactory and the curriculum and educational program, including the
developmental component that comes with it, which some parents acknowledge would be hard to
provide at home. Specifically, in rural areas, parents also highlight a feeling of satisfaction with teachers.
One strong negative aspect had to do with parent’s assessment of a lack of qualified staff in kindergartens.
The FGD participants would like kindergartens to focus more on education rather than on ‘just spending
time’ (for example, making the children watch cartoons on television) and this was attributed to poor
teacher qualifications and attentiveness as well as lack of basic training or education needed to care for
children. The FGD participants attributed the poor teacher performance to low wages, which are thought
to curb the motivation of existing teachers to perform better. Therefore, parents think that the salaries of
staff should be improved to ensure that they could deliver better quality services, and the responsibility
of salaries lies within the state. Data collected from providers support these views as about one-third (33
percent) of caregivers do not have a higher education diploma (see more detail on qualifications below);
0%
10%
20%
30%
40%
50%
60%
70%
80%
90%
100%
Per
cen
t o
f ch
ildca
re p
rovi
der
s
Georgia Armenia Kyrgyz Republic Avg Western Balkans
24
only 29 percent of institutions in the sample provide opportunities for continued education, training, and
professional development for caregivers; few providers (24 percent) indicate having a probationary period
for new caregivers; and almost half of the surveyed centers have defined evaluation criteria for caregivers.
Moreover, according to the latest available report on quality of early childhood and care services in
Georgia (UNICEF, 2018), the social status of a caregiver working in this field is very low. The average
monthly salary for a full-time caregiver is GEL 336 (approximately US$128), which is almost three times
less than the average monthly earnings of the employed population in Georgia (GEL 940, approximately
US$ 360).30
“(…) it is also not acceptable to read the fairy-tale ten times and let children sit there in vain. The teacher should be trained, I respect everyone who works at a kindergarten since I trust them my children, but they should train them so they can give better education to children.” (Women in urban area of Georgia)
The other negative aspect was the children-staff ratio. Participants pointed out that because municipal
kindergartens have a higher enrollment, there are many children distributed in a few groups which
elevates the child-staff ratio. Participants mentioned that there are about 40–45 children in one group
and the group has one caregiver and one nanny only. This in turn was named to be the source of infections
among children.
“The space is small, there are forty children in the group.” (…) “There are many children in one group and only two teachers.” (Women in a peri-urban area of Georgia)
To complement the FGDs, supply-side data were used to create a quality index comprising three equally
weighted subindexes, reflecting on central aspects discussed during the FGD: (a) infrastructure; (b) human
resources; and (c) materials, curriculum, and learning quality (MCLQ) subindex. The subindexes and the
overall scores were standardized to a scale between 0 and 100, where a higher score indicates better
quality. (See list of variables used in the construction of each subindex in Annex 1.) The overall quality
score places Georgia at similar levels of what Armenia, Kyrgyz Republic, or the Western Balkans were in
2014 in terms of quality and at a higher level than Turkey (who scores the lowest in all three components
of the index).31
In Georgia the human resources component is the weakest, and it is also lower than most of the countries
where the same research was conducted except for Turkey (Figure 14). The human resources subindex
includes four variables: the pupil-caregiver ratio, the educational attainment of teachers (tertiary and/or
vocational diplomas), whether a small group of children are primarily cared for by one designated staff
member, and the permanence of staff in the institution. In this regard, only half (52 percent) of the
providers indicated that a small group is primarily cared by one caregiver, in only 47 percent of the centers
30 UNICEF (2018) using data from GeoStat for the period 2014-2016. 31 Caution needs to be used when interpreting these results, as the sample used for these estimates is small and by no means
representative of either country.
25
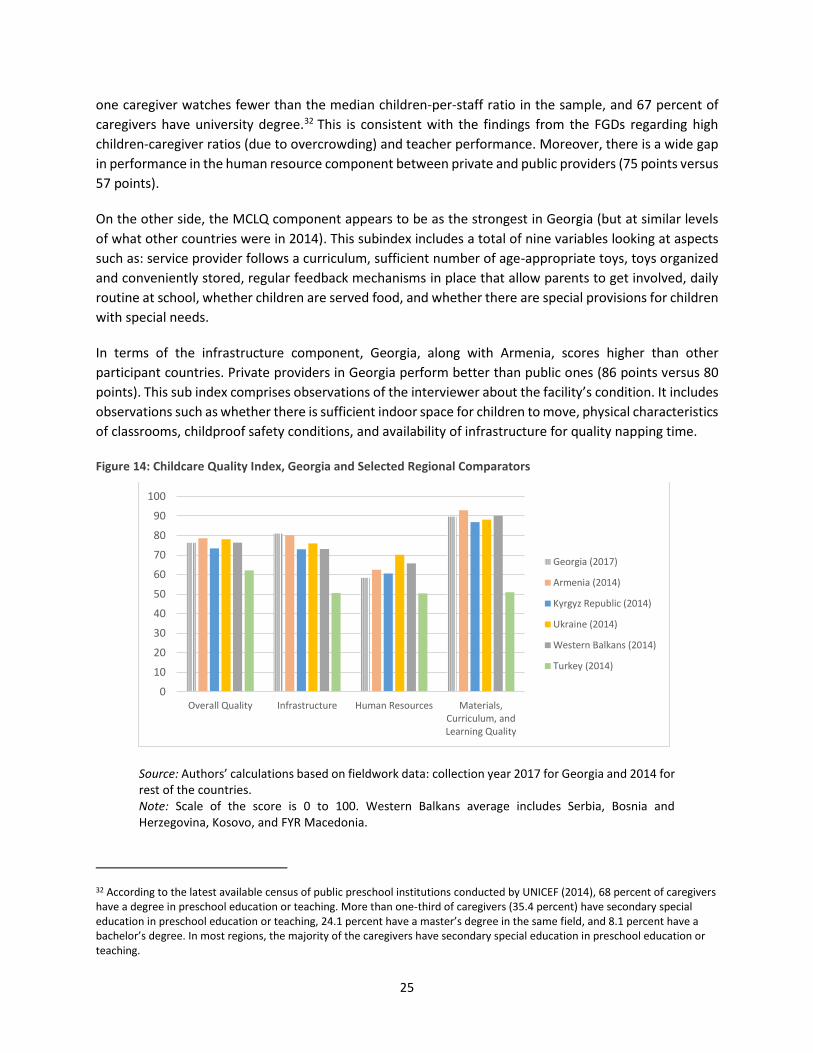
one caregiver watches fewer than the median children-per-staff ratio in the sample, and 67 percent of
caregivers have university degree.32 This is consistent with the findings from the FGDs regarding high
children-caregiver ratios (due to overcrowding) and teacher performance. Moreover, there is a wide gap
in performance in the human resource component between private and public providers (75 points versus
57 points).
On the other side, the MCLQ component appears to be as the strongest in Georgia (but at similar levels
of what other countries were in 2014). This subindex includes a total of nine variables looking at aspects
such as: service provider follows a curriculum, sufficient number of age-appropriate toys, toys organized
and conveniently stored, regular feedback mechanisms in place that allow parents to get involved, daily
routine at school, whether children are served food, and whether there are special provisions for children
with special needs.
In terms of the infrastructure component, Georgia, along with Armenia, scores higher than other
participant countries. Private providers in Georgia perform better than public ones (86 points versus 80
points). This sub index comprises observations of the interviewer about the facility’s condition. It includes
observations such as whether there is sufficient indoor space for children to move, physical characteristics
of classrooms, childproof safety conditions, and availability of infrastructure for quality napping time.
Figure 14: Childcare Quality Index, Georgia and Selected Regional Comparators
Source: Authors’ calculations based on fieldwork data: collection year 2017 for Georgia and 2014 for rest of the countries. Note: Scale of the score is 0 to 100. Western Balkans average includes Serbia, Bosnia and Herzegovina, Kosovo, and FYR Macedonia.
32 According to the latest available census of public preschool institutions conducted by UNICEF (2014), 68 percent of caregivers have a degree in preschool education or teaching. More than one-third of caregivers (35.4 percent) have secondary special education in preschool education or teaching, 24.1 percent have a master’s degree in the same field, and 8.1 percent have a bachelor’s degree. In most regions, the majority of the caregivers have secondary special education in preschool education or teaching.
0
10
20
30
40
50
60
70
80
90
100
Overall Quality Infrastructure Human Resources Materials,Curriculum, andLearning Quality
Georgia (2017)
Armenia (2014)
Kyrgyz Republic (2014)
Ukraine (2014)
Western Balkans (2014)
Turkey (2014)
26
Cost of childcare
Most of the samples included state-owned providers which translates into a higher percentage of
providers offering free services, as compared to other countries in the study (Table 5). Among those not
providing free services (that is, private providers), the majority (67 percent) offered price flexibility for
families with financial difficulties to pay for these services, which is higher than other countries. Private
providers indicated charging parents on a monthly basis, with a rate in the range GEL 200–270 (US$82–
US$110).33
Table 5: Percentage of Childcare Providers Offering Free Services or Payment Flexibility, Georgia and Selected
Comparators
Offers Free Services
Offer Price Flexibility, among those
not Providing Free Services
No (%) Yes (%) Sample No (%) Yes (%) Sample
Georgia 14 86 21 33 67 3
Armenia 38 62 26 70 30 10
Kyrgyz Republic 93 7 67 69 31 62
Western Balkans 96 4 46 20 80 44
Source: Authors’ calculations based on fieldwork data: collection year 2017 for Georgia and 2014 for rest of the
countries.
Despite having access to a public system providing free childcare services, quality concerns move Georgian
families into willingness to pay a fee in exchange for better quality. Several participants in the urban FGDs
explained that this gradual deterioration of public care services began when these services became free
of charge. In many cases, the cost of childcare for rural residents also implies indirect costs such as
transportation, as the supply of formal childcare centers (both public and private) is even more limited
than in urban areas. Information gathered from providers indicates that services provided to children
without extra charge include food, materials such as toys and pencils, and educational activities, with
transportation to and from the childcare center being the only exception.
“They [childcare facilities] are too loaded; it is good that meals are free, but I would prefer to pay something and to know that quality is better.” (Women in peri-urban area of Georgia)
33 Caution needs to be used when interpreting these results, as the sample used for these estimates is small and by no means
representative at the country level.

27
Demand for Childcare
Main determinants of demand are awareness about benefits to children’s development and need of support for working mothers
Two main factors seem to determine the demand for childcare services in Georgia: (a) awareness about
benefits to children’s development from a formal education and social environment and (b) the need for
childcare support particularly among women with limited or no informal support for care activities and
who entered or are looking to enter (or reenter) the labor market.
The FGD participants indicated that, along with providing care, the social and cognitive development
benefits provided by formal childcare centers represent an important motivation for parents to use these
services. These perceptions were observed both among urban and rural parents. Main benefits mentioned
during the discussion included socialization and communication with other peers, language skill
development, and future school readiness.
“They [not only] take care of the children, but [also] teach them some things; you cannot make a child read by her/himself, and they teach them elementary things and it is good.” “They have good teachers and good food, and all kind of entertainment a child needs.” (Men in rural area of Georgia)
Formal childcare services have a potentially important beneficial role for working women, providing
support during working hours, improving work-life balance, and increasing possibilities to access broader
opportunities and better jobs. These services are particularly important for women with no access to
informal childcare support systems from family members. The profile of interviewed working women
suggests that the role of nannies as a particularly convenient form of childcare because it helps mothers
work while at the same time allowing them to ‘have control of the upbringing process’. In the case of older
children, FGD participants—regardless of their working status—voiced a preference for kindergartens
over nannies.
“I had a nanny for both of my kids and I am very satisfied about it… essentially, nannies are not a bad option for women who are occupied and have a profession. If you stay home and look after the child for a year, you may fall behind. Some women enjoy being a housewife, but if you want to be successful then taking a time off is not good for your career. I would not be where I am now if I had stayed at home.”
(Women in peri-urban area of Georgia)
Social norms play a significant role in shaping negative perceptions about childcare use
Norms on childcare (and, in general, on care for family members), work, and motherhood may play a role
in shaping negative perceptions on use of care centers.
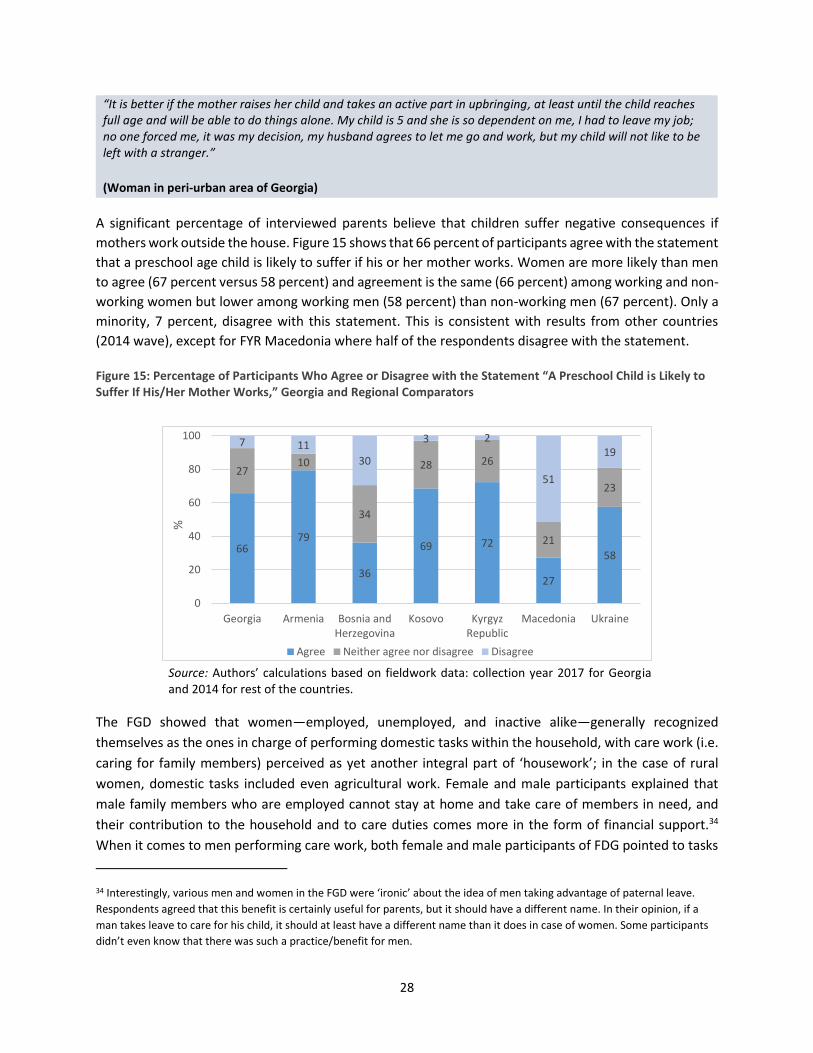
28
“It is better if the mother raises her child and takes an active part in upbringing, at least until the child reaches full age and will be able to do things alone. My child is 5 and she is so dependent on me, I had to leave my job; no one forced me, it was my decision, my husband agrees to let me go and work, but my child will not like to be left with a stranger.”
(Woman in peri-urban area of Georgia)
A significant percentage of interviewed parents believe that children suffer negative consequences if
mothers work outside the house. Figure 15 shows that 66 percent of participants agree with the statement
that a preschool age child is likely to suffer if his or her mother works. Women are more likely than men
to agree (67 percent versus 58 percent) and agreement is the same (66 percent) among working and non-
working women but lower among working men (58 percent) than non-working men (67 percent). Only a
minority, 7 percent, disagree with this statement. This is consistent with results from other countries
(2014 wave), except for FYR Macedonia where half of the respondents disagree with the statement.
Figure 15: Percentage of Participants Who Agree or Disagree with the Statement “A Preschool Child is Likely to Suffer If His/Her Mother Works,” Georgia and Regional Comparators
Source: Authors’ calculations based on fieldwork data: collection year 2017 for Georgia and 2014 for rest of the countries.
The FGD showed that women—employed, unemployed, and inactive alike—generally recognized
themselves as the ones in charge of performing domestic tasks within the household, with care work (i.e.
caring for family members) perceived as yet another integral part of ‘housework’; in the case of rural
women, domestic tasks included even agricultural work. Female and male participants explained that
male family members who are employed cannot stay at home and take care of members in need, and
their contribution to the household and to care duties comes more in the form of financial support.34
When it comes to men performing care work, both female and male participants of FDG pointed to tasks
34 Interestingly, various men and women in the FGD were ‘ironic’ about the idea of men taking advantage of paternal leave.
Respondents agreed that this benefit is certainly useful for parents, but it should have a different name. In their opinion, if a
man takes leave to care for his child, it should at least have a different name than it does in case of women. Some participants
didn’t even know that there was such a practice/benefit for men.
6679
36
69 72
27
58
2710
34
28 26
21
23
7 11
30
3 2
51
19
0
20
40
60
80
100
Georgia Armenia Bosnia andHerzegovina
Kosovo KyrgyzRepublic
Macedonia Ukraine
%
Agree Neither agree nor disagree Disagree

29
such as taking children to/from school/kindergarten, buying/providing medications, and giving advice or
making decisions on behalf of their children.35
“Any woman who chooses career or work over family loses all respect from me... I can’t believe how families with five women decide to hire a nanny.” (Man in urban area of Georgia)
Moreover, representative results at the country level from LiTS (2016) confirm the existence of social
constructs that women should take a more active role in taking care of the home and men should be the
ones participating in the labor market. Most Georgians ages 18 and above—59 percent of women and 68
percent of men—agree that it is better for the household if the man earns money and the woman takes
care of the home and the children (Figure 16).
Figure 16: Percentage of People Who Agree with the Statement in Georgia
Source: LiTS III, 2016. Note: Sample of primary respondents (age 18+).
Eldercare Supply
Availability of residential care is limited, most private options are expensive, and there is lack of flexible arrangements
Administrative data on the supply side of eldercare is limited. GeoStat publishes aggregate figures on the
number, capacity and staff of residential care facilities (nursing homes in Georgia)36 for the elderly and
people with disabilities. The HIS does not contain information on use nor demand for these types of
services. According to GeoStat, by the end of 2017, there were six residential institutions for care of the
35 Some female participants perceived men as “not good enough” at tasks such as feeding, bathing, monitoring medicine intake,
etc., and men in general agreed with this perception.
36 Residential care for the elderly refers to these centers where the elderly citizens reside/live, as opposed to adult daycare
centers which provide care for elders only during day times, much like childcare. The most common format of residential care
across Eastern Europe and Central Asia countries is the nursing homes.
0 20 40 60 80 100
Men
Women
Total
It is better for everyone involved if the man earns the money and the woman takes care of the home and children
Refused Doesn't know Strongly disagree Disagree Agree Strongly agree
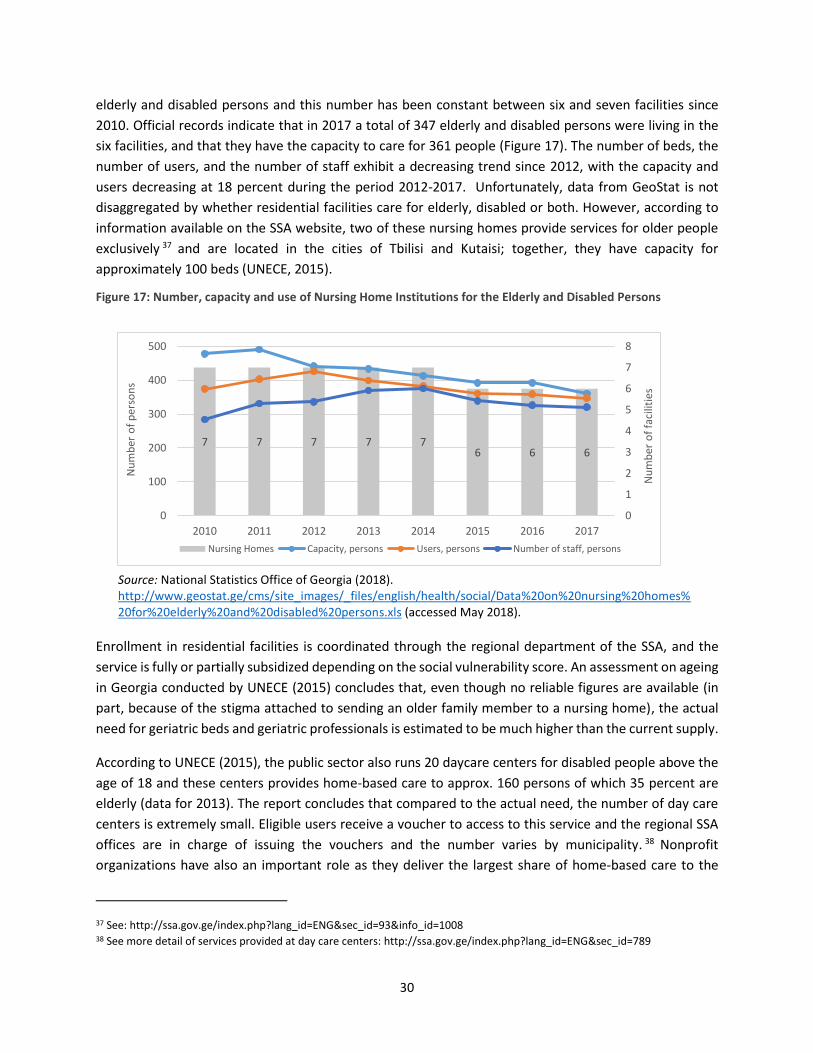
30
elderly and disabled persons and this number has been constant between six and seven facilities since
2010. Official records indicate that in 2017 a total of 347 elderly and disabled persons were living in the
six facilities, and that they have the capacity to care for 361 people (Figure 17). The number of beds, the
number of users, and the number of staff exhibit a decreasing trend since 2012, with the capacity and
users decreasing at 18 percent during the period 2012-2017. Unfortunately, data from GeoStat is not
disaggregated by whether residential facilities care for elderly, disabled or both. However, according to
information available on the SSA website, two of these nursing homes provide services for older people
exclusively 37 and are located in the cities of Tbilisi and Kutaisi; together, they have capacity for
approximately 100 beds (UNECE, 2015).
Figure 17: Number, capacity and use of Nursing Home Institutions for the Elderly and Disabled Persons
Source: National Statistics Office of Georgia (2018). http://www.geostat.ge/cms/site_images/_files/english/health/social/Data%20on%20nursing%20homes%20for%20elderly%20and%20disabled%20persons.xls (accessed May 2018).
Enrollment in residential facilities is coordinated through the regional department of the SSA, and the
service is fully or partially subsidized depending on the social vulnerability score. An assessment on ageing
in Georgia conducted by UNECE (2015) concludes that, even though no reliable figures are available (in
part, because of the stigma attached to sending an older family member to a nursing home), the actual
need for geriatric beds and geriatric professionals is estimated to be much higher than the current supply.
According to UNECE (2015), the public sector also runs 20 daycare centers for disabled people above the
age of 18 and these centers provides home-based care to approx. 160 persons of which 35 percent are
elderly (data for 2013). The report concludes that compared to the actual need, the number of day care
centers is extremely small. Eligible users receive a voucher to access to this service and the regional SSA
offices are in charge of issuing the vouchers and the number varies by municipality. 38 Nonprofit
organizations have also an important role as they deliver the largest share of home-based care to the
37 See: http://ssa.gov.ge/index.php?lang_id=ENG&sec_id=93&info_id=1008 38 See more detail of services provided at day care centers: http://ssa.gov.ge/index.php?lang_id=ENG&sec_id=789
7 7 7 7 76 6 6
0
1
2
3
4
5
6
7
8
0
100
200
300
400
500
2010 2011 2012 2013 2014 2015 2016 2017
Nu
mb
er o
f fa
cilit
ies
Nu
mb
er o
f p
erso
ns
Nursing Homes Capacity, persons Users, persons Number of staff, persons

31
elderly in Georgia and much of these service is provided to people who live in poverty and receive benefits
from the SSA. It is estimated that there are 95 NGOs working on disability issues, but not specifically on
the matters related to older people (UNECE, 2015).39
Data gathered for this study, although not representative at the country level, include two public facilities
operating in both urban and rural areas; five facilities ran by nonprofit organizations serving all urban,
peri-urban, and rural areas; one facility owned by a religious organization in the urban area; and one
private facility serving the urban area (Table 6). Public providers are funded by the state budget, and
nonpublic ones (hereinafter private) are funded by international cooperation funds and/or by charging
fees. As seen from the data, the average capacity is significantly higher in urban areas compared to peri-
urban and rural areas.
Table 6: Live-in Eldercare Provision in Georgia as Observed from Mixed Methods Study
Urban Small town/Peri-urban Rural
Country
Number
of
providers
Total
elders
served
Average
elders
served
per
provider
Number
of
providers
Total
elders
served
Average
elders
served
per
provider
Number
of
providers
Total
elders
served
Average
elders
served
per
provider
Georgia 4 452 113 3 69 23 2 47 23.5
Armenia 2 42 21 0 0 — 0 0 —
Kyrgyz Republic 2 955 478 2 131 131 1 11 11
Kosovo 1 110 110 1 20 20 0 0 —
Bosnia and
Herzegovina 2 585 293 1 155 155 2 320 160
FYR Macedonia 2 173 87 2 20 10 1 20 20
Source: Authors’ calculations based on fieldwork data: collection year 2017 for Georgia, and 2014 for rest of the
countries.
Note: Total elders served = total of capacity of all providers in the location.
While filial obligations and social norms are a strong deterrent for formal eldercare use in Georgia (see
more detail in section ‘Demand for Eldercare’), urban participants from the FGDs indicated being aware
of existing senior homes in Tbilisi and its location. Participants do not seem to be aware of public eldercare
facilities that are free of charge and instead referred to senior homes that charge a fee that in most cases
is covered from the client’s pension. Participants voiced difficulties from senior homes in allocating all
elders who demand living in such facilities, even if the elder or the elder’s family are willing and able to
39 The largest share of home care services is delivered by nonprofit organizations such as Caritas and the Red Cross, using a mix
of professionals and trained volunteers (UNECE 2015).

32
pay for the service. Moreover, some participants indicated the lack of eldercare services was a bigger
problem than the issue of affordability. Yet, there is concern regarding the cost of private services that in
general are more expensive.
Human resources are the main challenge for quality provision of eldercare As with childcare, a principal component analysis was used to create a quality index for eldercare services.
In this case, the index comprises four equally weighted quality subindicators. Subindexes and the overall
scores were standardized to a scale between 0 and 100. The quality sub-indicators include (a)
infrastructure and safety, which comprises 24 variables such as whether the space is in good repair and if
there is no malodor in the spaces or whether clinical mattresses or beds are available; (b) schedule,
activities, and materials, which includes 16 indicators such as whether care recipients are served food and
whether there are visiting hours for family members; (c) human resources, which includes 8 indicators of
caregivers’ credentials and qualifications, training, typical length of time that caregivers stay working at
the center, and the ratio of elders to caregivers, among others; and (d) special needs, health care, and
support, which includes 14 indicators such as whether there are special services for elders with dementia
and whether routine medical care is available. (Full details of the subindexes can be found in Annex 2.)
Estimates derived from the visit to existing centers suggest that Georgia’s overall quality index is close to
the average of countries participating in the 2014 wave and inferior than its neighbor Armenia (Figure
18).40 Particularly, the human resources component appears to be the weakest one as is the case in the
visited centers in all other countries.
Figure 18: Eldercare Center Quality Index
Source: Authors’ calculations based on fieldwork data: collection year 2017 for Georgia and 2014 for rest of the countries. Note: Scale of the score is 0 to 100. Western Balkans includes Serbia, Bosnia and Herzegovina, Kosovo, and FYR Macedonia.
40 Caution needs to be used when interpreting these results, as the sample used for these estimates is small and by no means
representative of either country.
0
10
20
30
40
50
60
70
80
90
100
Overall Quality HumanResources
Infrastructure& Safety
Schedule,Activities, and
MaterialsQuality
Special needs,Healthcare,and Support
Quality
Val
ue
of
ind
ex Georgia (2017)
Armenia (2014)
Kyrgyz Republic (2014)
Ukraine (2014)
Western Balkans (2014)

33
Cost of eldercare Overall, information on prices of eldercare is very limited. Of the sampled eldercare providers in Georgia,
56 percent indicated providing services at no cost, which include a mix of all public and some nonprofit
facilities. Of those that charge a fee, 75 percent grant price flexibilities for certain services, individuals, or
families. As seen from Figure 19, several of the most basic services provided to elders in eldercare centers
such as physical therapy, organized activities, and transportation to/from center come at extra charge.
Figure 19: Services Provided to the Elders Without Extra Charge
Source: Authors’ calculations based on fieldwork data (2017).
Affordability of care services, particularly of home-based care, also seems to have an influence on the
decisions to use a particular form of care as well as household division of labor. The FGD participants
indicated that lack of financial resources prevents families from using various types of eldercare services.
Some participants explained that where center-based formal care is unaffordable, for many households
the provision of informal care and in-home division of labor remains as the only options.
Demand for Eldercare
Filial obligations and social norms are strong deterrents for use of formal eldercare, particularly residential care
Social norms and perceptions regarding the role of adult children in the care of their aging parents is one
of the main factors determining demand for eldercare services in Georgia—as well as in most of the
countries included in the previous wave (2014) of the study. The FGDs evidence that informal care is the
preferred format to care for the elderly; moreover, data from interviews show that a clear majority of
households (99 percent) use informal care (household members, relatives, and friends). No household
reported using a combination of formal and informal care and a small share of households (1 percent)
utilized formal care.
Caring for the elderly at home by family members is viewed as an obligation as well as the most
0 20 40 60 80 100
Room/stay
Food
Professional Staff
Medications
Physical Therapy
Other medical controls
Organized activities
Laundry
Room maintenance
Use of water and electricity
Transportation to/from center
% respondents offering service

34
appropriate way of helping their aging loved ones to live out their remaining years in comfort, health,
peace, and dignity, in the companionship of their loved ones. The profiles of interviewees show that 94
percent of participants expressed agreement with the statement “Children should have their parents to
live with them when parents can no longer look after themselves”, and this is true among men and
women. Moreover, the FGD also suggests that this is both due to social norms that emphasize filial
obligations and the belief that the care needs of the elders (social-emotional needs, companionship,
medical assistance needs, and basic day-to-day needs such as house chores, self-care, and security) can
be best met at home by relatives compared with current provision of services.
“(…) none of the parents would want to go to the boarding house; can you imagine how hard they worked all their life, built a house, and invested in the house all they earned?... and now, you take them to the boarding house because they are old?! It is not fair!” (Man in small town in Georgia) “I would not be able to take my elderly there [boarding house], who will take care of them like I will?” (Woman in rural area of Georgia)
Regarding the gender of the offspring playing the role of parental caregiver during old age in Georgia, the
profiles of interviewees suggest that it is most likely that the daughter, the daughter-in-law, or a close
female relative (mother, mother-in-law, or sister of respondent caring for an elderly) would fulfill the time
requirements for care tasks. From the interviews, 90 percent of households where eldercare was provided
or received had a female caregiver. This percentage is consistent with estimates observed in other
countries, although it is smaller than in Armenia (97 percent).
“My husband and I take care of my mother-in-law; she is his mother which means he is more involved… I am a woman and I have to do everything in the house [housework, care responsibilities] and if I am busy, my husband does my job.” (Woman in peri-urban area of Georgia)
There is a 30 percent of interviewed participants who agreed with the statement “When parents are in
need, daughters should take more caring responsibilities than sons”, with more women (32 percent of
them) than men (17 percent) expressing agreement (Figure 20). The high percentage of those who
disagreed or were indifferent with the statement could be attributed to patriarchal structures present in
the South Caucasus and Asia in which sons will support parents in their old age, while daughters will leave
their parents at marriage to invest their labor in their husband’s family (rather than their parents). (Das
Gupta 2015; Das Gupta et al. 2003; Dudwick 2015). In fact, the profile of interviewees shows that a higher
share of men than women expressed disagreement with the statement (58 vs. 43 percent).
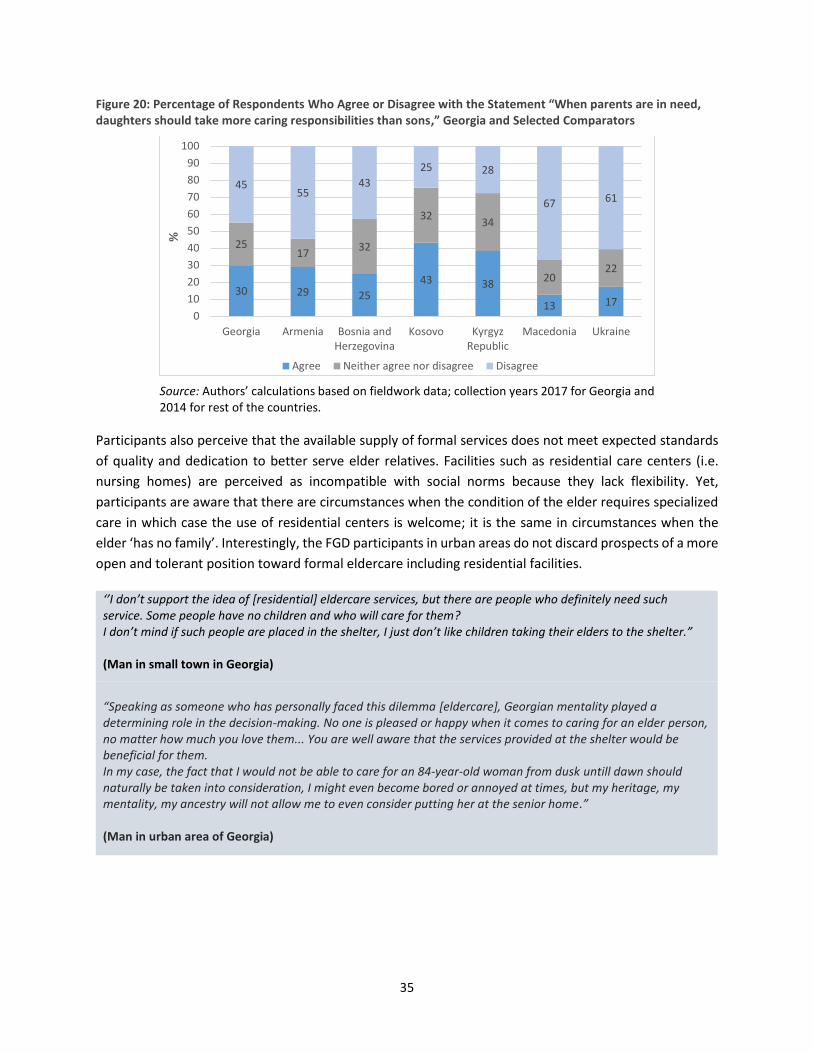
35
Figure 20: Percentage of Respondents Who Agree or Disagree with the Statement “When parents are in need, daughters should take more caring responsibilities than sons,” Georgia and Selected Comparators
Source: Authors’ calculations based on fieldwork data; collection years 2017 for Georgia and 2014 for rest of the countries.
Participants also perceive that the available supply of formal services does not meet expected standards
of quality and dedication to better serve elder relatives. Facilities such as residential care centers (i.e.
nursing homes) are perceived as incompatible with social norms because they lack flexibility. Yet,
participants are aware that there are circumstances when the condition of the elder requires specialized
care in which case the use of residential centers is welcome; it is the same in circumstances when the
elder ‘has no family’. Interestingly, the FGD participants in urban areas do not discard prospects of a more
open and tolerant position toward formal eldercare including residential facilities.
‘’I don’t support the idea of [residential] eldercare services, but there are people who definitely need such service. Some people have no children and who will care for them? I don’t mind if such people are placed in the shelter, I just don’t like children taking their elders to the shelter.” (Man in small town in Georgia)
“Speaking as someone who has personally faced this dilemma [eldercare], Georgian mentality played a determining role in the decision-making. No one is pleased or happy when it comes to caring for an elder person, no matter how much you love them... You are well aware that the services provided at the shelter would be beneficial for them. In my case, the fact that I would not be able to care for an 84-year-old woman from dusk untill dawn should naturally be taken into consideration, I might even become bored or annoyed at times, but my heritage, my mentality, my ancestry will not allow me to even consider putting her at the senior home.” (Man in urban area of Georgia)
30 29 25
43 38
13 17
2517
32
3234
2022
4555
43
25 28
67 61
0
10
20
30
40
50
60
70
80
90
100
Georgia Armenia Bosnia andHerzegovina
Kosovo KyrgyzRepublic
Macedonia Ukraine
%
Agree Neither agree nor disagree Disagree
36
Daycare centers and home-based formal eldercare formats are more compatible with social norms
Across all the FGDs, participants expressed the need for more flexible care arrangements such as on-call
care, home-based care (for example, nurses), and daycare facilities. These more flexible formats are
viewed positively by Georgians, as they are seen to be more compatible with the norms that emphasize
the well-being of the elderly. Participants mentioned difficulties to find caregivers willing to work with
elders at home, even if it it was only for a few hours, so that family members could free some time to
attend different matters. With more daycare facilities available, elders could spend the day there and
come back home later during the day without families feeling that they are ‘abandoning’ their elders.
Respondents stated that it would be ideal if such daycares provide medical services as well. In any case,
flexible formal arrangements of eldercare are always perceived as ‘complementary’ to the informal at-
home care.
“My father-in-law had a stroke, he is 58 and his wife is abroad, I could not take care of him (…) we had to change the diaper (…) I asked everyone around if they knew a person who could help with this and then the neighbour told me about the centre. This service costs about GEL 20–25 per day. I did not need it all day, I just needed someone who will come to the house when you need them.” (Woman in urban area of Georgia) “[Family member] does not need a caretaker yet, at least in terms of hygiene maintenance. Still, I don’t think I would be able to provide such care if the need comes, it is an extremely challenging job, especially for a man. So, I suppose I will have to hire a caretaker if necessary.” (Man in urban area of Georgia)
Perceptions regarding the needs and benefits of formal eldercare services are limited in comparison to
formal childcare. Some of the few benefits formal non-family eldercare arrangements mentioned during
these discussions included (a) companionship (as formal daycare centers could provide spaces for
socialization, meeting their companionship needs during the day), (b) overall support for elderly people
with no relatives available to care for them, and (c) support for caregivers by using regular free home-
based services provided by nongovernmental organizations or social services (lightening the burden of
care on informal caregivers or providing regular support for the elderly with no social support and
improving the quality of care received by elders).
Given the limited supply of formal eldercare services, many of these ideas were largely suggestions that
participants projected to improve the condition of many elderly people. In addition, it is understood that
accessibility to such services could be limited and feasible for those who are willing/able to pay for it.
An obvious effect of Georgia’s changing demographics, typical of many other countries in Eastern Europe
and Central Asia, is that the population is aging quickly. This has important implications regarding
eldercare responsibilities: they will be rising, as shown by the proxy of old age dependency ratio (Figure

37
21). Furthermore, these responsibilities are commonly delegated to women, constraining even further
their participation in the labor market during their most productive years of life.41 This issue becomes
even more complicated, as eldercare duties, in contrast with childcare responsibilities, are more
unpredictable regarding the timing, duration, and intensity of the potential care needed (Keck and
Saraceno 2009).
Figure 21: Population Estimates, Young and Old Age Dependency Ratio Projections in Georgia
Source: Authors’ estimation based on World Development Indicators (2018). Note: The young age dependency ratio is defined as the proportion of the population 0 to 14 compared to the working-age population (15–64 years). The old age dependency ratio is defined as the proportion of the population 65 years and above divided by the working-age population.
Conclusions and Policy Recommendations
Georgia needs to increase labor participation among men and women alike and capitalize the investments
of valuable resources in education of a large group of young women by implementing policies to help
balance care and work responsibilities. Women’s lagging participation in employment and
entrepreneurship represents a misallocation of Georgia’s human resource potential. Calculations suggest
that these gaps in labor market activity result in a loss in economic output equivalent to 11 percent of
gross domestic product (Cuberes and Teignier 2016b).
Policy efforts for adequate job creation need to be accompanied by policies addressing care needs.
Women tend to reduce their labor supply on either the extensive or intensive margin when market,
normative, and institutional forces push them toward fulfilling their caregiving mandate in the household.
Career interruptions or reductions in work hours can have a permanent negative impact on women’s
41 Albertini, Kohli, and Vogel (2007) document that the largest amount of intergenerational time transfers is delivered during
the adult children’s middle-aged years (45–65 years) to both the younger and older generations within the family.
0
0.05
0.1
0.15
0.2
0.25
0.3
0.35
0
400
800
1200
1600
0-14 15-64 65+ 0-14 15-64 65+ 0-14 15-64 65+
2018 2025 2035
Dep
end
ency
Rat
io
Po
pu
lati
on
, th
ou
san
ds
Women MenYoung age dependency ratio Old age dependency ratioPoly. (Young age dependency ratio) Poly. (Old age dependency ratio)

38
lifetime income, affecting their households’ current living standards and human capital investments as
well as future well-being due to reduced pension wealth and damaged health.
Given the current demographic situation of Georgia, meeting the challenge of rising care burden is
essential to ensure economic growth and poverty reduction. The expansion of formal care services can
present a double benefit for the population: A well-developed childcare sector not only helps generating
economic participation opportunities for women but also implies potential improvements in the school
readiness for children through better coverage of early childhood education; this, in turn, can translate
into higher human capital accumulation, which is vital for sustaining economic growth. Similarly, quality
provision of formal eldercare can potentially improve health outcomes of the elderly through prevention,
early detection, and consistent maintenance of chronic diseases, which may imply long-term cost savings
in the health care sector.
Policy designs should also consider the potential demographic implications and the unintentional
potential effects on informal care providers’ educational, reproductive, and health investment decisions.
As Georgia’s demographic changes follow the same aging population path as the rest of the Eastern
Europe and Central Asia region, it is important to keep in mind that the care burden that women face also
affects their long-term financial decisions and their fertility and human capital investment decisions.
These decisions too have direct consequences on the country’s ability to achieve sustainable growth or
reduce poverty, as women withdraw themselves from the labor market to fulfill their informal care
responsibilities and delay or stop childbearing, reducing the pool of potential future workers.
Current challenges with regard to supply and demand of childcare and eldercare services are summarized
in five salient points: (a) limited availability of affordable services, including a primary focus on older
children, that underlies the relatively low coverage and overcrowding of formal childcare institutions; (b)
latent demand of formal childcare services that is voiced predominantly by parents perceiving benefits
for child’s development and need of support for working (or willing-to-work) mothers; (c) social norms
that act as a strong deterrent for use of residential eldercare while use of daycare centers and home-
based formats—if available—would be more compatible with prevailing standards; and (e) the main
challenges of the existing supply in terms of quality—an important factor for potential users of formal
care services—involve mainly human resources for both childcare and eldercare services.
In terms of childcare, comprehensive policies that target both the supply and availability of affordable and
quality services, particularly for women who have potential to join the labor market, are expected and
likely to have a high employment impact. While the abolition of fees in public early and preschool
institutions has made these services affordable, it has come at the expense of quality and infrastructure
capacity of the provision of services. Early childhood education and care services need to be provided at
reasonable quality standards to be more widely available at more affordable costs and be utilized by more
women and children. A viable alternative is a neighborhood program—made widely available through
public or private subsidized provision and based on the expectations of mothers and fathers. The
implementation of a national system for pre- and in-service training of educators and caregivers is
essential.

39
Regarding eldercare, evidence suggests prioritization of daycare provision and at-home support policies
over institutionalization and long-term care in medical institutions. At-home systems of elderly care and
treatment make it essential to have efficient, professional workers capable of working with elderly people
and their families. Government investment in training programs for staff working in elderly care is
essential to ensure high standards.
Crucial elements in the design of care systems for successful achievement of intended impacts are the
gender neutrality in financing and service characteristics tailored to address constraints related to labor
market participation. To avoid unintended effects such as increasing gender gaps in labor outcomes or
having low take-up of care facilities, the design and implementation of care programs will require (a)
avoiding differential costs in hiring and employing women and men—for example, mandated benefits that
imply for employers’ higher costs of employing a woman versus a man—and (b) providing flexibility with
regard to service characteristics (hours of operation, year-round service, and so on) to respond to working
women and family needs.
40
References
Albertini, M., M. Kohli, and C. Vogel. 2007. “Intergenerational Transfers of Time and Money in European Families: Common Patterns, Different Regimes?” Journal of European Social Policy 17 (4): 319–334.
Asai, Y., R. Kambayashi, and S. Yamaguchi. 2014. “Childcare Availability, Household Structure, and Maternal Employment.” Discussion Paper Series A, No. 611, Institute of Economic Research, Tokyo.
Attanasio, O., and M. Vera-Hernandez. 2004. “Medium and Long Run Effects of Nutrition and Child Care: Evaluation of a Community Nursery Programme in Rural Colombia.” Centre for the Evaluation of Development Policies. Working Paper 04/06, The Institute for Fiscal Studies, London.
Becker, G. S. 1985. “Human Capital, Effort, and the Sexual Division of Labor.” Journal of Labor Economics 17 (3): S33–S58.
Behrman, J. R., and B. L. Wolfe. 1984. “Labor Force Participation and Earnings Determinants for Women in the Special Conditions of Developing Countries.” Journal of Development Economics 15 (1): 259–288.
Berlinski, S., and S. Galiani. 2007 “The Effect of a Large Expansion of Pre-Primary School Facilities on Preschool Attendance and Maternal Employment.” Labour Economics 14: 665–80.
Bolin, K., B. Lindgren, and P. Lundborg. 2008. “Your Next of Kin or Your Own Career? Caring and Working Among the 50+ of Europe.” Journal of Health Economics 27 (3): 718–738.
Calderon, Gabriela. 2014. “The Effects of Child Care Provision in Mexico.” Working Papers 2014-07, Banco de Mexico.
Carmichael, F., and S. Charles. 1998. “The Labour Market Costs of Community Care.” Journal of Health Economics 17: 747–765.
Correll, S. J., S. Benard, and I. Paik. 2007. “Is There a Motherhood Penalty?” American Journal of Sociology 112 (5): 1297–1339.
Cuberes, D., and M. Teignier. 2016a. “Aggregate Effects of Gender Gaps in the Labor Market: A Quantitative Estimate.” Journal of Human Capital 10 (1): 1–32
–––––––. 2016b. “How Important Are Labor Market Gender Gaps in the South Caucasus?” Paper prepared for the “FY16 South Caucasus Gender Assessment Program.”
Del Boca, D., and M. Locatelli. 2006. “The Determinants of Motherhood and Work Status: A Survey.” IZA Discussion Papers 2414, Institute for the Study of Labor (IZA).
Deutsch, R. 1998. Does Child Care Pay? Labor Force Participation and Earning Effects of Access to Child Care in the Favelas of Rio de Janeiro. Washington, DC: Inter-American Development Bank.
Fong, M., and M. Lokshin. 2000. “Child Care and Women’s labor Force Participation in Romania.” Policy Research Working Papers 2400, World Bank.
Gabriele, S., P. Tanda, and F. Tediosi. 2011. The Impact of Long-Term Care on Caregivers’ Participation in the Labour Market. ENEPRI Research Report No. 98.
Geyer, Johannes, and Thorben Korfhage. 2014. “Long-term Care Insurance and Carers’ Labor Supply: A Structural Model.” Discussion Papers of DIW Berlin 1421, DIW Berlin, German Institute for Economic Research.
Heger, Dorte. 2014. “Work and Well-Being of Informal Caregivers in Europe.” Ruhr Economic Paper 512, Rhine-Westphalia Institute for Economic Research.
Heitmueller, A., and K. Inglis. 2007. “The Earnings of Informal Care: Wage Differentials of Opportunity Costs.” Journal of Health Economics 26 (4): 821–41.
Henz, U. 2006. “Informal Caregiving at Working Age: Effects of Job Characteristics and Family
41
Configurations.” Journal of Marriage and Family 68: 411–429. Herlofson, K., G. Hagestad, B. Slagsvold, and A. Sørensen. 2011. “Intergenerational Family Responsibility
and Solidarity in Europe.” Norwegian Social Research (NOVA). Illya State University. 2015. “Healthcare Policy and Insurance.” Jaumotte, F. 2003. “Labour Force Participation of Women: Empirical Evidence on the Role of Policy and
Other Determinants in OECD Countries.” OECD Working Paper No.37. Jacobs, J. C., A. Laporte, C. H. Van Houtven, and P. C. Coyte. 2014. “Caregiving Intensity and Retirement
Status in Canada.” Social Science & Medicine 102 (February): 74–82. Johnson, R.W., and A.T. Lo Sasso. 2000. “The Trade-Off between Hours of Paid Employment and Time
Assistance to Elderly Parents at Midlife.” Research Report, The Urban Institute. Krauss, M., M. Riedel, E. Mot, P. Willeme, G. Rohrling, and T. Czpionka. 2010. “A Typology of Systems of
Long-Term Care in Europe.” ANCIEN Project, Research Institute for Advanced Studies, Vienna. Keck, W., and C. Saraceno. 2009. “Balancing Elderly Care and Employment in Germany.” Discussion Paper,
No. SP I 2009-401, Wissenschaftszentrum Berlin fur Sozialforschung (WZB), Research Professorship Demographic Development, Social Change, and Social Capital.
Lefebvre, P., and P. Merrigan. 2008. “Child-Care Policy and the Labor Supply of Mothers with Young Children: A Natural Experiment from Canada.” Journal of Labor Economics 26 (3): 519–548.
Lilly, M. B., A. Laporte, and P. C. Coyte. 2010. “Do They Care Too Much to Work? The Influence of Caregiving Intensity on the Labour Force Participation of Unpaid Caregivers in Canada.” Journal of Health Economics 29 (6): 895–903.
Loken, K. V., S. Lundberg, and J. Riise. 2014. “Lifting the Burden: State Care of the Elderly and Labor Supply of Adult Children.” IZA Discussion Papers 8267, Institute for the Study of Labor.
Lokshin, M. 2000. Household Childcare Choices and Women's Work Behavior in Russia. Washington, DC: World Bank.
Luci-Greulich, A., and O. Thevenon. 2013. “The Impact of Family Policies on Fertility Trends in Developed Countries.” European Journal of Population 29 (4): 387–416.
OECD (Organisation for Economic Co-operation and Development). 2011. “Public Long-term Care Financing Arrangements in OECD Countries.” In Help Wanted? Providing and Paying for Long-Term Care.” Providing and Paying for Long-Term Care. Chapter 7. OECD Publishing, Paris.
Paes de Barros, R., P. Olinto, T. Lunde, and M. Carvalho. 2011. The Impact of Access to Free Childcare on Women’s Labor Market Outcomes: Evidence from a Randomized Trial in Low-Income Neighborhoods in Rio de Janeiro. enGender Impact: World Bank’s Gender Impact Evaluation Database. Washington, DC: World Bank.
Ribar, D. 1995. “A Structural Model of Child Care and the Labor Supply of Married Women”. Journal of Labor Economics 13 (3): 558-597.
Sarasa, S. 2006. “The Women’s Conciliation of Adult Care and Employment in Different Welfare Regimes.” Paper presented at Equalsoc/Employ_Famnet Workshop, January 27, Torino.
Spiess, K., and U. Schneider. 2003. “Interactions between Care-Giving and Paid Work Hours among European Midlife Women, 1994 to 1996” Ageing and Society 23 (1): 41–68.
Todd, P. E. 2013. “How to Improve Women's Employability and Quality of Work in Developing and Transition Economies.” United Nations Foundation.
UNECE. 2015. Road Map for Mainstreaming Ageing. Georgia. United Nations, Geneva. United Nations Publication https://www.unece.org/population/paupubwelcome/ageing/2015/roadmapformainstreamingageingingeorgia/docs.html
UNESCO. 2015. “Education for All. National Review 2015. Georgia.” UNICEF (United Nations Children's Fund). 2014. “Data Collection for Early Learning and Child Protection
in Georgia. Preschool Census.” Tbilisi.
42
http://unicef.ge/uploads/UNICEF_Preschool_Census_ENG_FINAL.PDF –––––––. 2018. “Study on Quality of Early Childhood Education and Care in Georgia. Summary.” Tbilisi. http://unicef.ge/uploads/Pre-school_quality_study-eng-2018.pdf Viitanen, Tarja. 2007. “Informal and Formal Care in Europe.” Working Papers 2007010, The University of
Sheffield, Department of Economics. World Bank. 2015. Europe and Central Asia - Why should we care about care? The role of informal childcare
and eldercare in aging societies in the ECA region. Washington, DC: World Bank Group. http://documents.worldbank.org/curated/en/687741468257352228/Europe-and-Central-Asia-Why-should-we-care-about-care-the-role-of-informal-childcare-and-eldercare-in-aging-societies-in-the-ECA-region
–––––––. 2015. Why should we care about care? The role of childcare and eldercare in former Yugoslav Republic of Macedonia. Washington, D.C.: World Bank Group.
–––––––. 2015. Why Should We Care about Care? The Role of Childcare and Eldercare in Kosovo. Washington, D.C.: World Bank Group.
–––––––. 2015. Why should we care about care? The role of childcare and eldercare in Bosnia and Herzegovina (English). Washington, D.C.: World Bank Group.
–––––––. 2015. Supply and Demand for Child Care Services in Turkey: A Mixed Methods Study. Washington, DC: World Bank Group.
–––––––. 2016. Why Should We Care about Care? The Role of Childcare and Eldercare in Serbia. Washington, D.C.: World Bank Group.
–––––––. 2016. Georgia Country Gender Assessment. Washington, DC: World Bank. https://openknowledge.worldbank.org/handle/10986/26091
–––––––. 2018. Georgia - Systematic Country Diagnostic: From Reformer to Performer. Washington, DC: World Bank Group.
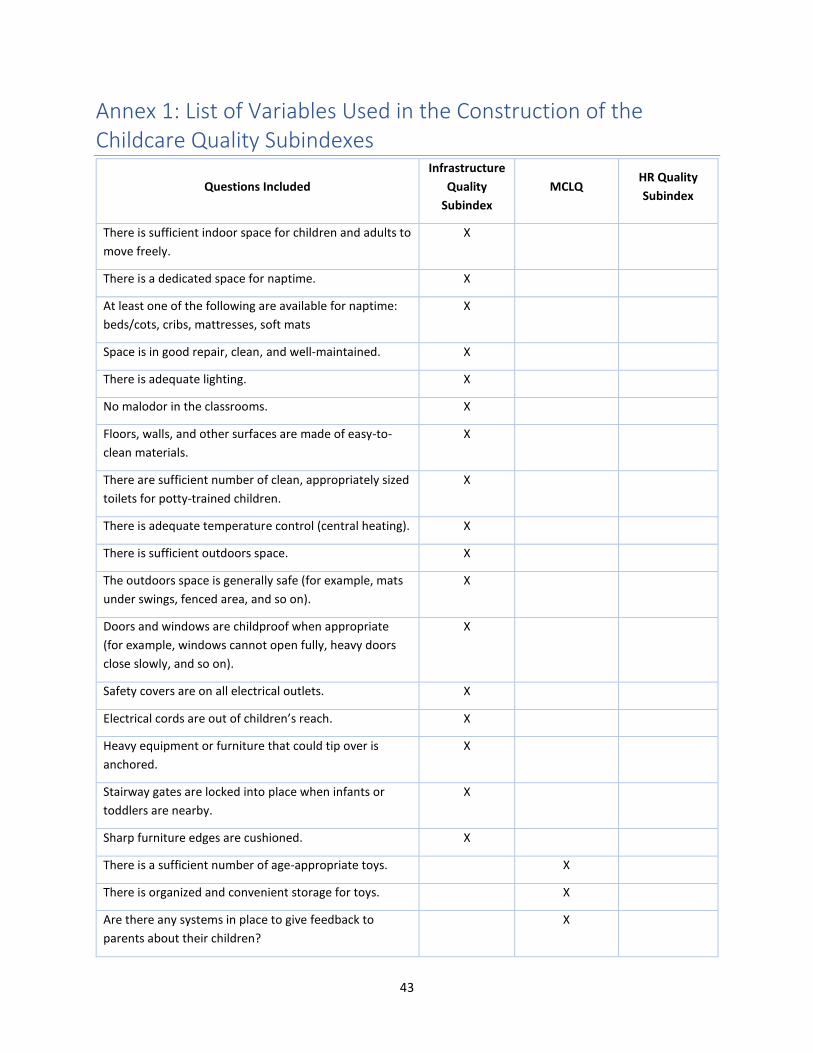
43
Annex 1: List of Variables Used in the Construction of the Childcare Quality Subindexes
Questions Included
Infrastructure
Quality
Subindex
MCLQ HR Quality
Subindex
There is sufficient indoor space for children and adults to
move freely.
X
There is a dedicated space for naptime. X
At least one of the following are available for naptime:
beds/cots, cribs, mattresses, soft mats
X
Space is in good repair, clean, and well-maintained. X
There is adequate lighting. X
No malodor in the classrooms. X
Floors, walls, and other surfaces are made of easy-to-
clean materials.
X
There are sufficient number of clean, appropriately sized
toilets for potty-trained children.
X
There is adequate temperature control (central heating). X
There is sufficient outdoors space. X
The outdoors space is generally safe (for example, mats
under swings, fenced area, and so on).
X
Doors and windows are childproof when appropriate
(for example, windows cannot open fully, heavy doors
close slowly, and so on).
X
Safety covers are on all electrical outlets. X
Electrical cords are out of children’s reach. X
Heavy equipment or furniture that could tip over is
anchored.
X
Stairway gates are locked into place when infants or
toddlers are nearby.
X
Sharp furniture edges are cushioned. X
There is a sufficient number of age-appropriate toys.
X
There is organized and convenient storage for toys.
X
Are there any systems in place to give feedback to
parents about their children?
X

44
Questions Included
Infrastructure
Quality
Subindex
MCLQ HR Quality
Subindex
Are there any systems in place to receive feedback from
parents?
X
Are there opportunities and provisions for parents to
present and discuss additional needs?
X
Is there a daily routine?
X
Are children served food?
X
Are there provisions for children with special needs?
X
Whether caregivers’ minimum credentials include higher
school or university degree.
X
Whether the typical length of time that caregivers stay
working at the provider is five or more years.
X
Caregiver to pupil ratio.
X
Is a small group of children primarily cared for by one
designated staff member?
X

45
Annex 2: List of Variables Used in the Construction of the Eldercare Quality Subindexes
Questions Included
Infrastructure
and Safety
Quality
Subindex
Schedule,
Activities,
and
Materials
Quality
Subindex
HR
Quality
Subindex
Special
Needs,
Health Care,
and Support
Quality
Subindex
There is sufficient indoor space for elders and
caregivers to move freely.
X
Space allows for privacy when desired. X
Is there a dedicated space for naptime? X
What is the quality of the bedrooms? Please take
into account cleanliness, lighting, ventilation,
temperature, absence of unpleasant odors,
comfort, quantity and quality of furniture, safety,
and privacy.
X
Space is in good repair, clean, and well-maintained. X
There is adequate lighting. X
The facilities do not have unpleasant odors. X
Floors are smooth and have nonskid surfaces. Rugs
are skidproof.
X
There are clean toilets for staff members and
elders.
X
There is adequate temperature control. X
There is outdoors space for elders to use. X
The outdoors space is generally safe (for example,
mats under swings, fenced area, and so on).
X
Walls and ceilings have no peeling paint, have no
cracked or falling plaster, and are free of crumbling
asbestos.
X
Cords and electrical elements are in good condition
and do not present a hazard to elders.
X
Heavy equipment or furniture that could tip over is
anchored.
X

46
Questions Included
Infrastructure
and Safety
Quality
Subindex
Schedule,
Activities,
and
Materials
Quality
Subindex
HR
Quality
Subindex
Special
Needs,
Health Care,
and Support
Quality
Subindex
Doorways to unsupervised or unsafe areas are
closed and locked unless the doors are used for
emergency exits.
X
The facilities feel comfortable and nurturing. X
Do elders sleep in individual or shared bedrooms? X
Who provides the furniture for the bedrooms? X
Are clinical mattress and bed available if needed? X
Do elders use individual or shared bathrooms? X
What are families required to provide for their
elders?
X
Are there standards and regulations that pertain to
safety?
X
Do your safety policies and procedures meet these
standards and regulations?
X
For each of the following activities, please check
whether it is a frequent part of the elders’ activities,
happens on a limited basis, or is not allowed.
X
There is a sufficient number of mentally stimulating
materials, such as chess sets.
X
There is organized and convenient storage for
materials, such as books and games.
X
Are there any systems in place to give feedback to
families about their elders?
X
Are there any systems in place to receive familial
feedback?
X
Are there opportunities and provisions for families
to present and discuss additional needs?
X
Is there a daily schedule?
X
Are elders served food?
X
When are elders served food?
X

47
Questions Included
Infrastructure
and Safety
Quality
Subindex
Schedule,
Activities,
and
Materials
Quality
Subindex
HR
Quality
Subindex
Special
Needs,
Health Care,
and Support
Quality
Subindex
Where is the elders’ food prepared?
X
Does the food follow nutrition and health standards
and regulations?
X
Does the food follow hygiene and cleanliness
standards and regulations?
X
Does the food follow other relevant standards and
regulations?
X
Is there a set procedure around elders’ first-time
arrival?
X
Is there a set procedure to prepare for elders’
departure (moving out or death)?
X
Are there visiting hours for family members?
X
What are the caregivers’ credentials and
qualifications? (include minimum required)
X
What is the typical length of time that caregivers
stay working at [service provider]?
X
What is the current ratio of caregivers to elders?
X
Are elders organized into groups?
X
Do staff members make an effort to ensure that
elders feel respected?
X
Are there opportunities for continued education,
training, and professional development for current
caregivers?
X
What is the typical contract type for caregivers?
X
On what basis are caregivers evaluated?
X
Space is accessible for persons with disabilities
X
Protected access to stairs and facilities allow for
limited mobility elders to circulate (that is, those
using wheelchairs, walkers, and so on).
X
Are there provisions for special needs?
X
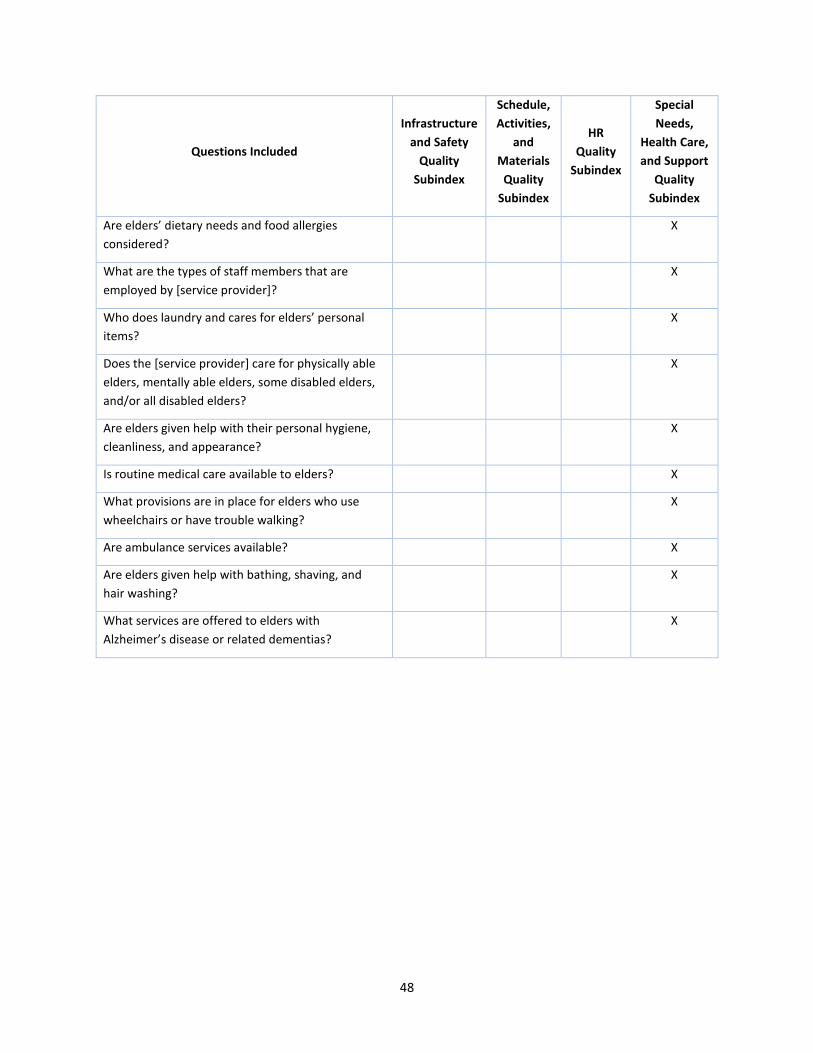
48
Questions Included
Infrastructure
and Safety
Quality
Subindex
Schedule,
Activities,
and
Materials
Quality
Subindex
HR
Quality
Subindex
Special
Needs,
Health Care,
and Support
Quality
Subindex
Are elders’ dietary needs and food allergies
considered?
X
What are the types of staff members that are
employed by [service provider]?
X
Who does laundry and cares for elders’ personal
items?
X
Does the [service provider] care for physically able
elders, mentally able elders, some disabled elders,
and/or all disabled elders?
X
Are elders given help with their personal hygiene,
cleanliness, and appearance?
X
Is routine medical care available to elders?
X
What provisions are in place for elders who use
wheelchairs or have trouble walking?
X
Are ambulance services available?
X
Are elders given help with bathing, shaving, and
hair washing?
X
What services are offered to elders with
Alzheimer’s disease or related dementias?
X


