
Wind waves and sediments
Calm
Stephen MonismithJeremy Bricker, Satoshi Inagaki, and Nicole Jones
Stanford University
Windy
Supported by UPS Foundation and CALFED ERP

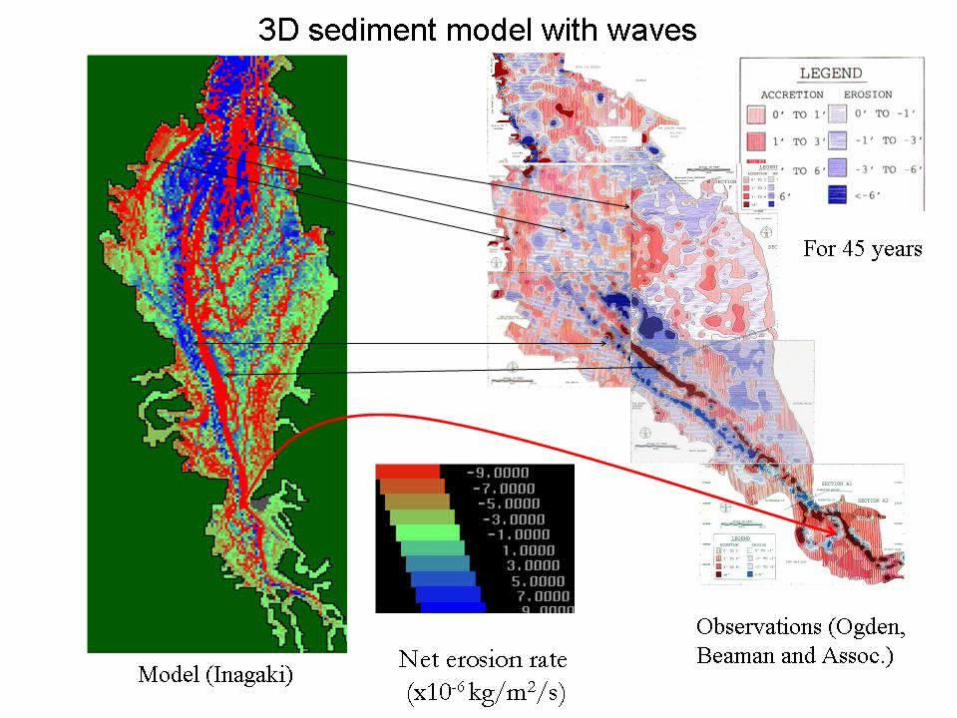
Sediment model (ca. 1999)
• TRIM3D - Casulli code as modifed by Ed Gross - calibrated for Winter/Spring 1995
• Sediment model = 3D transport + standard cohesive sediment model (Inagaki and Bricker)
• Use Krone’s (1962) values for sediment model parameters (Erodability etc.)
• (for seds) Increase bed stress to min. drag coeff. value
• (for seds) Include wave friction factor in bed stress calculation
• Waves modeled using USACE Shore Protection Manual

(kg/m3)
Tide Only
Waves:H=0.6m T=2.8s
Effects of waves on computed concentrations (1 m below
MLLW)
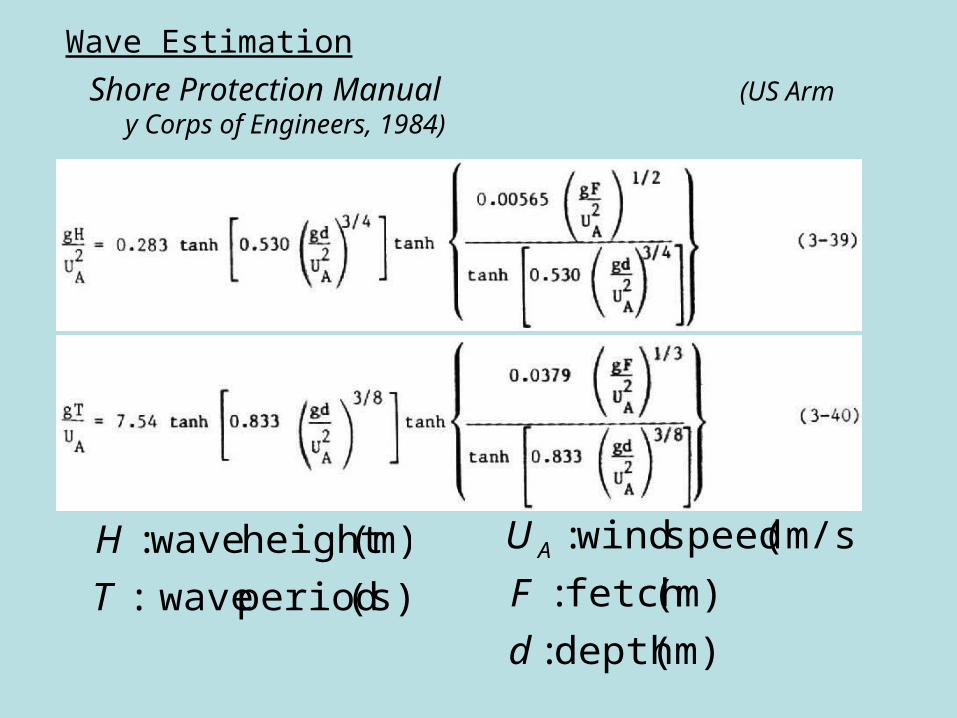
Wave Estimation
Shore Protection Manual (US Army Corps of Engineers, 1984)
(s) period wave:
(m)height wave:
T
H
(m) depth :
(m) fetch :
(m/s) speed wind:
d
F
U A

Wave Estimation
Fetch
SF PORTS winds Wind from W
Winds
+
N
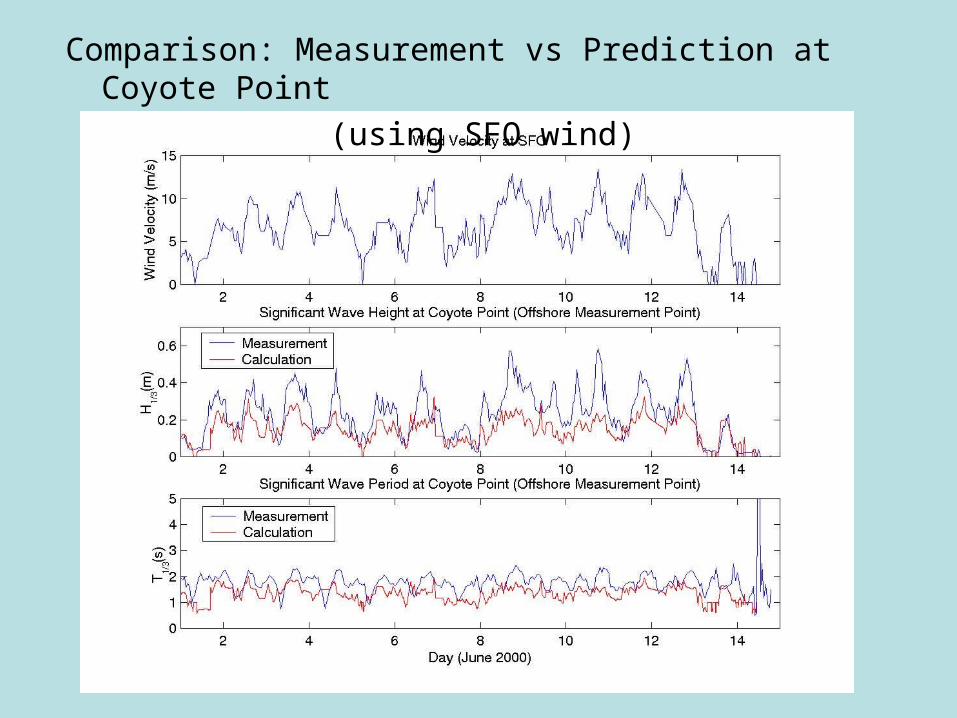
Comparison: Measurement vs Prediction at Coyote Point
(using SFO wind)
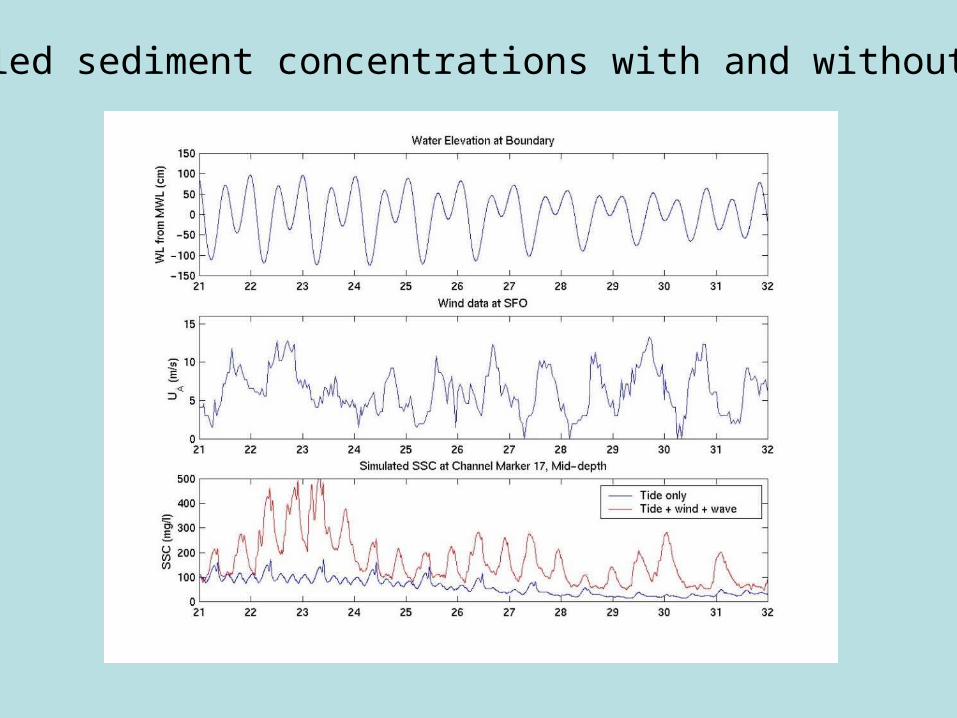
Modeled sediment concentrations with and without winds

Effect of more realistic waves
(kg/m3)
From 4/19/1993, 6 days
Suspended sediment concetration at 1m below MLLW
hindcast with tides, winds, and waves
Two wave models
QuickTime™ and a decompressor
are needed to see this picture.
QuickTime™ and a decompressor
are needed to see this picture.
Shore Protection SWAN (Bricker)
QuickTime™ and a decompressor
are needed to see this picture.
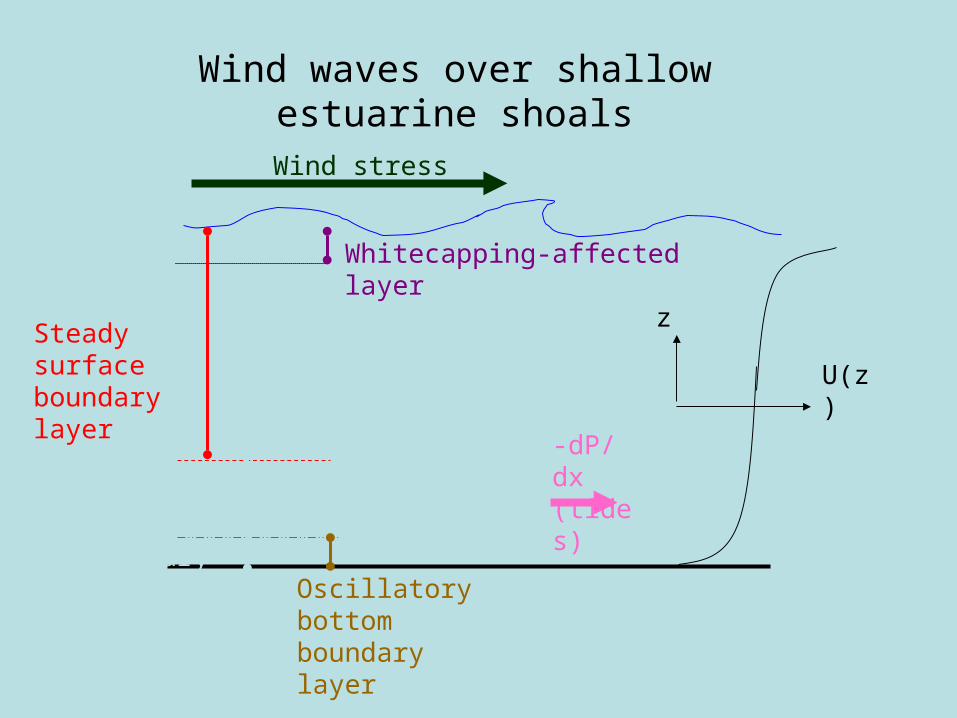
Wind waves over shallow estuarine shoals
Steady bottomboundary layer
Steady surface boundary layer
Whitecapping-affected layer
Wind stress
z
U(z)
-dP/dx(tides)
Oscillatory bottom boundary layer
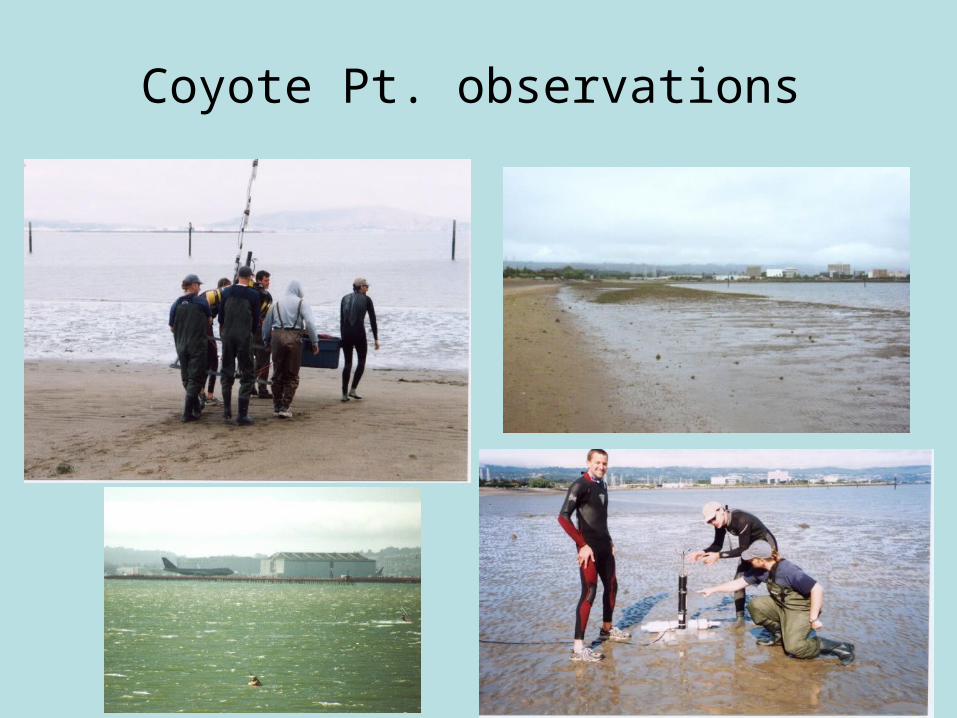
Coyote Pt. observations

Tidal stage and sea state at Coyote Point, June-July 2002

Conditions at Coyote Point, June-July 2002
QuickTime™ and a decompressor
are needed to see this picture.
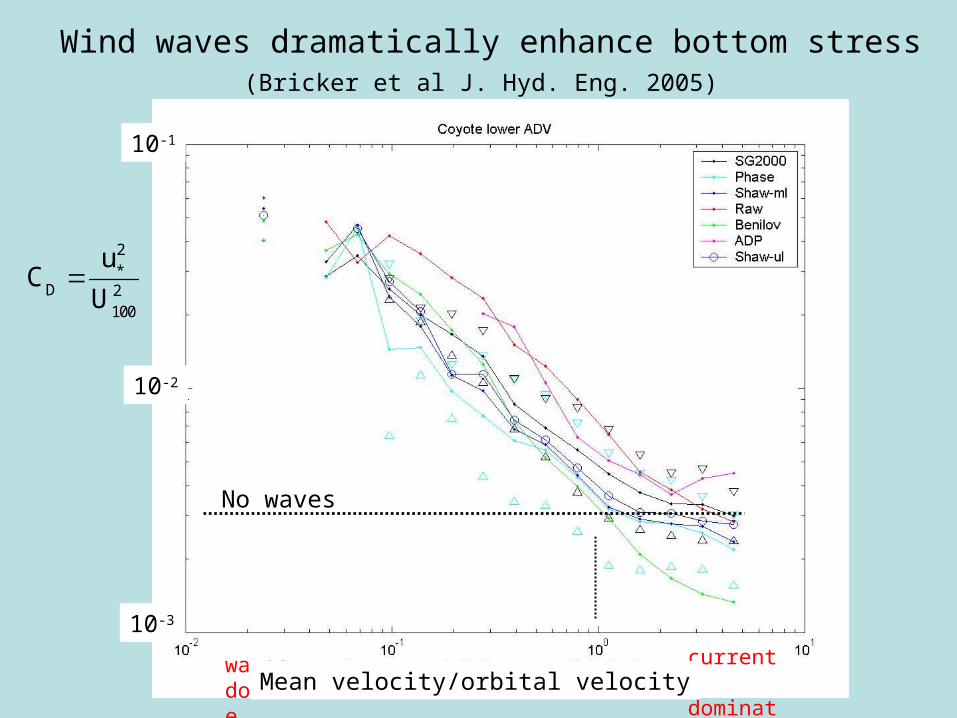
currents dominate
waves dominate
Wind waves dramatically enhance bottom stress(Bricker et al J. Hyd. Eng. 2005)
C
D
u*2
U1002
10-2
10-1
10-3
Mean velocity/orbital velocity
No waves

Effect on drag coefficient
QuickTime™ and a decompressor
are needed to see this picture.
15 x 10-3
10 x 10-3
5 x 10⁻³
“canonical”
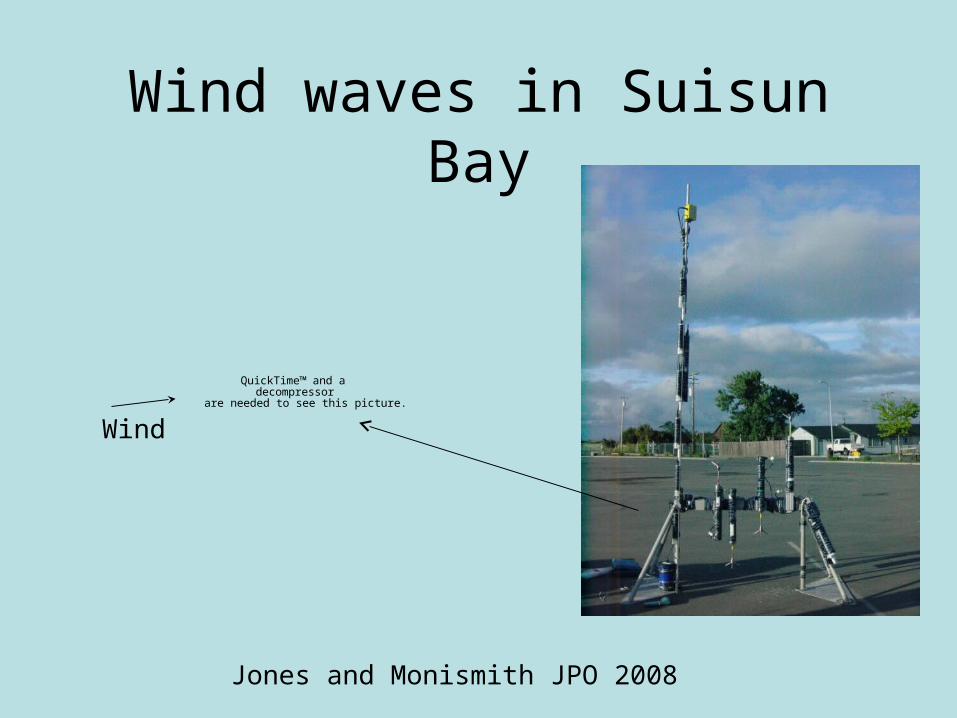
Wind waves in Suisun Bay
Jones and Monismith JPO 2008
QuickTime™ and a decompressor
are needed to see this picture.
Wind

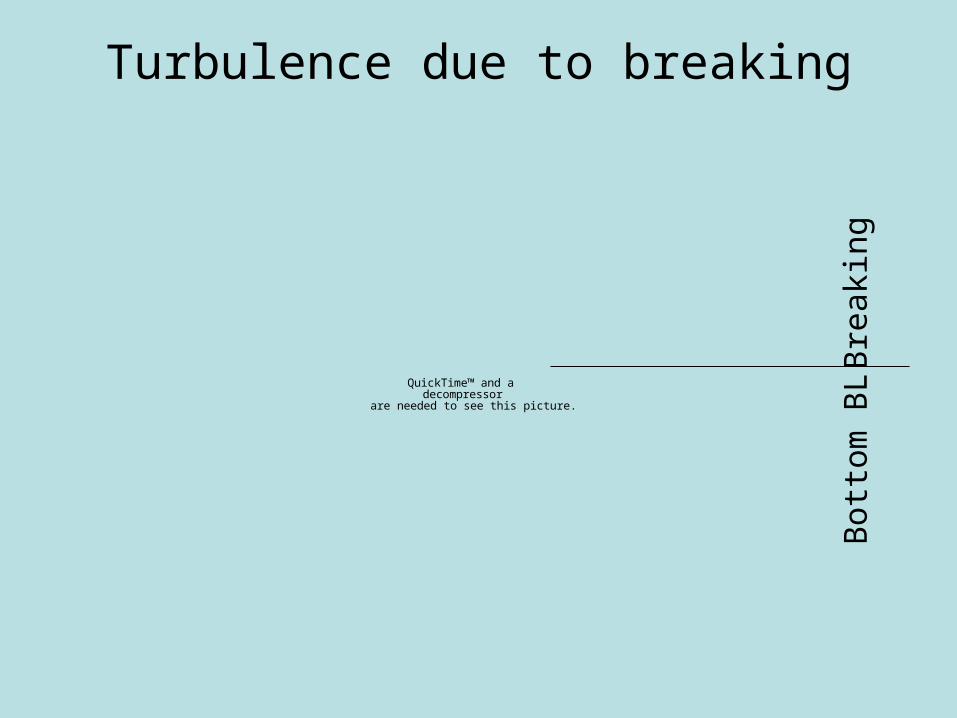
Breaking
QuickTime™ and a decompressor
are needed to see this picture.
Turbulence due to breaking
Bre
akin
g
Bott
om
BL
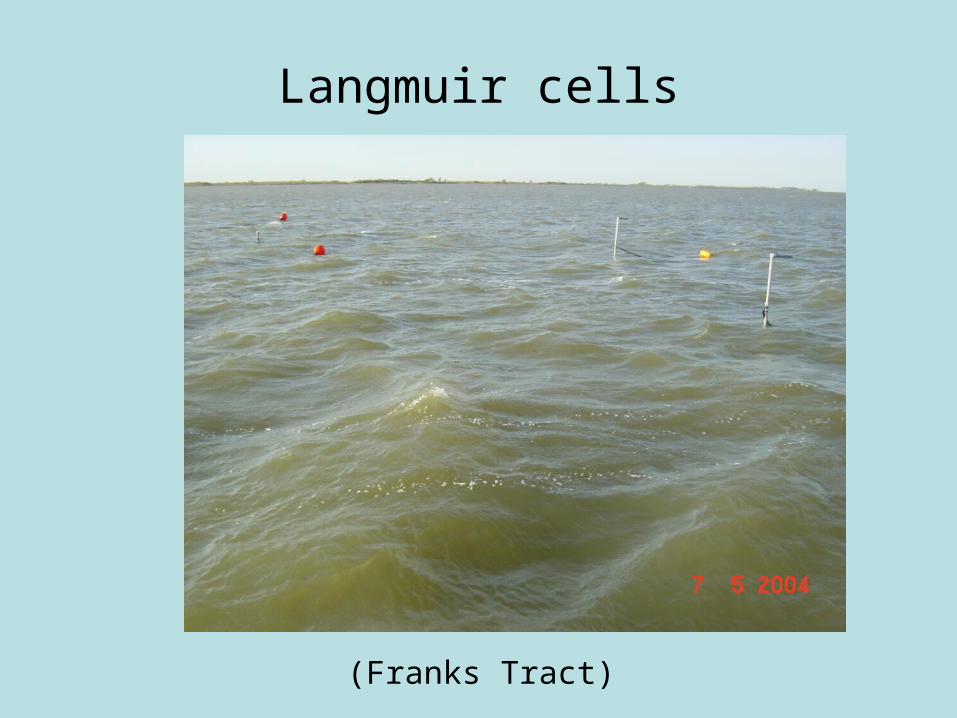
Langmuir cells
(Franks Tract)

Wind wave evolution
QuickTime™ and a decompressor
are needed to see this picture.
QuickTime™ and a decompressor
are needed to see this picture.
Day
Summary
• Waves important to sediment dynamics on shoals
• Waves modify bottom drag and thus flows and transport on shoals
• Waves modify vertical turbulent mixing of sediments on shoals
Needs
• Validated wave model for SF Bay (SWAN?)
• Wave data for whole bay• Spatially variable parameters for
sediment model (Sedflume?)• Parametrization of effects of wave
damping by soft muds
• Compare sediment model (with waves) to both short and long term data sets
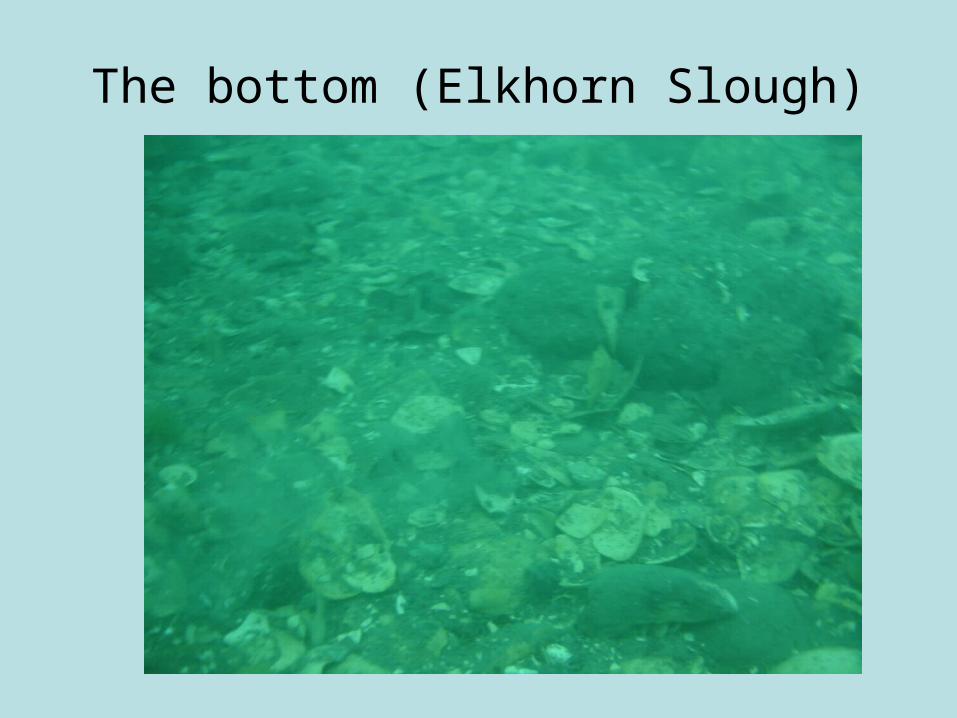
The bottom (Elkhorn Slough)


