Working with Demographic Life
Table Data in Stata Daniel C. Schneider
Max Planck Institute for Demographic Research
Stata Conference, July 27, 2017, Baltimore

2 / 20
Contents
Demographic Life Tables
The Human Mortality Database
hmddata
text to .dta conversion
data usage and examples
life expectancy: Oeppen / Vaupel (2002)
mortality rates
lifetable
Demographic Life Table Data in Stata D.C.Schneider Stata Conference 2017
3 / 20
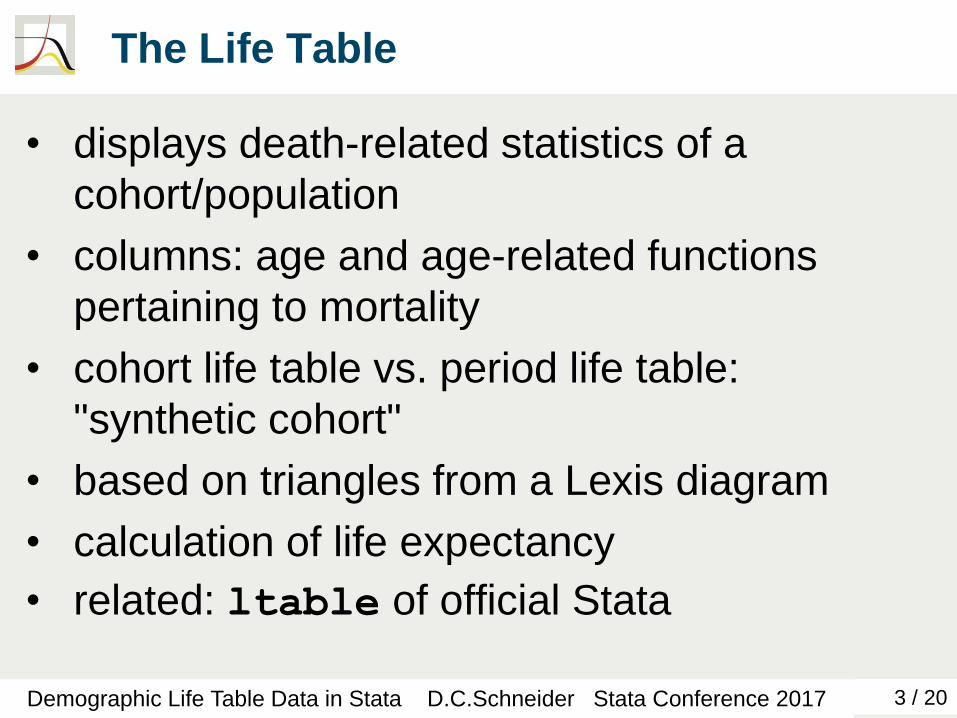
The Life Table
• displays death-related statistics of a
cohort/population
• columns: age and age-related functions
pertaining to mortality
• cohort life table vs. period life table:
"synthetic cohort"
• based on triangles from a Lexis diagram
• calculation of life expectancy
• related: ltable of official Stata
Demographic Life Table Data in Stata D.C.Schneider Stata Conference 2017
4 / 20
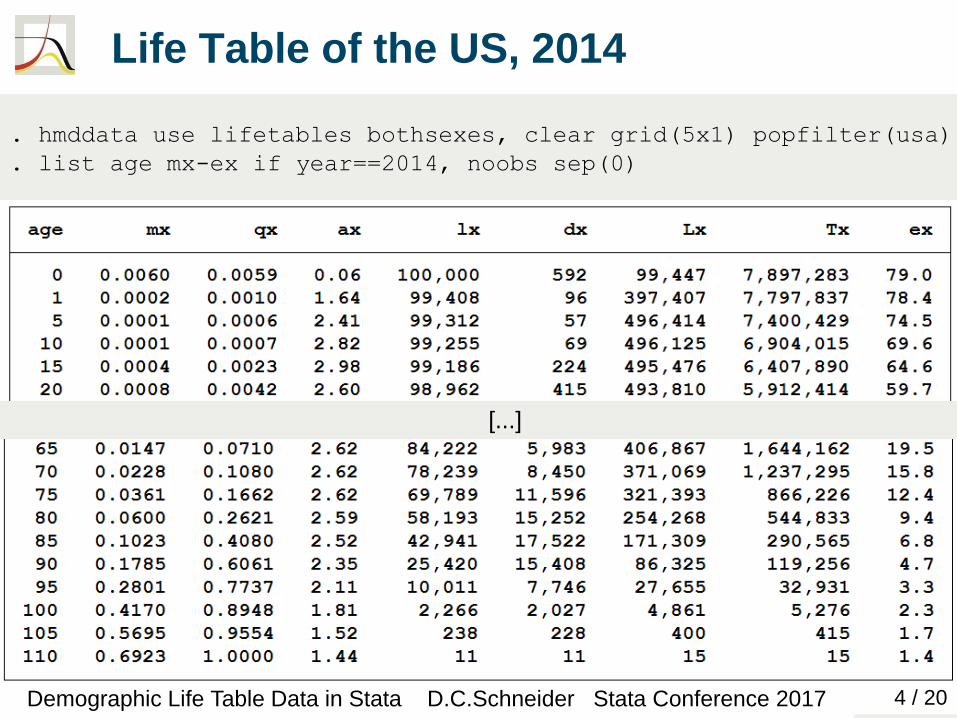
Life Table of the US, 2014
Demographic Life Table Data in Stata D.C.Schneider Stata Conference 2017
. hmddata use lifetables bothsexes, clear grid(5x1) popfilter(usa)
. list age mx-ex if year==2014, noobs sep(0)
[...]
5 / 20
Life Expectancy
• life expectancy (LE, ex):
• ex: average years ahead of a population
member aged X
• e0 (LE at birth):
• average years lived
= mean age at death
• e0 of period life table: average years lived
under current (period) mortality conditions
• All statements are made with respect to
members of a hypothetical cohort.
Demographic Life Table Data in Stata D.C.Schneider Stata Conference 2017
6 / 20
The Human Mortality Database (HMD)
Demographic Life Table Data in Stata D.C.Schneider Stata Conference 2017
• compiled by: UC Berkeley, Max Planck Institute for Demographic Research
• high-quality data
• variables: see next slide
• geographic coverage: • currently 39 countries / populations
• many European countries, plus: US, Canada; Japan, Taiwan; Australia; Chile; Israel; Russia
• time coverage: Sweden 1750-, France 1816-, 10 other countries start before 1900
• www.mortality.org
• companion / similar databases: HLD, HFD, HFC

7 / 20
HMD: Data Contents
Demographic Life Table Data in Stata D.C.Schneider Stata Conference 2017

8 / 20
HMD: Data Acquisition
Demographic Life Table Data in Stata D.C.Schneider Stata Conference 2017
• consent to user agreement and registration required, but free of charge
• Data are distributed in text files.
• zipped text files (http://www.mortality.org/cgi-bin/hmd/hmd_download.php)
• available • by statistic / concept
• by country
• all data
• hmddata can process any one and one or more of the zipped text files.
9 / 20
hmddata
Demographic Life Table Data in Stata D.C.Schneider Stata Conference 2017
• development goal was a data exploration
tool for researchers:
• easy data access
• quick generation of working-quality tables and
graphs
• net install hmddata , from(http://user.demogr.mpg.de/schneider/stata)

10 / 20
hmddata : text to .dta conversion
Demographic Life Table Data in Stata D.C.Schneider Stata Conference 2017

11 / 20
hmddata : data handling
Demographic Life Table Data in Stata D.C.Schneider Stata Conference 2017
12 / 20
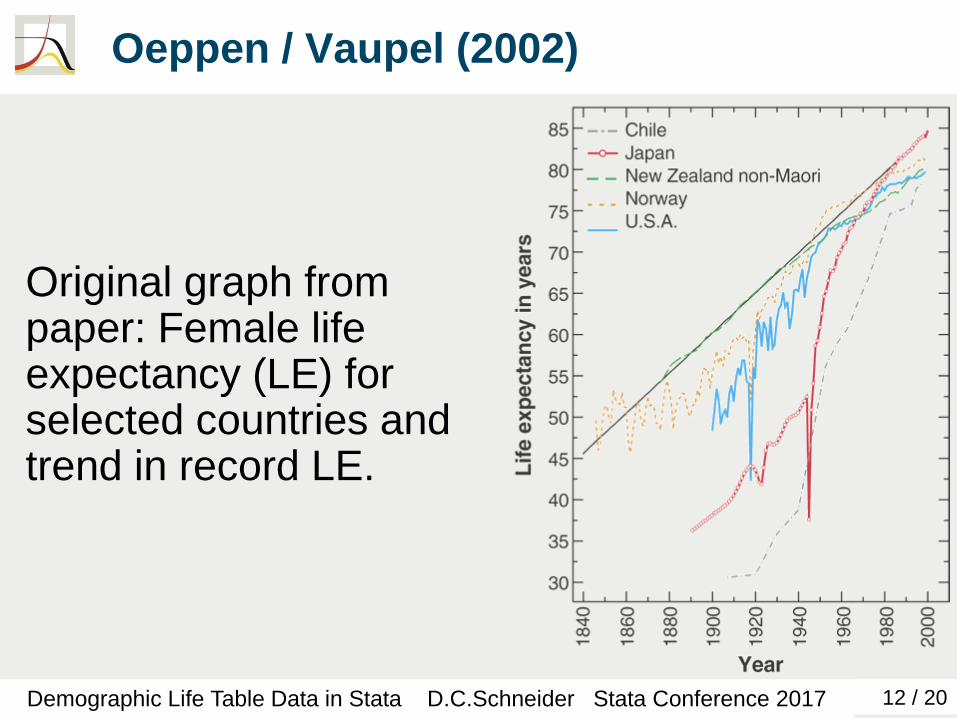
Oeppen / Vaupel (2002)
Demographic Life Table Data in Stata D.C.Schneider Stata Conference 2017
Original graph from paper: Female life expectancy (LE) for selected countries and trend in record LE.

13 / 20
Oeppen / Vaupel (2002)
Demographic Life Table Data in Stata D.C.Schneider Stata Conference 2017
Graph replication using hmddata:
14 / 20
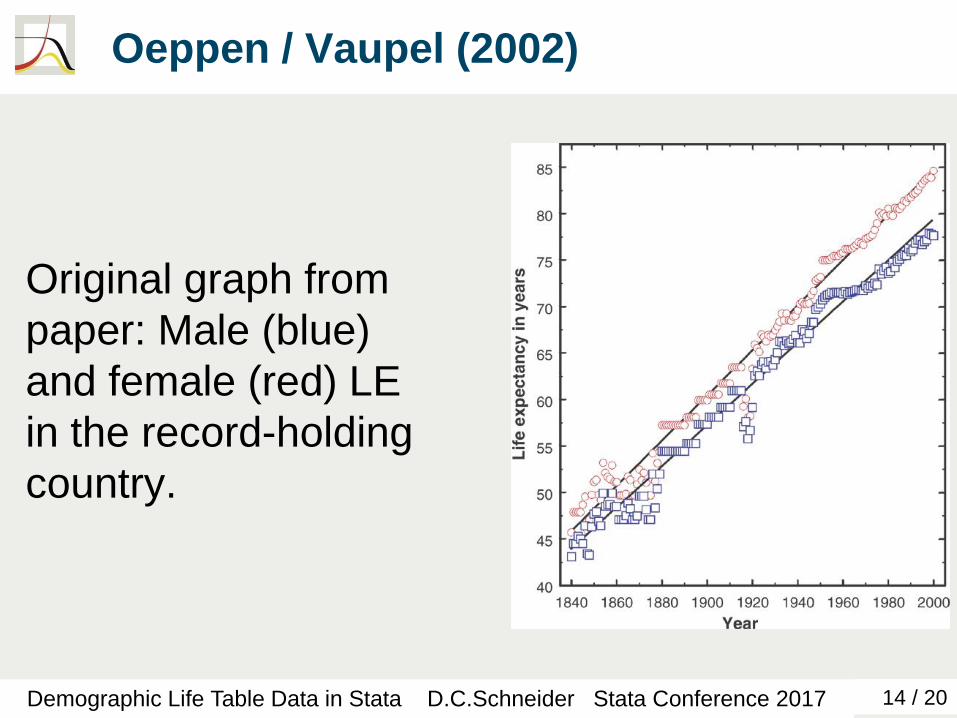
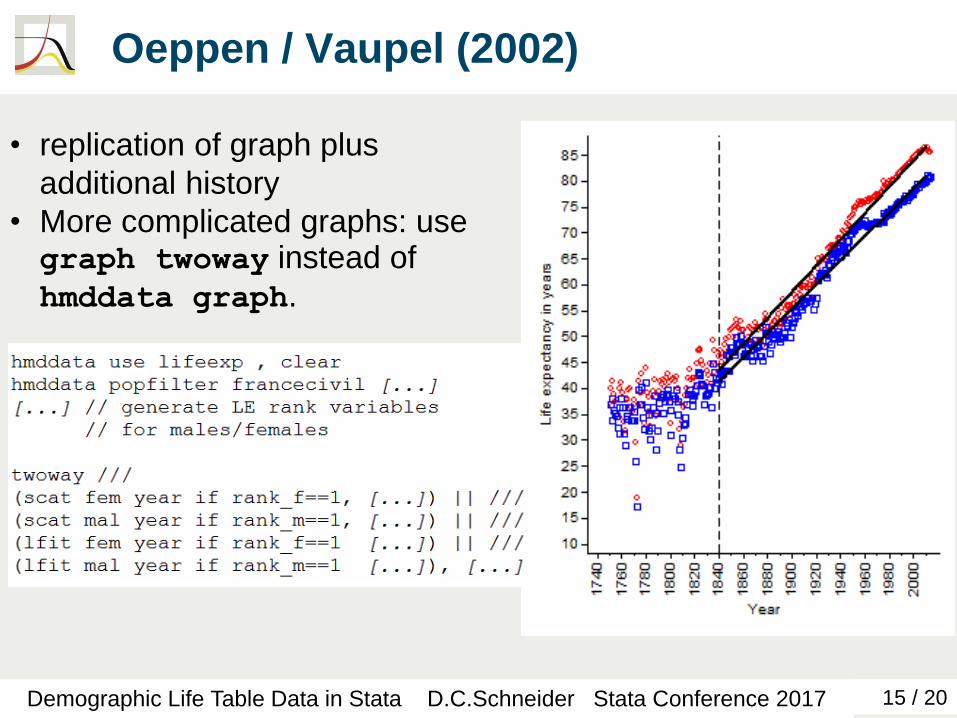
Oeppen / Vaupel (2002)
Demographic Life Table Data in Stata D.C.Schneider Stata Conference 2017
Original graph from
paper: Male (blue)
and female (red) LE
in the record-holding
country.
15 / 20
Oeppen / Vaupel (2002)
Demographic Life Table Data in Stata D.C.Schneider Stata Conference 2017
• replication of graph plus
additional history
• More complicated graphs: use graph twoway instead of
hmddata graph.
16 / 20
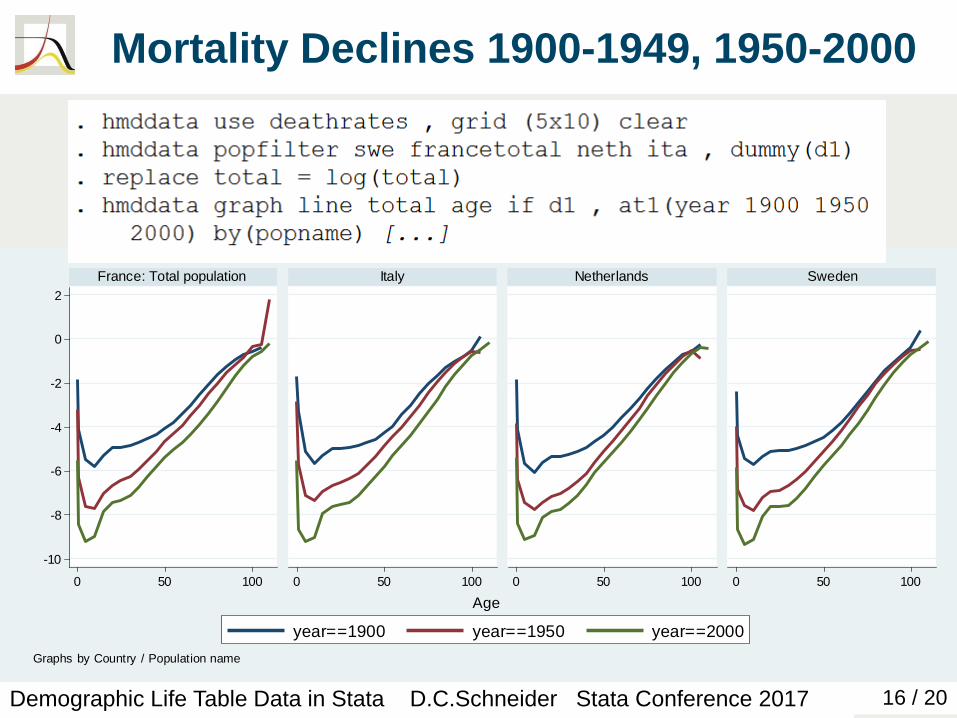
Mortality Declines 1900-1949, 1950-2000
Demographic Life Table Data in Stata D.C.Schneider Stata Conference 2017
-10
-8
-6
-4
-2
0
2
0 50 100 0 50 100 0 50 100 0 50 100
France: Total population Italy Netherlands Sweden
year==1900 year==1950 year==2000
Log
dea
th r
ate
s (
deca
de
s)
Age
Graphs by Country / Population name

17 / 20
Mortality Declines 1900-1949, 1950-2000
Demographic Life Table Data in Stata D.C.Schneider Stata Conference 2017
-10
-8
-6
-4
-2
0
2
0 50 100 0 50 100 0 50 100
1900 1950 2000
Lo
g d
ea
th r
ate
s (
decad
es)
AgeGraphs by Year
18 / 20
lifetable
• not yet released
• development goal: versatile tool to generate and
manipulate demographic life tables
• principles / features:
• operation on multiple yet selected life tables at once
• standardized/prescribed variable names
• calculations using any valid minimum starting
information
• to be added before release: CIs, methods for
approximating nax, …
Demographic Life Table Data in Stata D.C.Schneider Stata Conference 2017
19 / 20
The End
Demographic Life Table Data in Stata D.C.Schneider Stata Conference 2017
Thank you!
Questions? Comments?
contact: [email protected]
20 / 20
References
Human Mortality Database. University of California, Berkeley
(USA), and Max Planck Institute for Demographic
Research (Germany). Available at www.mortality.org and
www.humanmortality.de.
J. Oeppen and James W. Vaupel (2002): Broken Limits to
Life Expectancy. Science, 5570 (296), pp. 1029-1031.
Demographic Life Table Data in Stata D.C.Schneider Stata Conference 2017


