
world Trade reporT 2010
18
I The trade situation in 2009-10The economic and financial crisis that shook the world economy in the closing months of 2008 produced a global recession in 2009 that resulted in the largest decline in world trade in more than 70 years. The rate of trade growth had already slowed from 6.4 per cent in 2007 to 2.1 per cent in 2008, but the 12.2 per cent contraction in 2009 was without precedent in recent history. The WTO has projected a modest recovery in 2010 which should reverse some of the impact of the trade collapse.

I - tHe tRADe sItuAtIon In 2009-10
19
Contents A Introduction 20
B overview of output and price developments in 2009-10 22
c merchandise trade, volume (real) terms, 2009 24
D merchandise and services trade, value (nominal) terms, 2009 26
world Trade reporT 2010
20
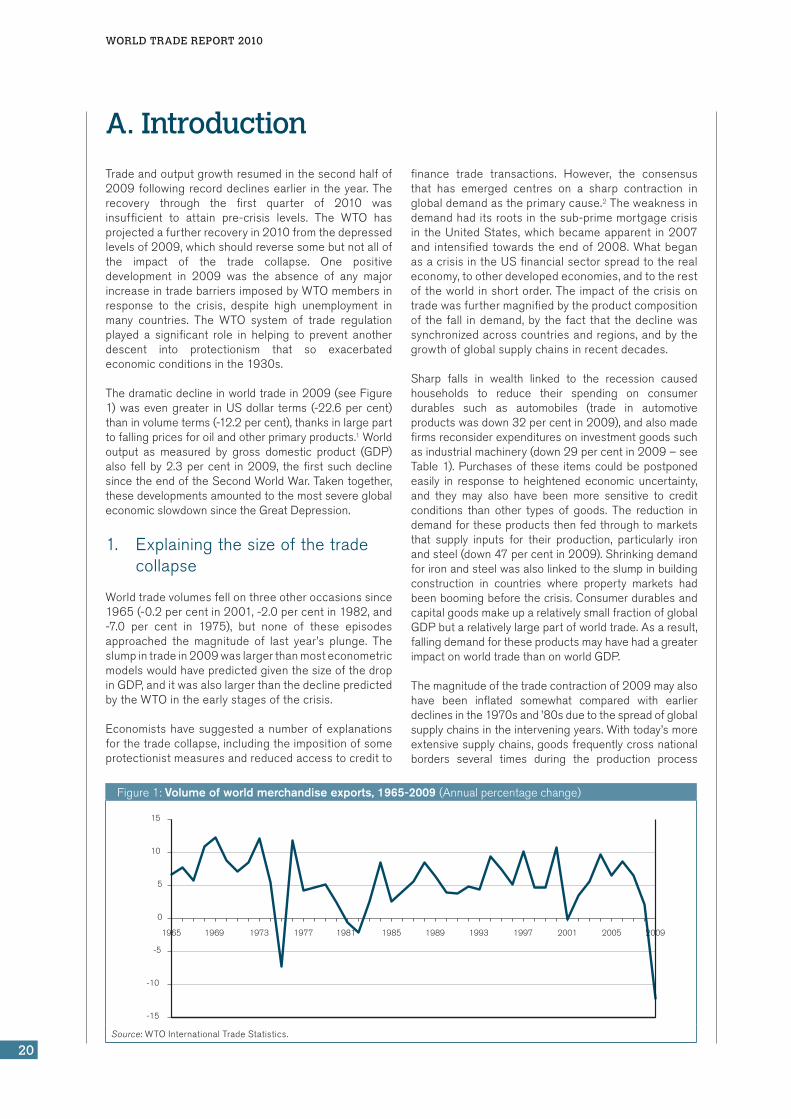
Tradeandoutputgrowthresumedinthesecondhalfof2009followingrecorddeclinesearlier in theyear.Therecovery through the first quarter of 2010 wasinsufficient to attain pre-crisis levels. The WTO hasprojectedafurtherrecoveryin2010fromthedepressedlevelsof2009,whichshouldreversesomebutnotallofthe impact of the trade collapse. One positivedevelopment in 2009 was the absence of any majorincreaseintradebarriersimposedbyWTOmembersinresponse to the crisis, despite high unemployment inmany countries. The WTO system of trade regulationplayed a significant role in helping to prevent anotherdescent into protectionism that so exacerbatedeconomicconditionsinthe1930s.
Thedramaticdeclineinworldtradein2009(seeFigure1)wasevengreater inUSdollar terms (-22.6percent)thaninvolumeterms(-12.2percent),thanksinlargeparttofallingpricesforoilandotherprimaryproducts.1Worldoutput as measured by gross domestic product (GDP)also fell by2.3percent in2009, thefirst suchdeclinesincetheendoftheSecondWorldWar.Takentogether,thesedevelopmentsamountedtothemostsevereglobaleconomicslowdownsincetheGreatDepression.
1. Explainingthesizeofthetradecollapse
Worldtradevolumesfellonthreeotheroccasionssince1965(-0.2percentin2001,-2.0percentin1982,and-7.0 per cent in 1975), but none of these episodesapproached the magnitude of last year’s plunge. Theslumpintradein2009waslargerthanmosteconometricmodelswouldhavepredictedgiventhesizeofthedropinGDP,anditwasalsolargerthanthedeclinepredictedbytheWTOintheearlystagesofthecrisis.
Economistshavesuggestedanumberofexplanationsforthetradecollapse,includingtheimpositionofsomeprotectionistmeasuresandreducedaccesstocreditto
finance trade transactions. However, the consensusthat has emerged centres on a sharp contraction inglobaldemandastheprimarycause.2Theweaknessindemandhaditsrootsinthesub-primemortgagecrisisin theUnitedStates,whichbecameapparent in2007and intensifiedtowards theendof2008.WhatbeganasacrisisintheUSfinancialsectorspreadtotherealeconomy,tootherdevelopedeconomies,andtotherestoftheworld inshortorder.Theimpactofthecrisisontradewasfurthermagnifiedbytheproductcompositionof thefall indemand,by thefact that thedeclinewassynchronizedacrosscountriesandregions,andbythegrowthofglobalsupplychainsinrecentdecades.
Sharp falls in wealth linked to the recession causedhouseholds to reduce their spending on consumerdurables such as automobiles (trade in automotiveproductswasdown32percentin2009),andalsomadefirmsreconsiderexpendituresoninvestmentgoodssuchasindustrialmachinery(down29percentin2009–seeTable1).Purchasesof these itemscouldbepostponedeasily in response to heightened economic uncertainty,and they may also have been more sensitive to creditconditions than other types of goods. The reduction indemandfortheseproductsthenfedthroughtomarketsthat supply inputs for their production, particularly ironandsteel(down47percentin2009).Shrinkingdemandforironandsteelwasalsolinkedtotheslumpinbuildingconstruction in countries where property markets hadbeenboomingbeforethecrisis.ConsumerdurablesandcapitalgoodsmakeuparelativelysmallfractionofglobalGDPbutarelativelylargepartofworldtrade.Asaresult,fallingdemandfortheseproductsmayhavehadagreaterimpactonworldtradethanonworldGDP.
Themagnitudeofthetradecontractionof2009mayalsohave been inflated somewhat compared with earlierdeclinesinthe1970sand’80sduetothespreadofglobalsupplychainsintheinterveningyears.Withtoday’smoreextensivesupplychains,goodsfrequentlycrossnationalborders several times during the production process
a. Introduction
Figure1:volume of world merchandise exports, 1965-2009 (Annualpercentagechange)
-15
-10
-5
0
5
10
15
1965 1969 1973 1977 1981 1985 1989 1993 1997 2001 2005 2009
Source:WTOInternationalTradeStatistics.

I – tHe tRADe sItuAtIon In 2009-10
21
A. In
tRo
Du
ctIo
n
before arriving at their final destination. Merchandisetradestatisticsrecordthevalueofgoodseverytimetheycrossnationalboundaries,sowhenthesedataareaddedtogether to arrive at a figure for total world trade, thenumber will be larger when supply chains are moreextensive due to a certain amount of double counting.Consequently, a given fall in demand in 2009 wouldprobablyproduceabiggermeasureddeclineintradethananequivalentfallindemandin1982or1975.
Theextentofthisdoublecountingisdifficulttogaugeduetoalackofreadilyavailabledata,butitisreflectedin the fact that trade has been growing faster thanproduction since the 1980s. As a result, the ratio ofworld exports to GDP has increased steadily since1985, and jumped by nearly one-third between 2000and2008,beforedroppingin2009asworldtradefellfasterthanworldGDP(seeFigure2).
A final factor that reinforced the trade slump was itssynchronizednature.Exportsandimportsofallcountriesfellatthesametime,leavingnoregionuntouched(seeFigure3).Itisintuitivelyclearthatthefallinworldtradewouldhavebeensmallerifcontractioninsomeregionshadbeenbalancedbyexpansioninothers,butthiswasnotthecasein2009.
Thesynchronizednatureofthedeclineiscloselyrelatedto the spread of international supply chains and
informationtechnology,whichallowsproducers inoneregiontorespondalmostinstantlytomarketconditionsinanotherpartoftheworld.Thisusuallycontributestoglobal and national welfare by encouraging the mostefficientuseofscarceresources,butinthecaseofthetrade collapse it may have acted as a transmissionmechanism.
Figure3:World merchandise exports by region, 2007Q1-2009Q4 (Year-to-yearpercentagechangeincurrentUSdollars)
-60
-40
-20
0
20
40
60
80
2007Q1 2007Q2 2007Q3 2007Q4 2008Q1 2008Q2 2008Q3 2008Q4 2009Q1 2009Q2 2009Q3 2009Q4
World a
North America
South and CentralAmerica
Europe
Commonwealth ofIndependent States
Asia a
Others b
aIncludessignificantre-exports.bIncludesAfricaandMiddleEast.Source:IMF,InternationalFinancialStatistics;Eurostat,ComextDatabase;Nationalstatistics;GlobalTradeAtlas.
Table1:World trade in manufactured goods by product, 2008Q1-2009Q4(Year-to-yearpercentagechangeincurrentdollars)
2008Q1 2008Q2 2008Q3 2008Q4 2009Q1 2009Q2 2009Q3 2009Q4 2009
manufactures 16 18 13 -11 -28 -30 -22 0 -21
Ironandsteel 15 27 43 4 -39 -56 -55 -31 -47
Chemicals 19 24 20 -7 -24 -25 -17 8 -15
Officeandtelecomequipment 10 13 7 -14 -29 -22 -15 8 -15
Automotiveproducts 15 16 3 -26 -47 -46 -29 6 -32
Industrialmachinery 21 22 15 -8 -29 -36 -32 -15 -29
Textiles 11 9 3 -13 -27 -27 -17 0 -19
Clothing 11 11 8 -2 -11 -15 -12 -6 -11 Source:WTOSecretariatestimates.
Figure2:Ratio of world exports of goods and commercial services to GDP, 1981-2009 (Index2000=100)
1981 1985 1989 1993 1997 2001 2005 2009
40
50
60
70
80
90
100
110
120
130
140
Source: IMFforworldGDP,WTOSecretariatforworldtradeingoodsandcommercialservices.

world Trade reporT 2010
22
1. Economicgrowth
WorldGDPgrowthturnedsharplynegativein2009forthefirsttimesincethe1930s,droppingto-2.3percentfrom1.6percentin2008.Bothyearswerewellbelowthe 2000-08 average of 3.0 per cent. Although thecontraction in output started in the developedeconomiesinthefourthquarterof2008,itacceleratedin the first half of 2009 and eventually affected allcountries and regions to varying degrees. However,many developing countries only experienced slowerGDPgrowthratherthanabsolutedeclinesinoutput.
Figure4showsthequarterlyevolutionofGDP,aswellasexportsand importsofgoodsandservices for theindustrialized economies of the Organisation forEconomic Cooperation and Development (OECD).Positivequarter-on-quarterGDPgrowthresumedinthesecondquarterof2009 inOECDcountries,but year-on-year changes remained negative throughout theyear.AninterestingfeatureofFigure4isthattradeandoutputbegantheirdeclinesandstartedtheirrecoveriesat the same time. This provides some support for thenotion that the trade decline was mostly related tofallingdemandratherthanotherfactors.
Output of developed economies fell 3.5 per cent in2009aftergrowing just0.5percent in2008.Amongthe leadingdevelopedeconomies,Japansuffered thelargest decline in its GDP (-5.0 per cent) followed bythe European Union (-4.2 per cent)3 and the UnitedStates (-2.4 per cent). On the other hand, developingeconomies still managed to increase their collectiveoutputby2.6percentin2009,althoughthiswasdownsharply from the 5.6 per cent growth of the previousyear.ThecontinuedpositiveGDPgrowthofdevelopingeconomies can be partly credited to the strong
performances of China and India, whose outputincreasedby8.5percentand5.4percent,respectively,in 2009. Oil-exporting countries saw their collectiveGDPfallto2.0percentin2009,downfrom5.1percentin2008,while least-developedcountries(LDCs)grew3.7percent,downfrom6.7percentin2008.
North America’s GDP growth fell to -2.7 per cent in2009,whileSouthandCentralAmerica’sratedroppedto -0.8 per cent. The decline in Europe’s output wasevenlarger(-4.0percent),andthatoftheCommonwealthof IndependentStates (CIS) largerstill (-7.0percent).On the other hand, Africa managed to increase itsproductionofgoodsandservicesby1.6percent,asdidthe Middle East, which recorded GDP growth of1.0 per cent. Asia’s GDP growth was almost flat at0.1per cent, as thesharpdeclineof JapancancelledouttheexpansionsofChinaandIndia.
2. Pricesandexchangerates
After plunging in the early stages of the economiccrisis,pricesforprimaryproductsstabilizedandstagedasignificantrecoveryinthesecondhalfof2009.ThisisillustratedbyFigure5,whichshowsindicesofworldprimaryproductpricesfromtheInternationalMonetaryFund (IMF). Between July 2008 and February 2009,energy prices fell by 64 per cent and metals pricesdropped by 50 per cent, but between February 2009and January 2010 prices for energy and metals rose60 per cent and 65 per cent, respectively. Averagecommodity prices for 2009 were down for energy(-37 per cent), metals (-29 per cent), agricultural rawmaterials (-17 per cent) and food (-15 per cent). Theonlyprimaryproduct category registeringan increaseinpriceslastyearwasbeverages(1.7percent),whichincludescoffeeandtea(seeFigure6).
B. overview of output and price developments in 2009-10
Figure4:Real GDP and trade growth of oecD countries, 2008-09 (year-to-yearpercentagechange)
-20
-15
-10
-5
0
5
10
2008Q1 2008Q2 2008Q3 2008Q4 2009Q1 2009Q2 2009Q3 2009Q4 a
GDP
Exports of goods and services
Imports of goods and services
aEstimatedbasedonavailabledata.Source:OECDQuarterlyNationalAccounts.

I – tHe tRADe sItuAtIon In 2009-10
23
B: o
ve
Rv
IeW
oF tR
AD
e A
nD
PR
oD
uc
tIon
De
veLo
Pme
nts
In 2009-10
Major currencies have undergone significantfluctuationsagainst theUSdollarsince thebeginningoftheeconomiccrisis,withtheexceptionoftheChineseyuan,whichhasbeeneffectivelypegged to thedollarsince July 2008. For example, after falling nearly20percentinvalueagainstthedollarbetweenJulyandNovember2008,theeurothenappreciated17percentbetween February and November 2009. Many othercurrencies followed a similar pattern, depreciatingagainst the dollar as the crisis worsened andappreciatingasconditionseased,probablydue to thedollar’s role as a safe haven currency in times ofeconomicuncertainty.Anexception to this rule is theJapaneseyen,whichappreciatedagainstthedollarasaresult of the unwinding of the so called yen “carrytrade”inwhichlargeamountsofyenwereborrowedinJapan and invested in assets denominated in othercurrenciesinordertoobtainahigherrateofreturn.Theliquidationof thesepositions increasedcapital inflowsinto Japan and put upward pressure on the country’scurrency(seeFigure7).
Figure5:export prices of selected primary products, January 2000-January 2010 (Index,January2000=100)
50
100
150
200
250
300
350
400
450
500
Jan-
00
Jan-
01
Jan-
02
Jan-
03
Jan-
04
Jan-
05
Jan-
06
Jan-
07
Jan-
08
Jan-
09
Jan-
10
Energy
Metals
Food
Source:IMFInternationalFinancialStatistics.
Figure6:export prices of selected primary products, 2007-09 (Annualpercentagechange)
-40 -30 -20 -10 0 10 20 30 40 50
Beverages a
Food
Agriculturalraw materials
Metals
Energy
2009
2008
2007
Source:IMFInternationalFinancialStatistics.
Figure7:Dollar exchange rates of selected currencies, January 2000-January 2010 (Index,January2000=100)
70
80
90
100
110
120
130
140
150
160
Jan-
00
Jan-
01
Jan-
02
Jan-
03
Jan-
04
Jan-
05
Jan-
06
Jan-
07
Jan-
08
Jan-
09
Jan-
10
70
80
90
100
110
120
130
Jan-
00
Jan-
01
Jan-
02
Jan-
03
Jan-
04
Jan-
05
Jan-
06
Jan-
07
Jan-
08
Jan-
09
Jan-
10
Euro
Canadian dollar
UK pound
Japanese yen
Chinese yuan
Korean won
Source:IMFInternationalFinancialStatistics.

world Trade reporT 2010
24
Worldmerchandisetradeinvolumeterms(i.e.excludingthe influence of prices and exchange rates) fell by12.2percentin2009(seeTable2).Thiswaswellbelowthe 2.1 per cent increase for 2008, and significantlylowerthanthe10yearaverageincreaseof4.1percent.Thedropintradewasalsolargerthanthe2.3percentdeclineinGDPfor2009,whichisnotsurprisingsinceworld trade generally grows faster than GDP whenoutput isacceleratinganddeclinesmorewhenoutputslows(seeFigure8).
AllcountriesandregionsinTable2sawthevolumeoftheir exports decline last year. North America andEuropefellmorethantheworldaverage(14.4percenteach)whilethesmallestdeclineswererecordedbyoil-
exporting regions such as the Middle East(-4.9 per cent), Africa (-5.6 per cent) and South andCentralAmerica (-5.7percent).Thedeclines forAsia(-11.1 per cent) and the CIS (-9.5 per cent) weresomewhatlarger,butstilllessthantheworldaverage.
The United States (-13.9 per cent), European Union(-14.8percent)andJapan(-24.9percent)allsawtheirexportsfallbymorethantheworldaverage,butChina’sdropwassmaller(-10.5percent).Collectively,thenewlyindustrializedcountries(NICs)experiencedarelativelysmall decline in exports (-5.9 per cent) despite theirvulnerability during the crisis due to the exportorientationoftheireconomies.ThereductioninIndia’sexportswasalsocomparativelysmall(-6.2percent).
C. Merchandise trade, volume (real) terms, 2009
Figure8:Growth in the volume of world merchandise trade and GDP, 1999-2009 (Annualpercentagechange)
-16
-12
-8
-4
0
4
8
12
1999 2000 2001 2002 2003 2004 2005 2006 2007 2008 2009
Avg. GDP growth 1999-2009
Avg. export growth 1999-2009
GDP
Merchandise exports
Source:WTOSecretariat.
Table2:GDP and merchandise trade by region, 2007-09 (Annualpercentagechange)
GDP Exports Imports
2007 2008 2009 2007 2008 2009 2007 2008 2009
World 3.8 1.6 -2.3 6.4 2.1 -12.2 6.1 2.2 -12.9
north America 2.2 0.5 -2.7 4.8 2.1 -14.4 2.0 -2.4 -16.3
UnitedStates 2.1 0.4 -2.4 6.7 5.8 -13.9 1.1 -3.7 -16.5
south and central America a 6.4 5.0 -0.8 3.3 0.8 -5.7 17.6 13.3 -16.3
europe 2.9 0.8 -4.0 4.2 0.0 -14.4 4.4 -0.6 -14.5
EuropeanUnion(27) 2.8 0.7 -4.2 4.0 -0.1 -14.8 4.1 -0.8 -14.5
commonwealth of
Independent states (cIs) 8.3 5.3 -7.1 7.5 2.2 -9.5 19.9 16.3 -20.2
Africa 5.8 4.7 1.6 4.8 0.7 -5.6 13.8 14.1 -5.6
middle east 5.5 5.4 1.0 4.5 2.3 -4.9 14.6 14.6 -10.6
Asia 6.0 2.7 0.1 11.7 5.5 -11.1 8.2 4.7 -7.9
China 13.0 9.0 8.5 19.8 8.6 -10.5 13.8 3.8 2.8
Japan 2.3 -1.2 -5.0 9.4 2.3 -24.9 1.3 -1.3 -12.8
India 9.4 7.3 5.4 14.4 14.4 -6.2 18.7 17.3 -4.4
Newlyindustrialized
economies(4)b 5.6 1.6 -0.8 9.0 4.9 -5.9 5.3 3.5 -11.4
aIncludestheCaribbean.bHongKong,China;RepublicofKorea;SingaporeandChineseTaipei.Source:WTOSecretariat.

I – tHe tRADe sItuAtIon In 2009-10
25
c: m
eR
cH
An
DIs
e tR
AD
e, v
oLu
me
(Re
AL)
teR
ms
, 2009
The situation was reversed on the import side, wheretheregionswiththelargestdeclinesin2009includedmajorexportersofoilandothernaturalresources–theCIS (-20 per cent) and South and Central America(-16.5 per cent – see Figure 9). This can be partlyexplainedbyfallingexportrevenuesasaresultofloweroil prices in 2009. North America, Europe and theMiddle East all saw their imports drop sharply(-16 per cent, -14.5 per cent and -10.6 per cent,respectively),butAfricaandAsiaonlysufferedsingle-digit declines (-5.6 per cent and -7.9 per centrespectively).
Thedeclines in imports for theUnitedStatesand theEuropean Union (-16.5 per cent and -14.5 per cent,respectively)weregreaterthantheworldaverage,whileJapan’s drop was nearly equal to the world rate(-12.8percent).Indiarecordedarelativelysmalldropinits imports (-4.4percent)while thevolumeofChina’spurchases from other countries actually increased(2.8percent).ThisincreasecanbepartlyexplainedbyChina’s stockpiling of minerals and other naturalresources while prices for these commodities weretemporarilydepressed.
Figure9:Real merchandise trade growth by region, 2009 (Annualpercentagechange)
-25 -20 -15 -10 -5 0
Middle East
Africa
South and Central America
Commonwealth of Independent States (CIS)
Asia
North America
EuropeExports
Imports
World exports
Source:WTOSecretariat.
world Trade reporT 2010
26
1. Merchandisetrade
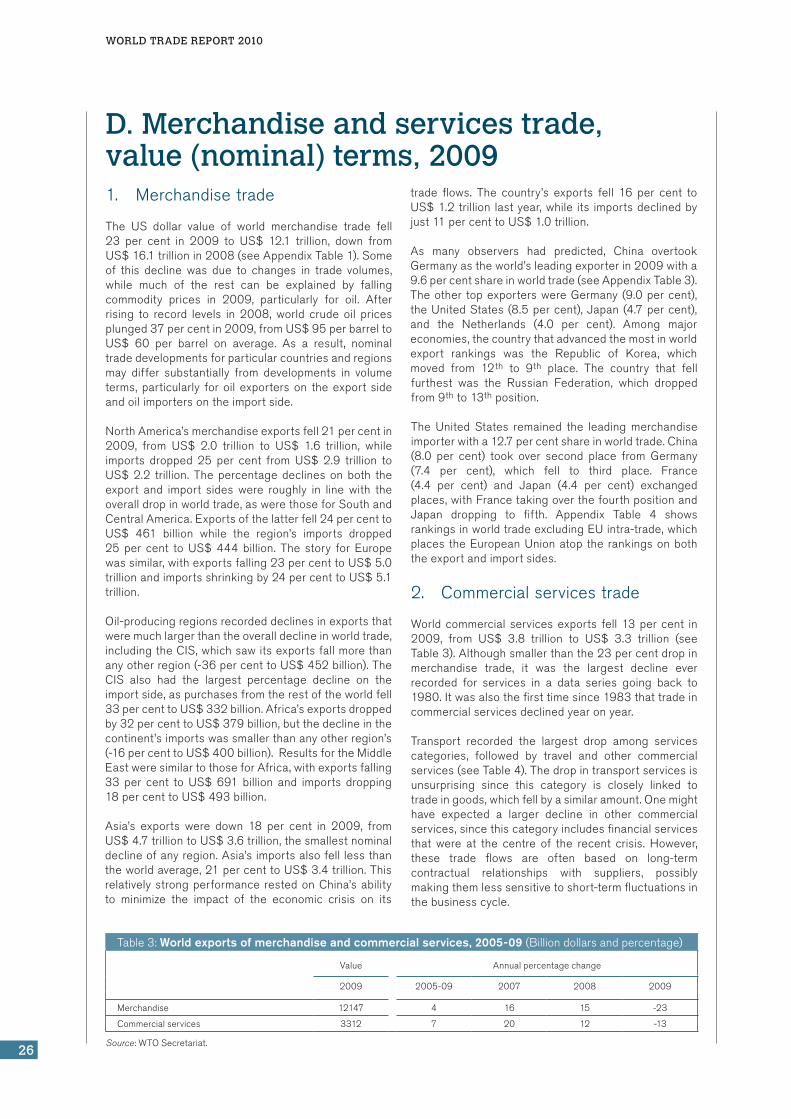
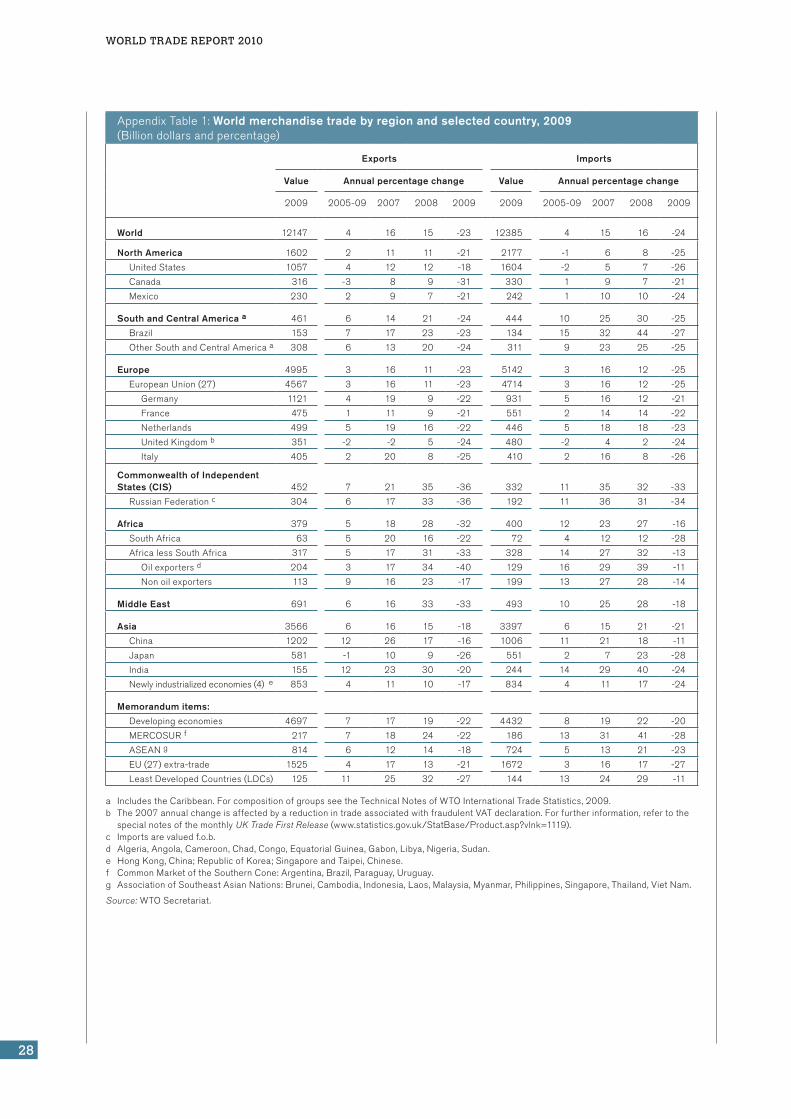
The US dollar value of world merchandise trade fell23 per cent in 2009 to US$ 12.1 trillion, down fromUS$16.1trillionin2008(seeAppendixTable1).Someof this decline was due to changes in trade volumes,while much of the rest can be explained by fallingcommodity prices in 2009, particularly for oil. Afterrising to record levels in 2008, world crude oil pricesplunged37percentin2009,fromUS$95perbarreltoUS$ 60 per barrel on average. As a result, nominaltradedevelopmentsforparticularcountriesandregionsmay differ substantially from developments in volumeterms, particularly for oil exporterson theexport sideandoilimportersontheimportside.
NorthAmerica’smerchandiseexportsfell21percentin2009, from US$ 2.0 trillion to US$ 1.6 trillion, whileimports dropped 25 per cent from US$ 2.9 trillion toUS$2.2 trillion. Thepercentagedeclinesonboth theexport and import sides were roughly in line with theoveralldropinworldtrade,aswerethoseforSouthandCentralAmerica.Exportsofthelatterfell24percenttoUS$ 461 billion while the region’s imports dropped25 per cent to US$ 444 billion. The story for Europewassimilar,withexportsfalling23percenttoUS$5.0trillionandimportsshrinkingby24percenttoUS$5.1trillion.
Oil-producingregionsrecordeddeclinesinexportsthatweremuchlargerthantheoveralldeclineinworldtrade,includingtheCIS,whichsawitsexportsfallmorethananyotherregion(-36percenttoUS$452billion).TheCIS also had the largest percentage decline on theimportside,aspurchasesfromtherestoftheworldfell33percenttoUS$332billion.Africa’sexportsdroppedby32percenttoUS$379billion,butthedeclineinthecontinent’simportswassmallerthananyotherregion’s(-16percenttoUS$400billion).ResultsfortheMiddleEastweresimilartothoseforAfrica,withexportsfalling33 per cent to US$ 691 billion and imports dropping18percenttoUS$493billion.
Asia’s exports were down 18 per cent in 2009, fromUS$4.7trilliontoUS$3.6trillion,thesmallestnominaldeclineofanyregion.Asia’simportsalsofelllessthantheworldaverage,21percenttoUS$3.4trillion.Thisrelativelystrongperformance restedonChina’sabilityto minimize the impact of the economic crisis on its
trade flows. The country’s exports fell 16 per cent toUS$1.2trillion lastyear,while its importsdeclinedbyjust11percenttoUS$1.0trillion.
As many observers had predicted, China overtookGermanyastheworld’sleadingexporterin2009witha9.6percentshareinworldtrade(seeAppendixTable3).Theother topexporterswereGermany (9.0percent),theUnitedStates(8.5percent),Japan(4.7percent),and the Netherlands (4.0 per cent). Among majoreconomies,thecountrythatadvancedthemostinworldexport rankings was the Republic of Korea, whichmoved from 12th to 9th place. The country that fellfurthest was the Russian Federation, which droppedfrom9thto13thposition.
The United States remained the leading merchandiseimporterwitha12.7percentshareinworldtrade.China(8.0 per cent) took over second place from Germany(7.4 per cent), which fell to third place. France(4.4 per cent) and Japan (4.4 per cent) exchangedplaces,withFrancetakingoverthefourthpositionandJapan dropping to fifth. Appendix Table 4 showsrankingsinworldtradeexcludingEUintra-trade,whichplaces theEuropeanUnionatop the rankingsonboththeexportandimportsides.
2. Commercialservicestrade
Worldcommercial servicesexports fell13percent in2009, from US$ 3.8 trillion to US$ 3.3 trillion (seeTable3).Althoughsmallerthanthe23percentdropinmerchandise trade, it was the largest decline everrecorded for services in a data series going back to1980.Itwasalsothefirsttimesince1983thattradeincommercialservicesdeclinedyearonyear.
Transport recorded the largest drop among servicescategories, followed by travel and other commercialservices(seeTable4).Thedropintransportservicesisunsurprising since this category is closely linked totradeingoods,whichfellbyasimilaramount.Onemighthave expected a larger decline in other commercialservices,sincethiscategoryincludesfinancialservicesthat were at the centre of the recent crisis. However,these trade flows are often based on long-termcontractual relationships with suppliers, possiblymakingthemlesssensitivetoshort-termfluctuationsinthebusinesscycle.
d. Merchandise and services trade, value (nominal) terms, 2009
Table3:World exports of merchandise and commercial services, 2005-09 (Billiondollarsandpercentage)
Value Annualpercentagechange
2009 2005-09 2007 2008 2009
Merchandise 12147 4 16 15 -23
Commercialservices 3312 7 20 12 -13
Source:WTOSecretariat.

I – tHe tRADe sItuAtIon In 2009-10
27
D: m
eR
cH
An
DIs
e A
nD
se
Rv
Ice
s tR
AD
e,
vALu
e (n
om
InA
L) teR
ms
, 2009
AllcountriesandregionsinAppendixTable2recordednegativegrowthincommercialservicestradein2009with twoexceptions (China’s importswereunchangedfrom 2008, while Morocco was the only country toreportariseinimportsofservices).
Regional declines in exports were led by the CIS(-18 per cent to US$ 69 billion), followed by Europe(-14percent,US$1.6trillion),Asia(-13percent,US$751billion),MiddleEast(-12percent,US$96billion),Africa (-11 per cent, US$ 78 billion), North America(-10percent,US$542billion)andSouthandCentralAmerica (-8percent,US$100billion).On the importside,theCISagainhadthebiggestdecline(-21percent,US$91billion),followedbytheMiddleEast(-13percent,US$162billion),Europe(-13percent,US$1.5trillion),Africa(-11percent,US$117billion),Asia(-11percent,US$776billion),NorthAmerica(-10percent,US$430billion) and South and Central America (-8 per cent,US$111billion).
The United States was the largest exporter ofcommercialservicesin2009witha14.2percentshareof world trade, followed by the United Kingdom(7.2 per cent), Germany (6.5 per cent), France(4.2 per cent) and China (3.9 per cent). The UnitedStates also retained top spot on the import side(10.6 per cent of world trade), with Germany(8.2percent),theUnitedKingdom(5.1percent),China(5.1percent)andJapan(4.7percent)beingtheothercountriesinthetopfive(seeAppendixTable5).
Table4:World exports of commercial services by major category, 2009 (Billiondollarsandpercentage)
Value Annualpercentagechange
2009 2005-09 2007 2008 2009
commercial services 3312 7 20 12 -13
Transport 704 5 20 16 -21
Travel 854 6 15 11 -11
Othercommercialservices 1754 10 23 12 -10
Source:WTOSecretariat
world Trade reporT 2010
28
AppendixTable1:World merchandise trade by region and selected country, 2009(Billiondollarsandpercentage)
exports Imports
value Annual percentage change value Annual percentage change
2009 2005-09 2007 2008 2009 2009 2005-09 2007 2008 2009
World 12147 4 16 15 -23 12385 4 15 16 -24
north America 1602 2 11 11 -21 2177 -1 6 8 -25
UnitedStates 1057 4 12 12 -18 1604 -2 5 7 -26
Canada 316 -3 8 9 -31 330 1 9 7 -21
Mexico 230 2 9 7 -21 242 1 10 10 -24
south and central America a 461 6 14 21 -24 444 10 25 30 -25
Brazil 153 7 17 23 -23 134 15 32 44 -27
OtherSouthandCentralAmericaa 308 6 13 20 -24 311 9 23 25 -25
europe 4995 3 16 11 -23 5142 3 16 12 -25
EuropeanUnion(27) 4567 3 16 11 -23 4714 3 16 12 -25
Germany 1121 4 19 9 -22 931 5 16 12 -21
France 475 1 11 9 -21 551 2 14 14 -22
Netherlands 499 5 19 16 -22 446 5 18 18 -23
UnitedKingdomb 351 -2 -2 5 -24 480 -2 4 2 -24
Italy 405 2 20 8 -25 410 2 16 8 -26
commonwealth of Independent states (cIs) 452 7 21 35 -36 332 11 35 32 -33
RussianFederationc 304 6 17 33 -36 192 11 36 31 -34
Africa 379 5 18 28 -32 400 12 23 27 -16
SouthAfrica 63 5 20 16 -22 72 4 12 12 -28
AfricalessSouthAfrica 317 5 17 31 -33 328 14 27 32 -13
Oilexportersd 204 3 17 34 -40 129 16 29 39 -11
Nonoilexporters 113 9 16 23 -17 199 13 27 28 -14
middle east 691 6 16 33 -33 493 10 25 28 -18
Asia 3566 6 16 15 -18 3397 6 15 21 -21
China 1202 12 26 17 -16 1006 11 21 18 -11
Japan 581 -1 10 9 -26 551 2 7 23 -28
India 155 12 23 30 -20 244 14 29 40 -24
Newlyindustrializedeconomies(4)e 853 4 11 10 -17 834 4 11 17 -24
memorandum items:
Developingeconomies 4697 7 17 19 -22 4432 8 19 22 -20
MERCOSURf 217 7 18 24 -22 186 13 31 41 -28
ASEANg 814 6 12 14 -18 724 5 13 21 -23
EU(27)extra-trade 1525 4 17 13 -21 1672 3 16 17 -27
LeastDevelopedCountries(LDCs) 125 11 25 32 -27 144 13 24 29 -11
a IncludestheCaribbean.ForcompositionofgroupsseetheTechnicalNotesofWTOInternationalTradeStatistics,2009.b The2007annualchangeisaffectedbyareductionintradeassociatedwithfraudulentVATdeclaration.Forfurtherinformation,refertothe
specialnotesofthemonthlyUK Trade First Release(www.statistics.gov.uk/StatBase/Product.asp?vlnk=1119).c Importsarevaluedf.o.b.d Algeria,Angola,Cameroon,Chad,Congo,EquatorialGuinea,Gabon,Libya,Nigeria,Sudan.e HongKong,China;RepublicofKorea;SingaporeandTaipei,Chinese.f CommonMarketoftheSouthernCone:Argentina,Brazil,Paraguay,Uruguay.g AssociationofSoutheastAsianNations:Brunei,Cambodia,Indonesia,Laos,Malaysia,Myanmar,Philippines,Singapore,Thailand,VietNam.
Source: WTOSecretariat.

I – tHe tRADe sItuAtIon In 2009-10
29
AppendixTable2:World exports of commercial services by region and selected country, 2009(Billiondollarsandpercentage)
exports Imports
value Annual percentage change value Annual percentage change
2009 2005-09 2007 2008 2009 2009 2005-09 2007 2008 2009
World 3310 7 20 12 -13 3115 7 19 13 -12
north America 542 6 15 9 -10 430 4 9 7 -10
UnitedStates 470 7 16 10 -9 331 4 8 8 -9
south and central America b 100 9 18 16 -8 111 12 22 21 -8
Brazil 26 15 26 27 -9 44 18 28 28 -1
europe 1675 7 21 12 -14 1428 6 19 11 -13
EuropeanUnion(27) 1513 7 21 11 -14 1329 6 19 11 -13
UnitedKingdom 240 4 20 2 -16 160 0 15 1 -19
Germany 215 8 18 11 -11 255 5 16 11 -10
France 140 4 16 10 -14 124 4 16 10 -12
Spain 122 7 20 12 -14 87 7 23 9 -17
Italy 101 3 13 7 -15 114 6 21 8 -11
commonwealth of Independent states (cIs) 69 13 27 28 -18 91 11 30 26 -21
RussianFederation 42 14 27 30 -17 60 12 32 29 -19
Ukraine 13 10 26 27 -23 11 11 29 43 -32
Africa 78 9 19 19 -11 117 14 28 27 -11
Egypt 21 10 24 25 -15 14 9 27 25 -17
Morocco 12 13 24 12 -5 6 20 27 24 13
SouthAfrica 11 0 13 -8 -9 14 4 16 3 -16
middle east 96 11 16 20 -12 162 14 32 18 -13
Israel 22 6 10 14 -9 17 6 20 13 -12
Asia 751 9 22 14 -13 776 8 18 14 -11
Chinaa 129 15 33 20 -12 158 17 29 22 -0
Japan 124 5 10 15 -15 146 4 11 10 -11
HongKong,China 86 8 16 9 -6 44 7 15 11 -6
India 86 ... 25 18 ... 74 ... 21 26 ...
Singapore 74 8 26 3 -11 74 8 16 6 -6
Korea,Republicof 56 6 28 20 -25 74 6 21 12 -19
Taipei,Chinese 31 5 7 11 -10 29 -2 8 0 -15
aPreliminaryestimate.bIncludestheCaribbean.ForcompositionofgroupsseeChapterIVMetadataofWTOInternationalTradeStatistics,2009.Note: WhileprovisionalfullyeardatawereavailableinearlyMarchfor50countries,accountingformorethantwo-thirdsofworldcommercialservicestrade,estimatesformostothercountriesarebasedondataforthefirstthreequarters.Source: WTOSecretariat.

world Trade reporT 2010
30
AppendixTable3:merchandise trade: Leading exporters and importers, 2009 (Billiondollarsandpercentage)
Rank exporters value share Annual per cent
change Rank Importers value share Annual per cent
change
1 China 1202 9.6 -16 1 UnitedStates 1604 12.7 -26
2 Germany 1121 9.0 -22 2 China 1006 8.0 -11
3 UnitedStates 1057 8.5 -18 3 Germany 931 7.4 -21
4 Japan 581 4.7 -26 4 France 551 4.4 -22
5 Netherlands 499 4.0 -22 5 Japan 551 4.4 -28
6 France 475 3.8 -21 6 UnitedKingdom 480 3.8 -24
7 Italy 405 3.2 -25 7 Netherlands 446 3.5 -23
8 Belgium 370 3.0 -22 8 Italy 410 3.2 -26
9 Korea,Republicof 364 2.9 -14 9 HongKong,China 353 2.8 -10
-retainedimportsa 91 0.7 -8
10 UnitedKingdom 351 2.8 -24 10 Belgium 351 2.8 -25
11 HongKong,China 330 2.6 -11 11 Canada 330 2.6 -21
-domesticexportsa 15 0.1 -9
-re-exportsa 314 2.5 -11
12 Canada 316 2.5 -31 12 Korea,Republicof 323 2.6 -26
13 RussianFederation 304 2.4 -36 13 Spain 290 2.3 -31
14 Singapore 270 2.2 -20 14 Singapore 246 1.9 -23
-domesticexports 138 1.1 -21 -retainedimportsb 114 0.9 -28
-re-exports 132 1.1 -19
15 Mexico 230 1.8 -21 15 India 244 1.9 -24
16 Spain 218 1.7 -23 16 Mexico 242 1.9 -24
17 Taipei,Chinese 204 1.6 -20 17 RussianFederationc 192 1.5 -34
18 SaudiArabiaa 189 1.5 -40 18 Taipei,Chinese 175 1.4 -27
19 UnitedArabEmiratesa 175 1.4 -27 19 Australia 165 1.3 -17
20 Switzerland 173 1.4 -14 20 Switzerland 156 1.2 -15
21 Malaysia 157 1.3 -21 21 Poland 147 1.2 -30
22 India 155 1.2 -20 22 Austria 144 1.1 -22
23 Australia 154 1.2 -18 23 Turkey 141 1.1 -30
24 Brazil 153 1.2 -23 24 UnitedArabEmiratesa 140 1.1 -21
25 Thailand 152 1.2 -14 25 Thailand 134 1.1 -25
26 Austria 137 1.1 -24 26 Brazil 134 1.1 -27
27 Poland 134 1.1 -21 27 Malaysia 124 1.0 -21
28 Sweden 131 1.0 -29 28 Sweden 119 0.9 -29
29 Norway 121 1.0 -30 29 CzechRepublic 105 0.8 -26
30 Indonesia 120 1.0 -14 30 SaudiArabiaa 92 0.7 -20
Totalofaboved 10244 82.2 - Totalofaboved 10323 81.6 -
Worldd 12461 100.0 -23 Worldd 12647 100.0 -23
aSecretariatestimates.bSingapore’sretainedimportsaredefinedasimportslessre-exports.cImportsarevaluedf.o.b.dIncludessignificantre-exportsorimportsforre-export.Source:WTOSecretariat.

I – tHe tRADe sItuAtIon In 2009-10
31
AppendixTable4:merchandise trade: Leading exporters and importers excluding intra-eu(27) trade, 2009(Billiondollarsandpercentage)
Rank exporters value share Annual per cent
change Rank Importers value share Annual per cent
change
1 Extra-EU(27)exports 1525 16.2 -21 1 Extra-EU(27)imports 1672 17.4 -27
2 China 1202 12.8 -16 2 UnitedStates 1604 16.7 -26
3 UnitedStates 1057 11.2 -18 3 China 1006 10.5 -11
4 Japan 581 6.2 -26 4 Japan 551 5.7 -28
5 Korea,Republicof 364 3.9 -14 5 HongKong,China 353 3.7 -10
-retainedimportsa 91 0.9 -8
6 HongKong,China 330 3.5 -11 6 Canada 330 3.4 -21
-domesticexportsa 15 0.2 -9
-re-exportsa 314 3.3 -11
7 Canada 316 3.4 -31 7 Korea,Republicof 323 3.4 -26
8 RussianFederation 304 3.2 -36 8 Singapore 246 2.6 -23
-retainedimportsb 114 1.2 -28
9 Singapore 270 2.9 -20 9 India 244 2.5 -24
-domesticexports 138 1.5 -21
-re-exports 132 1.4 -19
10 Mexico 230 2.4 -21 10 Mexico 242 2.5 -24
11 Taipei,Chinese 204 2.2 -20 11 RussianFederationc 192 2.0 -34
12 SaudiArabiaa 189 2.0 -40 12 Taipei,Chinese 175 1.8 -27
13 UnitedArabEmiratesa 175 1.9 -27 13 Australia 165 1.7 -17
14 Switzerland 173 1.8 -14 14 Switzerland 156 1.6 -15
15 Malaysia 157 1.7 -21 15 Turkey 141 1.5 -30
16 India 155 1.6 -20 16 UnitedArabEmiratesa 140 1.5 -21
17 Australia 154 1.6 -18 17 Thailand 134 1.4 -25
18 Brazil 153 1.6 -23 18 Brazil 134 1.4 -27
19 Thailand 152 1.6 -14 19 Malaysia 124 1.3 -21
20 Norway 121 1.3 -30 20 SaudiArabiaa 92 1.0 -20
21 Indonesia 120 1.3 -14 21 Indonesia 92 1.0 -28
22 Turkey 102 1.1 -23 22 SouthAfricaa 72 0.7 -28
23 Iran,IslamicRep.ofa 78 0.8 -31 23 VietNam 69 0.7 -15
24 SouthAfrica 63 0.7 -22 24 Norway 69 0.7 -23
25BolivarianRep.ofVenezuela 58 0.6 -39 25 Iran,IslamicRep.ofa 51 0.5 -10
26 Kuwaita 57 0.6 -35 26 Israela 49 0.5 -27
27 VietNam 57 0.6 -10 27 Philippines 46 0.5 -24
28 Argentina 56 0.6 -20 28 Ukraine 45 0.5 -47
29 Chile 53 0.6 -20 29 Egypt 45 0.5 -7
30 Nigeriaa 53 0.6 -36 30 Chile 42 0.4 -32
Totalofaboved 8504 90.3 - Totalofaboved 8602 89.6 -
Worldd(excl.intra-EU(27)) 9419 100.0 -22
Worldd(excl.intra-EU(27)) 9605 100.0 -23
aSecretariatestimates.bSingapore’sretainedimportsaredefinedasimportslessre-exports.cImportsarevaluedf.o.b.dIncludessignificantre-exportsorimportsforre-export.Source:WTOSecretariat.

world Trade reporT 2010
32
AppendixTable5:Leading exporters and importers in world trade in commercial services, 2009(Billiondollarsandpercentage)
Rank exporters value shareAnnual percentage
change Rank Importers value shareAnnual percentage
change
1 UnitedStates 470 14.2 -9 1 UnitedStates 331 10.6 -9
2 UnitedKingdom 240 7.2 -16 2 Germany 255 8.2 -10
3 Germany 215 6.5 -11 3 UnitedKingdom 160 5.1 -19
4 France 140 4.2 -14 4 China 158 5.1 0
5 Chinaa 129 3.9 -12 5 Japan 146 4.7 -11
6 Japan 124 3.8 -15 6 France 124 4.0 -12
7 Spain 122 3.7 -14 7 Italy 114 3.6 -11
8 Italy 101 3.0 -15 8 Ireland 104 3.3 -5
9 Ireland 95 2.9 -7 9 Netherlands 87 2.8 -5
10 Netherlands 92 2.8 -11 10 Spain 87 2.8 -17
11 HongKong,China 86 2.6 -6 11 Canada 77 2.5 -11
12 India 86 2.6 ... 12 India 74 2.4 ...
13 Belgium 75 2.3 -11 13 Korea,Republicof 74 2.4 -19
14 Singapore 74 2.2 -11 14 Singapore 74 2.4 -6
15 Switzerland 68 2.1 -11 15 Belgium 72 2.3 -12
16 Sweden 60 1.8 -16 16 RussianFederation 60 1.9 -19
17 Luxembourg 60 1.8 -16 17 Denmark 51 1.6 -19
18 Canada 57 1.7 -12 18 Sweden 47 1.5 -14
19 Korea,Republicof 56 1.7 -25 19 HongKong,China 44 1.4 -6
20 Denmark 55 1.7 -25 20 Brazil 44 1.4 -1
21 Austria 53 1.6 -13 21 SaudiArabiab 43 1.4 ...
22 RussianFederation 42 1.3 -17 22 Australia 41 1.3 -13
23 Australia 41 1.3 -7 23 Thailand 38 1.2 -18
24 Norway 38 1.1 -17 24 Austria 38 1.2 -12
25 Greece 38 1.1 -25 25 Norway 37 1.2 -16
26 Turkey 33 1.0 -6 26 Luxembourg 36 1.2 -13
27 Taipei,Chinese 31 0.9 -10 27 UnitedArabEmiratesb 36 1.1 ...
28 Thailand 31 0.9 -9 28 Switzerland 34 1.1 -6
29 Poland 29 0.9 -19 29 Taipei,Chinese 29 0.9 -15
30 Malaysia 28 0.8 -8 30 Malaysia 27 0.8 -12
Totalofabove 2765 83.5 - 31 Totalofabove 2540 81.6 -
World 3310 100.0 -13 32 World 3115 100.0 -12
aPreliminaryestimate.bSecretariatestimate.Note:WhileprovisionalfullyeardatawereavailableinearlyMarchfor50countriesaccountingformorethantwo-thirdsofworldcommercialservicestrade,estimatesformostothercountriesarebasedondataforthefirstthreequarters.Source:WTOSecretariat.

I – tHe tRADe sItuAtIon In 2009-10
33
AppendixFigure1:monthly merchandise exports and imports of selected economies, January 2006 - January 2010 (Billiondollars)
Source:IMFInternationalFinancialStatisitics,GlobalTradeInformationServicesGTAdatabase,nationalstatistics.
0
20
40
60
80
0
30
60
90
120
150
0
10
20
30
40
50
60
70
Exports Imports
0
50
100
150
200
250
0
50
100
150
200
250
0
10
20
30
40
50
60
70
2006 2007 2008 2009 2006 2007 2008 2009
2006 2007 2008 2009 2006 2007 2008 2009
2006 2007 2008 2009 2006 2007 2008 2009
United States European Union (27) extra-trade
Germany France
United Kingdom Italy

world Trade reporT 2010
34
AppendixFigure1:monthly merchandise exports and imports of selected economies, January 2006 - January 2010 (Billiondollars)continued
Source:IMFInternationalFinancialStatisitics,GlobalTradeInformationServicesGTAdatabase,nationalstatistics.
Exports Imports
2006 2007 2008 2009 2006 2007 2008 2009
2006 2007 2008 2009 2006 2007 2008 2009
2006 2007 2008 2009 2006 2007 2008 2009
Japan China
Republic of Korea India
Russian Federation Brazil
0
5
10
15
20
25
30
35
0
10
20
30
40
50
0
5
10
15
20
25
0
10
20
30
40
50
0
30
60
90
120
150
0
20
40
60
80
100
I – tHe tRADe sItuAtIon In 2009-10
35
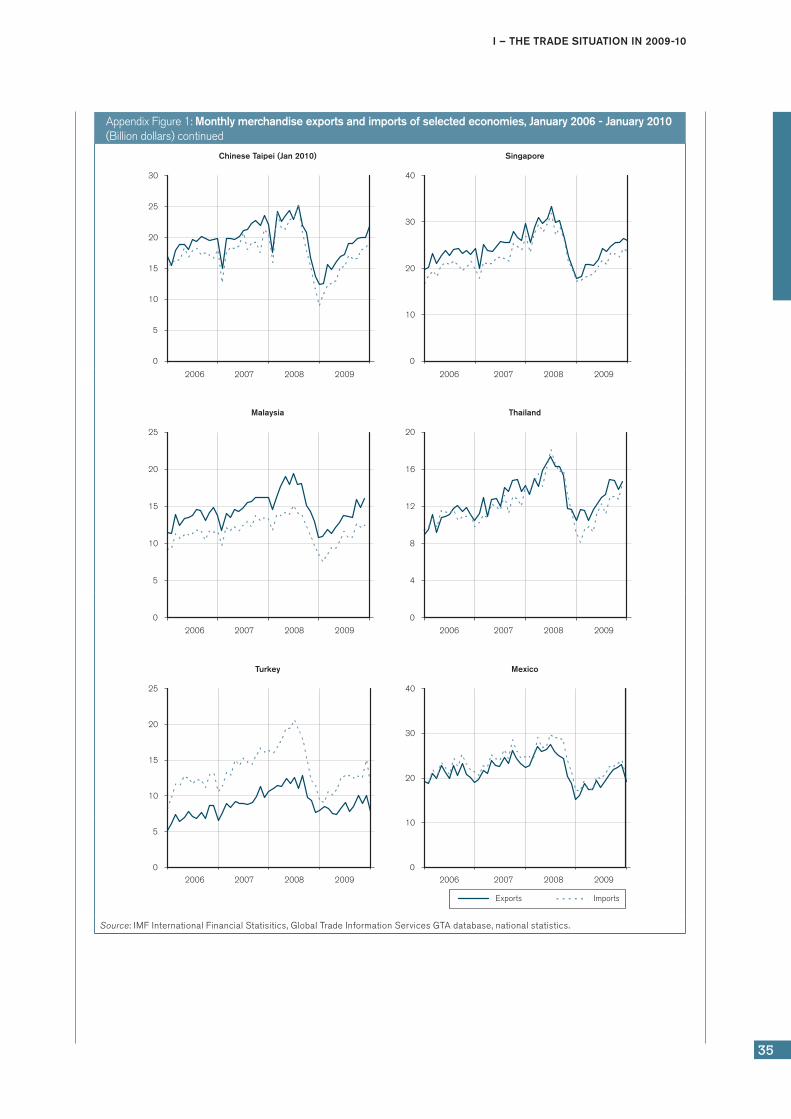
AppendixFigure1:monthly merchandise exports and imports of selected economies, January 2006 - January 2010 (Billiondollars)continued
Source:IMFInternationalFinancialStatisitics,GlobalTradeInformationServicesGTAdatabase,nationalstatistics.
Exports Imports
2006 2007 2008 2009 2006 2007 2008 2009
2006 2007 2008 2009 2006 2007 2008 2009
2006 2007 2008 2009 2006 2007 2008 2009
Chinese Taipei (Jan 2010) Singapore
Malaysia Thailand
Turkey Mexico
0
5
10
15
20
25
0
4
8
12
16
20
0
5
10
15
20
25
30
0
10
20
30
40
0
5
10
15
20
25
0
10
20
30
40

world Trade reporT 2010
36
AppendixFigure1:monthly merchandise exports and imports of selected economies, January 2006 - January 2010 (Billiondollars)continued
Source:IMFInternationalFinancialStatisitics,GlobalTradeInformationServicesGTAdatabase,nationalstatistics.
Exports Imports
2006 2007 2008 2009 2006 2007 2008 2009
2006 2007 2008 2009 2006 2007 2008 2009
2006 2007 2008 2009 2006 2007 2008 2009
Indonesia South Africa
Argentina Chile
Australia Canada
0
2
4
6
8
0
2
4
6
8
0
10
20
30
40
50
0
2
4
6
8
10
12
14
16
0
2
4
6
8
10
12
0
4
8
12
16
20

I – tHe tRADe sItuAtIon In 2009-10
37
endnotes1 Unless otherwise noted, world trade refers to world
merchandiseexports.Figuresforworldmerchandiseimportsaresimilarbutnotidenticaltoexportsduetotheinclusionofshippingandothercostsinimports,andtodifferencesintherecordingoftradeflows.
2 For a comprehensive analysis of the causes of tradecontraction,seeBaldwin,R.(2009), The Great Trade Collapse: Causes, Consequences and Prospects, London: Centre forEconomicPolicyResearch.
3 EuroareaGDPalsofellby4.0percent.


