Data set, KPIs, tools & methodologies
for impact assessment
Deliverable: D2.1
EC-GA nº Project full title:
612748 BEyond State of the art Technologies for re-Powering AC corridors & multi-Terminal HVDC Systems

D2.1 - Data set, KPIs, tools & methodologies for impact assessment
I
Document info sheet
Document Name: Data set, KPIs, tools & methodologies for impact assessment
Responsible Partner: Red Eléctrica de España
WP: WP #2
Task: Tasks 2.1, 2.2, 2.3, 2.4 & 2.5
Deliverable nº: 2.1
Revision: 1
Revision date: 31/07/2015
Name Company
Name Company
Author/s
I. Azpiri, R. Veguillas O. Despouys
M. Rebolini, M. Marzinotto, F. Palone, A. Sallati
W. Kiewitt, V. Gombert N. Lallouet, C. Bruzek
S. Borroy Vicente V. González, M. Lorenzo
Iberdrola RTE
Terna
50Hertz Nexans CIRCE REE
S. D’Arco J. García, Q.Zhao
J. Siborgs S. Finney
P. Lund, S. Sorensen C. Ugalde
D. Cirio, E. Ciapessoni R. Eriksson
S. Berljn
SINTEF IIT
ELIA STRATH
ENER CAR RSE DTU
STATNET
Task
Leader V. González REE
WP
Leader V. González REE
Diffusion list
Public.
Approvals
Version approved by Steering Committee
Documents History
Revision Date Author
1.0 30/09/2015 WP2 participants, TC and SC members

D2.1 - Data set, KPIs, tools & methodologies for impact assessment
II
Executive Summary
The present document represents the main outcome of Work Package 2 “Data set, KPIs, tools &
methodologies for impact assessment”. It aims to establish general and specific objectives, impacts and
barriers for all demos and Work Package 13 in order to determine objectively a set of KPIs with the purpose
to provide a general overview of the impact that will cause the technologies developed and tested during the
project. This will allow Work Package 13 to assess in an objective and comprehensive way the impact of the
Demos results and its implications at pan-European scope. This study will include a detail analysis on the
scalability and replicability potential of each tested solution.
1. Project Objectives, expected impacts and barriers to be overcome:
The Best Paths project aims to demonstrate the capabilities of several critical network technologies required
to increase the Pan European transmission network capacity and electric system flexibility, and thus will
allow to make Europe able of responding to the increasing share of renewables in its energy mix by 2020 and
beyond, while maintaining its present level of reliability performance. The main objectives of Best Paths
projects for each demo are:
o Demo 1: to move from HVDC lines to HVDC grids, in order to achieve this, it is due to demonstrate and
validate some important issues to keep on HVDC grid the same reliability standards as those achieved
for HVDC links. It is needed to investigate the behaviour and the interactions between the HVDC link
converters and the wind turbine converters, with special attention paid to the control system design
aspects and the behaviour when a fault occurs in the DC grid.
o Demo 2: to insure/secure that multi-terminal HVDC grids can rely on interoperable VSC-HVDC terminals,
especially because the VSC terminals could be supplied by different vendors. This underscores the need
of providing guiding foundations to establish interoperability standards in order to maximize the
reliability of the future DC grids.
o Demo 3: to design, develop and test new technological solutions for different HVDC elements designed
especially for HVDC links such as converters, submarine cables, land cables, HVDC High Temperature
Low Sag conductors, insulators for DC overhead lines, etc. Techniques to speed up fault locations
operations in DC cables will also be addressed in order to understand what a fault locator must have and
thus help to develop advanced fault locator systems.
o Demo 4: to research AC High Temperature Low Sag (HTLS) conductors and insulated cross-arms for
repowering existing lines as well as to validate innovative design and field working processes. Another
target of this demo is to develop a prototype of a dynamic line rating (DLR) system based on low cost
sensors in order to increase lines capacity.
o Demo 5: to design, build and test a full scale HVDC MgB2 superconducting cable to perform a type test
with a 5-30 m long test loop. These studies will be used to estimate the losses on the transmitted power
for different scenarios and an estimation of the reliability of the overall system and its availability. This

D2.1 - Data set, KPIs, tools & methodologies for impact assessment
III
superconducting cable will be compared with traditional cable and HTLS cable in terms of cost to
determine its viability.
o WP 13: to perform the assessment of the improvements achieved by each demonstration and to
evaluate the impact of the integrated solutions over the European network by the usage of a cost-
benefit analysis (CBA) and the assessment of level 1 and 2 Key Performance Indicators (KPIs).
-Expected impact:
Demo 1: HVDC links in offshore wind farms and offshore interconnections
Studying the interaction between wind turbine converters and HVDC link converters will give guidelines for a
better understanding of this technology. This knowledge will allow a reduction of costs and risks enabling the
realization of projects that are not possible yet from a technical and/or economical point of view. In addition
a better knowledge will permit smaller-scale stakeholders to have access to this market, improving in this
way the competitiveness.
Demo 2: HVDC-VSC multi-terminal interoperability
Maximize the interoperability for multivendor VSC-HVDC schemes will enable new DC grids composed of
equipment from several manufacturers, permitting TSOs to plan new HVDC Grid development based on
smaller building blocks and tenders rather than huge stand-alone links and projects. The acquired knowledge
will be a step forward in the creation of interoperability standards.
Offshore wind energy requires dedicated controls for HVDC converters, Demo 2 aspires to knock down the
last technical barriers for massive integration of renewable energy.
Demo 3: Innovative components and system control for new/upgraded HVDC links
The results of this demo will provide several advances in a wide range of HVDC transmission elements. Those
advances will allow manufacturers to develop more and better products to give competitive solutions to
present and future projects. The knowledge to be developed will be useful for both new projects and
rehabilitation projects, enabling in this way a transmission capacity increase, improve the performance and
extend the lifespan of existing connections. With a higher transmission capacity and with an advanced VSC
controls will be possible to achieve an efficient generation with environmental and economical benefits, a
greater flexibility and an enhanced operational security with a higher penetration of renewables.
Demo 4: Innovative repowering of AC corridors
The technologies researched might potentially lead to optimized transmission capacity on existing lines as
well as increase flexibility with regard to operation and maintenance. The researched technological options
might assist TSOs in overhead line construction, maintenance and operation.. Further, it potentially

D2.1 - Data set, KPIs, tools & methodologies for impact assessment
IV
facilitates new system operation options, the repowering of existing AC overhead lines and innovative
solutions to meet the needs of the future European grid.
Repowering existing overhead lines could also lead to a reduction of the overall investment costs since it is
not necessary to build new lines. Innovative design and field working processes will reduce costs due to
shorter building time and the minimization of downtimes on the lines.
Demo 5: DC superconducting cable
The overall goal of Demo 5 is to demonstrate that superconducting HVDC links are a viable solution for bulk
power transmission in the future grids. New technologies are required to relieve constraints on the grid,
particularly in the most populated and power-demanding areas of Europe: superconductors promise to
revolutionize power transfer by providing lossless and environmentally friendly transmission of electrical
power. The development of superconductors with transition temperatures higher than the boiling point of
liquid nitrogen (77 K = -196°C) has made the concept of superconducting power lines possible at least for
high-load applications. Superconducting cables are particularly suited for highly populated areas such as
dense districts of large cities, where purchase of a right-of-way for cables would be very costly. They can also
provide a very effective and efficient interface between two adjacent and asynchronous AC systems (power
hubs). In the longer term, this would also offer a very attractive solution for long-range transmission with
very limited power losses and could be the backbone of the future European transmission grid.
Based on the above, the main Demo impacts are summarized below:
IMPACT D1 D2 D3 D4 D5
Improvement in technical KNOWLEDGE (risk reduction) X X X X X
Beyond state of the art PERFORMANCES in specific technologies X X
Increase in COMPETITIVENESS (leads to cost reduction) X X
System PLANNING X X X X
System OPERATION X
Grid MAINTENANCE X
RES integration X X X X X
WP13: integrated global assessment for future replication in EU27
The specific improvements (beyond state of the art) of the different relevant technological areas, developed
and tested within each of the five Demos, must be aimed towards common objectives such as ensuring
increased network capacity and system flexibility. Under this premise, the results of each individual
demonstration will be assessed, as well as the combined effect of all the innovations developed, according to
their scalability and replicability potential, with the aim of evaluating the impact of the integrated solutions
proposed over the pan-European network, in accordance with the aforementioned objectives.

D2.1 - Data set, KPIs, tools & methodologies for impact assessment
V
-Barriers to overcome
Demo 1: HVDC links in offshore wind farms and offshore interconnections
There is a lack of detailed technical information, operational experience on the control and protection of
VSC-HVDC multi-terminal and meshed grids for transmission of -high quantities of energy generated by wind
power. This implies that exist an uncertainty that means high risks and leads to lower investment and slower
evolution of the technology to be studied. In order to obtain a comprehensive analysis the partners will
develop all the necessary tools to carry out an integral analysis of the technology.
The construction of the test facility will be another barrier to overcome; especially since there is a risk of
damage to demonstrator components by wrong design or human errors during the tests. The budget could
be also a problem because it could limit the system downscaling, this way impeding a profound
understanding of real system behaviour.
Demo 2: HVDC-VSC multi-terminal interoperability
No multivendor VSC-HVDC system is under operation so far, that means that there is no experience on
operation available about this issue. To obtain all information required to know this technology precisely it is
necessary to carry out simulations that reflect a large number of different situations, which is really
challenging. Moreover manufacturers that participate in this demo have to find solutions that respect the
confidentiality of their products on the one hand but share enough data and models needed to perform the
tests on the other hand.
Demo 3: SACOI link
Most of the barriers of this demo are technological. The elements to be tested have to comply with some
certain specifications as could be mechanical and electrical properties of materials, elements handling
(specially for heavier and stiffer cables), complex numerical simulations for fault location systems,
development of new VSC converter elements and control system, etc.
A potential barrier to overcome is about costs: the solutions achieved during this project have to be
affordable in terms of costs or benefit acquired compared to other existing solutions.
Demo 4: Innovative repowering of AC corridors
There is limited experience with HTLS conductors and insulated cross-arms technology among European
TSOs for repowering existing overhead lines. The expertise in these fields is still limited to some specific types
and technologies. The economical assessment could be complicated as the repowering using HTLS and
insulated cross-arms usually incurs changes to or exchanges of some line elements, this way decreasing the
cost effectiveness of the upgrading.

D2.1 - Data set, KPIs, tools & methodologies for impact assessment
VI
The permitting process for the introduction of new technologies and methods for innovative designs and
field working processes may be time-consuming and the changes in overhead lines design might have
technical and quality impacts which cannot be determined during the project duration. Unconventional
materials used for innovative designs and field working processes may have significantly higher costs for
procurement, installations and maintenance.
Demo 5: DC superconducting cable
It is very difficult to obtain or to estimate CAPEX and OPEX to compare MgB2 superconducting installations
with other technical options (conventional and HTS).
Furthermore, provided the limited size of the demonstrator, it will be very difficult to assess the reliability of
a full size facility. These full size projects would also need for a parallel development and increase of the
power rates of the rest of components in order to achieve the massive levels of transmission allowed by
HVDC superconductivity.
In terms of control, there is a need for new ways to measure and to control the very low voltage drop across
the very low resistance from the resistive bus bars and terminations for the connection to the grid.
Other barriers include the lack of stardards and the lack of experience and human resources expertise in
maintenance activities of this kind of facilities.
An overview of the main barriers to carry out the different demos is shown below:
BARRIERS D1 D2 D3 D4 D5
TECHNICAL (complexity of the solution and/or lack of background) X X X X X
Representativeness/Interpretation of the results (from DEMO to real
facility)
X X X
Suitable FACILITIES to host demonstrator X X
REGULATORY/LICENSING X
Finally, with regards to WP13:
WP13: integrated global assessment for future replication in EU27
Main barriers are on the one hand the uncertainties related to the European economic environment: its
previsions could jeopardize the robustness of the CBA performed.
On the other hand an important barrier to obtain meaningful results is the availability of the needed data
and models in time for performing the replicability and scalability analyses of the Best Paths project.
D2.1 - Data set, KPIs, tools & methodologies for impact assessment
VII
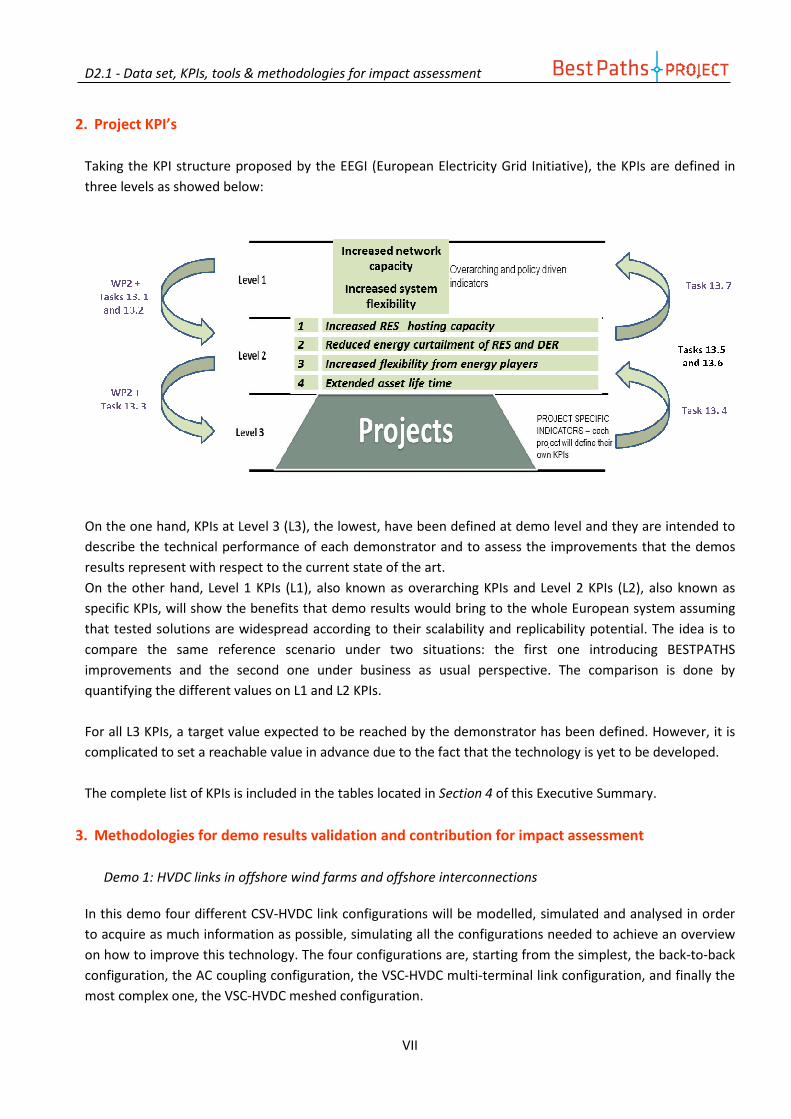
2. Project KPI’s
Taking the KPI structure proposed by the EEGI (European Electricity Grid Initiative), the KPIs are defined in
three levels as showed below:
On the one hand, KPIs at Level 3 (L3), the lowest, have been defined at demo level and they are intended to
describe the technical performance of each demonstrator and to assess the improvements that the demos
results represent with respect to the current state of the art.
On the other hand, Level 1 KPIs (L1), also known as overarching KPIs and Level 2 KPIs (L2), also known as
specific KPIs, will show the benefits that demo results would bring to the whole European system assuming
that tested solutions are widespread according to their scalability and replicability potential. The idea is to
compare the same reference scenario under two situations: the first one introducing BESTPATHS
improvements and the second one under business as usual perspective. The comparison is done by
quantifying the different values on L1 and L2 KPIs.
For all L3 KPIs, a target value expected to be reached by the demonstrator has been defined. However, it is
complicated to set a reachable value in advance due to the fact that the technology is yet to be developed.
The complete list of KPIs is included in the tables located in Section 4 of this Executive Summary.
3. Methodologies for demo results validation and contribution for impact assessment
Demo 1: HVDC links in offshore wind farms and offshore interconnections
In this demo four different CSV-HVDC link configurations will be modelled, simulated and analysed in order
to acquire as much information as possible, simulating all the configurations needed to achieve an overview
on how to improve this technology. The four configurations are, starting from the simplest, the back-to-back
configuration, the AC coupling configuration, the VSC-HVDC multi-terminal link configuration, and finally the
most complex one, the VSC-HVDC meshed configuration.

D2.1 - Data set, KPIs, tools & methodologies for impact assessment
VIII
Two types of models will be developed; the first type is “Switched models”, their characteristic is that these
models represent the performance of the system in an accurate way, enabling to perform electromagnetic
simulations, total harmonic distortion, high frequency harmonic analysis, DC faults, interactions and
oscillations between the components of the HVDC link; in return the simulations need more time to be
performed. The second type is “Averaged models”, they represent the operation of the system at 50 Hz, their
characteristic is that they are faster to simulate but that the accuracy is lower. These models are useful to
perform dynamic electromechanical analysis and load flow simulations.
The models obtained need to be validated before carrying out the simulation studies, this validation will be
performed against the experimental results with a small-scale demonstrator. The tolerated level of
differences isn’t allowed to be higher than 15%: if this occurs the models need to be refined and simulated
again until their accuracy is achieved.
A set of simulations will be carried out to study the performance of each configuration. For this purpose the
scaled-down demonstrator needs to be developed under realistic objectives in order to get realistic data
from the simulations.
Demo 2: HVDC-VSC multi-terminal interoperability
A total of five DC topologies are to be studied. The elementary topologies (T1, T2 and T3 – see section 2.2.3
of the present document) will be exhaustively studied, performing offline simulations and real-time
simulations. These topologies are the elementary bricks from which larger DC grids can be built up.
Topologies T1, T2 and T3 will be studied under the same conditions in two different stages; first, offline
simulations will be performed for a first assessment.Second, with the data obtained a real-time simulation
will be done, obtaining in this way interoperability issues. The encountered interoperability issues will be
classified as unsolved, identified and presumably fixed or identified and fixed interoperability issues, giving at
the end of the project the degree of interoperability achieved for each DC topology.
For topologies T4 and T5 just offline simulations will be carried out using EMTP because these topologies
imply more than three converters to perform real-time simulations and for this demo only three replicas will
be available. Comparing the results of topologies T1, T2 and T3 with those corresponding with T4 and T5 will
make it possible to assess how the results obtained from simplest DC topologies are replicable for larger and
arbitrary DC grids.
Demo 3: SACOI link
As this demo addresses different elements typically present on HVDC interconnectors, different
methodologies will be deployed. The overall vision of the different methodologies will enable the assessment
of the impact of this demo.
The converter full load losses tests will be evaluated at the design stage using the methodology established
in EN 62751-1/2, on the other hand the converter current THD will be measured using the EN 61000-4-30
and EN 61000-4-7. The converter power reversal time will be evaluated as well; this time is defined as the

D2.1 - Data set, KPIs, tools & methodologies for impact assessment
IX
delay between the step change in the control signal and the stabilization of the converter power inside ±10%
boundary around the set value.
Land and submarine cable test cycles will be performed according to pre-qualification procedure described in
CIGRE TB496.
The HTLS conductor ampacity will be measured according to CIGRE TB 207 and the DC resistance will be
determined at the manufacturer facilities. Tests will be made partly based on current HTLS testing
procedures (devoted to AC conductors) and partly on new procedures defined ad hoc.
For the characterization of polymer insulators for DC lines has to be established a procedure in both terms of
laboratory and field tests. A reference from CIGRE Technical Brochures 555 and 481 will be used to
laboratory tests. As regards field measurements will be characterized by ESDD and NSDD according to IEC
60815-1.
There is no standard procedure for fault location due each HVDC link has its own peculiarities, for this reason
the duration and the accuracy of fault locator has to be evaluated based only on past experience.
Demo 4: Innovative repowering of AC corridors
In this demo it is needed to set up a set of technical use cases for HTLS conductors in order to summarize the
technical challenges that could potentially be solved by the use of these conductors taking into account the
relevance of each use case from perspective of each TSO participating in the BestPaths project.
To carry out the HTLS test programs, existing test methodswill be reviewed and analysed in order to base
them on existing experiences and shared know-how. These tests are expected to deliver findings on
operational and long-term behaviour of HTLS and insulated cross-arms. These results will be applied to the
defined use cases established before in order to assess their impact into the grid.
With the new innovative overhead designs and field working processes developed in this demo an impact
assessment will be performed by calculating the savings in time for live line working or the cost per kilometer
for each concept/method.
For the assessment of the net transfer capacity with the usage of DLR systems, a comparison between the
capacities potentially obtained with DLR and without will be carried out.
Demo 5: DC superconducting cable
To assess the impacts, two approaches will be carried out in parallel.
- The first one is a “type test” approach based on manufacturing and testing hardware pieces of equipment.

D2.1 - Data set, KPIs, tools & methodologies for impact assessment
X
- The second is technical economic evaluation of different applications in the grid including long length applications.
With regards to the first one, in addition to the pre-tests required to qualify independently of the different
components, the overall demonstrator will be tested according to the methods inspired from CIGRE B1.31
recommendations for AC cables (type tests) and transposed to DC applications.
The methodology and the test sequence proposed are as follow:
- Bending test followed by HVDC tests - Pressure tests on the assembly - DC voltage test on the assembly - Superimposed-impulse voltage test followed by DC voltage test on the assembly
In relation with the second approach, the technical evaluation will be carried out. It will include the cost
estimation of the following 6 key pieces of equipment:
a) Terminations b) Cable conductor including the MgB2 wires c) Cryo-envelope with the HV insulation d) Joint e) Cooling systems f) Pressurization/circulation fluid systems.
The number of pieces of equipment required (joints, number of piece of cryo-envelope, cable conductor
length...) is dependent on the application cases studied in the project.
WP13: integrated global assessment for future replication in EU27
The Work Package 13 will use a methodology based on five steps to achieve a complete assessment of the
combined impact that the innovations obtained during the project will cause.
The first step is focused on defining and modelling a common reference transmission system at European
level. This model (Business As Usual) will be used in following steps to be compared with the Best Paths
model (model that includes the innovations achieved during the project). This model has to be as general as
possible, for this reason the ENTSO-E 10-year network will be used to determine its characteristics.
The next step is to perform an identification of the affected level 1 and level 2 KPIs by the whole project,
according to the expected impact derived from the implementation of the results obtained by each demo.
The step three is dedicated to define and model a scenario, called Best Path Scenario, which will be the
reference transmission system at European level with the innovations obtained from the results of the
demos level 3 KPI assessments.
The fourth step will define the simulations needed for the evaluations of level 1 and level 2 KPIs. It is needed
to perform power flow studies to assess the impacts by comparing the results obtained both with (Best Paths

D2.1 - Data set, KPIs, tools & methodologies for impact assessment
XI
scenario) and without (BAU scenario) innovative solutions. However, several intrinsic difficulties must be
taken into account as could be the spatial dimension, the time duration in order to make the assessment
representative, and the level of detail of the considered network topologies with the aim of find a balance
between the complexity of the network model used and the accuracy of the obtained results when modelling
the pan-European system.
The last step is focused on the evaluation of the results obtained in the simulation of the previous step in
order to assess the level 1 and 2 KPIs. For this purpose the results obtained previously will be included in the
KPI equations defined in section 2.6.3 as well as information about economic data related to CAPEX and
OPEX associated to the implementation of the innovations and the costs related to the business as usual
scenario.

D2.1 - Data set, KPIs, tools & methodologies for impact assessment
I
4. KPIs summary
Demo KPI Code KPI name Description
1
KPI.D1.1
AC/DC
interacti
ons –
power
and
harmoni
cs
Validates if the proposed converter configurations, DC network topologies and controllers achieve the expected
performance in terms of AC/DC interactions.
It measures the performance in three different areas
Title Description Target value Units
KPI.D1.1.1
Steady state performance
Evaluates the performance of the converter
controllers by measuring the steady state error of a
number of variables after a defined settling time.
Five variables are measured:
C1: Steady state error of the active power
C2: Steady state error of the reactive power
C3: Steady state error of the DC voltage at the
converter terminals
C4: Steady state error of the voltage of offshore AC
networks
C5: Steady state error of the frequency of offshore
AC networks
[1%, 1%, 0
(for constant
DC voltage
control mode)
or 2% (droop
control mode),
5%, 1%]
C1: p.u
(W)
C2: p.u
(vAR)
C3: p.u
(V)
C4: p.u
(V)
C5: Hz
KPI.D1.1.2
AC and DC power quality
Establishes if the power quality of both AC and DC
voltages are within the limits stated in standards.
Two aspects will be evaluated:
C1: Harmonics of AC voltages
C2: Ripple of DC voltages
[10%, 2%]
C1:
dimension
-less
C2: p.u
(V)
KPI.D1.1.3
Wind turbine ramp rates
Maximum Power Ramp Rate (MW/s) solicitation to
any WTG to assure Wind Park stability after DC fault
One variable is measured:
C1: Active power ramp rate
<1 MW/s

D2.1 - Data set, KPIs, tools & methodologies for impact assessment
II
Demo KPI Code KPI name Description
1
KPI.D1.2
AC/DC
Interacti
ons:
Transien
t
Respons
e &
Voltage
Margins
Studies necessary to evaluate transient response of HVDC networks for wind connection are identified. These studies
will be used to validate whether or not the proposed converter configurations, DC network topologies and controllers
achieve the expected performance in terms of transient performance under normal and extreme operation
conditions.
Title Description Target value Units
KPI.D1.2.1
Normal Operation
Evaluate dynamic power flows, under normal
operating conditions, in response to:
Variation in wind input power
Reallocation of power between AC nodes
Measured variables2:
C1: DC link voltage
C2: Cell capacitance voltage
C3: Converter arm current
C4: Converter AC real and reactive power
C5: Converter terminal voltage (at wind farms and
AC grid connections).
80% of
identified
cases
successfully1
simulated and
evaluated
%

D2.1 - Data set, KPIs, tools & methodologies for impact assessment
III
KPI.D1.2.2
Extreme Operation
Evaluate dynamic power flows, under extreme
operating conditions, in response to:
AC fault at grid terminal (either sinking or sourcing
power) Loss of wind farm connection
Loss of individual DC line in mesh network
Measured variables2:
C1: DC link voltage
C2: Cell capacitance voltage
C3: Converter arm current
C4: Converter AC real and reactive power
C5: Converter terminal voltage (at wind farms and
AC grid connections).
C6: System settling time
80% of
identified
cases
successfully1
simulated and
evaluated
%
Note: 1Successful simulation may have one of two outcomes: either the system simulation is operational and all parameters remain
within limits, or the system simulation is operational and some or none of the parameters do not remain within limits. 2Converter parameters should remain within safe operating limits AC grid quantities to remain within appropriate grid codes.
Demo KPI Code KPI name Description
1
KPI.D1.3
Protecti
on
perform
ance
Protecti
on &
Faults
The aim is to validate the functionality and the performances of the protection system for fault location and
clearance. The following KPI refer to a line to ground short circuit fault in a few selected fault locations (e.g. 6
points).
Variable Target value Units
KPI.D1.3.1 Protection Selectivity Yes/No -
KPI.D1.3.2 Peak current < 3 pu
KPI.D1.3.3 Clearance time < 6 ms

D2.1 - Data set, KPIs, tools & methodologies for impact assessment
IV
Demo KPI Code KPI name Description
1
KPI.D1.4
DC
interarra
y design
Validates if the proposed DC interarray topologies achieve the expected performance in terms of Wind Farm security,
operation and maintenance
Title Description Target
value Units
KPI.D1.4.1 Interarray topology
Maximum number of wind turbines to conform a
DC interarray <5 -
KPI.D1.4.2
Fault tolerance
Designed to withstand a single DC interarray
short-circuit without stopping the whole wind
farm.
Variable: Number of short-circuits that the WF can
withstand without stopping.
≥1 -
KPI.D1.4.3 Power unbalance
Maximum power unbalance between wind
turbines on each interarray. >3 %
KPI.D1.4.4 Motorising capability
DC interarray topology allows wind turbine
motorising for maintenance tasks. It can deliver
(P>0) and consume (P<0) active power.
P>0 and P<0 [MW]
Demo KPI Code KPI name Description
1
KPI.D1.5
Resonan
ces
Studies necessary to evaluate potential resonances are identified. Categories of resonance include: internal inter-
converter DC resonance; interaction with windfarm connections; interaction with AC grids of various system strength
Title Description Target
value Units
KPI.D1.5.1
Resonance with AC Systems
Simulations will identify potential oscillatory
modes2 between DC converter stations and
connected AC networks. AC networks will include
large inverter-connected windfarms or
conventional synchronous generator dominated
AC grids.
80% of
identified
cases
successfully1
simulated and
evaluated
%

D2.1 - Data set, KPIs, tools & methodologies for impact assessment
V
KPI.D1.5.2
Internal DC Resonance
Simulations will identify potential oscillatory
modes2 between converter terminals on HVDC
networks.
80% of
identified
cases
successfully1
simulated and
evaluated
%
Note: 1Successful simulation may have one of two outcomes: either the system simulation is operational and all parameters remain
within limits, or the system simulation is operational and some or none of the parameters do not remain within limits. 2Oscillatory modes may be control-band effects, or may be the result of switching frequency harmonics and passive component
resonance.
Demo KPI Code KPI name Description
1
KPI.D1.6
Grid
Code
complia
nce
Evaluates if the controllers developed during the project fulfil the requirements specified in National Grid grid code. It
measures the performance in four different areas.
Title Description Target
value Units
KPI.D1.6.1
Active power control
Establishes if the active power control of the grid-
connected HVDC converters operates correctly and
fulfil the frequency control criteria specified in the
National Grid grid code.
Measured variable:
C1: Steady state error of the active power after a
defined settling time.
5% p.u (P)
KPI.D1.6.2
Reactive power control
Establishes if the reactive power control of the grid
connected HVDC converters operates correctly and
fulfil the voltage control criteria specified in the
National Grid grid code.
Measured variable:
C1: Steady state error of the reactive power after a
defined settling time.
5% p.u (Q)
D2.1 - Data set, KPIs, tools & methodologies for impact assessment
VI
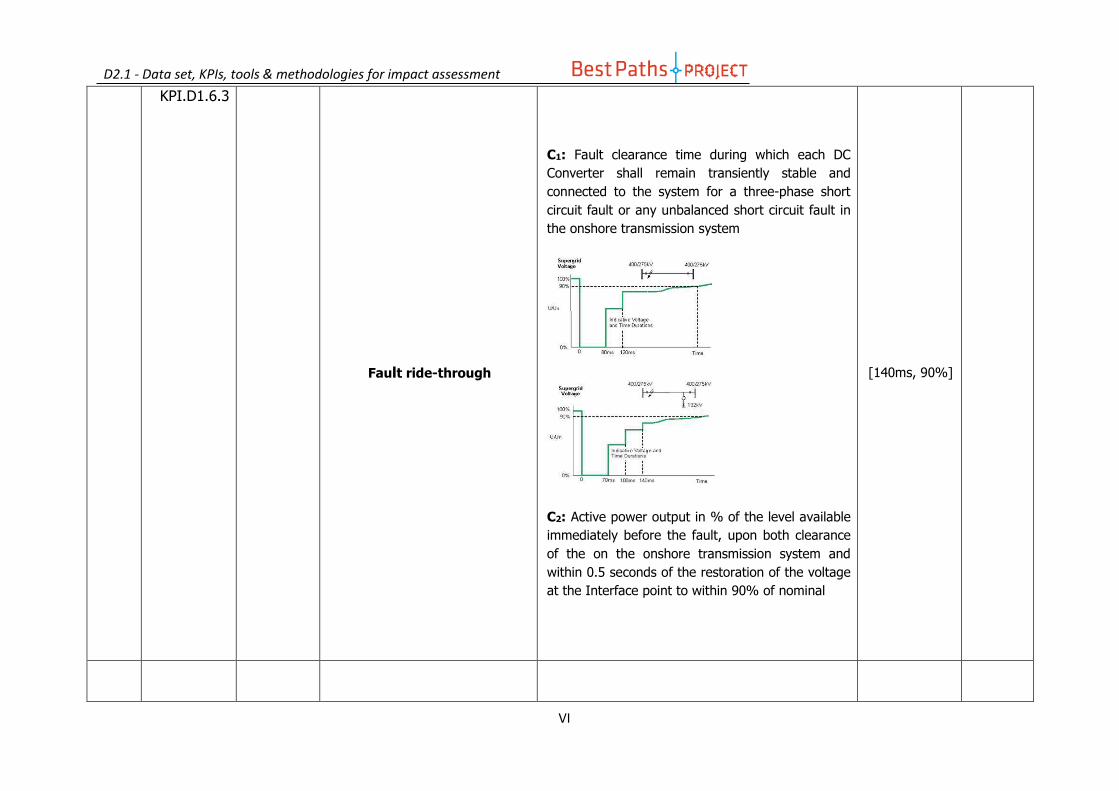
KPI.D1.6.3
Fault ride-through
C1: Fault clearance time during which each DC
Converter shall remain transiently stable and
connected to the system for a three-phase short
circuit fault or any unbalanced short circuit fault in
the onshore transmission system
C2: Active power output in % of the level available
immediately before the fault, upon both clearance
of the on the onshore transmission system and
within 0.5 seconds of the restoration of the voltage
at the Interface point to within 90% of nominal
[140ms, 90%]

D2.1 - Data set, KPIs, tools & methodologies for impact assessment
VII
Demo KPI Code KPI name Description
1
KPI.D1.7
Demonst
rator
perform
ance at
converte
r unit
level
Measures the correlation between the measurements of the individual converter units used in the demonstrator and
the results from the simulation models through four variables
Variable Target
value Units
KPI.D1.7.1 Rise time for step in current reference (single unit)
<15%
variation
compared to
the
simulation
model
-
KPI.D1.7.2 Overshoot for step in current reference (single unit)
<15%
variation
compared to
the
simulation
model
-
KPI.D1.7.3 Settling time for step in current reference (single unit)
<15%
variation
compared to
the
simulation
model
-

D2.1 - Data set, KPIs, tools & methodologies for impact assessment
VIII
Demo KPI Code KPI name Description
1
KPI.D1.8
Demonst
rator
perform
ance at
system
level
Measures the correlation between the measurements of the converters when they are integrated in the complete
demonstrator system and the results from the simulation models through four variables
Variable Target
value Units
KPI.D1.8.1 Steady state performance
<15%
variation
compared to
the
simulation
model
-
KPI.D1.8.2 Rise time for step in current reference (system level)
<15%
variation
compared to
the
simulation
model
-
KPI.D1.8.3 Overshoot for step in current reference (system level)
<15%
variation
compared to
the
simulation
model
-
KPI.D1.8.4 Settling time for step in current reference (system level)
<15%
variation
compared to
the
simulation
model
-

D2.1 - Data set, KPIs, tools & methodologies for impact assessment
IX
Demo KPI Code KPI name Description Measurement / Verification Target
value Units
2 KPI.D2.1
Complianc
e of EMTP
VSC
models to
the
specificatio
ns
The first deliverable in DEMO #2
(D4.1) will describe among other
things the functional specifications for
VSC converters used in the remaining
of the project. Then, the three
manufacturers will provide EMTP
models of the converters which
should comply with those
specifications (subtasks 4.2.1 to
4.2.3). The testing and validation of
each individual model (subtask 4.2.4)
is therefore an important indicator of
their compliance to the specifications,
and expected adequacy for future
interoperability tests.
Therefore, this KPI is intended to
measure the validity of each EMTP
model, as their compliance to the
original specifications will be a
prerequisite to forthcoming
interoperability tests.
Deliverable D4.1 will include a set of tests with associated
acceptance criteria. All those tests will be performed
during subtask 4.2.4 on each individual model provided
by the three manufacturers; for obvious reasons, non-
manufacturer members of DEMO #2 will be in charge of
this validation. The final value for this KPI will be the
percentage of passed tests, for each model.
85% for ABB
85% for Alstom
Grid
85% for
SIEMENS
%
D2.1 - Data set, KPIs, tools & methodologies for impact assessment
X
Demo KPI Code KPI name Description Measurement / Verification Target
value Units
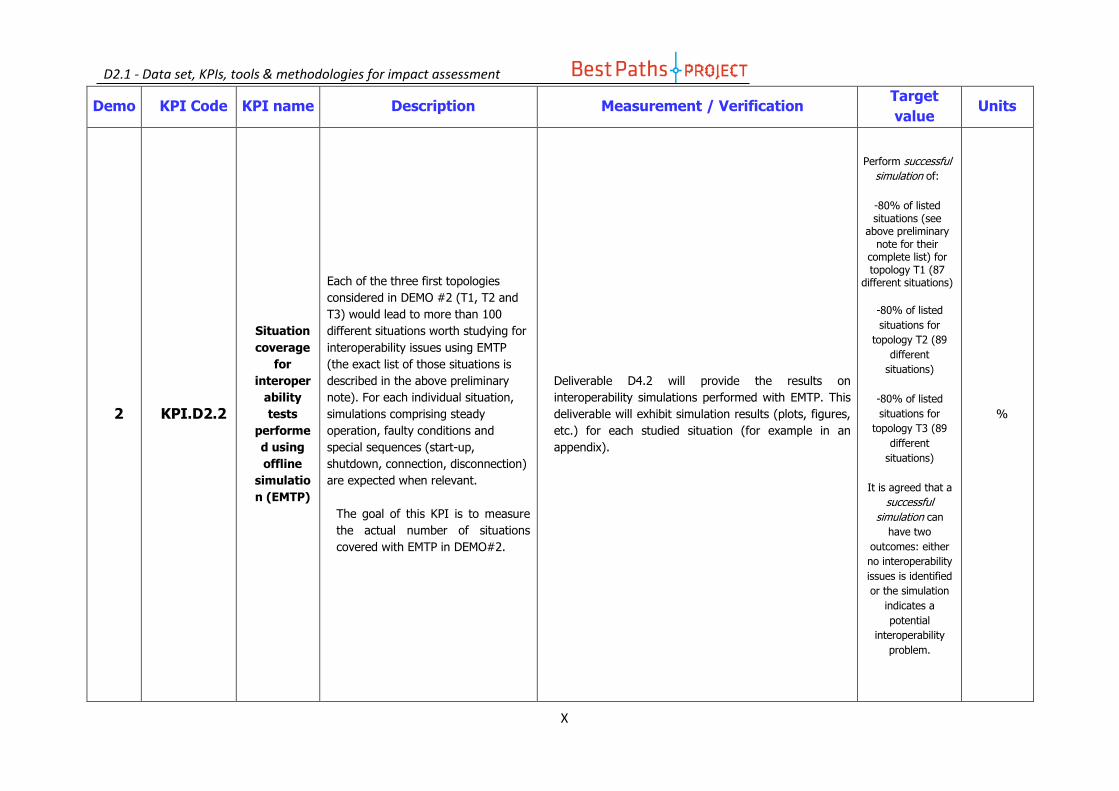
2 KPI.D2.2
Situation
coverage
for
interoper
ability
tests
performe
d using
offline
simulatio
n (EMTP)
Each of the three first topologies
considered in DEMO #2 (T1, T2 and
T3) would lead to more than 100
different situations worth studying for
interoperability issues using EMTP
(the exact list of those situations is
described in the above preliminary
note). For each individual situation,
simulations comprising steady
operation, faulty conditions and
special sequences (start-up,
shutdown, connection, disconnection)
are expected when relevant.
The goal of this KPI is to measure
the actual number of situations
covered with EMTP in DEMO#2.
Deliverable D4.2 will provide the results on
interoperability simulations performed with EMTP. This
deliverable will exhibit simulation results (plots, figures,
etc.) for each studied situation (for example in an
appendix).
Perform successful
simulation of:
-80% of listed situations (see
above preliminary note for their
complete list) for topology T1 (87
different situations)
-80% of listed
situations for
topology T2 (89
different
situations)
-80% of listed
situations for
topology T3 (89
different
situations)
It is agreed that a
successful
simulation can
have two
outcomes: either
no interoperability
issues is identified
or the simulation
indicates a
potential
interoperability
problem.
%
D2.1 - Data set, KPIs, tools & methodologies for impact assessment
XI
Demo KPI Code KPI name Description Measurement / Verification Target
value Units
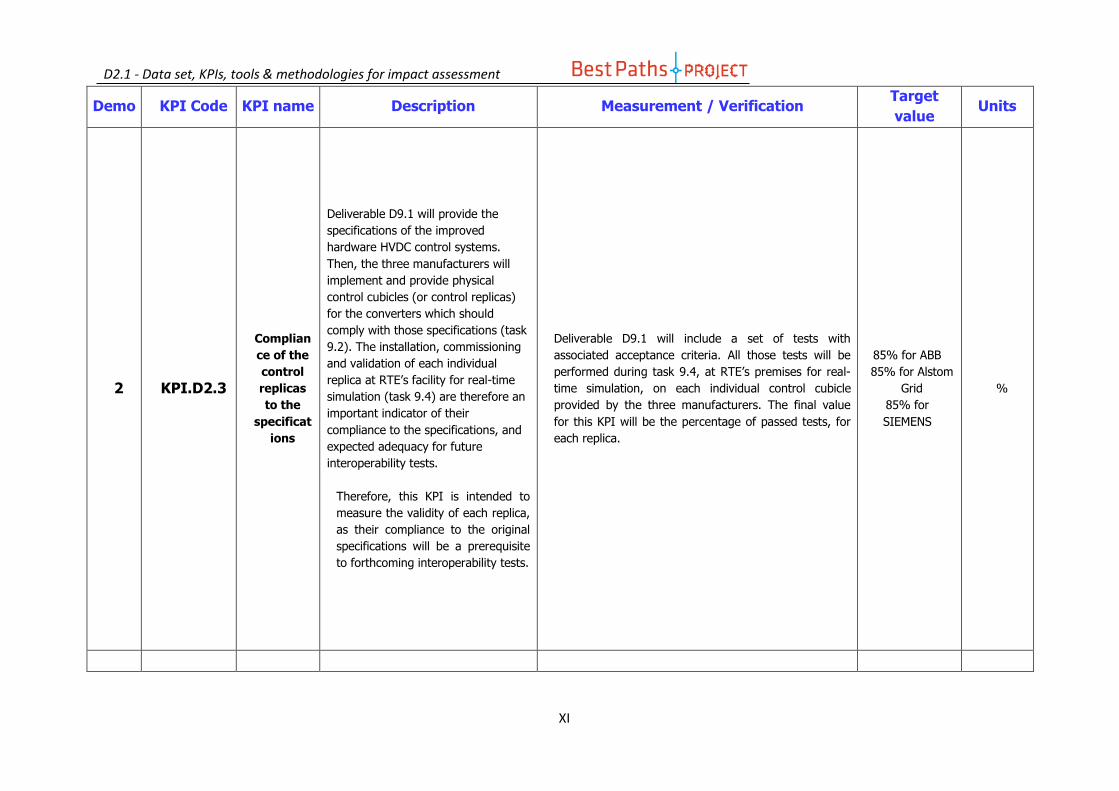
2 KPI.D2.3
Complian
ce of the
control
replicas
to the
specificat
ions
Deliverable D9.1 will provide the
specifications of the improved
hardware HVDC control systems.
Then, the three manufacturers will
implement and provide physical
control cubicles (or control replicas)
for the converters which should
comply with those specifications (task
9.2). The installation, commissioning
and validation of each individual
replica at RTE’s facility for real-time
simulation (task 9.4) are therefore an
important indicator of their
compliance to the specifications, and
expected adequacy for future
interoperability tests.
Therefore, this KPI is intended to
measure the validity of each replica,
as their compliance to the original
specifications will be a prerequisite
to forthcoming interoperability tests.
Deliverable D9.1 will include a set of tests with
associated acceptance criteria. All those tests will be
performed during task 9.4, at RTE’s premises for real-
time simulation, on each individual control cubicle
provided by the three manufacturers. The final value
for this KPI will be the percentage of passed tests, for
each replica.
85% for ABB
85% for Alstom
Grid
85% for
SIEMENS
%
D2.1 - Data set, KPIs, tools & methodologies for impact assessment
XII
Demo KPI Code KPI name Description Measurement / Verification Target
value Units
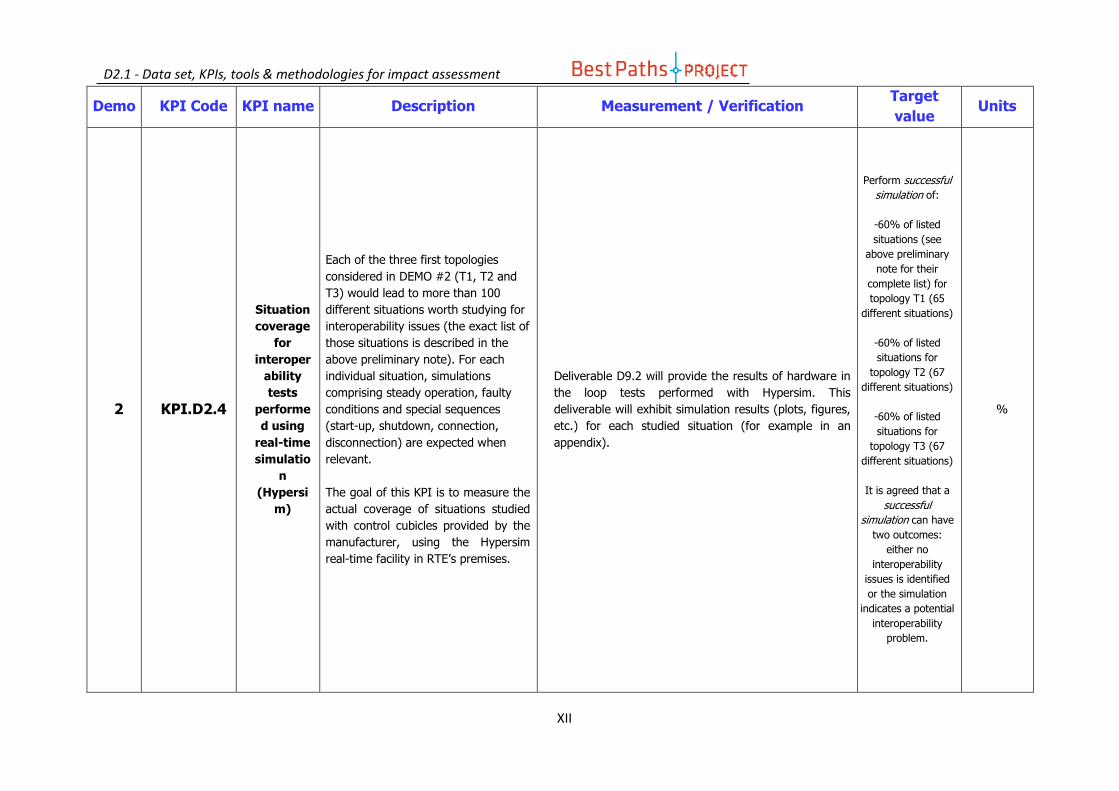
2 KPI.D2.4
Situation
coverage
for
interoper
ability
tests
performe
d using
real-time
simulatio
n
(Hypersi
m)
Each of the three first topologies
considered in DEMO #2 (T1, T2 and
T3) would lead to more than 100
different situations worth studying for
interoperability issues (the exact list of
those situations is described in the
above preliminary note). For each
individual situation, simulations
comprising steady operation, faulty
conditions and special sequences
(start-up, shutdown, connection,
disconnection) are expected when
relevant.
The goal of this KPI is to measure the
actual coverage of situations studied
with control cubicles provided by the
manufacturer, using the Hypersim
real-time facility in RTE’s premises.
Deliverable D9.2 will provide the results of hardware in
the loop tests performed with Hypersim. This
deliverable will exhibit simulation results (plots, figures,
etc.) for each studied situation (for example in an
appendix).
Perform successful
simulation of:
-60% of listed
situations (see
above preliminary
note for their
complete list) for
topology T1 (65
different situations)
-60% of listed
situations for
topology T2 (67
different situations)
-60% of listed
situations for
topology T3 (67
different situations)
It is agreed that a
successful
simulation can have
two outcomes:
either no
interoperability
issues is identified
or the simulation
indicates a potential
interoperability
problem.
%

D2.1 - Data set, KPIs, tools & methodologies for impact assessment
XIII
Demo KPI Code KPI name Description Measurement / Verification Target
value Units
2 KPI.D2.5
Measure
of the
actual
improve
ment
realized
on
interoper
ability
issues
detected
during
offline
simulatio
ns.
Topologies T1, T2 and T3 will be
tested using EMTP in offline
simulations first, and later, in real-
time with Hypersim. Interoperability
issues are already expected during the
first stage (EMTP simulations), which
will be reported in deliverable D4.2.
As detailed specifications will be
provided for the physical
implementation, enriched with the
experience gained thanks to the EMTP
simulations, some of these
interoperability issues (identified at
the offline simulation stage) should be
fixed for real-time tests, with a special
attention for the issues which have
the largest impact.
The goal of this KPI is exactly to
measure the improvement that was
made on interoperability issues
detected during the offline simulation
phase of the project, as some of them
shouldn’t occur again during real-time
simulation.
Deliverables D4.2 and D9.2 will provide the results on
interoperability simulations performed in offline and
real-time environments respectively. The
interoperability issues reported in those deliverables will
be compared to measure the amount of issues that
were actually solved during real-time simulations.
50% of the
situations for
which an
interoperability
issue was
experienced
during offline
simulation should
not lead to the
same
interoperability
issue during real-
time simulation,
thanks to
enhanced
specifications and
the experience
gained using
EMTP. Of course,
this performance
is without
prejudice to the
overall number of
interoperability
issues
experienced
during hardware
in the loop tests,
as new sorts of
issues may be
encountered.
%

D2.1 - Data set, KPIs, tools & methodologies for impact assessment
XIV
Demo KPI Code KPI name Description Measurement / Verification Target
value Units
3 KPI.D3.1 Full Load
Converter
Losses
This KPI accounts for conversion
losses (converter bridge) in the
innovative VSC converter.
Losses will be calculated as described in EN 62751-1/2
standards.
Calorimetric method (using cooling water) will be used
to validate the results on the demo.
1% (converter
bridge only)
1.5% The
whole system1
%
3 KPI.D3.2 Power
reversal time
This KPI accounts for the power
reversal time of the proposed
converter.
A step change in the required active power signal, from
-1 p.u. to 1 p.u., is sent to the converter control. The
power reversal time is defined as the delay between the
step change in the control signal and the stabilization of
the converter power (ac side) inside a ±10% boundary
around the new value.
0.2 s
3 KPI.D3.3 Converter
Current THD
This KPI accounts for the THD of
AC/DC converter, at full load
The current THD at full load will be measured as
described in EN 61000-4-30 and EN 61000-4-7
In line with
IEEE 519 (2)
Dimensionles
s (%)
3 KPI.D3.4
HTLS
conductor DC
resistance
reduction
This KPI accounts for the DC
resistance reduction of the
innovative HTLS conductor, with
respect to typical ACSR conductors
evaluated at the nominal ACSR
ampacity3
This KPI is evaluated as:
(innovative HTLS DC resistance – ACSR DC resistance)/
ACSR DC resistance
-10% Dimensionles
s (%)
3 KPI.D3.5 HTLS
conductor
ampacity
This KPI accounts for the ampacity
increase of the innovative HTLS
conductor with respect to typical
ACSR solution (see footnote (19)
above)
This KPI is evaluated as:
(innovative HTLS DC ampacity – ACSR conductor
ampacity )/ ACSR conductor ampacity
50% Dimensionles
s (%)
1 The values refer to a converter system only.
2 Considering that the VSC converter is regarded as a voltage source seen from the AC coupling point and the network impedance is unknown (because demo site is not yet determined), the current distortion level is hardly predictable. Anyway harmonic current flowing into the AC network needs to be within the acceptable range of the network. The THD target value will be defined once the site and consequently the node of the network where the demonstrator will be installed will be identified.
3 i.e. in the diameter range of 30-35 mm, installed according to international recommendations on tensile load, with nominal ACSR ampacity calculated at 75°C.

D2.1 - Data set, KPIs, tools & methodologies for impact assessment
XV
Demo KPI Code KPI name Description Measurement / Verification Target
value Units
3 KPI.D3.6
Land and
submarine
cable test
cycles
This KPI accounts for the completion of
Pre-Qualification (PQ) test cycles on the
cables.
PQ test of HVDC extruded cable systems is based on a
sequence of 360 “24 hours” load cycles, as indicated in CIGRE
TB 496
This KPI is calculated as the number of days (i.e. of cycles)
since the starting of PQ cycles.
Level 1: 360
thermal cycles
prior to impulse
tests
Level 2: as level 1,
plus impulse tests
successful
days
3 KPI.D3.7
Voltage Level
of the land
and
submarine
cable
systems
Development of a land HVDC cable
system to be operated at high electrical
voltage.
Prequalification according to CIGRE TB 496 document
"Recommendations for Testing DC Extruded Cable Systems for
Power Transmission at a Rated Voltage up to 500 kV"
Level 1:350
Level 2: 400
kV
3 KPI.D3.8 Installation
Depth
Design of HVDC Submarine Cable system
(cable and accessories) to be safely
installed in deep corridors
Mechanical prequalification procedure according to CIGRE
Electra n. 171 clause 2.2 and 2.3 will be carried out
Level 1: 200
Level 2: 400 m
3 KPI.D3.9 HVDC
Insulators
Setting up and validating a testing
procedure for polymer DC insulators
Application of the procedure for assessing the behaviour and
useful life of polymer
Procedure
adopted at
IEC/Cigre or
equivalent level
--
3 KPI.D3.1
0
Cable fault
detection
system
- Measurement accuracy, which may be
affected by static interference
- Operator safety during the
measurement with the nearby healthy
pole energised
Accuracy of measurement and assessment of operator safety 1 successful
simulation test -
D2.1 - Data set, KPIs, tools & methodologies for impact assessment
XVI
Demo KPI Code KPI name Description Measurement / Verification Target
value Units
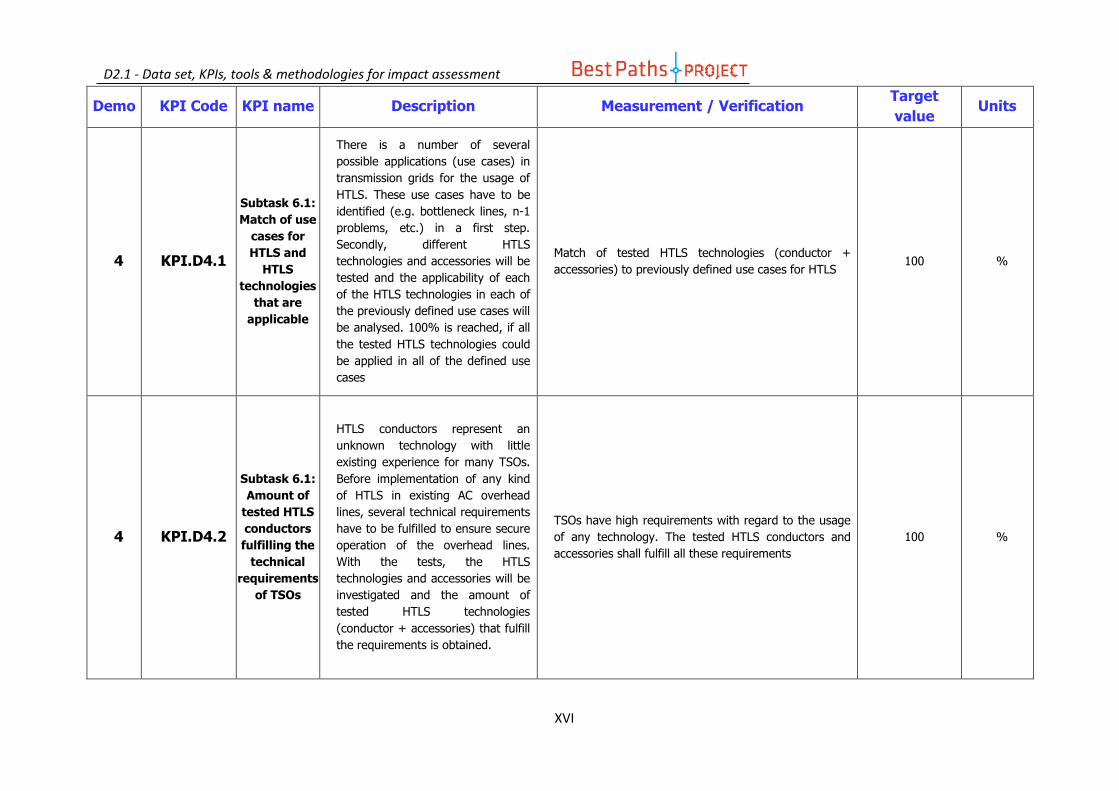
4 KPI.D4.1
Subtask 6.1:
Match of use
cases for
HTLS and
HTLS
technologies
that are
applicable
There is a number of several
possible applications (use cases) in
transmission grids for the usage of
HTLS. These use cases have to be
identified (e.g. bottleneck lines, n-1
problems, etc.) in a first step.
Secondly, different HTLS
technologies and accessories will be
tested and the applicability of each
of the HTLS technologies in each of
the previously defined use cases will
be analysed. 100% is reached, if all
the tested HTLS technologies could
be applied in all of the defined use
cases
Match of tested HTLS technologies (conductor +
accessories) to previously defined use cases for HTLS 100 %
4 KPI.D4.2
Subtask 6.1:
Amount of
tested HTLS
conductors
fulfilling the
technical
requirements
of TSOs
HTLS conductors represent an
unknown technology with little
existing experience for many TSOs.
Before implementation of any kind
of HTLS in existing AC overhead
lines, several technical requirements
have to be fulfilled to ensure secure
operation of the overhead lines.
With the tests, the HTLS
technologies and accessories will be
investigated and the amount of
tested HTLS technologies
(conductor + accessories) that fulfill
the requirements is obtained.
TSOs have high requirements with regard to the usage
of any technology. The tested HTLS conductors and
accessories shall fulfill all these requirements
100 %

D2.1 - Data set, KPIs, tools & methodologies for impact assessment
XVII
Demo KPI Code KPI name Description Measurement / Verification Target
value Units
4 KPI.D4.3
Subtask 6.1:
Estimated
service life
time of
tested HTLS
conductors
and
accessories in
comparison
with
conventional
ACSR
conductor
systems
HTLS conductors and the
accessories could especially be
applied on highly-loaded overhead
lines. The estimated life time of a
HTLS installation (conductor +
accessories) under different load
situations is therefore an important
parameter that is to be compared to
a conventional ACSR installation.
The estimated life time of a HTLS installation shall be
compared to a conventional ACSR installation: Years of
estimated service life of HTLS/ Years of estimated
service life of ACSR
100 %
4 KPI.D4.4
Subtask 6.1:
Suitability of
HTLS
conductors in
different
operational
scenarios
During the operation of any kind of
overhead line, different load
situations and operational issues
can occur (switch-off, ice load,...).
Due to the special characteristics of
HTLS conductor installations, there
are even other operational
situations possible that do not exist
for conventional ACSR installations
(e.g. rapid cooling). The tested
HTLS conductors and accessories
shall be suitable for all of these
different operational situations.
HTLS conductors and accessories shall be suitable for
all possible operational scenarios 100 %
D2.1 - Data set, KPIs, tools & methodologies for impact assessment
XVIII
Demo KPI Code KPI name Description Measurement / Verification Target
value Units
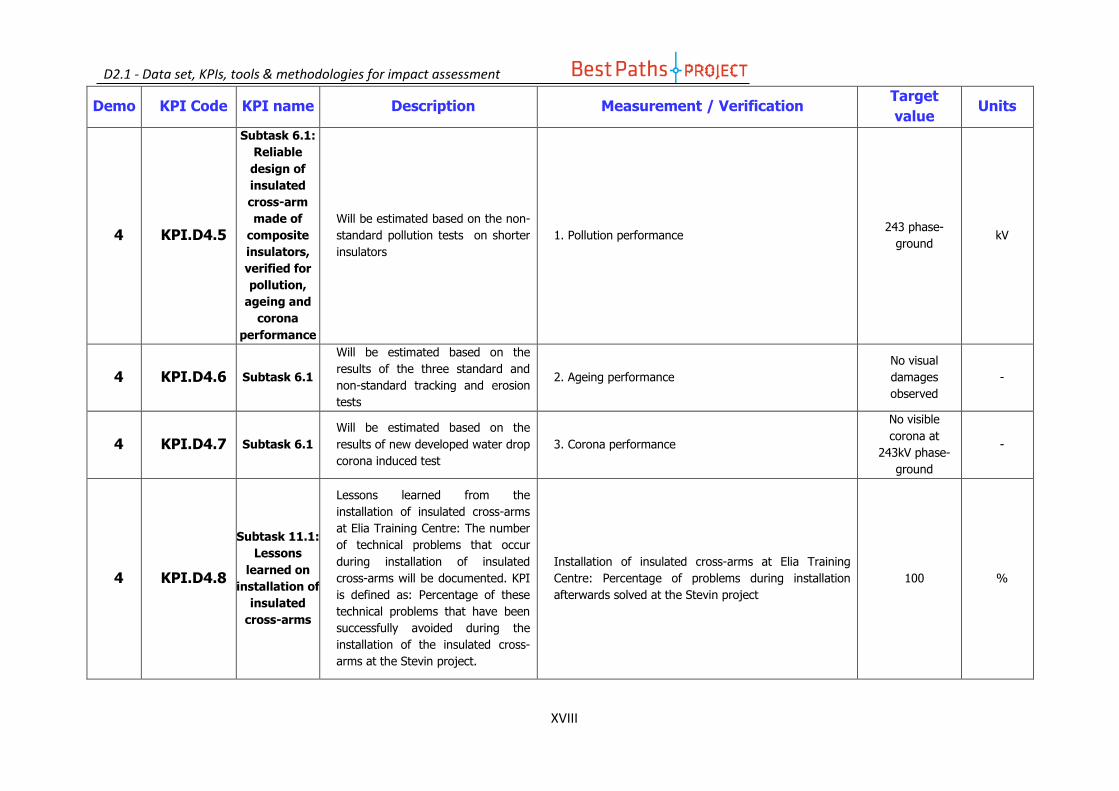
4 KPI.D4.5
Subtask 6.1:
Reliable
design of
insulated
cross-arm
made of
composite
insulators,
verified for
pollution,
ageing and
corona
performance
Will be estimated based on the non-
standard pollution tests on shorter
insulators
1. Pollution performance 243 phase-
ground kV
4 KPI.D4.6 Subtask 6.1
Will be estimated based on the
results of the three standard and
non-standard tracking and erosion
tests
2. Ageing performance
No visual
damages
observed
-
4 KPI.D4.7 Subtask 6.1
Will be estimated based on the
results of new developed water drop
corona induced test
3. Corona performance
No visible
corona at
243kV phase-
ground
-
4 KPI.D4.8
Subtask 11.1:
Lessons
learned on
installation of
insulated
cross-arms
Lessons learned from the
installation of insulated cross-arms
at Elia Training Centre: The number
of technical problems that occur
during installation of insulated
cross-arms will be documented. KPI
is defined as: Percentage of these
technical problems that have been
successfully avoided during the
installation of the insulated cross-
arms at the Stevin project.
Installation of insulated cross-arms at Elia Training
Centre: Percentage of problems during installation
afterwards solved at the Stevin project
100 %

D2.1 - Data set, KPIs, tools & methodologies for impact assessment
XIX
Demo KPI Code KPI name Description Measurement / Verification Target
value Units
4 KPI.D4.9
Subtask 11.1:
Successful
installation of
insulated
cross-arms
This KPI will be evaluated at the
end of the project with the
contractors:
Number of damaged insulated cross
arms on site / Total number of
insulated cross-arms installed on
site
Installation of insulated cross-arms in the Stevin project
in Brugge region: Percentage of damaged cross-arms
during the installation
<5 %
4 KPI.D4.1
0
Subtask 11.1:
Successful
installation of
HTLS
accessories
This KPI will be evaluated at the
end of the project with the
contractors:
Number of damaged HTLS
accessories / Total number of HTLS
accessories installed on site
Installation of HTLS conductors in the Stevin project in
the Brugge region: Percentage of damaged accessories
during installation.
<5 %
4 KPI.D4.1
1
Subtask 11.1:
Successful
installation of
HTLS
conductors
This KPI will be evaluated at the
end of the project with the
contractors:
Length of damaged HTLS
conductors during installation in
meters / Total length of insulated
HTLS conductors in meters installed
on site
Installation of HTLS conductors in the Stevin project in
the Brugge region: Percentage of damaged HTLS
conductor meters
< 5 %
4 KPI.D4.1
2
Subtask 6.2:
Application of
the new
methodology
on what length of a given power
line is the new method/conventional
applicable
75 %
4 KPI.D4.1
3
Subtask 11.2:
Timesaving
with the new
methodology
time required for the installation of
1 spacer dumper in case of new
method/conventional
50 %
4 KPI.D4.1
4
Subtask 6.3:
Accuracy of
rating
forecast
Error between the measured and
the forecasted (for the following 1-4
hours) rate of the line
>=10 %

D2.1 - Data set, KPIs, tools & methodologies for impact assessment
XX
Demo KPI Code KPI name Description Measurement / Verification Target
value Units
4 KPI.D4.1
5
Subtask 11.3:
Line transfer
capacity
growth
Ratio between actual (means:
forecasted for the next 1-4 hours)
real time rating and static
(seasonal) rating
>= 15% %
4 KPI.D4.1
6
Cost efficent
Innovative
overhead line
concepts
The savings will be compared to
present standard configuration.
The aim is to develop at least one concept using new
materials and one concept using conventional materials
that will yield a 20% reduction in cost compared to
conventional methods.
-20 %
4 KPI.D4.1
7
Innovative
retrofit
process with
shorter
outage time
The savings in outage time will be
compared to the present process.
The aim is to develop one retrofit method with as few
outages as possible using LLW methods when
applicable.
-20 %
4 KPI.D4.1
8
Safer
mounting
retrofit
process
Reduction on helicopter transport
compared to present process.
The aim is to develop a process that reduces the
number of helicopter transports during the retrofit
process.
-20 %

D2.1 - Data set, KPIs, tools & methodologies for impact assessment
XXI
Demo KPI Code KPI name Description Measurement / Verification Target
value Units
5 KPI.D5.1
High
quality MgB2
wires
To validate the quality of MgB2 wires produced in long length
Critical current measurement
Je >500 A/mm2 @ 20T;1T
A/mm2
Diameter variation
3 % of the nominal diameter
along a piece length
%
5 KPI.D5.2
Price evolution
of MgB2
wires
Calculation of the price of the wire according to the different design proposal
Ratio of the Overall price of the MgB2 wires after over before the project
>50 % reduction of price
%
5 KPI.D5.3
IC degradatio
n after cabling on
industrial
machine
Validate MgB2 wires and cable designs
Critical measurement 1) extracted wires from cable 2) full cable conductor
Ic/Ic0 <5%
Ic= after bending
IcO before cabling
%
5 KPI.D5.4
IC degradatio
n after cable
bending
Validate MgB2 wires and cable designs
Critical measurement on based on CIGRE recommendation B1.31 1) extracted wires from cable 2) full cable conductor
Ic/Ic0 <5%
Ic= after bending
IcO = before
bending and after
cabling
%
5 KPI.D5.5 DC High voltage
test
Validate the demonstrator concept HV test on the demonstrator (2 terminations + cable) > 1.85 x U nom
for 30 min KV
5 KPI.D5.6
Superimpo
sed impulses
test
Validate the demonstrator concept Superimposed HV impulses added to the nominal voltage To be specified
during the project kV

D2.1 - Data set, KPIs, tools & methodologies for impact assessment
XXII
Demo KPI Code KPI name Description Measurement / Verification Target
value Units
5 KPI.D5.7 Losses of cryogenic
envelope
Validate the cryo-envelopes Calorimetric losses measurement
<2W/m at 77K for Liq N2
<0.2 W/m at 20 K for He Gas
W/m
5 KPI.D5.8
Price evolution
of the cryogenic
envelope
Calculation according to the design of the cryogenic envelope
Ratio of the Overall price of the cryogenic envelopes after over before the project
>30% %
5 KPI.D5.9 right of
way
reduction
Installation drawing Space required for superconducting link/space for conventional link for the same power at the same voltage
<50% %
5 KPI.D5.1
0
Overall
performance costs
(comparison with AC,
DC, GIL.
Calculation of OPEX and CAPEX of different system based on installation cases (urban, landscape, including substations
OPEX & CAPEX To be determined €/kA.m
5 KPI.D5.1
1
Terminatio
n current leads
Validate the design for the current leads Losses by electrical and thermometric measurements at 20 K <10 W/ current lead at 10 kA at
20 K W
5 KPI.D5.1
2
He leaks in the
injection tube in the
terminatio
n
Validate the design for He injection tube that should withstand the HV
He Leaks measurement at RT at 20 bars after 5 cooling down from RT to 20 K And 5 overvoltage shocks
< 10-7 mbarls-1

D2.1 - Data set, KPIs, tools & methodologies for impact assessment
XXIII
Demo KPI Code KPI name Description Measurement / Verification Target
value Units
WP
13 KPI.L1.1
Increased network
capacity at affordable
cost
“Network Capacity” (NC) is the
additional electrical power that can be transmitted or distributed in the
selected framework (to connect new RES generation, to enhance an
interconnection, to solve a congestion, or even all the
transmission capacity of a TSO). “Network Capacity at Affordable Cost”
(NCAC) is the additional network capacity gained per unit of cost,
considering the cost (C) as the OPEX and/or CAPEX of the installations
included in order to gain network capacity.
Once BAU and Best Paths scenarios have been defined, power flow simulations will allow comparing the network
capacity for each of them. It is expected that HVDC links, AC corridors repowering and superconductor cables
(considering the topologies and level of penetration defined in the methodology) involve a significant increase
in network capacity. Cost related to each scenario must
be used to obtain the relative values.
W/€
WP
13 KPI.L1.2
Increased
system flexibility at
affordable cost
“System Flexibility” (SF) is the amount of electrical power (generation and
load) that can be modulated to the needs of the system operation within
a specified unit of time. “System Flexibility at Affordable Cost”
(SFAC) can be indicated as total load and generation (including RES and
DER) connected to the transmission and distribution system, that can be
modulated in response of market
signals or system needs, considering the cost (C) as the OPEX and/or
CAPEX needed in order to gain system flexibility.
Power flow and dynamic simulations, including variations in generation/load will allow to determine the flexibility
brought by the HVDC-VSC improvements, multi-terminal HVDC networks and the increased interconnection
capacity achieved in the Best Paths scenario, compared to the BAU scenario. As in previous KPI, estimated costs
for each scenario will be needed.
W or MVAr/€
WP
13 KPI.L2.1
Increased RES and DER
hosting capacity
The RES/DER hosting capacity (HC) is
the total installed capacity of RES/DER that can be connected
without endangering system stability and reducing system reliability.
Hosting capacity is evaluated from power flow simulations, obtaining the maximum power that can be
injected in the system without reaching technical limits (voltage/current). The performance of such simulations in
the base case and in the Best Paths scenario will assess the impact of the integrated innovations in hosting
capacity.
%

D2.1 - Data set, KPIs, tools & methodologies for impact assessment
XXIV
Demo KPI Code KPI name Description Measurement / Verification Target
value Units
WP
13 KPI.L2.2
Reduced energy
curtailment
of RES and DER
Due to network technical problems such as overvoltage, overfrequency,
local congestion, etc., RES/DER production can be curtailed partially
or totally, i.e. tripped. An objective of the proposed innovations is to provide
solutions to reduce and minimize shedding of RES/DER, while still
maintaining system security and reliability.
By means of power flow simulations, including contingences that can lead to voltage or congestion
problems, Best Path and BAU scenarios will be compared,
obtaining the RES curtailments needed for each case, according to TSOs’ general curtailment criteria.
%
WP
13 KPI.L2.3
Increased flexibility
from energy players
Flexibility is an indication of the ability of the electricity system to respond to
(and balance) supply and demand in real time. Flexibility already exists and
is reliably used, but increasing the presence of variable renewables
involves greater need and different management of electricity flows.
Therefore, along with an increase of
renewable energies penetration, increase of flexibility is one of the
objectives of the future network.
Similarly to what it is defined for level 1 KPI 2, power flow and dynamic simulations performed both in BAU and
in Best Paths scenarios will allow to compare the flexibility achieved to face contingences such as sudden
changes in local load demand. In Best Paths scenario, the increased interconnection capacity and the multi-terminal
HVDC networks are expected to allow RES participation in
flexibility services.
-
WP
13 KPI.L2.4
Extended
asset life time
This indicator deals with the increase of the life-time of assets. Some of the
innovations to be demonstrated will avoid congestion situations, which will
contribute in this idea.
Power flow simulations in BAU and Best Paths scenarios will give as a result a group of assets with possible
overloading problems, which can be linked with the ageing of such elements, thus having an impact over the
need of replacement of assets. Especially in Demo 4, some of the improvements to be developed, such as
dynamic line rating and live line working, can contribute in the increase of asset lifetime. Therefore, the
comparison of scenarios with and without the implementation of these techniques over the same group
of assets will allow calculating the reduction in costs, mainly due to the possible reduction in replacement costs
brought by the optimized use of the assets.
-

D2.1 - Data set, KPIs, tools & methodologies for impact assessment
XXV
Demo KPI Code KPI name Description Measurement / Verification Target
value Units
WP
13 KPI.L2.5
Power quality and quality of
supply
One of the most commonly used
indexes for this purpose, from the TSO point of view, is the Average
Interruption Time (AIT). The AIT is interrupted minutes per year.
For this KPI short circuit events will be simulated in DC
lines, in order to determine the average interruption time for Best Paths scenario and for BAU case. Improvements
in DC fault location should result in a positive assessment of this KPI.
%

D2.1 - Data set, KPIs, tools & methodologies for impact assessment
XXVI
Table of Contents
1. Introduction ................................................................................................................................................. 1
2. Project objectives ........................................................................................................................................ 2
2.1. Demo 1: HVDC links in offshore wind farms and offshore interconnections .......................................... 3
2.1.1. Demonstration description .............................................................................................................. 3
2.1.2. Demonstration Objectives, expected impacts and barriers to be overcome ................................. 5
2.1.3. Demo 1 KPI’s .................................................................................................................................... 8
2.1.4. Methodologies for demo results validation and contribution for impact assessment ................. 13
2.2. Demo 2: HVDC-VSC multi-terminal interoperability ............................................................................. 22
2.2.1. Demonstration description ............................................................................................................ 22
2.2.2. Demonstration Objectives, expected impacts and barriers to be overcome ............................... 24
2.2.3. Demo 2 KPI’s .................................................................................................................................. 27
2.2.4. Methodologies for demo results validation and contribution for impact assessment ................. 33
2.3. Demo 3: SACOI link ................................................................................................................................ 35
2.3.1. Demonstration description ............................................................................................................ 35
2.3.2. Demonstration Objectives, expected impacts and barriers to be overcome ............................... 41
2.3.3. Demo 3 KPI’s .................................................................................................................................. 47
2.3.4. Methodologies for demo results validation and contribution for impact assessment ................. 48
2.4. Demo 4: Innovative repowering of corridors ........................................................................................ 51
2.4.1. Demonstration description ............................................................................................................ 51
2.4.2. Demonstration Objectives, expected impacts and barriers to be overcome ............................... 53
2.4.3. Demo 4 KPI’s .................................................................................................................................. 59
2.4.4. Methodologies for demo results validation and contribution for impact assessment ................. 61
2.5. Demo 5: DC superconducting cable ...................................................................................................... 64
2.5.1. Demonstration description ............................................................................................................ 64
2.5.2. Demonstration Objectives, expected impacts and barriers to be overcome ............................... 70
2.5.3. Demo 5 KPI’s .................................................................................................................................. 71
2.5.4. Methodologies for demo results validation and contribution for impact assessment ................. 73
2.6. WP13 Integrated global assessment for future replication in EU27 ..................................................... 77
2.6.1. Demonstration description ............................................................................................................ 77
2.6.2. Demonstration Objectives, expected impacts and barriers to be overcome ............................... 79
2.6.3. WP13 KPI’s ..................................................................................................................................... 82

D2.1 - Data set, KPIs, tools & methodologies for impact assessment
XXVII
2.6.4. Tools and methodologies for impact assessment ......................................................................... 86
Annex 1. List of Acronyms ................................................................................................................................. 100

D2.1 - Data set, KPIs, tools & methodologies for impact assessment
XXVIII
List of figures
Figure 1: EEGI KPI framework ............................................................................................................................... 2
Figure 2: DC demonstrator scheme ...................................................................................................................... 5
Figure 3: back-to-back configuration .................................................................................................................. 14
Figure 4: AC coupling configuration .................................................................................................................... 14
Figure 5: VSC-HVDC multi-terminal link .............................................................................................................. 14
Figure 6: VSC-HVDC meshed ............................................................................................................................... 15
Figure 7: DC topology 1 ....................................................................................................................................... 15
Figure 8: DC topology 2 ....................................................................................................................................... 15
Figure 9: DC topology 3 ....................................................................................................................................... 16
Figure 10: methodology to be used to validate the accuracy of the models ..................................................... 17
Figure 11: reference model data ........................................................................................................................ 18
Figure 12: reference model one-line diagram .................................................................................................... 18
Figure 13: Sum of upper capacitor voltages, in pu ............................................................................................. 19
Figure 14: Sum of lower capacitor voltages, in pu .............................................................................................. 19
Figure 15: Circulation current, in pu ................................................................................................................... 19
Figure 16: Circulation current, in pu ................................................................................................................... 20
Figure 17: Grid current, in pu .............................................................................................................................. 20
Figure 18: Upper and lower insertion index ....................................................................................................... 20
Figure 19: Preliminary unit control ..................................................................................................................... 21
Figure 20: Demo 2 topologies ............................................................................................................................. 28
Figure 21: Definition of Power reversal time ...................................................................................................... 49
Figure 22: Commercial HTS superconducting tapes and wires .......................................................................... 65
Figure 23: MgB2 Superconducting HVDC cable system concept ........................................................................ 68
Figure 24: Demonstrator concept for Best Paths project ................................................................................... 69
Figure 25: HVDC cable concept for Best Paths project ....................................................................................... 69
Figure 26: Scalability towards a full meshed offshore grid, Task 13.5 investigates Multi-terminal HVDC
demonstrations inside each TSO control area (green connections); task 13.6 extends the analysis allowing for
connections across different control zones between different TSOs (ORANGE CONNECTIONS). ..................... 79
Figure 27: KPIs structure (Figure 16 of Description of Work document) ............................................................ 82

D2.1 - Data set, KPIs, tools & methodologies for impact assessment
Page 1 of 142
1. Introduction
This deliverable contains the objectives established, as well as the tools and the methodologies for the
impact assessment for each demo, providing a set of key performance indicators (KPIs) in order to give an
objective point of view of the project results.
This document addresses some issues set out below:
- To define the objectives to be achieved by each demonstration and WP13.
- To identify any barrier to be overcome to carry out the demonstration and to implement the results at European level. Such barriers can come from different points:
• Technical barriers
• Regulatory barriers
• Operational barriers
• Economic barriers
• Legal barriers
• Market structure based barriers
• Others
- To define the expected impact, considering the results obtained by each demo in an isolated way and the impact derived from a pan-European deployment of the obtained solutions. The impacts could be considered from the following aspects:
• Grid management and operation
• Grid planning
• Proceedings for inter area coordinated operation
• Design, Engineering and Construction of the proposed solutions.
• Wind (RES in general) energy integration
• Economic impact
• Others
- To define the KPIs as well as the target values at Level 1, 2 and 3.
- To identify the tools and methodologies to be used for the KPI assessment.
- To detail the demonstrations work plan for an optimal achievement of the project results in terms of quality of results, time and resources.
Section 2 of this deliverable will collect demo by demo and WP13 the main issues expressed above, giving
pinpoint information about the work to be developed during the project as well as the results expected
through the use of KPIs and the methodology to be used to perform the data collection. The tools and the
methodology that will be applied to achieve the project’s results and impact assessment are identified in
outline, having in mind that the final results of the demonstrations are going to be obtained on dates very
close to the end of the project, the assessment process should be able to start with preliminary results and
being updated in a very efficient way once the demonstrations final results were available.

D2.1 - Data set, KPIs, tools & methodologies for impact assessment
Page 2 of 142
Subsection 3 of each demo/WP 13 of section 2 describes the KPIs defined at Level 1, 2 and 3 following the
EEGI R&I Roadmap (see Figure 1). Those KPIs will measure the effectiveness of the obtained results after
deploy them at European level.
Figure 1: EEGI KPI framework
Finally, in separate Annexes the detailed demonstrations work plan and other complementary information
for a better understanding and easy monitoring of the project development are included.
The main value of this report is to set up a transparent framework for the project results assessment by the
definition of methodologies, KPIs and target values. In this way the objectiveness of the impact assessment
of project results to be carried out in the final stages of each demonstration is guaranteed by WP 13
“Integrated global assessment for future replication in EU27”, and WP 14 “Dissemination and exploitation”.
2. Project objectives
The Best Paths project aims to increase the Pan European transmission network capacity and electric system
flexibility by the demonstration of the capabilities of several network technologies. This will allow to make
Europe able of responding to the increasing share of renewables while maintaining its present level of
reliability performance.
The focus of the demonstrations is to deliver solutions to allow the transition from HVDC lines to HVDC grids,
to upgrade and repower existing AC parts of the network, and to integrate superconducting high power links
within AC meshed networks. The project demonstrations purpose to validate the technical feasibility of grid
technologies proposed to improve the network, as well as their cost, their impact and their benefits.

D2.1 - Data set, KPIs, tools & methodologies for impact assessment
Page 3 of 142
2.1. Demo 1: HVDC links in offshore wind farms and offshore interconnections
2.1.1. Demonstration description
There are currently several issues and uncertainties about offshore wind farms connected to multi-terminal
DC grids. To begin with, such configurations do not currently exist but it is quite clear that they will be
needed in the not so distant future. Even nowadays there is limited experience in offshore HVDC links for
connecting wind power. It is therefore important to identify all the possible interactions between the
turbines and the HVDC link (subsynchronous interactions and high frequency resonance), which is an issue
that has not been deeply studied up to now.
The second main issue for wind developers is their lack of necessary knowledge on HVDC links. This is due to
the fact that there is not enough experience on installations and the manufacturers of these systems are few
and quite secretive about their technology to protect their intellectual property against their competitors,
and even their own clients. This translates as high costs and technical and commercial risks for the final user
in addition to strong barriers for new entrants who could bring costs down, as well as a dependence on the
manufacturers to correctly operate and maintain the assets.
The aim of this demonstration is therefore to reduce the risks of the technology and to foster new suppliers
and sub-suppliers of HVDC technology. This is done by investigating the interactions of the converters in the
wind turbines and the HVDC substation, and by developing a testing laboratory where different stakeholders
can perform their studies in a real environment with real measurements from converter equipment. This
way, knowledge of the whole industry will be fostered -not limited only to HVDC equipment manufacturers.
Demo 1 will focus on getting a deeper practical and operational knowledge on the integration of wind
turbine generators in the offshore HVDC links that connect offshore wind farms to the onshore AC grid in
different configurations. Most specifically, the main issues that will be covered are:
• Wind turbine/HVDC control algorithms: power control, coordination with wind turbine generator control
and consideration of multiple VSC technologies. Two aspects will be taken into account: control in stable
operation and in transient operation (faults, disturbances, optimal re-dispatching, etc).
• Stability limits and fault clearance time: different ways to achieve the fault clearance will be studied (full
bridge converters, DC breakers, AC breakers) as well as aspects like protection selectivity or fault ranges.
• Harmonic emission requirements from the wind turbine generator up to the point of common coupling
(PCC) onshore: physical solutions and tools to avoid the potential effects will be investigated.
• Offshore DC interarray: studies will be carried out on wind turbines generating directly in DC and using
high voltage DC/DC converters.
The demonstration consists of two parts: the first part focuses on developing software models of all of the
main pieces of equipment in a HVDC link and run simulations on different topologies that range from point-
to-point links to meshed HVDC grids. The simulation scenarios will be built by the research institutions with

D2.1 - Data set, KPIs, tools & methodologies for impact assessment
Page 4 of 142
the help of the TSOs taking part in the project. In order to study a complete HVDC system both averaged and
switched models will be developed. These include: wind turbine (full-converter and with both AC and DC
output in the medium voltage side), DC/DC converter, VSC (two-level, half-bridge MMC and full-bridge
MMC), HVDC converter station and cable and AC grid. All these models will be open to the different
stakeholders (they will be programmed in MATLAB Simulink and DIgSILENT PowerFactory), as opposed to the
“black box” approach of the HVDC equipment manufacturers, which is very limiting for the widespread of
offshore HVDC technology.
The second part of the project will be focused on building a DC demonstrator in the testing facilities owned
by SINTEF Energy Research in Norway. The tests performed in this demonstrator will have the objective of
validating the simulation models developed in the first stage of Demo 1. The existing laboratory
infrastructure will be upgraded with three different converter prototypes in the 50kW power range designed
to emulate the existing MMC converter technologies (full-bridge and half-bridge in different configurations).
In particular, in a preliminary pre-engineering phase the configuration has been specified as follows:
-MMC unit with half bridge cells with 18 cells per arm (HF18)
-MMC unit with full bridge cells with 12 cells per arm (FB12)
-MMC unit with half bridge cells with 6 cells per arm (HF6)
The configuration HF18 is intended to be operated without pulse-width modulation -PWM- (e.g. near level
modulation) while the configuration HF6 is intended to be operated with PWM on one cell. The configuration
FB12 will be set to be operated in both control options.

D2.1 - Data set, KPIs, tools & methodologies for impact assessment
Page 5 of 142
Figure 2: DC demonstrator scheme
An aspect that will be accounted for in the design process is the scaling down of the ratings from the HVDC
levels to laboratory compatible values in order to preserve the main dynamics of the converters. Since the
older versions of HVDC substations offshore are currently using two-level converters with PWM, a scaled-
down converter of this kind will also be included to analyse its behaviour. The four converters will be
interconnected in such a way that it will be possible to test several configurations in a multi-terminal DC
environment.
The wind farms will be physically emulated through generators and converters controlled by a PC running
LabView. On the other hand, the HVAC grid will be simulated by means of a detailed model running in an
OPAL-RT real time digital simulation system. The resulting setup offers flexibility both in terms of the specific
converters control (MMC balancing algorithm, droop controls for the terminals etc.) and in terms of the
operating conditions (e.g. power flow, connection or disconnection of a terminal etc.). Thus, during the
project execution a set of scenarios will be defined in order to be tested and validated experimentally.
The results and lessons learned will be applied in a simulation of the East Anglia project -an area of 7.2GW of
wind capacity in the UK that was awarded to the joint venture between ScottishPower Renewables and
Vattenfall Wind Power.
2.1.2. Demonstration Objectives, expected impacts and barriers to be overcome
-Demonstration objectives:
1. To investigate the electrical interactions between the HVDC link converters and the wind turbine
converters in offshore wind farms: these interactions have not yet been thoroughly studied using
simulation models of the whole system and comparing them to the performance of real hardware.
2. To study the interactions between the low level and high level controllers of the MMC converters: substantial
research work has been presented in the last ten years regarding the control of MMCs. However, in most cases
the MMCs are connected to a DC source and low level controllers to control the circulating currents and the sub-
module capacitor voltages are presented. This configuration differs significantly from those where the converter
is connected to a HVDC link. In this case, it is necessary to develop high level controllers to control the DC
voltage. The high level controllers should cooperate with the low level controllers to regulate magnitudes that
are related between them without causing control conflicts and instabilities. Cooperative control algorithms to
control the DC-link voltage and the sub-module capacitor voltages without causing conflicts, as well as to control
the active and reactive power injected into the grid will be developed in this project.
3. To de-risk multi-terminal schemes that mix different VSC technologies to interconnect wind farms from the point
of view of resonances, power flow and control.
4. To demonstrate the results in a laboratory environment using scaled models: 4-terminal DC grid with 50kW MMC
VSC prototypes and a Real Time Digital Simulator system to emulate the AC grid.
5. To extrapolate the results to a real project (East Anglia Offshore Wind).

D2.1 - Data set, KPIs, tools & methodologies for impact assessment
Page 6 of 142
-Demonstration expected impact:
1. The studies that will be carried out will help to significantly improve the knowledge on the integration of offshore
wind farms via HVDC links.
2. Enabling stakeholders other than big HVDC equipment manufacturers to have access to a scaled-down
demonstrator and open simulation models will make it possible to foster new suppliers and sub-suppliers of
HVDC equipment, and will allow new entrants to gain access to the technology.
3. The cost of the technology will be lowered once a greater level of competition is achieved.
4. The reduction of costs and risks will make it possible to develop offshore wind farm projects that are currently
not attractive from the economic point of view, thus increasing the penetration of wind energy generation in the
European system.
5. The results from the demonstration will shed some light on the most suitable network topologies to interconnect
the large offshore wind farms that will be built in the future.
-Demonstration barriers to overcome:
1. Lack of comprehensive technical information: several studies can be found in the technical literature focused on
control aspects for MMC-based VSC-HVDC links. References 4-5-6-7-8-9-10-11-12 try to summarize the technical work
recently published on this topic. However, most of the published works are focussed on specific aspects while
4 S. Liu, Z. Xu, W. Hua, G. Tang, and Y. Xue, “Electromechanical transient modelling of modular multilevel converter based mult-terminal HVDC systems,” IEEE Trans. Pow. Syst., vol. 29, no. 1, pp. 72-83, Jan. 2014.
5 X. Lin, K. Ou, Y. Zhang, H. Guo, and Y. Chen, “Simulation and analysis of the operating characteristics of MMC based VSC-MTDC system,” in Proc. 4th
IEEE PES Innovative Smart Grid Technologies Europe (ISGT Europe), pp. 1-5, Oct 2013.
6 X. Yan, S. Difeng, and Q. Shi, “Protection coordination of meshed MMC MTDC transmission systems under DC faults,” in Proc. 2013 IEEE Region 10
Conference (TENCON 2013), pp. 1-5, Oct. 2013.
7 G. P. Adam and B. W. Williams, “Half- and full-Bridge modular multilevel converter models for simulations of full-scale HVDC links and multiterminal DC grids,” IEEE Journal of Emerging and Selected Topics in Power Electrinics, vol. 2, no. 4, pp. 1089-1108, Dec. 2014.
8 X. Yao, L. Herrera, and J. Wang, “Modulation and control of MMC based multiterminal HVDC,” in Proc. 2014 IEEE Energy Conversion Congress and
Exposition (ECCE), pp. 499-504, Sept. 2014.
9 G. P. Adam, O. Anaya-Lara, and G. Burt, “Multi-terminal de transmission system based on modular multilevel converter,” in Proc. 44th International
Universities Power Engineering Conference (UPEC), pp. 1-5, Sept. 2009.
10 G. Bergna, M. Boyra, and J. H. Vivas, “Evaluation and proposal of MMC-HVDC control strategies under transient and steady state conditions,” in Proc.
14th Conference on Power Electronics and Applications (EPE 2011), pp. 1-10, Aug.-Sept. 2011.
11 S. Kim, S. Cui, and S-K Sul, “Modular multilevel converter based on full bridge cells for multi-terminal DC transmission,” in Proc. 16th European
Conference on Power Electronics and Applications (EPE’14 – ECCE Europe), pp. 1-10, Aug. 2014.
12 Y. C. Choo , A. P. Agalgaonkar, K. M. Muttaqi, S. Perera, M. Negnevitsky, “Subsynchronous torsional interaction behaviour of wind turbine-generator unit connected to an HVDC system,” in Proc. 36th Annual Conference on IEEE Industrial Electronics Society (IECON 2010), pp. 996 – 1002, Nov. 2010.

D2.1 - Data set, KPIs, tools & methodologies for impact assessment
Page 7 of 142
consider the rest of the system as an ideal entity. A lack of detailed technical information has been found, among
others, in the following topics:
o Interactions between the system-level and converter-level controllers in MMC based multi-terminal
links: 4-5-6-7-8-9 describes system-level controllers for MMC converters in multi-terminal links. However, no
converter-level controllers for the circulating currents are developed. This fact degrades the dynamic
response of the MMC. Only two references (10-11) have been found pointing out the problems that might
arise due to the interactions between the system and converter-level controllers. These works propose
some solutions to overcome these problems. However, only simulation results of back-to-back links are
presented to validate the proposed solutions. No experimental results have been obtained to
corroborate the simulation results.
o AC/DC interactions and resonances: One point that needs to be addressed is the analysis of possible
subsynchronous interactions and resonances between the wind farms, the offshore and onshore
converters and the grid (12). These interactions should be damped to have stable operation of the whole
system. This is an issue that has not been deeply studied up to now and that will be addressed in the
project.
o Most of the papers deal with multi-terminal links with relatively low number of grid connected
converter stations. There are not many studies carrying out a comprehensive analysis about the
integration of offshore wind farms in meshed HVDC grids with a relatively high number of MMC
converters. In addition, no experimental results are usually presented to corroborate the simulation
results.
These issues point out the lack of technical information performing an integral and comprehensive
analysis of MMC-based VSC-HVDC meshed grids for transmission of offshore wind power. The project
partners will develop all the necessary tools to carry out, for the first time, an integral and
comprehensive analysis of such a system.
2. Lack of operational experience on the control and protection of VSC-HVDC multi-terminal and meshed grids for
transmission of bulky amounts of wind power: Recently, the first MMC-based VSC-HVDC multi-terminal link has
been put into operation in China. The Naoao VSC-HVDC multiterminal link has three converter stations
manufactured by three different HVDC valve suppliers. This pilot project will bring practical experience on the
operation of multi-vendor multi-terminal VSC-HVDC links. However, it is important to remark two points:
o It is the very first worldwide project operating a MMC-based VSC-HVDC multi-terminal link. Therefore,
the technology is still in its infancy.
o The project only includes three terminals with no offshore wind farm integrated in the link. MMC-based
VSC-HVDC grids integrating offshore wind farms do not exist yet.
Consequently, these two issues point out that the lack of practical experience on the operation of
MMC-based VSC-HVDC grids interfacing offshore wind farms is still a barrier that needs to be
overcome.
3. The lack of detailed information on commercial systems and how they are scaled up for offshore wind projects
could lead to erroneous assumptions in the design and simulation of the converters.

D2.1 - Data set, KPIs, tools & methodologies for impact assessment
Page 8 of 142
4. It is necessary to develop models on every component of the HVDC system in such a way that there are no
incompatibilities that could lead to delays and errors during the simulations.
5. The construction of the test facility could face delays due to the late shipping of the equipment.
6. There is a risk of damage to the components in the demonstrator caused by wrong designs or human errors
during the tests.
7. There could be a mismatch between the simulation results and the measurements in the demonstrator.
8. If the limitations set by the budget and the necessity to downscale the system for a laboratory environment are
too high, there will still be some limitations to understand the behaviour of real-life offshore wind projects
connected by HVDC.
2.1.3. Demo 1 KPI’s
KPI
Number KPI Name Description
1
AC/DC
interactions –
power and
harmonics
Validates if the proposed converter configurations, DC network topologies and controllers achieve the expected performance in terms of AC/DC interactions.
It measures the performance in three different areas.
Title Description Target value Units
Steady state
performance
Evaluates the performance of the converter controllers by measuring the steady state error of a number of variables after a defined settling time. Five variables are measured: C1: Steady state error of the active power C2: Steady state error of the reactive power C3: Steady state error of the DC voltage at the converter terminals C4: Steady state error of the voltage of offshore AC networks C5: Steady state error of the frequency of offshore AC networks
[1%, 1%, 0 (for constant DC
voltage control mode) or 2%
(droop control mode), 5%,
1%]
C1: p.u (W)
C2: p.u (vAR)
C3: p.u (V)
C4: p.u (V)
C5: Hz
AC and DC
power quality
Establishes if the power quality of both AC and DC voltages are within the limits stated in standards. Two aspects will be evaluated: C1: Harmonics of AC voltages C2: Ripple of DC voltages
[10%, 2%]
C1: dimension-
less C2: p.u (V)

D2.1 - Data set, KPIs, tools & methodologies for impact assessment
Page 9 of 142
Wind turbine
ramp rates
Maximum Power Ramp Rate (MW/s) solicitation to any WTG to assure Wind Park stability after DC fault One variable is measured: C1: Active power ramp rate
<1 MW/s
Table 1: Demo 1 KPI number 1
KPI
Number KPI Name Description
2
AC/DC
Interactions:
Transient
Response &
Voltage Margins
Studies necessary to evaluate transient response of HVDC networks for wind connection are identified. These studies will be used to validate whether or not the proposed converter configurations, DC network topologies and controllers achieve
the expected performance in terms of transient performance under normal and extreme operation conditions.
Title Description Target value Units
Normal
Operation
Evaluate dynamic power flows, under normal operating conditions, in response to:
Variation in wind input power
Reallocation of power between AC nodes Measured variables2: C1: DC link voltage C2: Cell capacitance voltage C3: Converter arm current C4: Converter AC real and reactive power C5: Converter terminal voltage (at wind farms and AC grid connections).
80% of identified
cases successfully1
simulated and evaluated
%
Extreme
Operation
Evaluate dynamic power flows, under extreme operating conditions, in response to:
AC fault at grid terminal (either sinking or sourcing power)
Loss of wind farm connection
Loss of individual DC line in mesh network Measured variables2: C1: DC link voltage C2: Cell capacitance voltage C3: Converter arm current C4: Converter AC real and reactive power C5: Converter terminal voltage (at wind farms and AC grid connections). C6: System settling time
80% of identified
cases successfully1
simulated and evaluated
%
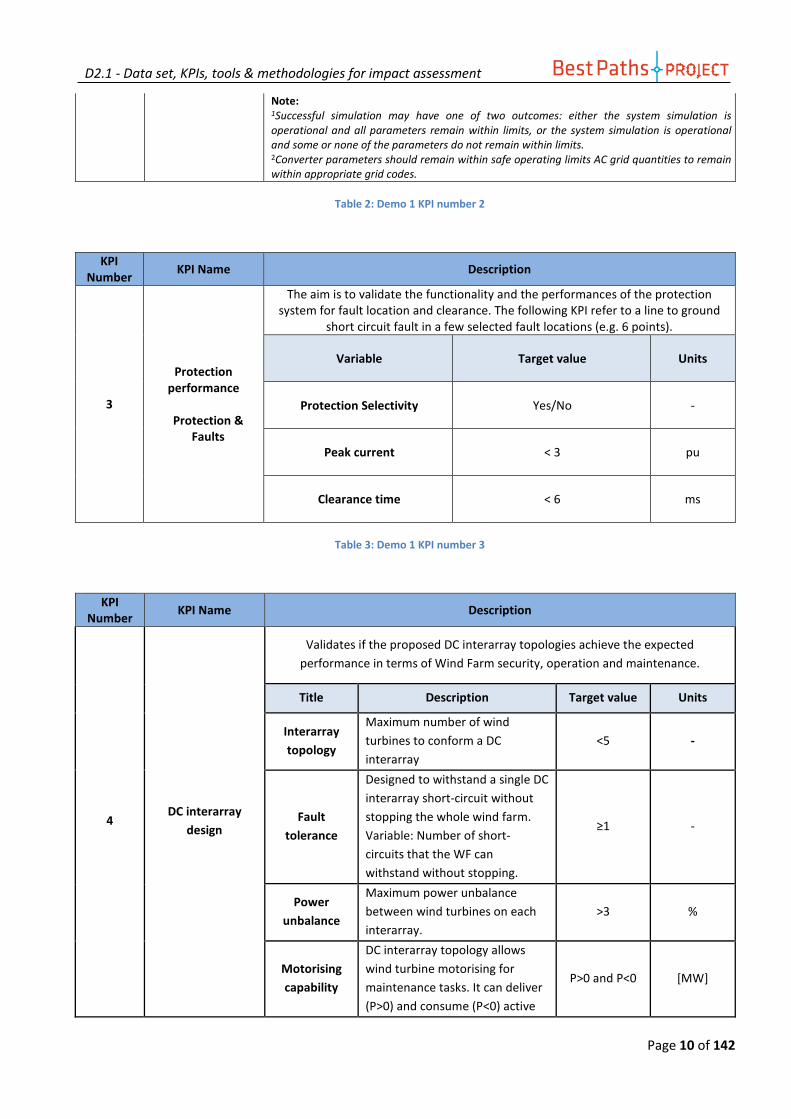
D2.1 - Data set, KPIs, tools & methodologies for impact assessment
Page 10 of 142
Note: 1Successful simulation may have one of two outcomes: either the system simulation is
operational and all parameters remain within limits, or the system simulation is operational
and some or none of the parameters do not remain within limits. 2Converter parameters should remain within safe operating limits AC grid quantities to remain
within appropriate grid codes.
Table 2: Demo 1 KPI number 2
KPI
Number KPI Name Description
3
Protection
performance
Protection &
Faults
The aim is to validate the functionality and the performances of the protection system for fault location and clearance. The following KPI refer to a line to ground
short circuit fault in a few selected fault locations (e.g. 6 points).
Variable Target value Units
Protection Selectivity Yes/No -
Peak current < 3 pu
Clearance time < 6 ms
Table 3: Demo 1 KPI number 3
KPI
Number KPI Name Description
4 DC interarray
design
Validates if the proposed DC interarray topologies achieve the expected
performance in terms of Wind Farm security, operation and maintenance.
Title Description Target value Units
Interarray
topology
Maximum number of wind
turbines to conform a DC
interarray
<5 -
Fault
tolerance
Designed to withstand a single DC
interarray short-circuit without
stopping the whole wind farm.
Variable: Number of short-
circuits that the WF can
withstand without stopping.
≥1 -
Power
unbalance
Maximum power unbalance
between wind turbines on each
interarray.
>3 %
Motorising
capability
DC interarray topology allows
wind turbine motorising for
maintenance tasks. It can deliver
(P>0) and consume (P<0) active
P>0 and P<0 [MW]
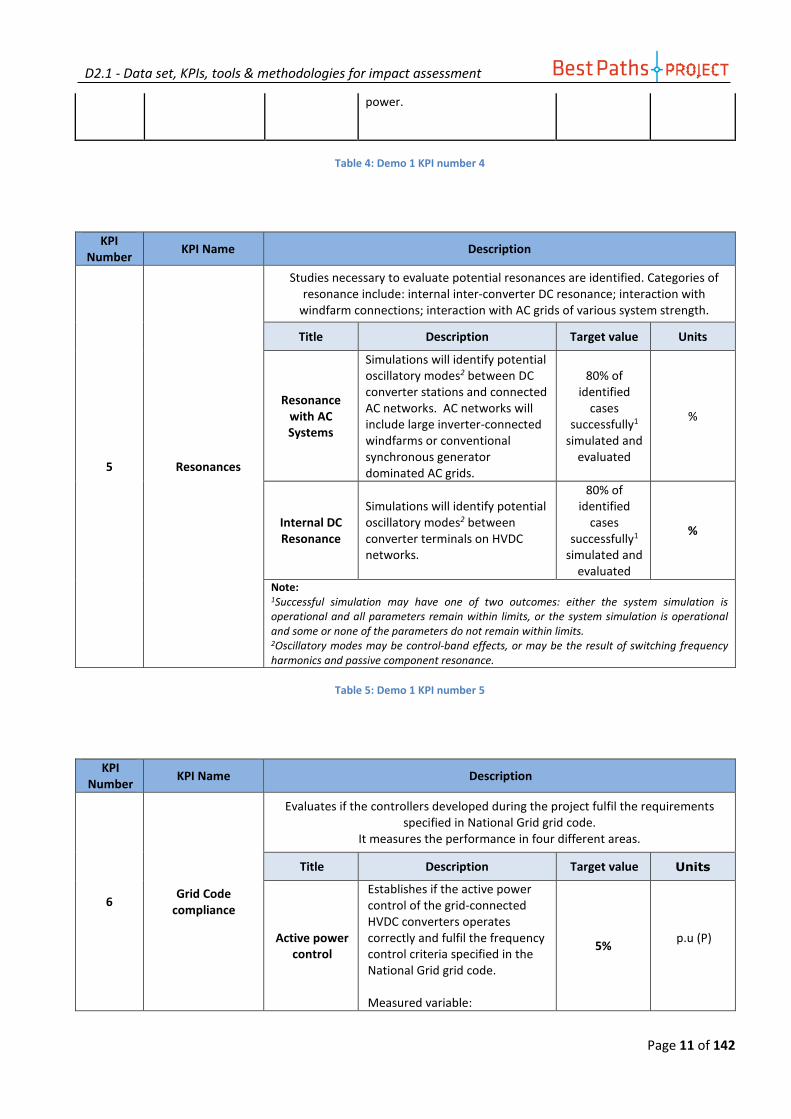
D2.1 - Data set, KPIs, tools & methodologies for impact assessment
Page 11 of 142
power.
Table 4: Demo 1 KPI number 4
KPI
Number KPI Name Description
5 Resonances
Studies necessary to evaluate potential resonances are identified. Categories of resonance include: internal inter-converter DC resonance; interaction with
windfarm connections; interaction with AC grids of various system strength.
Title Description Target value Units
Resonance
with AC
Systems
Simulations will identify potential oscillatory modes2 between DC converter stations and connected AC networks. AC networks will include large inverter-connected windfarms or conventional synchronous generator dominated AC grids.
80% of identified
cases successfully1
simulated and evaluated
%
Internal DC
Resonance
Simulations will identify potential oscillatory modes2 between converter terminals on HVDC networks.
80% of identified
cases successfully1
simulated and evaluated
%
Note: 1Successful simulation may have one of two outcomes: either the system simulation is
operational and all parameters remain within limits, or the system simulation is operational
and some or none of the parameters do not remain within limits. 2Oscillatory modes may be control-band effects, or may be the result of switching frequency
harmonics and passive component resonance.
Table 5: Demo 1 KPI number 5
KPI
Number KPI Name Description
6 Grid Code
compliance
Evaluates if the controllers developed during the project fulfil the requirements specified in National Grid grid code.
It measures the performance in four different areas.
Title Description Target value Units
Active power
control
Establishes if the active power control of the grid-connected HVDC converters operates correctly and fulfil the frequency control criteria specified in the National Grid grid code. Measured variable:
5% p.u (P)

D2.1 - Data set, KPIs, tools & methodologies for impact assessment
Page 12 of 142
C1: Steady state error of the active power after a defined settling time.
Reactive
power
control
Establishes if the reactive power control of the grid connected HVDC converters operates correctly and fulfil the voltage control criteria specified in the National Grid grid code. Measured variable: C1: Steady state error of the reactive power after a defined settling time.
5% p.u (Q)
Fault ride-
through
C1: Fault clearance time during which each DC Converter shall remain transiently stable and connected to the system for a three-phase short circuit fault or any unbalanced short circuit fault in the onshore transmission system
C2: Active power output in % of the level available immediately before the fault, upon both clearance of the on the onshore transmission system and within 0.5 seconds of the restoration of the voltage at the Interface point to within 90% of nominal
[140ms, 90%]
Table 6: Demo 1 KPI number 6
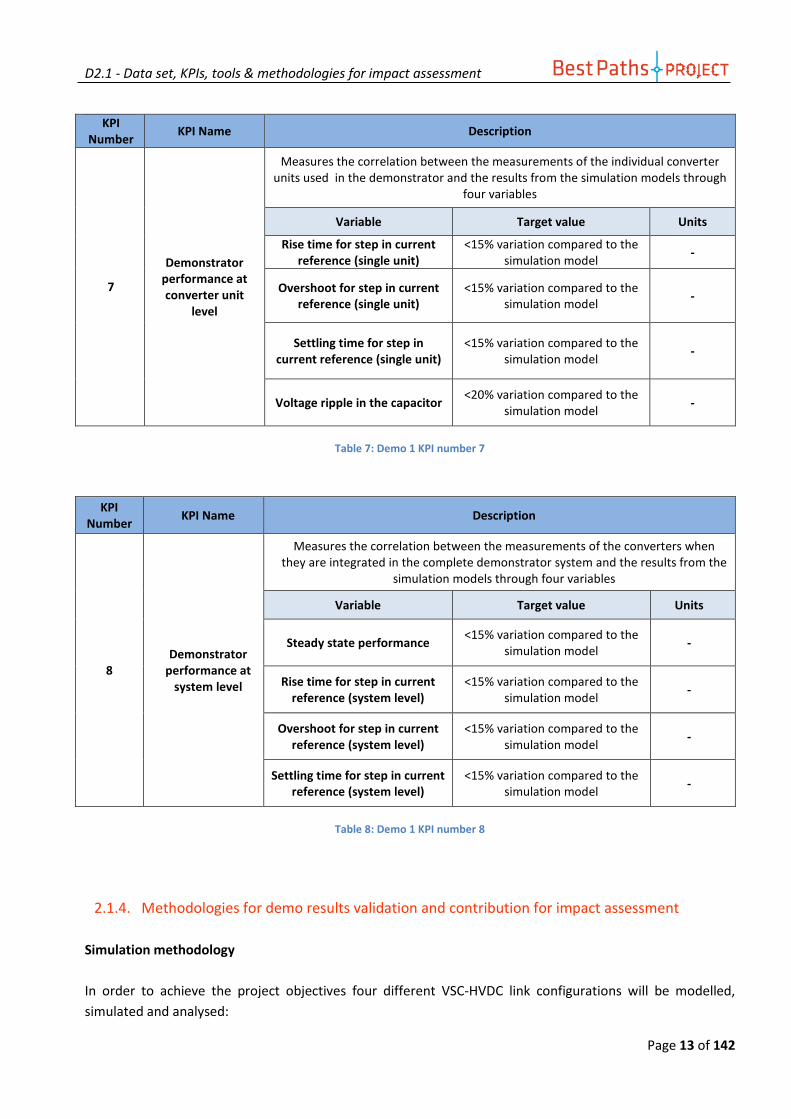
D2.1 - Data set, KPIs, tools & methodologies for impact assessment
Page 13 of 142
KPI
Number KPI Name Description
7
Demonstrator
performance at
converter unit
level
Measures the correlation between the measurements of the individual converter units used in the demonstrator and the results from the simulation models through
four variables
Variable Target value Units
Rise time for step in current
reference (single unit)
<15% variation compared to the simulation model
-
Overshoot for step in current
reference (single unit)
<15% variation compared to the simulation model
-
Settling time for step in
current reference (single unit)
<15% variation compared to the simulation model
-
Voltage ripple in the capacitor <20% variation compared to the
simulation model -
Table 7: Demo 1 KPI number 7
KPI
Number KPI Name Description
8
Demonstrator
performance at
system level
Measures the correlation between the measurements of the converters when they are integrated in the complete demonstrator system and the results from the
simulation models through four variables
Variable Target value Units
Steady state performance <15% variation compared to the
simulation model -
Rise time for step in current
reference (system level)
<15% variation compared to the simulation model
-
Overshoot for step in current
reference (system level)
<15% variation compared to the simulation model
-
Settling time for step in current
reference (system level)
<15% variation compared to the simulation model
-
Table 8: Demo 1 KPI number 8
2.1.4. Methodologies for demo results validation and contribution for impact assessment
Simulation methodology
In order to achieve the project objectives four different VSC-HVDC link configurations will be modelled,
simulated and analysed:

D2.1 - Data set, KPIs, tools & methodologies for impact assessment
Page 14 of 142
1. Back-to-back configuration: This is the simplest configuration that will be analysed in the project. It represents
the HVDC links that are under construction nowadays. In addition, as it is the simplest configuration, it will be
used to test and refine the controllers that will be developed on the project before addressing more complex
topologies.
Figure 3: back-to-back configuration
2. AC coupling configuration: In this configuration the AC outputs of several offshore converter stations are
connected forming a unique AC grid. The wind farms are connected to this grid. The offshore converter stations
are connected to the onshore ones following a back-to-back scheme. This configuration is suitable when the
distance between the wind farms is not too long.
Figure 4: AC coupling configuration
3. VSC-HVDC multi-terminal link: In this topology the converter stations are coupled at the DC side forming a multi-
terminal link.
Figure 5: VSC-HVDC multi-terminal link
4. VSC-HVDC meshed: In this configuration the DC sides of the converter stations are connected forming a meshed
DC grid. This configuration is the most complex one and concentrates most of the difficulties and technical
challenges that will be found in the future development of VSC-HVDC meshed networks.

D2.1 - Data set, KPIs, tools & methodologies for impact assessment
Page 15 of 142
Figure 6: VSC-HVDC meshed
These four configurations cover the different DC topologies that will be very likely used for transmission of
offshore wind energy in the future years. In addition, power electronics based solutions for the development
of DC inter-arrays will be analysed in the project. Although these solutions are not going to be used in the
near future, they may be of interest and will be also modelled and analysed in the project. The topologies
presented herein are a preliminary proposal and can be modified if new or better approaches are found
during the R&D activities.
-DC topology 1
Figure 7: DC topology 1
-DC topology 2
Figure 8: DC topology 2

D2.1 - Data set, KPIs, tools & methodologies for impact assessment
Page 16 of 142
-DC topology 3
Figure 9: DC topology 3
The methodology that will be followed to carry out the simulations will consist on the following three steps:
Step 1: Development of the basic models needed to perform the simulations
In the first phase of the project, the partners will work on the development of the individual models that will
be used as the basic pieces to build the simulation scenarios described above. These models include:
• Converter station models
• Transformer models
• AC grid model
• DC cables models
• Wind turbine models
• Models of the controllers
All partners will participate in the development of these models according to their previous experience and
some of them will lead the simulation of the topologies. Consequently coordination between partners is
essential at this stage of the project to avoid incompatibilities between models. In order to minimise the
risks, a guide on how to perform the models and a document describing the model templates and interfaces
will be circulated among the partners.
Two types of models are going to be developed:
1. Switched models: These models represent the performance of the system in an accurate way. They represent the
commutations of the semiconductors of the converter stations. Consequently, they are able to cope with the
fastest dynamic responses of the system. These models are fast and accurate enough to perform
electromagnetic simulations, total harmonic distortion and high frequency harmonic analysis, DC fault studies,
analysis of the fast interactions and oscillations between the different components of the HVDC link etc. These
models will be developed using MATLAB-Simulink. MATLAB allows performing simulations of power electronic
topologies in a simple and accurate way. In addition, the models developed under MATLAB are easily integrated
in the Opal RT system that will be used in the DEMO phase of the project. Consequently MATLAB suits perfectly
well the demands on the simulation tools for the development of the project.
2. Averaged models: These models represent the operation of the system at 50 Hz. They are less accurate than
their switched counterparts but the time required to carry out the simulations is lower. They are useful to
perform dynamic electromechanical analysis and load flow simulations. MATLAB and DIgSILENT PowerFactory
will be used to develop these models.

D2.1 - Data set, KPIs, tools & methodologies for impact assessment
Page 17 of 142
Step 2: Validation of the models against an experimental demonstrator
Both switched and averaged models need to be validated before carrying out the simulations studies
commented before. The validation of the models will be performed against the experimental results
obtained with a small scale demonstrator to be developed in the DEMO phase of the project. The
methodology that will be used to validate the accuracy of the models is represented in the following figure.
Figure 10: methodology to be used to validate the accuracy of the models
A set of simulations, that will represent the performance of the scaled-down demonstrator, will be carried
out using the “basic models” developed previously. Results from these simulations will be compared against
the experimental results from the demonstrator. If the divergence found between simulation and
experimental results is less than 15% the models will be considered accurate enough, and will be
extrapolated to represent real size systems in an accurate way. If the divergence between the simulation and
the experimental results is higher, the models will need a refinement and the procedure shown in the figure
will be repeated. This procedure will be repeated as many times as required until the results of the models
are accurate enough.
Yes
Development of scaled
down models matching
the demonstrator and
carry out simulations
Are the models
accurate
Comparison between
experimental and
simulation results
The model results
can be
extrapolated to
No

D2.1 - Data set, KPIs, tools & methodologies for impact assessment
Page 18 of 142
Step 3: Simulation of the full-scale VSC-HVDC configurations
Once the simulation results are accurate enough, the models with downscaled parameters will be extended
to deal with full-power systems. A set of simulations will be carried out to study the performance of the
proposed topologies and to calculate the KPIs described in the previous section.
One critical point that needs to be addressed properly is the development of the scaled down demonstrator
under realistic objectives. The procedure followed to define the demonstrator is described in the following
lines.
Demonstrator development
A first step in the development of a laboratory scale demonstrator is to fix realistic objectives to reproduce
the real units. Efficiency or parameters as the THD that are critical in the design of a HVDC terminal cannot
be assumed as practical design specifications in the laboratory scale prototypes. However, the scaling can be
focused to maintain the main dynamics of the converter in terms for example of time constants. This has
been examined in a preengineering phase where the effect of the scaling has been assessed. The reference
model is based on the preliminary design of an MMC-HVDC system interconnecting the 400kV systems of
France and Spain. The reference model data is given in the table below. Figure 12 shows the reference model
one-line diagram.
Value Comment
DC Voltage: 320 kV Rated Transmission Capacity: 1059MVA 1000MW 350Mvar
Sub-Modules per Multivalve arm: 400 800 per phase Sub-Module Capacitance: 10 mF designed for ±10% voltage ripple Arm Reactor: 15% of the system impedance Transformer: 18% of the system impedance - 1059-MVA, 400/33kV
three phase transformer with its secondary winding connected in delta
Figure 11: reference model data
Figure 12: reference model one-line diagram
Numerical simulations on the reference model and on a laboratory scale model confirm the divergences in
the voltage output in terms of THD or concerning the circulating current. However, proper design can lead to
a reasonable match of the main dynamics of the converter.
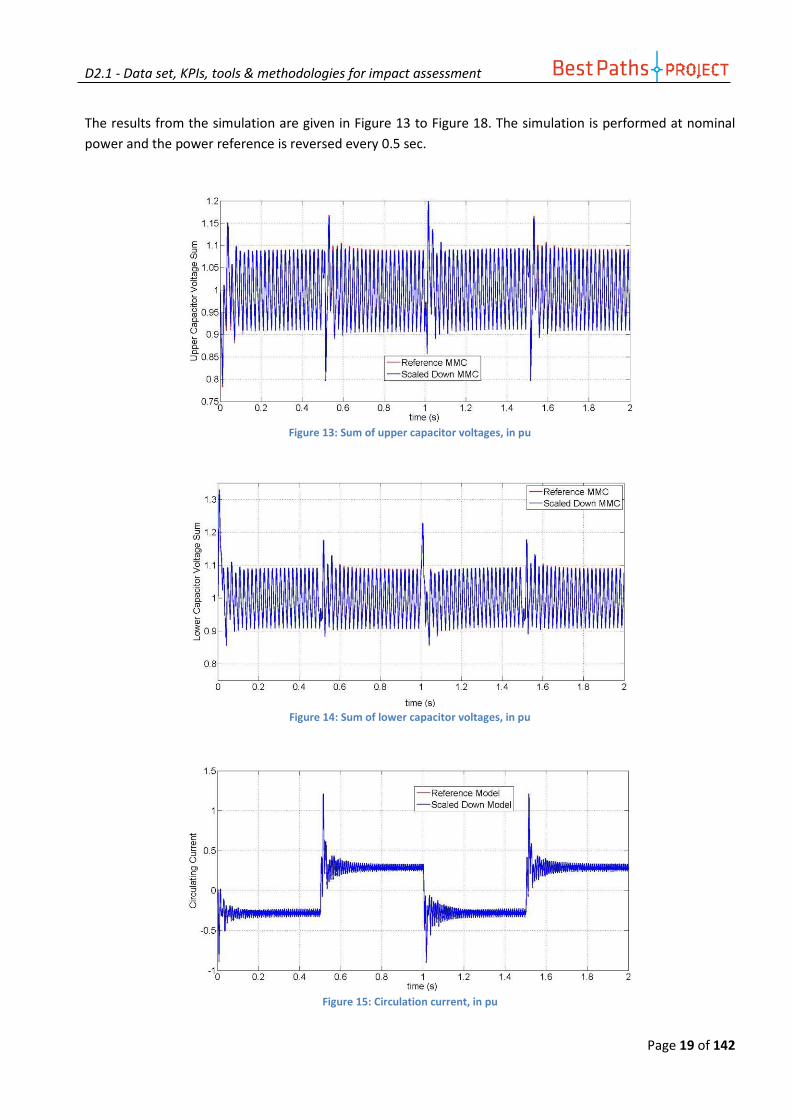
D2.1 - Data set, KPIs, tools & methodologies for impact assessment
Page 19 of 142
The results from the simulation are given in Figure 13 to Figure 18. The simulation is performed at nominal
power and the power reference is reversed every 0.5 sec.
Figure 13: Sum of upper capacitor voltages, in pu
Figure 14: Sum of lower capacitor voltages, in pu
Figure 15: Circulation current, in pu
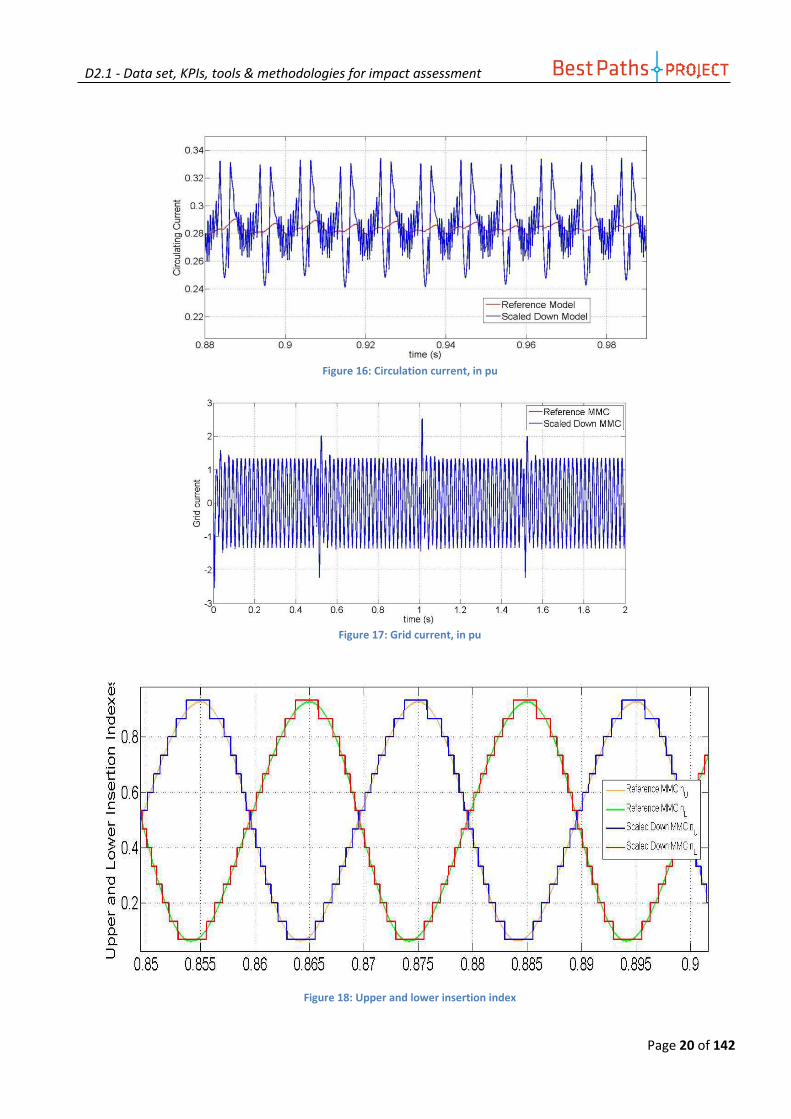
D2.1 - Data set, KPIs, tools & methodologies for impact assessment
Page 20 of 142
Figure 16: Circulation current, in pu
Figure 17: Grid current, in pu
Figure 18: Upper and lower insertion index

D2.1 - Data set, KPIs, tools & methodologies for impact assessment
Page 21 of 142
Despite the good agreement between both models, reducing the number of levels will cause higher
harmonics in the scaled-down system, particularly in the circulating current as shown in Figure 16.
Reducing the number of levels will have a direct implication on the THD, as can be seen also from the
resulting insertion indexes in Figure 18. The "staircase" waveform is used for the reference and the scaled
down model. A bigger inductance in the laboratory model might therefore be necessary to mitigate the
resulting harmonics.
The control implementation for the units has preliminarily been defined as in Figure 19 below with three
hierarchical levels. Two of the levels are based on a FPGA (Field-Programmable Gate Arrays) controller while
the upper level is based on an OPAL-RT platform. Communication between the control units is based on
gigabit optical fiber.
Central control unit
Arm control board
InsulationCabinet
Fiber
FPGA
uP
SFP
SFP
SFP
SFP
Block
Arm
Control domain-power domain border interface
Block control board
Drivers
Measurements
Drivers
Measurements
Drivers
Measurements
FPGA
Drivers
Measurements
Drivers
Measurements
Drivers
Measurements
FPGA
Drivers
Measurements
FPGA
FPGA/ARM
FPGA/ARM
Power cell board
Gbit/s
Gbit/s
Gbit/s
Gbit/s
Power circuit wiring
Arm
Figure 19: Preliminary unit control

D2.1 - Data set, KPIs, tools & methodologies for impact assessment
Page 22 of 142
2.2. Demo 2: HVDC-VSC multi-terminal interoperability
2.2.1. Demonstration description
HVDC grids are expected to be key elements of future power systems, both at national and trans-national
scale. As an illustration, major initiatives have been emerged in the last few years: Krieger’s Flak was
probably the first international project in the North Sea to consider HVDC grid; since then, Medgrid and
Desertec envision DC grids to take advantage of the energy production portfolio over a wide area, while the
Atlantic Wind Connection project is a wide attempt to collect offshore wind energy through a DC backbone
on the East coast of the US.
While some major issues related to HVDC-based grids were already considered in previous projects (for
instance: protection and control of DC grids in former TWENTIES project), some unknown aspects still
remain. On the technical side, the major barrier to overcome is interoperability, as there is no doubt that
future DC grids will require HVDC converters to be provided by various manufacturers; obviously, this
statement holds both for new DC grids and also for possible extensions of existing HVDC schemes.
In December 2013, the first multi-terminal HVDC arrangement based on VSC technology was erected in China
(Nan’Ao project); though the three converters were provided by different Chinese manufacturers, the
control and protection were designed by one single stakeholder for the whole system. Consequently, this
project can be regarded as an important step forward with respect to interoperability, but still, this issue
remains partly addressed, given the realization conditions which would not apply in a competitive framework
or for the step by step erection of a DC grid. Therefore, it should be recalled that the objective of DEMO #2
remains of utmost relevance. Indeed, the Chinese project was realized thanks to a deep collaboration
between manufacturers (mainly driven by the utility), and the most critical part of the system regarding
interoperability (control and protection) was realized by the same single entity, rather than by each vendor;
obviously, such a situation would not apply to European projects, as manufacturers are competing and want
to safeguard their intellectual property and know-how to a larger extent.
Therefore, the goal of DEMO #2 is to highlight the conditions to ensure maximum interoperability, for all
parties involved (utilities, manufacturers, standardization bodies, testing laboratories, etc.) at different
project stages (from specifications to converter testing and commissioning), for a wide range of HVDC
arrangements based on recent VSC technology (in particular: MMC or Modular Multi-level Converters). In
particular, DEMO #2 will issue recommendations both for specifications and hardware control
implementation which would ensure maximum interoperability for multi-vendor solutions. Finally, the
proposed guidelines will provide feedback to the Network Code drafting teams of ENTSO-E, but also form a
solid basis to make significant advances towards interoperability requirements for multi-vendor HVDC grids
as currently targeted by standardization groups (CENELEC, IEC, etc.).
Leading HVDC manufacturers (ABB, Alstom and Siemens), major European TSOs (Elia, REE and RTE) and
renowned academics (Ecole Centrale Lille and University of Strathclyde) will join their efforts toward this
objective, by offering their respective experience on HVDC-VSC converters, power systems operation and
“out-of-the-box” vision in DEMO #2.
D2.1 - Data set, KPIs, tools & methodologies for impact assessment
Page 23 of 142
To this end, a step-by-step approach is followed:
First, a set of DC system topologies (from point-to-point links to actual DC grids) will be defined such that a
wide range of situations are considered (connection to strong AC networks, to weak ones and to offshore
wind farms; converters in close electric vicinity or connected to different AC networks). In addition to these
network conditions, functional specifications describing the requirements and expected behaviour of
converters will be provided for various conditions: normal operation, during and after a fault, and during
special sequences (start-up, connection, disconnection, and shutdown).
Then, manufacturers will adapt their generic VSC converter models and controllers to meet these
specifications, and provide dedicated models to run simulations in EMTP-RV electro-magnetic transient
software.
These models will be tested individually first (in single-vendor point-to-point configurations) to validate them
against the specifications, and then, in multi-vendor configurations according to the DC system topologies
initially defined. Interoperability issues are likely to occur at this early stage, either at the interface between
manufacturers, or between an external master control and the converters, or caused by inappropriate
behaviour if the specifications appear to be not comprehensive enough for a multi-vendor project.
The outcome of the previous tests is twofold: a first set of recommendations will be issued based on the
experience gained with the previously described offline simulations. In addition, detailed replica
specifications, enriched by the EMTP-RV simulations experience, will be provided to manufacturers for the
provision of converters control cubicles. These cubicles (or control replicas) will be the exact hardware
implementations of the manufacturers current control system solutions; in particular, the replicas will
implement interfaces to interact with the digital simulator for (i) measurements from and control signals to
the simulated VSC converters, (ii) information exchange with the simulated master control algorithms and
(iii) measurements and trigger signals for protection against DC and AC faults.
Each replica will host the exact control system of a converter station, as implemented in a real HVDC project.
As for the offline models, the cubicles will be tested individually first, and finally on previously defined DC
topologies.
Finally, updated recommendations for the ENTSO-E and standardization bodies will be issued based on the
results observed during the real-time simulation phase with the exact control replicas.
As a conclusion, BEST PATHS DEMO #2 gathers significant assets to accomplish a decisive step forward
regarding the interoperability issue: rather than a few specific and hypothetical AC/DC configurations, DEMO
#2 proposes to explore a wide range of possible DC arrangements and AC conditions, such that future DC
grids will necessarily be built upon the elementary bricks considered in this project; additionally, this will be
the base for the final recommendations on a wide set of operational conditions and thus demonstrate their
generality. Furthermore, the results will benefit from undebatable credentials thanks to the use of actual
converter control replicas provided by their manufacturers, taken to a critical look from major TSOs and
academics.

D2.1 - Data set, KPIs, tools & methodologies for impact assessment
Page 24 of 142
2.2.2. Demonstration Objectives, expected impacts and barriers to be overcome
-Demonstration objectives:
The main objective of DEMO #2 in BEST PATHS is to establish the conditions to maximize interoperability
for multi-vendor VSC-HVDC solutions, as this technology is regarded as the best suited for the deployment
of future DC grids.
In a first stage, functional specifications in DEMO #2 will be build based on the existing documents published
by major stakeholders (HVDC Network Code from ENTSO-E, guidelines for DC grids by CENELEC …); however,
another important goal for DEMO #2 is to provide at the end of the project recommendations in order for
TSOs and standardization bodies to update their guidelines and standards according to the results observed
in this piece of work.
Finally, the third – and long-term – objective of DEMO #2 is to propose solutions to transmission networks
to facilitate massive integration of renewable energy (in particular wind power generation) via the
development of HVDC technology.
With respect to these objectives, DEMO #2 steps out of earlier work for different reasons:
• For the first time, three major HVDC manufacturers will contribute to this effort by providing control
replicas of their latest VSC technology, to perform independent tests. The connection of these cubicles
to a real-time simulator will provide undebatable evidence of the results, contrary to simulations
performed using generic or simplified vendor models.
• Representative European TSOs and well-known academics will take part in this project to ensure that
the different multi-vendor HVDC systems comply with the requirements for actual operation on such
equipment.
• The partners in DEMO #2 will investigate the interoperability issue from the specification stage to the
final testing of converter station replicas. This large coverage will gather the views of different
stakeholder (utilities and manufacturers) at different levels (planning, validation, operation under
normal or faulty conditions, coordinated control…), and finally benefit to the emerging standardization
of HVDC grids.
• Finally, the aim of DEMO #2 is to consider a wide range of DC topologies and conditions in order to
assess generality of the results: different control modes, connection to offshore wind farms, AC and DC
fault scenarios, etc. Rather than applying to a few specific situations, the conclusions will therefore
benefit to virtually any future HVDC project and manufacturer.
-Demonstration expected impact:
The expected impact of DEMO #2 is manifold, both at the demonstration level, but also considering a pan-
European deployment for future DC grids.
D2.1 - Data set, KPIs, tools & methodologies for impact assessment
Page 25 of 142
Grid planning. The aim at the demonstration level is to virtually include any specific AC or DC condition. To
this extend, weak, strong and islanded AC networks will be considered for AC connection; concerning DC
connection, it was decided to study the widest possible range of “elementary” converters arrangements, as
future DC grids will necessarily be variations of these basic configurations. Therefore, DEMO #2 will obviously
have an impact on planning activities as it explores a wide variety of situations encompassing virtually any
condition for grid planning or grid extension, thanks to the results observed on those “elementary bricks”.
At both national and pan-European levels, the recommendations exhibited by DEMO #2 to maximize
interoperability for multi-vendor VSC-HVDC schemes will create the confidence and technical conditions for
the erection of future DC grids, as they will certainly not be entrusted to a single manufacturer. As a
consequence, the results from this demonstration will enable single TSOs and consortiums of TSOs to
envision new power systems in grid planning, from the simple extension of an existing HVDC scheme to the
design of a new DC grid from scratch.
Design, Engineering and Construction. As a complementary work by academics, manufacturers and TSOs,
DEMO #2 will have an impact on various aspects of interest for those stakeholders: at the specification stage
(mostly for TSOs), the recommendations will exhibit requirements for which special attention should be paid
to assess interoperability (communication, interfaces between converter controls and/or master controls, for
example); guidance for the testing phase and the design of specific controls should benefit to manufacturers,
academics, and independent testing facilities.
At a broader scale (pan-European and beyond), the recommendations issued by DEMO #2 will be presented
to ENTSO-E and hopefully make it possible to update some general documents shared among TSOs (such as
the Grid Code for HVDC); additionally, the experience gained from this demonstration should lead to
significant advances towards interoperability standards of multi-vendor HVDC grids (in CENELEC, IEC,…).
Finally, the conditions exhibited to maximize interoperability for future DC grids should provide the
confidence necessary for decision-makers and utilities to move forward toward their erection.
Grid management and operation - Proceedings for inter-area coordinated operation. Although DEMO #2 is
focused on interoperability issues first, the variety of scenarios (including fault conditions) considered will
make it possible to exhibit operation conditions which are likely to lead to adverse situations: interactions
between converters, unstable control modes due to uncoordinated tuning of regulations, for instance.
This holds both for classical converter controls (where each station hosts a centralized control) and for
coordinated controls, as some more complex DC grids will be tested with a master control sending set-points
to individual converters.
Wind energy integration (and other RES). DEMO #2 covers a wide variety of situations, and as such, the
topologies considered apply not only to wind generation, but also to any energy source, including any RES.
However, it should be emphasized that offshore wind energy (or tidal energy) requires specific connection
conditions (through islanded AC networks), which in turn require dedicated controls for HVDC converters.
Those situations will be deeply investigated in order to assess the interoperability conditions of RES
integration, both onshore and offshore.
D2.1 - Data set, KPIs, tools & methodologies for impact assessment
Page 26 of 142
Therefore, it can be claimed that this demonstration, jointly with DEMO #3 of former TWENTIES project (on
control and protection of offshore DC grids) aspires to knock down the last technical barriers for massive
integration of renewable; both have a significant impact on the deployment of future DC grids, which should
facilitate the use of offshore wind energy as the averaging effect of DC grids will contribute to make it a
steadier energy source.
Economic impact. Beyond the technical aspects covered in DEMO #2, there is no doubt that the economic
impact will be considerable if, as expected, the results make it possible to exhibit the factors ensuring
maximal interoperability between VSC converters from various manufacturers. Indeed, in a competitive
market, future DC grids will be based on VSC technology provided by different vendors. Thus, it can be
claimed that the success of DEMO #2 is a prerequisite to the actual design and implementation of national or
pan-European DC grids.
Moreover, apart from the specific question of DC grids, it is expected that the results obtained in DEMO #2
will contribute to create new perspectives for “standard” point-to-point HVDC links (for example, by
considering a multi-vendor ones), which will increase the development of HVDC technology and, as a side
effect, RES integration.
-Demonstration barriers to overcome:
At the demonstration level, the main barriers foreseen for DEMO #2 are mainly technical ones.
First of all, it should be recalled that no multi-vendor VSC-HVDC system is under operation so far (apart from
the recent Nan’Ao project in China, for which the conditions were very different from the ones expected for
future DC grids, as Chinese manufacturers had to share information and collaborated with another).
Therefore, the objectives of DEMO #2 are particularly ambitious as it will nearly start from the blank page.
Another technical challenge results from the objective to cover a very large number of situations (for various
types of AC connections, considering different DC topologies, for different control modes and with different
shifts on the position of the three manufacturers): by varying all those parameters, a few hundreds of
situation would result from the simplest topologies (with only 2 or 3 converters). Therefore, the number of
simulations to perform (both in offline and real-time simulation), for normal operation, faulty conditions or
special sequences is particularly challenging due to the large number of combinations.
In addition to those technical barriers, DEMO #2 will have to create the conditions for competitors (HVDC
manufacturers) to share with independent partners (TSOs and academics) sufficiently detailed information
and models for in-depths investigations expected in this demonstration. This is all the more difficult as
detailed models are prone to exhibit possible interoperability issues compared to generic and simplified
models, but also because this may be regarded by manufacturers as an industrial risk with respect to their
intellectual property.
In addition to the above mentioned barriers, supplementary ones are foreseen concerning a wider
implementation of DEMO #2 results.

D2.1 - Data set, KPIs, tools & methodologies for impact assessment
Page 27 of 142
On the other hand, it is expected that the conclusions of this demonstration project should benefit to
normalization bodies (at least at the European level); on the other hand, some other attempts toward
normalization are ongoing (for example: Chinese manufacturers evoked this objective during CIGRE 2014).
Therefore, different standards could result in the coming years and, as a result, slow down the erection of
trans-national DC grids.
In addition, the results obtained with former TWENTIES DEMO #3 (on DC grids protection and control) and
the ones expected in BEST PATHS DEMO #2 constitute decisive and technical steps forward for future pan-
European DC systems. However, some barriers still remain to be overcome:
• Planning such complex structures is challenging as DC grids are likely to be realized step by step, over
long periods during which the planning assumptions will obviously evolve; to this extent, the results
expected from the e-Highway 2050 project for robust grid planning should provide some significant
answers.
• The governance of future DC grids, but also the share of responsibility between “traditional” TSOs and
a possible DC grid operator, or their mutual obligations are subject to various debates.
• Thanks to the results obtained with the TWENTIES project (DEMO #3), it is now established that the
protection is still unfeasible for very large DC networks (ratings of existing DC circuit breakers are too
limited; protection algorithms are viable up to a certain cable length). These technical issues are still
unsolved, which results in limitations on DC grid size and ratings.
• Finally, from the market perspective, the erection of DC grids could be facilitated by increasing the
value of some services they could provide (such as power oscillation damping). Rather than a barrier,
this aspect should be considered as a facilitator.
2.2.3. Demo 2 KPI’s
Preliminary note:
As some KPIs are related to the different situations for various topologies considered in DEMO #2, this
preliminary note is intended to clarify some aspects related to both offline and real-time simulation.
As discussed and approved during the 1st BEST PATHS Technical Committee (Dec. 16th 2014), DEMO #2 will concentrate on five DC topologies, which comply with the general ideas and requirements exposed in the DoW : point-to-point HVDC links with different manufacturers; connection of a third terminal to point-to-point connections; interactions of converters from different manufacturers through the AC network; connection of offshore wind generation, or AC passive networks. In addition, two meshed DC systems and a topology with more than four converters are considered. The basic idea is to consider elementary topologies which should be carefully studied, as (i) this will provide a step-by-step approach, from simple situations to more complex layouts, and (ii) the selected topologies will be the basic elementary bricks of future complex DC systems, so that no new sort of interoperability issue should be experienced, as future large DC grids will be simply based on similar, reduced but deeply studied small DC systems. With that perspective, and given the fact that each of the three manufacturers involved in DEMO #2 will provide one control replica each, it was decided to test all possible layouts with two or three VSC converters

D2.1 - Data set, KPIs, tools & methodologies for impact assessment
Page 28 of 142
as exhaustively as possible, as they will the elementary brick of future DC grids. The three resulting topologies, used both for offline and real-time simulation, are sketched below. In addition, more complex DC layouts (with more converters) will also be considered for offline simulation only.
Topology
T1
Topology
T2
Topology
T3
Figure 20: Demo 2 topologies
The simulations to be performed with EMTP-RV (for offline simulation) and Hypersim (for real-time simulation) on the above topologies will cover different AC network conditions:
o connection to strong / weak AC / islanded networks (offshore wind farm); o independent AC networks / closely coupled converter connections; o various control modes (active power, reactive power, DC voltage, AC voltage); o different shifts on positions (or roles) for the three manufacturers for each topology.
By combining all those parameters and excluding some unrealistic combinations, it is possible to list all
relevant situations to be examined in simulation tasks, for topologies T1 to T3:
o For topology T1:
DC
AC
AC
DC
DC
V1 V3
DC
AC V2
AC
AC
AC
DC
AC
AC
DC
DC
V1 V3
DC
AC V2
AC
AC
AC
DC
AC
AC
DC DC
V1 V2
AC AC
P

D2.1 - Data set, KPIs, tools & methodologies for impact assessment
Page 29 of 142
AC connection Control mode13 Shift on
manufacturers Situations
2 strong AC networks PQU;VQU (4 cases) 4x6 24
1 strong AC network ; converters 1 & 2 are connected to the same AC network, such that their connection points are electrically close
PQU;VQU (4 cases) 4x6 24
2 weak AC networks PQU;VQU (4 cases) 4x6 24
1 weak AC network ; converters 1 & 2 are connected to the same AC network, such that their connection points are electrically close
PQU;VQU (4 cases) 4x6 24
Connection of an offshore wind farm fU;VQU (2) 2x6 12
Total 108
Table 9: Topology 1 cases
o For topologies T2 and T3:
AC connection Control mode Shift on
manufacturers Situations
3 strong AC networks PQU;PQU;V (4 cases) 4x3 12
1 strong AC networks ; converters are connected to the same AC network, such that their connection points are electrically close
PQU;PQU;V (4 cases) 4x3 12
3 strong AC networks P;VQU;VQU (4 cases) 4x3 12
1 strong AC networks ; converters are connected to the same AC network, such that their connection points are electrically close
P;VQU;VQU (4 cases) 4x3 12
3 weak AC networks PQU;PQU;V (4 cases) 4x3 12
1 weak AC networks ; converters are connected to the same AC network, such that their connection points are electrically close
PQU;PQU;V (4 cases) 4x3 12
3 weak AC networks P;VQU;VQU (4 cases) 4x3 12
1 weak AC networks ; converters are connected to the same AC network,
P;VQU;VQU (4 cases) 4x3 12
13 Regular letter are used for active power control (P for active power ; f for frequency ;V for DC voltage). Subscript letters are used for reactive power (Q for reactive power ; U for AC voltage).

D2.1 - Data set, KPIs, tools & methodologies for impact assessment
Page 30 of 142
such that their connection points are electrically close
Connection of an offshore wind farm f;V;V (1) 1x3 3
Connection of an offshore wind farm f;P;V (1) 1x6 6
Connection of two offshore wind farms
f;f;V (1) 1x3 3
Connection of two electrically close offshore wind farms (same offshore AC network)
f;f;V (1) 1x3 3
Total 111
Table 10: Topology 2 and 3 cases
KPI
number KPI name Description
Description of how it is
measured Target value Units
1
Compliance of
EMTP VSC
models to the
specifications
The first deliverable in DEMO #2
(D4.1) will describe among other
things the functional specifications
for VSC converters used in the
remaining of the project. Then, the
three manufacturers will provide
EMTP models of the converters
which should comply with those
specifications (subtasks 4.2.1 to
4.2.3). The testing and validation of
each individual model (subtask
4.2.4) is therefore an important
indicator of their compliance to the
specifications, and expected
adequacy for future interoperability
tests.
Therefore, this KPI is intended to
measure the validity of each EMTP
model, as their compliance to the
original specifications will be a
prerequisite to forthcoming
interoperability tests.
Deliverable D4.1 will include a
set of tests with associated
acceptance criteria. All those
tests will be performed during
subtask 4.2.4 on each individual
model provided by the three
manufacturers; for obvious
reasons, non-manufacturer
members of DEMO #2 will be in
charge of this validation. The
final value for this KPI will be
the percentage of passed tests,
for each model.
85% for ABB
85% for Alstom
Grid
85% for SIEMENS
%
2
Situation
coverage for
interoperability
tests
performed
using offline
simulation
(EMTP)
Each of the three first topologies
considered in DEMO #2 (T1, T2 and
T3) would lead to more than 100
different situations worth studying
for interoperability issues using
EMTP (the exact list of those
situations is described in the above
preliminary note). For each
individual situation, simulations
comprising steady operation, faulty
conditions and special sequences
(start-up, shutdown, connection,
disconnection) are expected when
relevant.
Deliverable D4.2 will provide
the results on interoperability
simulations performed with
EMTP. This deliverable will
exhibit simulation results
(plots, figures, etc.) for each
studied situation (for example
in an appendix).
Perform successful
simulation of:
-80% of listed
situations (see
above preliminary
note for their
complete list) for
topology T1 (87
different
situations)
-80% of listed
situations for
%

D2.1 - Data set, KPIs, tools & methodologies for impact assessment
Page 31 of 142
The goal of this KPI is to measure
the actual number of situations
covered with EMTP in DEMO#2.
topology T2 (89
different
situations)
-80% of listed
situations for
topology T3 (89
different
situations)
It is agreed that a
successful
simulation can
have two
outcomes: either
no
interoperability
issues is identified
or the simulation
indicates a
potential
interoperability
problem.
3
Compliance of
the control
replicas to the
specifications
Deliverable D9.1 will provide the
specifications of the improved
hardware HVDC control systems.
Then, the three manufacturers will
implement and provide physical
control cubicles (or control replicas)
for the converters which should
comply with those specifications
(task 9.2). The installation,
commissioning and validation of
each individual replica at RTE’s
facility for real-time simulation (task
9.4) are therefore an important
indicator of their compliance to the
specifications, and expected
adequacy for future interoperability
tests.
Therefore, this KPI is intended to
measure the validity of each replica,
as their compliance to the original
specifications will be a prerequisite
to forthcoming interoperability
tests.
Deliverable D9.1 will include a
set of tests with associated
acceptance criteria. All those
tests will be performed during
task 9.4, at RTE’s premises for
real-time simulation, on each
individual control cubicle
provided by the three
manufacturers. The final value
for this KPI will be the
percentage of passed tests, for
each replica.
85% for ABB
85% for Alstom Grid
85% for SIEMENS
%
4
Situation
coverage for
interoperability
tests
performed
using real-time
simulation
Each of the three first topologies
considered in DEMO #2 (T1, T2 and
T3) would lead to more than 100
different situations worth studying
for interoperability issues (the exact
list of those situations is described in
the above preliminary note). For
Deliverable D9.2 will provide
the results of hardware in the
loop tests performed with
Hypersim. This deliverable will
exhibit simulation results
(plots, figures, etc.) for each
studied situation (for example
Perform successful
simulation of:
-60% of listed
situations (see
above preliminary
note for their
%

D2.1 - Data set, KPIs, tools & methodologies for impact assessment
Page 32 of 142
(Hypersim) each individual situation,
simulations comprising steady
operation, faulty conditions and
special sequences (start-up,
shutdown, connection,
disconnection) are expected when
relevant.
The goal of this KPI is to measure
the actual coverage of situations
studied with control cubicles
provided by the manufacturer, using
the Hypersim real-time facility in
RTE’s premises.
in an appendix). complete list) for
topology T1 (65
different
situations)
-60% of listed
situations for
topology T2 (67
different
situations)
-60% of listed
situations for
topology T3 (67
different
situations)
It is agreed that a
successful
simulation can
have two
outcomes: either
no interoperability
issues is identified
or the simulation
indicates a
potential
interoperability
problem.
5
Measure of the
actual
improvement
realized on
interoperability
issues detected
during offline
simulations.
Topologies T1, T2 and T3 will be
tested using EMTP in offline
simulations first, and later, in real-
time with Hypersim. Interoperability
issues are already expected during
the first stage (EMTP simulations),
which will be reported in deliverable
D4.2. As detailed specifications will
be provided for the physical
implementation, enriched with the
experience gained thanks to the
EMTP simulations, some of these
interoperability issues (identified at
the offline simulation stage) should
be fixed for real-time tests, with a
special attention for the issues
which have the largest impact.
The goal of this KPI is exactly to
measure the improvement that was
made on interoperability issues
detected during the offline
simulation phase of the project, as
some of them shouldn’t occur again
during real-time simulation.
Deliverables D4.2 and D9.2 will
provide the results on
interoperability simulations
performed in offline and real-
time environments
respectively. The
interoperability issues reported
in those deliverables will be
compared to measure the
amount of issues that were
actually solved during real-time
simulations.
50% of the
situations for
which an
interoperability
issue was
experienced during
offline simulation
should not lead to
the same
interoperability
issue during real-
time simulation,
thanks to
enhanced
specifications and
the experience
gained using
EMTP. Of course,
this performance is
without prejudice
to the overall
number of
interoperability
issues experienced
during hardware in
the loop tests, as
%

D2.1 - Data set, KPIs, tools & methodologies for impact assessment
Page 33 of 142
new sorts of issues
may be
encountered.
Table 11: Demo 2 KPIs 1 to 5
2.2.4. Methodologies for demo results validation and contribution for impact assessment
The outputs which will be produced in DEMO #2 will suit future L2 and L1 indicators to establish the global
assessment for future replication in EU27, thanks to the following methodology.
Step 1. Coverage and genericity of the DC structures and situations studied in DEMO #2.
As approved during the 1st BEST PATHS Technical Committee (Dec. 16th 2014), DEMO #2 will concentrate on
five DC topologies, which comply with the general ideas and requirements exposed in the DoW: point-to-
point HVDC links with different manufacturers; connection of a third terminal to the previous case;
interactions of converters from different manufacturers through the AC network; connection of offshore
wind generation, or AC passive networks. In addition, two meshed DC systems and a topology with more
than four converters are considered.
It was agreed that instead of trying to represent the widest range of possible topologies for future multi-
terminal DC networks in Europe (which would be rather vain as a new layout is likely to appear in the near
future), elementary topologies should be extensively studied, as:
• The selected topologies will be the basic elementary bricks of future complex DC systems, so that no
new sort of interoperability issue should be experienced, as future large DC grids will be simply based
on similar, reduced but deeply studied small DC systems;
• This will provide a step-by-step approach, from simple situations to more complex layouts.
Therefore, in order to provide as much genericity as possible, a wide coverage of all possible layouts with three converters will be realised, using EMTP for offline simulation first, and then real-time simulation. Those
topologies (denoted T1, T2, and T3 in the KPI description above) are the elementary bricks from which
larger DC grids can be built up.
In addition to this investigation on different DC grid topologies, those simulations (both offline and in real-time) will test a series of different conditions for each topology:
• Connection of converters to distinct synchronous zones or to a single AC network (with interactions of converters from different manufacturers through the AC network).
• Connection of converters to strong AC networks; weak AC networks; offshore wind generation, or AC passive networks.
• Use of cables or over-head lines as DC conductors.
• Use of different control mode combinations: active power, DC voltage, frequency, reactive power, and AC voltage control.

D2.1 - Data set, KPIs, tools & methodologies for impact assessment
Page 34 of 142
• Use (or not) of a supervisor (or master control) to coordinate orders sent to the converters.
• Shift on the role and position of each manufacturer for each topology.
• Operation of the DC system during start-up, connection, disconnection and shutdown sequences.
• Operation of the DC system during normal conditions
• Operation of the DC system during faulty conditions (AC fault, DC fault, converter fault).
This large variety of situations, for the above elementary DC structures (T1, T2 and T3) will contribute to
establish conclusions with the widest coverage, so that their genericity should benefit possibly larger DC
grids, regardless of their exact layout.
The assessment of the coverage of this variety of situations is established for off-line and real-time simulation thanks to KPIs 2 and 4 respectively.
Step 2. Assessment of improvement and gains in understanding interoperability issues based on the basic
DC topologies.
Topologies T1, T2 and T3 will be studied under the same conditions (AC connection, faults, control modes, shift on vendor position, etc.) in two different stages: first, offline simulation will be realized for a first assessment of interoperability issues; then, thanks to refined specifications, real-time simulations will exhibit both the improvement achieved based on the experience gained during offline simulation (measured by KPI #5), and the probable new interoperability issues appearing as we will get closer to a real DC system.
Hence, KPI #5 and the simulation results described in deliverables D4.2 and D9.2 will establish a classification of interoperability issues encountered in DEMO #2:
• The first sort of interoperability issues corresponds to those which were discovered during the offline simulation stage, and for which a fix was found, applied (thanks to the improved specifications provided for the control replicas) and its adequacy was validated during real-time simulation under identical conditions. There are identified and fixed interoperability issues.
• The second set of interoperability issues corresponds to those which occurred during the real-time simulation stage (and possibly during the offline simulations, but were not successfully fixed for real-time simulations) and which led to recommendations (in deliverable D9.3) aiming at fixing them. At the end of the project, they will be identified and presumably fixed interoperability issues (as their fixes could not be actually tested in the time frame of the project).
• The last type of interoperability issues corresponds to those which occurred during the real-time simulation stage, and for which no satisfactory explanation and fix was found. These will be tagged as unsolved interoperability issues.
From the experience and the results obtained on topologies T1, T2 and T3, and thanks to the above typology of interoperability issues encountered in BEST PATHS, it will be possible to clearly define the progress that was made in this demo on interoperability issues, the recommendations and fixes which are already validated, those which could not be tested, and the remaining open questions.
This will provide enlightening information on the benefits provided by DEMO #2 on interoperability for
generic DC structures (and under general situations: AC connection, faults, etc), but also on the remaining
issues to overcome.

D2.1 - Data set, KPIs, tools & methodologies for impact assessment
Page 35 of 142
Step 3. Identification of the best candidate layouts for future DC grids (based on simple DC structures).
Compared to what is described in Step 2, a complementary way of exploiting the results achieved in DEMO #2 is to consider them separately for each topology (T1, T2, and T3) rather than globally. Indeed, the typology of interoperability issues described in Step 2 should also be established separately for each DC layout, so as to define the degree of interoperability achieved for each DC topology at the end of the
project.
As the simple DC layouts considered (topologies T1 to T3) will be the elementary building blocks for future
large DC grids, this indication will be crucial to determine which structures are likely to suffer from
interoperability issues, so as to focus on more favourable ones.
Step 4. Extrapolation to large and generic DC structures
In addition to topologies T1, T2 and T3 mentioned above, larger DC grids (with four converters or more) will be studied using EMTP only. One of them (T4) is a tree-like DC grid which can be regarded as an extension of T2; the other one (T5) combines both meshed parts and tree-like parts in a five-terminal DC grid (combination of T2 and T3).
Though an extensive coverage of all conditions is out of reach (combining all possible AC conditions, DC
transmission media, shifts on converter roles and control modes, type of fault, etc would generate an
intractable number of conditions), a significant number of offline simulations will be carried out based on the
experience gained from EMTP simulations on topologies T1, T2 and T3. By comparing the results obtained on
topologies T1, T2 and T3 on one hand with those corresponding to topologies T4 and T5 on the other hand
(for similar situations), it will be possible to assess to what extent the results witnessed on simple yet
generic DC topologies are replicable for larger and arbitrary DC grids.
2.3. Demo 3: SACOI link
2.3.1. Demonstration description
The demo originates from the plans to upgrade and revamp an existing HVDC link between Sardinia-Corsica–
Italy (also called SACOI), which is one of the few multi-terminal systems in operation in the world, with long
and pioneering history of operational performances: it is a 300 MW, 3-terminal interconnection between
continental Italy (Tuscany), the French island of Corsica and the Italian island of Sardinia in the Tyrrenian Sea.
It is owned and operated by Terna, the Italian TSO, since it entirely belongs to the Italian Public Grid; the 50
MW tap station in Corsica is considered as a cross-border withdrawal point, and the relevant HVDC station
belongs to EDF, who acts as the single electric utility (including transmission and distribution roles) in the
French island. Dating back to 1967, its useful life is long overdue, but the link is still in permanent – albeit
reduced – operation; its complete rehabilitation has been decided and included in the Italian national grid
development plan, while EDF will rehabilitate the tap station within the same project.
The rehabilitation project of SACOI is an important step towards increased integration of the transmission
system of Sardinia and Corsica with the interconnected European continental system (enhancing flexibility,
security, and efficiency of operation), and may play a significant role in the central Mediterranean corridor

D2.1 - Data set, KPIs, tools & methodologies for impact assessment
Page 36 of 142
for the connection of large amounts of RES, making Sardinia an important energy hub with multiple
connections to continental Europe, including Corsica Island, while new gas pipeline projects are also under
development. The project has indeed been listed among the “Projects of Common Interest” (PCI) under the
energy infrastructure package and is considered by ENTSO-E among the Projects of Pan-European
Significance for Long-Term in the Continental Central South (CCS) Region (project 34). The investments shall
be part of the TSO asset base. The demo aims at adding to the conventional approach an exploration of new
technological solutions and control strategies that would not be addressed under conventional investment
schemes. A conventional approach for the rehabilitation would involve the classical CSC converter
technology (in operation in the present SACOI), and the corresponding cable and OHL technologies. Yet, the
specific condition of the Sardinian power system and the constraints on infrastructure development call for
validating more innovative approaches which still largely need technology development and testing.
The SACOI link is a good laboratory for demonstrating new HVDC technologies, since it already comprises all
possible components of an HVDC system: 3 AC/DC converter stations linking 3 AC asynchronous systems at
different voltage levels, 2 submarine cable sections (in very sensitive and protected areas), 4 DC terrestrial
cable sections, 4 sea-land transition joints outposts, 3 overhead line sections (conductors and insulators) in
severe environmental stressing conditions, 3 electrodes systems of both sea and earth types.
The demo will thus address all major issues concerned with converters, cables, overhead conductors and
insulation, which may be of concern for rehabilitation projects of HVDC links similar to the SACOI, as well as
for new projects of onshore and offshore HVDC links, e.g. exhibiting:
• Series connection of cable and overhead lines (nominal rating and overloading capabilities may be
different, upgrading of OHL may be more constrained than upgrading of cables due to the limited
rights-of-way, see below)
• Limited rights-of-way of OHL lines, constraint to keep pre-existing towers
• Polluted environment
• Transient DC faults
The last two items challenge the need to keep the DC link operational as much as possible, and to minimise
the outage time.
The technological developments pursued in the demo will also meet the needs of the future HVDC grid,
offshore and onshore, aimed to provide wind power transfer capability and a high-capacity overlay for
interconnection purposes.
In the following, an overview of the demo is provided. More details are reported in D5.2 “Overall Demo 3
requirement design”.
***
-HVDC converter
HVDC converter will be based on an innovative design facilitating transient fault recovery and advanced
control (such as fast power inversion also through voltage polarity reversal, automatic switch to monopolar
mode and/or reduced voltage in case of contingency for strong pollution on the overhead line sections).

D2.1 - Data set, KPIs, tools & methodologies for impact assessment
Page 37 of 142
A technological challenge addressed by the converter demo is the realization of a buffer reactor -free Voltage
Source Converter (VSC). Generally, buffer reactors are inserted between a pair of arms for limiting rush
current at the instance of IGBT switching. Air core reactors used as buffer reactors require considerations for
separation distances for limiting induction current caused by magnetic field among them, especially in case
metallic structures are surrounding them, as well as installation space and insulation distances.
Applying a specially designed three windings converter transformer realizes a buffer reactors free Modular
Multilevel Converter (MMC) system. The secondary and tertiary winding of the transformer are connected to
a pair arms and the leakage inductance of the transformer is utilized for limiting rush current at the instance
of IGBT switching. This would bring advantages in the plant installation space over conventional half-bridge
MMC converter.
On the DC circuit of the demonstrator, the asymmetrical monopole configuration is chosen. From the
installation point of view, asymmetrical monopole configuration is easily expanded to bipole configuration. It
is for this that asymmetrical monopole configuration is adopted for this project.
For multi-terminal applications, voltage polarity inversion is not desirable in case of power flow reversal as
voltage management is not always easy. Hence in this demonstrator, a Half Bridge Voltage Sourced
Converter solution is applied.
In the research and development of the prototype, activities are focused on the building up and investigating
of the basic control strategies with an innovative converter, starting from a complete simulation phase.
Other requirements and characteristics of this demonstrator are shown below:
• Implementation of the Voltage Source Converter with a half-bridge converter in asymmetrical configuration;
• Development of the basic control schemes for a real-scale converter
• Evaluation of the usability of new control model for the innovative converter
• Fulfilment of the harmonics requirements of testing facilities.
A minimum required voltage and a real-scale current are applied in order to investigate the usable
components for various HVDC links.
Typical IGBT device (real-scale) for the HVDC converter application (for example 4.5kV) is applied for the
demo converter cell and the converter cell is to be designed in typical rating (real-scale) for HVDC converter
applications (for example DC capacitor voltage = 2 kV etc.)
Harmonic performance for the MV network for demo plant will be studied for verifying the number of series
cells. Preliminary calculations suggest the series number of the converter module/cells per arm could be 6.
Then the DC voltage is considered DC 10kV including a control margin (2kV x 6 series = 12kV).
Ratings of the demo converter are determined as: 12MW, 10kV, 1200A MMC voltage source converter with 6
series half-bridge per arm.
D2.1 - Data set, KPIs, tools & methodologies for impact assessment
Page 38 of 142
Innovative aspects of the Toshiba Multi-Terminal Multi-Level Voltage Sourced Converter, based on modular
design, even if deployed for this Demo in 2-terminal monopole configuration are achieved thanks to the
highly innovative unique circuit topology which will be designed and realized for the very first time by
Toshiba T&D Europe. The main benefits & innovative aspects of the proposed technology are the following:
• Highly compact design, layout, and dimension thanks to the simplified connection between the
transformer tanks, which allows the whole converter system to be extremely small and lightweight as
compared to what is currently available in the market;
• Minimized flux leakage, almost zero inductive current around the VSC converter, and minimum heat
propagation, which makes it ideal for use within metallic structures and environments such as offshore
platforms. This benefit is achieved thanks to the use of the new generation highly advanced converter
transformer, the impedance of which will act as the buffer reactor, and hence no buffer reactor will be
needed.
• Full protection of the DC overhead line in case of any failure, thanks to the deployment of a highly
innovative High Voltage DC Circuit Breaker, simulated in the R&D phase, which allows the non-affected
terminals to continue to function in case of any fault in the DC line connecting to one terminal;
• Zero risk of any overheating caused by the leakage flux thanks to the use of the above mentioned new
generation converter transformer.
-Land and submarine cables
The demo activity on cable technology is aimed to substantially increase the voltage level of both land and
submarine extruded cables, thus meeting the needs for higher and higher capacity of DC links realised with
voltage source converter technology and addressing the needs of the future HVDC grids. Moreover, as far as
submarine cables are concerned, the demo will provide solutions for increased installation depth, thus
removing further barriers to submarine and offshore transmission deployment.
The development and technical demonstration for the cable part of Demo 3 will be two electrical
prequalification programmes, one for land installation, one for submarine application carried out in
accordance to the CIGRE TB 496 document "Recommendations for Testing DC Extruded Cable Systems for
Power Transmission at a Rated Voltage up to 500 kV" (which replaced TB 219). Testing the two circuits,
possibly connected together in a joint test length, will include the cable and all relevant accessories.
Additionally, and relevantly for the submarine length, a mechanical prequalification procedure according to
CIGRE Electra n. 171 clause 2.2 and 2.3 will be carried out. Finally, and again for the submarine length,
external water pressure withstand test will be carried out on a cable sample (visual examination).
-High Temperature Low Sag (HTLS) conductors
A typical issue related with repowering of transmission corridors consists of the constraint to keep the same
rights-of-way. Accordingly, the design of the new installation must comply with the mechanical properties of
the previous design. Higher capacity generally implies larger rights-of-way requirements, unless special
solutions are adopted. The latter may consist of High Temperature Low Sag (HTLS) conductors; however,
D2.1 - Data set, KPIs, tools & methodologies for impact assessment
Page 39 of 142
conventional HTLS technology under the above constraints may lead to increased losses. This feature is
particularly undesired, as the DC links may be very long. Moreover, to our knowledge HTLS has never been
applied to DC but only to AC. The demo will thus cover the development of HTLS solutions suitable for DC
transmission. The idea is to develop an innovative conductor which is characterized by new material (lighter
than steel) as conductor core. The new solution will be characterized by an increasing of conductive section
which guarantees higher ampacity (especially if the material for external layers will be high thermal limit
aluminium alloy) and reduced losses. The demo will include a design phase, in which two or three conductor
geometries will be designed based on the specific line needs and constraints. Based on software simulations
of expected performances, the most promising solutions will be chosen for production in preliminary
samples. The design and correct sizing of fittings will be done in parallel. It will be very important to
guarantee the complete system performances and compatibility between the new system and the existing
condition. The final phase of this demo is the production of the most promising samples of different
technologies to obtain a complete characterisation from a mechanical, electrical and thermal point of view.
These samples, whose length will be around 400-500 meters, will be used to obtain a complete
characterisation from a mechanical, electrical and thermal point of view. The specific tests will be defined as
part of the work, considering the technology chosen and the characteristic of the line. In fact no international
technical standards on procedures and tests exist on this topic (especially for composite core material
conductors). Tests will be made partly based on current HTLS testing procedures (devoted to AC conductors),
partly on new procedures defined ad hoc.
-Insulation of overhead DC lines
A field measurement campaign and laboratory tests will be conducted in order to characterize electric and
mechanical properties of the insulators of HVDC overhead lines. Periodic measurements will be carried out
on insulators along the SACOI link, representative of the different environments (Tuscany and Sardinia) that
the HVDC overhead line crosses. In order to characterize the strength of insulation subjected to DC voltage, it
is important to test different insulators solutions (naked glass cap&pin and RTV coated glass cap&pin) with
possibly different creep lengths, monitoring the value of the leakage current. To this aim, installations of
these insulators on the existing HVDC SACOI will be carried out.
In order to perform the work, a system named ILCMS (Insulator Leakage Current Monitoring System), set up
by RSE for monitoring leakage currents on insulators of overhead transmission lines, will be used. The system
detects leakage currents (characterized in terms of peak value, accumulated charge, etc.) and correlates
them with the environmental parameters recorded by a weather station, an integral part of the system.
Another tool developed by RSE, at prototype stage, that will be adopted in the measurements is AMICO
(Artificially Moistened Insulator for Cleaning Organization), aimed to measure the pollution level of the
environment.
In parallel with field installations, laboratory tests need to be carried out in order to characterize the possible
solutions for insulators. The tests will include a characterization of the insulators with reference to both
types of insulator pollutions considered by IEC 61815. “Type A” pollution (where solid pollution with a non-

D2.1 - Data set, KPIs, tools & methodologies for impact assessment
Page 40 of 142
soluble component is deposited onto the insulator surface) will be characterized by ESDD/NSDD
measurements. In order to carry out these tests on a Hydrophobicity Transfer Mechanism (HTM)14 insulator a
new test procedure will be used. This procedure, reported in the CIGRE brochure 555, has been proposed in
order to test the pollution performance by “solid layer” methodology also on HTM insulators. “Type B”
pollution (where liquid electrolytes are deposited on the insulator with very little or no non-soluble
components) will be characterised by leakage current measurements. In addition, accelerated ageing tests
on polymer insulator solutions will be considered. Also these types of tests (multi stress, tracking & erosion)
are not yet standardized for DC insulators, but precious information can be gathered with these types of
tests (at least in terms of comparative results on different tested solutions).
-Fault location
The fault detection on very long HVDC cables is usually a problem not easy to approach. Fault location of
cable faults consists of two stages:
1. Pre-location, performed with an accuracy of about 1% of the length of the cable
2. Detailed location (“pinpointing”), performed with a higher accuracy
Different equipment is used for the two stages. In demo 3 we address issues of the pre-location stage.
Especially on HVDC bipolar systems when a fault occurs in one cable, there are circumstances in which the
analysis cannot be performed without the shutdown of the system: it’s the case of bipolar systems equipped
with earth/sea return and unidirectional electrodes. However, in this condition the operation of the healthy
cable with the converter of the other pole could be necessary. In such a case in one DC hall it will not be
possible to assess the fault location since the nearby energized busbar can induce interferences that can alter
the measurements necessary for the fault detection; consequently the shutdown of the HVDC systems
becomes an obliged step in order to prevent also risks for the operators. Induced voltage or current can also
be harmful to connected fault location equipment.
To summarise, critical factors in the pre-location are, besides the connection of the fault location machine to
the faulted cable:
1. Measurement accuracy, which may be affected by static interference
2. Operator safety during the measurement with the nearby healthy pole energised.
The demo will focus on these items by making some inference starting from numerical models which are able
to implement interference induced by an energized busbar to the fault locator machine. Such simulation will
take into account the typical layout of DC halls in HVDC systems. So far there is no evidence whether static
interference affects the measurement. Moreover, studies will also identify if there may be risks for the
personnel in presence of a nearby energised DC busbar.
14 HTM is a mechanism in which groups of low molecular weight migrate from the bulk to the surface until the concentration of these molecules in the bulk and in the pollution layer is equal, thus making the hydrophobic also the pollutants on the insulator. More details are reported in D5.2.

D2.1 - Data set, KPIs, tools & methodologies for impact assessment
Page 41 of 142
-System studies
The higher power rating of the HVDC link, envisaged within the rehabilitation project, may deeply impact
power system operation especially as another large HVDC link connects the same power systems15.
Moreover, the flexibility offered by the advanced functionalities of the VSC converter in providing system
services needs to be investigated, in order to identify new operational solutions to guarantee system
security. This is the scope of system studies that will be performed in the demo. The studies will address
static and dynamic topics including
• Optimal operation between Sardinia, Corsica and mainland Italy by means of coordinated control of SACOI3 and SAPEI.
• Impact on the stability of the Sardinian and Corse system due to the operation of two large HVDC links (i.e. SACOI3 and SAPEI), and design of possible special controls of SACOI3 and/or special protection schemes aiming to ensure stability following contingency events. Complementary analyses will address stability of mainland Italy.
• Analysis of requirements and of the effects of VSC Fault Ride Through (FRT) control strategies on the stability of the Sardinian system
• Design and simulation of VSC black start controls and restoration solutions using SACOI as black start resource
• Evaluation of the renewable penetration increase, in the Sardinian system, made possible by the rehabilitated SACOI, considering security constraints.
Coordination with Toshiba is foreseen as far as converter control design issues are involved, such as fault ride
through and black start capability.
2.3.2. Demonstration Objectives, expected impacts and barriers to be overcome
-Objectives
The objective of the demonstration is to design, develop and test new technological solutions at prototype
level, to be integrated in advanced HVDC designs.
As far as HVDC converters are concerned, focus will be on a novel converter topology and control capable of
achieving a robust, reliable Multi-Modular Converter (MMC) VSC configuration and capable of meeting the
requirements of DC fault management and reactive power control with no or limited loss of service of the
link. The converter will exhibit low power reversal time and meet harmonic emission requirements. The
usability of the new control of the converter will be evaluated.
Key rating parameters of the prototype, in particular the nominal current, will be designed real-scale,
therefore important results of the demo will directly apply to full-scale installations. Important features also
regard the smaller footprint and small leakage flux, which leads to low-level induction currents in the metallic
15 In the case of the demo, the SAPEI HVDC link (2x500 MW) would connect Sardinia to mainland Italy, in parallel with the rehabilitated SACOI. Similar considerations may apply to

D2.1 - Data set, KPIs, tools & methodologies for impact assessment
Page 42 of 142
structures around the VSC converter. These aspects may be useful not only in land installations, but even
more in offshore platform applications. Moreover, higher reliability is expected thanks to innovative circuit
arrangement.
As far as the DC Circuit Breaker (DCCB) is concerned, a medium voltage demonstrator does not completely
ensure a replicability / realization of the high voltage DC circuit breaker for actual HVDC applications. Hence
DCCB is not included in this demonstration, but is only simulated during the R&D phase. Realisation of DCCB
for HVDC application is now under investigation in another project by Toshiba16.
As far as submarine cables are concerned, the demo will develop and validate new extruded cable concepts
for increased depth and higher voltage. The objective is to carry out mechanical prequalification according to
CIGRE Electra n. 171 clauses 2.2 and 2.3.
Voltage level of land cables will also be risen accordingly, and duly tested.
Both cable types will be prequalified according to CIGRE TB 496 "Recommendations for Testing DC Extruded
Cable Systems for Power Transmission at a Rated Voltage up to 500 kV" (which replaced TB 219). Testing the
two circuits, possibly connected together in a joint test length, will include the cable and all relevant
accessories. Additionally, and relevantly for the submarine length, a mechanical prequalification procedure
according to CIGRE Electra n. 171 will be carried out. Finally, and again for the submarine length, external
water pressure withstand test will be carried out on a cable sample (visual examination). Goal of the
Demonstration will be the attainment of a 350 kV voltage and, for the submarine span, the preconditioning
for a laying depth of 400 m. Optionally, a further step up of the operational voltage to 400 kV will be also
attempted.
Regarding overhead lines for HVDC transmission, solutions of High Temperature Low Sag (HTLS) conductors
will be provided. So far, to our knowledge, HTLS technology has been developed for AC lines only. The demo
has the objective to make HTLS conductors available, suitable for HVDC, hence assuring all the advantages of
this kind of technology. This means higher ampacity, reduced losses, reduced right-of-way for the lines on
existing routes where new infrastructure cannot be built. In order to increase ampacity with conventional
HTLS conductors, the following drawbacks are encountered:
• Diameter decreases
• Conductive section decreases
• Higher resistance
These drawbacks are not so critical on AC HTLS conductors because AC lines are usually short and the corona
effect at the voltage levels of HTLS lines is not high. DC lines are generally longer than AC lines and the losses
are a major aspect in their design and operation. The new conductor will be characterized by new material
which overcomes the above problems. The main objective is to develop an innovative conductor with a
higher conductive section with respect to the conventional solutions (ACSR, 30-35mm diameter), which will
16 It is worth mentioning that a demo on DCCB has already been addressed within the TWENTIES project, cf. W. Grieshaber, D.-L. Penache, “Test results
of DC Breaker Demonstrator”, Addendum to Deliverable D11.3, April 2014, and J.-B. Curis et al., “Testing results from DC network mock-up and DC breaker prototype”, Deliverable D11.3, September 2013, http://www.twenties-project.eu/

D2.1 - Data set, KPIs, tools & methodologies for impact assessment
Page 43 of 142
permit to increase the ampacity and reduce the losses (compared to conventional conductors at the same
ampacity).
The demo will address insulators of DC overhead lines as well. In this regard, the objective is to characterize
electric and mechanical properties of HVDC overhead lines insulators, also by means of new measurement
systems. In addition, results on ageing of polymer insulator solutions will be obtained, which may help to
define solutions that are more resistant to pollution.
The demo will also address techniques for speed up the fault location operations in DC cables. As mentioned
above, when a fault occurs in one cable of HVDC bipolar systems, there are circumstances in which the fault
detection cannot be performed without the shutdown of the system: this is the case of bipolar systems
equipped with earth/sea return and unidirectional electrodes. In fact, under such conditions, it could be
necessary to shut down the operation of the healthy cable with the converter of the other pole through the
“by-pass” pole scheme. Actually in one DC hall/yard near the faulted cable termination, the bypass high
voltage bus bar would be energized hindering the standard fault location procedures: this leads to risks 1) for
the maintenance crew during the connection of the fault locator to the cable termination, 2) for the fault
locator due to electrostatic couplings and 3) for the measurement altered by electrostatic coupling. Today
there are no bipolar HVDC interties in the world able to perform the cable fault location with a nearby DC
energized bus bar (during monopole operation), forcing in this way the shutdown of the system. The
objective of this activity is to perform research to understand the peculiarities which a fault locator must
have, in order to cope with the problems listed above. This will help in particular the HVDC system utilities in
the specification of cable fault locators and cable fault locator manufacturers in the development of
advanced fault locator systems.
The objective of the power system studies is to evaluate the impact, at system level, of the rehabilitated
HVDC system, and to identify requirements needed to guarantee stable and secure operation. In fact, the
higher rating of the rehabilitated link may imply more severe perturbations, hence higher risk for stability; on
the other hand, enhanced control opportunities associated to VSCs (compared to the LCC technology of the
existing link) can be exploited to support stability and offer new services (such as reactive control, fault ride
through, black start).
In this respect, power system studies provide a necessary complement to the field demo, in terms of analysis
of the security problems, input to the design of control systems for system stability (regarding VSC and
possibly system protection schemes), and development of functions to support operational security in the
complex Sardinia-Corsica-mainland Italy system. Planned activities have been mentioned in the previous
section.
-Impacts
Overview
The demo is expected to provide significant advances in a wide range of technical issues associated to HVDC
transmission, both rehabilitation projects and new projects. For example, peculiar contributions regard the
problems related to HVDC based on overhead lines, as far as transient faults robustness, strength of
insulation under polluted environments and HTLS requirements are concerned. On the other hand, progress
in cable technologies (in terms of voltage levels and installation depth) is particularly needed as more and
more HVDC projects (typically using cables) are proposed. Innovative HTLS solutions are particularly

D2.1 - Data set, KPIs, tools & methodologies for impact assessment
Page 44 of 142
interesting for repowering of existing lines under right-of-way constraints; moreover the DC application is an
innovation in itself.
Overall, benefits will allow manufacturers to offer better and more performing solutions, and they will
become more competitive on worldwide markets. A series of advantages will also result to TSOs and end
users of electricity. A higher transmission capacity implies allowing more efficient generation (also far away
from consumption sites) with environmental and economic benefits; moreover, greater flexibility allowed by
advanced VSC controls means enhanced operational security and higher penetration of renewables.
Impact on transmission system planning
Availability of higher performance technologies will obviously impact on transmission planning. Some
projects may not only be designed at higher rate, but also just become feasible (recall for instance the
increased depth of installation of submarine cables).
Impact on HVDC VSC converters
The demo will show the advantages of the proposed innovative converter scheme, without air core leg
reactors. This will lead to costs and space savings in converter building.
Once the Demo will be developed, future manufactured industrial converters could be implemented by
merely expanding and extending the Demo VSC system, i.e. by simply increasing the number of series
connected converter units, in a flexible and modular way.
The benefits envisaged by the new converter concept are of particular interest not only for the future SACOI
rehabilitation project (where the converter station is onshore), but also for offshore installations, where
reduced footprint and higher reliability are of utmost importance.
Impact on HVDC Cables
The realization of breakthrough land and submarine power transmission cable systems as the ones here
described, based on Extruded Insulation material, will allow for the realization of a valid alternative to Mass
Impregnated (MI) technology (e.g. where weight plays a significant role), thus allowing the realisation of a
more efficient network planning.
The availability of high power HVDC extruded transmission technology will offer a new possibility for long distance transmission, including connection of renewables. The voltage/capacity performance levels of MI technology are not yet reached by extruded insulation cables, therefore the current development will allow for a step forward to comparable transmission and installation capability.
Impacts on conductors
Generally, it’s quite difficult to build a new line. The only solution for repowering a line keeping the same
rights-of-way is to substitute a conventional conductor with an HTLS.
The demo will show the possibility to develop an innovative conductor which is suitable for HVDC line,
designing a solution which guarantees higher ampacity and reduced losses.
Another focus point is the overloading capability. This feature is interesting, especially when a transmission
line is built by connecting in series overhead conductors and cables. In fact cables typically exhibit
overloading capabilities, higher than overhead lines i.e. the latter become the limiting factor in the overall

D2.1 - Data set, KPIs, tools & methodologies for impact assessment
Page 45 of 142
line overloading capability. The overhead line should be able to withstand the same level of temporary
overloads.
Impact on wind farm connection
Though this topic is not explicitly addressed in the demo, the proposed converter design could be of great
interest for wind farm connection, especially as regards offshore conversion station. As mentioned above,
the reduced spaces of the proposed converter, without air-core leg reactances, could introduce significant
space and cost savings. Furthermore the asymmetrical configuration allows for increased reliability of the
link.
-Barriers
Most of the barriers are technological and have to be overcome in order to implement demo 3 results using
beyond state-of-the-art components. Major barriers are:
Converter
Major technical barriers envisaged for the converter are the following:
• Development of the control system for the proposed HVDC converter.
• Design of the large scale prototype of converter, in multilevel asymmetrical VSC configuration.
• Development of the innovative converter transformer.
Cables
XLPE insulation material needs to be characterized in terms of space charges accumulation and of its electrical conductivity. Such measurements are extremely delicate and difficult and call for a dedicated development and experimental set-ups. The measurement of the dependence of conductivity upon temperature is of fundamental importance for HVDC cables. Unfortunately such measurements are extremely difficult because of the very low currents that need to be measured.
Thermal breakdown may become the mechanism that limits the voltage of a given HVDC cable. In this breakdown mechanism the electrical power density into a region of the insulation (i.e. the product of the field and current density) is such that either the temperature increases above that which the insulation material can sustain without damage or that the electrical power into this region exceeds the rate at which it can be thermally conducted and the temperature increases steeply. Techniques to properly evacuate the by-products affecting the material conductivity have been developed; nevertheless research has to be carried out, for each new material, or combination of materials within the cables and accessories, to determine the optimal degassing process, its robustness and to verify that the by-product levels are suitable for all future operations during the cable lifespan.
In the case of submarine cables and their accessories there is the further challenge of the installation
requirements typical of such installations. During laying operation the full hung span of cable has to be
maintained under centenary tension from the laying vessel.
D2.1 - Data set, KPIs, tools & methodologies for impact assessment
Page 46 of 142
The cable design shall therefore guarantee that an acceptable level of mechanical strain is reached. While
the solution could seem straightforward the reality is trickier: the cable axial and flexural rigidity could be
improved by applying appropriate layers of armouring, those additional layers, nevertheless, will increase the
overall cable weight thus increasing the laying forces. At the same time, handling of heavier and stiffer cables
is much more difficult, and potentially dangerous, it is therefore necessary to apply a dedicated development
to any particular application, and dedicated testing and verification procedures are required.
Important barriers will be:
• The development of cables and accessories where the space charges accumulation will not unfavourably affect the electrical gradient in order to obtain the expected lifespan of the power transmission links of 30 years.
• The development of accessories and cable lengths capable of installation at water depths way beyond the current attainable depths
Conductors
The HTLS conductor is a new experience in DC lines. As per our knowledge, HTLS conductors are used only in
AC lines.
The main barrier is due to the use of composite material. Their limit is linked to the temperature. Composite
materials are already studied in other applications at ambient and moderate temperature and they don’t
show specific problems. These materials need an accurate study about the behaviour at high continuative
temperature. In case of inadequate performances, new matrix solutions should be studied and developed.
As far as deployment is concerned, a potential barrier to overcome regards the cost, which should be
comparable with that of other solutions. One of the demo objectives is indeed finding a cost-effective
solution. As can be understood from analysing the current needs, TSOs would then be very interested in
applying this technology.
Insulators
The adoption of RTV pre-coated typology cap&pin glass insulators (for DC voltage) will increase the
withstand capability and the reliability of the line under polluted conditions. As far as DC lines are concerned
only experimental installations are currently carried out.
The activity of the Demo will characterize the behaviour of different type RVT pre-coated solutions (with
total and partial coatings), and the actual laboratory and field performance will be evaluated together with
the relevant types and rate of degradation of the polymer coatings (and characteristics), in order to assess
also the possible useful life of the solutions adopted.
Fault location
Numerical simulations in order to take into account possible induced voltage on the fault location systems by
a nearby energized busbar is not an easy task since such numerical model shall take into account the

D2.1 - Data set, KPIs, tools & methodologies for impact assessment
Page 47 of 142
electromagnetic environment of a DC hall with all the equipment installed. Without field measurement the
model will not have a validation and consequently the results could be less accurate.
2.3.3. Demo 3 KPI’s
KPI
number KPI name Description
Description of how it is
measured Target value Units
1 Full Load
Converter Losses
This KPI accounts for conversion
losses (converter bridge) in the
innovative VSC converter.
Losses will be calculated as
described in EN 62751-1/2
standards.
Calorimetric method (using
cooling water) will be used to
validate the results on the
demo.
1% (converter
bridge only)
1.5% of the whole
system17
%
2 Power reversal
time
This KPI accounts for the power
reversal time of the proposed
converter.
A step change in the required
active power signal, from -1
p.u. to 1 p.u., is sent to the
converter control. The power
reversal time is defined as the
delay between the step change
in the control signal and the
stabilization of the converter
power (ac side) inside a ±10%
boundary around the new
value.
0.2 s
3 Converter Current
THD
This KPI accounts for the THD of
AC/DC converter, at full load
The current THD at full load will
be measured as described in EN
61000-4-30 and EN 61000-4-7
In line with IEEE
519 (18)
Dimensio
nless (%)
4
HTLS conductor DC
resistance
reduction
This KPI accounts for the DC
resistance reduction of the
innovative HTLS conductor, with
respect to typical ACSR conductors
evaluated at the nominal ACSR
ampacity19
This KPI is evaluated as:
(innovative HTLS DC resistance
– ACSR DC resistance)/ ACSR DC
resistance
-10% Dimensio
nless (%)
5 HTLS conductor
ampacity
This KPI accounts for the ampacity
increase of the innovative HTLS
conductor with respect to typical
ACSR solution (see footnote (19)
above)
This KPI is evaluated as:
(innovative HTLS DC ampacity –
ACSR conductor ampacity )/
ACSR conductor ampacity
50% Dimensio
nless (%)
6
Land and
submarine cable
test cycles
This KPI accounts for the
completion of Pre-Qualification
(PQ) test cycles on the cables.
PQ test of HVDC extruded cable
systems is based on a sequence
of 360 “24 hours” load cycles,
as indicated in CIGRE TB 496
Level 1: 360
thermal cycles
prior to impulse
tests
days
17 The values refer to a converter system only.
18 Considering that the VSC converter is regarded as a voltage source seen from the AC coupling point and the network impedance is unknown (because demo site is not yet determined), the current distortion level is hardly predictable. Anyway harmonic current flowing into the AC network needs to be within the acceptable range of the network. The THD target value will be defined once the site and consequently the node of the network where the demonstrator will be installed will be identified.
19 i.e. in the diameter range of 30-35 mm, installed according to international recommendations on tensile load, with nominal ACSR ampacity calculated at 75°C.
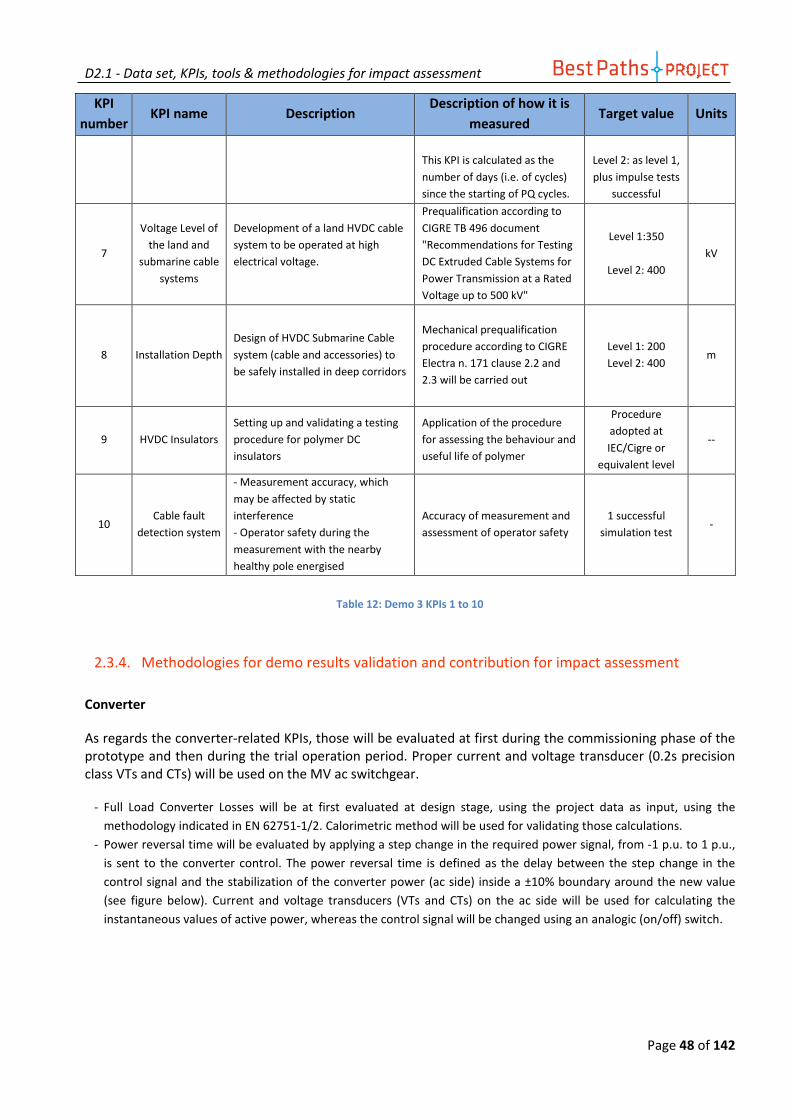
D2.1 - Data set, KPIs, tools & methodologies for impact assessment
Page 48 of 142
KPI
number KPI name Description
Description of how it is
measured Target value Units
This KPI is calculated as the
number of days (i.e. of cycles)
since the starting of PQ cycles.
Level 2: as level 1,
plus impulse tests
successful
7
Voltage Level of
the land and
submarine cable
systems
Development of a land HVDC cable
system to be operated at high
electrical voltage.
Prequalification according to
CIGRE TB 496 document
"Recommendations for Testing
DC Extruded Cable Systems for
Power Transmission at a Rated
Voltage up to 500 kV"
Level 1:350
Level 2: 400
kV
8 Installation Depth
Design of HVDC Submarine Cable
system (cable and accessories) to
be safely installed in deep corridors
Mechanical prequalification
procedure according to CIGRE
Electra n. 171 clause 2.2 and
2.3 will be carried out
Level 1: 200
Level 2: 400 m
9 HVDC Insulators
Setting up and validating a testing
procedure for polymer DC
insulators
Application of the procedure
for assessing the behaviour and
useful life of polymer
Procedure
adopted at
IEC/Cigre or
equivalent level
--
10 Cable fault
detection system
- Measurement accuracy, which
may be affected by static
interference
- Operator safety during the
measurement with the nearby
healthy pole energised
Accuracy of measurement and
assessment of operator safety
1 successful
simulation test -
Table 12: Demo 3 KPIs 1 to 10
2.3.4. Methodologies for demo results validation and contribution for impact assessment
Converter
As regards the converter-related KPIs, those will be evaluated at first during the commissioning phase of the prototype and then during the trial operation period. Proper current and voltage transducer (0.2s precision class VTs and CTs) will be used on the MV ac switchgear.
- Full Load Converter Losses will be at first evaluated at design stage, using the project data as input, using the
methodology indicated in EN 62751-1/2. Calorimetric method will be used for validating those calculations.
- Power reversal time will be evaluated by applying a step change in the required power signal, from -1 p.u. to 1 p.u.,
is sent to the converter control. The power reversal time is defined as the delay between the step change in the
control signal and the stabilization of the converter power (ac side) inside a ±10% boundary around the new value
(see figure below). Current and voltage transducers (VTs and CTs) on the ac side will be used for calculating the
instantaneous values of active power, whereas the control signal will be changed using an analogic (on/off) switch.

D2.1 - Data set, KPIs, tools & methodologies for impact assessment
Page 49 of 142
Power reversal
time
-1 p.u.
1 p.u.
Active power
output ±10%
Signal change time
Figure 21: Definition of Power reversal time
- Converter Current THD will be measured according to EN 61000-4-30 and EN 61000-4-7 during periods of
at least one week.
Cables
- Land and submarine cable test cycles will be performed according to pre-qualification (PQ) procedure
described in CIGRE TB 496, which foresees a sequence of 360 “24 hours” load cycles, followed by impulse
testing. The load cycles are performed according to CIGRE TB 496.
Conductors
- HTLS conductor DC resistance will be measured at conductor manufacturer facility, using for instance the
bridge method.
- HTLS conductor ampacity will be measured according to CIGRE TB 207 or other harmonized standards,
depending on which conductor materials will be chosen.
- As far as tests on HTLS conductors are concerned, it must be recalled that specific tests will be defined as
part of the work, considering the technology chosen and the characteristic of the line. In fact no
international technical standards on procedures and tests exist on this topic (especially for composite
core material conductors). Tests will be made partly based on current HTLS testing procedures (devoted
to AC conductors), partly on new procedures defined ad hoc. In this regard, it is worth mentioning that De
Angeli and TERNA are represented at the IEC Project Team 62818 of IEC TC7 with the scope to develop a
D2.1 - Data set, KPIs, tools & methodologies for impact assessment
Page 50 of 142
standard relevant composite core for high temperature conductors. Still within TC 7, during the last
meeting, a new Work Proposal has been approved for the development of a new standard on composite
core conductors. Within committees IEC TC 11 and TC 7, a JWG is going to be constituted with the aim to
revise actual IEC 61284 on fittings and include tests for high temperature conductors.
Insulation
As far as tests for polymer insulators for DC lines are concerned, it must be underlined that no international
technical standard does exist at the moment; hence a fundamental part of the activity in this regard will be
the setting up of a test procedure for the characterization of these components both in terms of laboratory
and field tests.
As regards laboratory tests (on new and from field insulators), reference will be made to recent CIGRE
Technical Brochures 55520 and 48121 and to international standards for ceramic insulator, if applicable.
Participation to the on-going works of CIGRE WG D1.44 (“Testing of naturally polluted insulators”) will also
contribute to the setting up of the above mentioned procedure. The tests will characterize the behaviour of
selected polymer insulators as regards voltage withstand and tracking & erosion performance under surface
pollution conditions.
As regards field measurements, ad hoc systems monitoring for measuring leakage currents on line and probe
insulators will be used22; site severity pollution will also be characterized by ESDD and NSDD23 measurements
according to IEC 60815-124.
Fault location
The duration and accuracy of fault location could be evaluated based only on past experience. Unfortunately
there's no way to address standard procedure since each HVDC link has its own peculiarity.
20 “Artificial Pollution test for polymer Insulators”, CIGRE Technical Brochure 555, WG C4.303, Oct. 2013.
21 Guide for the Assessment of Composite Insulators in the Laboratory after their Removal from Service”, CIGRE Technical Brochure 481, WG B2.21, Dec. 2011.
22 ILCMS – “Insulator leakage monitoring System” and AMICO “Artificially Moistened Insulator for Cleaning Organization”, developed by RSE.
23 ESDD – “Equivalent Salt Deposit Density”, NSDD – “Non Soluble Deposit Density”
24 IEC 60815-1, Edition 1.0 2008-10, “Selection and dimensioning of high-voltage insulators intended for use in polluted conditions – Part 1: Definitions, information and general principles”

D2.1 - Data set, KPIs, tools & methodologies for impact assessment
Page 51 of 142
2.4. Demo 4: Innovative repowering of corridors
2.4.1. Demonstration description
The overall goal of Demo 4 is to demonstrate the role and impacts of several innovative system approaches
for the repowering of existing AC overhead lines. Repowering of existing lines is a way to combine ageing
constraints with capacity increase objectives in view of developing innovative repowering processes of
corridors, while maintaining their cost efficient and secure operations over a wide range of system
conditions.
Three complementary routes are examined from a system perspective, meaning the total cost of ownership
of solutions to increase the capacity of existing corridors, which therefore includes all the cost incurred to
reach this capacity increase. It involves the background experience gained by several TSOs from all over
Europe to address the following issues:
• Repowering of existing overhead lines using high-temperature low-sag (HTLS) conductors or insulated cross-arms,
• Innovative overhead line (OHL) designs and retrofit processes to maximize existing line availability,
• Improved line operation.
The first task regards HTLS and insulated cross-arms. 6-8 different HTLS technologies and the respective
accessories will be selected. The selection process is planned to be carried out on the basis of previously
defined use cases for HTLS conductors specifying first assumptions on suitability of commercially available
HTLS technologies. The partners will carry out mechanical, thermal and electric tests addressing long-term
behavior of the conductors under static, thermal and fatigue loading and will conduct electrical tests of
conductors, contacts and joints with regard to long-term behavior and ageing mechanisms. They will analyze
and update existing simulation models with data for HTLS using Finite-element-method (FEM) modelling. The
whole HTLS system (conductors, accessories, insulators, pylons) is to be evaluated; only mature technologies
(i.e. HTLS available on the market) will be considered, the classification will be technology-based, not
manufacturer-based. The relevance of cost-effectiveness of HTLS systems (incl. costs for mounting) is also to
be considered. Insulated cross-arms research is based on the general considerations and decision: with
insulated cross-arms, pylons can be built in a compact form minimizing corridor widths.
The demonstration scope of HTLS and insulated cross-arms is planned to take place at the Stevin project of
Elia. The main tasks will be to build an overhead line using HTLS and insulated cross-arms on different
sections, to contribute experiences gained at already installed HTLS conductors, to contribute and participate
with experience regarding installation of HTLS and to contribute with knowledge gained during research of
HTLS and insulated cross-arms.
The second issue that is addressed is to demonstrate and develop innovative OHL designs and retrofit
processes including live line working (LLW). New concepts and methods for repowering existing AC overhead
lines, e.g. rock foundations without concrete, 420kV composite towers and tower concepts, will be
demonstrated.

D2.1 - Data set, KPIs, tools & methodologies for impact assessment
Page 52 of 142
One of Statnett’s goals is to develop a composite suspension tower that is significantly lighter than the
current standard Statnett 420 kV tower (11-12 tonn). The project has planned to perform
engineering/design, evaluate a manufacturing technique, and study weaknesses of material when it comes
to transport/handling/installation and ageing, and weaknesses when it comes to electrical flashover and
fields. Expected lifetime, maintenance friendliness as well as the efficiency of the construction process it can
provide, will also be investigated.
For mounting of air warning markers the main activity is to inventory and evaluate methods that can
minimize the outage period of the OH lines when mounting air warning markers and comply with the
Norwegian safety regime. Some methods are already identified, but the goal is to develop additional
methods, each customized to different frame conditions. The main activity will be divided into different
subtasks including developing methods, testing, and evaluating methods. If the methods are acceptable
there is a need to get the required approvals and certificates for use before demonstration is possible.
The activities for the two parts; Rock foundations without concrete and Smarter mounting of insulators, will
be specified in autumn 2015.
The main aspects of the research with regard to LLW are to take into account the constraints of electric and
magnetic fields, conductor car motion through the insulators and insulator string replacement of glass and
composite insulators both in a reduced phase-to-phase spacing and conductor configuration, and extension
of the above processes to all phases of a double circuit power line. Initially, the LLW methods will be
demonstrated in a laboratory and later on-site. Aspects that are part of the demonstration:
• Selection of tools against high electric and magnetic fields
• Phase conductor repairs
• Work on the phase conductors (distance between the phase conductors and the ground has decreased)
• Replacement and repair of insulator sets
• Repair of damages on hard-to-reach areas and
• Work on the upper phase conductors on double-circuit power lines (where the phase conductors are in a vertical position), also replacing and maintaining the earth conductors and optical fibers
The third issue is improved line operation with a focus on dynamic line rating (DLR). The research with regard
to DLR is subdivided into the following aspects: development of a new type of DLR implementation, increase
of efficiency of existing conductors, and implementation of the conductor monitoring with a new sensor and
software development. The DLR demonstration will include the examination of power lines, the preparation
and installation of sensors and the software integration.

D2.1 - Data set, KPIs, tools & methodologies for impact assessment
Page 53 of 142
2.4.2. Demonstration Objectives, expected impacts and barriers to be overcome
-Demo objectives:
The objectives of Demo 4 are firstly to research, analyze and model existing high-temperature low-sag (HTLS)
conductors with a focus on ageing behaviour including temperature, electrical and mechanical effects and
determine the benefits of insulated cross-arms. Secondly, the objectives are to validate all potentials for
innovative design and field working processes including retrofit process and live line working, and thirdly, to
develop a prototype dynamic line rating (DLR) system based on low cost sensors which would allow higher
temperature operations of current line technologies.
The main goals of the HTLS and cross-arms research and demonstration are to identify and evaluate existing
HTLS technologies, to analyze physical line parameters (mechanical, electrical, thermal) relevant for long-
term fatigue and creep modelling, to identify predominant ageing mechanisms as a function of working
parameters (temperature, load profiles, etc.) and to implement improvement options of existing overhead
line models (ampacity and sag modelling). Research will focus on tests for long-term behaviour, and tests for
operation under real conditions. Experience values with regard to ageing will be included. A FEM model in
PLS-CADD of a representative OHTL section with towers and HTLS conductors is to be created. The main
purpose of the simulation is to determine the conductor sag of HTLS conductors and the loads on towers.
Insulated cross-arms research will include water-induced corona tests, pollution tests and tracking & erosion
tests will be conducted. The water-induced corona state-of-the-art test method comprises two dimensioning
criteria for design of corona/grading rings for composite insulators based on E-field calculations: the first
criterion is a limited E-field for metallic hardware, the second is a limited E-field for composite insulator
surface. There is a standard RIV test (IEC 60437) for metallic hardware under dry conditions for verification of
E-field calculations but there is no test for composite insulator surfaces. Further, some deterioration due to
water drop corona was observed in service in a relatively clean environment. The water-induced corona test
method that will be researched will be in accordance with IEC requirements. The second test to be
conducted is a tracking and erosion test on the insulated cross-arms with a duration of 5,000h.
For the innovative OHL designs and retrofit processes the objective of all activities is to obtain a safer
construction process, to decrease construction time, and to obtain overall lower costs. The composite tower
may bring a new construction process approach to make the construction processes more efficient to
maximize existing line availability. Identifying a set of methods for mounting of air warning markers may
bring a new approach that helps to make repowering existing corridors more efficient. Moreover, the
methods will possibly allow for line availability to be maximized and potentially innovative design and field
working processes including retrofit process and live line working.
The main goals of the life line working (LLW) research and demonstration are to take into account the
constraints of electric and magnetic fields, conductor car motion through the insulators and insulator string
replacement of glass and composite insulators both in a reduced phase-to-phase spacing and conductor
configuration, and extension of the above processes to all phases of a double-circuit power line. The main
goals of the DLR are the development of a new type of DLR implementation, the increase of efficiency of

D2.1 - Data set, KPIs, tools & methodologies for impact assessment
Page 54 of 142
existing conductors, and the implementation of the conductor monitoring with a new sensor and software
development.
-Demonstration expected impact:
The results of these separate pilots will be packaged into a self-standing line re-powering package which will
help TSOs delivering overhead lines that are more
• compact and therefore more acceptable on visual standpoints and less demanding in right-of-way,
• robust to face fluctuating power profiles,
• flexible in exploitation (reducing the need for new AC overhead line corridors) and
• affordable to run (acceptable CAPEX and OPEX figures including maintenance).
The combination of the solutions enhances the existing system approach to AC overhead line repowering: it
assists TSOs and utilities to keep overhead lines reliable and resilient under the light of the developments in
the European energy system and aims at replication by other ENTSO-E members.
One of the impacts of HTLS conductors and insulated cross-arm research and demonstration is that they
potentially facilitate new system operation options, repowering existing lines and innovative solutions to
meet the needs of the future European grid. Therefore, a selection of conductors (see above) will be
analyzed in detail regarding operability and reliability including ageing behaviour in order to gain experience
on long-term usage of HTLS conductors. Close to the research activities on new conductors, insulated cross-
arms for innovative overhead lines will be analyzed. Upgrading an existing AC line with new conductors might
have a lower economic impact than building new lines and could provide a suitable solution to provide
medium-term alternatives to grid extension (i.e. new overhead line corridors).
The goal of innovative design and field working processes to replace overhead lines is to increase safety and
decrease costs and building time, with minimum impacts on the line’s availability. Therefore, new field
processes and tower designs must be studied and demonstrated using for instance live line maintenance
techniques.
The main impact of the dynamic line rating is the increase in capacity of an existing line with comparably low
investments. Based on the monitoring of relevant parameters such as the conductor position above ground
in real time at the current instant, the permissible thermal limits are calculated in order to allow a safe
increase of the power flow along the line. The economic impact is that new sensors reduce the total cost of
ownership for RTR (Real-Time Rating) solutions. A technical impact is that software upgrades could allow to
deliver data to system operators for decision making (capacity forecast method). With regard to grid
management and operation, the implementing of novel algorithms in the dispatch centers to increase the
operational temperature of conductors might have a big impact.
D2.1 - Data set, KPIs, tools & methodologies for impact assessment
Page 55 of 142
-Demonstration barriers to overcome:
The main barriers that have been identified up to now for Demo 4 are:
-Technical barriers:
• HTLS and cross-arms:
o Even though already tested at some sites in Europe, there is little long-lasting experience with
new conductor technologies among European TSOs for repowering existing overhead
transmission lines. The up-to-date expertise on HTLS conductor technologies as well as insulated
cross-arms in Europe is still limited to some specific types and widespread information on overall
reliability and applicability is not sufficiently available. Some TSOs, research centers and producers
have conducted testing and research activities. However, there is still the need of TSOs in the Best
Paths project to gain knowledge on the operability, ageing and reliability of such HTLS conductors
in real service conditions in European grids. Likewise, a general overview on existing solutions as
well as the verification of some mechanical and electrical parameters needs more analysis. A
number of pilot sites have also deployed insulating cross-arms in the recent past. However, some
research issues are still open and there is a lack of experience about the aging of this technology
and its reliability over time. For cross-arms, the main problem is the accessibility to the
conductors that requires the development of new work benches, the reduction of new working
procedures and the training of staff.
• Innovative design and field working processes:
o Changes to overhead line design might have technical and quality impacts which cannot be
determined during the project duration, but only after a number of years in service. However, a
thorough technology qualification process is needed for any changes that might impact livetime
and safety.
o Composite Towers for 420 kV level:
� There are several challenges using carbon/glass fiber at high voltage level linked to
both mechanical and electrical complexity of the construction.
� The costs are high for both the material and production.
� Moreover, there are challenges with stiffness/deflection of the material and
uncertainties about aging traits.
� One other technical barrier is splicing of long components; bolting/ bonding
o Mounting of air warning markers:
� There are uncertainties about the strength/quality of the earthwire and it is forbidden
to load earthwire older than 10 years with a carriage. Therefore there is a need for
other alternatives to line carriage assembly.
� Since outages are difficult to obtain in the in the Norwegian Grid, it is important to
reduce, or possibly eliminate, outages.
� Statnett’s standard markers are large, heavy, and require special equipment for
assembly. Normal net assembly is 15-20 min/per marker.
� In Norway the regime for work at height is strict, limiting opportunities related to other
countries.
D2.1 - Data set, KPIs, tools & methodologies for impact assessment
Page 56 of 142
• Improved line operation:
o There are a number of R&D as well as practical implementation issues still hindering the
integration of the technology, including, for instance, interoperability issues, the need for
improvements in the ability to forecast ratings in the short-term based on weather forecasts,
communication with SCADA/EMS problems, availability and reliability of communication links, the
reliability and life-cycle costs of measurement devices, revision of standards and increased
coordination in inter-TSO operation modes, etc. New and challenges may occur during the
development of the related standards and regulations.
-Regulatory barriers:
• HTLS and cross-arms:
o Increasing the capacity of existing AC overhead lines with HTLS might be especially relevant for
existing corridors if it is difficult for the TSO to get permits for new corridors. However, whether
the exchange of standard conductors with HTLS on an existing overhead line does indeed not
require the usual long-lasting permitting processes largely depends on local, regional and national
regulations.
• Innovative design and field working processes:
o Permit process for the introduction of new technologies and methods may be time-consuming,
especially with regard to safety issues. Changes that have a visual impact need to be approved by
the licensing organization (NVE).
• Improved line operation:
o It is necessary to modify MAVIR’s internal regulations which may take a long time.
o It might be necessary to modify different national codes (eg. Operational Code, Code of
Commerce etc.)
-Operational barriers
• HTLS and cross-arms:
o Upgrading existing lines requires work slots for the installation teams, especially for lines with
high demand, this is most often difficult to realize.
o The operation of overhead lines with HTLS can provide relevant advantages only if the
surrounding assets in the system are appropriate, i.e. the increased capacity of HTLS installations
can be beneficial if the substations and neighbouring connections do have at least the same
capacity. It is therefore of utter importance to not only focus on the technical limitations of the
HTLS conductors, but on the limits of these conductors in a specific grid and use case.
• Innovative design and field working processes:
o Building high-voltage overhead lines is something that has been done since the 60's, as well as
building new lines in an existing corridor. However, planned outages are now much more difficult
to get. They have to be planned years in advance. Finally, time slots are very small and the
realization of repowering depends on very volatile renewables feed in.
• Improved line operation:
o Practical implementation issues due to a rather conservative approach of TSOs especially
regarding health and safety criteria and its variability need to be overcome. This engineering

D2.1 - Data set, KPIs, tools & methodologies for impact assessment
Page 57 of 142
acceptance could be increased if the RTTR system brings an additional value in terms of rating
forecasts (from few hours to day-ahead) based on weather predictions.
• Live-line monitoring:
o Determination of magnetic flux density during common LLM activities
o Evaluation of effects and risks of magnetic field which might be above the standard limits
o Finding a possible solution for shielding the magnetic field during LLM
o Evaluation of the applicability in practice
-Economic barriers
• HTLS and cross-arms:
o Costs for HTLS conductors may vary significantly among suppliers, therefore general conclusions
on economic feasibility are difficult to be drawn
o Upgrading existing AC overhead lines with HTLS may as well result in upgrading of pylons,
foundations and accessories, these costs are likely to diminish cost effectiveness of an upgrading
project with HTLS
o Operation of HTLS with high temperatures (within the specific limits) results in a higher
transmission capacity but also in increased transmission losses on the line. These costs have to be
included in the economic analysis of a possible application of HTLS
o The application of HTLS on existing overhead lines may often provide a medium-term solution for
a specific transmission problem. However, the usage of HTLS as a long-term solution (i.e. building
new overhead lines with HTLS) might be no feasible option for many European TSOs.
• Innovative design and field working processes:
o Unconventional materials such as composite materials may have significantly higher costs both
for procurement, installation and maintenance.
• Improved line operation:
o Too high costs of installation, operation and maintenance
-Legal barriers:
• HTLS and cross-arms: see regulatory barriers
• Innovative design and field working processes and improved line operation:
o Intellectual property rights for new methods have to be clarified at an early stage to avoid legal
conflicts
-Market structure based barriers:
• HTLS and cross-arms: none at the moment
• Innovative design and field working processes:
o Single supplier situations might cause higher cost
• Improved line operation: none at the moment

D2.1 - Data set, KPIs, tools & methodologies for impact assessment
Page 58 of 142
-Further barriers:
• HTLS and cross-arms: none at the moment
• Innovative design and field working processes:
o Public acceptance has also gained importance and now represents a major decisive factor.
• Improved line operation:
o The expert system requires a learning period (it will be self learning). Final results might be
available after a given tuning session which might be longer than the time frame of the project.
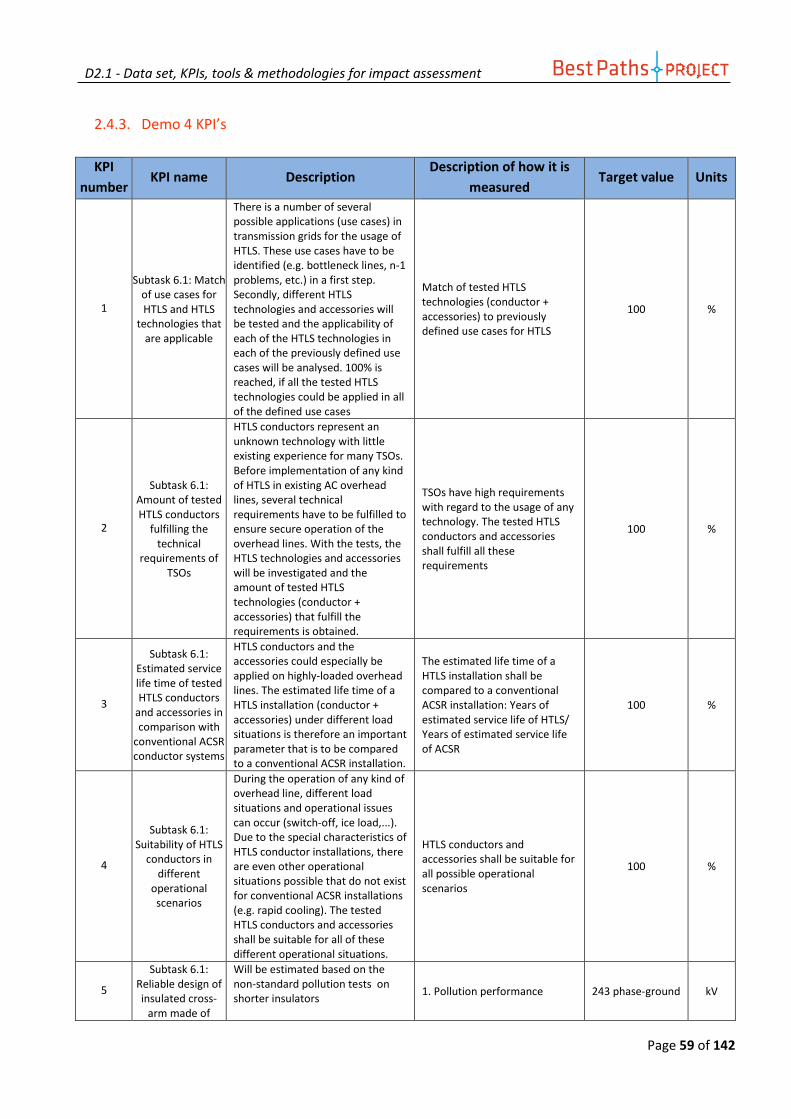
D2.1 - Data set, KPIs, tools & methodologies for impact assessment
Page 59 of 142
2.4.3. Demo 4 KPI’s
KPI
number KPI name Description
Description of how it is
measured Target value Units
1
Subtask 6.1: Match of use cases for HTLS and HTLS
technologies that are applicable
There is a number of several possible applications (use cases) in transmission grids for the usage of HTLS. These use cases have to be identified (e.g. bottleneck lines, n-1 problems, etc.) in a first step. Secondly, different HTLS technologies and accessories will be tested and the applicability of each of the HTLS technologies in each of the previously defined use cases will be analysed. 100% is reached, if all the tested HTLS technologies could be applied in all of the defined use cases
Match of tested HTLS technologies (conductor + accessories) to previously defined use cases for HTLS
100 %
2
Subtask 6.1: Amount of tested HTLS conductors
fulfilling the technical
requirements of TSOs
HTLS conductors represent an unknown technology with little existing experience for many TSOs. Before implementation of any kind of HTLS in existing AC overhead lines, several technical requirements have to be fulfilled to ensure secure operation of the overhead lines. With the tests, the HTLS technologies and accessories will be investigated and the amount of tested HTLS technologies (conductor + accessories) that fulfill the requirements is obtained.
TSOs have high requirements with regard to the usage of any technology. The tested HTLS conductors and accessories shall fulfill all these requirements
100 %
3
Subtask 6.1: Estimated service life time of tested HTLS conductors
and accessories in comparison with
conventional ACSR conductor systems
HTLS conductors and the accessories could especially be applied on highly-loaded overhead lines. The estimated life time of a HTLS installation (conductor + accessories) under different load situations is therefore an important parameter that is to be compared to a conventional ACSR installation.
The estimated life time of a HTLS installation shall be compared to a conventional ACSR installation: Years of estimated service life of HTLS/ Years of estimated service life of ACSR
100 %
4
Subtask 6.1: Suitability of HTLS
conductors in different
operational scenarios
During the operation of any kind of overhead line, different load situations and operational issues can occur (switch-off, ice load,...). Due to the special characteristics of HTLS conductor installations, there are even other operational situations possible that do not exist for conventional ACSR installations (e.g. rapid cooling). The tested HTLS conductors and accessories shall be suitable for all of these different operational situations.
HTLS conductors and accessories shall be suitable for all possible operational scenarios
100 %
5
Subtask 6.1: Reliable design of insulated cross-
arm made of
Will be estimated based on the non-standard pollution tests on shorter insulators
1. Pollution performance 243 phase-ground kV
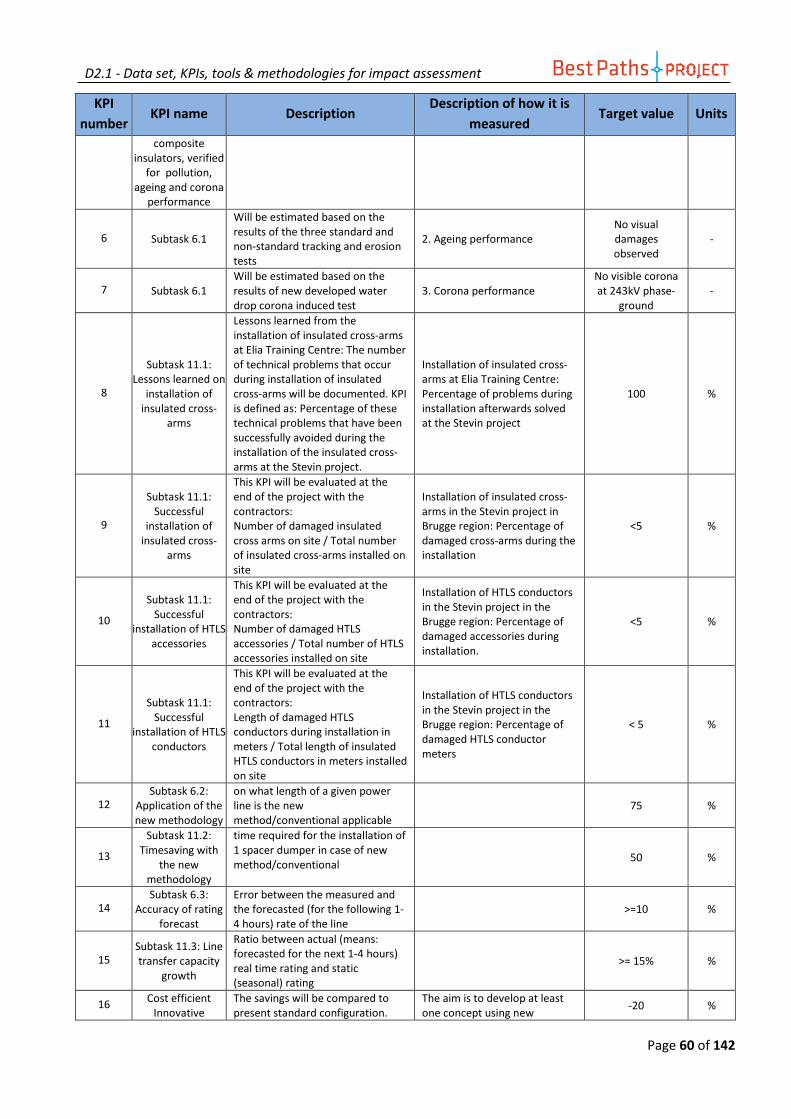
D2.1 - Data set, KPIs, tools & methodologies for impact assessment
Page 60 of 142
KPI
number KPI name Description
Description of how it is
measured Target value Units
composite insulators, verified
for pollution, ageing and corona
performance
6 Subtask 6.1
Will be estimated based on the results of the three standard and non-standard tracking and erosion tests
2. Ageing performance No visual damages observed
-
7 Subtask 6.1 Will be estimated based on the results of new developed water drop corona induced test
3. Corona performance No visible corona at 243kV phase-
ground -
8
Subtask 11.1: Lessons learned on
installation of insulated cross-
arms
Lessons learned from the installation of insulated cross-arms at Elia Training Centre: The number of technical problems that occur during installation of insulated cross-arms will be documented. KPI is defined as: Percentage of these technical problems that have been successfully avoided during the installation of the insulated cross-arms at the Stevin project.
Installation of insulated cross-arms at Elia Training Centre: Percentage of problems during installation afterwards solved at the Stevin project
100 %
9
Subtask 11.1: Successful
installation of insulated cross-
arms
This KPI will be evaluated at the end of the project with the contractors: Number of damaged insulated cross arms on site / Total number of insulated cross-arms installed on site
Installation of insulated cross-arms in the Stevin project in Brugge region: Percentage of damaged cross-arms during the installation
<5 %
10
Subtask 11.1: Successful
installation of HTLS accessories
This KPI will be evaluated at the end of the project with the contractors: Number of damaged HTLS accessories / Total number of HTLS accessories installed on site
Installation of HTLS conductors in the Stevin project in the Brugge region: Percentage of damaged accessories during installation.
<5 %
11
Subtask 11.1: Successful
installation of HTLS conductors
This KPI will be evaluated at the end of the project with the contractors: Length of damaged HTLS conductors during installation in meters / Total length of insulated HTLS conductors in meters installed on site
Installation of HTLS conductors in the Stevin project in the Brugge region: Percentage of damaged HTLS conductor meters
< 5 %
12 Subtask 6.2:
Application of the new methodology
on what length of a given power line is the new method/conventional applicable
75 %
13
Subtask 11.2: Timesaving with
the new methodology
time required for the installation of 1 spacer dumper in case of new method/conventional
50 %
14 Subtask 6.3:
Accuracy of rating forecast
Error between the measured and the forecasted (for the following 1-4 hours) rate of the line
>=10 %
15 Subtask 11.3: Line transfer capacity
growth
Ratio between actual (means: forecasted for the next 1-4 hours) real time rating and static (seasonal) rating
>= 15% %
16 Cost efficient
Innovative The savings will be compared to present standard configuration.
The aim is to develop at least one concept using new
-20 %

D2.1 - Data set, KPIs, tools & methodologies for impact assessment
Page 61 of 142
KPI
number KPI name Description
Description of how it is
measured Target value Units
overhead line concepts
materials and one concept using conventional materials that will yield a 20% reduction in cost compared to conventional methods.
17
Innovative retrofit process with
shorter outage time
The savings in outage time will be compared to the present process.
The aim is to develop one retrofit method with as few outages as possible using LLW methods when applicable.
-20 %
18 Safer mounting retrofit process
Reduction on helicopter transport compared to present process.
The aim is to develop a process that reduces the number of helicopter transports during the retrofit process.
-20 %
Table 13: Demo 4 KPIs 1 to 18
2.4.4. Methodologies for demo results validation and contribution for impact assessment
-Subtask 6.1/11.1:
Research and demonstration of HTLS and insulated cross-arms for the use on existing AC overhead lines is
likely to have impacts for the grid operation of European TSOs.
Due to the high importance of network security and system stability, European TSOs require high standards
and proven technologies to be used in the asset base. The work carried out for HTLS conductors and
insulated cross-arms within Demo 4 can help TSOs to better understand the technical specifications,
limitations and use cases (e.g. increase transfer capacity, increase ground clearance, decrease mechanical
load on towers) for HTLS conductors and insulated cross-arms.
Step 1: Definition of use cases for HTLS conductors within Demo 4:
A set of technical use cases for HTLS conductors is set up by the Demo partners that summarize:
- The different technical challenges possibly occurring on overhead lines that could potentially be solved
by a the implementation of HTLS conductors
- Description of each use case including technical requirements on conductors and existing examples
among European TSOs
Step 2: Assessment of the relevance of the use cases among TSOs involved in Best Paths:
Distribution of the compiled specific use cases for HTLS to other TSOs:
- Knowledge dissemination and following feedback collection from TSOs with regard to the use case
description
- Assessment of relevance of each use case from perspective of each TSO in Best Paths consortium
Step 3: Review of existing knowledge/test programmes and analyses on the usage of HTLS:
- Existing test programmes for HTLS will be reviewed and analysed
- Best Paths consortium members are to be involved in the review and knowledge sharing
D2.1 - Data set, KPIs, tools & methodologies for impact assessment
Page 62 of 142
- Specifications of HTLS tests will be based on the existing experiences and the shared know-how
Step 4: Evaluation of HTLS and insulated cross-arms research and demonstration:
Demo 4 participants expect specific findings on operational and long-term behaviour for HTLS and insulated
cross-arms delivered by tests and demonstration:
- Results of the research on HTLS will be integrated into the previously elaborated use cases
- The main conclusions and insights from the research as well the demonstration shall be evaluated and
shared with the consortium
Step 5: Estimated relevance of use cases and and evaluation of other grids:
Due to the diverging experiences and know-how with HTLS and insulated cross-arms among TSOs in Europe,
results of the research and demonstration on HTLS and insulated cross-arms in Demo 4 is likely to different
impacts. Depending on the individual background, involved TSOs might be impacted as follows:
a) First contact with HTLS and insulated cross-arms and possible use cases
b) Verification/know-how enhancement of existing experiences with HTLS and insulated cross-arms
c) Background to optimize/change existing or planned installations of HTLS or insulated cross-arms
d) Background for standardization efforts with regard to HTLS and insulated cross-arms
These different impacts shall be assessed during impact assessment in WP13 considering the specific national
grid topologies and the amount of applicable overhead line kilometres.
-Subtask 6.2/11.2:
Step 1: Calculation of improvements:
Impact assessment for the concepts/methods can be performed by calculating the savings in time for LLW at
MAVIR. With regard to innovative overhead line designs, money per kilometre for each concept/method at
Statnett shall be assessed.
Step 2: Estimation of applicable kilometres and evaluation of other grids:
Afterwards, an estimation of the total number of kilometres within an existing AC grid with overhead lines is
to be carried out, taking into account the limitations for the application for the specific technologies. Based
on this analysis, the approach could be repeated for each European TSO to obtain a general European impact
estimation.
-Subtask 6.3/11.3:
Step 1: Assessment of the net transfer capacity without DLR:
During the testing period, the maximum positive impact on using DLR can be measured by comparing the
amount of intraday net transfer capacity before (without DLR) with the new capacities that could potentially
be made accessible by DLR.

D2.1 - Data set, KPIs, tools & methodologies for impact assessment
Page 63 of 142
Step 2: Estimation of applicable kilometres and evaluation of other grids:
Based on this approach at MAVIR, any TSO in the European Union could potentially install the DLR and
perform the comparison of ex-ante capacity (before the DLR) and ex-post capacity. Depending on the specific
characteristics of the respective grids, an overall European impact could be estimated.
D2.1 - Data set, KPIs, tools & methodologies for impact assessment
Page 64 of 142
2.5. Demo 5: DC superconducting cable
2.5.1. Demonstration description
The overall goal of Demo 5 is to demonstrate that superconducting HVDC links are a viable solution for bulk
power transmission in the future grids. New technologies are required to relieve constraints on the grid,
particularly in the most populated and power-demanding areas of Europe: superconductors promise to
revolutionize power transfer by providing lossless and environmentally friendly transmission of electrical
power. The development of superconductors with transition temperatures higher than the boiling point of
liquid nitrogen (77 K = -196°C) has made the concept of superconducting power lines possible at least for
high-load applications. Superconducting cables are particularly suited for highly populated areas such as
dense districts of large cities, where purchase of a right-of-way for cables would be very costly. They can also
provide a very effective and efficient interface between two adjacent and asynchronous AC systems (power
hubs). In the longer term, this would also offer a very attractive solution for long-range transmission with
very limited power losses and could be the backbone of the future European transmission grid.
Discovered 100 years ago, superconductivity has led to the development of several major industrial
applications such as electro-magnets for the medical scanners (MRI) or high-energy particle colliders in the
1970s. These applications are mostly based on NbTi, a material that has to be cooled down to -269°C (4.2 K
for Liquid He) to become superconducting. In order to keep the superconducting state, any heat that enters
the system must be removed by cryogenic cooling machines. The operation costs are too high for
transmission power cable applications at liquid He temperature. Consequently, NbTi-based superconducting
cables were not developed or considered for power link applications outside research facilities like CERN. The
discovery of High Temperature Superconductors (HTS) in 1986, superconducting below -183°C (90 K) opened
new perspectives for using superconductors in power applications and in particular for transmission power
links. This opportunity was since then explored and developed by the cable industry.
Three types of commercial superconductors are available for cable applications at the moment (see Figure
22): Tapes superconducting below 90-100K, made out of ceramics.
a) Bi2Sr2Ca2Cu3O10-x (BSCCO) called 1st generation (1G) HTS
b) YBa2Cu3O7-x (YBCO) called 2nd generation (2G) HTS or Coated Conductors (CC)
c) MgB2 wires based on magnesium diboride which needs to be operated at a temperature below 39K.
1G and 2G HTS are superconductive in liquid nitrogen. Nitrogen is a low cost coolant (15 times less expensive
than Liquid He), abundant and environmentally friendly. However, tapes based on HTS are still too costly for
mass application. Manufactured with industrial processes, 1G needs a silver alloy matrix (minimum 50% of
the section) that makes it expensive. The complex manufacturing processes of 2G does still need
improvements, which are subjects to ongoing industrial development programmes.
Discovered in 2001, MgB2 is less expensive than any HTS material as it is based on the abundant materials
Magnesium and Boron. An optimized use requires a cooling at 15-20K by either liquid H2 or gaseous He.
Although these coolants are more expensive than liquid N2 they are still less expensive than liquid He (2 to 3
times less). Fortunately, the heat load to the cooling system can be strongly reduced when a liquid N2

D2.1 - Data set, KPIs, tools & methodologies for impact assessment
Page 65 of 142
radiation shield is used (approximately by a factor of 10) to prevent the heat radiating from warm surfaces at
300 K to enter the system. Consequently the extra investment and operational costs of the cooling system
are limited. For a high ampacity cable conductor (>5 kA), the extra cost for the cooling system is
compensated by the very low price of MgB2 wires.
a) Bi2223 tape / 1st generation b) YBCO tape / 2nd generation
c) MgB2 wires
Figure 22: Commercial HTS superconducting tapes and wires
Shape
Dimensions Commercial performances
Cost of the
performance Width
(mm)
Thickness
(mm)
Je (Amm-2)
@77K; self field
(SF)
(A.cm-1)
Length (m)
Bi2223 Laminated tapes 4,5 0.3 120-150
(350 - 400) < 1500m
100 €/(kA.m)
@77K, SF
YBCO Laminated NiW Tapes
4 to 12 0.2 100 - 150
400 - 500
(200 - 250)
< 500m 180€/(kA.m)
@77K, SF IBAD tapes 0.05
Shape Diameter (mm) Je (Amm-2)
@20 K ; 1T Length (m)
Cost of the
performance
MgB2 Cylindrical wires 0.8 -1.5mm 300 < 3000m 10€/(kA.m)
@20K, 1T SF: Self magnetic field
Table 14: and cost of the performances of commercial tapes and wires in 2014

D2.1 - Data set, KPIs, tools & methodologies for impact assessment
Page 66 of 142
The cost of the performance reported in table 14 corresponds to the cost of the superconducting tapes or
wires (equivalent to the copper wire in a resistive cable). The cost of the cabling, of the insulation, of the
cryogenic envelopes, and the cooling system have to be added. Specific works about costs will be developed
during the project. In particular 2 Kpis about the cost evolution all through the project of the MgB2 wires and
of the cryogenic envelope will be considered. They are the most significant contributor to be considered for
the costs of the overall system.
These tapes or wires are stranded to allow the manufacturing of a cable conductor that transmits very high
currents. Depending on the superconducting material, the exact design of the cable conductor requires a
thorough modelling to adjust the number of superconducting wires to the operating current (cost impact)
and to withstand transient events such as short circuit fault currents, etc…
The arrangement of stranded HTS tapes or MgB2 wires shall be compatible with existing cabling machines
and also allows bending of the cable for its coiling on drums and its installation without damaging the wires.
In some cases, special mechanical reinforcement could be added to the cable conductor to withstand the
cabling operations, the cable shrinkage during the cable system cooling down and the installation stresses.
Copper or aluminium wires can also be stranded in parallel with the superconducting wires to transfer the
very high fault currents and increase the superconductor stability. Cable conductors with very high ampacity,
higher than 10 kA, have been manufactured. The manufacturing of 100+kA ampacity conductors could be
considered with MgB2 superconducting wires. Many cabling tests have been carried out with 1G and 2G
tapes on industrial cabling machines for the demonstrators. Recently, some stranding validations of sub-
cable conductors have been performed with MgB2 wires produced by Columbus within the FP7 Poseidon and
Eucard projects respectively by Nexans and CERN.
The electrical insulation is generally immersed in the cooling fluid. It is made out of paper or polypropylene
laminated paper tapes lapped around the cable conductor and impregnated with the cooling liquid that is
used in the same way as the oil in “Impregnated” conventional cables. High voltage insulation can be
achieved with such a structure. To limit the risk of a dielectric breakdown, gas bubbles are forbidden in the
cooling liquid of HV insulation.
The cable (conductor + electrical insulation) is inserted into a flexible cryogenic envelope to keep the
superconducting material at the cryogenic operating temperature. Such envelopes are produced in
hectometer piece lengths, delivered on drums and can be jointed on field for multi-kilometre long systems.
They have been developed for liquefied gas transfers and are commercially available.
Beside the insulated conductor and its cryogenic envelope, a superconducting cable is a complex assembled
system that requires associated accessories for terminations and junctions, and also the cooling and cryo-
fluid management systems. Cooling machines sufficient for niche applications can be purchased from the
market. Terminations, junctions and cooling fluid management systems have to be specifically developed for
selected applications. The reliability and availability of all these equipment are paramount for a mass
deployment in the grid.
For more than 15 years, several cable systems have been installed in niche situations, where they are studied
before their mass commercialization to demonstrate the maturity of the technology. As AC is used in all
electrical grids and DC only for a few point-to-point high power applications, nearly all (except references
D2.1 - Data set, KPIs, tools & methodologies for impact assessment
Page 67 of 142
25,26,27) demonstrators have been designed for AC power transmission and distribution applications. An AC
cable used by the Long Island Power Authority (LIPA) and designed and manufactured by Nexans (approx.
600 MVA 2,4kA-138kV, with a length of 600 m and installed in April 2008) is the world’s first installation of a
superconducting cable in grid at standard transmission voltages. It includes 3 phases and is based on 1G
tapes that have been upgraded with 2G tapes. 6 high voltage terminations are used for the connection to the
grid. Within the European FP6 demonstrator project SUPER3C (coordinated by Nexans) completed in
November 2008, a 30m long 150 MVA (25 kV-3,2 kA) cable system with 2G superconducting tapes has been
developed. It has been tested in a laboratory in Spain but not integrated into the grid. Other projects have
been carried out or are still ongoing in Japan, China and Korea.
Ongoing or planned projects demonstrate a tendency to increase the transferred power, with two different
approaches: one with a simultaneous increase of voltage and current for very high power transmission and
one towards increasing the current while keeping or reducing the system voltage for distribution. This last
solution is now under testing within an ongoing major project called Ampacity (involving RWE, Nexans and
KIT). Its objective is the development of a 40 MVA (10kV-2,3 kA) 3 phase coaxial superconducting cable made
out with Bi2223 tapes for the power distribution into the cities or urban areas. As a demonstration, a 1000 m
long system associated with a fault current limiter has been installed in the grid in the city of Essen
(Germany). The testing is now ongoing and shows the expected results.
Superconducting transmission systems are even more efficient in DC than in AC mode due to the suppression
of AC losses in superconducting materials, an extra heat from AC hysteresis losses is generated in a
superconducting material when it is in a variable magnetic field. For DC transmission, the heat load does not
depend on the ampacity of the cable but only on the cryogenic envelope performance. In this way, very high
current cable conductors up to 100 kA can be designed and economically operated. However, no complete
demonstration of a superconducting HVDC cable system has been carried out so far.
Superconductors have been ready for deployment in energy-related applications for some years now, but
have yet to be used on a large scale and to be validated for DC operation. Furthermore, superconducting
wires are only now available in sufficient lengths and quantities at viable costs, thanks to the discovery of
‘low cost’ superconductors such as MgB2.
Within Best Paths project, the first goal of Demo 5 is to convince the European authorities and TSO’s that the
required technologies are ready for the installation of superconducting HVDC cables in the grid. Figure 23
presents a concept of such a complete bipolar HVDC superconducting link that is envisioned for future grids.
25 Kostyuk, V., Antyukhov, I. , Blagov, E., Vysotsky, V. , Katorgin, B. , Nosov, A., Fetisov, S. and Firsov, V. , Experimental Hybrid Power Transmission Line with liquid Hydrogen and MgB2-based superconducting Cable, Technical physic letters 2012, Vol 38, N°3 PP 279-282 Pleiades Publishing Ltd, 2012
26 L.Y.Xiao et Al; “Development of a 10kA HTS DC Power cable” IEEE Trans. on applied supercon. Vol 22, pp 580-584 June 2012
27 S Yamagushi et Al, “Design and Construction of 200-Meter High Temperature Superconducting DC Power Cable Test Facility in Chubu University” Twenty-Third International Cryogenic Engineering Conference 1041-1047 Nov 2011

D2.1 - Data set, KPIs, tools & methodologies for impact assessment
Page 68 of 142
Figure 23: MgB2 Superconducting HVDC cable system concept
This goal will be met by the manufacture and the testing of a monopole cable system including HV
terminations, transferring 10 kA at 320 kV. Joints are out of the scope of Demo 5. Their manufacturing
technologies have been already developed for other grid applications (LIPA or Ampacity projects). Based on
these experiences, the technologies and processes are ready to build a joint. A conceptual design and a
description of manufacturing processes will be given in the “long range cable” studies that will be carried out
in the 2nd part of the project. The joints’ manufacture and testing with Liq N2/gas He cooling media will
require another project to be carried out.
As a result, the HVDC monopole superconducting cable demonstrator (see Figure 24) will be designed to
transfer 3.2 GW, nearly an order of magnitude higher than any existing conventional system, with a much
lower environmental footprint due to its smaller size. Design and manufacture of 2 full scale terminations
and the associated testing at high voltage and at high current will be carried out.
He gas or liq H2 20 K system &
Liq N2 70 K system
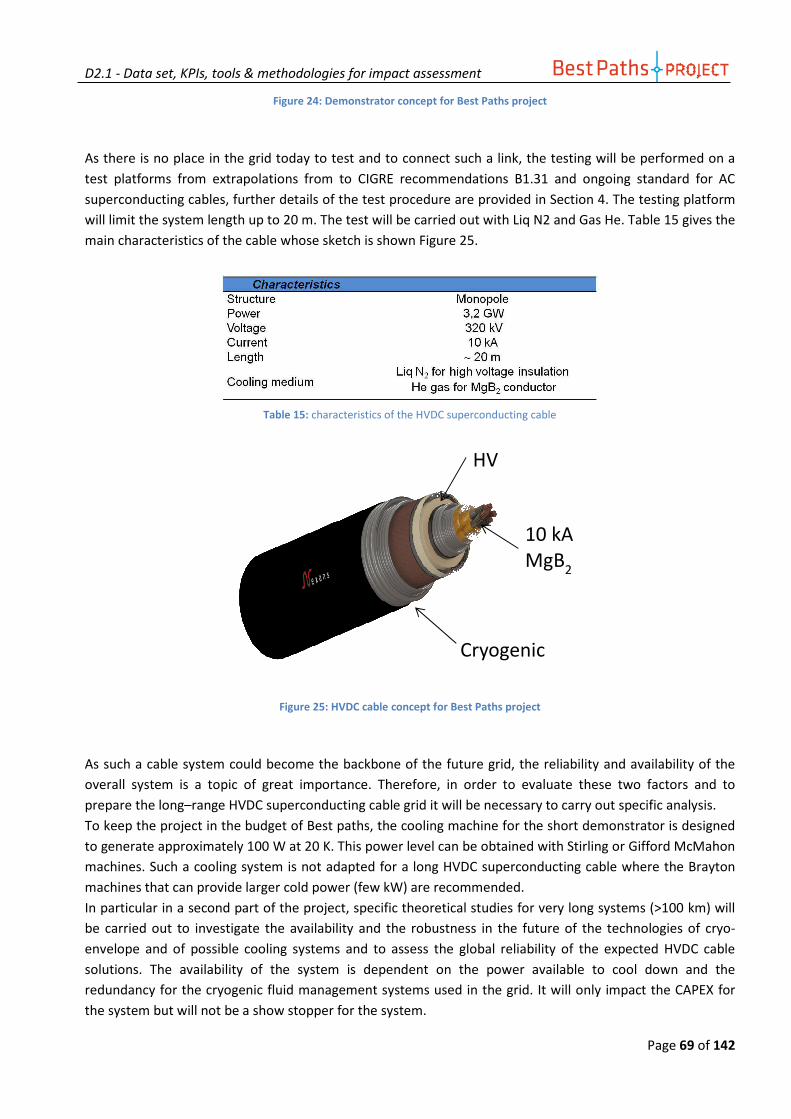
D2.1 - Data set, KPIs, tools & methodologies for impact assessment
Page 69 of 142
Figure 24: Demonstrator concept for Best Paths project
As there is no place in the grid today to test and to connect such a link, the testing will be performed on a
test platforms from extrapolations from to CIGRE recommendations B1.31 and ongoing standard for AC
superconducting cables, further details of the test procedure are provided in Section 4. The testing platform
will limit the system length up to 20 m. The test will be carried out with Liq N2 and Gas He. Table 15 gives the
main characteristics of the cable whose sketch is shown Figure 25.
Table 15: characteristics of the HVDC superconducting cable
Figure 25: HVDC cable concept for Best Paths project
As such a cable system could become the backbone of the future grid, the reliability and availability of the
overall system is a topic of great importance. Therefore, in order to evaluate these two factors and to
prepare the long–range HVDC superconducting cable grid it will be necessary to carry out specific analysis.
To keep the project in the budget of Best paths, the cooling machine for the short demonstrator is designed
to generate approximately 100 W at 20 K. This power level can be obtained with Stirling or Gifford McMahon
machines. Such a cooling system is not adapted for a long HVDC superconducting cable where the Brayton
machines that can provide larger cold power (few kW) are recommended.
In particular in a second part of the project, specific theoretical studies for very long systems (>100 km) will
be carried out to investigate the availability and the robustness in the future of the technologies of cryo-
envelope and of possible cooling systems and to assess the global reliability of the expected HVDC cable
solutions. The availability of the system is dependent on the power available to cool down and the
redundancy for the cryogenic fluid management systems used in the grid. It will only impact the CAPEX for
the system but will not be a show stopper for the system.
10 kA MgB
2
Cryogenic
HV insul
D2.1 - Data set, KPIs, tools & methodologies for impact assessment
Page 70 of 142
Consequently in parallel, an economical viability of the superconducting HVDC cable solution will also be
studied. This economical assessment must take into account the cost for the cable itself as well as estimated
costs of the sub-stations and civil works. In order to assess the economical viability of the superconducting
HVDC solutions a comparison with conventional resistive solutions carried out on significant cases' studies
proposed by TSO’s will be developed.
2.5.2. Demonstration Objectives, expected impacts and barriers to be overcome
- Demonstration objectives
1. To design, build and test a full scale HVDC MgB2 superconducting cable to perform a type test. All the key
elements except joints will be assembled and tested during a type test performed on a 20 m long test loop.
The test program methods and acceptance criteria are detailed in detail in section 2.6.4. With the success of
this test program we expect to convince the users that HVDC MgB2 superconductor technology is ready for a
quick implementation within future grids.
2. To study the extrapolation of the results to multi-kilometric long cables on field cases proposed by TSO’s
will be carried out. These studies will principally focus on the power losses in the cable system. They are
directly proportional to two factors:
• The cold power and pressure drop of the fluids principally dependent cryogenic envelope performances.
• The number of cooling machines and circulation pumps and their efficiency.
This study will be used to estimate the losses on the transmitted power for the different scenario.
3. To compare investment costs and operational costs with the HTS cable and the conventional cable systems
including gas insulated lines will be carried out. A mapping of the different solutions showing which one is
the most economically preferable will be drawn. As the superconducting solutions offer the possibility to
transmit the same power at a lower voltage and require less space, such analysis must consider the full
system including the substations and the civil works (permit costs included).
To estimate the reliability of the overall system and of its availability (especially the cooling machines) will be
proposed. It will be based on some statistical approaches for the critical components (cooling machines). This
study will indicate when redundancy is required for a safe operation.
- Demonstration Expected Impact
The results of the demonstration will offer an unparallel possibility to transfer very high power that will help
TSOs to optimize the right of way in there grids. The advantages of the superconducting cable are:
• compact design that therefore can be easily installed and less demanding in right-of-way,
• robust to face fluctuating power profiles,

D2.1 - Data set, KPIs, tools & methodologies for impact assessment
Page 71 of 142
• flexible in exploitation and
• affordable to install and to run (acceptable CAPEX and OPEX figures including maintenance) based on a
selection of cases
For this demonstration the development and the optimization of the manufacturing process for production of
high performance MgB2 superconducting wires at low cost will be carry out. We will have robust designs and
processes for the MgB2 wires ready for the production in large quantities for the future implementation within
the grid.
The demonstration will validate a generic concept for such a superconducting HVDC power link that could be
declined to different filed cases. It will include a study on its robustness versus transient phenomena at high
voltage (lightning impulses, switching operations into the grid,…) and at high current (power flux inversion or
fault currents ...) within the grid.
With a reduced footprint and no environmental impact, it will offer an unparalleled solution to transmit huge
power throughout grid bottlenecks. It is expected to have a lower economic impact than installation of
resistive cables and could provide a suitable solution to provide medium-term alternatives to grid extension.
From this project a commitment at the European level on the testing required for HVDC superconducting cable
will be proposed. It could be used as a basis for CIGRE and standardization future works.
- Demonstration Barriers
1- Difficulty to obtain or to estimate CAPEX and OPEX to compare MgB2 superconducting installations with
other technical options (conventional and HTS)
2- As long as some components of the overall system may not yet be fully developed (high power cooling
machine or circulation pumps), the needed information to carry out reliability and availability analysis
could be difficult to obtain/estimate. Discussions with cooling system manufacturers and the expertise of
TU Dresden on the cooling machines and UP Madrid on the methodologies to estimate the reliability will
be key to overcome this barrier
3- Regarding the implementation of demo results after the project, as the MgB2 superconducting cables
can transmit very high currents, HV converters that can provide very high current (>10 kA) are needed to
get the full benefit of the developed cable system. A parallel development of such converters (including
the connection to busbars) is mandatory before any implementations of the HVDC MgB2
superconducting cables in transmission grid.
4- The new way to measure and to control the very low voltage drop across the very low resistance from
the resistive bus bars and terminations for the connection to the grid.
5- The lack of standards for testing superconducting HVDC cables
6- The education/training of the maintenance teams of the TSO’s or subcontractors on cryogenic fluid
management, cooling systems etc...
2.5.3. Demo 5 KPI’s
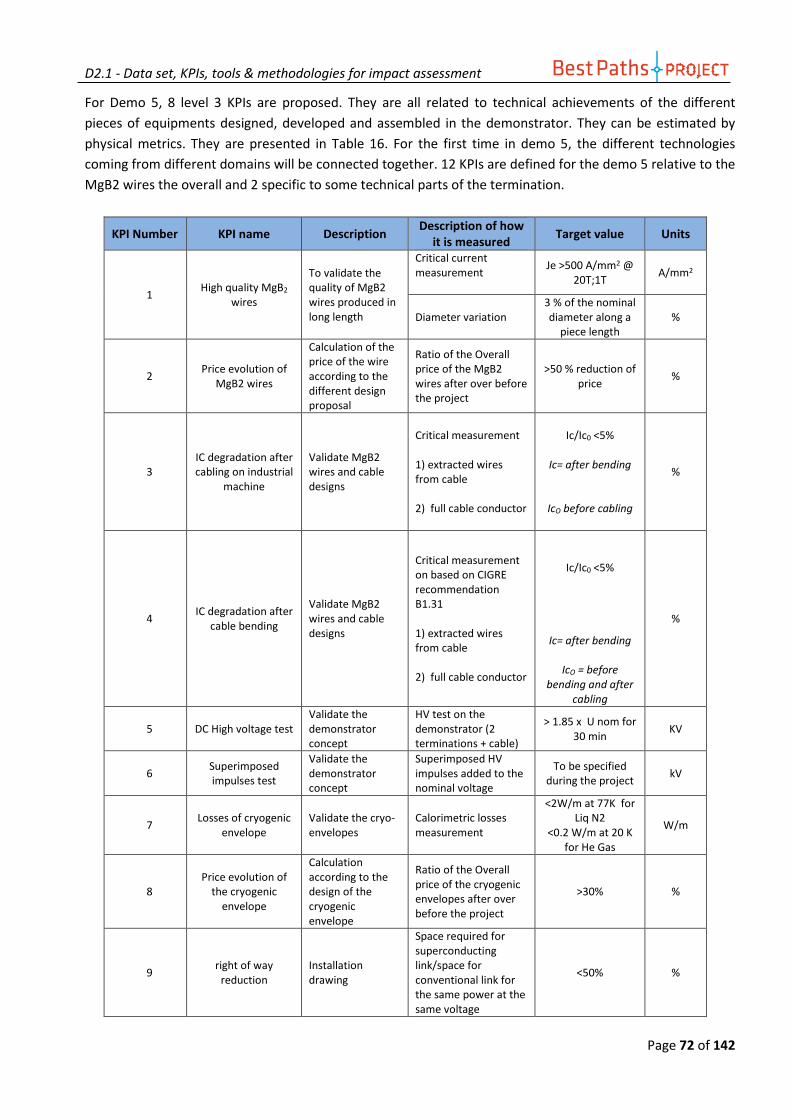
D2.1 - Data set, KPIs, tools & methodologies for impact assessment
Page 72 of 142
For Demo 5, 8 level 3 KPIs are proposed. They are all related to technical achievements of the different
pieces of equipments designed, developed and assembled in the demonstrator. They can be estimated by
physical metrics. They are presented in Table 16. For the first time in demo 5, the different technologies
coming from different domains will be connected together. 12 KPIs are defined for the demo 5 relative to the
MgB2 wires the overall and 2 specific to some technical parts of the termination.
KPI Number KPI name Description Description of how
it is measured Target value Units
1 High quality MgB2
wires
To validate the quality of MgB2 wires produced in long length
Critical current measurement
Je >500 A/mm2 @ 20T;1T
A/mm2
Diameter variation 3 % of the nominal diameter along a
piece length %
2 Price evolution of
MgB2 wires
Calculation of the price of the wire according to the different design proposal
Ratio of the Overall price of the MgB2 wires after over before the project
>50 % reduction of price
%
3 IC degradation after cabling on industrial
machine
Validate MgB2 wires and cable designs
Critical measurement 1) extracted wires from cable 2) full cable conductor
Ic/Ic0 <5%
Ic= after bending
IcO before cabling
%
4 IC degradation after
cable bending
Validate MgB2 wires and cable designs
Critical measurement on based on CIGRE recommendation B1.31 1) extracted wires from cable 2) full cable conductor
Ic/Ic0 <5%
Ic= after bending
IcO = before
bending and after
cabling
%
5 DC High voltage test Validate the demonstrator concept
HV test on the demonstrator (2 terminations + cable)
> 1.85 x U nom for 30 min
KV
6 Superimposed impulses test
Validate the demonstrator concept
Superimposed HV impulses added to the nominal voltage
To be specified during the project
kV
7 Losses of cryogenic
envelope Validate the cryo-envelopes
Calorimetric losses measurement
<2W/m at 77K for Liq N2
<0.2 W/m at 20 K for He Gas
W/m
8 Price evolution of
the cryogenic envelope
Calculation according to the design of the cryogenic envelope
Ratio of the Overall price of the cryogenic envelopes after over before the project
>30% %
9 right of way
reduction Installation drawing
Space required for superconducting link/space for conventional link for the same power at the same voltage
<50% %

D2.1 - Data set, KPIs, tools & methodologies for impact assessment
Page 73 of 142
10 Overall performance
costs (comparison with AC, DC, GIL.
Calculation of OPEX and CAPEX of different system based on installation cases (urban, landscape, including substations
OPEX & CAPEX To be determined €/kA.m
11 Termination current
leads
Validate the design for the current leads
Losses by electrical and thermometric measurements at 20 K
<10 W/ current lead at 10 kA at 20
K W
12 He leaks in the
injection tube in the termination
Validate the design for He injection tube that should withstand the HV
He Leaks measurement at RT at 20 bars after 5 cooling down from RT to 20 K And 5 overvoltage shocks
< 10-7 mbarls-1
Table 16: Demo 5 KPI 1 to 6
2.5.4. Methodologies for demo results validation and contribution for impact assessment
To assess the impacts, two approaches will be carried out in parallel.
- The first one is a “type test” approach based on manufacturing and testing hardware pieces of equipment.
- The second is technical economic evaluation of different applications in the grid including long length applications.
2.5.4.1. Type test procedure on the demonstrator
In addition to the pre-tests required to qualify independently of the different components, the overall
demonstrator will be tested according to the methods inspired from CIGRE B1.31 recommendations for AC
cables (type tests) and transposed to DC applications.
The methodology and the test sequence proposed are as follow:
- Bending test followed by HVDC tests - Pressure tests on the assembly - DC voltage test on the assembly - Superimposed-impulse voltage test followed by DC voltage test on the assembly
Each step of this sequence is described below.
a) Bending test on the cable
The cable sample shall be bent around a test cylinder with 25 x (d+D) diameter at ambient temperature on a
drum.
“d” is the nominal outside diameter of the outer corrugated wall off the 20 K chamber and D is the nominal
outside diameter of the Liq N2 chamber.

D2.1 - Data set, KPIs, tools & methodologies for impact assessment
Page 74 of 142
Ic (critical current) measurements of the MgB2 cable conductor will be carried out at 20 K or above in gas He
to check potential damage of the superconducting wires due to bending. No degradation higher than 5%
shall be measured at 1V/cm voltage rise criteria. As the critical current to measure can exceed the capacity
of the electrical power supply and of the demonstrator termination (i.e. fault current up to 35 kA), this test
will be carried on a sample of cable conductor on a different measurement set-up at CERN. If not possible
with the existing test set-up, it can be performed on extracted wires.
b) Pressure tests of the systems
The pressure tests shall be carried out on the cable system (including terminations). The cable and the
accessories shall be built as a pressure vessel and will follow international standards or the German rules at
least. The test will be carried out at room temperature with a gas (N2 or He). The test pressure will be held
for 24 hours. The pressure at starting time and ending time will be measured. No observable pressure drop
shall be measured.
c) DC voltage test
The tests are performed on the demonstrator with no current. The voltage will be applied to insulation
chamber of the cable (paper lapped chamber) in which circulate the liq N2 at 70K and 5 bars and connected
to the 2 terminations.
1.85 U0 voltage will be applied between the pole/outer wall of the inner cryogenic envelope and the ground
shield of the cable. For our demonstrator the voltage tested is from to 592 kV DC. The voltage will be held for
30 min.
No breakdown or flashover shall occur during the test.
d) Superimposed-impulse test
Procedure, test values and acceptance criteria will be analysed and specified during the 1st year of the
project. Indeed, inductance and capacity of the cable have to be established to determine through modelling
the accurate criteria for this test.
e) Cryogenic envelope heat invasion
The heat invasion of the cryostat will be checked for the inner chamber (MgB2 cable at 20 K in He gas) and for
the outer chamber (LiqN2 thermal shield and HV insulation). It will be measured by calorimetric methods.
2.5.4.2. Techno-economic evaluation
The technical evaluation will be carried out. It will include the cost estimation of the following 6 key pieces of
equipment:
g) Terminations h) Cable conductor including the MgB2 wires i) Cryo-envelope with the HV insulation j) Joint k) Cooling systems

D2.1 - Data set, KPIs, tools & methodologies for impact assessment
Page 75 of 142
l) Pressurization/circulation fluid systems.
The number of pieces of equipment required (joints, number of piece of cryo-envelope, cable conductor
length...) is dependent on the application cases studied in the project.
Today, the following grid applications have been identified and will be studied. This list is not limitative and if
some others cases are found during the project they will be added.
The first list from the shortest to the longest cables is as follow:
1. Superconducting HVDC cables could be introduced within large power hubs located at key grid nodes
to transfer high bulk power for example from two adjacent and asynchronous AC areas. The length of
such power links will be in the range of few tens of meters.
2. The MgB2 superconducting cable systems can be introduced within the grid to help to overcome
bottlenecks. This technology is particularly desirable for new transmission links or upgrading of existing
grids in urban or suburban areas where the increasing difficulties of installation could slow or stop the
power grid deployment. This situation is faced in most populated countries as in the European zone.
Moreover, coupled with HVDC standard cables or lines, they enable the transmission on long
distances. The length for such cable is in the range of several kilometers. In this case one high power
existing cooling system is sufficient.
3. The development of Renewable Energy, and especially off-shore wind farms, will increase considerably
the power injected in the land connection points of the on-shore grid. To withstand this additional and
intermittent power, the reinforcement of the existing grid is necessary. This evolution is technically
complex, highly expensive and even sometimes impossible with standard technologies. The very high
ampacity offered by superconducting cable systems is a way to deal with this issue: they make it
possible to increase the accepted power by increasing the current with a very limited environmental
impact (reduced footprint). The length of such application will be of several tens of kilometres long.
Specific issue of length between cooling and pressurization substation will be studied. Although DC
superconducting links are more efficient, comparisons on the CAPEX of a DC and an AC power cables
built with MgB2 wires will be carried out. This study will include the costs of the pieces of equipment in
the substations.
This specific long links study will consider also the potential use of Liquid H2 as a cooling fluid for very
long length system longer than 100 km. In this case the association of superconductivity with hydrogen
technologies offers a unique combination for the transition of two energy vectors that could be a
result of the energy transition. With such “hybrid” power lines, electricity is transferred via HVDC
superconducting cables and H2, one of the most effective fuels, via the cryogenic lines. The
deployment of this technology into the grid will require few steps of demonstration after the FP7
energy project. One challenge is of course to get the acceptance of the H2 (cooling fluid) by civil society
with a large and public support but also to insure the availability of the long-range complete system.
To fully release these safety and security points, studies will be performed within this project to have a
clear vision of the potential risks but further validations will be required.

D2.1 - Data set, KPIs, tools & methodologies for impact assessment
Page 76 of 142
Availability and reliability of the system:
The availability and reliability of the cooling pressurization/circulation fluid systems is an important factor to
estimate for every studied case. It will control the need of any redundancy to operate the superconducting
system. A correction cost factor will be estimated and applied according to the availability requirement of
the power link.
Availability of a device can be measured in terms of the fraction of time the device is operating or ready to
operate. This concept is to some extent linked to reliability of a system, namely an electric system or an
electric grid. They are complex systems with a web structure, and reliability can be expressed in relation to
generators, clients or other variables of the electricity services. This leads to a Reliability Compendium
gathering all the information on performance according to a structure commensurate to the number of
clients and other relevant variables, which includes specific components, as special transmission lines. This
technical procedure is generally taken into account in evaluating the quality of an electric grid.
The case under consideration is simpler than the full case of a complex grid which in turn is divided into
sectors and sub-grids with different hierarchy in voltage, because the current case is targeted into a single or
a few superconducting cables providing a specific transmission service.
Reliability of a grid depends a lot on its structure and architecture, where redundant transmission lines,
alternative routes and ad-hoc electric devices can shut-off or switch-on some circuits to give appropriate
answers to changes in the state variable of the grids. The word “reliability” is particularly suited to feature a
complex and integrated system where a plurality of services is satisfied.
For a single transmission line, particularly a superconducting line, the concept of “availability” seems to be
closer to the semantic and technical roots. Availability obviously covers aspects which can be used in the
formulation of the Reliability Study but those aspects can primarily be used to determine the availability
record of a device under test.
This means that some type of specific tests and performance indicators would provide deterministic and
stochastic information, that could be used in the formulation of the reliability of a system which embodies a
plurality or circuits with different levels of hierarchy, redundancy and total or partial substitutions of some
elements by others; and can also be used to establish the Availability of an operational device, as a
superconducting cable. The latter does not include redundancies provided by other parts of the system,
because they are fully dependent on a given embodiment. It must include all types of test answers
specifically belonging to the device as such.
From the point of view of developing and evaluating cables, Availability seems more targeted into the actual
problem of characterizing a cable to fulfill a variety of missions. Of course a superconducting cable needs a
number of auxiliary items which are absolutely necessary for working properly, particularly the cooling
system, and those items must be included in the Availability study, which can be structured in the following
levels:

D2.1 - Data set, KPIs, tools & methodologies for impact assessment
Page 77 of 142
1. Physical and functional description of the full device. 2. Fault analysis from any conceivable change in the nominal conditions of relevant variables (or state
variables). 3. Detection mechanisms, early warnings and repair actions, characterized by time scales. 4. Consequence evaluation, taking into account the existence of critical values in some key magnitudes,
specifically Critical Temperature. This obliges to have a set of cooling channels made of thermal transfer effects which must be kept operational or ready to operate. Those channels contain both passive and active components, the latter being particularly important to determine the availability value, because they consist of complex machines which require sources of energy to operate. Additionally, another important piece in this analysis is the availability of the chain of heat sinks to remove the heat load of the cable container. Cooling systems at least require a final heat sink (the atmosphere, for instance) but intermediate heat sinks can be used to help keep temperatures under a given value.
5. Stochastic characterization of the failure modes of the components and subsystems, where the fundamental challenge is the determination of accurate coefficients of the equations featuring the statistical behaviour.
6. Integration of the specific stochastic information into a synthesis describing the Availability of a superconducting cable, including sensitivity analysis to identify routes of improvement to have a balanced situation among the effect of each state variable onto the Availability value.
Steps 1) through 4) are inside the scope of Best Path. Information on the stochastic behavior will not be
covered properly, because of lack of time and budget. A theoretical framework can however be established
to express the dependence of the Availability level on the reliability coefficients of the parts and subsystems
embodied in the device, but it will not be a complete answer to step 5) requirement; and therefore the final
synthesis remains also out of scope.
Information of steps 1) through 4) will provide ad hoc expertise, including the development of calculation
tools, to guide further developments of superconducting cables towards the very high level of availability
which should be associated to such a device of ultra-high technical quality.
2.6. WP13 Integrated global assessment for future replication in EU27
2.6.1. Demonstration description
The specific improvements (beyond the state of the art) of the different relevant technological areas,
developed and tested within each of the five demonstration projects which integrate Best Paths, must be
aimed towards common objectives such as ensuring increased network capacity and system flexibility.
Under this premise, the results of each individual demonstration must be assessed, as well as the combined
effect of all the innovations developed, according to their scalability and replicability potential, with the aim
of evaluating the impact of the integrated solutions proposed over the pan-European network, in accordance
with the aforementioned objectives.
The evaluation of the combined impact of Best Paths solutions will be achieved through KPIs assessments,
adopting the KPIs structure defined by EEGI (European Electricity Grid Initiative). EEGI establishes three levels

D2.1 - Data set, KPIs, tools & methodologies for impact assessment
Page 78 of 142
of KPIs, which are level 1 KPIs, also known as overarching KPIs; level 2 KPIs, also known as specific KPIs; and
finally level 3 KPIs, or project KPIs. Accordingly, level 1 and level 2 KPIs will allow evaluating the global impact
of the combined solutions on the pan-European network.
WP13 deals with the following overarching issue:
How replicable are the Best Paths promising demonstrations results within the entire pan-European
electricity system?
On the one hand, scalability refers to the possible evolution of the demonstration scale, away for the one
chosen for the demonstration. On the other hand, replicability is related to the dependency of the solution
upon the network, considering external factors such as the location or time when the innovative system is
deployed. It is affected by technical and economic regulations.
Given that each innovative solution is tested under a controlled environment and reduced scale
(demonstrations), in order to give answer to the previous question it has to be analysed if the expected
improvements provided are certainly able to contribute to fulfil the common objectives of the European
Power System, once integrated in the interconnected European network. Thus, the scalability and
replicability of the innovative solutions tested in Best Paths must be assessed.
Thus, geographical expansion is considered to apply demo results in large geographical systems. Relevant
demonstrators are German offshore wind areas Gaia – Bard offshore, British Dogger Bank offshore, Danish
offshore (Horns Rev 2) and relevant Norwegian offshore areas. WP13 (task 13.6, led by SINTEF) will assess
the possibilities of connecting of all these "independent- stand alone" offshore grids into a full meshed
offshore grid across the North Sea (see Figure 26 below). Focus will be on economic benefits, impact on
inter-operability and on barriers and challenges for large scale scalability. Also the validity of the scalability
rules defined by Level 3 and Level 2 KPIs for demo #1, demo #2 and demo #3 specifically will be considered to
geographically wide regions and large meshed grids.
Infrastructure costs, production cost savings and gross consumer surplus will be calculated as a function of
different offshore grid topologies (radial connection, clustering, possibility of T-connection with HVDC links
between UK-NO, UK-NL...) as well as for different levels of onshore transmission expansion. Moreover, CBA
of configurations incorporating offshore trans-border connection between different control zones offshore,
making up a large-scale meshed offshore grid will be carried out.
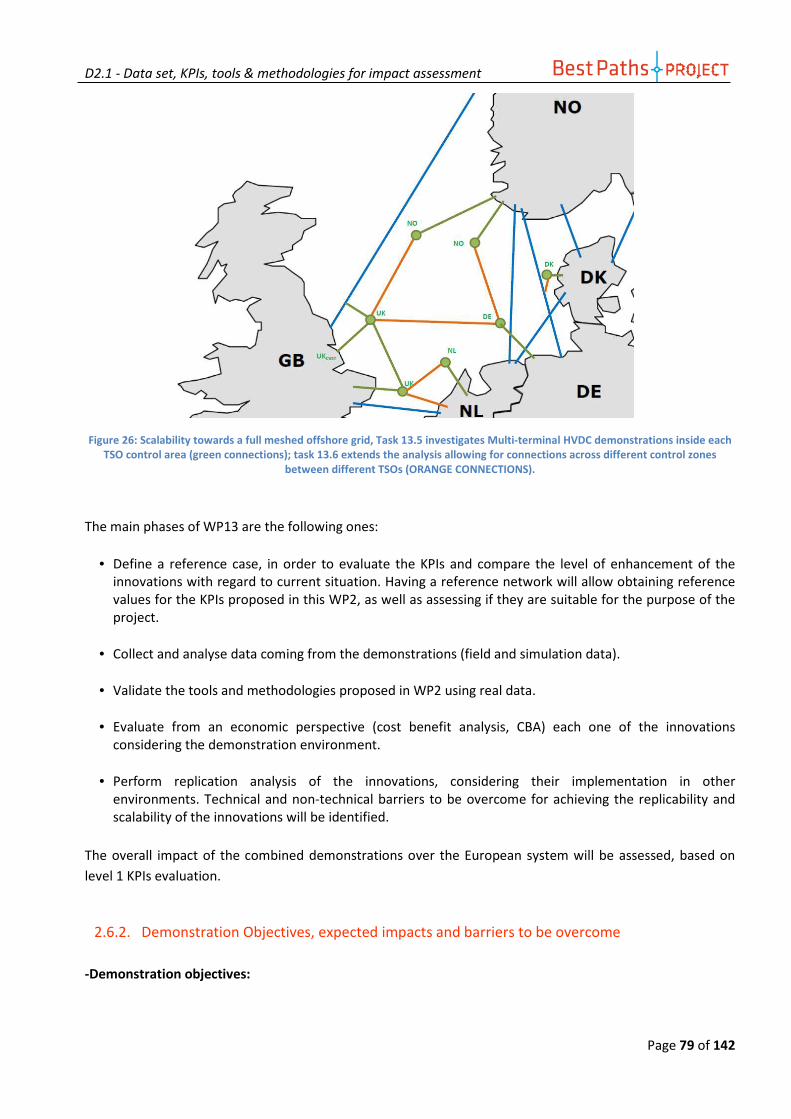
D2.1 - Data set, KPIs, tools & methodologies for impact assessment
Page 79 of 142
Figure 26: Scalability towards a full meshed offshore grid, Task 13.5 investigates Multi-terminal HVDC demonstrations inside each
TSO control area (green connections); task 13.6 extends the analysis allowing for connections across different control zones
between different TSOs (ORANGE CONNECTIONS).
The main phases of WP13 are the following ones:
• Define a reference case, in order to evaluate the KPIs and compare the level of enhancement of the innovations with regard to current situation. Having a reference network will allow obtaining reference values for the KPIs proposed in this WP2, as well as assessing if they are suitable for the purpose of the project.
• Collect and analyse data coming from the demonstrations (field and simulation data).
• Validate the tools and methodologies proposed in WP2 using real data.
• Evaluate from an economic perspective (cost benefit analysis, CBA) each one of the innovations considering the demonstration environment.
• Perform replication analysis of the innovations, considering their implementation in other environments. Technical and non-technical barriers to be overcome for achieving the replicability and scalability of the innovations will be identified.
The overall impact of the combined demonstrations over the European system will be assessed, based on
level 1 KPIs evaluation.
2.6.2. Demonstration Objectives, expected impacts and barriers to be overcome
-Demonstration objectives:

D2.1 - Data set, KPIs, tools & methodologies for impact assessment
Page 80 of 142
The main goals to be achieved by WP13 are the assessment of the improvements achieved by each
demonstration and, specially, the evaluation of the impact of the integrated solutions over the European
network, performing CBA and level 1 and 2 KPI assessments. This is achieved through the following partial
objectives:
• Assess and maximise the probability of scaling and replication potential by designing proper demonstrations of innovative technology integration into the Pan-European transmission system.
• Monitor the data collection during the demonstrations which support the validation of scaling rules on the basis of a specific set of project level 3 KPIs per demonstration.
• Evaluate each demonstrator through the KPIs defined in WP 2.
• Confirm the economic scaling of the demonstrated innovations using simulation tools.
• Perform cost/benefit analyses of each demonstration under its controlled environment which relates to the level 2 KPI chosen for the overall project.
• Perform replication studies in other relevant EU conditions, which include cost/benefit analyses of each demonstration, assuming that all the replication barriers are removed.
• Integrate all level 2 KPIs analyses into a final impact analysis dealing with transmission network capacity and system flexibility increases (level 1 KPI).
-Demonstration expected impact:
WP13 is an assessment work package, based on the analysis of the impact of different demonstration
projects, so its expected impacts have a different approach than those expected in each individual demo
project.
The impacts, classified in different points of view are the following ones:
• Analysis results: The most significant impact of WP13 is the result of the evaluation of the combined impact of the demonstrated innovations in the European power system.
• Innovations validation processes: The procedures, tools and methodologies developed in the project and validated in WP13, aiming at validating new technologies assessing their contribution to the improvement of the network, can be considered one of the impacts brought by WP13. The method developed will allow evaluating technically and economically future new implementations.
• Grid management and operation: WP13 results will determine whether the innovations tested in the project are suitable for implementation in a post-demo stage. In positive case, each innovation implementation will involve an impact on the grid management and operation (addressed in the corresponding section of this report).
• Grid planning: WP13 results will determine whether the innovations tested in the project are suitable for implementation in a post-demo stage. In positive case, each innovation implementation will involve an impact on the grid planning (addressed in the corresponding section of this report).

D2.1 - Data set, KPIs, tools & methodologies for impact assessment
Page 81 of 142
• Renewable energy integration: The result of WP13 will determine whether the demonstrated technologies contribute to the improvements of level 1 and 2 KPIs. If satisfactory results are obtained, a relevant step towards increasing the RES hosting capacity of the pan-European network will be taken.
• Grid codes: The result of WP13 will determine whether the demonstrated technologies could contribute to the improvements of level 1 and 2 KPIs. In case of grid codes compliance might become one of the barriers to be overcome for the final implementation of one of the innovations, and its impact analysis concludes predicting a significant improvement, a review of the affected grid codes (as a barrier) might be proposed.
-Demonstration barriers to overcome:
The main barriers to be overcome for the achieving of the objectives of WP13 are the following ones:
• Difficulties in obtaining the data needed to define and model the reference network for performing simulation analyses.
• Difficulties in obtaining in time the field data from demo sites for performing the replicability and scalability analyses.
• Constraints for the demonstration sites due to other factors outside the control of Best Paths, which could cause delays and/or complications in the results to be received by WP13.
• Uncertainties related to the European economic environment and its previsions, which could jeopardize the robustness of CBA performed in WP13.
• Confidentiality issues. Although unexpected, confidentiality reasons could prevent some partners to share data which could be necessary for completing WP13 tasks.
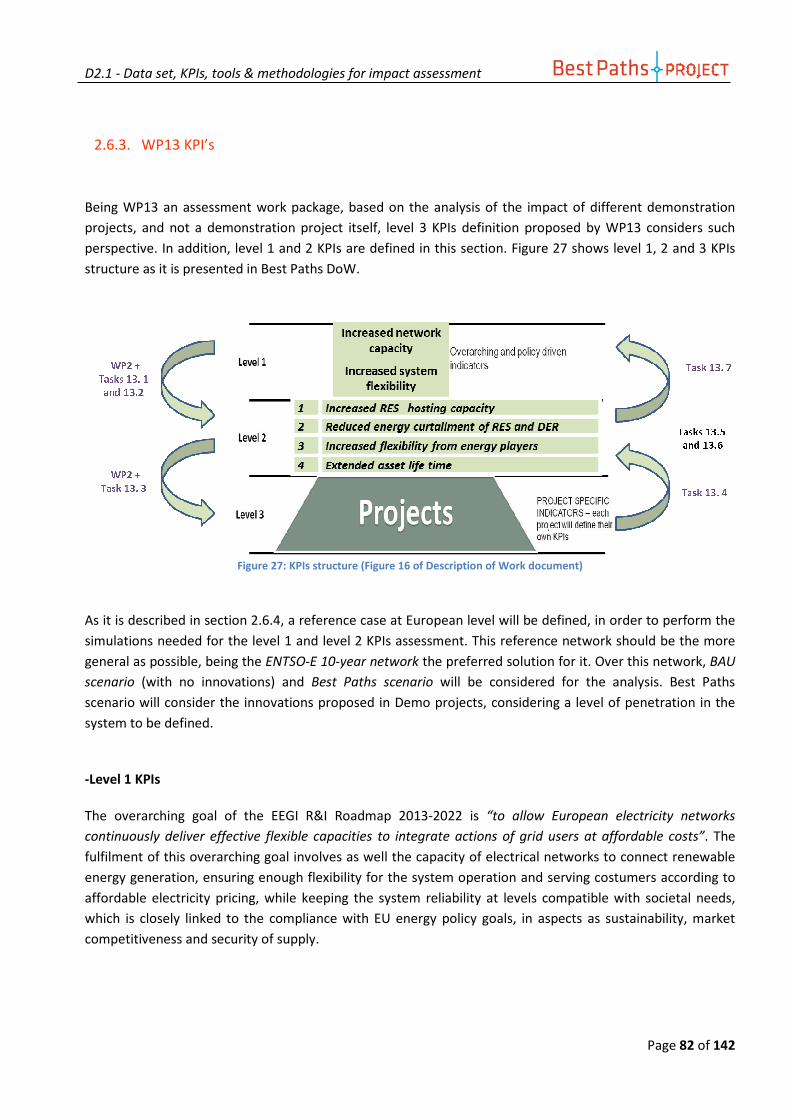
D2.1 - Data set, KPIs, tools & methodologies for impact assessment
Page 82 of 142
2.6.3. WP13 KPI’s
Being WP13 an assessment work package, based on the analysis of the impact of different demonstration
projects, and not a demonstration project itself, level 3 KPIs definition proposed by WP13 considers such
perspective. In addition, level 1 and 2 KPIs are defined in this section. Figure 27 shows level 1, 2 and 3 KPIs
structure as it is presented in Best Paths DoW.
Figure 27: KPIs structure (Figure 16 of Description of Work document)
As it is described in section 2.6.4, a reference case at European level will be defined, in order to perform the
simulations needed for the level 1 and level 2 KPIs assessment. This reference network should be the more
general as possible, being the ENTSO-E 10-year network the preferred solution for it. Over this network, BAU
scenario (with no innovations) and Best Paths scenario will be considered for the analysis. Best Paths
scenario will consider the innovations proposed in Demo projects, considering a level of penetration in the
system to be defined.
-Level 1 KPIs
The overarching goal of the EEGI R&I Roadmap 2013-2022 is “to allow European electricity networks
continuously deliver effective flexible capacities to integrate actions of grid users at affordable costs”. The
fulfilment of this overarching goal involves as well the capacity of electrical networks to connect renewable
energy generation, ensuring enough flexibility for the system operation and serving costumers according to
affordable electricity pricing, while keeping the system reliability at levels compatible with societal needs,
which is closely linked to the compliance with EU energy policy goals, in aspects as sustainability, market
competitiveness and security of supply.
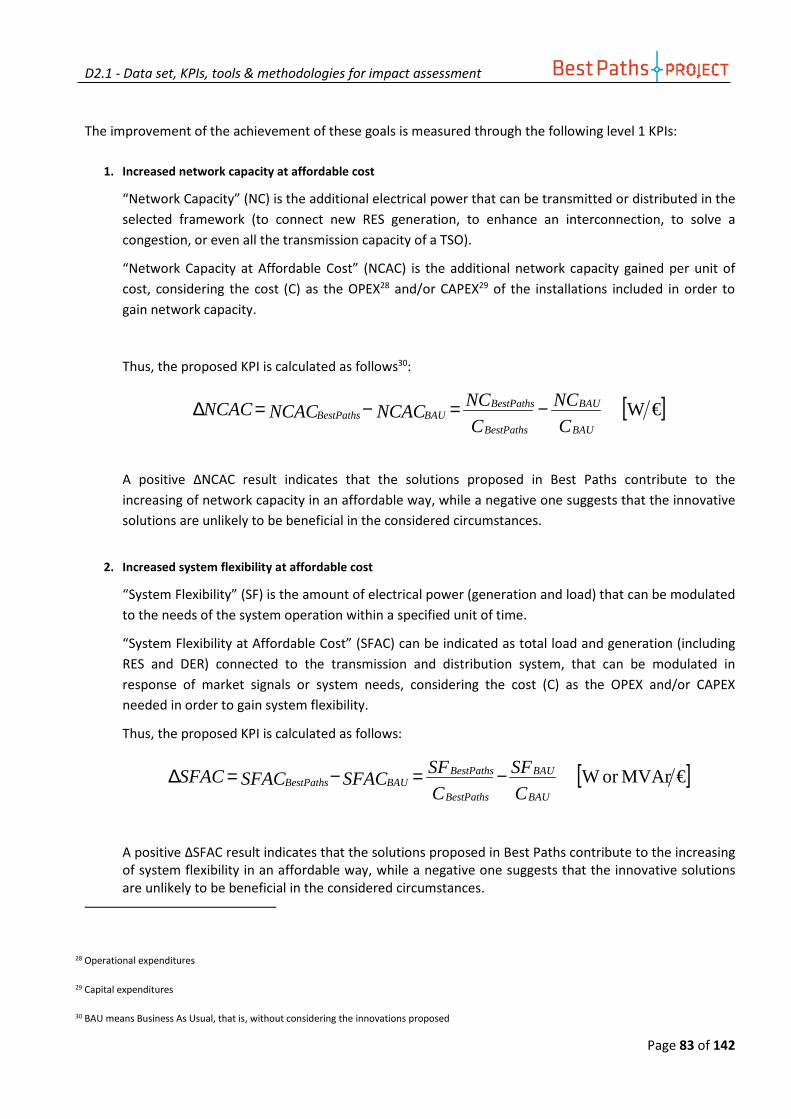
D2.1 - Data set, KPIs, tools & methodologies for impact assessment
Page 83 of 142
The improvement of the achievement of these goals is measured through the following level 1 KPIs:
1. Increased network capacity at affordable cost
“Network Capacity” (NC) is the additional electrical power that can be transmitted or distributed in the
selected framework (to connect new RES generation, to enhance an interconnection, to solve a
congestion, or even all the transmission capacity of a TSO).
“Network Capacity at Affordable Cost” (NCAC) is the additional network capacity gained per unit of
cost, considering the cost (C) as the OPEX28 and/or CAPEX29 of the installations included in order to
gain network capacity.
Thus, the proposed KPI is calculated as follows30:
[ ]€W C
NC
C
NCNCACNCACNCAC
BAU
BAU
BestPaths
BestPathsBAUBestPaths −=−=∆
A positive ΔNCAC result indicates that the solutions proposed in Best Paths contribute to the
increasing of network capacity in an affordable way, while a negative one suggests that the innovative
solutions are unlikely to be beneficial in the considered circumstances.
2. Increased system flexibility at affordable cost
“System Flexibility” (SF) is the amount of electrical power (generation and load) that can be modulated
to the needs of the system operation within a specified unit of time.
“System Flexibility at Affordable Cost” (SFAC) can be indicated as total load and generation (including
RES and DER) connected to the transmission and distribution system, that can be modulated in
response of market signals or system needs, considering the cost (C) as the OPEX and/or CAPEX
needed in order to gain system flexibility.
Thus, the proposed KPI is calculated as follows:
[ ]€MVAror W C
SF
C
SFSFACSFACSFAC
BAU
BAU
BestPaths
BestPathsBAUBestPaths −=−=∆
A positive ΔSFAC result indicates that the solutions proposed in Best Paths contribute to the increasing of system flexibility in an affordable way, while a negative one suggests that the innovative solutions are unlikely to be beneficial in the considered circumstances.
28 Operational expenditures
29 Capital expenditures
30 BAU means Business As Usual, that is, without considering the innovations proposed

D2.1 - Data set, KPIs, tools & methodologies for impact assessment
Page 84 of 142
-Level 2 KPIs
Increasing network capacity and/or system flexibility can be further monitored through different specific
KPIs, which are the level 2 KPIs:
• Increased RES and DER hosting capacity
The RES/DER hosting capacity (HC) is the total installed capacity of RES/DER that can be connected
without endangering system stability and reducing system reliability.
The proposed KPI is calculated as follows:
[ ]% 100% xHC
HCHCEHC
BAU
BAUBestPaths −=
Where EHC means enhanced hosting capacity.
It has to be considered that though a RES/DER project is accepted for connection, there is no
guarantee of curtailment or tripping under given circumstances in order to maintain a secure network
operation. This curtailment part is covered in other KPI.
• Reduced energy curtailment of RES and DER
Due to network technical problems such as overvoltage, overfrequency, local congestion, etc.,
RES/DER production can be curtailed partially or totally, i.e. tripped. An objective of the proposed
innovations is to provide solutions to reduce and minimize shedding of RES/DER, while still maintaining
system security and reliability.
The proposed KPI is calculated as follows:
[ ]% 100
% x
E
EEE
tcurtailmen
tcurtailmentcurtailmentcurtailmen
BAU
BAUBestPaths−
=
The energy curtailment considered is due to network problems. Other problems that are out of control
of network operators are not included such as storm, break down of generators or plant maintenance.
3. Increased flexibility from energy players
Flexibility is an indication of the ability of the electricity system to respond to (and balance) supply and
demand in real time. Flexibility already exists and is reliably used, but increasing the presence of
variable renewables involves greater need for and different management of electricity flows.
Therefore, along with an increase of renewable energies penetration, increase of flexibility is one of
the objectives of the future network.
As the need for flexibility increases, dispatchable generation technologies are not enough to guarantee
it and additional factors are needed, such as increased interconnection capability, storage and demand
response.

D2.1 - Data set, KPIs, tools & methodologies for impact assessment
Page 85 of 142
For the TSO, increased network flexibility would be a measure of additional RES/DER participation in flexibility
services. It is also an indication of the introduction of cost effective balancing technologies for these services. The
KPIs can thus be defined as:
( ) ( )P
PPNF
Total
RES BAURES BestPaths −=∆
( )( )P
PRPI
tTotal BAU
tTotal BestPaths
cos_
cos_=
Where,
NFΔ is the increased network flexibility
PRES is the amount of renewable capacity participating in balancing
PTotal is the total reserve capacity required to balance the area under evaluation
RPI is the Reserve Price Index
PTotal_cost is the average cost of the reserve capacity
4. Extended asset life time
This indicator deals with the increase of the life-time of assets. Some of the innovations to be
demonstrated will avoid congestion situations, which will contribute to this idea.
The proposed KPI (ILA, Improved Life-Time of Assets) can be calculated by looking at the total cost of
exploiting a given group of assets, both the capital expenditure as well as the operational
expenditure31:
)(
)()(
OPEXCAPEXOPEXCAPEXOPEXCAPEX
ILABAUBAU
BestPathsBestPathsBAUBAU
++−+
=
Replacement costs (RC), which are included in the CAPEX, can be reduced as a consequence of the
improvements given by the innovations. New elements derived from the project may increase the
expense in OPEX (more monitoring, supervision, predictive or reliability-centred maintenance, etc.).
However, this extra expense in OPEX should justify or compensate the reduction in RC.
This indicator may also be evaluated by looking only at the replacement costs (RC) in a business as
usual situation and in a situation where new asset management policies (from R&I projects) have been
applied:
CAPEX
RCRCILA
BAU
BestPathsBAU −=
31 The values involved in the calculation need to be Net Present Value (NPV) ones in order to perform an appropriate comparison
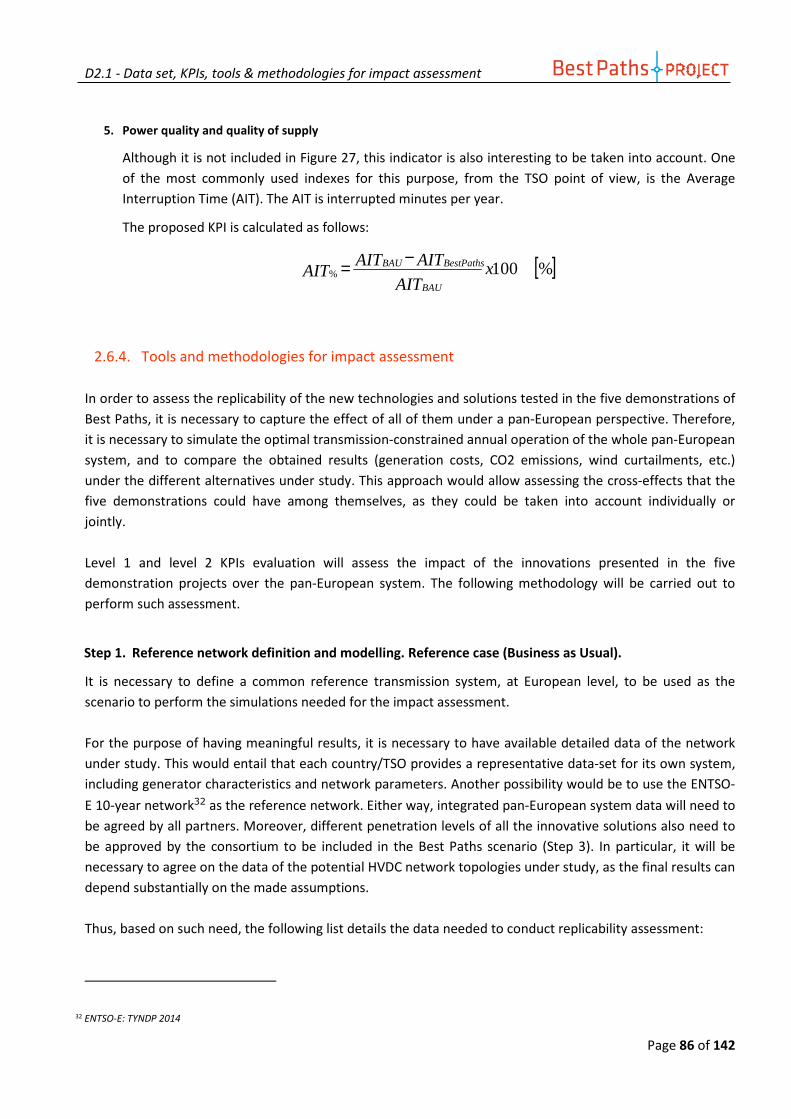
D2.1 - Data set, KPIs, tools & methodologies for impact assessment
Page 86 of 142
5. Power quality and quality of supply
Although it is not included in Figure 27, this indicator is also interesting to be taken into account. One
of the most commonly used indexes for this purpose, from the TSO point of view, is the Average
Interruption Time (AIT). The AIT is interrupted minutes per year.
The proposed KPI is calculated as follows:
[ ]% 100% xAIT
AITAITAIT
BAU
BestPathsBAU −=
2.6.4. Tools and methodologies for impact assessment
In order to assess the replicability of the new technologies and solutions tested in the five demonstrations of
Best Paths, it is necessary to capture the effect of all of them under a pan-European perspective. Therefore,
it is necessary to simulate the optimal transmission-constrained annual operation of the whole pan-European
system, and to compare the obtained results (generation costs, CO2 emissions, wind curtailments, etc.)
under the different alternatives under study. This approach would allow assessing the cross-effects that the
five demonstrations could have among themselves, as they could be taken into account individually or
jointly.
Level 1 and level 2 KPIs evaluation will assess the impact of the innovations presented in the five
demonstration projects over the pan-European system. The following methodology will be carried out to
perform such assessment.
Step 1. Reference network definition and modelling. Reference case (Business as Usual).
It is necessary to define a common reference transmission system, at European level, to be used as the
scenario to perform the simulations needed for the impact assessment.
For the purpose of having meaningful results, it is necessary to have available detailed data of the network
under study. This would entail that each country/TSO provides a representative data-set for its own system,
including generator characteristics and network parameters. Another possibility would be to use the ENTSO-
E 10-year network32 as the reference network. Either way, integrated pan-European system data will need to
be agreed by all partners. Moreover, different penetration levels of all the innovative solutions also need to
be approved by the consortium to be included in the Best Paths scenario (Step 3). In particular, it will be
necessary to agree on the data of the potential HVDC network topologies under study, as the final results can
depend substantially on the made assumptions.
Thus, based on such need, the following list details the data needed to conduct replicability assessment:
32 ENTSO-E: TYNDP 2014
D2.1 - Data set, KPIs, tools & methodologies for impact assessment
Page 87 of 142
• Reference network data which is agreed by all partners (circuit R, X, B, maximum capacity of each line, bus to bus, generator to bus mapping)
• Candidate AC repowering lines and candidate VSC-MTDC systems (converter information and topology such as ring-shaped, heavily meshed, etc.)
• Generator information (technical limits, operational limits such as total capacity limit, ramping capacity, minimum and maximum production level, minimum up and down time, etc.) and yearly generation information on an hourly basis (each generator ),
• General/representable wind farms production information (production level through the year, yearly wind speed information since stochasticity/uncertainties will be taken into account, etc.), as well as wind production information on North Sea specifically
• Representable yearly consumption level (for all nodes) of the entire considered region, i.e., pan-European
• Potential Grid Code that would be issued due to proposed demos (repowered AC corridors and VSC-MTDC systems) since it can act as constraints in the model during power flow analysis
In case it were not possible to obtain all the data included in the list, simplifications and estimations will be
performed in order to carry out the assessments.
The selected network will be modelled in appropriated simulation platforms that allow performing the
necessary simulations (mentioned in Step 4) for obtaining the required data to evaluate level 1 and level 2
KPIs. Therefore, according to the KPIs definitions included in section 2.6.3, both a conventional case
(Business As Usual), without the innovations presented in this project, and an R&I case (Best Paths scenario)
considering the implementation of the improvements demonstrated, will be modelled.

D2.1 - Data set, KPIs, tools & methodologies for impact assessment
Page 88 of 142
Step 2. Determine the level 1 and level 2 KPIs impacted by the expected results of the Demo projects.
According to the expected impact derived from the implementation of the results obtained by each demo
project (defined in their respective sections of this document), an identification of the affected level 1 and
level 2 KPIs affected by the whole project is done. Table 17 summarizes this estimated identification. A brief
qualitative explanation on how each demo project can impact each level 1 and level 2 KPI is given next.
Affected Level 1 KPIs Affected Level 2 KPIs
Increased network
capacity at affordable
cost
Increased system
flexibility at
affordable cost
Increased RES and
DER hosting capacity
Reduced energy
curtailment of RES and
DER
Increased flexibility
from energy players
Extended asset life
time
Power quality
and quality of
supply
D1
Proposed multi-
terminal HVDC
configurations
x x x x x
D2
Proposed HVDC
configurations
with multi-vendor
interoperability
x x x x x
D3
HVDC VSC x
HTLS DC
conductors x x x x x
DC extruded
submarine cables x x x x x
DC fault location x
D4
HTLS AC lines &
insulated cross-
arms
x x x x x
Dynamic line
rating x x x x x x
Live line working ? x
D5 HVDC
superconductor x x x x x
Table 17: Relationship between Demo projects expected impacts and level 1 and level 2 KPIs
• Demo 1. According to the expected impacts of this demo, explained in section 2.6.2 which could be
summarized in the future availability of a set of HVDC multi-terminal topologies that will enable the
interconnection of large offshore wind farms, the following level 1 and level 2 KPIs are expected to be
affected:

D2.1 - Data set, KPIs, tools & methodologies for impact assessment
Page 89 of 142
o Level 1 KPI 1. Increased network capacity at affordable cost. HVDC multi-terminal links can
contribute significantly to the increase of network capacity (defined in section 2.6.3) in offshore
networks, being these networks the objective implementation of Demo 1, but also in onshore
transmission networks. Therefore the impact of Demo 1 on this level 1 KPI will be analysed.
o Level 1 KPI 2. Increased system flexibility at affordable cost. The meshed HVDC configurations
proposed in Demo 1 will allow to evacuate the power generated by offshore windfarms through
substations of the European transmission system which can be geographically distant. From a pan-
European system point of view, this can represent a flexibility feature, as generation could be
directed to the areas where it is more demanded (respecting the topologies limitations).
o Level 2 KPI 1. Increased RES and DER hosting capacity. The different topologies for HVDC
interconnections proposed in the Demo along with the increased knowledge on the integration of
offshore windfarms is expected to involve an increase in the wind energy hosting capacity, thus
meaning a direct impact on this level 2 KPI, which will be analysed.
o Level 2 KPI 2. Reduced energy curtailment of RES and DER. The enhancement of the level of
integration of offshore windfarms along with the development of multi-terminal HVDC networks
will help to avoid problems such as local congestions which could lead to RES energy curtailment.
Therefore Demo 1 improvements are expected to contribute to reduce these curtailments, as it will
be analysed.
o Level 2 KPI 3. Increased flexibility from energy players. As it is explained in section 2.1, the increased
interconnection capacity can contribute to increase flexibility. In this sense, HVDC topologies
developed in Demo 1 can contribute to increase interconnection capacity at pan-European level
therefore having an impact on this level 2 KPI.
• Demo 2. The objective of this Demo, as it is explained in section 2.2, is to maximize the interoperability
for multi-vendor VSC-HVDC solutions and, from the point of view of the power system, to propose
solutions to transmission networks to facilitate massive integration of renewable energy. Therefore,
although from a different approach, the relationship between Demo 2 and level 1 and level 2 KPIs is
similar to the one defined for Demo 1; Thus, the affected KPIs are the following:
o Level 1 KPI 1. Increased network capacity at affordable cost. HVDC multi-terminal links can
contribute significantly to the increase of network capacity, as it is explained regarding Demo 1.
o Level 1 KPI 2. Increased system flexibility at affordable cost. The meshed HVDC configurations
proposed in Demo 2 will allow increasing onshore and offshore interconnection capacity, which can
contribute to increase system flexibility.
o Level 2 KPI 1. Increased RES and DER hosting capacity. Similarly to Demo 1, the different topologies
for HVDC interconnections proposed in the Demo are expected to involve an increase in the
renewable energy hosting capacity, thus meaning a direct impact on this level 2 KPI, which will be
analysed.
D2.1 - Data set, KPIs, tools & methodologies for impact assessment
Page 90 of 142
o Level 2 KPI 2. Reduced energy curtailment of RES and DER. The development of multi-terminal
HVDC networks will help to avoid problems such as local congestions which could lead to RES
energy curtailment. Therefore Demo 2 improvements are expected to contribute to reduce these
curtailments, as it will be analysed.
o Level 2 KPI 3. Increased flexibility from energy players. As it is explained in section 2.2, the increased
interconnection capacity can contribute to increase flexibility. In this sense, HVDC topologies
developed in Demo 2 can contribute to increase interconnection capacity at pan-European level
therefore having an impact on this level 2 KPI.
• Demo 3. This Demo project involves different activities within the framework of SACOI HVDC link.
According to their expected impacts, the affected level 1 and level 2 KPIs are:
o Level 1 KPI 1. Increased network capacity at affordable cost. Improvements in both overhead HTLS
DC conductors and DC extruded submarine cables, can involve an impact on this level 1 KPI.
o Level 1 KPI 2. Increased system flexibility at affordable cost. The increase of capacity to be achieved
for overhead HTLS DC conductors could allow to use them in interconnections, thus allowing
increasing interconnection capacity, which can contribute to increase system flexibility.
o Level 2 KPI 1. Increased RES and DER hosting capacity. The expected contribution to increase HVDC
links capacity, including interconnections, as well as improvements in HVDC VSC converters can
involve an increase in the renewable energy hosting capacity, thus meaning an impact on this level
2 KPI.
o Level 2 KPI 2. Reduced energy curtailment of RES and DER. The increase in HVDC links capacity will
help to avoid local congestions contributing to reduce RES energy curtailment. Therefore Demo 3
improvements are expected to contribute to reduce these curtailments.
o Level 2 KPI 3. Increased flexibility from energy players. As it is explained in section 2.3, the increased
interconnection capacity can contribute to increase flexibility. In this sense, developments in HTLS
DC conductors can contribute to increase interconnection capacity at pan-European level therefore
having an impact on this level 2 KPI.
o Level 2 KPI 5. Power quality and quality of supply. DC fault location techniques that will be
addressed in Demo 3 will allow to reduce outage times in case of fault in DC cables, which can have
an impact on the average interruption time and therefore on this level 2 KPI.
• Demo 4. In this Demo project different activities related to the repowering of AC corridors are involved.
According to their expected impacts, the affected level 1 and level 2 KPIs are:

D2.1 - Data set, KPIs, tools & methodologies for impact assessment
Page 91 of 142
o Level 1 KPI 1. Increased network capacity at affordable cost. Research in HTLS AC conductors, as
well as in insulated cross-arms and dynamic line rating is aimed at increasing the net transfer
capacity at affordable cost, so this level 1 KPI is expected to be affected.
o Level 1 KPI 2. Increased system flexibility at affordable cost. The increase of capacity to be achieved
for AC corridors will allow increasing interconnection capacity, which can contribute to increase
system flexibility.
o Level 2 KPI 1. Increased RES and DER hosting capacity. The expected contribution to increase AC
corridors capacity, including interconnections, can involve an increase in the renewable energy
hosting capacity of the pan-European transmission system.
o Level 2 KPI 2. Reduced energy curtailment of RES and DER. The increase in AC corridors capacity will
help to avoid local congestions contributing to reduce RES energy curtailment.
o Level 2 KPI 3. Increased flexibility from energy players. The increased interconnection capacity can
contribute to increase flexibility. In this sense, repowering of AC corridors can contribute to
increased interconnection capacity at pan-European level therefore having an impact on this level 2
KPI.
o Level 2 KPI 4. Extended asset life time. One of the objectives of Demo 4 is to increase the capacity of
existing AC corridors reducing the needs for constructing new lines. Likewise, dynamic line rating
techniques and improved working processes will be developed. Therefore, there will be an impact
on this KPI, as life time of existing asset can be increased, reducing replacement costs.
• Demo 5. According to the expected impacts of the HVDC superconductor research, the affected level 1
and level 2 KPIs are:
o Level 1 KPI 1. Increased network capacity at affordable cost. The main advantage of the HVDC
superconductor cable is the increased transmission capacity that it provides, so this level 1 KPI will
be analysed.
o Level 1 KPI 2. Increased system flexibility at affordable cost. The increase of capacity to be achieved
by HVDC superconductor could allow increasing interconnection capacity, which can contribute to
increase system flexibility.
o Level 2 KPI 1. Increased RES and DER hosting capacity. The expected contribution to increase the
capacity of some links, including eventually interconnections, can involve an increase in the
renewable energy hosting capacity of the pan-European transmission system.
o Level 2 KPI 2. Reduced energy curtailment of RES and DER. The increase in capacity will help to
avoid local congestions contributing to reduce RES energy curtailment.

D2.1 - Data set, KPIs, tools & methodologies for impact assessment
Page 92 of 142
o Level 2 KPI 3. Increased flexibility from energy players. The increased interconnection capacity can
contribute to increase flexibility. In this sense, superconductive links can contribute to increase
interconnection capacity at pan-European level, consequently having an impact on this level 2 KPI.
Step 3. Best Path scenario definition and modelling based on level 3 KPI assessments for each Demo
project.
As it is advanced in Step 1 description, a pan-European scenario which considers the implementation of the
innovations and improvements achieved by each Demo project will be defined for the impact assessment.
Such scenario is referred to in this section as “Best Paths scenario”.
Finding the right balance between the level of accuracy of the model, the data availability, and the
computational burden is crucial. Therefore, it is proposed to follow the next points to define the model of
the Best Paths scenario:
1) Define the decision variables, the temporal horizon, and the time representation. As the objective is
to assess one-year operation of the system, investment decisions in new generation capacity or new
lines will not be considered. Therefore, the main decision variables will be the unit-commitment and
power dispatch of generation units, and the power flows through all the lines (both AC and DC). In
order to assess different generation and/or transmission expansion plans, they can be introduced as
input-data to the model and the corresponding solution can provide interesting information about its
profitability. Regarding the temporal horizon, a whole year operation will be modelled. However,
given that the size of the resulting problem can be intractable, it is proposed to define a number of
representative snapshots (one hour, one-day, one-week, depending of the final size of the problem)
and to extrapolate the results for the whole year.
2) Define the meaning of “optimal” in the sense that several objective functions could be used. In this
case, the objective function will be to minimize the global operational costs. Market power or
strategic behaviour or market participants will not be modelled, assuming that the results reflect a
perfect competitive framework, and that such results are not biased by any particular market design.
3) Formulate the constraints of the model that allow modelling properly the effect of the
demonstrations on the whole system. On the one hand, given the predominant role of the
transmission system in Best Paths, it is necessary to avoid oversimplified approaches such as
representing every country by just a single node and to define Net Transfer Capacity (NTC) values
among neighbouring countries. The detailed representation of the pan-European network is crucial
in order to capture how the presence of new corridors (HVDC or AC) can influence the power
dispatch among the different regions considered in the analysis. On the other hand it is necessary to
model the interaction of both the AC and the HVDC network. This is currently a hot topic of research,
and it is proposed to include in the model the possibility of having the following configurations,
which cover the different DC topologies that will be most likely used in the future to transmit
offshore wind power.
• Back to Back configuration

D2.1 - Data set, KPIs, tools & methodologies for impact assessment
Page 93 of 142
• AC coupling configuration: AC outputs of the offshore converter stations are connected forming a unique AC grid
• VSC-HVDC multi-terminal link: converter stations are coupled at the DC side forming a multi-terminal link
• VSC-HVDC meshed: converter stations are connected forming a meshed DC grid on the DC sides
The results of the level 3 KPI assessments for each Demo project will provide needed assumptions that will
allow defining the Best Paths scenario and quantifying the impacts envisaged in Step 2. Accordingly,
specifications related to each demo shall be decided, to characterize the Best Paths scenario that will be
modelled as a variation of the reference case defined in Step 1. Specifically, to assess the replicability of
innovative solutions in the entire pan-European system (i.e., the coexistence of large AC transmission
corridors and Multi-Terminal HVDC grids), it will be necessary to identify a number of candidate MT-HVDC
interconnections, and AC transmission lines.
Thus, next are described some relevant results needed from each Demo project (that will be obtained from
each Demo level 3 KPIs):
• Demo 1.
o Most appropriate33 HVDC multi-terminal topologies.
o Rated values for which above conclusion is obtained (voltage level, transmission capacities, etc.).
Additionally, the level of penetration of decided HVDC multi-terminal links will be determined, as well
as their location, to be included in the Best Paths scenario model.
• Demo 2.
o Most appropriate34 HVDC multi-terminal topologies (once saved multivendor interoperability
issues).
o Rated values for which above conclusion is obtained (voltage level, transmission capacities, etc.).
Additionally, the level of penetration of decided HVDC multi-terminal links will be determined, as well
as their location, to be included in the Best Paths scenario model.
• Demo 3.
o Transmission capacity of HTLS DC overhead line (and rated values).
o Transmission capacity of DC submarine cable (and rated values).
o Time needed for fault location in DC cables.
Additionally, the level of penetration of HTLS DC overhead lines and DC submarine cables proposed in
the Demo will be decided, as well as their location, to be included in the Best Paths scenario model.
33 Or, if it is the case, confirmation that all the topologies studied in the demo fulfil all the requirements. 34 Or, if it is the case, confirmation that all the topologies studied in the demo fulfil all the requirements.

D2.1 - Data set, KPIs, tools & methodologies for impact assessment
Page 94 of 142
• Demo 4.
o Transmission capacity of repowered existing AC corridors (and rated values), associating it to each
use case studied.
o Increase of line availability achieved by life line working research.
Likewise, the level of penetration of HTLS AC overhead lines and dynamic line rating techniques will be
decided, as well as their location, to be included in the Best Paths scenario model.
• Demo 5.
o Transmission capacity of HVDC superconductor links (and rated values).
o Maximum length of HVDC superconductor cables (considering long systems research to be
performed in the Demo).
Likewise, the level of penetration of HVDC superconductor cables, as well as their location and length
will be decided, to be included in the Best Paths scenario model.
Step 4. Definition of the simulations needed for the evaluation of level 1 and level 2 KPIs
To obtain the optimal transmission-constrained operation of the whole pan-European system for a whole
year it is necessary to perform detailed power flow studies. By comparing the results obtained both with
(Best Paths scenario) and without (BAU scenario) the innovative solutions, the impact assessment can be
carried out. However, several intrinsic difficulties must be taken into account:
• The time dimension: in order to make the assessment representative, power flow studies need to be
done for each hour within the studying period, taking into account different system conditions that
involve uncertainty. Theoretically speaking, analyzing each hour independently is not enough, as many
constraints link the operation decisions of different hours. For a particular scenario, (i.e. a given set of
forecasted demand, installed generation capacity, hydro availability, wind and PV production
hypothesis, and a given network topology) a single run for a whole year would include the analysis of
8760 temporally coupled hourly periods.
• The spatial dimension: Line congestion can occur when one area’s wind generation exceeds a certain
quantity. Therefore, it is necessary to consider the spatial correlation among the generation of the
wind farms operating in such area. Moreover, a broader scope is required to perform a global analysis
considering that congestions could appear simultaneously in several areas.
• The level of detail of the considered network topologies: in order to run power flow analysis, the
network topology needs to be fixed. However, in order to avoid an excessive computational burden, it
will be necessary to find a balance between the complexity of the network model used, and the
accuracy of the obtained results when modelling the pan-European system.
D2.1 - Data set, KPIs, tools & methodologies for impact assessment
Page 95 of 142
Taken into account all the previous points, it is proposed to develop a linearized (or quadratized) Optimal
Power Flow model, where the various HVDC configurations can be properly represented (as mentioned in
Step 3), paying an special attention to the limits on the operation that can be derived from the converters. A
very interesting result of this approach will be the nodal-marginal costs that can be obtained as an outcome
of the optimization from the dual information of the nodal demand-balance equations. Thus, apart from the
technical operation of the network and the generators, it would be possible to obtain economic information
about the locational marginal costs, and how they could vary due to the enhanced network flexibility tested
in Best Paths.
On the other hand, the impact of enhancing the network flexibility can be studied under two perspectives:
• The effect within each one of the countries (or zones), and
• The effect on the cross-border flow between different areas
Within a country, better network flexibility can lead a more efficient use of generation resources. While inter
exchange of cross-border power flows would also have a positive effect. Facilitated by proposed new
technologies, presumably more power generated by renewable sources can be deployed.
This analysis would require a good understanding of the zones and scenarios to feed the tool, which include:
• Detailed network modelling of the regions (Step 3)
• Grid codes for day to day operational events
• Characteristics of the proposed technologies
To assess the replicability of innovative solutions in the entire pan-European system (i.e., the coexistence of
large AC transmission corridors and Multi-Terminal HVDC grids), the proposed methodology to perform the
impact assessment can be summarized as following:
1) Identify a number of candidate MT-HVDC interconnections, and AC transmission lines (as it is explained in Step 3)
2) Define a number of scenarios that are mostly likely emerged by 2030 under the scope of the entire pan-European network. Taken into account future network planning and wind power generation (installed capacity, location, etc.), representative scenarios will need to be defined with certain hypotheses
3) Prepare a number of yearly representative snapshots of the system and run the optimal power flow (pan European transmission-constrained model) under different conditions for each scenario. This implies that characterization of all generating units and demand at each node are necessary to perform power flow studies, along with network information, snapshots can be made.
4) A power flow analysis will be performed for selected scenarios. Results will be compared with and without proposed technologies. In this step, a DC optimal power flow model will be made to calculate the power flow of the AC and MT HVDC hybrid system, with different levels of penetration of innovative technologies

D2.1 - Data set, KPIs, tools & methodologies for impact assessment
Page 96 of 142
5) Evaluate the economic impact of having candidate Multi-terminal HVDC interconnections and certain AC transmission lines or not. Economic savings can be assessed and compared with investment costs. This analysis could also provide information on overloaded transmission lines and corridors.
6) Simulate the operation of the generation-transmission system considering a less detailed representation of the network, but capturing the inter-temporal links such as the stochastic unit-commitment decisions, hydrothermal coordination, etc. In this case, the emphasis will be done in capturing the effect of generation constraints.
Considering the abovementioned, an indicative description of the needed simulation work to be performed
for the assessment of each level 1 and level 2 KPI is the following:
• Level 1 KPI 1. Increased network capacity at affordable cost.
Once BAU and Best Paths scenarios have been defined in previous steps, power flow simulations will
allow comparing the network capacity for each of them. It is expected that HVDC links, AC corridors
repowering and superconductor cables (considering the topologies and level of penetration defined in
Step 3) involve a significant increase in network capacity. Cost related to each scenario must be used
to obtain the relative values, according to the expression detailed in section 2.6.3 for this KPI.
• Level 1 KPI 2. Increased system flexibility at affordable cost.
Power flow and dynamic simulations, including variations in generation/load will allow to determine
the flexibility brought by the HVDC-VSC improvements, multi-terminal HVDC networks and the
increased interconnection capacity achieved in the Best Paths scenario, compared to the BAU
scenario. As in previous KPI, estimated costs for each scenario will be needed.
• Level 2 KPI 1. Increased RES and DER hosting capacity.
Hosting capacity is evaluated from power flow simulations, obtaining the maximum power that can be
injected in the system without reaching technical limits (voltage/current). The performance of such
simulations in the base case and in the Best Paths scenario will assess the impact of the integrated
innovations in hosting capacity.
• Level 2 KPI 2. Reduced energy curtailment of RES and DER.
By means of power flow simulations, including contingences that can lead to voltage or congestion
problems, Best Path and BAU scenarios will be compared, obtaining the RES curtailments needed for
each case, according to TSOs’ general curtailment criteria.
• Level 2 KPI 3. Increased flexibility from energy players.
Similarly to what it is defined for level 1 KPI 2, power flow and dynamic simulations performed both in
BAU and in Best Paths scenarios will allow to compare the flexibility achieved to face contingences
such as sudden changes in local load demand. In Best Paths scenario, the increased interconnection
capacity and the multi-terminal HVDC networks are expected to allow RES participation in flexibility
services.
• Level 2 KPI 4. Extended asset life time.
D2.1 - Data set, KPIs, tools & methodologies for impact assessment
Page 97 of 142
Power flow simulations in BAU and Best Paths scenarios will give as a result a group of assets with
possible overloading problems, which can be linked with the ageing of such elements, thus having an
impact over the need of replacement of assets. Especially in Demo 4, some of the improvements to be
developed, such as dynamic line rating and live line working, can contribute in the increase of asset
lifetime. Therefore, the comparison of scenarios with and without the implementation of these
techniques over the same group of assets will allow calculating the reduction in costs, mainly due to
the possible reduction in replacement costs brought by the optimized use of the assets.
• Level 2 KPI 5. Power quality and quality of supply.
For this KPI short circuit events will be simulated in DC lines, in order to determine the average
interruption time for Best Paths scenario and for BAU case. Improvements in DC fault location should
result in a positive assessment of this KPI.
Step 5. Numeric evaluation of level 1 and level 2 KPIs
In the last step of the proposed methodology, the results obtained in the simulations indicated in Step 4 will
be included in the KPI equations defined in section 2.6.3. Additionally, as it has been remarked, economic
data related to CAPEX and OPEX associated to the implementations of the innovations as well as the costs
related to the business as usual scenario will be needed to complete the analysis.
Cost Benefit Analysis
The approaches and analyses developed by SINTEF in FP7-TWENTIES WP16.3 will be used as a starting point
in this task. A CBA methodology which combines the use of the EMPS market model and the PSST grid model
will be used for socio-economic assessments relating to the Level 2 and Level 1 KPIs in the project and split
up the contributions per country (consumer's surplus, producer's surplus, congestion rent etc.).
EMPS model is primarily designed to model the Scandinavian power system. However, the plan is to update
the input dataset of EMPS with the European dataset of PSST model. In the following sections, we will
describe the details of the toolboxes that are going to be used in this task:
• EMPS Model.
This model is a commercial model developed by SINTEF Energy Research and used for power market
simulation by most large actors in the Nordic power market. It is used for long-term scheduling of hydro-
thermal power as well as expansion planning of both generation and transmission. The EMPS model is a
socio-economic market simulator for the current or expected future power markets. The model allows for
hydro-thermal scheduling under uncertainty, treating e.g. inflows to reservoirs, wind power,
temperature-dependent load and exogenously given power prices as stochastic variables. It can also
model certificate markets and emission quotas.
o Input to the model.

D2.1 - Data set, KPIs, tools & methodologies for impact assessment
Page 98 of 142
The EMPS model can be used as a fundamental model, where power prices are endogenous while
prices for other energy carriers are exogenous. Execution of the model is based on a command line
interface.
The state of the power system and the elastic demand curve for electricity are deemed as inputs to
the model. Input details can be unit data for single generation units and loads or aggregated into
load and unit types. If detailed data is used also thermal start-up cost can be modelled increasing
the realism of the market prices in regions with thermal generation. All input data is based on files
in ASCII-format and operation of the model can also take place entirely based on scripting, both
regarding input and execution of the model. Rerunning a case updating results is easy while setting
up a new case requires experience and knowledge on an expert user level. Input consist mainly of
parameters and profiles with a minimum time resolution of one hour, but data such as energy
series for inflow to hydro reservoirs and wind power can be supplied either from files or from a
database.
o Features of the model.
The model is designed for the Scandinavian hydropower system and has a very sophisticated
modelling of hydropower and pumped storage including cascaded plants. As the model has gained
new application and the connections from the NordPool market towards Europe are expanded,
modelling of hydro-thermal and thermal systems has improved. Modelling includes:
- Modelling short- and long-term energy storage
- Modelling the stochastic inflows to hydro reservoirs.
- Modelling generation variation for wind and solar power.
- Future investment in hydro, thermal, wind and solar power.
- The model includes transmission system modelling, in terms of exchange possibilities, not a
physical representation of the electrical grid.
- Thermal generation with its marginal cost, known investment cost and local capacity, can
be added to the generation description. With detailed unit descriptions consequences of
start stop cost may be included in the model.
- Quota modelling for annual awarded quotas with flexible transitions between the years.
- Green certificate modelling.
o Results from the model.
Detailed data for each demand and generation option is available as well as discharge and water
flows for modelled watercourses. Results are generally extracted from binary results files using
either simple interfaces or scripts that arrange the data for use in spreadsheets. Other results are:
- Regional power prices
- Exchange between market areas
- Emissions of CO2, from thermal generation
- Quota and certificate prices
- Transmission losses/cost
D2.1 - Data set, KPIs, tools & methodologies for impact assessment
Page 99 of 142
In this project we plan to apply recently developed functionality to the EMPS model, which allows
the coupled market and transmission network problem. Results from the market model are
distributed to a detailed transmission network model to check for overloads on pre-selected
interfaces. In the case of overloads, linear power flow constraints are added to the original market
model. Thus, the model resembles the flow-based market clearing principle.
The main toolbox that we are going to use in this analysis is EMPS model and we plan to adapt the
input dataset of Power System Simulation Tool (PSST) to EMPS. For this reason in the following part
we briefly explain the structure of input dataset that has been used in PSST model.
PSST model is a post-analysis of EMPS model to take into account the effect of detailed grid model
to dispatch hydropower stations located in different parts of the grid. The integrated common
market for continental Europe for a given time step (one hour) is solved as a linear optimisation
problem to minimise the production cost taking into account the characteristics of the underlying
transmission grid.
The input dataset of PSST covers a large power system including the detail grid model for the whole
continental European system. In order to model the representative loop flows in high meshed grid
especially in the central continental system, NTC values made available by ENTSO-E are set as
constraints for the power flow between countries.
Electricity suppliers are categorized into different types of producers, i.e., nuclear, coal (lignite coal
and hard coal), gas-fired, oil, hydro, pump storage, wind, and renewables other than wind.
The simulation includes market clearing at each hour of the simulation period which is normally
one year consisting 8760 consecutive hours. The model includes time dependent varying inputs
such as water values, hydro inflow, load changes, and forecasted wind power variation at each
hour. Production costs and capacities for all production units are given exogenously. The marginal
costs of hydro units (water values) are imported from the EMPS model as exogenous inputs. Water
values reflecting the expected marginal value of the other types of production that the hydro
generators substitute are determined based on the reservoir level and the time of the year. Hence,
the matrix of water values is a function of reservoir level and the time of year for strategic use of
hydro stored in the reservoir.

D2.1 - Data set, KPIs, tools & methodologies for impact assessment
Page 100 of 142
Annex 1. List of Acronyms
AC Alternating Current
ACSR Aluminium Conductor Steel Reinforced
AIT Average Interruption Time
AMICO Artificially Moistened Insulator for Cleaning Organization
BAU Business As Usual
CAPEX CAPital EXpenditures
CBA Cost Benefits Analysis
CC Coated Conductors
CCS Continental Central South
CENELEC Comité Européen de Normalisation Electrotechnique
CIGRE Conseil International des Grands Réseaux Électriques
CSC Current Source Converter
DC Direct Current
DCCB DC Circuit Breaker
DER Distributed Energy Resources
DLR Dynamic Line Rating
DoW Document of Work
EEGI European Electricity Grid Initiative
EMTP Electro Magnetic Transient Program
ENTSO-E European Network of Transmission System Operators for Electricity
ESDD Equivalent Salt Deposit Density
FEM Finite Element Method
FP Frame Programme
FRT Fault Ride Through
HTLS High Temperature Low Sag
HTM Hydrophobicity Transfer Mechanism
HTS High Temperature Superconductors
HV High Voltage
HVDC High Voltage Direct Current
IEC International Electromechanical Commission
IEEE Institute of Electrical and Electronics Engineers
KPI Key Performance Indicator
LCC Line-Commutated Converters
LIPA Long Island Power Authority
LLW Live Line Working
MMC Modular Multi-level Converter
NCAC Network Capacity at Affordable Cost
NSDD Non-Soluble material Deposit Density
NTC Net Transfer Capacity
OHL OverHead Lines
OPEX OPerating EXpense
PCC Point of Common Coupling
PCI Projects of Common Interest

D2.1 - Data set, KPIs, tools & methodologies for impact assessment
Page 101 of 142
PSST Power System Simulation Tool
R&D Research and development
RC Replacement costs
RES Renewable Energy Sources
RTTR Real-Time Thermal Rating
SFAC System Flexibility at Affordable Cost
TB Technical Brochure
THD Total Harmonic Distortion
TSO Transmission System Operator
VSC Voltage Source Converter
WF Wind Farm
WP Work Package

www.best-paths.eu
EC-GA nº Project full title:
612748 BEyond State of the art Technologies for re-Powering AC corridors & multi-Terminal HVDC Systems


