
X-ray Techniques for Crystallinity Analysis
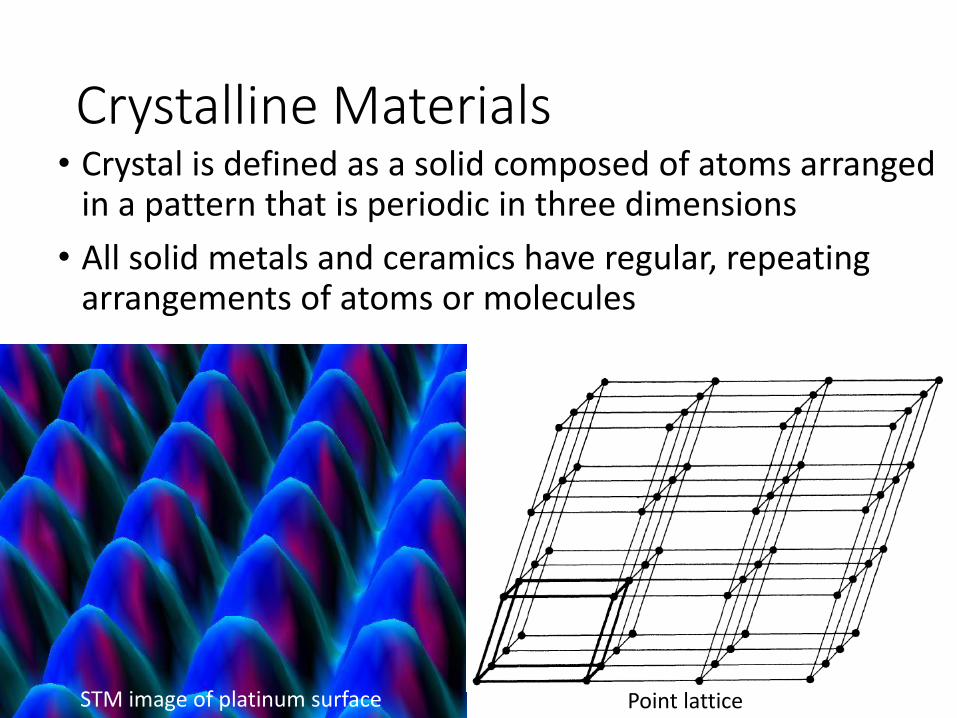
Crystalline Materials• Crystal is defined as a solid composed of atoms arranged
in a pattern that is periodic in three dimensions
• All solid metals and ceramics have regular, repeating arrangements of atoms or molecules
STM image of platinum surface Point lattice

Molecular Crystal Structure Theory
The first comprehensive molecular crystal structure theory was the creation of the AbbéRené Just Haűy (1743 – 1822).
Haűy, one of the few major scientists to be a catholic priest, had received a good scientific education and became interested in natural history (botany/mineralogy/crystallography).
In 1784, he published his Essai d’une théorie sur la structure des crystaux, based on the unit of the compound molécule intégrante, specific in shape and composition for every compound.
Haűy’s Theory: Molecules
Matter Theory: 2 Stage Molecular ModelCompound determinately-shaped polyhedral molécules
intégrantes built out of Elementary moléculesconstituantes whose shapes are not inferable
Crystal Structure Theory: 2 StageCore: Primitive form, constant and common to crystals of
same species, revealed by cleavage
Secondary (external) forms: Derived from primitive form by decrements (recessions) in each successive layer of molécules intégrantes by small integer number of molecules.
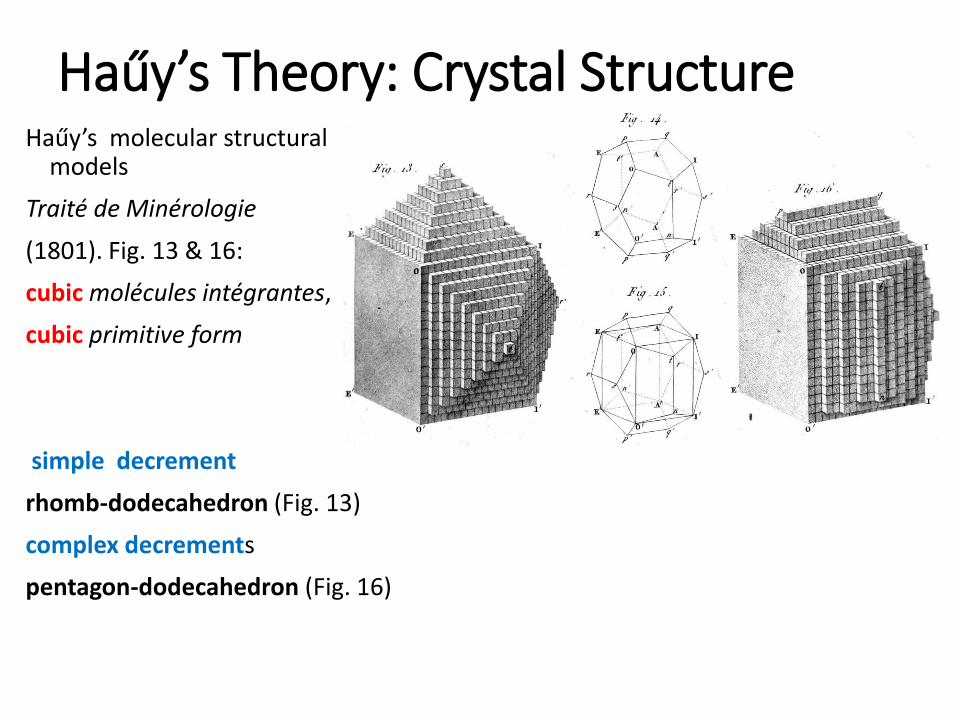
Haűy’s Theory: Crystal StructureHaűy’s molecular structural
models
Traité de Minérologie
(1801). Fig. 13 & 16:
cubic molécules intégrantes,
cubic primitive form
simple decrement
rhomb-dodecahedron (Fig. 13)
complex decrements
pentagon-dodecahedron (Fig. 16)

Crystalline Symmetry & SystemsThe over-riding focus in 19th-century
crystallography: abstract, mathematical considerations of crystalline symmetry.
This was initiated early in the 19th
century in Germany by Christian Samuel Weiss, (1780 – 1856) who preferred molecule models of crystal structure in favor of more dynamical ones, relating to axes of symmetry.
Influence of German Naturphilosophie.
Monoclinic & triclinic systems identified by Friedrich Mohs. Subsequently, the hexagonal system was divided into the trigonal and hexagonal, making 7 systems.
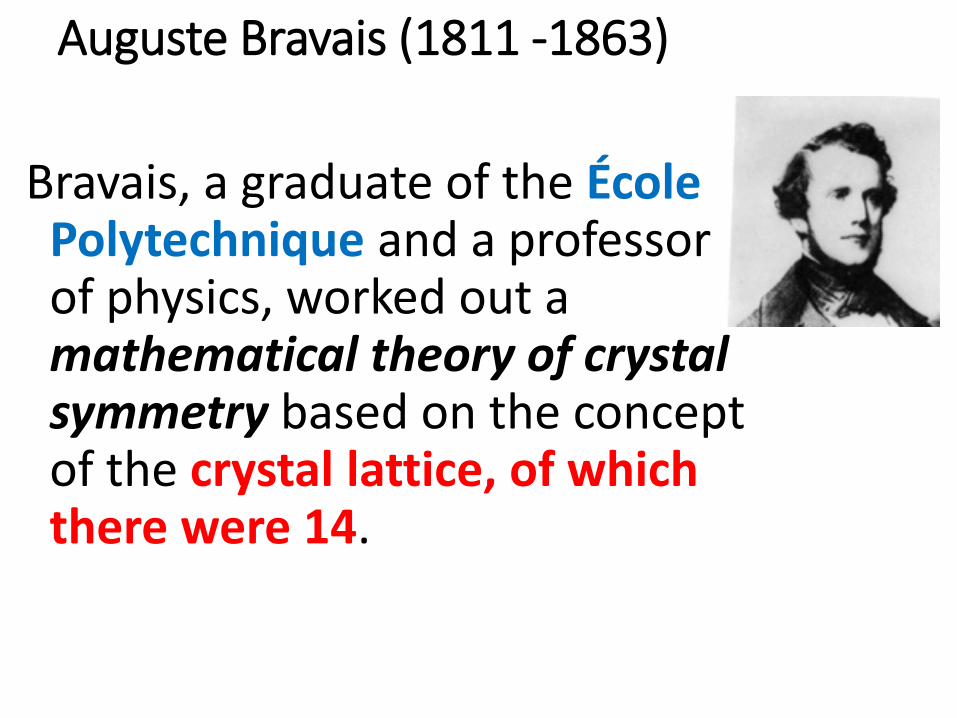
Auguste Bravais (1811 -1863)
Bravais, a graduate of the École Polytechnique and a professor of physics, worked out a mathematical theory of crystal symmetry based on the concept of the crystal lattice, of which there were 14.

Crystallography After BravaisDuring the remainder of the 19th century, the basis for modern crystal structure theory was development on the basis of Bravais’s formulation of crystal lattices.
These developments were largely mathematical and had little concern with the actual interpretation of atomic and molecular arrangement.

X-Ray Diffraction: April, 1912Von Laue designed an experiment in which
he placed a copper sulphate crystal between an X-ray tube and a photographic plate. His assistants, Walther Friedrich and Paul Knipping, carried out the experiment. After a few initial failures, they met with success on 23 April, 1912. X-rays passing through the crystal formed the pattern of bright spots that proved the hypothesis was correct.”
http://www.nobelprize.org/nobel_prizes/physics/laureates/1914/perspectives.html
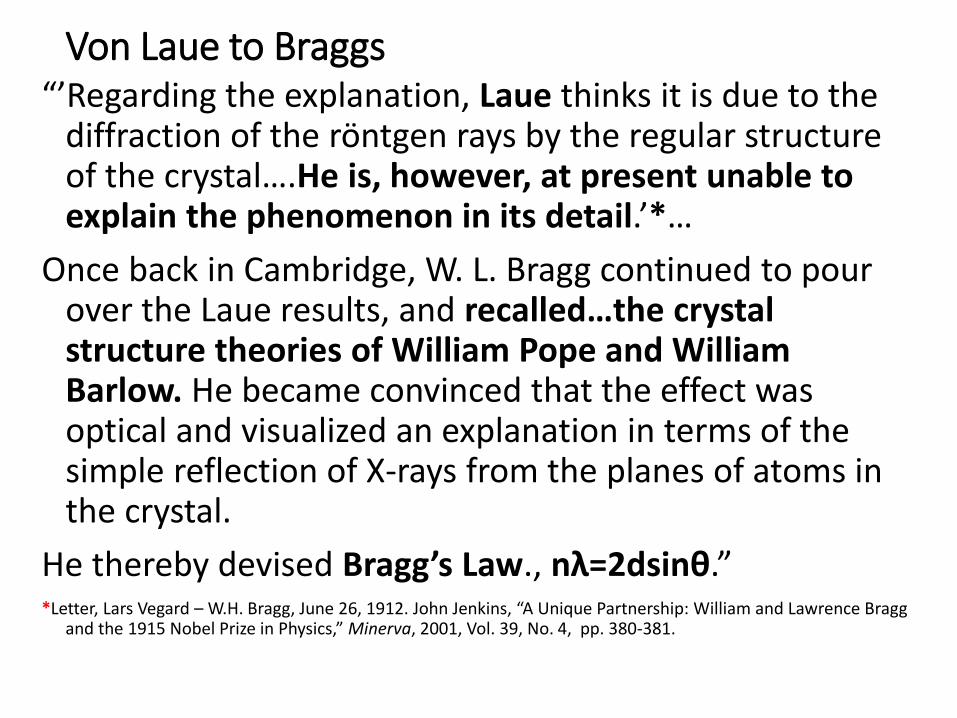
Von Laue to Braggs“’Regarding the explanation, Laue thinks it is due to the
diffraction of the röntgen rays by the regular structure of the crystal….He is, however, at present unable to explain the phenomenon in its detail.’*…
Once back in Cambridge, W. L. Bragg continued to pour over the Laue results, and recalled…the crystal structure theories of William Pope and William Barlow. He became convinced that the effect was optical and visualized an explanation in terms of the simple reflection of X-rays from the planes of atoms in the crystal.
He thereby devised Bragg’s Law., nλ=2dsinθ.”*Letter, Lars Vegard – W.H. Bragg, June 26, 1912. John Jenkins, “A Unique Partnership: William and Lawrence Bragg
and the 1915 Nobel Prize in Physics,” Minerva, 2001, Vol. 39, No. 4, pp. 380-381.

W.H. & W. L. Bragg, X-Rays and Crystal Structure (1915)
“It is natural to suppose that the Laue pattern owes its origin to the interference of waves diffracted at a number of centres which are closely connected with the atoms or molecules of which the crystal is built, and are therefore arranged according to the same plan.
The crystal is, in fact, acting as a diffraction grating.” (pp. 8-9).

W. H. & W. L. Bragg, X-Rays and Crystal Structure (1915)
Photos
Top: William Henry Bragg (1862 – 1942);
Bottom Wlliam Lawrence Bragg
(1890-1971)
Swedish postage stamp with Braggs
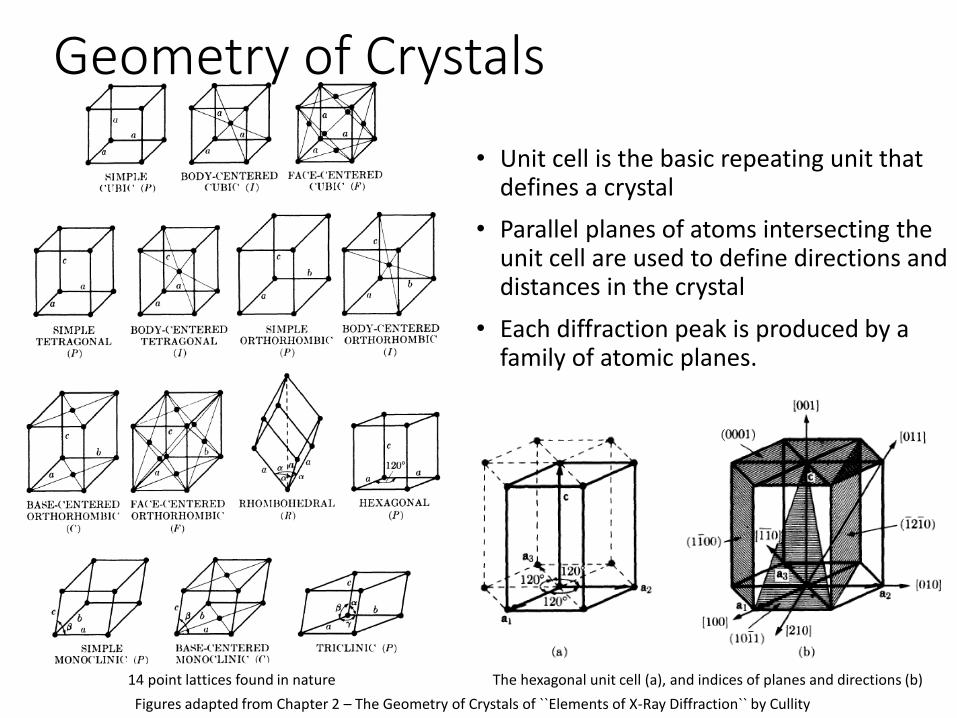
Geometry of Crystals
• Unit cell is the basic repeating unit that defines a crystal
• Parallel planes of atoms intersecting the unit cell are used to define directions and distances in the crystal
• Each diffraction peak is produced by a family of atomic planes.
The hexagonal unit cell (a), and indices of planes and directions (b)
Figures adapted from Chapter 2 – The Geometry of Crystals of ``Elements of X-Ray Diffraction`` by Cullity
14 point lattices found in nature

LATTICE ARRAYS AND BRAVAIS LATTICES
Crystalline materials differ from amorphous materials in that in the former there is
order in the arrangement of the molecular contents whereas in the latter there is
no order or a tendency for a short-range order.
The packing of atoms, molecules or ions within a crystal occurs in a symmetrical
manner and furthermore this symmetrical arrangement is repetitive.
The most important common characteristic that crystals may share is the manner
in which repetition occurs. This is expressed in a common lattice array.
A lattice array is constructed from the arrangement of atomic material within the
crystal
pma 2010
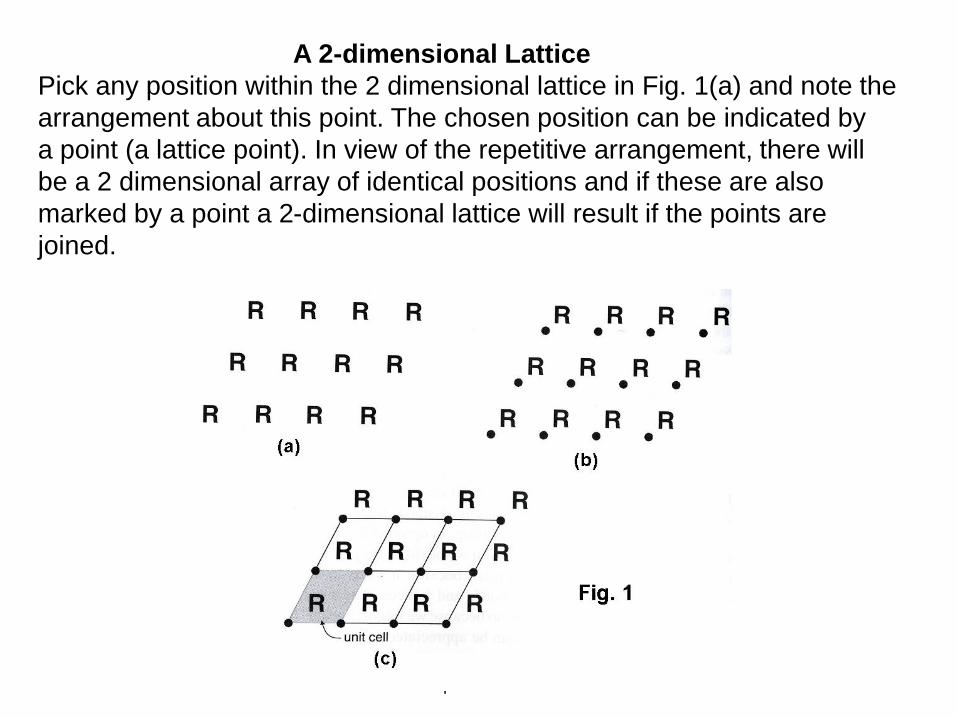
A 2-dimensional Lattice
Pick any position within the 2 dimensional lattice in Fig. 1(a) and note the
arrangement about this point. The chosen position can be indicated by
a point (a lattice point). In view of the repetitive arrangement, there will
be a 2 dimensional array of identical positions and if these are also
marked by a point a 2-dimensional lattice will result if the points are
joined.

In a real 3-dimensional crystal lattice the same ideas apply.
When crystal structures are represented by lattices, it transpires that all crystals
break down into one of fourteen three dimensional lattice arrangements.
Bravais demonstrated mathematically that there are only fourteen ways
in which repetitive symmetry can occur and the fourteen lattices representing
the ways in which repetition can occur are referred to as the Bravais lattices.
UNIT CELL
A unit cell can be any unit of a lattice array which when repeated in all directions,
and always maintaining the same orientation in space, generates the
lattice array.
There is no unique way of choosing
a unit cell. For example, each of the
cells (A to D) in Fig. 2 are OK.
However, the cell favoured by
crystallographers is the one of
smallest volume that displays all of
the symmetry of the lattice.
Thus, cells C and A are the
preferred unit cells for the lattices
of Figs. 2 and 3 respectively.
A B
C D
A
B
Fig. 1 Fig. 2Fig. 2 Fig. 3

When these unit cells are combined with possible “centering” there are
14 different Bravais lattices.
In general, six parameters are required to define the shape and size of a unit cell,
these being three cell edge lengths (conventionally, defined as a, b, and c),
and three angles (conventionally, defined as , , and ). In the strict mathematical
sense, a, b, and c are vectors since they specify both length and direction.
is the angle between b and c, is the angle between a and c, is the angle
between a and b. The unit cell should be right handed. Check the cell above with
your right hand
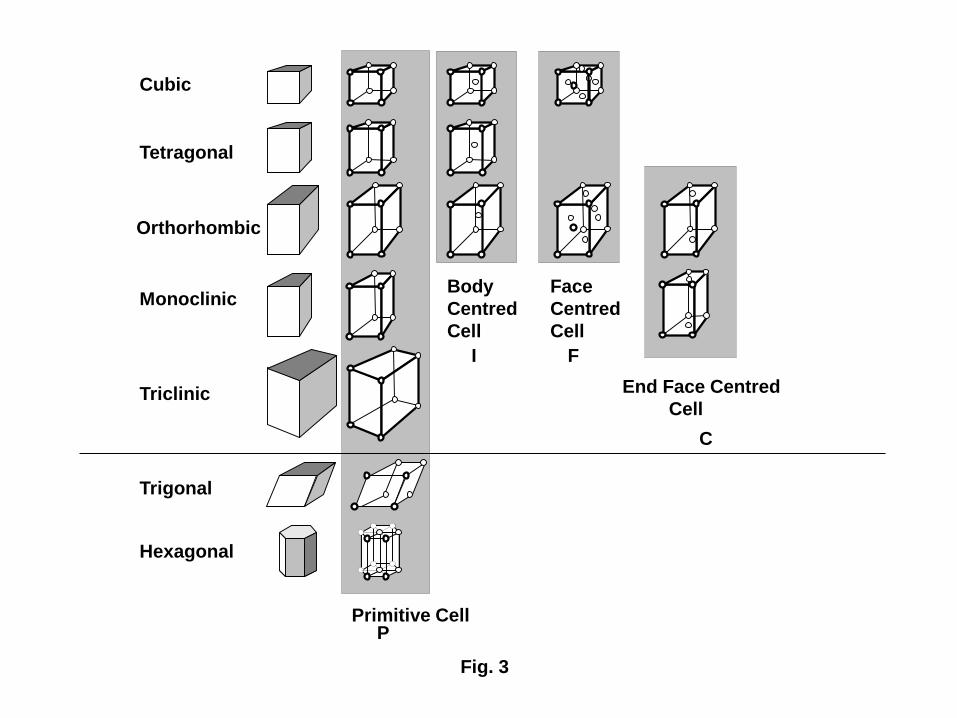
UNIT CELL TYPES and THE SEVEN CRYSTAL SYSTEMS
Cubic a = b = c. = = = 90º.
Tetragonal a = b c. = = = 90º.
Orthorhombic a b c. = = = 90 º.
Monoclinic a b c. = = 90º, 90º.
Triclinic a b c.. 90º.
Rhombohedral a = b = c. = = 90 º.
(or Trigonal)
Hexagonal a = b c. = = 90º, = 120º.
Orthorhombic
a
cb
Cubic
Tetragonal
Orthorhombic
Monoclinic
Triclinic
Primitive Cell
Body
Centred
Cell
Face
Centred
Cell
End Face Centred
Cell
P
I F
C
Fig. 3
Trigonal
Hexagonal
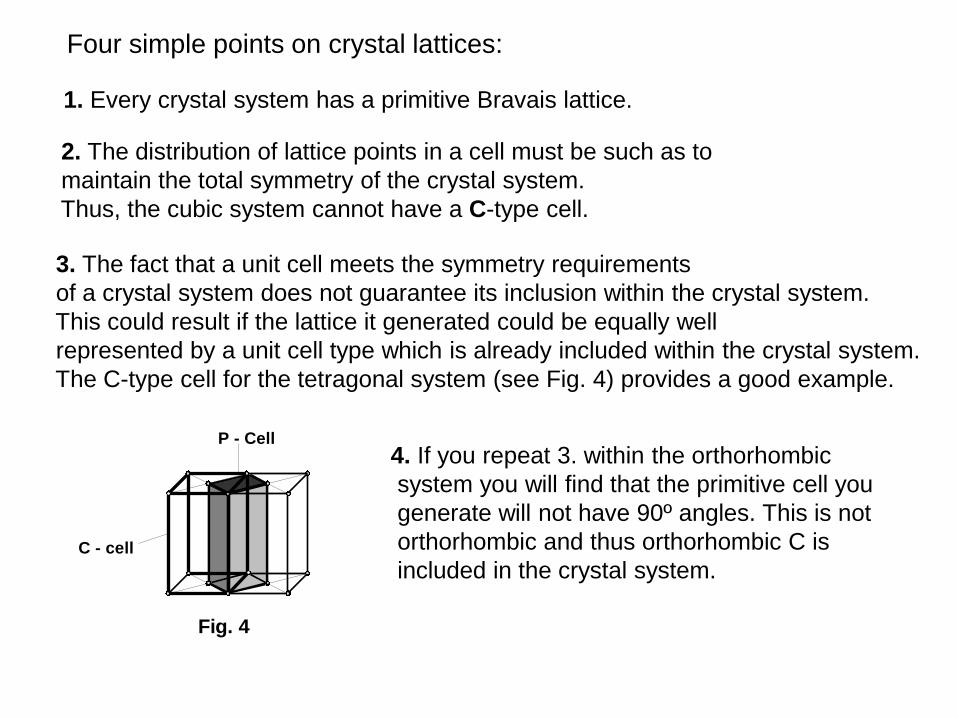
1. Every crystal system has a primitive Bravais lattice.
2. The distribution of lattice points in a cell must be such as to
maintain the total symmetry of the crystal system.
Thus, the cubic system cannot have a C-type cell.
3. The fact that a unit cell meets the symmetry requirements
of a crystal system does not guarantee its inclusion within the crystal system.
This could result if the lattice it generated could be equally well
represented by a unit cell type which is already included within the crystal system.
The C-type cell for the tetragonal system (see Fig. 4) provides a good example.
Fig. 4
C - cell
P - Cell
Four simple points on crystal lattices:
4. If you repeat 3. within the orthorhombic
system you will find that the primitive cell you
generate will not have 90º angles. This is not
orthorhombic and thus orthorhombic C is
included in the crystal system.
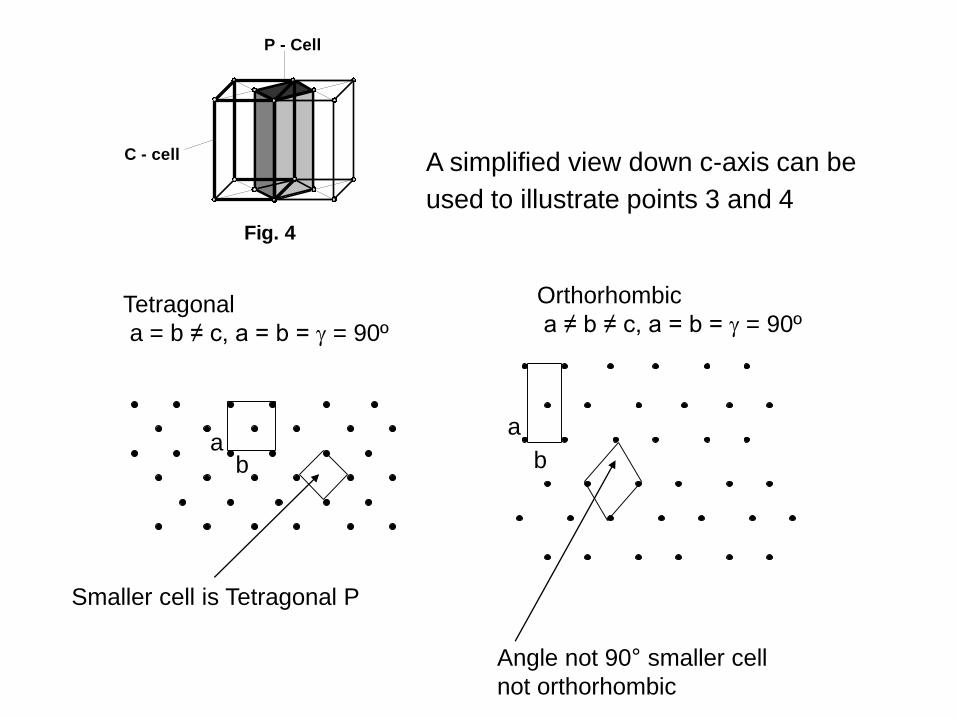
Fig. 4
C - cell
P - Cell
A simplified view down c-axis can be
used to illustrate points 3 and 4
Orthorhombic
a ≠ b ≠ c, a = b = = 90º
a
b
Angle not 90° smaller cell
not orthorhombic
Tetragonal
a = b ≠ c, a = b = = 90º
ab
Smaller cell is Tetragonal P
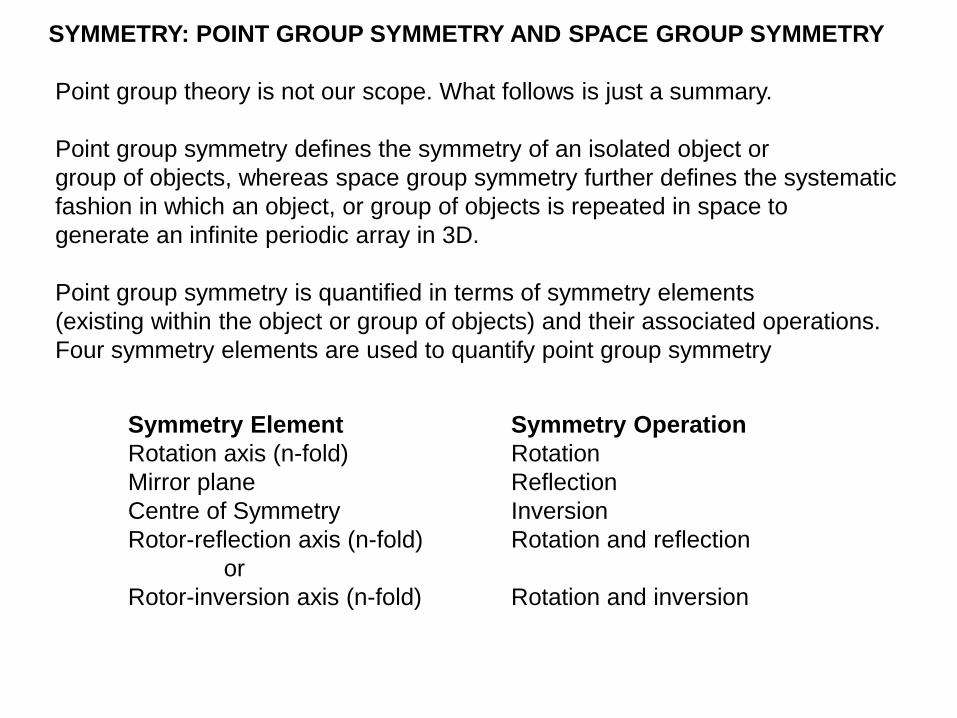
SYMMETRY: POINT GROUP SYMMETRY AND SPACE GROUP SYMMETRY
Point group theory is not our scope. What follows is just a summary.
Point group symmetry defines the symmetry of an isolated object or
group of objects, whereas space group symmetry further defines the systematic
fashion in which an object, or group of objects is repeated in space to
generate an infinite periodic array in 3D.
Point group symmetry is quantified in terms of symmetry elements
(existing within the object or group of objects) and their associated operations.
Four symmetry elements are used to quantify point group symmetry
Symmetry Element Symmetry Operation
Rotation axis (n-fold) Rotation
Mirror plane Reflection
Centre of Symmetry Inversion
Rotor-reflection axis (n-fold) Rotation and reflection
or
Rotor-inversion axis (n-fold) Rotation and inversion

Symmetry Elements and Operations
“Symmetry elements define the (conceptual) motion of an object in space the carrying out of which, thesymmetry operation, leads to an arrangement that is indistinguishable from the initial arrangement.”
Werner Massa, Crystal Structure Determination (2004), p. 41.
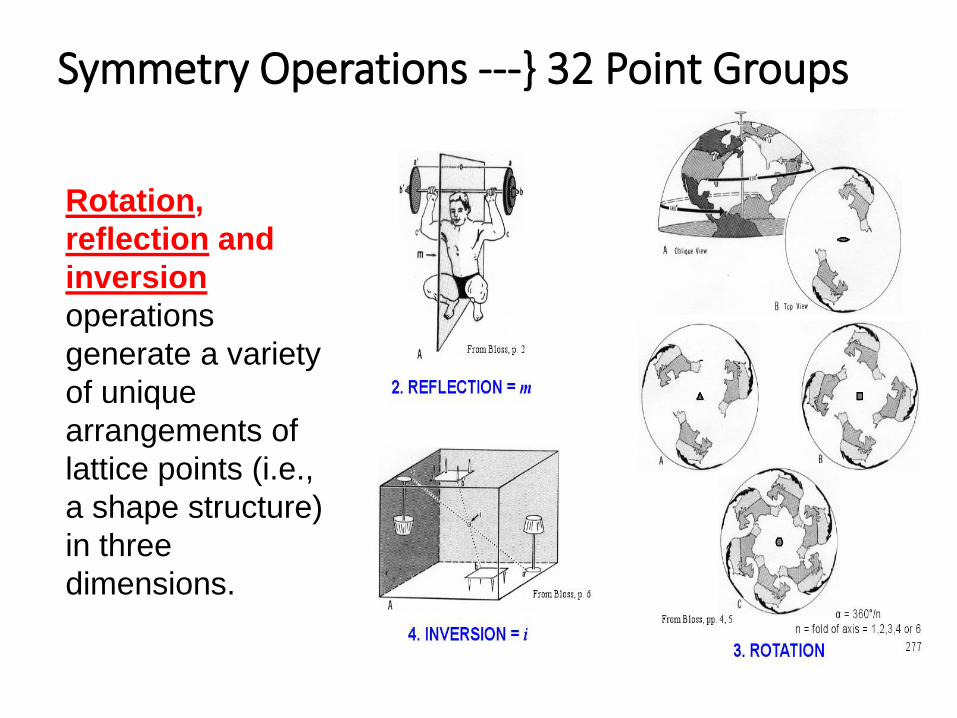
Rotation,
reflection and
inversion
operations
generate a variety
of unique
arrangements of
lattice points (i.e.,
a shape structure)
in three
dimensions.
Symmetry Operations ---} 32 Point Groups

UNIT CELL UNIT CELL
Positions of 2-fold axesand mirror planes
Centres of symmetry
a
b
a
Fig. 5
(a) (b)
Point Group and Space Group Symmetry
To generate a 3D lattice from an object it is necessary to add translational
symmetry to point group symmetry. The two important space group
symmetry operations which move objects are glide planes and screw
axes. These operations combine translation and reflection and translation
and rotation respectively.
The pentagons on the
left are related by
simple translation.
In 5(b) the pentagon
on the top left of the
cell is related to the
one in the centre by
translation a/2 followed
by either reflection or
rotation. Centres of
inversion in 5(b) are
marked with tiny
circles.
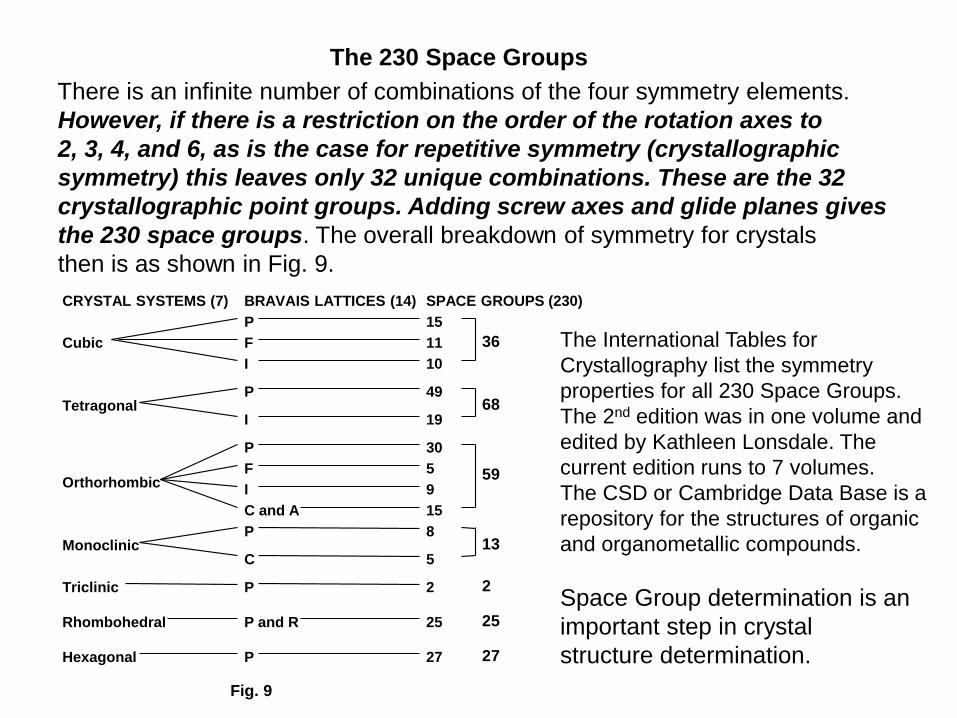
There is an infinite number of combinations of the four symmetry elements.
However, if there is a restriction on the order of the rotation axes to
2, 3, 4, and 6, as is the case for repetitive symmetry (crystallographic
symmetry) this leaves only 32 unique combinations. These are the 32
crystallographic point groups. Adding screw axes and glide planes gives
the 230 space groups. The overall breakdown of symmetry for crystals
then is as shown in Fig. 9.
The 230 Space Groups
CRYSTAL SYSTEMS (7)
Cubic
Tetragonal
Orthorhombic
Monoclinic
Triclinic
Rhombohedral
Hexagonal
BRAVAIS LATTICES (14)
P
F
I
P
I
P
F
I
P
C
P
P
SPACE GROUPS (230)
49
19
30
9
C and A 15
5
8
5
2
27
P and R 25
68
59
13
2
25
27
36
15
11
10
Fig. 9
Space Group determination is an
important step in crystal
structure determination.
The International Tables for
Crystallography list the symmetry
properties for all 230 Space Groups.
The 2nd edition was in one volume and
edited by Kathleen Lonsdale. The
current edition runs to 7 volumes.
The CSD or Cambridge Data Base is a
repository for the structures of organic
and organometallic compounds.
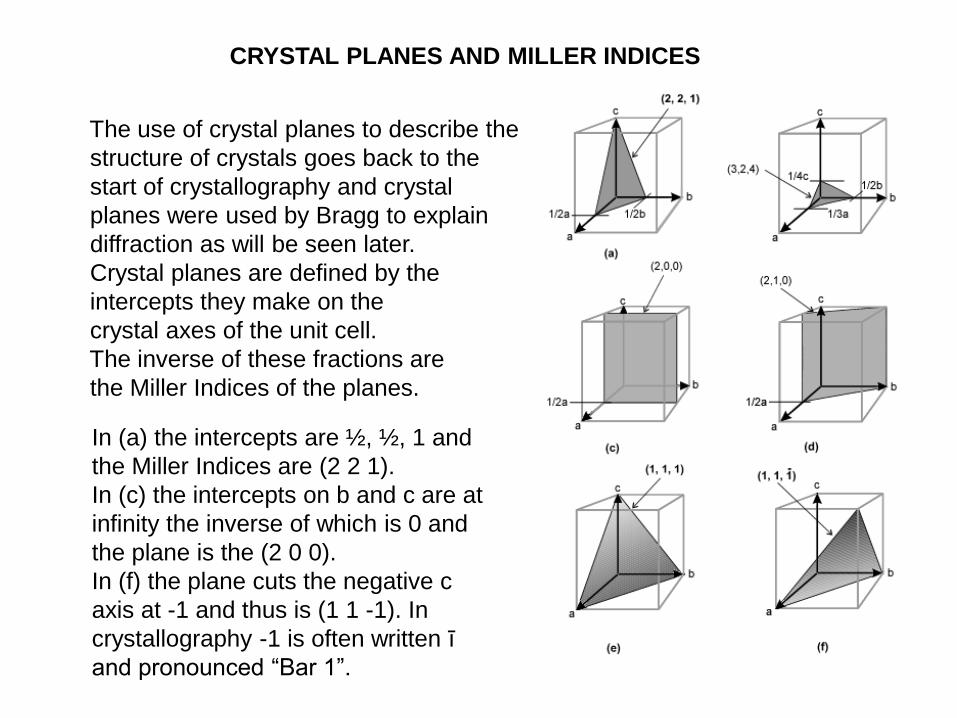
CRYSTAL PLANES AND MILLER INDICES
The use of crystal planes to describe the
structure of crystals goes back to the
start of crystallography and crystal
planes were used by Bragg to explain
diffraction as will be seen later.
Crystal planes are defined by the
intercepts they make on the
crystal axes of the unit cell.
The inverse of these fractions are
the Miller Indices of the planes.
In (a) the intercepts are ½, ½, 1 and
the Miller Indices are (2 2 1).
In (c) the intercepts on b and c are at
infinity the inverse of which is 0 and
the plane is the (2 0 0).
In (f) the plane cuts the negative c
axis at -1 and thus is (1 1 -1). In
crystallography -1 is often written ī
and pronounced “Bar 1”.

DIFFRACTION AND THE BRAGG EQUATION
Max von Laue was the first to
suggest that crystals might
diffract X-rays and he also
provided the first explanation
for the diffraction observed.
However, it is the explanation
provided by Bragg that is simpler
and more popular.
incidentbeam
reflectedbeam
x
y
m n
d
o o
o o
o oA B
C D
a
incidentbeam
reflectedbeam
x
y
m n
d
o o
o o
o oA B
C D
d
aUNITCELL
Z
O P
(a)
(b)
Fig. 11
(2,0,0)
(1,0,0)
E F
UNIT
CELL
In the Bragg view, crystal
planes act a mirrors.
Constructive interference
is observed when the path
difference between the two
reflected beams in (a) = nl.
The path difference in (a) is
2my. Since my/d = sin
2my = 2dsin = nl
where d is the interplanar spacing.

l =sin2 )0,0,1(d
l 2sin2 )0,0,1( =d
In (a) it is clear that the planes are the (1,0,0) set of planes.
If the path difference is simply one wavelength the Bragg condition
can be stated as
This is a first order reflection. If the path difference is
two wave lengths the Bragg condition becomes
and the reflection is a second order reflection.
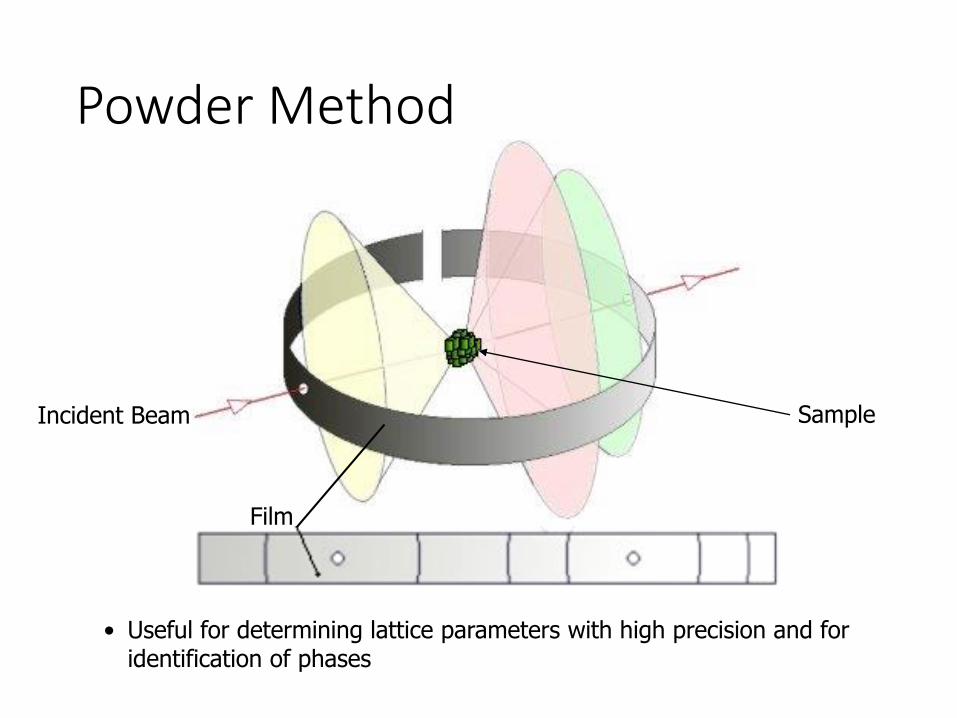
Powder Method
• Useful for determining lattice parameters with high precision and for identification of phases
Incident Beam Sample
Film

pma 2010
Diagram Of An Area Detector X-Ray Data Collection System.
X-ray Beam
Beam Stop
Diffracted Beam & Spot
Image Plate / CCD
Crystal
X-ray Beam
Beam Stop
Diffracted Beam & Spot
Image Plate / CCD
Crystal
The crystal is oscillated over < 2°
while an image is collected then
rotated by the same amount
and oscillated again. The process is
repeated over a total range of about 180°.
Each image is exposed for < 100s.
Thus if readout time is ignored total
data collection time is often < 3 hr.
A typical image shown to the left.
A computer program is used to predict
the unit cell from several images.
The first crystallographic
data collection systems used
photographic methods. These
were replaced by automated
diffractometers which measured
reflections one at a time. A typical
data collection took several days.
modern systems use area detectors
which measure 100s at a time.

CRYSTAL SYSTEMand
UNIT CELL DIMENSIONS
FULL DATA SET
COLLECTION
BRAVAIS LATTICE
SPACE GROUP
CONSTRUCT AN
ELECTRON DENSITYMAP
LOCATE ATOMPOSITIONS
STRUCTUREREFINEMENT
SELECT A SUITABLE
CRYSTAL
A
B
C
D
E
F
G
SOLVING A CRYSTAL STRUCTURE BY
SINGLE CRYSTAL DIFFRACTION TECHNIQUES
The crystal must be a single crystal.
Bragg's equation specifies that, if a crystal is rotated
within a monochromatic X-ray beam, such that every
conceivable orientation of the crystal relative to the beam
is achieved, each set of planes will have had the
opportunity to satisfy the Bragg equation and will have
given rise to reflection.
In order to solve a crystal structure it is necessary
to record a large number of reflections.
This implies accurately measuring their intensities and
recording their directions with respect to crystal orientation
and initial X-ray beam direction.
Many experimental techniques have been devised
to achieve this. The steps involved in a crystal structure
determination are summarised in the flow chart.
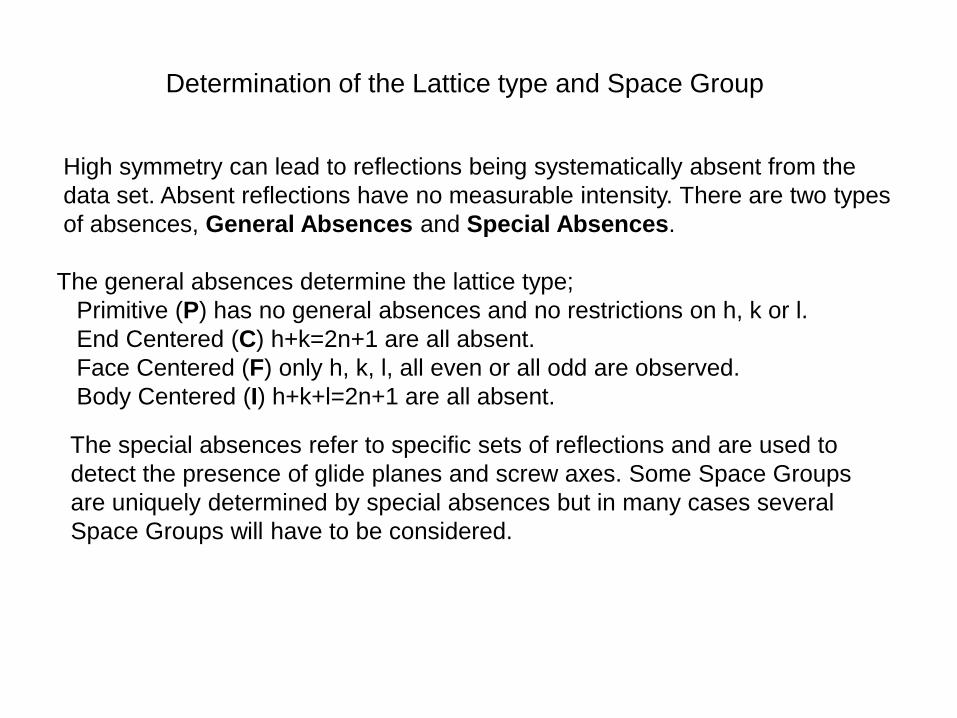
Determination of the Lattice type and Space Group
High symmetry can lead to reflections being systematically absent from the
data set. Absent reflections have no measurable intensity. There are two types
of absences, General Absences and Special Absences.
The general absences determine the lattice type;
Primitive (P) has no general absences and no restrictions on h, k or l.
End Centered (C) h+k=2n+1 are all absent.
Face Centered (F) only h, k, l, all even or all odd are observed.
Body Centered (I) h+k+l=2n+1 are all absent.
The special absences refer to specific sets of reflections and are used to
detect the presence of glide planes and screw axes. Some Space Groups
are uniquely determined by special absences but in many cases several
Space Groups will have to be considered.

Structure Factor
2 ( )
1
n n n
Ni hu kv lw
hkl nF f e
=
Bravais Lattice Reflections possibly present Reflections necessarily absent
Simple All None
Body Centered (h+k+l): Even (h+k+l): Odd
Face Centered h, k, and l unmixed i.e. all odd or all even
h, k, and l: mixed
− h,k,l : indices of the diffraction plane under consideration − u,v,w : co-ordinates of the atoms in the lattice− N : number of atoms − fn : scattering factor of a particular type of atom
Intensity of the diffracted beam |F|2

Systematic Absences
Simple Cubic (100), (110), (111), (200), (210), (211), (220), (300), (221) ………
BCC (110), (200), (211), (220), (310), (222)….
FCC (111), (200), (220), (311)…..
Permitted Reflections

2
2
2
2
2
2
2),,(
1
c
l
b
k
a
h
d lkh
=
2
2
2
22
2),,(
)(1
c
l
a
kh
d lkh
=
2
222
2),,(
)(1
a
lkh
d lkh
=
For an orthogonal system ( = = = 90°) the relationship between
interplanar spacing (d) and the unit cell parameters is given by the
expression:
This is the expression for an orthorhombic crystal.
For the tetragonal system it reduces to
and, for the cubic system, it further reduces to
Calculations using X-ray powder diffraction patterns

• Complete determination of an unknown crystal structure is possible by
1. Calculation of the size and shape of the unit cell from the angular positions of the diffraction peaks
2. Computation of the number of atoms per unit cell from the size and shape of the unit cell, the chemical composition of the specimen, and its measured density
3. Deduction of the atom positions within the unit cell from the relative intensities of the diffraction peaks
The first step is indexing pattern – assigning Miller indices to each peak
Bragg’s law becomes
Phase Identification based on Lattice Parameter Determination
Cubic unit cell

l sin2dn =
The Bragg equation may be rearranged (if n=1)
from to l 2
2
2
sin4
=d
If the value of 1/(dh,k,l)2 in the cubic system equation above is inserted into
this form of the Bragg equation you have
)(4
sin 222
2
22 lkh
a=
l
Since in any specific case a and l are constant and if l2/4a2 = A
)(sin 2222 lkhA =
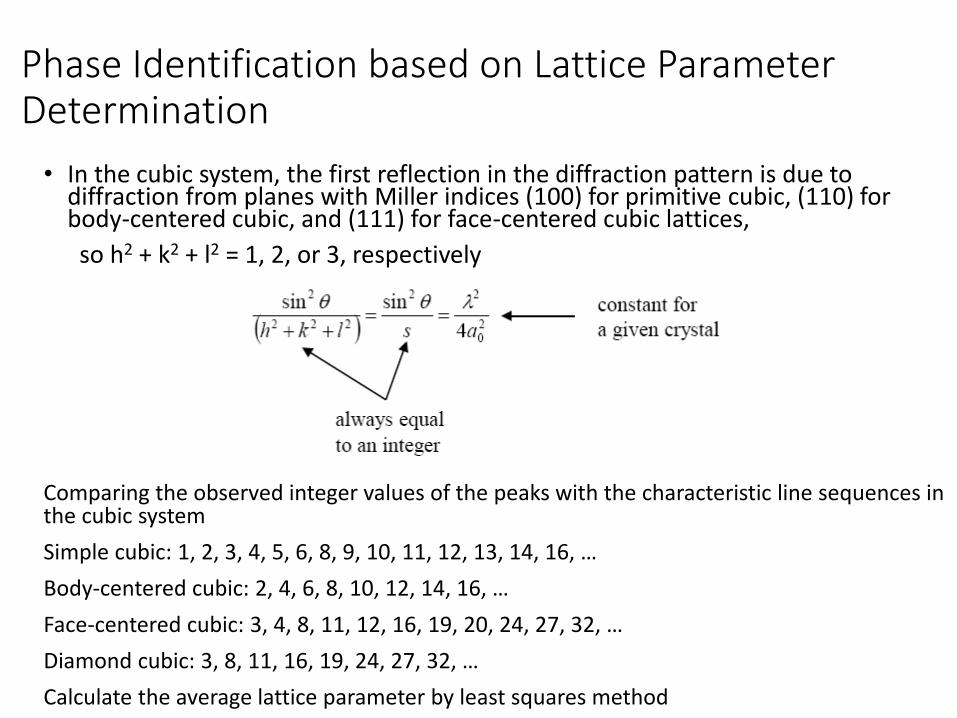
Phase Identification based on Lattice Parameter Determination
• In the cubic system, the first reflection in the diffraction pattern is due to diffraction from planes with Miller indices (100) for primitive cubic, (110) for body-centered cubic, and (111) for face-centered cubic lattices,
so h2 + k2 + l2 = 1, 2, or 3, respectively
Comparing the observed integer values of the peaks with the characteristic line sequences in the cubic system
Simple cubic: 1, 2, 3, 4, 5, 6, 8, 9, 10, 11, 12, 13, 14, 16, …
Body-centered cubic: 2, 4, 6, 8, 10, 12, 14, 16, …
Face-centered cubic: 3, 4, 8, 11, 12, 16, 19, 20, 24, 27, 32, …
Diamond cubic: 3, 8, 11, 16, 19, 24, 27, 32, …
Calculate the average lattice parameter by least squares method
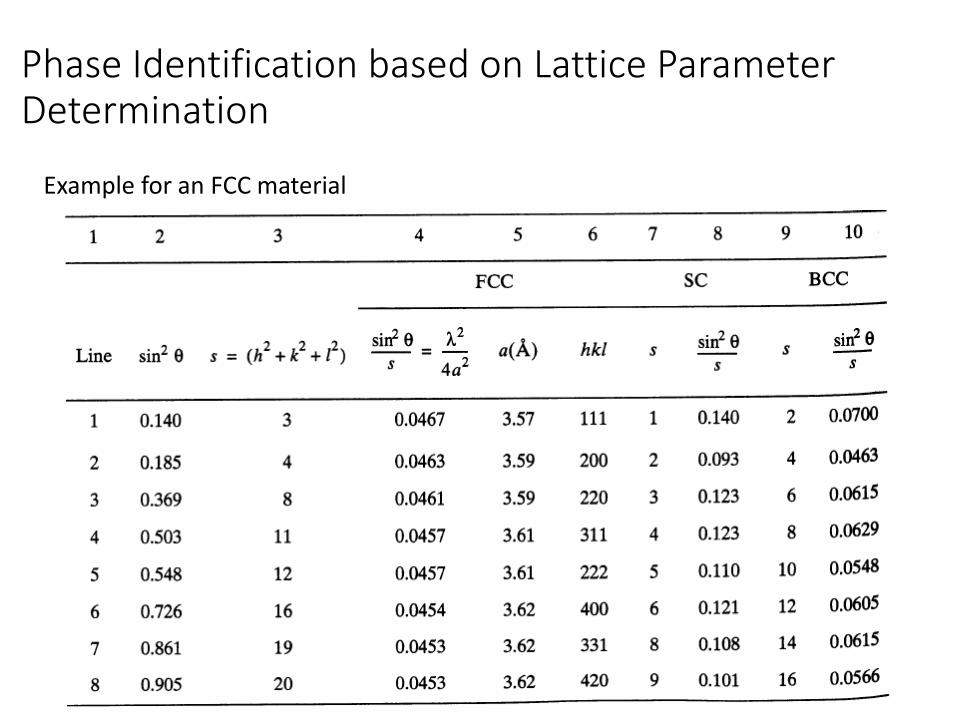
Phase Identification based on Lattice Parameter Determination
Example for an FCC material
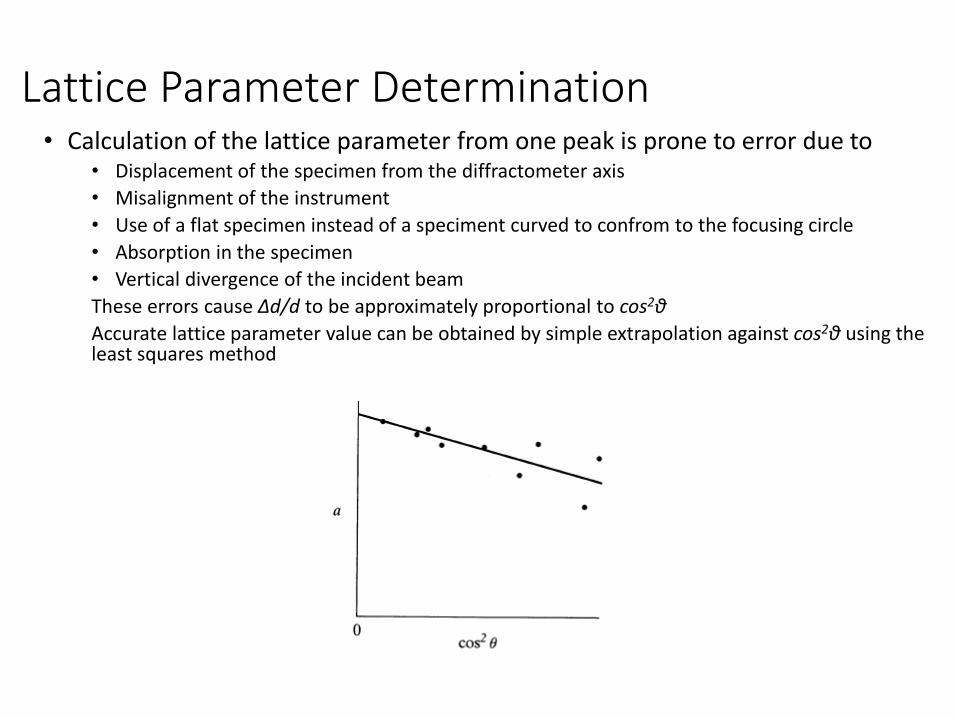
Lattice Parameter Determination• Calculation of the lattice parameter from one peak is prone to error due to
• Displacement of the specimen from the diffractometer axis
• Misalignment of the instrument
• Use of a flat specimen instead of a speciment curved to confrom to the focusing circle
• Absorption in the specimen
• Vertical divergence of the incident beam
These errors cause Δd/d to be approximately proportional to cos2θ
Accurate lattice parameter value can be obtained by simple extrapolation against cos2θ using the least squares method

Indexing a Laue powder pattern
1
2
Sθ (for front reflections)or
2W
Sθ 1 (for back reflections)
2 W
=
=
hkl 2 2 2
2 2
2 2 2 2
ad
h k l
which gives rise to
sin θ
h k l 4a
which is a constant
l
=
=
Bragg’s Lawnl = 2d sin
For cubic crystals

Indexing
BCC
S1 (mm) () sin2 h2+k2+l2 sin2/ h2+k2+l2
Not BCC
38 19.0 0.11 2 0.055
45 22.5 0.15 4 0.038
66 33.0 0.30 6 0.050
78 39.0 0.40 8 0.050
83 41.5 0.45 10 0.045
97 49.5 0.58 12 0.048
113 56.5 0.70 14 0.050
118 59.0 0.73 16 0.046
139 69.5 0.88 18 0.049
168 84.9 0.99 20 0.050
Not Constant
Simple Cubic
S1 (mm) () sin2 h2+k2+l2 sin2/ h2+k2+l2
Not Simple Cubic
38 19.0 0.11 1 0.11
45 22.5 0.15 2 0.75
66 33.0 0.30 3 0.10
78 39.0 0.40 4 0.10
83 41.5 0.45 5 0.09
97 49.5 0.58 6 0.097
113 56.5 0.70 8 0.0925
118 59.0 0.73 9 0.081
139 69.5 0.88 10 0.088
168 84.9 0.99 11 0.09
Not Constant
FCC; wavelength=1.54056Å
S1
(mm)() sin2 h2+k2+l2 sin2/ h2+k2+l2 Lattice Parameter, a (Å)
38 19.0 0.11 3 0.037 4.023
45 22.5 0.15 4 0.038 3.978
66 33.0 0.30 8 0.038 3.978
78 39.0 0.40 11 0.036 4.039
83 41.5 0.45 12 0.038 3.978
97 49.5 0.58 16 0.036 4.046
113 56.5 0.70 19 0.037 4.023
118 59.0 0.73 20 0.037 4.023
139 69.5 0.88 24 0.037 4.023
168 84.9 0.99 27 0.037 4.023
Constant; so it is FCC
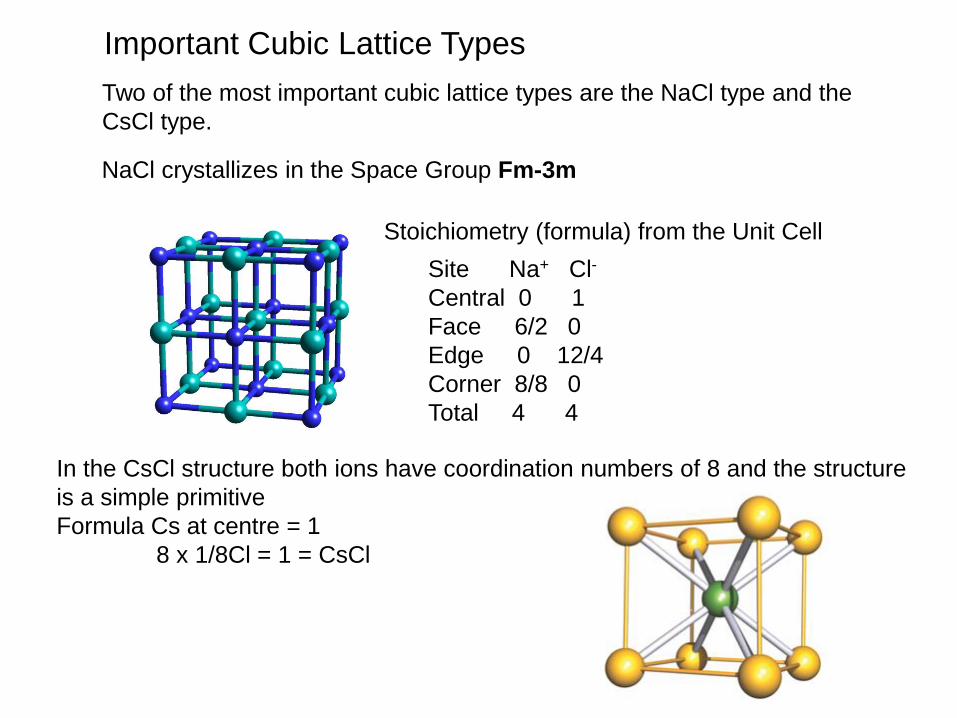
Site Na+ Cl-
Central 0 1
Face 6/2 0
Edge 0 12/4
Corner 8/8 0
Total 4 4
Important Cubic Lattice Types
Two of the most important cubic lattice types are the NaCl type and the
CsCl type.
Stoichiometry (formula) from the Unit Cell
In the CsCl structure both ions have coordination numbers of 8 and the structure
is a simple primitive
Formula Cs at centre = 1
8 x 1/8Cl = 1 = CsCl
NaCl crystallizes in the Space Group Fm-3m
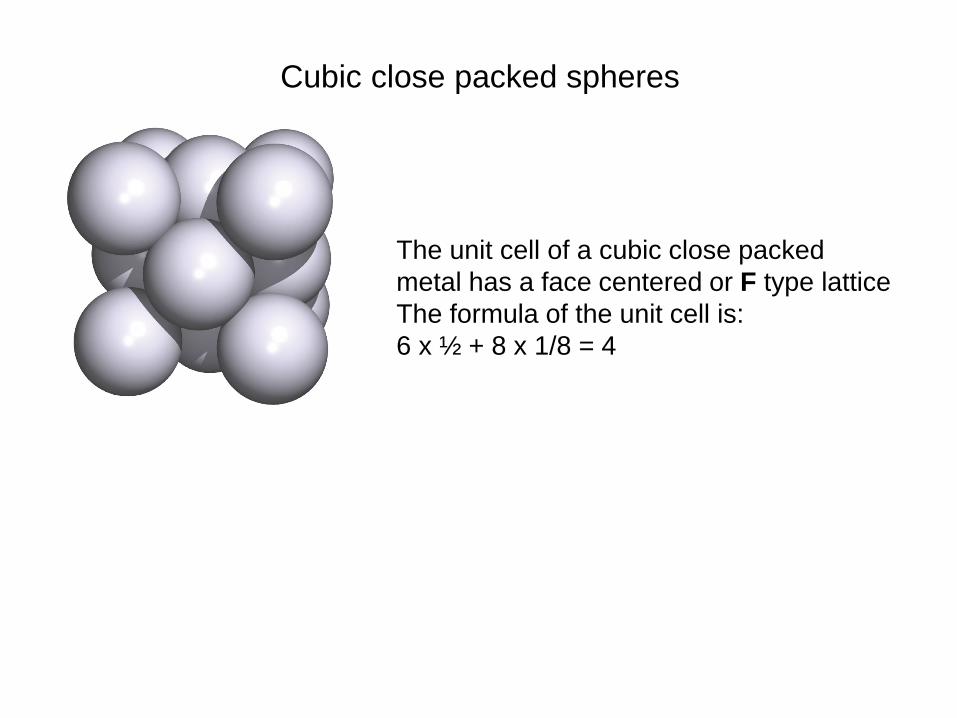
The unit cell of a cubic close packed
metal has a face centered or F type lattice
The formula of the unit cell is:
6 x ½ + 8 x 1/8 = 4
Cubic close packed spheres

Name and formulaReference code: 00-001-1260
PDF index name: Nickel Empirical formula: NiChemical formula: NiCrystallographic parameters
Crystal system: Cubic Space group: Fm-3m
Space group number: 225a (Å): 3.5175 b (Å): 3.5175 c (Å): 3.5175 Alpha (°): 90.0000 Beta (°): 90.0000 Gamma (°): 90.0000
Measured density (g/cm^3): 8.90 Volume of cell (10^6 pm^3): 43.52
Z: 4.00 RIR: -Status, subfiles and quality
Status: Marked as deleted by ICDDSubfiles: InorganicQuality: Blank (B)
ReferencesPrimary reference: Hanawalt et al., Anal. Chem., 10, 475, (1938)
Optical data: Data on Chem. for Cer. Use, Natl. Res. Council Bull. 107Unit cell: The Structure of Crystals, 1st Ed.
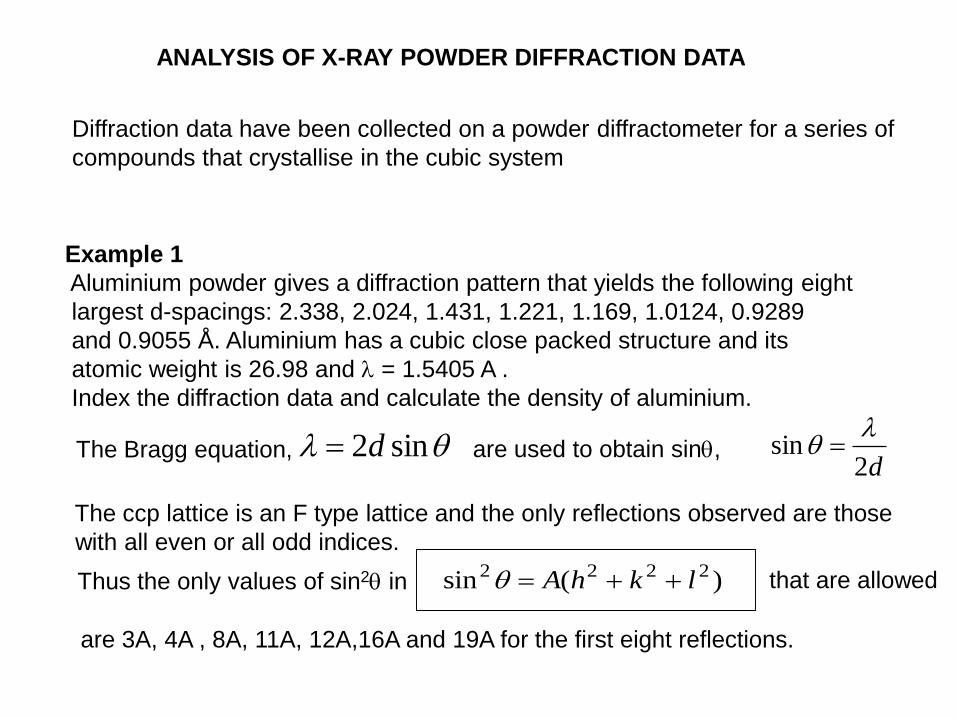
ANALYSIS OF X-RAY POWDER DIFFRACTION DATA
Diffraction data have been collected on a powder diffractometer for a series of
compounds that crystallise in the cubic system
Example 1
Aluminium powder gives a diffraction pattern that yields the following eight
largest d-spacings: 2.338, 2.024, 1.431, 1.221, 1.169, 1.0124, 0.9289
and 0.9055 Å. Aluminium has a cubic close packed structure and its
atomic weight is 26.98 and l = 1.5405 A .
Index the diffraction data and calculate the density of aluminium.
)(sin 2222 lkhA =
l sin2d=The Bragg equation, are used to obtain sin,d2
sinl
=
The ccp lattice is an F type lattice and the only reflections observed are those
with all even or all odd indices.
Thus the only values of sin2 in that are allowed
are 3A, 4A , 8A, 11A, 12A,16A and 19A for the first eight reflections.
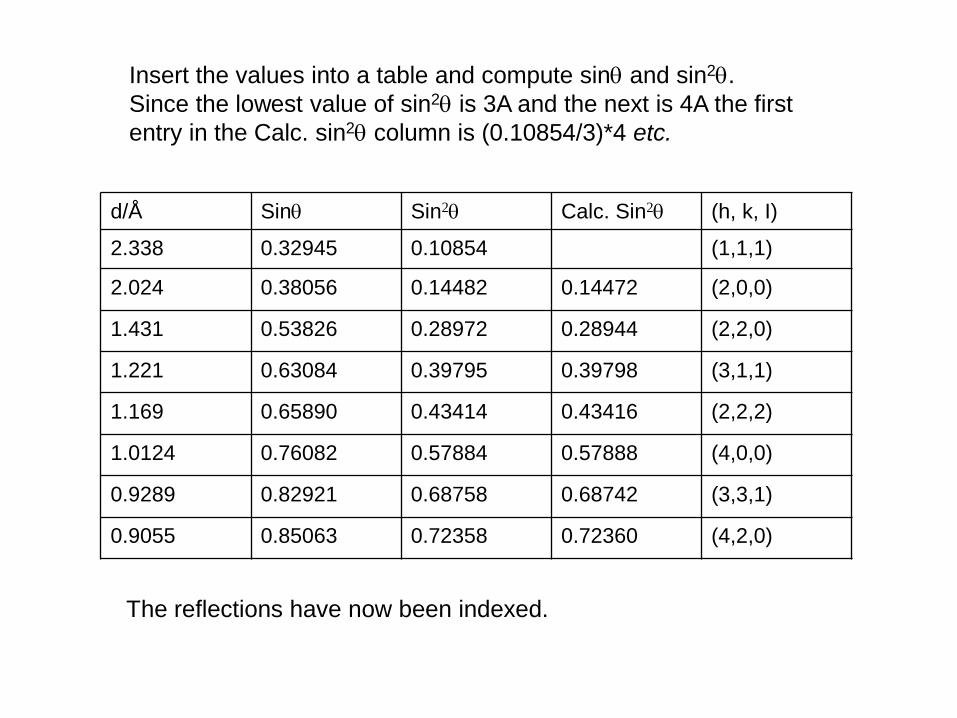
d/Å Sin Sin2 Calc. Sin2 (h, k, I)
2.338 0.32945 0.10854 (1,1,1)
2.024 0.38056 0.14482 0.14472 (2,0,0)
1.431 0.53826 0.28972 0.28944 (2,2,0)
1.221 0.63084 0.39795 0.39798 (3,1,1)
1.169 0.65890 0.43414 0.43416 (2,2,2)
1.0124 0.76082 0.57884 0.57888 (4,0,0)
0.9289 0.82921 0.68758 0.68742 (3,3,1)
0.9055 0.85063 0.72358 0.72360 (4,2,0)
Insert the values into a table and compute sin and sin2.
Since the lowest value of sin2 is 3A and the next is 4A the first
entry in the Calc. sin2 column is (0.10854/3)*4 etc.
The reflections have now been indexed.

For the first reflection (for which h2 + k2 + l2 = 3)
sin2 = 3A = 3 ( l2 / 4a2 )
a2 = 3l2 / 4sin2
a = 4.04946 Å = 4.04946 x 10⁻⁸ cm.
Calculation of the density of aluminiuma3 = 66.40356 Å3 = 66.40356 x 10⁻²⁴ cm3.
If the density of aluminium is r (g. cm.-3), the mass of the unit cell is
r x 66.40356 x 10⁻²⁴ g.
The unit cell of aluminium contains 4 atoms.
The weight of one aluminium atom is 26.98/(6.022 x 1023) = 4.48024 x 10⁻²³
and the weight of four atoms (the content of the unit cell) is 179.209 x 10⁻²⁴.
r x 66.40356 x 10-24 = 179.209 x 10⁻²⁴
p = 2.6988 g.cm-3.
Calculation of a
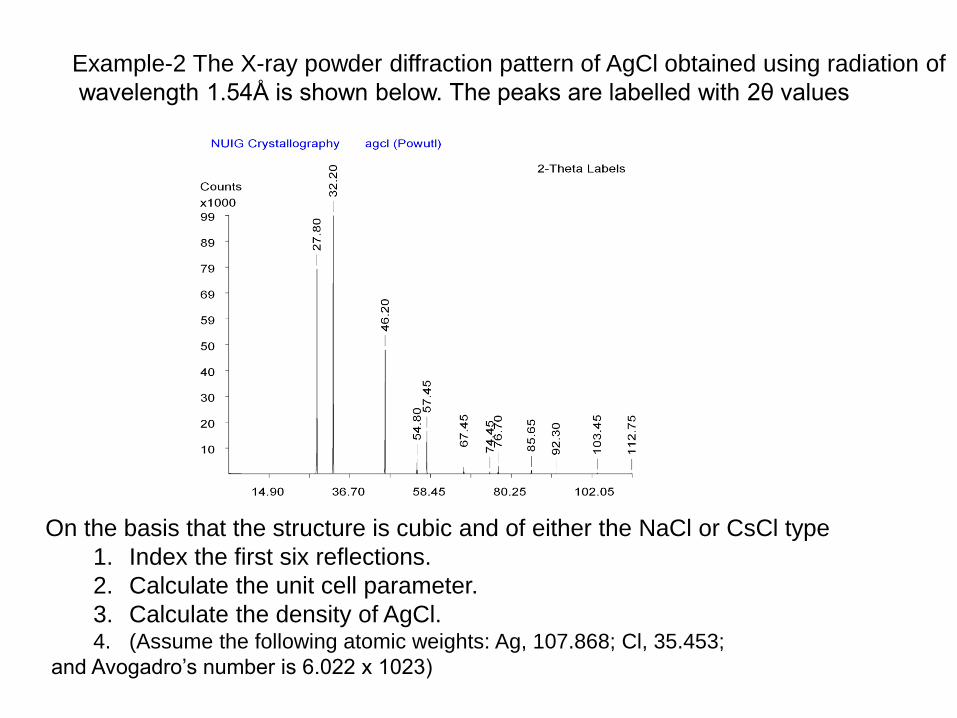
On the basis that the structure is cubic and of either the NaCl or CsCl type
1. Index the first six reflections.
2. Calculate the unit cell parameter.
3. Calculate the density of AgCl. 4. (Assume the following atomic weights: Ag, 107.868; Cl, 35.453;
and Avogadro’s number is 6.022 x 10²³)
Example-2 The X-ray powder diffraction pattern of AgCl obtained using radiation of
wavelength 1.54Å is shown below. The peaks are labelled with 2θ values
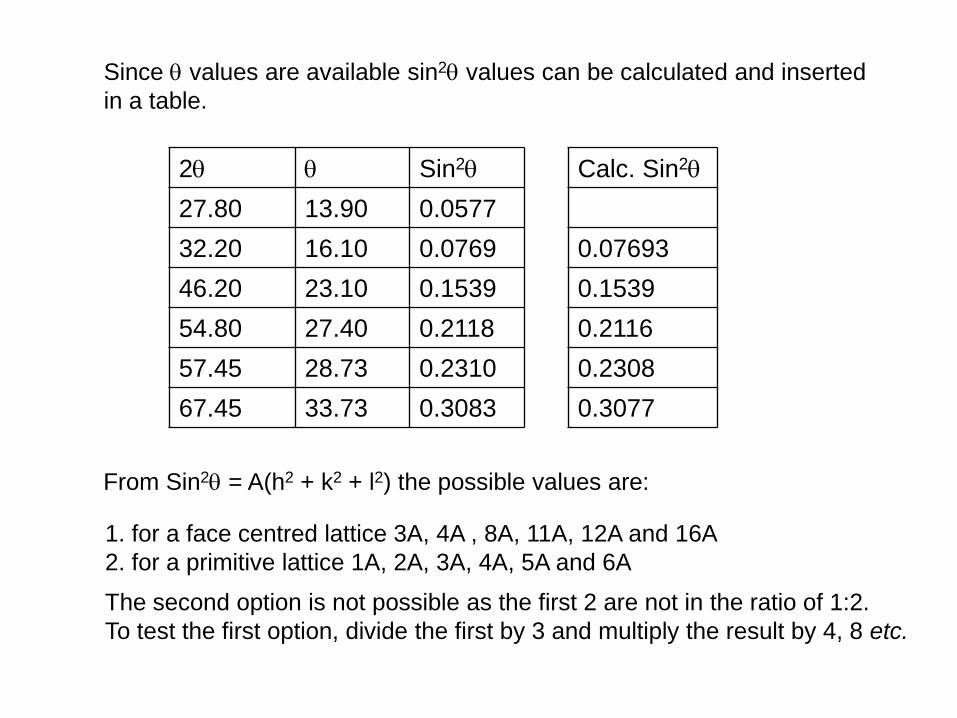
Since values are available sin2 values can be calculated and inserted
in a table.
1. for a face centred lattice 3A, 4A , 8A, 11A, 12A and 16A
2. for a primitive lattice 1A, 2A, 3A, 4A, 5A and 6A
2 Sin2
27.80 13.90 0.0577
32.20 16.10 0.0769
46.20 23.10 0.1539
54.80 27.40 0.2118
57.45 28.73 0.2310
67.45 33.73 0.3083
The second option is not possible as the first 2 are not in the ratio of 1:2.
To test the first option, divide the first by 3 and multiply the result by 4, 8 etc.
Calc. Sin2
0.07693
0.1539
0.2116
0.2308
0.3077
From Sin2 = A(h2 + k2 + l2) the possible values are:
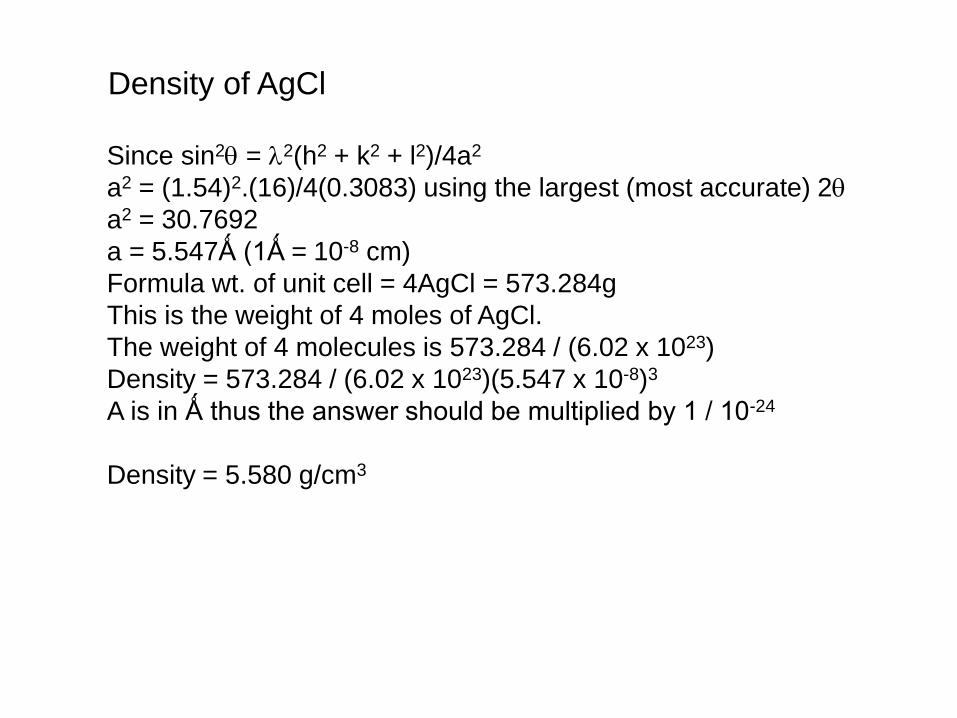
Since sin2 = l2(h2 + k2 + l2)/4a2
a2 = (1.54)2.(16)/4(0.3083) using the largest (most accurate) 2
a2 = 30.7692
a = 5.547Ǻ (1Ǻ = 10-8 cm)
Formula wt. of unit cell = 4AgCl = 573.284g
This is the weight of 4 moles of AgCl.
The weight of 4 molecules is 573.284 / (6.02 x 10²³)
Density = 573.284 / (6.02 x 10²³)(5.547 x 10⁻⁸)3
A is in Ǻ thus the answer should be multiplied by 1 / 10-24
Density = 5.580 g/cm3
Density of AgCl

General procedure
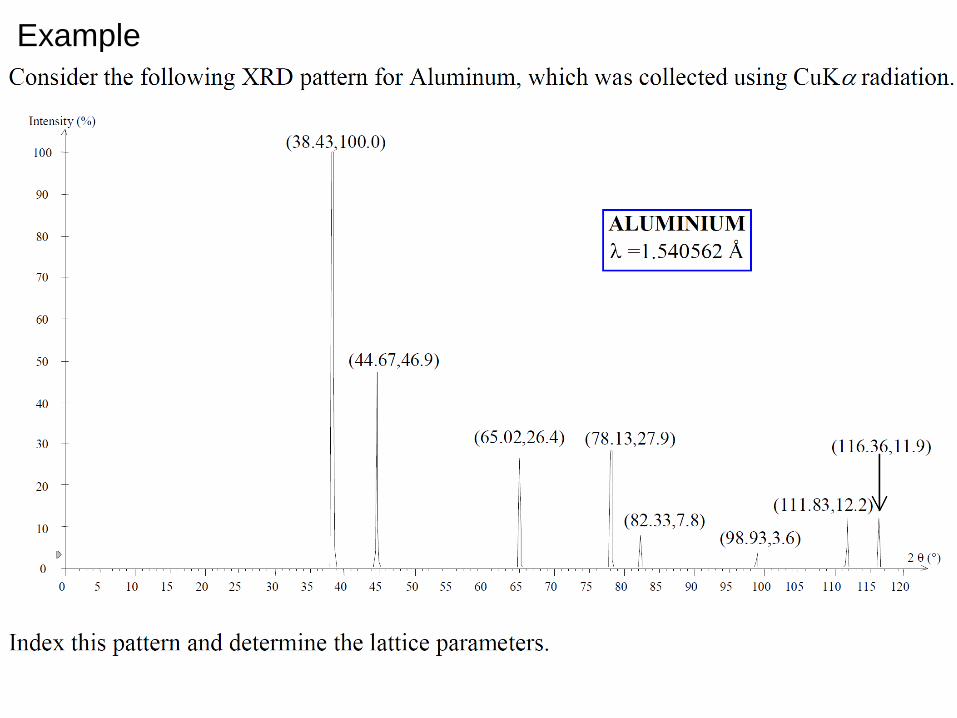
Example

Example

X-RAY FLUORESCENCE(XRF)
X-ray florescence spectroscopy enables determining elemental composition of
samples by analyzing the characteristic X-rays that are emitted from the samples. High
energy primary X-rays are used to generate these secondary X-rays.
Characteristic X-rays can be analyzed based on their wavelengths or energies.
There are two types of XRF methods:
Wavelength dispersive spectroscopy (WDS)
Energy dispersive spectroscopy (EDS)

XRF is a fast, accurate and non-destructive material characterization method thatrequires small amount of sampleMeasurement time varies between seconds and about 30 minutes per sampledepending on the number of determined elementsThe quantitative analysis based on measurement results takes seconds tocomplete

WDS(WDXRF)
EDS(EDXRF)
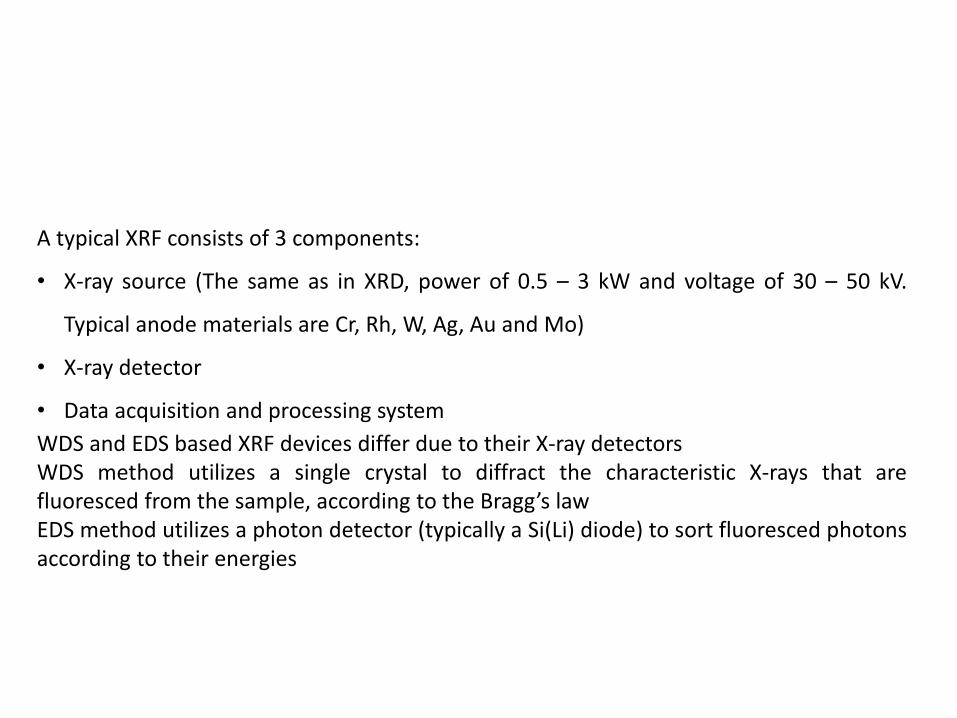
A typical XRF consists of 3 components:
• X-ray source (The same as in XRD, power of 0.5 – 3 kW and voltage of 30 – 50 kV.
Typical anode materials are Cr, Rh, W, Ag, Au and Mo)
• X-ray detector
• Data acquisition and processing system
WDS and EDS based XRF devices differ due to their X-ray detectorsWDS method utilizes a single crystal to diffract the characteristic X-rays that arefluoresced from the sample, according to the Bragg’s lawEDS method utilizes a photon detector (typically a Si(Li) diode) to sort fluoresced photonsaccording to their energies
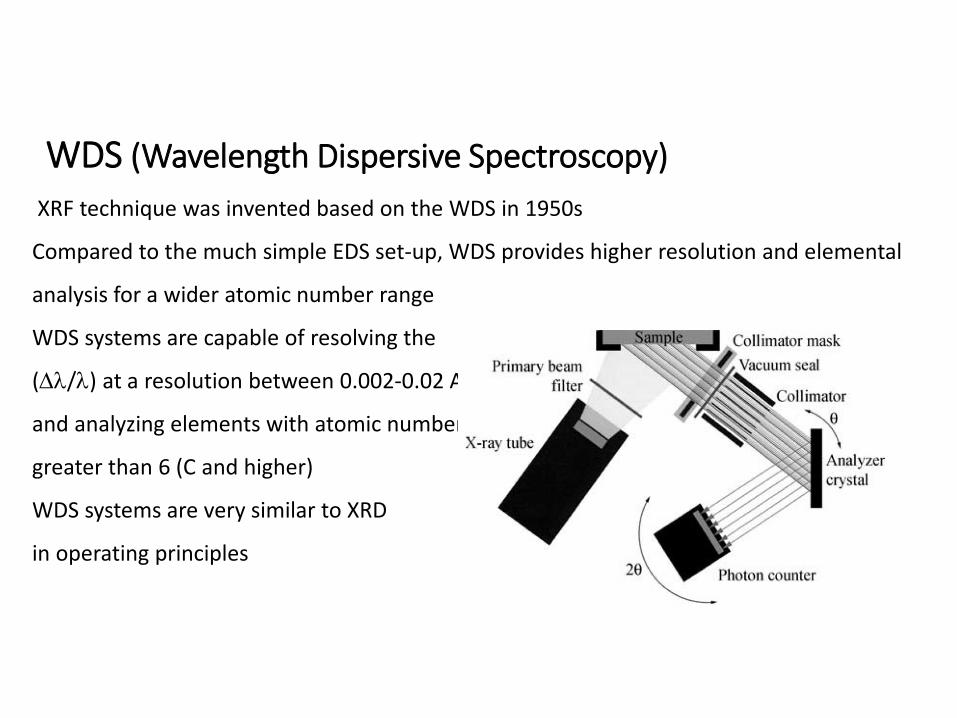
WDS (Wavelength Dispersive Spectroscopy)
XRF technique was invented based on the WDS in 1950s
Compared to the much simple EDS set-up, WDS provides higher resolution and elemental
analysis for a wider atomic number range
WDS systems are capable of resolving the
(Dl/l) at a resolution between 0.002-0.02 A
and analyzing elements with atomic number
greater than 6 (C and higher)
WDS systems are very similar to XRD
in operating principles
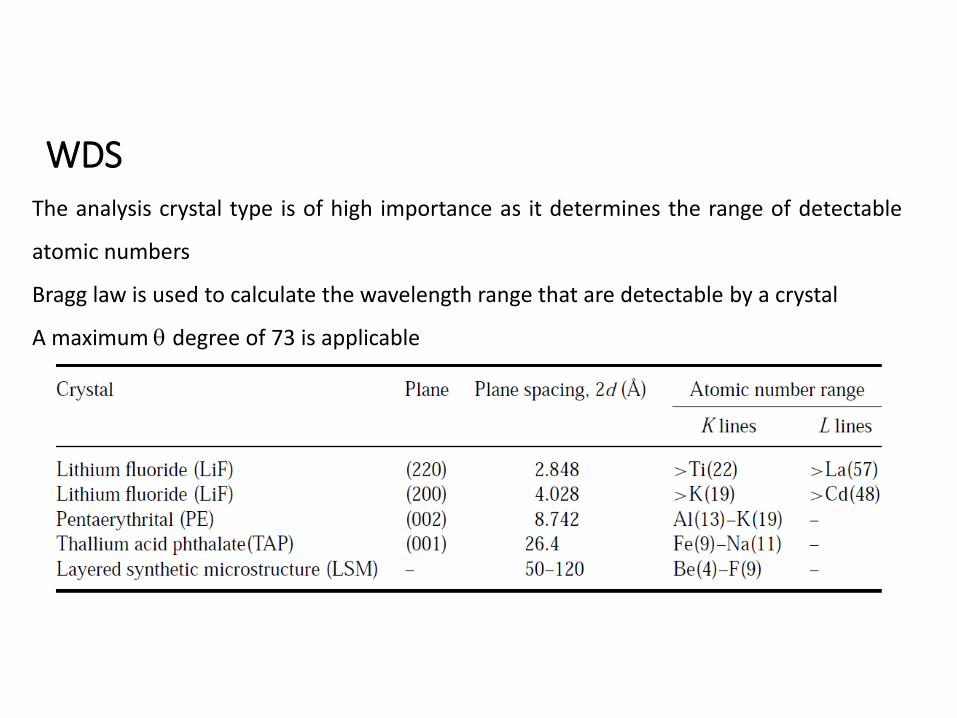
WDSThe analysis crystal type is of high importance as it determines the range of detectable
atomic numbers
Bragg law is used to calculate the wavelength range that are detectable by a crystal
A maximum degree of 73 is applicable
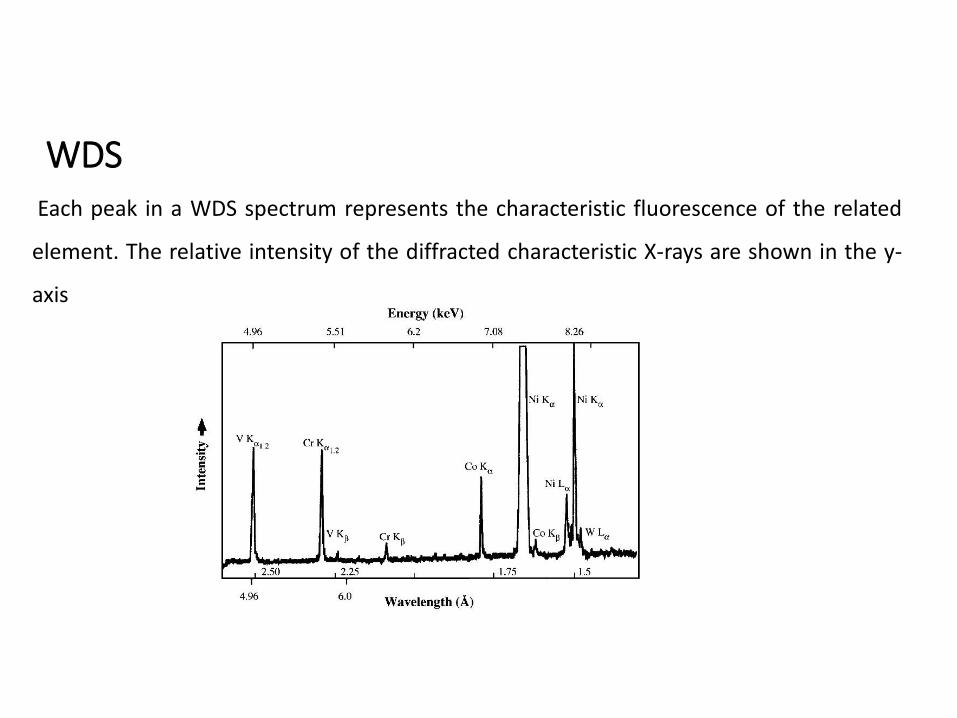
WDSEach peak in a WDS spectrum represents the characteristic fluorescence of the related
element. The relative intensity of the diffracted characteristic X-rays are shown in the y-
axis
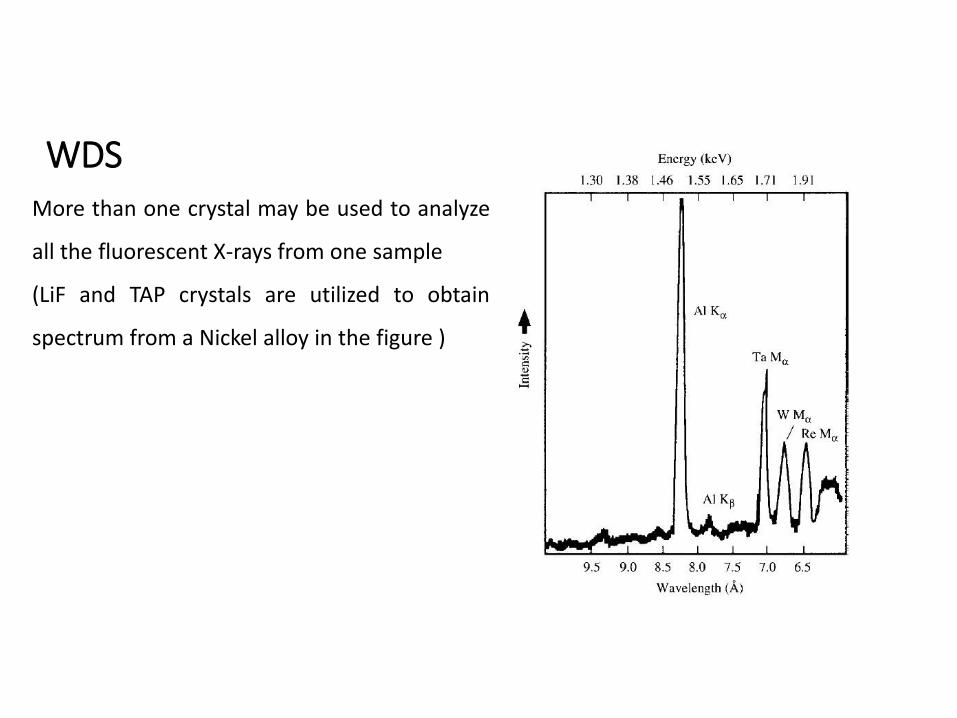
WDSMore than one crystal may be used to analyze
all the fluorescent X-rays from one sample
(LiF and TAP crystals are utilized to obtain
spectrum from a Nickel alloy in the figure )
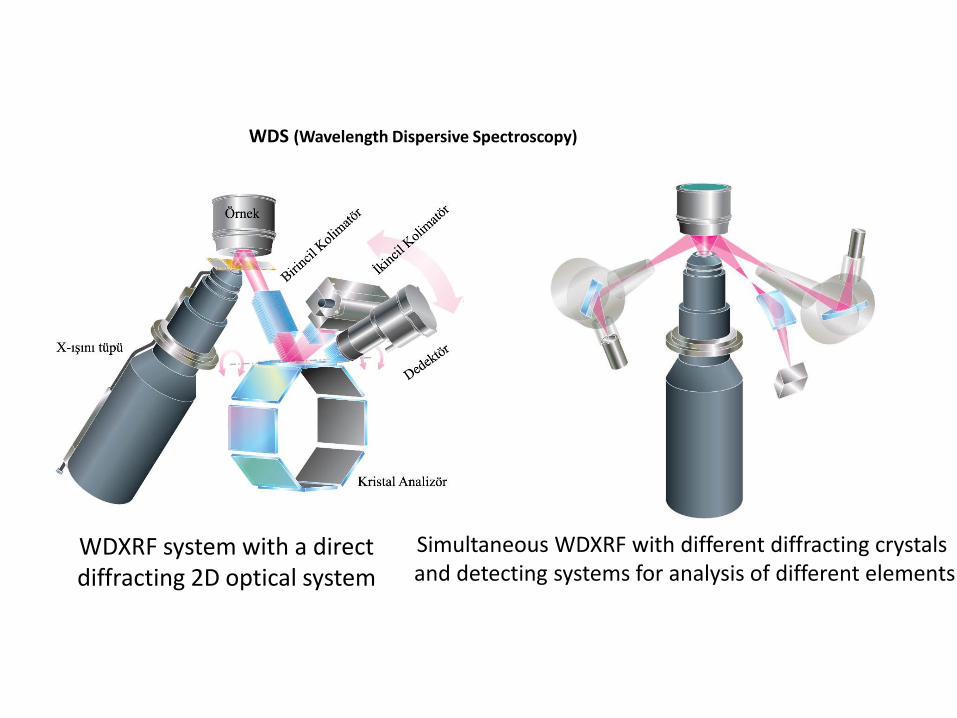
WDS (Wavelength Dispersive Spectroscopy)
Simultaneous WDXRF with different diffracting crystals and detecting systems for analysis of different elements
WDXRF system with a direct diffracting 2D optical system
EDSEnergy Dispersive Spectroscopy
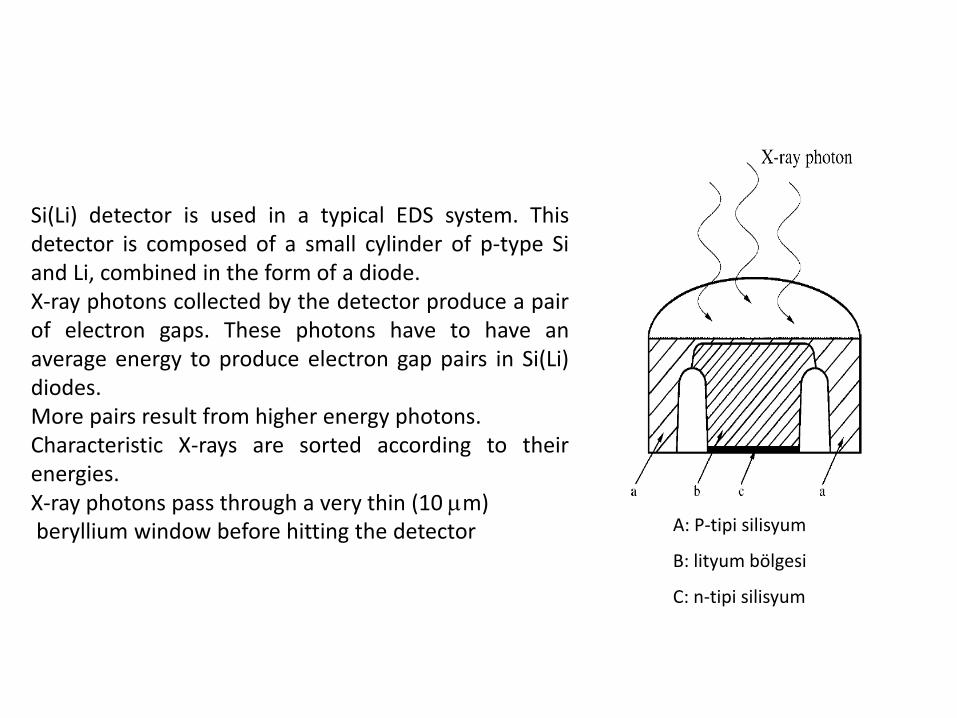
Si(Li) detector is used in a typical EDS system. Thisdetector is composed of a small cylinder of p-type Siand Li, combined in the form of a diode.X-ray photons collected by the detector produce a pairof electron gaps. These photons have to have anaverage energy to produce electron gap pairs in Si(Li)diodes.More pairs result from higher energy photons.Characteristic X-rays are sorted according to theirenergies.X-ray photons pass through a very thin (10 mm)beryllium window before hitting the detector A: P-tipi silisyum
B: lityum bölgesi
C: n-tipi silisyum

EDS Spectrum
EDS analysis of glass

EDXRF Geometry
• There are 2 fundamental spectroscopes: 2D and 3D
• They both contain an X-ray source and EDS detector. They differ by the optical path taken by the X-rays
2D optik sistemli 3D optik sistemli
EDS(EDXRF) spectroscope with 2D optical system
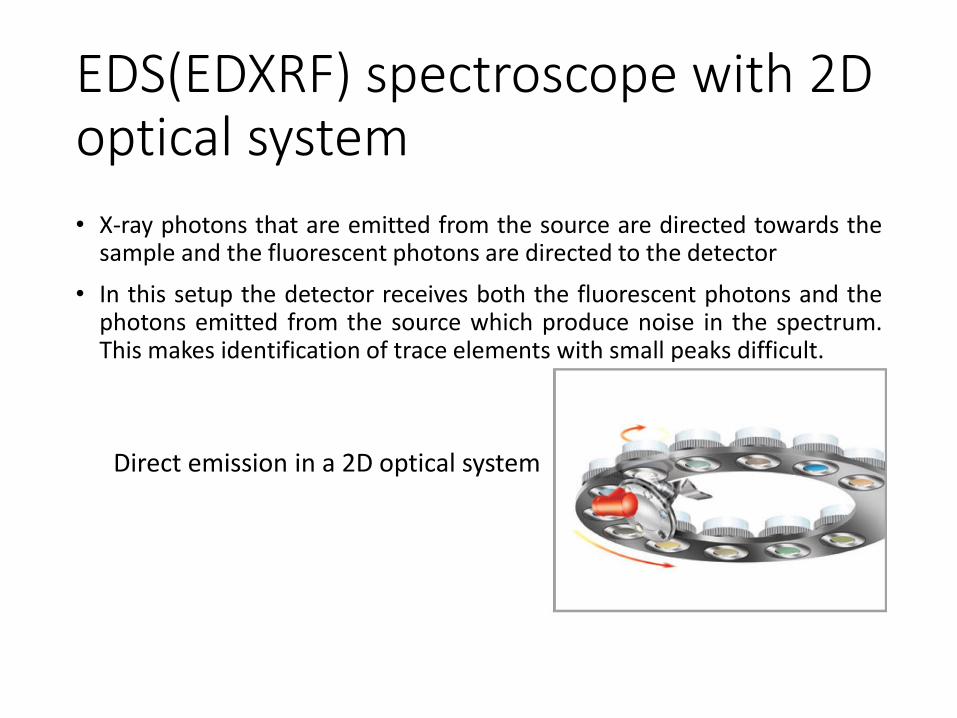
• X-ray photons that are emitted from the source are directed towards thesample and the fluorescent photons are directed to the detector
• In this setup the detector receives both the fluorescent photons and thephotons emitted from the source which produce noise in the spectrum.This makes identification of trace elements with small peaks difficult.
Direct emission in a 2D optical system
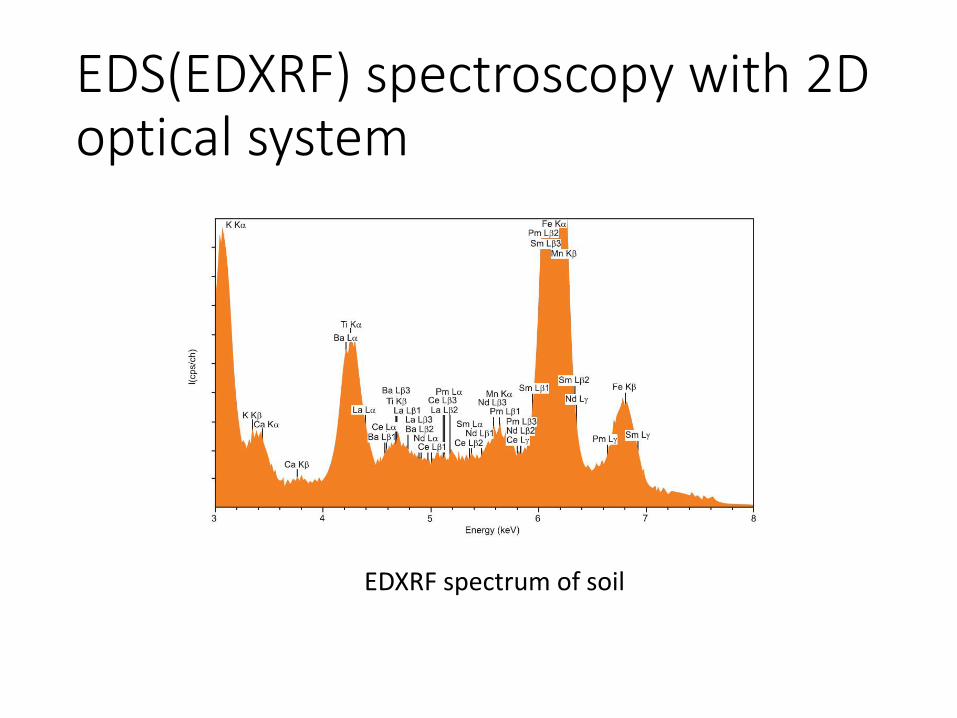
EDS(EDXRF) spectroscopy with 2D optical system
EDXRF spectrum of soil
EDS(EDXRF) spectroscopy with 3D optical system
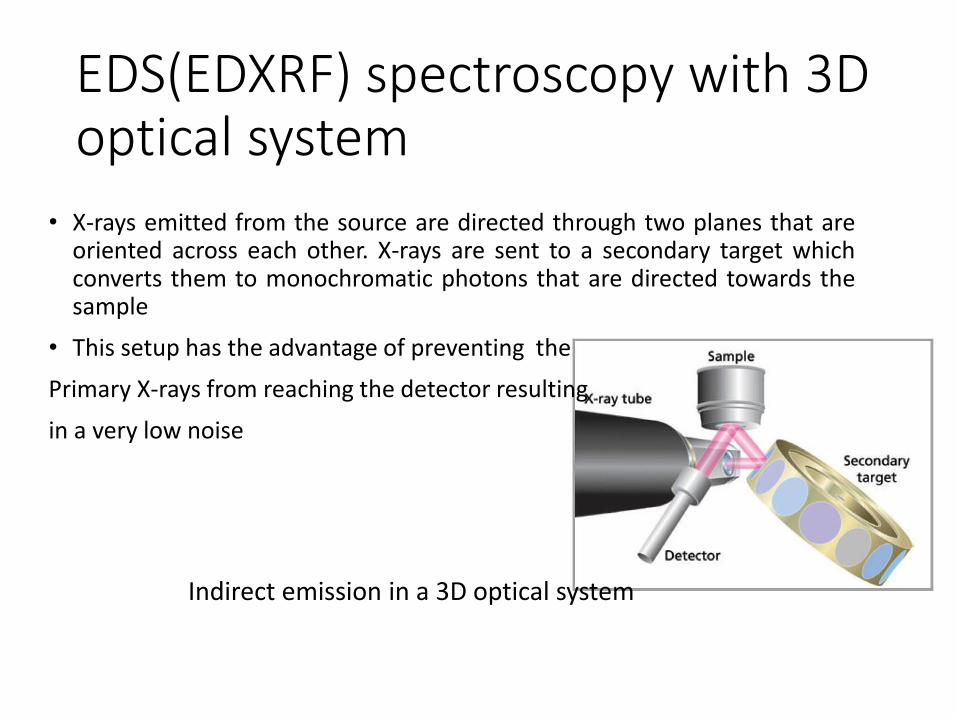
• X-rays emitted from the source are directed through two planes that areoriented across each other. X-rays are sent to a secondary target whichconverts them to monochromatic photons that are directed towards thesample
• This setup has the advantage of preventing the
Primary X-rays from reaching the detector resulting
in a very low noise
Indirect emission in a 3D optical system

EDS(EDXRF) spectroscopy with 3D optical system
EDXRF spectrum of soil using 3D optical system
EDS detector in the SEM
• EDS detectors are integrated into the SEM and TEM because they
are simpler than WDS. This setup enables elemental analysis
during microstructural analysis.
The main difference between the EDXRF and the EDS in SEM is the
mechanism of fluorescence from the sample. A high energy electron
beam is used in SEM EDS to generate fluorescence.
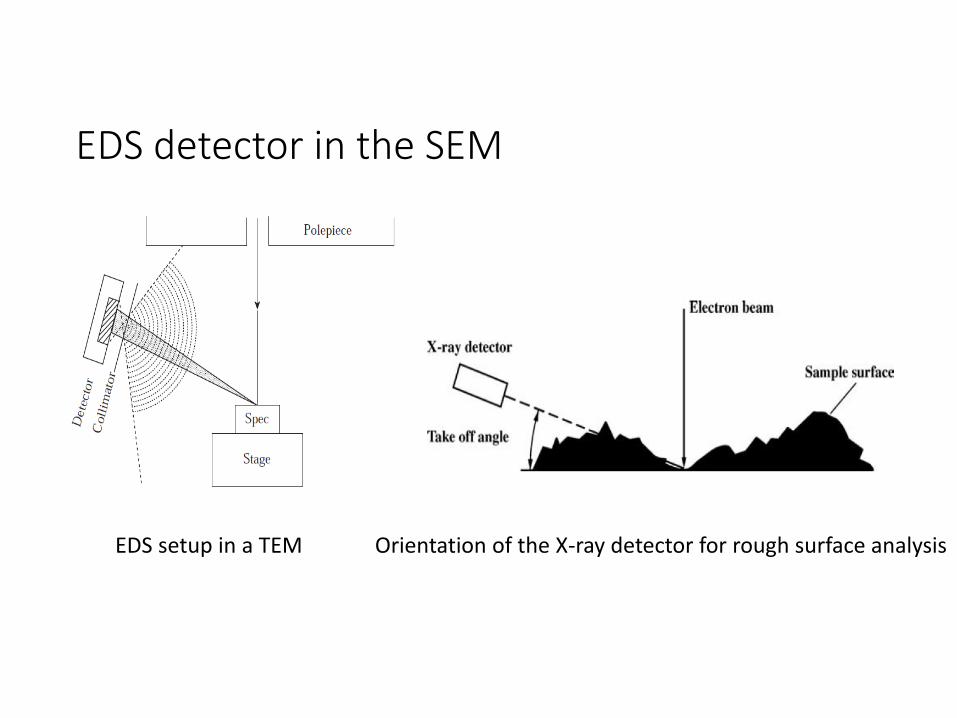
EDS setup in a TEM Orientation of the X-ray detector for rough surface analysis
EDS detector in the SEM

X-ray fluorescence zones from samples with different atomic numbers
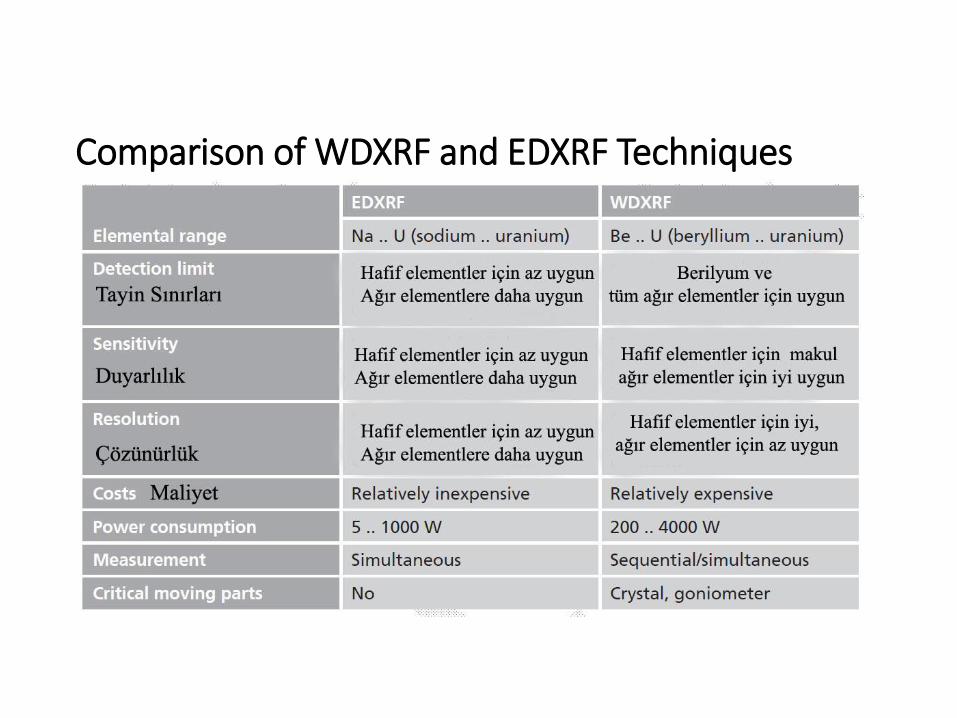
Comparison of WDXRF and EDXRF Techniques
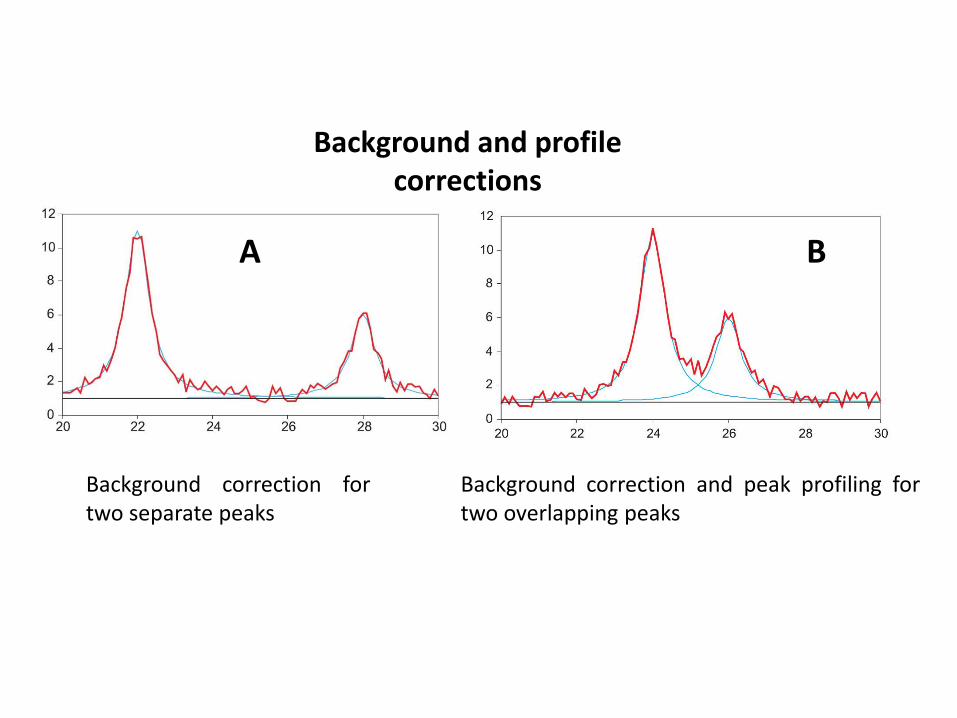
Background correction fortwo separate peaks
Background correction and peak profiling fortwo overlapping peaks
Background and profile corrections
A B

Peak intensity measurement and backgroundcorrection

Overlap factor
Peak overlapping and correction

Quantitative analysis using EDXRF ve WDXRF
• Intensity in EDXRF is obtained from peak area while peak height is used
for intensity measurement in WDXRF
• After a few calibration runs, the device converts relative peak intensities
into quantities
• Peak intensity in the spectrum does not only depend on the
concentration of the original element but also on the number and
intensities of other elements
• Presence of other elements may weaken or strengthen the intensity

Weight fraction of an element (X) is proportional to its relative intensity (IR) bythe instrument factor (K) and the sample matrix factor (M).
K is related to the condition of the source, emission and geometric position of
the sample
M contains 3 basic matrix factors:
1. Absorption of the X-ray by the sample2. Secondary absorption3. Secondary fluorescence
Quantitative analysis with EDXRF ve WDXRFTechniquesX = M * K * IR

Strengthening of the intensity of one element bythe secondary fluorescence of another element
A B
Absorption by the sample


