Download - Xoxo ir presentation 8 6-15

Investor Presentation | August 2015

2
© 2015 XO GROUP INC. ALL RIGHTS RESERVED.
This presentation may contain projections or other forward-looking statements regarding future events or our future financial
performance or estimates regarding third parties. These statements are only estimates or predictions and reflect our current
beliefs and expectations. Actual events or results may differ materially from those contained in the estimates, projections or
forward-looking statements. It is routine for internal projections and expectations to change as the quarter progresses, and
therefore it should be clearly understood that the internal projections and beliefs upon which we base our expectations may
change prior to the end of the quarter. Although these expectations may change, we will not necessarily inform you if they do. Our
policy is to provide expectations not more than once per quarter, and not to update that information until the next quarter. Some of
the factors that could cause actual results to differ materially from the forward-looking statements contained herein include, without
limitation, (i) our online wedding-related and other websites, mobile and other digital properties may fail to generate sufficient
revenue to survive over the long term, (ii) we incurred losses for many years following our inception and may incur losses in the
future, (iii) we may be unable to adjust spending quickly enough to offset any unexpected revenue shortfall, (iv) efforts to launch
new or upgrading existing technology and features may not generate significant new revenue or may reduce revenue from existing
services, (v) we may be unable to develop solutions that generate revenue from advertising and other services delivered to mobile
phones and wireless devices, (vi) the significant fluctuation to which our quarterly revenue and operating results are subject, (vii)
the seasonality of the wedding industry, (viii) our operations are dependent on Internet search engine rankings, and our ability to
influence those rankings is limited, (ix) the dependence of our registry and commerce services business on third parties, (x)
increased competition in our markets could reduce our market share, and (xi) other factors detailed in documents we file from time
to time with the Securities and Exchange Commission. Forward-looking statements in this release are made pursuant to the safe
harbor provisions contained in the Private Securities Litigation Reform Act of 1995.
This presentation includes certain "Non‐GAAP financial information." A reconciliation of such information to
the most directly comparable GAAP data can be found at the end of this presentation.
Safe Harbor
3
© 2015 XO GROUP INC. ALL RIGHTS RESERVED.
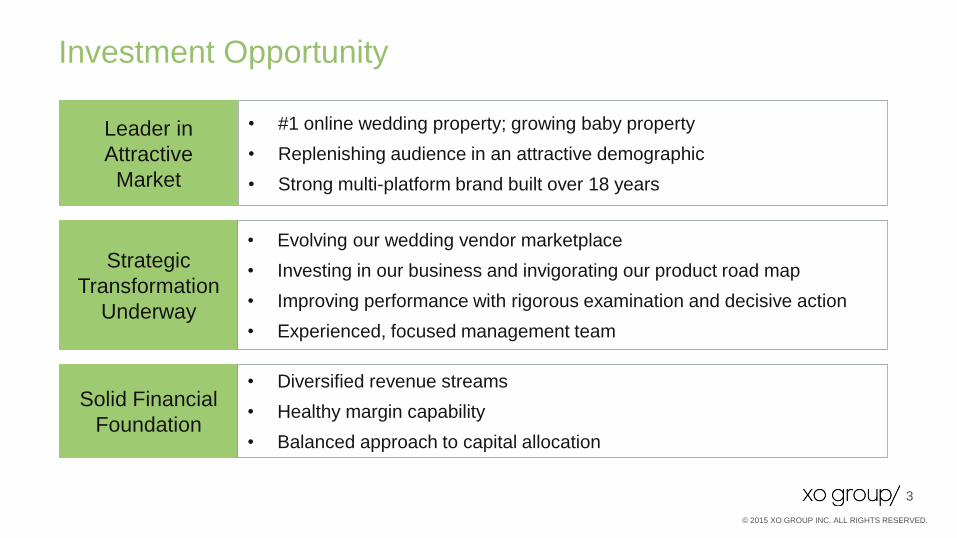
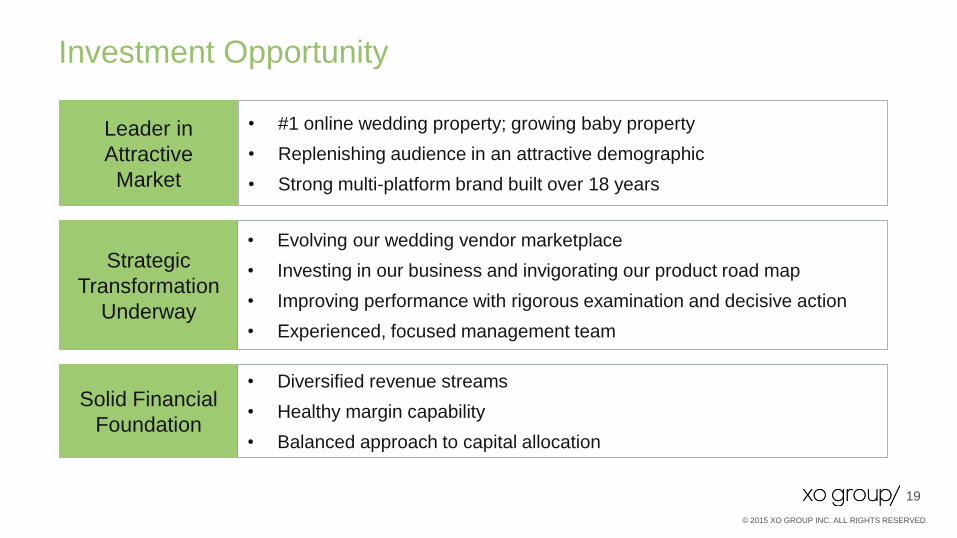
Leader in
Attractive
Market
• #1 online wedding property; growing baby property
• Replenishing audience in an attractive demographic
• Strong multi-platform brand built over 18 years
Solid Financial
Foundation
• Diversified revenue streams
• Healthy margin capability
• Balanced approach to capital allocation
Strategic
Transformation
Underway
• Evolving our wedding vendor marketplace
• Investing in our business and invigorating our product road map
• Improving performance with rigorous examination and decisive action
• Experienced, focused management team
Investment Opportunity

4
© 2015 XO GROUP INC. ALL RIGHTS RESERVED.
XO Group at a Glance Our mission is to help people navigate and truly enjoy life’s biggest moments, together. Our family of multi-platform
brands guide couples through transformative life stages, from getting married, to moving in together and having a
baby.
*Bump total revenue for the year ended December, 31 2014
*Number of employees as of 6/30/15
$143.7M $24.6M
604 #1
$53.8M 85.2%
18 years 9% of
revenue
2014 Revenue
(+7% Y/Y)
2014 Adjusted
EBITDA
Employees** Online Wedding
Property with Growing
Visitors
Free cash flow
generated over
last 3 years
2014 Gross Margin
Growing Baby
Property* Founded in 1996

5
© 2015 XO GROUP INC. ALL RIGHTS RESERVED.
Business Overview
*As of 6/30/15; avg revenue/vendor and retention rate calculated on a trailing 12 month basis **Ijie revenue included as part of The Knot
Local Online 41%
National Online 21%
Publishing/Other 20%
Merchandise
11%
Registry 7%
2014 Revenue by Business Line
2014 Revenue by Brand**
2014 Revenue $143.7M +7.4% Y/Y
Local
Online
Delivering qualified leads to local vendors; foundation for our
wedding vendor marketplace
• ~25,000 vendors*, ~$2,500 avg* revenue/vendor, ~76% retention*
National
Online Brand advertising to endemic and non-endemic advertisers
• The Bump national online revenue up 57% year-over-year 2014
Publishing
Other
Delivering award winning content & ads in local & national markets
• The Knot National magazine, regional magazines & The Bump
magazine; books
Registry
Service and
Commerce
Affiliate partnerships with top online wedding registries
• Registry revenue growth 20%+ year-over-year 2014
Merchandise Connecting our audience to goods and services through our commerce affiliate partners • Exited merchandise fulfilment operations during Q1 2015

6
© 2015 XO GROUP INC. ALL RIGHTS RESERVED.
The Knot: #1 in Weddings
6 months ended June 30, 2015
Unique Visitors Monthly Average
(in millions) with Year-Over-Year % Growth
*United States Census Bureau American Community Survey and The 2014 Knot Market Intelligence’s Annual Real Weddings Survey
Does not meet minimum
reporting requirements
Unique Visitor Source: comScore Multi Platform
• ~2 million marriages/yr
• 11 month average
planning cycle
• National avg. wedding
spend continues to grow:
$31,213 for 2014*
• $70+ B spent annually
Wedding
* Includes engagement
ring but does not include
honeymoon

7
© 2015 XO GROUP INC. ALL RIGHTS RESERVED.
• ~4 million
births/year
• $60+ B spend
annually on
newborns
Baby*
Growing mobile user-base dramatically
expands editorial and advertisers’ reach
The Bump: Growing Baby Platform
+16%
Y/Y
3.6M
6 month as of
June 30, 2015
Avg. Monthly
Unique Visitors
• 2014 Development team
focused on mobile apps
(not included by comScore)
• New responsive site launched
February 2015
Unique Visitor Source: comScore Multi Platform; *NCHS National Vital Health Statistics Reports and USDA report- expenditures on children

8
© 2015 XO GROUP INC. ALL RIGHTS RESERVED.
Strategic Transformation to Accelerate Growth
9
© 2015 XO GROUP INC. ALL RIGHTS RESERVED.
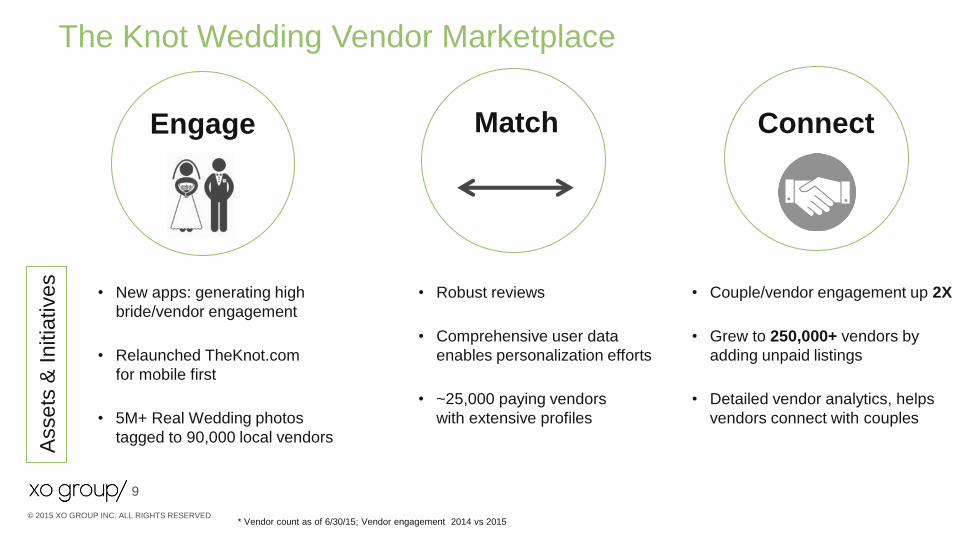
Engage
The Knot Wedding Vendor Marketplace
Match Connect
* Vendor count as of 6/30/15; Vendor engagement 2014 vs 2015
• New apps: generating high
bride/vendor engagement
• Relaunched TheKnot.com
for mobile first
• 5M+ Real Wedding photos
tagged to 90,000 local vendors
• Robust reviews
• Comprehensive user data
enables personalization efforts
• ~25,000 paying vendors
with extensive profiles
• Couple/vendor engagement up 2X
• Grew to 250,000+ vendors by
adding unpaid listings
• Detailed vendor analytics, helps
vendors connect with couples
Assets
& I
nitia
tives
10
© 2015 XO GROUP INC. ALL RIGHTS RESERVED.
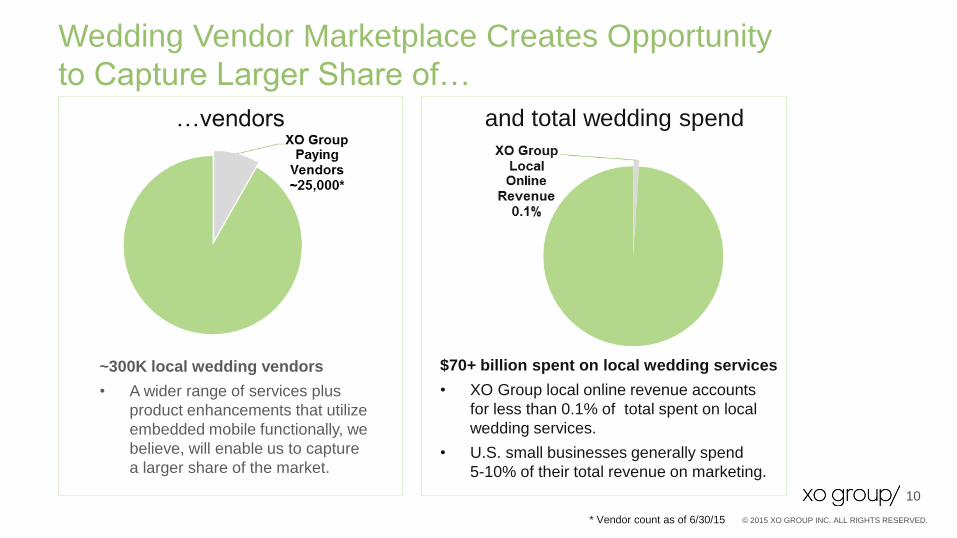
…vendors and total wedding spend
~300K local wedding vendors
• A wider range of services plus
product enhancements that utilize
embedded mobile functionally, we
believe, will enable us to capture
a larger share of the market.
Wedding Vendor Marketplace Creates Opportunity
to Capture Larger Share of…
* Vendor count as of 6/30/15
$70+ billion spent on local wedding services
• XO Group local online revenue accounts
for less than 0.1% of total spent on local
wedding services.
• U.S. small businesses generally spend
5-10% of their total revenue on marketing.
11
© 2015 XO GROUP INC. ALL RIGHTS RESERVED.
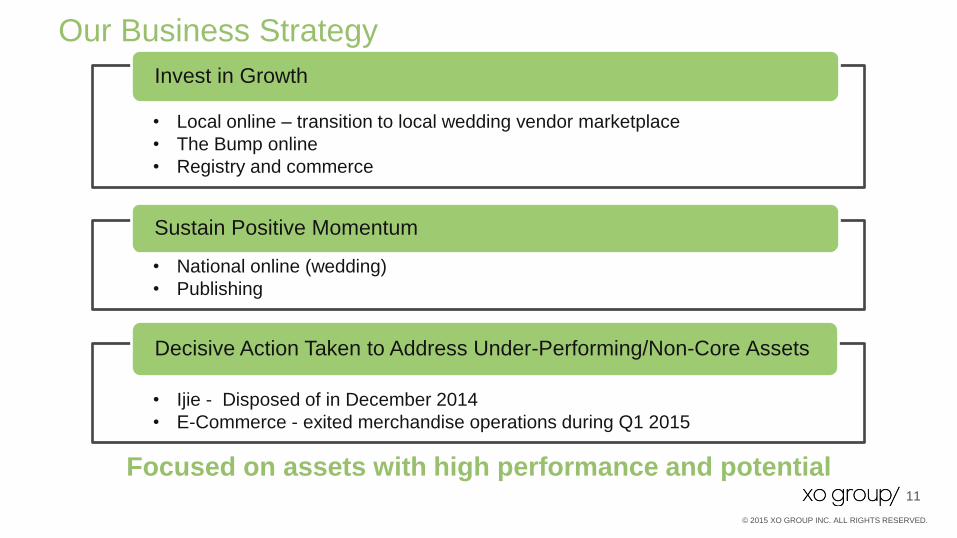
Focused on assets with high performance and potential
• Local online – transition to local wedding vendor marketplace
• The Bump online
• Registry and commerce
Invest in Growth
• National online (wedding)
• Publishing
Sustain Positive Momentum
• Ijie - Disposed of in December 2014
• E-Commerce - exited merchandise operations during Q1 2015
Decisive Action Taken to Address Under-Performing/Non-Core Assets
Our Business Strategy
12
© 2015 XO GROUP INC. ALL RIGHTS RESERVED.
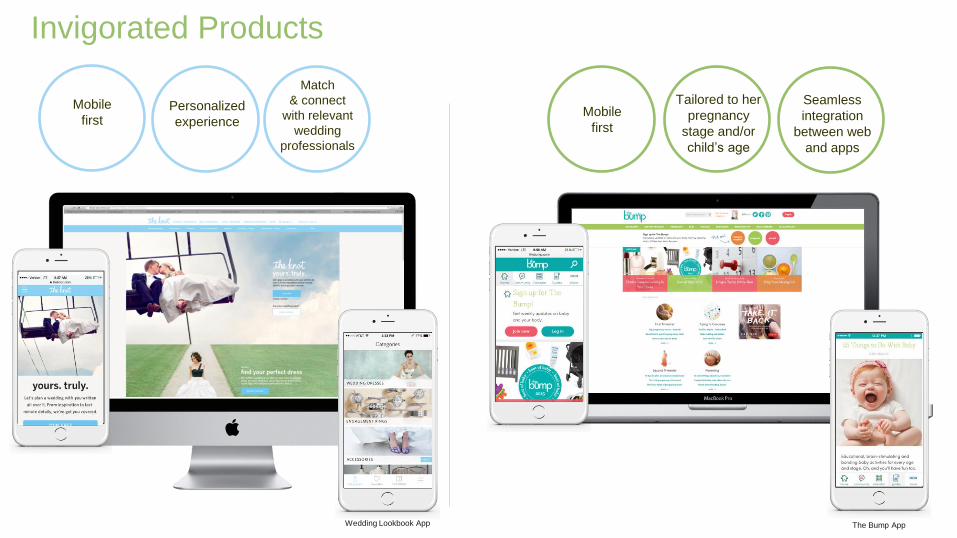
Invigorated Products
The Bump App Wedding Lookbook App
Personalized
experience
Mobile
first
Match
& connect
with relevant
wedding
professionals
Tailored to her
pregnancy
stage and/or
child’s age
Mobile
first
Seamless
integration
between web
and apps

13
© 2015 XO GROUP INC. ALL RIGHTS RESERVED.
Nic Di Iorio | Chief Technology Officer
• Chief Technology Officer since February 2008
• Cofounder and CEO of City24/7 LLC from (2006-2008),
where he remains a member of the Advisory Board
• Chief Technology Officer of Interpublic Group of Companies
(IPG)
• Joined XO Group July 2005; EVP of Local Enterprise (2010-
May 2015)
• Executive Director of Bridal & Gift Registry at
Linens ’n Things (1999-2005)
Kristin Savilia | President, Local Marketplace
Leadership Team Mike Steib | Chief Executive Officer
• Appointed CEO of XO Group March 2014; joined July 2013
• CEO at Vente-Privee USA (2011-2013)
• Managing Director Emerging Platforms; Google Inc.
(2007-2011)
• General Manager at NBC Universal
Gillian Munson | Chief Financial Officer
• Joined XO Group Nov. 2013
• MD at Allen & Co (2007-2013)
• VP Business Development at Symbol Technologies
(2003-2007)
• Executive Director and Senior Equity Analyst at
Morgan Stanley
• Cofounder; returned to XO Group in 2012
• Systems & operations consultant to the iCC division of
Group Commerce (2012)
• VP, General Manager of Interactive at United Media
(2007 - 2011)
Rob Fassino | Chief Product Officer Kathy Wu Brady | EVP, E-Commerce & Registry
• Joined XO in March 2014
• CEO of Vente-Privee USA, where sales doubled in 2013
under her management
• Held senior-level positions at AOL in strategy & operations,
and at NBC Universal
Dhanusha Sivajee | EVP, Marketing
• Joined XO in August 2014
• CMO, AOL Brand Group (June 2013-July 2014)
• VP, Marketing of Bloomberg Mobile (Feb. 2011–June 2013)
• Director, Affiliate & Advanced Product Marketing of HBO
including HBO GO (June 2004-Feb 2011)
Jennifer Garrett | EVP, National Enterprise
• Joined XO Group in February 2014
• Spent 12 years at Viacom Inc., in senior sales roles at
Nickelodeon and MTV Networks International

14
© 2015 XO GROUP INC. ALL RIGHTS RESERVED.
Financials

15
© 2015 XO GROUP INC. ALL RIGHTS RESERVED.
$49.9 $54.5 $59.1
$26.5 $27.2
$30.5 $6.2
$7.9 $10.4 $21.4
$18.4 $15.9
$25.1 $25.8
$27.8
2012 Revenue 2013 Revenue 2014 Revenue
Publishing/Other Merchandise
Registry and Commerce National Online
Local Online
$129.1 $133.8
$143.7
$MM
Solid Financial Foundation Adj. EBITDA ($MM)
2013 and 2014 FCF y/y decrease driven by an increase in capital
expenditures and a lower cash flow from operations –
Funding product transformation
Free Cash Flow (FCF) ($MM)
16
© 2015 XO GROUP INC. ALL RIGHTS RESERVED.
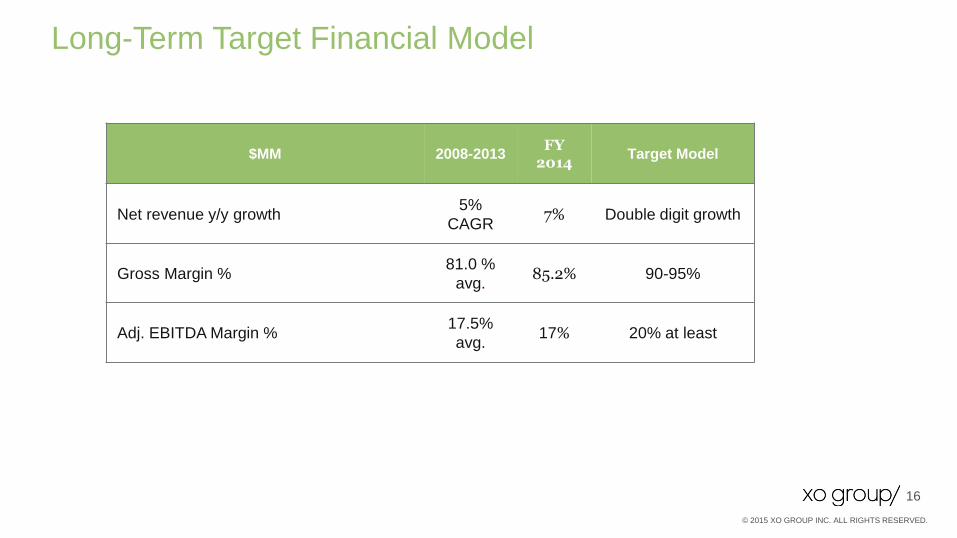
Long-Term Target Financial Model
$MM 2008-2013 FY
2014 Target Model
Net revenue y/y growth 5%
CAGR 7% Double digit growth
Gross Margin % 81.0 %
avg. 85.2% 90-95%
Adj. EBITDA Margin % 17.5%
avg. 17% 20% at least

17
© 2015 XO GROUP INC. ALL RIGHTS RESERVED.
Q2 Update
• text
Summary Income Statement ($M)
3 months ended 6/30/15
3 months ended 6/30/14
Revenue $36.2 $38.3
Gross Profit $33.3 $32.3
Margin 92.1% 84.2%
*Adjusted EBITDA $8.7 $8.3
Net Income $3.3 $3.0
Earnings per Diluted Share $0.13 $0.12
• Transactional businesses, Registry
and Commence, revenue +36% y/y
• Total revenue excluding merchandise
operations +8% y/y
• Gross margin 92%
• $85.6 million in cash
• Repurchased $2.8 million of shares
under $20 million share buyback
authorization (repurchased a total of
$10.4 million of shares under
authorization)
* Non- GAAP, please see reconciliation at the end of this presentation
Summary Balance Sheet ($M) 6/30/15 3/31/15
Cash and cash equivalents $85.6 $82.7
Other current assets 25.9 23.8
Total Assets 189.9 186.1
Debt 0 0
Current Liabilities 27.6 25.6
Total Liabilities 33.7 31.8
Total Liabilities and Stockholders’ Equity $189.9 $186.1

18
© 2015 XO GROUP INC. ALL RIGHTS RESERVED.
Capital Allocation Priorities
Capital Allocation Areas
• Internal investments
- In the midst of investment cycle: operating expenses to grow at
rates larger than revenue growth rates
• Strategic acquisitions and investments
- Assets that accelerate marketplace transformation
• Opportunistic stock buybacks
- $20 million authorization; repurchased $1.6 million during 2014
- Repurchased $8.8 million during the first half of 2015
19
© 2015 XO GROUP INC. ALL RIGHTS RESERVED.
Leader in
Attractive
Market
• #1 online wedding property; growing baby property
• Replenishing audience in an attractive demographic
• Strong multi-platform brand built over 18 years
Solid Financial
Foundation
• Diversified revenue streams
• Healthy margin capability
• Balanced approach to capital allocation
Strategic
Transformation
Underway
• Evolving our wedding vendor marketplace
• Investing in our business and invigorating our product road map
• Improving performance with rigorous examination and decisive action
• Experienced, focused management team
Investment Opportunity

21
© 2015 XO GROUP INC. ALL RIGHTS RESERVED.
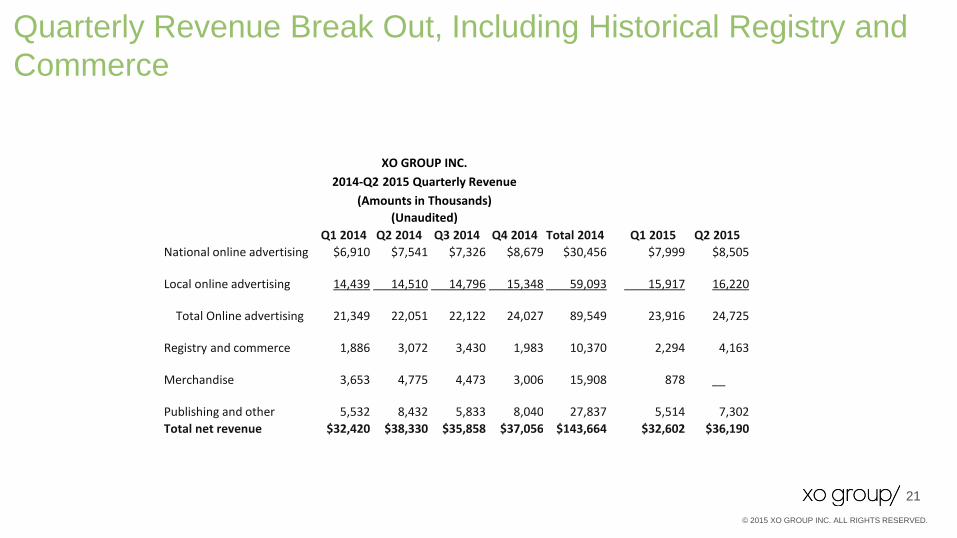
Quarterly Revenue Break Out, Including Historical Registry and
Commerce
XO GROUP INC.
2014-Q2 2015 Quarterly Revenue
(Amounts in Thousands)
(Unaudited)
Q1 2014 Q2 2014 Q3 2014 Q4 2014 Total 2014 Q1 2015 Q2 2015
National online advertising $6,910 $7,541 $7,326 $8,679 $30,456 $7,999 $8,505
Local online advertising
14,439 14,510 14,796 15,348 59,093 15,917 16,220
Total Online advertising
21,349 22,051 22,122 24,027 89,549 23,916 24,725
Registry and commerce
1,886 3,072 3,430 1,983 10,370 2,294 4,163
Merchandise
3,653 4,775 4,473 3,006 15,908 878 __
Publishing and other
5,532 8,432 5,833 8,040 27,837 5,514 7,302
Total net revenue $32,420 $38,330 $35,858 $37,056 $143,664 $32,602 $36,190

22
© 2015 XO GROUP INC. ALL RIGHTS RESERVED.
Reconciliation of GAAP to NON-GAAP Financial Measures: Q2 2015 & YTD
6/30/2015

23
© 2015 XO GROUP INC. ALL RIGHTS RESERVED.
Reconciliation of GAAP to NON-GAAP Financial Measures: 2012-2014


