downtime analysis as a tool to improve efficiency in...
TRANSCRIPT

Downtime Analysis as a tool to improve efficiency in automated production lines:
A bottle plant case study
Battini D., Persona A., Sgarbossa F., Zennaro I., De Marchi R.*
Department of Management and Engineering, University of Padova, Stradella San Nicola 3, Vicenza, Italy
*Production Manager, Acqua Minerale San Benedetto S.p.A., Viale Kennedy 65, Scorzè (VE), Italy
(e-mail: [email protected]; [email protected]; [email protected]; [email protected]; [email protected] )
Abstract:
Automated flow line manufacturing systems are becoming more and more relevant in our industries, especially in food and beverage sector. Safety, Quality and Sustainability are the main aspects that characterize this sector, but production efficiency remains the core objective of the entire system. In this context TPM (Total Productive Maintenance) is a useful tool to improve production plant effectiveness, through the utilization of OEE (Overall Equipment Effectiveness) index. One of the factor that considerably affects OEE in automated lines, is downtime, in particular micro downtimes of equipment, that are production minutes lost with low duration and high frequency that could not be define as failures. In this context micro downtimes are defined as short stops (few minutes) that are not related to failure, but, for example, to buffer capacity, layout parameters, production and product characteristics and other aspects. The paper presents the downtime analysis of a bottle production plant, from the OEE of the plant, the individuation of the most critical line, its global analysis, till the micro downtimes collection data and analysis. The aim of the paper is to present the initial studying and analysis of a TPM approach in food and beverage industry. It presents a framework for the individuation of the line criticalities, in relation to failures and OEE. The project aims to simulate the production system with a software and individuate suggestions and solutions to improve OEE with a cost-benefit analysis.
Keywords: Micro downtime, TPM, food & beverage, OEE, downtime analysis.
1. Introduction
Automated manufacturing systems are now being deeply influenced by the changing in market requests. A growing multitude of variants and an increasing product differentiation, due to various factors as more customization, shorter product lifecycles, uncertainty in demand, have to go along with an increase in effectiveness, to rise in the market competition [Mourtzis et al., 2012]. As the increasing of personalization of products, mix variability, requirement of short time to market and risk of products obsolescence, the need of continuous flow and JIT solutions forces the industries to achieve constant improvements in terms of product quality, operation efficiency and production capacity utilization [Battini et al. 2006]. Nowadays food and beverage sector is characterized by automated flow line manufacturing systems, that are several machines working in sequence, related to various transport systems. Automation, in general, has the core aim of reduce human participation in production systems, introducing machines for doing repetitive and/or complex actions, transforming production more continuous as possible. With this kind of production systems are required few operators that work as controller and supervisor of the process, and operate when is extremely necessary (for example during set ups). Food and Beverage sector, in addition to automation
peculiarities, is characterized by Safety, Quality and Sustainability aspects that collocated and identified the company in the market. A food company has to respect strict legislations and procedures to be accepted in the market, as safety of customers is the major priority. Quality and sustainability, on the other hand, have become pilot parameters to reach success. In this context automated equipment need complex systems and tools of control, as fix parameters and procedures well defined, certification, like ISO 22000, or tools like Hazard Analysis Critical Control Point system (HACCP), or others. Production systems effectiveness, anyway, remain the principal aim of each industry, to be competitive and get success. In this context Total Productive Maintenance (TPM) is a useful industrial tool to improve plants productivity and operation efficiency. It is designed primarily to maximize the effectiveness of equipment throughout its entire life by the participation and motivation of the entire workforce [Nakajima, 1988]. To measure effectiveness of production plants, TPM uses OEE index (Overall Equipment Effectiveness), that is the core metric to measure the success of TPM implementation program; it is the combination of three parameters as availability, performance and quality. The paper focused in micro downtime analysis, as it arises as a very relevant parameter that influence OEE in
XX Summer School "Francesco Turco" - Industrial Systems Engineering
162

automated flow line manufacturing systems. In fact, in accord with TPM framework, with an effective maintenance action plan, most of downtimes related to failures can be controlled and reduced; anyway micro downtimes remain a relevant cause of inefficiency, that needs a focused analysis. Micro downtimes could be considered as production line stops of few minutes but with high frequency. They are not related to failures, or to particular problems that requires maintenance staff intervention; they could be manage and solve by production operators. Micro downtimes could be named "process failures" and underestimate micro downtimes could be a big error in achieving OEE improvement. These stops are low in duration, but their high frequency makes them more incisive then a failure, sometimes.
The paper presents a bottle production plant case study, characterized by automated flow line manufacturing systems; the first section is dedicated to OEE index, as the principal TPM tool to measure improvements. Then the second one provides the description of the method and tools followed in the project. The third part is dedicated to the company profile and the data collection and analysis. Finally the last section regards the conclusions and further research.
2. Overall Equipment Effectiveness (OEE)
The Overall Equipment Effectiveness is the traditional evaluation index of Total Productive Maintenance that has to be maximized; it compares the operating level with the ideal potential of the plant performance [Lanza et al., 2013]. As it aims to measure the effectiveness of plant machinery, it summarizes the three main factors that affect it, as:
1. Availability, time for production; 2. Performance, time in which machines run; 3. Quality, final output.
These parameters are related to the six big wastes, as set-up, failures, micro downtimes, speed loss, reworks and scraps. Availability measures the time for the production of the equipment, and is related to big time losses, as set-ups and failures. Performance is related production efficiency, in terms of micro downtimes and speed losses, and measures the speed of the production system. Finally the rate of quality measures the effective production, through counting how many produced pieces can be considered final products, in accord with market standards. The target of TPM is to improve OEE percentage, to maximize plant productivity, to secure the equipment failure zero, defects and rework zero and industrial accident zero [Shirose et al., 1989]. "Studies carry out worldwide have revealed that the average OEE in producing companies is at about 60%" [Ryll et al., 2010]; in this context, to reach at least an index of 85% could be a proper objective, in addiction to economic and productivity benefits that OEE make risen.
3.Methods and Tools
The study aims to analyse in deep an automated production line, to construct the basis for a cost-benefit analysis to improve the OEE of the equipment.
To achieve this, the methodology followed is:
1. Collecting historical data of downtime of the equipment;
2. Collecting downtime data directly from the production system;
3. Implementing a Downtime Analysis (MTTF, MTTR, MTBF, etc.)
4. Implementing a Cost Analysis for each improvement action
5. Modelling and simulating the production system 6. Calculating a CPI Index (Cost Performance
Indicator) 7. Individuating priority on investing activities to
improve OEE;
Figure 1 presents the whole framework followed in the study. The paper presents the first part till downtime analysis.
Figure 1: Framework of the project
3.1 Data Collection and Downtime Analysis
Downtime data are collected both from historical database and directly from the production system. For each stop is signed the duration, the time and the nature (failure, set-up, micro downtime, etc.). Data are necessary to calculate:
TTF (Time to failure) MTTF (Mean time to failure) MTTR (Mean time to repair) MTBF(Mean time between failure)
XX Summer School "Francesco Turco" - Industrial Systems Engineering
163

These parameters are useful to study and construct the production line work reality. Moreover, through the data collection, the analysis allows to calculate for each cause of downtime the OEE loss; in this way it is possible to quantify the OEE recoverable, and it is useful for the cost-benefit analysis.
3.2 Cost Analysis
Cost Analysis is provided to calculate the impact from an economic point of view for each investment/action carried out from the downtime analysis. It is necessary for evaluating the priority of each activity in relation to OEE improvement..
3.3 CPI calculation
The Cost Performance Indicator aims to assign a priority to each improvement/maintenance activity. The index provides to compare the cost of the downtime, in terms of production loss, the cost of the activity and the OEE incisiveness.
To construct it, firstly it is defined:
i chronic downtimes (i=1,2...n) j random micro downtimes (j=1,2...m) k machine failures (k=1,2...p)
For each type of downtime, it will be discuss, through problem solving techniques and brain storming meetings, possible solutions, investment and maintenance activities to eliminate the time loss. After that, for each equipment improvement, it will be calculated the cost and compared with the OEE improvement. The CPI will be constructed as:
CPI = 𝐶𝑜𝑠𝑡 𝐸𝑞𝑢𝑖𝑝𝑚𝑒𝑛𝑡 𝐼𝑚𝑝𝑟𝑜𝑣𝑒𝑚𝑒𝑛𝑡[€]𝑂𝐸𝐸 𝐼𝑚𝑝𝑟𝑜𝑣𝑒𝑚𝑒𝑛𝑡 [%]
The lower the CPI is, more suitable the investment, as it means low costs and high OEE improvement.
4. The company and the OEE analysis
The company is situated in beverage world market and presents the biggest plant of Europe. Its core business is centred in mineral water and beverage, of its property and for third parts. It has 1800 employees, 6 plants in Italy (and others around the world), and a turnover of 720 million (2013). The project is situated in the core factory in Italy, that has 23 production lines: glass, PET and aseptic lines with numerous formats (0.25L, 0.5L, 1L, 1,5L, etc.). Moreover the company not only provide to bottling their products, but it produces the bottles, the plugs and the stamps for doing these ones from itself. Because of increased competency levels and demand of quality products at lower costs, companies needs a comprehensive system to achieve optimum output from the equipment [Dogrà et al., 2011]. The company reaches a high maturity level, as it was founded in 1956; because of its complexity, it requires a considerable maintenance system. In fact the company
implemented a maintenance engineering department to maintain the plant in order to produce the required output; it comprehends maintenance technicians (mechanics, electricians and plumbers), production line technicians, a maintenance planner, improvement technicians, and a maintenance engineering team leader. The company decided to implement TPM paradigm in 2013, to improve efficiency and effectiveness of the equipment. In order to do that, a first step of “make order” was applied to all the factory. Spare parts, activities, resources and all information related to maintenance were collected in order to have a clear situation of the AS-IS statement. This step took times and resources, but results were not immediately visible by an economic point of view. This philosophy requires a "drastic change" in production mindset and maintenance approaches [Fredendall et al., 1997]. In fact TPM is a useful tool, but it is a process that requires time and time to be well implemented and shows results, as at first it requires a deep mind change. For these reasons, a “faster” TPM project on a pilot line has been implemented; it aims to show more rapidly TPM benefits, to increase people trust in the project. The paper presents the pilot line selection as the one with the lowest OEE, to make results rise more and more, and its downtime analysis.
This part of the project is divided in the following steps: 1. OEE plant analysis 2. Individuation of the pilot line 3. Pilot line OEE analysis 4. Problem solving – individuation of the lower
parameter 5. Solutions and results
4.1 OEE Plant Analysis
As first it has been studied the efficiency of the production equipment of all the production plant in terms of OEE. The company calculates the OEE from years, to measure the efficiency of the production plant; data collection is made by the production personnel, day by day, in a common database following specific procedures. For each day it is signed:
1. time loss for machines downtime, distinguishing between failures and micro downtimes;
2. time loss for set ups; 3. time loss for law material lack; 4. time loss for preventive maintenance (Planned
downtime) 5. time loss for resources lack 6. planned and final output
It has been analysed the data about OEE plant referred to one year (2013), as it can been seen in Figure 2. From the graphic the worst line is A, but it was going to be disused; furthermore line B and C were quite new (the low OEE was justified).
XX Summer School "Francesco Turco" - Industrial Systems Engineering
164
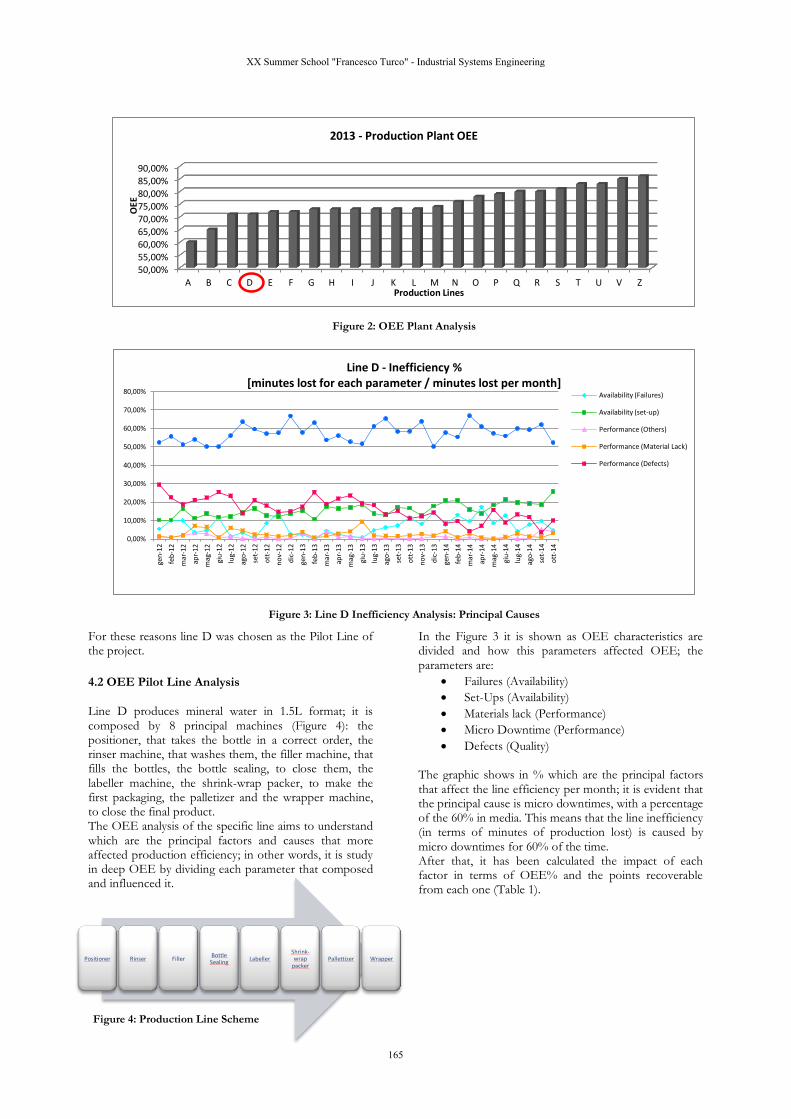
For these reasons line D was chosen as the Pilot Line of the project.
4.2 OEE Pilot Line Analysis
Line D produces mineral water in 1.5L format; it is composed by 8 principal machines (Figure 4): the positioner, that takes the bottle in a correct order, the rinser machine, that washes them, the filler machine, that fills the bottles, the bottle sealing, to close them, the labeller machine, the shrink-wrap packer, to make the first packaging, the palletizer and the wrapper machine, to close the final product. The OEE analysis of the specific line aims to understand which are the principal factors and causes that more affected production efficiency; in other words, it is study in deep OEE by dividing each parameter that composed and influenced it.
In the Figure 3 it is shown as OEE characteristics are divided and how this parameters affected OEE; the parameters are:
Failures (Availability) Set-Ups (Availability) Materials lack (Performance) Micro Downtime (Performance) Defects (Quality)
The graphic shows in % which are the principal factors that affect the line efficiency per month; it is evident that the principal cause is micro downtimes, with a percentage of the 60% in media. This means that the line inefficiency (in terms of minutes of production lost) is caused by micro downtimes for 60% of the time. After that, it has been calculated the impact of each factor in terms of OEE% and the points recoverable from each one (Table 1).
50,00% 55,00% 60,00% 65,00% 70,00% 75,00% 80,00% 85,00% 90,00%
A B C D E F G H I J K L M N O P Q R S T U V Z
OEE
Production Lines
2013 - Production Plant OEE
0,00%
10,00%
20,00%
30,00%
40,00%
50,00%
60,00%
70,00%
80,00%
gen-
12
feb-
12
mar
-12
apr-1
2 m
ag-1
2 gi
u-12
lu
g-12
ag
o-12
se
t-12
ot
t-12
nov-
12
dic-
12
gen-
13
feb-
13
mar
-13
apr-1
3 m
ag-1
3 gi
u-13
lu
g-13
ag
o-13
se
t-13
ot
t-13
nov-
13
dic-
13
gen-
14
feb-
14
mar
-14
apr-1
4 m
ag-1
4 gi
u-14
lu
g-14
ag
o-14
se
t-14
ot
t-14
Line D - Inefficiency % [minutes lost for each parameter / minutes lost per month]
Availability (Failures)
Availability (set-up)
Performance (Others)
Performance (Material Lack)
Performance (Defects)
Figure 1:OEE Plant Analysis Figure 2: OEE Plant Analysis
Figure 3: Line D Inefficiency Analysis: Principal Causes
Positioner Rinser Filler Bottle Sealing Labeller
Shrink-wrap
packer Pallettizer Wrapper
Figure 4: Production Line Scheme
XX Summer School "Francesco Turco" - Industrial Systems Engineering
165

In the same way, figure 5 shows OEE division for each cause. Plant operating time correspond to an OEE of 100%, considering all the time that theoretically is planned for production. Then there is the Operating time that represents the time loss for failures and set-ups; the net operating time is influenced by the performance of the production systems, in terms of materials lack and micro downtimes. Finally the fully productive time represents the quality loss in production. The figure well expose the great impact of micro downtime on OEE index, with the red area in the net operating time. The line presents an OEE of 71.57%; without micro downtimes the OEE could be 87.78%. This 16% of margin represents a great potential for improvements. For these reasons the analysis is concentred from here on micro downtimes. As first it has been analysed micro downtimes data about
last years, to individuate most critical machines in the line. Figure 6 shows the machines that result more affected by micro downtimes: the pallettizer, the shrink-wrap packer and the labeller. In the second part of the analysis, it has been collected micro downtime data about these three machines.
4.3 Micro Downtimes Analysis
This step includes to study in deep micro downtimes of these three machines. Micro downtimes are considered in the paper as short stops of few minutes, related to "process failures", with high frequency. For each machine, principal micro downtimes have been identified, speaking with both production and maintenance staff. Data have been collected by production operators and by the supervisor of the project, for a period of two months, in random production turns and days. Figure 7 presents the micro downtimes pareto analysis of the palletizer (the most critical machine).
It shows the impact of each process failure in terms of frequency (number of stops); Figure 8 presents the same analysis but showing the impact in terms of time (minutes). Anyway, the main causes are the same both in terms of frequency and time. The first 5 causes cover the 80% of the time loss for micro downtimes of the palletizer (Table 2).
OEE-actual 71,57% Improvement Margin
+ OEE-materials lack 72,29% 0,72% + OEE-defects 76,01% 4,44% + OEE-set-ups 76,01% 4,44% + OEE-micro downtime 87,78% 16,20% + OEE-failures 73,55% 1,98%
Table 1: OEE Improvement Margin- Line D
Figure 5: OEE Analysis-Causes identification
0
5000
10000
15000
20000
25000
Machines Micro downtimes (2012-2014) [minutes]
0,00%
20,00%
40,00%
60,00%
80,00%
100,00%
120,00%
0,00 100,00 200,00 300,00 400,00 500,00 600,00 700,00 800,00
Pareto Analysis Palletizer [min]
0,00%
20,00%
40,00%
60,00%
80,00%
100,00%
120,00%
0
100
200
300
400
500
600
700 Pareto Analysis Palletizer (n° of stops)
Figure 6: Micro Downtime Analysis per Machine - Line D
Figure 7: Palletizer - Micro downtime Pareto Analysis [Frequency]
Figure 8: Palletizer - Micro downtime Pareto Analysis [minutes]
XX Summer School "Francesco Turco" - Industrial Systems Engineering
166

The same analysis has been done also for the shrink-wrap packer and the labeller . Main micro "process failures" have been individuated and studied in deep for the three critical machines.
Once principal micro downtimes have been identified and studied, it has been calculated the possible recovered OEE for each one per month (Figure 9). Palletizer micro downtimes, as the most critical machine, covered the three first positions. This graphic points out the principal criticalities of the line, based on OEE index. It is an important tool for management to measure possible saving from further investments. On the other hand, it is necessary to measure incisiveness in terms of OEE of all micro downtimes, to highlight the improvement margin, and to support a cost-benefit analysis. Figure 10 and Figure 11 show the OEE areas during the data collection per day: blue area represents the real OEE, while the red one represents the possible OEE without micro downtimes of the three critical machines. It is evident that OEE improvement margin is considerable, both in March and in April.
Table 3 represents OEE improvement margin per month, summarizing data from the spider graphics. As the data have been collected for 8 hours per day and the line produces for 16 hours per day, it has been
assumed that micro downtimes measured, during the eight hours were approximately half of the entire production time. So the startling hypothesis is that the micro downtimes in the whole production are the double respected the measured ones. In this way it has been calculated the possible OEE without micro downtimes. The OEE improvement margin is in media 7 point (%) per month.
Palletizer
Total Time loss [min]
% time loss
% accumulate
Lack bottles in entrance 694,38 32,46% 32,46%
Output Transports full 615,10 28,75% 61,21%
Bottles not aligned in entrance 218,67 10,22% 71,43%
Pallet not alligned 130,58 6,10% 77,53% Products layer
uncorrect 108,00 5,05% 82,58%
Table 2: Palletizer - Principal Micro Downtimes
Figure 9: Line-D: OEE improvement per Micro Downtimes per Month
Figure 10: OEE Improvement Area - March [Line D]
Figure 11: OEE Improvement Area - March [Line D]
XX Summer School "Francesco Turco" - Industrial Systems Engineering
167

5. Conclusion and further research
The analysis shows as little production problems could have a great impact in terms of production efficiency. Often big failures are overestimated, hiding big losses as micro downtimes. The case study presented in the paper is just the first part of the research project. Table 4 summarizes steps done till today, as the data collection and the Downtime Analysis. Next step will provide to study each critical micro downtime cause in deep. It will be necessary to understand if it is chronic or casual. Then it will be necessary to evaluate a solution (lay-out improvements, changing machine, etc.) with a cost-benefit analysis. To better understand the line criticalities and dynamics, and to validate the problems emerged a line model could be constructed with a simulator program. After that, through the calculation of the CPI, the analysis will be support a decision making step.
Table 4: Case Study Steps, Objectives and Results
In conclusion, to improve OEE is the core objective of most companies nowadays, through maximizing machinery utilization and minimizing costs. The paper presents the OEE analysis of an automated production plant, aiming to show the possible implications and benefits of it. It reveal importance and incisively of short
process downtimes in automated production systems. It proposes how to identify the most critical aspects and how they could impact OEE. Finally it is presented a framework to reach a cost-benefit analysis based on downtime and OEE analysis.
Acknowledgements
Our heartfelt thanks to Acqua Minerale San Benedetto S.p.A. to have make possible the realization of the project and the data collection and analysis. Furthermore we are grateful to Maintenance Engineering Team and all the staff for the close collaboration and great support.
March April
Original OEE 70,62% 72,68%
New OEE 78,42% 79,95%
Δ OEE 7,80% 7,28%
Productin loss [bottles] 1 016 509 921 264
Production time loss (Hours) 33,88 30,71
Table 3: OEE Improvement Margin per Month
Step Objective Result 1. OEE plant analysis
Individuation of the pilot line Line D
2. Pilot Line Analysis (OEE)
Individuation of the most critical parameter
Micro Downtimes
3.Micro downtime Analysis
Individuation of critical machines
Palletizer, Shrink-
wrap packer
labeller
4.Machine Analysis
Individuation of critical microdowntimes
Principal process failure for each machine
5. Analysis of principal Process Failure
Calculation of OEE improvement +7% per month
XX Summer School "Francesco Turco" - Industrial Systems Engineering
168

References
Ahuja I.P.S., Khamba J.S.; (2007). An evaluation of TPM initiatives in an Indian Manufacturing enterprise. Journal of Quality in Maintenance engineering, Vol. 13, No. 4, pp. 338-352.
Ahuja I.P.S., Khamba J.S., (2008). Total Productive Maintenance: literature review and directions. International Journal of Quality and Reliability Management, Vol. 25, No. 7, pp. 709-756.
Battini D., Manzini R., Persona A., Regattieri A., (2006). TPM Approach and new buffer design paradigm in plant layout. 12th ISSAT International Conference on Reliability and Quality in design. Chicago, August 3-5, 2006.
Batumalay Ir. K., Santhapparaj A. S., (2009). Overall Equipment Effectivenss (OEE) through Total Productive Maintenance (TPM) Practices - A study across the Malaysian. Industries.Technical Postgraduates (TECHPOS). Kuala Lumpur , 14-15 Dec. 2009, pp. 1-5.
Brah S.A., Chong W.K., (2004). Relationship between total productive maintenance and performance. International Journal of Production Research. Vol. 42, No. 12, pp. 2383-2401.
Chan F.T.S., Lau H.C.W., Ip R.W.L., Chan H.K., Kong S., (2005). Implementation of total productive maintenance: A case study. International Journal of Production Economics, Vol. 95, No. 1, pp. 71-94.
Dal B., Tugwell P., Greatbanks R. (2000). Overall equipment effectiveness as a measure of operational improvement: a pratical analysis. International Journal of Operations and Production Management, Vol. 20, No. 12, pp. 1488-1502.
De Groote P., (1995). Maintenance Performance Analysis: a pratical approach. Journal of Quality Maintenance Engineering, Vol. 1, pp. 4-24.
Dogrà M., Sharma V., S., Sachdeva A., Dureja J.S., (2011). TPM- A key strategy for productivity improvement in process industry. Journal of Engineering Science and Technology, Vol. 6, No. 1, pp. 1-16.
Fredendall L. D., Patterson J. W., Kennedy W. J. Griffin T., (1997),. Maintenance: Modeling Its Strategic Impact, Journal of Managerial Issues,. Vol. 9, No. 4, pp. 440-453.
Huang S.H., Dismukes J.P., Shi J., Su Q., Razzak M.A., Bodhale R., Robinson D.E., (2003). Manufacturing productivity improvement using effectiveness metrics and simulation analysis. International Journal of Operations and Production Management, Vol. 21, pp. 1404-1416.
Huang S.H., Dismukes J.P., Shi J., Su Q. (2002). Manufacturing system modeling for productivity improvement. Journal of Manufacturing Systems. Vol. 21, No. 4, pp. 249-260.
Hussan S., Al-Chalabi, Lundberg J., Wijaya A., Ghodrati B., (2014). Downtime Analysis of drilling machines and suggestions for improvements. Journal of Quality in Maintenance Engineering, Vol. 20, No. 4, pp. 306-332.
Jeong K-Y, Philips D.T., (2001). Operational efficiency and effectiveness measurements. International Journal of Operation & Production Management, Vol. 21 No. 11, pp. 1404-1416.
Juric Z., Sanchez A.I., Goti A. (2006). Money-based Overall Equipment Effectiveness. Hydrocarbon Processing. Vol. 85, No. 5, pp. 43-55.
Kotze D. (1993). Consistency accuracy lead to maximum OEE benefits. TPM newsletter, Vol. 4, No. 2, AITPM, Productivity, Inc., Norwalk.
Lanza G., Stoll J., Stricker N., Peters S., Lorenz C., (2013). Measuring Global Production Effectiveness. Forty Sixth CIRP Conference on Manufacturing Systems 2013.
Ljungberg O., (1998). Measurement of overall equipment effectiveness as a basis for TPM activities. International Journal of Operations & Production Management, Vol. 18, No. 5, pp. 495-507.
Moubray J., (2003). 21st Century Maintenance Organization: Part 1- The Asset Management Model - Maintenance technology. Applied Technology Publications, Barrington, IL.
Mourtzis D., Doukas M., (2012). Decentalized Manufacturing Systems Review: Challenges and Outlook, Logistics Research, Springer. 1865-0368.
Nachiappan R. M., Anantharaman N., (2006). Evaluation of overall line effectiveness (OLE) in a continuous product line manufacturing system. Journal of Manufacturing Technology Management, Vol. 18, No. 11, pp. 1111-1124.
Nakajima S. (1988). Total Productive Maintenance – Introduction to TPM. Productivity Press; ISBN 0-915299-23-2.
Sharma R.K., Kumar D., Kumar P. (2005). FLM to select suitable maintenance strategy in process industries using MISO model. Journal of Quality in Maintenance engineering, Vol. 11 No. 4, pp. 359-374.
Samuel H.H., John P.D., Shi J. Qi S, (2002). Manufacturing system modeling for productivity imorovement. Journal of Manufacturing Systems, Vol. 21 No. 4, pp. 249-260.
XX Summer School "Francesco Turco" - Industrial Systems Engineering
169

Shirose K. (1989). Equipment Effectiveness, Chronic Losses, and Other TPM Improvement Concept in TPM Development Program: Implementing Total Productive Maintenance. Productivity Press. Portland, OR.
Yuseni A.B., Wahab, Basari S.H., (2013). Analysis of Down Time and Reliability Estimation in Hostel Building Maintenance – A case study. Middle East Journal of Scientific Research, Vol. 17, No. 9, pp 1213-1219.
XX Summer School "Francesco Turco" - Industrial Systems Engineering
170