downtown san diego december sales statistics
DESCRIPTION
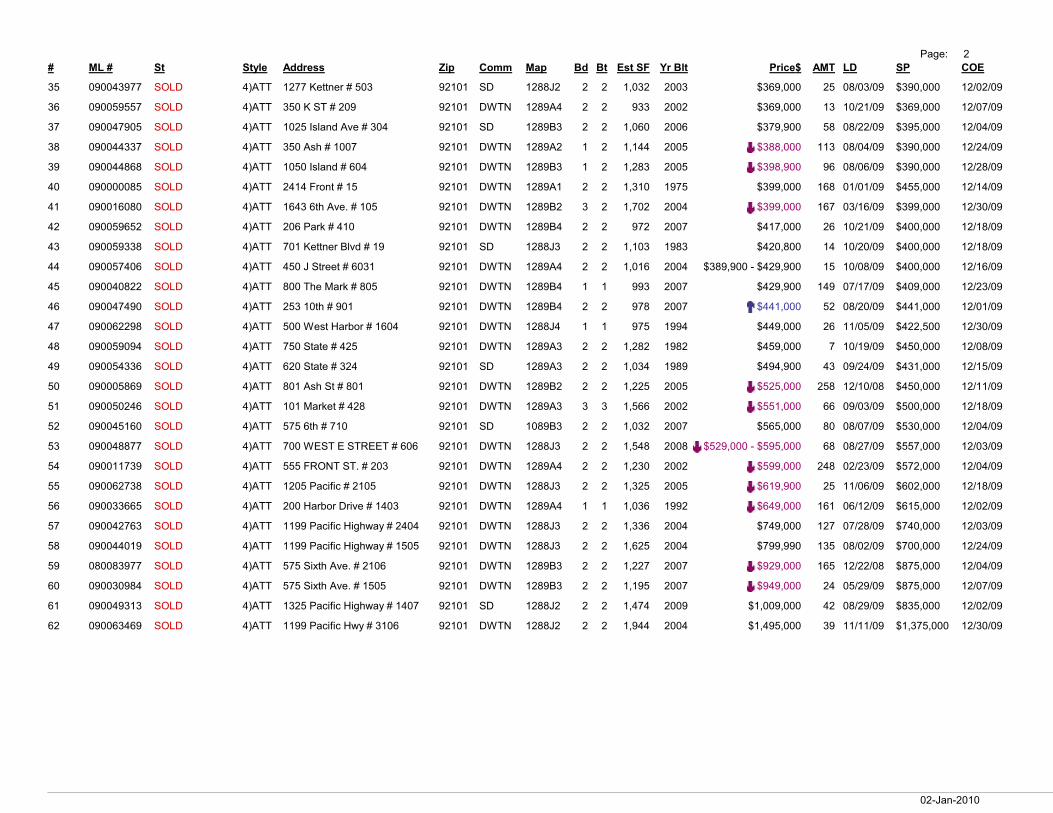
A combination of December 2009 Downtown San Diego condo sales and our monthly area newsletterTRANSCRIPT

������������ ��������������������� ��� � �
� ���� �� ���� ��� ��� ���� ��� �� �� � ���� ������ ����� �� �� �� ���
� ��������� ���� �� !! �������"������#���$ ����� �%!& ��'�() � � ��) ���) *���+��� $� ��,��,�� *��'+��� ��,��,��
� ��������' ���� �� !! �����-�#�)�$ ����� �%!& ��'�.� � � ��� ���� *�)'+��� $� ��,�',�� *�)�+��� ��,$�,��
$ ������$�� ���� �� !! ����./"�#���� ����� �%!& ��'� � � � )�� ���� *���+��� ��� �$,$�,�� *�'�+��� ��,��,��
� ��������� ���� �� !! ����0�� ����� �%!& ��'� � � � )�� ���� *���+��� �� ��,�',�� *���+��� ��,�$,��
� ����$'�)) ���� �� !! ����� �1�������#�) ����� �%!& ��'� � � � ��' ��)� *���+��� �$� ��,�$,�� *���+��� ��,��,��
) ����)$'�� ���� �� !! �����0�����#���� ����� �%!& ��'� � � � ��� ���� *���+��� �� ��,��,�� *���+��� ��,��,��
� �������'� ���� �� !! ����)�"� 2�#�$�� ����� �� ��'�.$ � � )�) ���� *���+��� $� ��,�',�� *���+��� ��,��,��
' ����)�)$� ���� �� !! ����3��4��#���� ����� �%!& ��'� $ � � �'� ���� *���+��� $ ��,�',�� *��'+��� ��,��,��
� ����)��$� ���� �� !! ��$��5����������#���� ����� �%!& ��''-� � � ��' ���� *���+��� �$ ��,��,�� *��$+��� ��,��,��
�� �����)��' ���� �� !! �����0��&!��!�#���� ����� �%!& ��'� � � � ')� ���� *���+��� $' ��,��,�� *���+��� ��,�$,��
�� �')�$$��� ���� �� !! �����0��������#��$� ����� �� ��'� � � � )�� ���� *���+��� �'� ��,�),�' *���+��� ��,��,��
�� ��������� ���� �� !! ��'���#��� ����� �%!& ��'�.$ � � )�� ���� *���+��� � ��,��,�� *���+��� ��,��,��
�$ ��������� ���� �� !! ����%6�./"�#��$�) ����� �%!& ��'� � � � )�� ���� *���+��� ��� ��,�),�� *���+��� ��,�',��
�� ����)���� ���� �� !! ����3��4��#�$�$ ����� �%!& ��'� $ � � ��� ���� *���+��� �� ��,��,�� *���+��� ��,��,��
�� ����)�)�$ ���� �� !! ����)�"� 2�#�#��� ����� �� ��'�.$ � � )�� ���� *���+)�� $) ��,��,�� *�$�+��� ��,��,��
�) ����)���) ���� �� !! ����5������ 2�#���) ����� �%!& ��'�.$ � � ��� ���) *���+��� �� ��,�$,�� *���+��� ��,$�,��
�� ����)���) ���� �� !! �������"����#���� ����� �%!& ��'�($ � � ��� ���) *�$�+��� �� ��,��,�� *���+��� ��,��,��
�' ����)�$�� ���� �� !! ����./"�#���� ����� �%!& ��'� � � � '�� ���� *��)+��� � ��,��,�� *��)+��� ��,��,��
�� ��������� ���� �� !! �����5�����#�$�' ����� �� ��''-$ � � ��� ���$ *���+��� '' ��,��,�� *���+��� ��,$�,��
�� ������$�� ���� �� !! ''�����������#�$�� ����� �%!& ��'�.� � � )�� ���� *���+��� )� ��,��,�� *���+��� ��,��,��
�� �����$��� ���� �� !! �����5�����#���� ����� �%!& ��''-$ � � '�� ���$ *�)$+��� ��) ��,�',�� *�'�+��� ��,$�,��
�� ����)���� ���� �� !! '���./"�#�$�� ����� �� ��'�.� � � �+��� ���$ *�)�+��� �� ��,�),�� *$��+��� ��,��,��
�$ ������$�� ���� �� !! '�������������#���' ����� �� ��'� $ � � ))) ��'� *���+��� '� �',��,�� *���+��� ��,��,��
�� �����)'�� ���� �� !! �����5������#�$�� ����� �� ��'�.$ � � ��) ���) *�'�+��� ��� �',��,�� *���+��� ��,�',��
�� �����))�$ ���� �� !! �������"�#�$�$ ����� �%!& ��'�.� � � �+�)� ��'� *�''+��� ��� ��,��,�� *�)�+��� ��,�$,��
�) ������'�� ���� �� !! ��$����"�#��$� ����� �%!& ��'�.� � � �)$ ���� *$�'+��� � ��,��,�� *$�'+��� ��,��,��
�� �����)��$ ���� �� !! �������"� 2�7�#���) ����� �� ��'� � � � �'� ���$ *$��+��� $$ ��,��,�� *$��+��� ��,��,��
�' ��������) ���� �� !! '����������#�$�� ����� �%!& ��'�.$ � � '�� ���) *$��+��� �� ��,�',�� *$�)+��� ��,��,��
�� ����)�$$� ���� �� !! ��$����"��2�7�#��$$ ����� �%!& ��'�.� � � ��' ���� *$�$+��� � ��,$�,�� *$�$+��� ��,�$,��
$� ��������$ ���� �� !! �����-������#�$�� ����� �%!& ��'�.� � � �+��' ���� *$$)+)�� �� ��,��,�� *$��+��� ��,��,��
$� �����''�� ���� �� !! '���!"�3��4�#���' ����� �� ��'�.$ � � �$� ���� *$$�+��� )� �',��,�� *$��+��� ��,�$,��
$� �������$' ���� �� !! �������"�#����� ����� �%!& ��'�.� � � �+�)� ���� *$$�+��� ��� �$,�$,�� *$$)+��� ��,��,��
$$ �������$$ ���� �� !! )�������������#���� ����� �%!& ��'� $ � � �+�$' ��'� *$��+��� �� ��,�',�� *$��+��� ��,��,��
$� ������)�� ���� �� !! �)������"�#�#���� ����� �%!& ��'�.� � � �+��� ��'$ *$)�+��� $� ��,��,�� *$)$+��� ��,$�,��
��8-��8����
���� �
� ���� �� ���� ��� ��� ���� ��� �� �� � ���� ������ ����� �� �� �� ���
$� �����$��� ���� �� !! �����9�����#���$ ����� �� ��''-� � � �+�$� ���$ *$)�+��� �� �',�$,�� *$��+��� ��,��,��
$) ��������� ���� �� !! $���9��!�#���� ����� �%!& ��'� � � � �$$ ���� *$)�+��� �$ ��,��,�� *$)�+��� ��,��,��
$� ��������� ���� �� !! �����5������ 2�#�$�� ����� �� ��'�.$ � � �+�)� ���) *$��+��� �' �',��,�� *$��+��� ��,��,��
$' ������$$� ���� �� !! $��� �"�#����� ����� �%!& ��'� � � � �+��� ���� *$''+��� ��$ �',��,�� *$��+��� ��,��,��
$� ������')' ���� �� !! �����5������#�)�� ����� �%!& ��'�.$ � � �+�'$ ���� *$�'+��� �) �',�),�� *$��+��� ��,�',��
�� �������'� ���� �� !! �����0�����#��� ����� �%!& ��'� � � � �+$�� ���� *$��+��� �)' ��,��,�� *���+��� ��,��,��
�� �����)�'� ���� �� !! �)�$�)�"� 26�#���� ����� �%!& ��'�.� $ � �+��� ���� *$��+��� �)� �$,�),�� *$��+��� ��,$�,��
�� ������)�� ���� �� !! ��)����4�#���� ����� �%!& ��'�.� � � ��� ���� *���+��� �) ��,��,�� *���+��� ��,�',��
�$ ������$$' ���� �� !! ����9�����.�2��#��� ����� �� ��''-$ � � �+��$ ��'$ *���+'�� �� ��,��,�� *���+��� ��,�',��
�� ��������) ���� �� !! ����-������#�)�$� ����� �%!& ��'� � � � �+��) ���� *$'�+����8�*���+��� �� ��,�',�� *���+��� ��,�),��
�� ������'�� ���� �� !! '���!"�3��4�#�'�� ����� �%!& ��'�.� � � ��$ ���� *���+��� ��� ��,��,�� *���+��� ��,�$,��
�) ��������� ���� �� !! ��$����"�#���� ����� �%!& ��'�.� � � ��' ���� *���+��� �� �',��,�� *���+��� ��,��,��
�� ����)���' ���� �� !! ����%���:��1���#��)�� ����� �%!& ��''-� � � ��� ���� *���+��� �) ��,��,�� *���+��� ��,$�,��
�' ��������� ���� �� !! ���������#���� ����� �%!& ��'� $ � � �+�'� ��'� *���+��� � ��,��,�� *���+��� ��,�',��
�� ������$$) ���� �� !! )��������#�$�� ����� �� ��'� $ � � �+�$� ��'� *���+��� �$ ��,��,�� *�$�+��� ��,��,��
�� ������')� ���� �� !! '��� �"����#�'�� ����� �%!& ��'�.� � � �+��� ���� *���+��� ��' ��,��,�' *���+��� ��,��,��
�� ��������) ���� �� !! ����3��4��#���' ����� �%!& ��'� $ $ $ �+�)) ���� *���+��� )) ��,�$,�� *���+��� ��,�',��
�� �������)� ���� �� !! ����)�"�#���� ����� �� ��'�.$ � � �+�$� ���� *�)�+��� '� �',��,�� *�$�+��� ��,��,��
�$ �����''�� ���� �� !! ����%;�!�;��!�;;!�#�)�) ����� �%!& ��''-$ � � �+��' ���' *���+����8�*���+��� )' �',��,�� *���+��� ��,�$,��
�� �������$� ���� �� !! ����0��&!��!6�#���$ ����� �%!& ��'� � � � �+�$� ���� *���+��� ��' ��,�$,�� *���+��� ��,��,��
�� ����)��$' ���� �� !! �������/�<�/�#����� ����� �%!& ��''-$ � � �+$�� ���� *)��+��� �� ��,�),�� *)��+��� ��,�',��
�) ����$$))� ���� �� !! ����:��1������2�#����$ ����� �%!& ��'� � � � �+�$) ���� *)��+��� �)� �),��,�� *)��+��� ��,��,��
�� �������)$ ���� �� !! �������/�<�/�:��"=���#����� ����� �%!& ��''-$ � � �+$$) ���� *���+��� ��� ��,�',�� *���+��� ��,�$,��
�' ��������� ���� �� !! �������/�<�/�:��"=���#����� ����� �%!& ��''-$ � � �+)�� ���� *���+��� �$� �',��,�� *���+��� ��,��,��
�� �'��'$��� ���� �� !! ������>�"� 26�#����) ����� �%!& ��'�.$ � � �+��� ���� *���+��� �)� ��,��,�' *'��+��� ��,��,��
)� ����$��'� ���� �� !! ������>�"� 26�#����� ����� �%!& ��'�.$ � � �+��� ���� *���+��� �� ��,��,�� *'��+��� ��,��,��
)� ������$�$ ���� �� !! �$�����/�<�/�:��"=���#����� ����� �� ��''-� � � �+��� ���� *�+���+��� �� �',��,�� *'$�+��� ��,��,��
)� ����)$�)� ���� �� !! �������/�<�/�:=��#�$��) ����� �%!& ��''-� � � �+��� ���� *�+���+��� $� ��,��,�� *�+$��+��� ��,$�,��
��8-��8����

The median price for single-family, re-sale homes gained 1.4% in November from October, and it was up 10.4% year-over-year. This is the third month in a row the median price has been higher than the year before. Also, the median price is at its highest level since Au-gust 2008.
After a strong October, driven in part by the first-time home buyers tax credit, which was set to expire October 31, sales fell in November: down 17.8% from October. Year-over-year, home sales were up 7.3%. With the ex-tension and expansion of the home-buyers tax credit, we expect sales to pick up and for the first quarter to be very strong. Year-to-date, home sales are up 13.3%.
The tax credit has been extended to April 30th. The difference being,
you only need to have a contract in place by then. After which, you have 60 days to close the contract to qualify for the tax credit. The expansion of the tax credit applies to existing homeowners who have
been residing in their principal residence for five consecutive years out of the last eight and are purchasing a home to be their principal residence (“repeat buyer”). They may be eligible for up to a $6,500 tax credit.
Inventory continues to decline: down 31.2% compared to last No-vember.
Pending sales were up 35.1% year-over-year.
Condo sales were down 14%, month-over-month, but were up 11.5% compared to last November.
Year-to-date, condo sales are up 15.1%.
The median price for condos rose 5.7% from October, and was up 13.8% year-over-year.
Condo inventory was down 27.3% compared to last November, while
pending sales were up 44.5%.
The real estate market is very hard to generalize. It is a market made up of many micro markets. For complete information on a particu-lar neighborhood or for an evalua-tion of your home's worth, call me.
S A N D I E G O C O U N T Y
— C E N T R A L S A N D I E G O
The Real Estate Report L O C A L M A R K E T T R E N D S Napolitano GMAC Real Estate
939 Orange Ave. Coronado, CA 92118 (619) 977-3174 [email protected] http://www.SanDiegoCrowns.com DRE #01427987 DRE #00521310
Sharyn & Victoria Crown
To “STOP” receiving this Monthly News-letter or to receive this Newsletter via “EMAIL”, please call or email me and I will make the changes immediately.
INSIDE THIS ISSUE:
Median Home Price Continues Rising
December/January 2010
FHA MORTGAGE PROGRAM IMPORTANT TO HOUSING
1
MORTGAGE RATE OUTLOOK
2
CITY STATISTICS 2
PENDING HOME SALES UP NINTH MONTH IN A ROW
3
CONDO STATISTICS 3
PRICE & SALES CHART 4
The Federal Housing Administration mortgage insurance program is a critical part of the American housing fabric and has never been more important than it is in today’s mar-ket, NAR President Vicki Cox Golder told a congressional panel today.
Testifying before the House Com-mittee on Financial Services, Golder said that the FHA program is fiscally sound with responsible underwriting, and needs enhancements not radi-cal reform. She urged Congress and the administration to tread lightly before making changes to a pro-gram that has a profound impact on economic recovery and serves the nation’s families.
“With the collapse of the private mortgage market, the importance of the FHA mortgage insurance pro-gram has never been more appar-ent. Thus far in 2009, nearly 80 percent of all FHA insured purchas-ers are first-time homebuyers. And if you take a closer look at the num-bers, you’ll see that program is doing exactly what it was designed to do—make more affordable mort-gage financing available to home-owners,” said Golder.
“As the leading advocate for home-ownership and housing issues, NAR knows that without FHA mortgage insurance, our housing market could never start to recover,” Golder said.
FHA’s decline in reserves is in part a reflection of a projected change in
home price values, and is not tied to excessive increases in defaults or unsound underwriting practices, she said. In citing the recent FHA audit, Golder said, “If FHA makes no changes to the way it does business today, the reserves will actually exceed 2 percent in the next several years. FHA has sufficient reserves.”
FHA cash reserves and capital reserves give the agency combined assets of $30.4 billion—enough to pay all claims over a 30-year period. Most banks are required to hold reserves sufficient to pay only one year of claims. “Realtors® strongly believe that FHA is taking the nec-essary steps to assure its financial solvency,” Golder said.
NAR strongly opposes H.R. 3706, the “FHA Taxpayer Protection Act of 2009,” which would increase FHA’s downpayment requirement. The bill would not add anything to FHA reserves but would put homeowner-ship out of reach for many credit-worthy borrowers.
Golder also thanked Chairman Barney Frank (D-Mass.) and the committee for passing legislation to extend the higher loan limits through 2010, but urged the committee to make the higher limits permanent. “The higher limits are not just for a few states with high median prices. There are currently 245 counties in 28 states that have high cost lim-its—this is a national issue,” she said.
FHA Mortgage Insurance Program Important to Housing Market & Recovery
Nov 09 Oct 09 Nov 08
Median Price: $370,000 $365,000 $335,000Average Price: $476,349 $464,708 $418,991Home Sales: 1,660 2,020 1,547
Sale/List Price Ratio: 99.6% 99.6% 98.4%Days on Market: 66 64 69
Trends at a Glance(Single-family Homes)

Page 2
The Real Estate Report
UnitAverage Median Sales DOM SP/LP Ave. Med. Sales Ave. Med. Sales
County $476,349 $370,000 1,660 66 99.6% 13.7% 10.4% 7.3% 2.5% 1.4% -17.8%Central San Diego $585,812 $415,000 356 61 99.7% 14.4% 15.3% 17.1% 6.4% -1.4% -21.4%City Heights $219,323 $225,500 26 44 102.2% 8.9% 11.6% -3.7% 5.4% 18.7% 13.0%Clairemont $447,873 $405,000 24 24 99.2% 14.3% 11.0% 26.3% -2.5% -6.9% -33.3%College Grove $385,987 $367,450 22 61 100.9% 23.7% 23.6% 0.0% 7.5% 8.9% -8.3%Coronado $1,200,000 $1,177,500 4 168 94.4% 9.9% 16.5% 0.0% -16.0% -13.4% -69.2%Del Cerro $492,429 $431,000 21 40 98.6% 23.1% 14.8% 110.0% 5.2% -13.6% 61.5%Encanto $213,443 $222,500 52 50 104.4% 2.8% 2.5% -3.7% -5.7% -3.3% -17.5%Golden Hill $246,625 $197,500 16 33 98.2% -23.6% -34.2% 33.3% 4.2% -1.1% 33.3%La Jolla $2,570,000 $1,375,000 24 134 80.0% -14.3% -32.9% 84.6% 45.0% -9.8% -14.3%Linda Vista $413,083 $400,100 15 26 100.6% -6.5% -4.7% 114.3% 1.0% -3.6% 7.1%Logan Heights $163,893 $154,500 14 103 103.8% -6.3% 8.4% 0.0% 9.7% 8.4% -12.5%Mira Mesa $413,977 $426,000 26 54 99.6% 6.9% 12.1% 13.0% 3.8% 5.7% -25.7%Mission Hills $732,250 $665,000 10 75 91.1% -10.7% -19.6% -37.5% -12.4% -11.6% -58.3%Mission Valley $460,800 $490,000 5 10 99.0% 19.0% 25.6% -54.5% 9.5% 19.5% -44.4%Normal Heights $432,282 $425,000 11 56 97.4% -4.1% -13.0% 10.0% -17.2% -8.7% -45.0%North Park $448,918 $435,000 17 35 99.1% -4.3% -9.9% 41.7% -2.4% -1.1% -37.0%Ocean Beach $703,188 $697,500 12 57 97.0% 4.0% 4.5% 100.0% 6.6% 9.0% -7.7%Old Town $497,125 $489,000 8 110 96.3% -6.4% 5.8% 33.3% -24.0% -21.1% 0.0%Pacific Beach $1,095,833 $807,500 12 80 91.1% 38.0% 4.9% 71.4% 46.0% 12.2% -29.4%Paradise Hills $252,848 $260,000 23 31 102.6% 6.1% 13.3% 130.0% 5.0% 10.6% 9.5%Point Loma $805,091 $749,000 11 72 96.1% 32.8% 34.3% 175.0% -9.4% 11.0% 0.0%San Carlos $402,456 $399,000 9 28 97.9% -9.2% -9.3% -30.8% -3.0% -5.0% -18.2%Scripps Ranch $776,962 $730,000 14 51 97.6% 18.8% 12.3% 7.7% 10.3% 4.8% -46.2%Sorrento Valley $733,500 $733,500 2 16 95.4% -4.9% -4.9% 0.0% 10.3% 10.3% 0.0%Tierrasanta $567,800 $578,200 9 53 98.5% 14.7% 9.1% -30.8% 11.3% 19.7% 12.5%University City $644,211 $620,000 9 37 95.2% -6.1% -9.7% 350.0% -3.2% -8.8% -35.7%
Prices Change from last year Change last month
November Sales Statistics(Single-family Homes)
5.0%
5.5%
6.0%
6.5%
7.0%
7.5%
01-0
2
01-0
3
01-0
4
01-0
5
01-0
6
01-0
7
01-0
8
01-0
9
30-Year Fixed Mortgage Rates
Mortgage Rate Outlook
Dec. 4, 2009 -- Mortgage rates have been easing a bit lately due to both softer demand for credit and, most recently, some flight-to-quality pur-chases of US Treasuries related to financing troubles at Dubai World, a state-backed corporation which asked to forego payments on its outstanding debts for at least six months. That is simply more fallout from the global financial crisis.
These troubles first came to light last Thursday. After initial concern, it seems Dubai World's effect on global finance markets is contained for the most part, so some of that move of cash into a safer haven has begun to unwind.
Some surprising economic news came late in the week, and if the again-influential yield on the 10-year Treasury is any indication, mortgage rates seem certain to rise in the days ahead. The 10-year
Treasury rose from a Tuesday low of 3.21% to an estimated 3.48% by Friday's market close; mortgage rates haven't yet fully reflected all of that move, but from Tuesday's low of 4.83%, the all-important 30-year Conforming interest rate had risen to 5.06% by Friday.
For the week, HSH.com's FRMI, our overall average for mortgage rates (including conforming, jumbo and agency jumbo), fell by five basis points, closing the at 5.24%. Both conforming and jumbo rates declined this week, with conforming 30-year FRMs slipping to a 4.91% average. At the same time, the overall average for 5/1 Hybrid ARMs fell five-basis points, landing at 4.56% for the week. Some ag-gressively-priced 5/1 ARMs can now be found in the market with rates starting as low as the mid-3% range.
Readers and visitors who regularly follow our work know that fluctua-tions in mortgage rates are a regu-lar recurrence, and that rates rise much more quickly than they fall. This being the case, we always advise borrowers that when they've got a mortgage in place that makes their purchase or refinance deal work, they should lock in the inter-est rate, rather than trying to guess at any kind of bottom in the market.
Our educated readers also know that 30-year FRMS holding tightly to either side of a 5% threshold is a great deal, whether it's upper 4% or low 5% on the bottom line. Interest rates will kick a little higher next week, probably all the way back to (yawn) early November levels, when they were only outstanding.

Page 3
The Real Estate Report
UnitAverage Median Sales DOM SP/LP Ave. Med. Sales Ave. Med. Sales
County $260,037 $222,000 913 69 99.8% 4.5% 13.8% 11.5% -6.8% 5.7% -14.0%Central San Diego $306,495 $255,500 354 69 99.7% -8.1% 4.3% 23.3% -11.1% 2.2% -20.6%City Heights $128,153 $109,900 11 56 101.2% 21.2% 8.8% -8.3% 50.6% 66.5% -15.4%Clairemont $255,133 $274,950 12 47 98.4% 32.1% 25.2% 233.3% 12.7% 12.7% 12.7%College Grove $117,565 $115,000 20 62 104.5% -19.9% -23.1% 25.0% -18.1% -8.0% -16.7%Coronado $704,600 $685,000 5 156 88.3% n/a n/a n/a -48.5% -48.8% -37.5%Del Cerro $184,389 $156,000 9 99 94.8% -8.7% -1.6% -25.0% 3.5% -3.3% -10.0%Downtown $408,399 $342,500 50 51 97.8% -14.3% -17.5% -2.0% -18.3% -12.1% -43.2%Golden Hill $194,350 $207,000 5 67 98.3% 12.8% 15.2% -16.7% 36.8% 88.2% 0.0%La Jolla $775,688 $623,250 24 124 91.9% 47.0% 22.7% 84.6% 47.0% 22.7% 84.6%Linda Vista $523,814 $297,750 14 95 192.8% 106.3% 30.9% 27.3% 204.5% 123.8% -58.8%Mira Mesa $189,526 $199,000 19 62 104.1% -6.1% -4.1% -5.0% -3.5% -0.3% -20.8%Mission Hills $402,384 $350,000 19 38 99.3% 11.0% 11.1% 111.1% -20.5% -33.3% 11.8%Mission Valley $257,948 $249,500 36 63 98.4% 9.1% 28.0% 71.4% 1.7% 4.0% -20.0%Normal Heights $170,355 $163,000 11 69 98.6% -19.1% 18.1% 120.0% -6.4% 23.5% -42.1%North Park $202,979 $181,000 19 61 101.2% 6.0% 6.5% 35.7% 7.7% -8.1% -26.9%Ocean Beach $335,125 $331,750 4 41 94.4% -7.4% 4.5% 0.0% 15.3% 18.5% -55.6%Old Town $253,306 $245,000 18 57 96.7% -4.2% -9.3% 100.0% -18.3% -23.9% 38.5%Pacific Beach $436,821 $431,000 19 98 94.6% -43.0% -10.7% 58.3% -1.1% 2.6% 11.8%Paradise Hills $130,559 $128,000 17 58 105.9% -17.1% -8.6% -10.5% -11.8% -1.5% 6.3%San Carlos $238,333 $260,000 3 51 96.6% 37.1% 67.7% -40.0% 8.7% 26.8% -50.0%Scripps Ranch $300,840 $298,500 10 34 100.8% 11.9% 13.7% 150.0% 4.9% 6.6% -47.4%Sorrento Valley $425,000 $425,000 1 5 94.4% n/a n/a n/a 22.4% 28.8% -66.7%Tierrasanta $335,136 $330,000 11 35 99.1% -1.9% -2.5% 175.0% 1.1% 0.3% 175.0%University City $311,323 $288,500 30 49 99.3% 2.0% -0.8% 87.5% 3.9% 7.6% 15.4%
November Sales Statistics(Condominiums/Townhomes)
Change last monthPrices Change from last year
million to 6.0 million annually, but we were well below the 5-million mark before the home buyer tax credit stimulus,” he said. “This means the tax credit is helping unleash a pent-up demand from a large pool of financially qualified renters, much more than borrowing sales from the future.
The PHSI in the Northeast surged 19.9 percent to 100.2 in October and is 44.2 percent above a year ago. In the Midwest the index rose 11.6 percent to 109.6 and is 36.6 percent higher than October 2008. Pending home sales in the South increased 5.4 percent to an index of 115.4, which is 31.6 percent above a year ago. In the West the index fell 11.2 percent to 127.7 but is 21.9 percent above October 2008.
Yun cautioned that home sales could dip in the months ahead. “The expanded tax credit has only been available for the past three
Pending home sales have risen for nine months in a row, a first for the series of the index since its inception in 2001, according to the National Association of Realtors®.
The Pending Home Sales Index,* a forward-looking indicator based on contracts signed in October, increased 3.7 percent to 114.1 from 110.0 in September, and is 31.8 percent above October 2008 when it was 86.6. The rise from a year ago is the biggest annual increase ever recorded for the index, which is at the highest level since March 2006 when it was 115.2.
Lawrence Yun, NAR chief economist, said home sales are experiencing a pendulum swing. “Keep in mind that housing had been underperforming over most of the past year. Based on the demographics of our growing population, existing-home sales should be in the range of 5.5
weeks, but the time between when buyers start looking at homes until they close on a sale can take anywhere from three to five months. Given the lag time, we could see a temporary decline in closed existing-home sales from December until early spring when we get another surge, but the weak job market remains a major concern and could slow the recovery process.
“Still, as inventories continue to decline and balance is gradually restored between buyers and sellers, we should reach self-sustaining housing conditions and firming home prices in most areas around the middle of 2010. That would mean broad wealth stabilization for the vast number of middle-class families,” Yun said.
The National Association of Realtors®, “The Voice for Real Estate,” is America’s largest trade association, representing 1.2
million members involved in all aspects of the residential and commercial real estate industries.
# # #
*The Pending Home Sales Index is a leading indicator for the housing sector, based on pending sales of existing homes. A sale is listed as pending when the contract has been signed but the transaction has not closed, though the sale usually is finalized within one or two months of signing.
The index is based on a large national sample, typically representing about 20 percent of transactions for existing-home sales. In developing the model for the index, it was demonstrated that the level of monthly sales-contract activity from 2001 through 2004 parallels the level of closed existing-home sales in the following two months. There is a closer relationship between annual index changes (from the same month a year earlier) and year-ago changes in sales performance than with month-to-month comparisons.
An index of 100 is equal to the average level of contract activity during 2001, which was the first year to be examined as well as the first of five consecutive record years for existing-home sales.
Existing-home sales for November will be reported December 22 and the next Pending Home Sales Index will be on January 5; release times are 10 a.m. EST.
Nine Consecutive Gains for Pending Home Sales

This Real Estate Report Real Estate Report Real Estate Report Real Estate Report is published and copyrighted by rereport.comrereport.comrereport.comrereport.com.
Napolitano GMAC Real Estate 939 Orange Ave. Coronado, CA 92118
THE REAL ESTATE REPORT S A N D I E G O C O U N T Y — C E N T R A L S A N D I E G O
http://www.SanDiegoCrowns.com
Sharyn & Victoria Crown
For a FREEFREEFREEFREE subscription and the city by city breakdown, go to our web-site at:
0
500
1,000
1,500
2,000
2,500
3,000
$100
$200
$300
$400
$500
$600
$700
$800
0
4
FMAM J J AS OND 0
5
FMAM J J ASOND 0
6
FMAM J J A SOND 0
7
FMAM J J ASOND 0
8
FMAM J J A SOND 0
9
FMAM J J ASON
San Diego County Homes: Prices & Sales(3-month moving average — price in $000's)
Ave Med Sales © 2009 rereport.com
0
200
400
600
800
1,000
1,200
1,400
1,600
$100
$150
$200
$250
$300
$350
$400
$450
$500
0
4
FMAM J J ASOND 0
5
FMAM J J AS OND 0
6
FMAM J J ASOND 0
7
FMAM J J ASOND 0
8
FMAM J J AS OND 0
9
FMAM J J ASON
San Diego County Condos: Prices & Sales(3-month moving average — price in $000's)
Ave Med Sales © 2009 rereport.com