dplo investor deck april 2015
TRANSCRIPT
August 2014
These materials may not be used or relied upon for any purpose other than as specifically contemplated by a written agreement with Credit Suisse AG or its Affiliates (hereafter “Credit Suisse”).
Confidential
Diplomat Pharmacy, Inc. April 2015
STRENGTH
I am a mother. I am a long distance swimmer. I have Multiple Sclerosis. I am not defined by my illness. I know The Diplomat Difference.
Vicki Bellingham, Washington
Confidential
1
This presentation may contain “forward-looking” statements that involve risks, uncertainties and assumptions. If the risks or uncertainties ever materialize or the assumptions prove incorrect, our results may differ materially from those expressed or implied by such forward-looking statements. All statements other than statements of historical fact could be deemed forward-looking, including, but not limited to, any projections of financial information; any statements about historical results that may suggest trends for our business and results of operations; any statements of the plans, strategies and objectives of management for future operations; any statements of expectation or belief regarding future events, health care developments, or specialty pharmaceutical industry market sizes, shares, trends or growth; and any statements of assumptions underlying any of the foregoing. Any forward-looking statements contained in this presentation are based on management's good-faith belief and reasonable judgment based on current information, and these statements are qualified by important factors, many of which are beyond our control, that could cause our actual results to differ materially from those in the forward-looking statements, including changes in global, regional or local economic, business, competitive, market, regulatory and other factors, many of which are beyond our control, including but not limited to the following risks related to our business: our ability to adapt to changes or trends within the specialty pharmacy industry; significant and increasing pricing pressure from third-party payors, our relationships with key pharmaceutical manufacturers; our limited history with integrating acquisitions; and the effects of competition. These and other risks and uncertainties associated with our business are described in the prospectus for our proposed follow-on offering, including under the heading “Risk Factors.” We assume no obligation and do not intend to update these forward-looking statements. In addition to U.S. GAAP financials, this presentation includes certain non-GAAP financial measures. These historical and forward-looking non-GAAP measures are in addition to, not a substitute for or superior to, measures of financial performance prepared in accordance with GAAP. A reconciliation between GAAP and non-GAAP measures is included in the appendix to this presentation. The issuer has filed a registration statement (including a prospectus) with the Securities and Exchange Commission (SEC) for the offering to which this communication relates. The registration statement has not yet become effective. Shares of the issuer’s common stock may not be sold nor may offers to buy be accepted prior to the time the registration statement becomes effective. Before you invest, you should read the prospectus in that registration statement and other documents the issuer has filed with the SEC for more complete information about the issuer and this offering. This presentation should be read in conjunction with the prospectus included in that registration statement and the other documents the issuer has filed with the SEC. You may get these documents for free by visiting EDGAR on the SEC Web site at www.sec.gov. Alternatively, copies of the prospectus related to the offering may be obtained, when available, from Credit Suisse Securities (USA) LLC, Attention: Prospectus Department, One Madison Avenue, New York, NY 10010, by telephone at (800) 221-1037, by facsimile at (212) 325-8057, or by email at [email protected]; or from Morgan Stanley & Co. LLC, Attention: Prospectus Department, 180 Varick Street, 2nd Floor, New York, NY 10014. Diplomat is a registered trademark of Diplomat Pharmacy, Inc. This presentation also contains additional trademarks and service marks of ours and of other companies. We do not intend our use or display of other companies’ trademarks or service marks to imply a relationship with, or endorsement or sponsorship of us by, these other companies.
Important note

Confidential
Diplomat continues to deliver on the growth drivers stated in the IPO
Ongoing IT and process improvements
60bps margin expansion y-o-y
Maintaining balanced mix of payors Successful renewals of key contracts
49% y-o-y revenue growth relative to industry
growth in the ~25% area
7 new limited distribution drug contracts
2
(1) Based on $412mm revenues in Q4 2013 and $612mm revenues in Q4 2014. (2) Based on 6.1% gross margin in Q4 2013 and 6.7% gross margin in Q4 2014.
(1)
(2)
5 incremental limited
distribution drugs

Confidential
3
Diplomat’s base business continues to gain momentum…
Industry growth of 15% per year
Strong pipeline ensures new drug launches each year
New opportunities emerging to treat orphan disease states
Limited distribution drugs are a growing trend
Large pharma continues to focus on specialty drugs
Small biotech companies emerging as a major growth driver
Drugs are increasingly moving from medical benefit to pharmacy benefit
Specialty pharmacy continues to be a very attractive market
Diplomat is in a leading position to benefit from this strong momentum
Specialty pharmacy market grew 24% from $63bn in 2013 to $78bn in 2014
Specialty drug approvals comprised ~50%+ of all FDA drug approvals in 2014
3,000+ oncology and immunology drugs in global drug development
Increased prevalence of limited distribution panels
Biosimilars launch in U.S.
Improving trends across specialty pharmacy…
…driving key milestones and achievements at Diplomat
Diplomat grew revenues by 46% from 2013 to 2014
10 new drug contracts since IPO
7 of which are limited distribution drugs
Respiratory
Dermatology
Oncology
Oncology
Oncology
Hepatitis C
Immunology
Oncology
Oncology
Oncology
Oncology Oncology
Hepatitis C
Dermatology and Respiratory

Confidential
4
…with strong financial performance since the IPO
(1) Based on dispensed scripts only. (2) Gross profit / net sales (i.e., based on dispensed and serviced scripts).
Revenue
EBITDA margin
1.4%
Adjusted EBITDA
$126
$187
4Q13A 4Q14A
Gross Profit /Script ($ in millions) ($ in millions)
1.7% 6.7% 6.1%
(1)
Gross margin
(2)

Confidential
BioRx creates compelling strategic value for Diplomat
5
• Benefits Diplomat’s primary constituents:
- Broadens patient offerings
- Meets Pharma’s demand for multi-channel reach
- Addresses Payors’ desires to shift site of care to a lower cost setting
• Adds significant scale to our specialty infusion business
- Diplomat is now one of the nation’s top specialty infusion providers
• Provides ability to compete for national contracts
• Offers both revenue and cost synergies
• Increases exposure to higher margin businesses
• Potential for addition of new disease states & therapeutic categories
$350 million acquisition announced in February 2015
− Leading specialty pharmacy and infusion services company focused on ultra-orphan and rare chronic diseases
− 2014 revenue of ~$227 million and EBITDA of ~$23 million
− ~10% EBITDA margins and implied ~11.5x trailing EBITDA multiple
− Expected close in early April
Expected to be accretive to EPS in first full year post closing
Transaction summary
Benefits Diplomat’s primary constituents:
− Broadens patient offerings
− Meets Pharma’s demand for multi-channel reach
− Addresses Payors’ desires to shift site of care to a lower cost setting
Affirms Diplomat’s leadership position in specialty infusion
Adds 5 new limited distribution drugs to DPLO
Creates both revenue and cost synergy opportunities
Improves margin profile
Expands potential for additional disease states and therapeutic categories
Strategic rationale
(1) Includes $35mm of contingent earnout. (2) Purchase price adjusted for $50mm of future tax benefit and $35mm of contingent earnout.
(1)
(2)

Confidential
6
Key investment highlights
Unique competitive position with differentiated business model
Outstanding financial profile
Highly experienced and incentivized management team
Taking share in high growth specialty pharmacy sector
Multiple avenues to drive strong long term growth

Confidential
7
Company overview

Confidential
8
Diplomat: Largest independent specialty pharmacy
Founded: 1975; Headquarters: Flint, MI
Employees: ~1,000
FY 2014 revenue: ~$2.2 billion
Diversified base of marquee partners
Diplomat at a glance
CVS Health26%
Express Scripts19%
Walgreens11%3%
OptumRx 3%
Avella 1%
Others37%
Market share ($78 billion total market size) (1)
Exceptional above market revenue growth
$27 $58$167
$271 $377
$578
$772
$1,127
$1,515
$2,215
$-
$500
$1,000
$1,500
$2,000
2005 2006 2007 2008 2009 2010 2011 2012 2013 2014
Scaled business: National footprint
($ in millions)
(1) Source: 2014 – 2015 Economic Report on Retail, Mail and Specialty Pharmacies, Drug Channel Institute.
National Distribution Center
Diplomat locations
Corporate Office
Ft. Lauderdale, FL
GLDC
Flint, MI
Carlsbad, CA
Chicago, IL
Springfield, MA
Raleigh, NC
Ontario, CA
Scottsdale, AZ
BioRx locations
Savage, MN
Urbandale, IA
Greensboro, NC
Cincinnati, OH
Woburn, MA
Enfield, CT

Confidential
Journey of a specialty patient
9
Patient
Physician
Payor
Patient
Patient visits physician
Payor approves script
Diplomat monitors adherence and collects data for manufacturers
Diplomat dispenses drug
Diplomat provides:
Benefit verification
Prior authorization
Clinical intervention
Physician writes script
Patient receives
drugs
Confidential
10
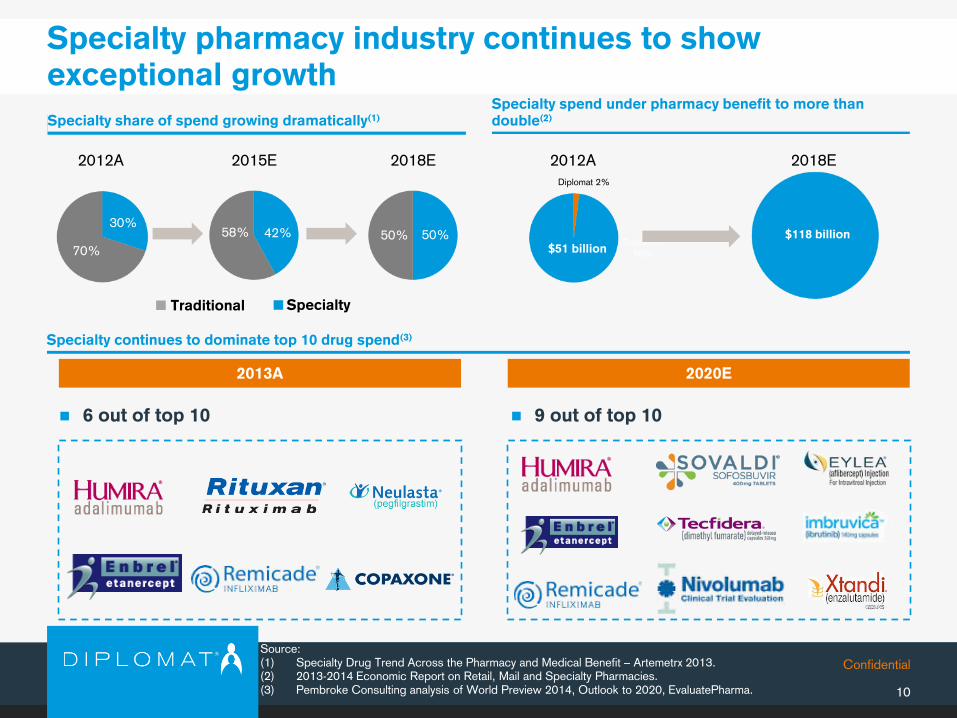
Specialty spend under pharmacy benefit to more than double(2)
Specialty pharmacy industry continues to show exceptional growth
Specialty share of spend growing dramatically(1)
Specialty continues to dominate top 10 drug spend(3)
Source: (1) Specialty Drug Trend Across the Pharmacy and Medical Benefit – Artemetrx 2013. (2) 2013-2014 Economic Report on Retail, Mail and Specialty Pharmacies. (3) Pembroke Consulting analysis of World Preview 2014, Outlook to 2020, EvaluatePharma.
6 out of top 10 9 out of top 10
2013A 2020E
70%
30% 42% 58% 50% 50%
Traditional
58%
Diplomat 2%
$51 million
$118 billion
2012A 2018E
Traditional
2012A 2015E 2018E
$51 billion
Specialty

Confidential
Limited distribution a central and growing theme in Specialty
11
Benefits to Diplomat Benefits to biotech / pharma
Completely eliminate or reduce reliance on wholesaler
Real-time clinical data
Commercialization assistance
Improves appropriate utilization
Barrier to entry Deeper, and earlier, partnerships with
pharma / biotech Increased value proposition to payors Market share opportunity
Other key limited distribution drugs
Oncology
®
MS
Portfolio of over 80 limited distribution drugs, comprising approximately 40% of revenue in 2014, and well positioned for disproportionate growth from future drug approvals
Recent unique oncology limited panels…Diplomat exclusive or semi-exclusive
Oncology expertise
Launched April 2011 2012
What is limited distribution?
Targeted channel strategy
Provides certain specialty pharmacies with exclusive or preferred dispensing rights to certain drugs
Fast-growing trend
(2013) (2014) (2012) (2014)
Diplomat is an opportunity to invest in pharma / biotech drug pipeline, without the binary risk
Traditional:
Limited:
Manufacturer Multiple Wholesalers 65,000 Pharmacies Patient
Manufacturer One/few pharmacies Patient
DPLO EXCLUSIVE DPLO LARGEST OF 5 DPLO LARGEST OF 4 DPLO EXCLUSIVE

Confidential
12
Unique competitive position
LARGE PBM / RETAIL PHARMACY
SMALLER SPECIALTY PHARMACIES
Diversification distracts from specialty pharmacy
Less flexible / less nimble
Limited scale
Most focused on one or a few disease states
Fragmented market
Consolidation opportunity for Diplomat
Singularly focused on specialty
High-touch model
Flexible and nimble
Entrepreneurial culture
National reach
Scalable infrastructure

Confidential
13
Over 3,000 oncology and immunology drugs in global drug development
Oncology / Immunology drugs accounted for ~70% of Diplomat’s revenues in 2014
Addition of 7 new limited distribution drugs across these areas since the IPO
Rapidly growing Hepatitis C franchise – additions of Viekira Pak and Harvoni since the IPO
Multiple avenues for future growth Continue to gain share in core therapeutic areas
Source: EvaluatePharma and company presentations. (1) Includes all indications as defined by EvaluatePharma under Immunology excluding
Multiple Sclerosis.
($ in billions)
US Oncology revenue
Diplomat achieved a 58% CAGR in Oncology from ’06-’13
Diplomat achieved a 79% CAGR in Immunology from ’06-’13
US Immunology revenue(1)
Diplomat ’11-’14 CAGR
45%
27%
Large and high growth Oncology and Immunology are Diplomat's power alley
Significant growth expected to continue in the future
1

Confidential
14
Multiple avenues for future growth Growing payor relationships
Projected higher proportion of higher priced and higher gross profit ($) drugs which have lower gross margin (%)
Positive result for Diplomat - profit $s increase given the higher price of these drugs but margins decline as a result
Payor pricing pressure is also included as a modest negative to gross margin %
Mix
Higher patient enrollment
Increased incidence of chronic disease
Personalized medicine
Health exchanges
Improved management of drugs under medical benefit
Pay for performance
STAR ratings
Population health management
Health Plans
PBMs
Employers
Unions
Diplomat addresses growing unmet customer needs
ACOs
Payor / provider coordination
Clinical data exchange
Opportunity to expand the medical benefit
Case study: Priority Health
Background
Priority Health is a 600K member health plan in Michigan
One of 8 specialty pharmacies working with Priority 8 years back
Diplomat Difference
High-touch customized programs
Proprietary access to limited distribution drugs
High patient adherence rates (over 90%)
Cost containment programs (e.g., channel management, formulary management and waste minimization)
Results
Diplomat named Priority’s sole specialty pharmacy partner
− Displaced previous specialty pharmacy partners
− January 2015 renewal for 4 more years
Strong historical growth in exclusive / preferred managed lives from 5 million to 13 million from 2009 to 2014 (20%+ CAGR), and our payor pipeline has never been stronger
State of Michigan
2

Confidential
15
Multiple avenues for future growth Grow high margin businesses
Continued expansion into specialty infusion market
Recently announced acquisition of BioRx has significantly higher margins
− 29% gross margin and ~10% EBITDA margin
New generics finally coming to specialty
− Temodar and Xeloda have come to market
− Copaxone is coming off patent soon
Emerging biosimilars opportunity expands addressable market for Diplomat
Grow high margin specialty infusion business
Specialty generics and biosimilars
New drug launches creating product preferencing
Competition in specialty space expected to create discount and rebate opportunities
Creates new data and service fees with pharma for high margin revenue
Hepatitis C
Oncology
3

Confidential
Multiple avenues for future growth Unique strategic partnerships with leading retailers and health systems
16
Benefits to Diplomat Needs / benefits for retail /
health systems
Diplomat’s retail and health system partners
Traditional drug trend low to mid single digit growth
Participate in high growth specialty without having to build expensive infrastructure internally
One stop shop for patients / consumers
Improve portfolio of wellness solutions
High margin business
Leverage infrastructure
Improved value proposition with pharma
Pharmacy of choice for limited distribution drugs
How does Diplomat support retail and health system partners?
Fee-for-service offering
− Clinical and administrative support services
− Patient engagement
− Adherence programs
− Integrated with retailers’ dispensing platforms
− Private label programs
Recent wins
Strong pipeline of future opportunities
4

Confidential
17
Multiple avenues for future growth Selectively pursue strategic acquisitions
Near-term focus on integrating BioRx
− Build upon recent experience of two strategically important acquisitions (MedPro and AHF)
Enhance our competitive position through disciplined strategic acquisitions
− Focus on higher margin opportunities
− New therapeutic / geographic expansion opportunities
− Services / technology businesses
• Specialty pharmacy focused on hemophilia and Ig
• 2013 revenue $83mm
• 2013 gross profit $16.8mm (20% margin)
• Specialty pharmacy focused on hemophilia
• 9 months ended 9/30/13 revenue $22mm
• 9 months ended 9/30/13 gross profit $4.9mm (23% margin)
Revenue: $22mm (9 months ended 9/30/13)
$83mm (2013)
Gross profit: $4.9mm (9 months ended 9/30/13)
$16.8mm (2013)
5

Confidential
18
Outstanding financial profile

Confidential
19
Revenue Payors
Distributors / pharmaceutical manufacturers
Patient
Diplomat COGS
Diplomat is essentially a spread business
On average…
− Diplomat sells (gets reimbursed by payors) at AWP – 15%
= 0.85*(AWP)
= (1.2 WAC)*(0.85)
=1.02*WAC =
Diplomat buys @ WAC – 3.3%
= 0.97*WAC =
Gross Profit = (Reimbursements) – (Buying Price)
= –
= 1.02*WAC – 0.97*WAC
= ~5% (WAC)
Physical drug movement
$ flows
How we make money and grow profitability (Illustrative example)
How we make money
Gross profit $ is the backbone of
profitability
Drug mix and positive pricing trends are tremendous profit tailwinds for Diplomat
Manufacturer price increases
Continued shift from lower profit retail non-specialty to higher profit specialty
Higher price, higher profit pipeline of new drugs vs. existing specialty mix
Manufacturer price increases have positively impacted Diplomat's revenue and profit
− Spread model allows Diplomat generally to pass all or portion of price increases on to payors
− AWP / WAC relationship (AWP = WAC x 1.20)
− Profit increase exacerbated by any material inventory stock build
− Profit $ increase, while margins flat to moderately down over time
Positive pricing trends
Specialty
Specialty Specialty Specialty Drug C
Traditional Drug Drug A Drug B Drug C (10% price incr.)
Revenue $100 $2,000 $10,000 $20,000 $22,000
Gross Profit ($) $10 $100 $400 $600 $660
Gross Margin (%) 10% 5% 4% 3% 3%
Diplomat mix shift movement over time
Our core focus
$167
Diplomat’s 2014 Average

Confidential
20
Strong financial performance…
Adjusted EBITDA 2010 – 2014
Total Revenue 2010 – 2014
$8$15
$11
$19
$35
96% (28%) 75% 86%
1.3% 2.0% 1.0% 1.3% 1.8%
2010A 2011A 2012A 2013A 2014A
% margin
% growth
($ in millions)
$578$772
$1,127$1,515
$2,215
34% 46% 34% 46%
2010A 2011A 2012A 2013A 2014A
% growth
($ in millions)
$412
Q4 '13 Q4 '14
$612
$6
$11
Q4 '13 Q4 '14
1.4% 1.7%
Infrastructure investments including IT, facilities and personnel
Volume, price and mix all driving superior revenue growth
Natural operating leverage and acquisitions driving EBITDA growth and margin expansion
53%
27%
Note: Historical financials are not pro forma for BioRx acquisition.

Confidential
21
… with continued growth in profitability
Gross Profit / Script (1)
2010 – 2014
Note: Financials are not pro forma for BioRx acquisition. (1) Based on dispensed scripts only. (2) Gross profit / net sales (i.e., based on dispensed and serviced scripts).
$71
$93 $97$116
$167
2010A 2011A 2012A 2013A 2014A
% growth 12% 20% 31% 4%
% margin 7.1% 5.9% 7.3% 6.2%
Several factors drive growth in our Gross Profit / Script(1):
Continued mix shift towards higher price, higher profit drugs (including acquisitions)
Favorable pricing trends
(2)
Gross margin expansion opportunities:
Recent acquisitions with higher gross margins (%)
Fee-for-service opportunities with pharmaceutical manufacturers
Specialty generics and biosimilars
44%
6.3%
Q4 '13 Q4 '14
6.1% 6.7%
$187
$126

Confidential
22
Capitalization summary (as of December 31, 2014)
Pro forma for BioRx acquisition(1)
($ in millions)
Cash $11
Total debt $210
Pro forma as adjusted for this offering(2)
$11
$129
Shareholder’s equity $263 $344
(1) BioRx acquisition financing includes $210mm in debt and $105mm equity issuance. (2) Proceeds from equity offering assumes 4.4mm primary shares offered at an offering price of $27.89
per share, net of underwriters’ fees. Also assumes that the Company will use approximately $35mm of net primary proceeds from this offering to redeem options from certain existing optionholders.
Actual
$18
-
$164

Confidential
Premier asset in healthcare’s fastest growing segment
Unique competitive position with sole focus on Specialty
Well-positioned to capitalize on multiple industry tailwinds
Powerful momentum and plenty of runway
Deep pipeline of strategic acquisition opportunities
Proven leadership team aligned with shareholders
Key takeaways
23

Confidential
24
Appendix

Confidential
25
Diversified therapeutic mix
Government,
41%
Exclusive /
Preferred,
34%
Patient pay,
3%
Commercial,
22%
(FY 2014A)
Revenue mix by therapeutic category
Oncology
48%
Immunology
20%
Multiple
Sclerosis
10%
Other
22%

Confidential
Reconciliation of Net income (loss) and Adjusted EBITDA
26
(1)
Calendar year ending December 31,
($ in millions) 2014A 2013A 2012A 2011A 2010A
Net income (loss) $4.8 ($26.1) ($2.6) $9.2 ($7.8)
Depreciation & Amortization 8.1 3.9 3.8 3.1 2.2
Interest Expense 2.5 2.0 1.1 0.6 0.5
Tax Expense 4.7 - - - -
EBITDA $20.1 ($20.2) $2.3 $12.8 ($5.2)
Share-based compensation expense 2.9 0.9 0.9 1.4 0.8
Change in fair value of redeemable common shares (9.1) 34.3 6.6 - 10.7
Restructring and impairment charges - 1.0 0.4 0.4 1.5
Equity loss and impairment of of non-consolidated entities 6.2 1.1 0.3 0.1 -
Severance and related fees 0.4 0.2 0.4 0.7 -
Contingent consideration and merger & acquisition related fees 7.2 0.7 - - -
Private company expenses 0.2 0.2 - - -
Other taxes and credits 1.0 - (0.1) (0.6) -
Termination of existing stock redemption agreement 4.8 - - - -
Other Items 1.4 0.7 0.1 0.2 (0.0)
Adjusted EBITDA $35.2 $19.0 $10.9 $15.1 $7.7
(2)
(3)
(4)
(5)
(6)
(7)
(8)
Note: Financials are not pro forma for BioRx acquisition. Detailed footnotes on the following page.

Confidential
Reconciliation of Net income (loss) and Adjusted EBITDA
27
1) Share-based compensation expense relates to director and employee share-based awards.
(2) Restructuring and impairment charges reflect decreases in the fair market value of non-core property and assets, or actual losses on disposal of such assets. 2013 charges primarily relate to the $932 write-down of our former Swartz Creek, Michigan headquarters facility to its fair value, after we vacated it in favor of our present Flint, Michigan facility. 2012 charges primarily relate to our write-down of an externally purchased software package we no longer utilize, as well as sales of Company-owned vehicles. 2011 charges include expense associated with the closure of our former Cleveland, Ohio facility, the move of our Chicago, Illinois area facility, and sales of Company-owned vehicles.
(3) During the fourth quarter of 2014, we reassessed the recoverability of our investment in our non-consolidated entity, Ageology. Based upon this assessment, we determined that a full impairment of $4,869 was warranted, primarily due to updated projections of continuing losses into the foreseeable future. The remaining amounts in 2014, 2013 and 2012 represents our share of losses recognized by Ageology, using the equity method of accounting. We first invested in Ageology, an anti-aging physician network dedicated to nutrition, fitness and hormones, in October 2011, in connection with its formation.
(4) Employee severance and related fees primarily relates to severance for former management.
(5) Fees and expenses directly related to merger and acquisition activities, including our acquisitions of AHF and MedPro and the impact of changes in the fair value of related contingent consideration liabilities.
(6) Primarily includes philanthropic activities performed at the direction of our majority shareholder.
(7) Represents (a) various tax credits received from the state of Michigan for facility improvement and employee hiring initiatives, (b) the one-time costs associated with converting from an S-Corporation to a C-Corporation, and (c) a 2014 charge of $1,825 related to non-income tax obligations.
(8) Includes other expenses, predominantly IT operating leases. These operating leases were initiated, in lieu of purchases or capital leases for a subset of our IT spend, for a short period of time in 2013 and 2014 for liquidity purposes. We have since discontinued the practice of leasing IT equipment. The cost of purchased IT equipment is reflected in depreciation and amortization.