dr. daniel matisoff georgia institute of technology may 10 ... · dr. daniel matisoff georgia...
TRANSCRIPT
Dr. Daniel Matisoff Georgia Institute of Technology Alliance for Research on Corporate Sustainability May 10, 2011

Rational model for voluntary policy Deter mandatory policy / enforcement of mandatory policy (Lyon &
Maxwell, 2003)
Reputational benefits
Market benefits
Gain experience
Mixed evidence for effectiveness (Lyon & Maxwell, 2007; King and Lenox 2000; Khanna 2001; Khanna and Damon 1999)
Boundedly rational model for voluntary policy Firms are boundedly rational (Simon, 1955)
Opportunities for low / no-cost environmental improvements (Porter et al, 1995)
Wide variety in strategies across firms, particularly in power industry (Hoffman 2007; Kolk & Pinske 2005; Matisoff 2010; Welch & Barnum 2009)
Firms implementing voluntary EMS improve environmental outcomes (Potoski & Prakash, 2005; )

Failure to find benefits of voluntary policy - analysis mis-specified? (Lyon & Maxwell, 2007)
Distinguish between different types of voluntary policy
Carbon has different incentives than toxics
Regulated industry is complex
An analysis of private voluntary initiatives – most efforts have focused on public voluntary environmental policy Club good, rather than public good

Compare two very different private policy instruments Cap-and-trade
▪ Set a cap, firms can trade “property rights” to emit CO2 ▪ Case study = Chicago Climate Exchange
▪ Firms voluntarily commit to reducing 1% per year of CO2 collectively ▪ About 90 firms, 1/3 utilities ▪ Firms can trade, buy offsets, etc ▪ Enforced via contract law
Information disclosure ▪ Sunlight is the best disinfectant ▪ What gets measured gets managed ▪ Case study = Carbon Disclosure Project
▪ Firms pressured to disclose carbon emissions; carbon strategy by financial firms ▪ Targets thousands of the world’s largest publicly traded firms ▪ Encourages firms to adopt standardized accounting methodology ▪ Rates firms on transparency of responses

Measures the change in trajectory of treatment group, compared with control group
First difference: Measures difference (CO2 emissions) between treated plants and control group plants
Second difference: Measures difference between time period t, and t-1 (first differences)
Controls for all unobserved static heterogeneity across plants

Converted fuel use (publicly available, at prime mover level) to CO2
DOE 1605b regulations
Eliminated nuclear (renewables & hydro not in dataset either)
1994 – 2007

Matched participants in Chicago Climate Exchange & participants in Carbon Disclosure Project against control group Propensity score matching
▪ Publicly traded; ▪ firm parent size; ▪ age of plant; ▪ plant capacity; ▪ whether restructuring was active in a state; ▪ Green Group membership rates, ▪ firm growth rate, ▪ ECHO data for air violations ▪ % of generation from coal
Controls for observable differences between each group & control
Tested for balancing using Hotelling T2 test (F test that compares the joint means of the matched & unmatched samples)
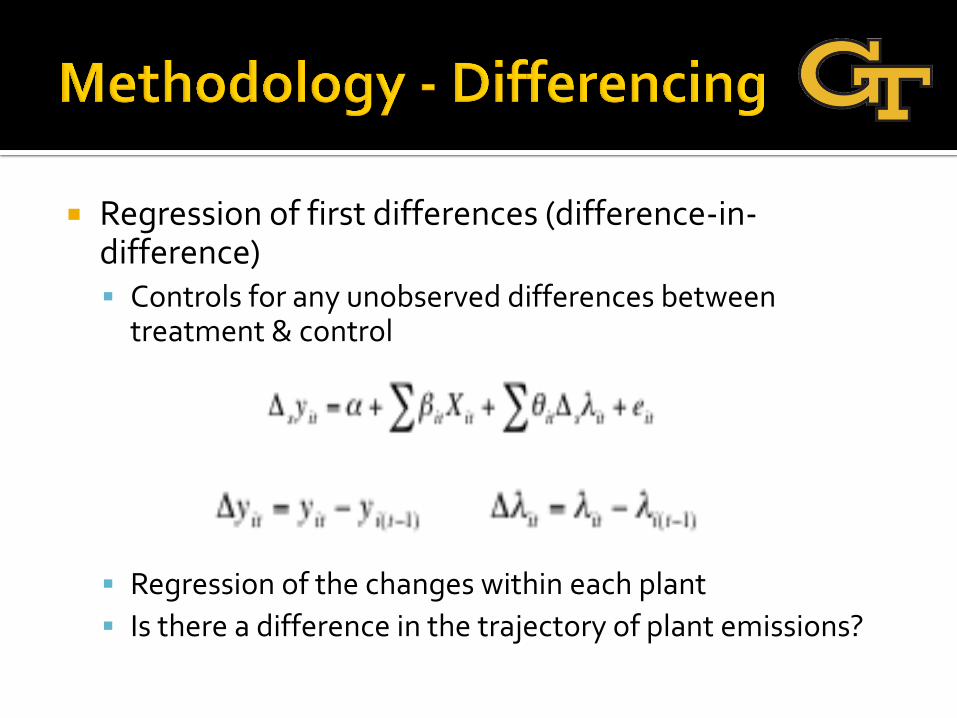
Regression of first differences (difference-in-difference) Controls for any unobserved differences between
treatment & control
Regression of the changes within each plant
Is there a difference in the trajectory of plant emissions?

Alternative matching techniques
Fixed Effects vs. Difference-in-differences
Full sample vs. matched sample

Model CCX1 CCX2 CDP1 CDP2
Observations 2470 2470 10998 10998
F Statistic 2.65** 84.73 6.16*** 284.84***
R-Squared .004 .5864 .0016 .6629
Program
Participation
- 42,857**
(21,207)
- 11,786
(13,772)
- 8,376
(12,362)
- 1,151
(6,692)
Publicly traded -24,887*
(13,357)
10,261
(9,863)
Active State
Restructuring
48,907**
(21,056)
7,684
(10,745)
-8,859
(8,648)
7,657
(4,941)
∆Firm Revenue
(ln $000,000)
- 8,131
(14,876)
-9,921
(7,662)
1,659
(14,220)
- 4,087
(6,309)
∆State Programs - 8,083**
(3,996)
- 3,275
(2311)
- 11,423***
(2,711)
- 4,148***
(1,539)
∆MWh .672***
(.030)
.756***
(.0205)
Constant 7,968
(14,468)
-8,905
(10,839)
31,689***
(5,313)
- 242
(3193)

1.5
1.6
1.7
1.8
1.9
2
2.1
2.2
2.3
2.4
1994 1995 1996 1997 1998 1999 2000 2001 2002 2003 2004 2005 2006 2007
Mil
lio
n M
etr
ic T
on
s o
f C
O2
Em
issi
on
s
Year
Predicted Plant Emissions From Difference in Differences Model (Matched Samples, demonstrating program intervention)
All Observations
CCX Control
CDP Control
CCX Treatment
CDP Treatment

1.5
1.6
1.7
1.8
1.9
2
2.1
2.2
2.3
2.4
2.5
1994 1995 1996 1997 1998 1999 2000 2001 2002 2003 2004 2005 2006 2007
Mil
lio
n M
etr
ic T
on
s, C
O2
Year
Predicted Emissions, Controlling for MWH, Matched Samples, Demonstrating Program Intervention
All Observations
CCX Control
CDP Control
CCX Treatment
CDP Treatment

0
0.5
1
1.5
2
2.5
3
1994 1995 1996 1997 1998 1999 2000 2001 2002 2003 2004 2005 2006 2007
Mil
lio
n M
etr
ic T
on
s, C
O2
Predicted CO2 emissions by sample, matched samples
All Observations
CCX Control
CDP Control
CCX Treatment
CDP Treatment

0
0.5
1
1.5
2
2.5
3
1994 1995 1996 1997 1998 1999 2000 2001 2002 2003 2004 2005 2006 2007
Mil
lio
n M
etr
ic T
on
s, C
O2
Year
Predicted CO2 emissions (intensity) by matched subsample
All Observations
CCX Control
CDP Control
CCX Treatment
CDP Treatment

CCX
-43,000 metric tons of carbon (2%)
10,000 tons per year, per plant
.5% decrease * 4 years
Reduction in Carbon intensity?

CDP
-8,000 Metric Tons (.8% decrease)
3,000 tons per year, per plant
(0.3% decrease, per year, for 2.7 years)
4x as many plants are involved in CDP
Broader, shallower reductions
Results are unbiased and consistent

CCX has more of an impact, per plant
More statistically significant results, despite nature of trading
Large standard errors
▪ Nature of trading in CCX
▪ Voluntary nature
CCX has been in effect longer
CDP is broader program

Decision to participate indicates change in management decision CDP participation requires that firms have started to pay attention CCX participation signals that attention is being paid to carbon Difficulty of evaluating policy with binary variable
Voluntary program participation correlated with changes
Voluntary programs can reward firms that are proactive Achieve low-cost carbon reductions
Still, problems with transparency of process
CDP works to force transparency CCX very opaque

Voluntary policy may help achieve low-cost environmental improvements
Still a bit of a black box
Source of reductions
Need to learn what’s going on inside firms
Improve upon binary measurement

NSF Dissertation improvement grant (SBE) #0819244
Indianapolis Power & Light

Program CCX CDP
Number of initial plants 966 966
Initial plant-year
observations
13,558 13,558
Matched pairs 95 423
Total plant-year
observations after first
differencing
2,548 10,988
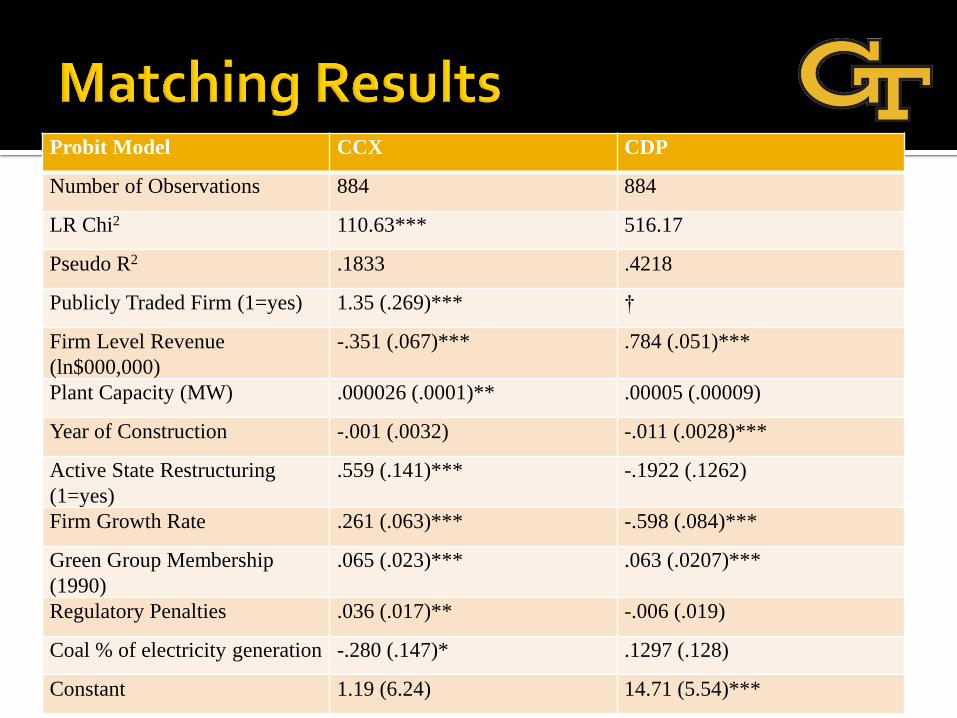
Probit Model CCX CDP
Number of Observations 884 884
LR Chi2 110.63*** 516.17
Pseudo R2 .1833 .4218
Publicly Traded Firm (1=yes) 1.35 (.269)*** †
Firm Level Revenue
(ln$000,000)
-.351 (.067)*** .784 (.051)***
Plant Capacity (MW) .000026 (.0001)** .00005 (.00009)
Year of Construction -.001 (.0032) -.011 (.0028)***
Active State Restructuring
(1=yes)
.559 (.141)*** -.1922 (.1262)
Firm Growth Rate .261 (.063)*** -.598 (.084)***
Green Group Membership
(1990)
.065 (.023)*** .063 (.0207)***
Regulatory Penalties .036 (.017)** -.006 (.019)
Coal % of electricity generation -.280 (.147)* .1297 (.128)
Constant 1.19 (6.24) 14.71 (5.54)***
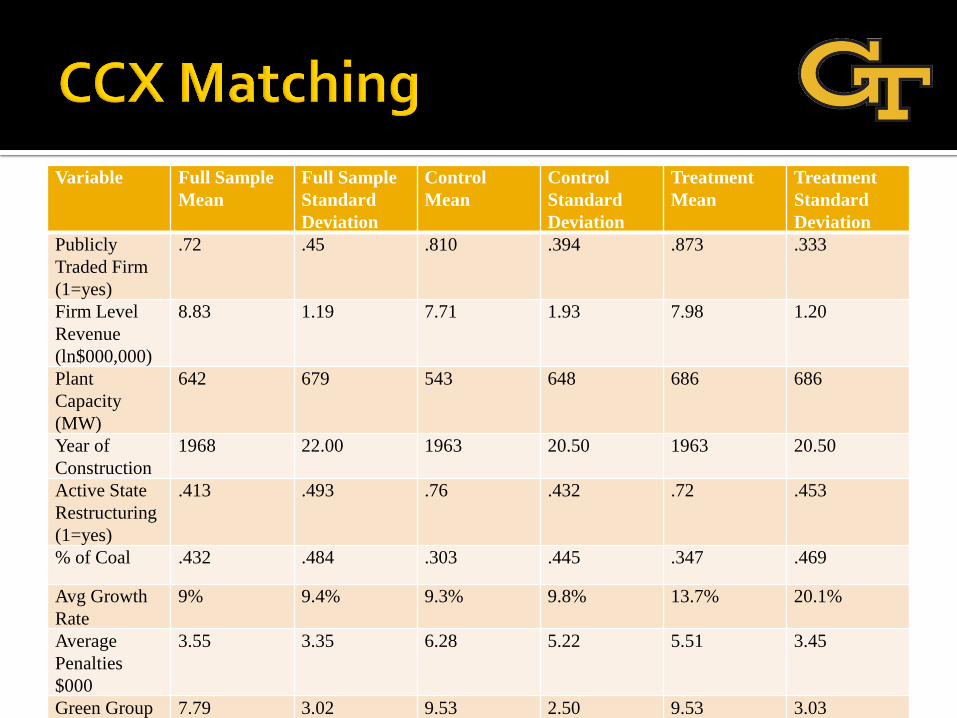
Variable Full Sample
Mean
Full Sample
Standard
Deviation
Control
Mean
Control
Standard
Deviation
Treatment
Mean
Treatment
Standard
Deviation
Publicly
Traded Firm
(1=yes)
.72 .45 .810 .394 .873 .333
Firm Level
Revenue
(ln$000,000)
8.83 1.19 7.71 1.93 7.98 1.20
Plant
Capacity
(MW)
642 679 543 648 686 686
Year of
Construction
1968 22.00 1963 20.50 1963 20.50
Active State
Restructuring
(1=yes)
.413 .493 .76 .432 .72 .453
% of Coal .432 .484 .303 .445 .347 .469
Avg Growth
Rate
9% 9.4% 9.3% 9.8% 13.7% 20.1%
Average
Penalties
$000
3.55 3.35 6.28 5.22 5.51 3.45
Green Group
membership
7.79 3.02 9.53 2.50 9.53 3.03

Variable Full Sample
Mean
Full Sample
Standard
Deviation
Control
Mean
Control
Standard
Deviation
Treatment
Mean
Treatment
Standard
Deviation
Firm Level
Revenue
(ln$000,000)
8.83 1.19 6.58 1.89 8.81 .808
Plant
Capacity
(MW)
642 679 543 648 686 686
Year of
Construction
1968 22.00 1970 21.74 1964 18.24
Active State
Restructuring
(1=yes)
.413 .493 .385 .487 .501 .500
% of Coal .432 .484 .396 .481 .469 .484
Avg Growth
Rate
9% 9.4% 9% 11.3% 9.2% 7.6%
Average
Penalties
$000
3.55 3.35 3.35 3.28 3.86 3.58
Green Group
membership
7.79 3.02 7.64 3.01 8.03 2.97

1.5
1.7
1.9
2.1
2.3
2.5
2.7
1994 1995 1996 1997 1998 1999 2000 2001 2002 2003 2004 2005 2006 2007
Predicted Emissions of Sub-Samples (Unmatched, Appendix A, model 1)
Emissions - Non-participants (Tons)
Emissions - CCX
Emissions - CDP
Emissions - CDP & CCX
1.5
1.7
1.9
2.1
2.3
2.5
2.7
2.9
1994 1995 1996 1997 1998 1999 2000 2001 2002 2003 2004 2005 2006 2007
Mil
lio
n M
etr
ic T
on
s, C
O2
Year
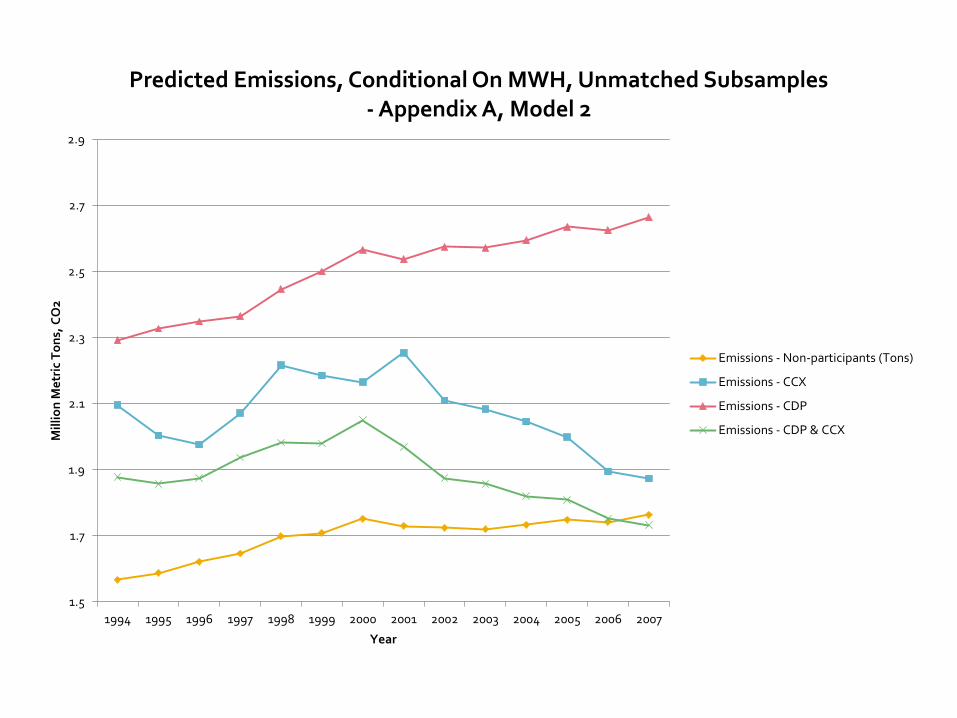
Predicted Emissions, Conditional On MWH, Unmatched Subsamples - Appendix A, Model 2
Emissions - Non-participants (Tons)
Emissions - CCX
Emissions - CDP
Emissions - CDP & CCX