dr. euler - manitoulin island · forest. forest ecology and management. 259(8), 1522-1529 7 ontario...
TRANSCRIPT

A Discussion about Sustainability 1
2
Dr. Euler, Ph.D., Certified Wildlife Biologist 3
October 2011 4
5
After the Algonquin Forest Management Plan was approved in early 2010 I wrote a paper that 6
suggested that the Plan was detrimental to migratory bird habitat, and I said “However, logging 7
as currently practiced in Algonquin Park is not sustainable in any normal meaning of that term, 8
and the current Forest Management Plan will slowly, but inexorably, degrade the habitat for 9
some migratory birds in the Park”.1 10
11
The forester for Renfrew County, Lacey Rose, prepared a rebuttal to my paper and suggested 12
that I was wrong to say the plan is not sustainable. Her paper is available from the County of 13
Renfrew, 9 International Drive, Pembroke, Ontario, K8A 6W5, 613 735 3204. 14
15
This paper is a discussion of the differences between MS Rose and me concerning sustainability 16
and how the concept of sustainability applies to the Forest Management Plan for Algonquin 17
Park. 18
19
The technique I used is to copy the major points made in MS Rose’s rebuttal and to address them 20
in paragraphs adjacent to her comments. 21
22
Comments are welcome on this discussion and may help everyone discover and refine the 23
concept of sustainability in a real world context. 24
25
26
27
Dr. Euler 28
29
30
31
32
33
34
35
36
37
38
39
40
1 An Analysis of Forest Management’s Impact on Migratory Bird Habitat in Algonquin Provincial Park, typescript,
Dr. Euler (this paper is available from me, [email protected]

On Page 1 MS Rose wrote: 41
42
Forest management planning on Crown land in Ontario is designed to be a transparent and 43
defendable process. Assumptions and standards used from the start of any plan are based on the 44
best available peer-reviewed science endorsed by the province of Ontario. Legislated manuals and 45
guides must be used. These documents are reviewed by highly regarded professionals of various 46
related fields, as well as the general public before approval. Forest management plans are reviewed 47
constantly during the planning process by multiple levels of the OMNR, First Nations, Local Citizen’s 48
Committees and the general public. The opportunities for input and participation are vast and 49
required by the Forest Management Planning Manual. The MNR is ultimately responsible for 50
ensuring a FMP is sustainable and approving it for implementation. 51
52
Dr. Euler’s response 53
54
Much of the documentation used in preparing a forest management plan is not based on peer-55
reviewed science. The Strategic Forest Management Model (SFMM) used as the prime planning 56
tool has not been subject to a peer-review, nor have many of the ecological assumptions used in 57
that model been subjected to a peer-review process. This is a fact that is easily proved or not 58
proved. If the SFMM and the assumptions used in that model been subject to a peer review, that 59
review should be available and it will be easy to see who is correct on this point. 60
61
One of the most important documents used in considering a test of sustainability of the Forest 62
Management Plan (FMP) for Algonquin Park is a paper that was used to estimate the impact of 63
forest management on wildlife habitat in the Park.2 This is a paper prepared by Ministry staff but 64
has never been submitted to a peer review by independent scientists who have expertise in this 65
area. This paper is a critically important part of the planning process and it should have been 66
peer reviewed to gain confidence in its use in such important work. In my opinion, as a Wildlife 67
Habitat Ecologist, and Certified Wildlife Biologist, with extensive experience in forest 68
management, this paper is not a reliable high-quality product that can be used with confidence. I 69
am not alone in this opinion. Scientists from the Canadian Wildlife Service identified many 70
serious problems with the paper when they conducted a test of the paper as applied in the 71
Northeast Region3. A similar test has never been conducted in the Algonquin Region, and thus 72
there is no evidence of its reliability in the FMP for Algonquin Park. 73
74
The lack of concern for the accuracy for one of the most basic tools in the planning process is a 75
major concern. The idea of sustainability is not supported with careless use of planning tools. 76
77
78
79
80
2 Holloway, G.L., B. J. Naylor, and W. R. Watt, Editors. 2004. Habitat relationships of wildlife in Ontario. Revised
habitat suitability models for the Great Lakes-St. Lawrence and Boreal East forests. Ontario Ministry of Natural
Resources, Science and Information Branch, Southern Science and Information and Northeast Science and
Information Joint Technical Report #1. 110p. 3 Holmes, S., L. Vernier and B. Naylor. 2007. A test of Ontario’s Habitat Suitability Matrix as a forest management
planning tool for forest birds, Vol. 83, No. 6, page 570-579.

81
On page 1 MS Rose wrote: 82
83 In recent years, population variances in migratory bird species have attracted attention from many 84
forest scientists and ecologists. For example, an entire edition of The Forestry Chronicle (March 85
2009, Volume 85, Number 2, http://pubs.cif-ifc.org/toc/tfc/85/2) was dedicated to the relationship 86
between forest birds and forest management. One article4 of particular interest analyzed 87
population trend of Ontario’s forest birds and found the trends of most forest birds as stable or 88
positive at the Ontario-wide scale. There is some evidence that increases in fragmentation due to 89
development and deforestation in southern Ontario5 has had an effect on forest-dependant 90
species. A study of the effects of group selection harvesting on breeding birds in tolerant hardwood 91
forests in Algonquin Park showed no difference in abundance of 73% of species analyzed; all other 92 species increased in abundance one or two years post-harvest, except for a small decrease in one 93 species in the second year6. A large volume of studies exist, yet the general consensus of most forest 94
professionals is there is no strong data to link forest management in Canada to a decline in bird 95
populations. 96
97
Dr. Euler’s response 98
99
It would be helpful to this discussion if MS Rose could substantiate her statement that “… the 100
general consensus of most forest professionals is there is not strong data to link forest 101
management in Canada to a decline in bird populations.” It is very easy to state that there is a 102
broad consensus but if there is no substantial evidence for that consensus the statement is not 103
credible. 104 105
The evidence that migratory birds have declined in the last several decades is convincing. In the 106
article cited by MS Rose (footnote 4), Table 5 list 23 species of birds that have experienced large 107
declines in Bird Conservation Region (BCR) 12 in the last 20 years. Algonquin Park is in the 108
heart of BCR 12. In her book, (Silence of the Song Birds: how we are losing the world’s 109
songbirds and what we can do to save them) Dr. Bridget Stutchbury, a Professor of Biology at 110
York University examines in detail how songbird populations are declining. It is not a pretty 111
picture. 112
113
The Ontario Government and the Federal Government have cooperated to produce a “Landbird 114
Conservation Plan” for all the BCRs in Canada. Algonquin Park is part of BCR 12 and the 115
Landbird Conservation Plan reviews all the species in that region and assigns them a 116
conservation priority based on their population trend and the trend of loss or gain in their 117
habitat.7 The entire plan should be consulted to provide a more careful and thoughtful review of 118
4 Blancher, P. et al. 2009. Population trend status of Ontario’s forest birds. The Forestry Chronicle. 85(2).
5 Austen, M.J.W. et al. 2001. Landscape Context and Fragmentation Effect on Forest Birds in Southern Ontario. The Condor 103
(4): 701-714 6 Tozer, D.C. et al. 2010. Short-term effect of group selection harvesting on breeding birds in a northern hardwood
forest. Forest Ecology and Management. 259(8), 1522-1529 7 Ontario Partners in Flight. 2008. Ontario Landbird Conservation Plan: Boreal Hardwood Transition,
North American Bird Conservation Region 12. Ontario Ministry of Natural Resources, Bird Studies
Canada, Environment Canada.
the status of landbirds in this region, however a quote from the summary (page iv) provides an 119
objective picture of the situation in BCR 12. 120
121 Fifty-one (31%) of the 167 species of landbirds that regularly breed or winter in ON BCR 12 are 122 identified as priority species (see Table 3 for a complete list) on the basis of a detailed species 123 assessment (Chapter 3 outlines the approach; the appendices provide details). The high number of 124 priority species occurs because this region includes many species of high conservation concern, as 125 well as many species of high conservation responsibility. A few species (Canada Warbler, Golden-126 winged Warbler and Veery) are of high concern and high responsibility. Priority species are identified 127 due to a combination of population declines, high vulnerability and future threats and include species 128 of Continental Concern (PIF Continental Watch List) with important populations in this region (e.g., 129 Bay-breasted Warbler), species with small global range and populations that are considered vulnerable 130 to future change (e.g., Golden-winged Warbler) and common widespread species that have 131 experienced population declines and face ongoing threats on their breeding or wintering grounds (e.g., 132 Wood Thrush). 133 134 Approximately half the priority species are landbirds for which ON BCR 12 has a high global 135 responsibility for the species’ population in combination with other concerns (e.g., Veery; Black-136 throated Blue, Blackburnian, Chestnut-sided and Golden-winged Warblers). Several landbird Species 137 at Risk occur within this region, including notable local populations of Cerulean Warbler and 138 Peregrine Falcon. Twenty-nine priority species are forest species, associated with one of the following 139 general forest types, each of which is considered a priority habitat for attention: 140
Deciduous forest – 15 priority species (see Chapter 5); _ 141 Coniferous forest – seven priority species (see Chapter 6); and 142 Successional forest – seven priority species (see Chapter 7). 143
144
Based on the evidence provided in the Landbird Conservation Plan and associated scientific 145
studies, it is impossible to conclude that there is little or no concern for bird habitat in Algonquin 146
Park. 147
148
On Page 3 MS Rose wrote: 149
150
The Ontario Crown Land Survey (1858-1893) composition of hemlock was recorded at 3.3% as 151
opposed to 4.3% in the 2005 forest resource inventory for Algonquin Park5. This snapshot in time 152
provides a glance at a similar composition of hemlock that is present today, although this was after 153
logging had commenced in Algonquin. Logging red and white pine for square timber started in 154
about 1830. Hemlock was harvested locally for its bark for use in the tanning industry in the early 155
1900s but the majority of harvest started in the 1950s when hemlock was targeted for construction 156
of the Toronto subway system. This conflicts with Euler’s statement that “...Eastern Hemlock was 157
once a major dominant species in the Park, forest harvesting over the last four centuries has 158
reduced it...”. (DE’s emphasis) An extensive review on the history of hemlock in the Park notes that 159
it became a minor component of the forest about 4,800 years ago, long before European influence. 160
161
162
163
164
165
166
167

Dr. Euler’s response: 168
169
There is no doubt that hemlock was once a major component of the forest in Algonquin Park. 170
Norm Quinn reviewed the literature on this topic and his paper can be consulted for details8. In 171
his study of Algonquin Park in 1952 and 1953, Nick Martin maintained that a maple-hemlock-172
yellow birch forest would exist in the Park, if natural successional was allowed to proceed 173
unhindered by human management9. Evidence from the pollen record shows that hemlock was a 174
major part of the area about 6,000 years ago; a large die-off happened about 4,500 years ago, 175
followed by a resurge of this species from about 1,000 years before present to the beginning of 176
industrial forestry10
. However, even at its lowest point about 4,500 years ago, it was still 5% of 177
the forest at that time. Today, as MS Rose points out, it is about 3.3% of the Park area. In 178
Quinn’s review of the hemlock literature, he wrote, “Hemlock was apparently a major 179
component of the resettlement forest, being the first or second dominant species in 26 of 38 180
studies of the composition of primary northern hardwood forests (Table 2).” Based on the data 181
in the historical record, Quinn cited studies which estimated that the hemlock-yellow birch 182
ecosite has declined by 62% (from 12.75% of to 4.72% of the area) since 1890. 183
184
Today, as measured by the Algonquin Forest Management Plan, the Eastern Hemlock working 185
group is about 3.3 percent of the Park, a major loss of an important keystone species. 186
187
On Page 3 through page 7, MS Rose explains that the hemlock harvest is acceptable and 188
concludes that: 189
190
The interpretation of hemlock harvest illustrated in Euler’s paper is incomplete and leads to a false 191
conclusion that “total habitat for migratory birds that depend on hemlock will be reduced 192
significantly if this plan is carried out as approved”. Available hemlock harvest area remains 193
constant in the short (10 year), medium (20 year) and long (100 year) time horizons of the plan13, 194
indicating that the area of available hemlock remains constant over time. There is no indication that 195
the implementation of the Algonquin Park Forest Management Plan will lead to a decrease in 196
hemlock area, or reduce representation of hemlock on the landbase. 197
198
199
Dr. Euler responds. 200
201
It is true that the area of hemlock working group that is 26,000 ha in size in 2010 will remain 202
approximately the same size during the implementation of this forest management plan. 203
However the plan will diminish the quality of that area for the migratory birds that use hemlock 204
as preferred habitat. 205
206
8 Quinn, N.W. S. 2004. The presettlement hardwood forests and wildlife of Algonquin Provincial Park: A synthesis
of historic evidence and recent research. The Forestry Chronicle 80: 705-715. 9 Martin, N.D. 1959. An analysis of forest succession in Algonquin Park, Ontario. Ecological
Monographs 29: 187-217. 10
Jean Nicolas Haas and John H. McAndrews, 1999. Summer Drought Related Hemlock (Tsuga canadensis)
Decline in Eastern North America 5,700 to 5,100 Years Ago: Seminar on Sustainability in Eastern Hemlock.

When N.D. Martin surveyed mature hemlock stands for migratory birds in 1952 and 1953 he 207
found considerably more birds in mature hemlock stands than in other types of habitat. 208
209
Martin (1960) surveyed bird communities in Algonquin Park over two field seasons in the early 210
1950’s. He was able to determine that distinct bird communities were present in forest types he 211
classified as bog, boreal forest, deciduous forest, and hemlock forest. The hemlock bird 212
community had the highest density of territorial males and the greatest number of “principal” 213
species. Most striking was the density of some species found in the hemlock community 214
compared to those found in other communities. He recorded 102 blackburnian warbler 215
(Dendroica fusca) males per 100 acres in the hemlock forest, compared with a maximum of 15 216
in other forest types. Also recorded most frequently in hemlock forests were black-throated green 217
warbler (D. virens) (28 in hemlock, compared to a maximum of 6 in other communities), slate-218
coloured junco (Junco hyemalis) (13 in hemlock, max. 4 elsewhere), red-breasted nuthatch (Sitta 219
canadensis) (10 hemlock, max. 4 elsewhere). In addition, two species (blue-headed vireo (Vireo 220
solitaries) and parula warbler (Parula americana) were found only in the hemlock community in 221
the Park. 222
223
Hemlock stands and small groups of hemlock trees within larger areas of hardwood are 224
extremely important to a variety of migratory bird species. 225
226
Although the area of the hemlock working group in Algonquin Park will be the same 227
throughout the planning period, the quality of the habitat for migratory birds will be diminished. 228
The Forest Management Plan will allow about 1,000 ha of hemlock working group to be 229
harvested each year using the Group Selection Silviculture System. Hemlock stands mature to 230
about 42 m²/ha basal area and after that very little wood is added. The Group Selection 231
harvesting system reduces the basal area of these stands to about 32 m²/ha to achieve maximum 232
growth rates following the harvest. In this harvesting process the amount of hemlock habitat for 233
birds is substantially reduced. As well, each hectare of the working group is harvested every 25 234
years, and thus the age distribution of the trees is reduced and most of the trees will never reach 235
the old growth stage, the most valuable stage for migratory birds, as Martin (1960) recorded. 236
237
In addition to the harvest in the Hemlock Working Group, well over 350,000 m³ of hemlock will 238
be harvested from other types of working groups. The Hardwood Uniform Shelterwood, the 239
Mixedwood Uniform Shelterwood, the Spruce-Fir Uniform Shelterwood and the Hardwood 240
Selection Working Group all contribute to the hemlock harvest, (Table FMP-17). In these 241
working groups hemlock occurs in single trees or small groups of trees often on cooler north-242
facing slopes. Regeneration in these stands is very difficult and often there is little or no 243
regeneration of hemlock in these stands following harvest. The Silvicultural Ground Rules in the 244
Plan, Table FMP-5, make little or no provision for regeneration of these hemlock trees that are 245
cut within the tolerant hardwood forests. Thus there is a general loss of hemlock throughout the 246
Park as these trees are cut. The loss of these trees also represents a major loss of habitat for 247
migratory birds. 248
249
The Forest Management Plan commits about 150,000 m³ of wood over a 10 year period to mills 250
adjacent to the Park in support of jobs in communities around the Park (FMP-19, in the 251
Algonquin Forest Management Plan). However in additional to the wood committed to support 252

jobs in these mills, almost 3 times as much wood is committed to the open market. This is wood 253
that is harvested beyond the commitment to support the local people in their daily life, Table 1. 254
255
The tragedy of this excessive harvest of hemlock is that valuable and needed habitat for 256
migratory birds is being destroyed in order to get the maximum possible revenue from the Park. 257
It seems unjustified and wrong to expect Algonquin Provincial Park to have supply this amount 258
of wood to satisfy human needs and ignore the needs of wildlife. 259
260
Table 1- The amount of hemlock committed to mills adjacent to Algonquin Park and the amount 261
that will be sold on the open market to provide revenue to the general treasury, FMP-19. 262
______________________________________________________________________________ 263
Mill Hemlock Product 264
Committed 265
______________________________________________________________________________266
__ 267
McRae Lumber 73,000m³ Sawlogs 268
Murray Bros 37,000m³ Sawlogs 269
Commonwealth P. 27,000m³ Sawlogs 270
McRae Lumber 11,280m³ Pulp 271
Murray Bros 1,440m³ Pulp 272
total 149,720m³ 273
274 Open Market 263,028m³ Sawlogs 275
Open Market 158,721m³ Pulp 276
Open Market 9,455m³ Undersize, defective 277
Total 431,204m³ 278
279 On page 7 MS Rose wrote: 280 281 White and Red Pine Habitat 282
Red and white pine forests are of high value ecologically, economically and spiritually. Historic 283
logging practices starting in the early 1800s removed a large proportion of the large white pine in 284
Central Ontario and as a result, there is little area in old growth still to this day. Still, to say pine is a 285
“negligible amount” of the Algonquin Park forest is misleading. There is almost 103,000ha of pine-286
dominated forest in Algonquin Park – about 21% of the forested landbase area. Approximately 287
73,000ha is available for forest management. The Thompson et al (2006) paper referenced by Euler 288
illustrates a reduction in the number of white pines in mixed and deciduous stands from about 3 to 289
>8 pines/ha to <1 pine/ha. As for the cause of this reduction, Thompson states: Aside from early 290
over logging, the continued low density of white pine in all forest types can be attributed in part to 291
intense post-logging fires in the 1800s and to the past 60 years of fire suppression, which have 292
eliminated seed sources and seedbeds. We suggest that a program using several silvicultural 293
techniques will be necessary to restore the white pine in forest types that existed historically; and 294
also the evidence for a decline in white pine in pine-dominated stands remains an open question. 295
296 297
298
Dr. Euler responds 299
300
Algonquin Park is bisected into two major forest communities. The eastern half of the Park is 301
dominated by red and white pine, but also includes intolerant hardwoods, (usually trembling 302
aspen and white birch. The silty soils of the Precambrian uplands, on the west side, support a 303
luxuriant forest dominated by tolerant hardwoods, primarily sugar maple, yellow birch, eastern 304
hemlock and beech. In the past this area was dominated eastern hemlock, yellow birch, and 305
sugar maple. Historically however, the tolerant hardwoods of the western half also supported a 306
major component of white and red pine. 307
308
In their paper Thompson et al (2006) present a comprehensive review of the historical abundance 309
of white pine in the park. Their conclusion, on page 69 reads as follows: 310
311
The scope of the decline of white pine from mixed wood ecosystems (mostly now 312
deciduous ecosystems) in Algonquin Park since ca. 1800 has been immense. Tolerant 313
hardwoods and boreal type mixed woods are the dominate types on the study areas, 314
comprising more than 90% of the forests. If these stands had 3-8 white pine trees per 315
hectare on average, as we suspect they should, then this conservatively translates to more 316
than a million fewer white pine trees in Algonquin now that occurred there historically. 317
318
The loss of pine from the western half of the Park has been enormous. There is less than one 319
pine per hectare on average in the current forest than in the era before industrial forestry began, 320
compared to 3 to 8 in the past. As the authors of that paper point out 88% of White Pine in the 321
Park in the early 1800’s have been cut and not replaced by regeneration procedures. 322
323
The Crown Forest Sustainability Act requires managers to use this principle when preparing 324
forest management plan: 325
326
The long term health and vigour of Crown Forests should be provided for by 327
using forest practices that, within the limits of silvicultural requirements, 328
emulate natural disturbances and landscape patterns while minimizing 329
adverse effects on plant life, animal life, water, soil, air and social and 330
economic values, including recreational values and heritage values. (CFSA s.2 (3)2). 331
332
The Algonquin Forest Authority and the Ministry of Natural Resources have not attempted to 333
apply silviculture techniques to re-establish the white pine that once grew in those forests. This 334
seems like a violation of the principles in the Crown Forest Sustainability Act and the moral 335
imperative to manage a Park in the most exemplary manner available. 336
337
338
On page 7, MS Rose wrote: 339
340
The age-of onset for old growth white pine is approximately 125 years and red pine approximately 341
140 years. A large majority of red and white pine forest is in the 100-120 age class at the present 342
time and is expected to naturally age into old growth during the course of the plan. This accounts 343
for the almost doubling of white pine old growth (PwUS) area (11,637ha to 21,907ha) and more 344

than doubling of red pine (PrCC) old growth area (58ha to 169ha) from 2010 to 2020. These 345
projections take planned harvest area into account. The 2010 FMP projects much higher white pine 346
old growth levels than the 2005 FMP. The “current” level of PWUS4 illustrated in Figure 3 is the 347
2006 level – 4,612 ha. The level projected for 2010 in the current FMP is, as stated above, 11,637ha. 348
The projected level for plan end is 21,907ha. This makes significant progress towards the lower 349 range in one of the white pine classes in the Landscape Guide referenced by Euler, PWUS4, shown 350 below in Figure 3. There are several other white pine landscape classes included in the landscape 351 guide – none of which are directly comparable to the PwUS forest unit of the Algonquin Park FMP. 352 For example, PWUS4 has a >50% composition of white and red pine; PwUS of the FMP has a >40% 353 composition of white and red pine. Another white pine landscape class – PWST (white pine seed 354 tree) has a higher level of old growth currently than the 900+ year projected Simulated Range of 355 Natural Variation contained in the Landscape Guide (Figure 4). In all projected white pine landscape 356 classes, area in mature forest is currently higher than “natural” – this is as a result of the relatively 357 skewed age class structure of the Park (and Central Ontario in general) caused by historic logging 358 practices and settlement that occurred over 100 years ago. A large proportion of this area is on the 359 cusp of aging into the “old’ age category, explaining the projected large increase in old growth in the 360 next 30 years. It is important to keep in mind that old growth forest cannot be created overnight. The 361 FMP balances an impressive increase in white pine old growth and a sustainable harvest to support 362 the economy of central Ontario. 363 364 Dr. Euler’s response. 365
366
A good example of how historic forest management in Algonquin Park has reduced biodiversity 367
and wildlife habitat is illustrated by the current age-class structure of white pine in the Park. 368
White pine has been a signature species in this Park for many years, and one of the motives of 369
establishing the Park was to preserve white pine ecosystems for study and enjoyment. However 370
after over 100 years of logging and forest management the white pine areas in the Park do not 371
resemble a forest that evolved under natural conditions. Instead they represent an age class 372
structure that is much less diverse and contains much less wildlife habitat than would be present 373
in a natural forest. Cleary the intent of the Crown Forest Sustainability Act is to develop Forest 374
Management Plans that start moving the forest towards a natural disturbance scenario, and this 375
has not been done. 376
377
In white pine stands, in the absence of human management, about half of the trees would be in an 378
“old growth” condition, represented in Figure 1 by the box and whisker diagrams. This diagram 379
comes from the Landscape Guide, a document produced by the Ministry of Natural Resources to 380
guide forest management. Well over half of the stands would be older than 120 years, and many 381
would be much older. A good example of a recent paper that describes this condition for 382
Algonquin Park was prepared by Ministry staff (Guyette and Dey 1995).11
In their study they 383
found many white pine trees older than 300 years and quite a few older than 400 years. Another 384
study that illustrates the loss of white pine trees in the Park was the study mentioned above and 385
conducted by scientists employed by the Canadian Forest Service.12
In their work, they found 386
11
Guyette, R.P. and D.C. Dey. 1995. Age, size and regeneration of old growth white pine at Dividing Lake Nature
Reserve, Algonquin Park, Ontario. Forest Research Report 131. Ontario Ministry of Natural Resources, Ontario
Forest Research Institute, Sault Ste. Marie, Ontario. 12
Thompson, I.D. and J.H. Simard.2006. Historic changes in White Pine (Pinus strobus L.) density in Algonquin
Park, Ontario, during the 19th
century. Natural Areas Journal 26(1): 61-71.

that “Stump and tree densities since the 1800s suggested a mean reduction in the number of 387
white pine trees of 88% from about 3 to > 8 pines per/ha to <1 pine /ha today in mixed and 388
deciduous stands. GIS-based mapping predicted a maximum decline of pine-dominated stands 389
of about 40% by area, from 539 km² that may have historically supported such forests.” 390
391
In sharp contrast to what would be expected from natural forces, current stands of white pine 392
(represented by the green dots in Figure 1) are dominated by trees less than 120 years of age. 393
This is the result of many years of shelterwood management in which the most economical 394
approach to white pine management is to harvest the trees before they reach the old growth state. 395
However this management approach reduces biodiversity and the older habitat that several 396
wildlife species use as their best habitat. 397
398
399
400
401
402 403
Figure 1 This graph represents a sample of about 47,000 ha of white pine in the Park and was 404
prepared by Ministry staff using the Ontario Landscape Tool, a sophisticated tool developed 405
using the best science and information available for Ontario conditions. It summarizes the work 406
of several dozen scientists and hundreds of scientific papers. 407
How Will the 2010 Plan Affect Old Growth Pine 408
409
Table 2- The figures in this table are all taken from Appendix H of the 2005 Forest Management 410
Plan and the 2010-2020 Forest Management Plan. Note that the amount of old growth white 411
pine increases for the first 50 years of the plan, and stays at 30,000 ha to the end of the Plan. 412
413
Estimated range of natural variation for forest unit - "PWUS4"
0
5,000
10,000
15,000
20,000
25,000
30,000
35,000
40,000
45,000
50,000
Development stage
Are
a (
hecta
res)
0
5,000
10,000
15,000
20,000
25,000
30,000
35,000
40,000
45,000
50,000
lower quartile 4 2 6 17,114 33,260 3,651
lower range 0 0 0 13,490 30,086 2,639
median 10 6 11 18,066 35,456 4,325
upper range 114 61 47 22,272 43,784 6,210
upper quartile 21 15 26 19,170 37,231 4,984
Current 2006 1,275 3,935 954 36,747 4,612 0
Year-50 Median 22 16 2,601 4,697 31,282 3,212
Pre-sapling 0-14 Sapling 15-34 Immature 35-74 Mature 75-119 Old 120+ Two-stage
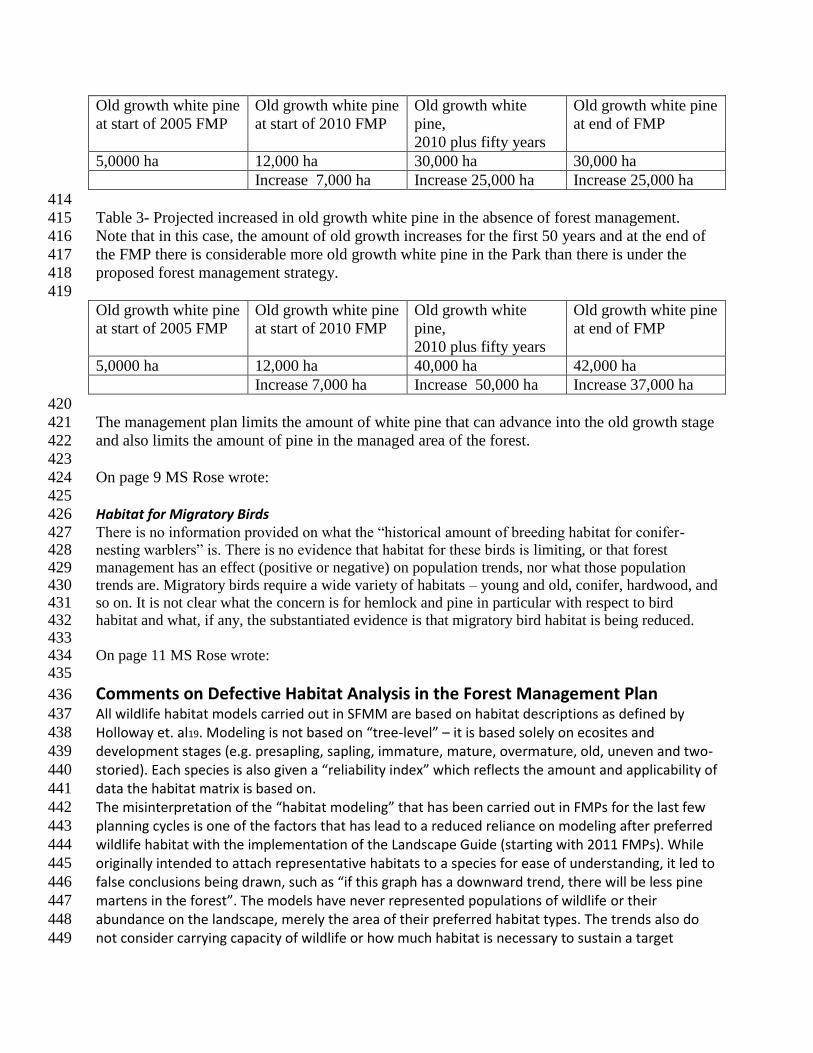
Old growth white pine
at start of 2005 FMP
Old growth white pine
at start of 2010 FMP
Old growth white
pine,
2010 plus fifty years
Old growth white pine
at end of FMP
5,0000 ha 12,000 ha 30,000 ha 30,000 ha
Increase 7,000 ha Increase 25,000 ha Increase 25,000 ha
414
Table 3- Projected increased in old growth white pine in the absence of forest management. 415
Note that in this case, the amount of old growth increases for the first 50 years and at the end of 416
the FMP there is considerable more old growth white pine in the Park than there is under the 417
proposed forest management strategy. 418
419
Old growth white pine
at start of 2005 FMP
Old growth white pine
at start of 2010 FMP
Old growth white
pine,
2010 plus fifty years
Old growth white pine
at end of FMP
5,0000 ha 12,000 ha 40,000 ha 42,000 ha
Increase 7,000 ha Increase 50,000 ha Increase 37,000 ha
420
The management plan limits the amount of white pine that can advance into the old growth stage 421
and also limits the amount of pine in the managed area of the forest. 422
423
On page 9 MS Rose wrote: 424
425
Habitat for Migratory Birds 426
There is no information provided on what the “historical amount of breeding habitat for conifer-427 nesting warblers” is. There is no evidence that habitat for these birds is limiting, or that forest 428 management has an effect (positive or negative) on population trends, nor what those population 429 trends are. Migratory birds require a wide variety of habitats – young and old, conifer, hardwood, and 430 so on. It is not clear what the concern is for hemlock and pine in particular with respect to bird 431 habitat and what, if any, the substantiated evidence is that migratory bird habitat is being reduced. 432 433 On page 11 MS Rose wrote: 434 435
Comments on Defective Habitat Analysis in the Forest Management Plan 436
All wildlife habitat models carried out in SFMM are based on habitat descriptions as defined by 437
Holloway et. al19. Modeling is not based on “tree-level” – it is based solely on ecosites and 438
development stages (e.g. presapling, sapling, immature, mature, overmature, old, uneven and two-439
storied). Each species is also given a “reliability index” which reflects the amount and applicability of 440
data the habitat matrix is based on. 441
The misinterpretation of the “habitat modeling” that has been carried out in FMPs for the last few 442
planning cycles is one of the factors that has lead to a reduced reliance on modeling after preferred 443
wildlife habitat with the implementation of the Landscape Guide (starting with 2011 FMPs). While 444
originally intended to attach representative habitats to a species for ease of understanding, it led to 445
false conclusions being drawn, such as “if this graph has a downward trend, there will be less pine 446
martens in the forest”. The models have never represented populations of wildlife or their 447
abundance on the landscape, merely the area of their preferred habitat types. The trends also do 448
not consider carrying capacity of wildlife or how much habitat is necessary to sustain a target 449

population. The natural benchmark is not related to “too much” or “too little” habitat for a species. 450
It is simply the result of growing the forest from its current condition 150 years into the future 451
without harvesting or fire suppression. In future, habitats will be modeled based on Landscape 452
Classes (e.g. White Pine Mixedwood). There are a few carry-over wildlife species that continue to be 453
mandatory for modelling due to commitments in legislation (e.g. the Old Growth Policy). 454
455 Dr. Euler’s response. 456
457
Canadian forest managers have a responsibility to conserve habitat for migratory birds as part of 458
the forest management planning process. In addition, Algonquin Park should not be just another 459
Crown Management Unit, treated in the same manner as any other Forest Management Unit 460
which requires a forest management plan. The original mandate of the Park was to “… reserve 461
and set apart as a public park and forest reservation, fish and game preserve, health resort and 462
pleasure ground for the benefit, advantage and enjoyment of the people of the Province.”13
). 463
Park managers have a responsibility to treat the Park Forest as a special unit where the desire to 464
harvest wood is not given predominance over the needs of habitat for wildlife. 465
466
One of the most important documents used in considering a test of sustainability of the FMP for 467
Algonquin Park is a paper that was used to estimate the impact of forest management on wildlife 468
habitat in the Park.14
This is the paper referred to in MS Rose’s comment above. This is a paper 469
prepared by Ministry staff but has never been submitted to a peer review by independent 470
scientists who have expertise in this area. This is a critically important part of the planning 471
process and it should have been peer reviewed to gain confidence in its use in such important 472
work. In my opinion, as a Wildlife Habitat Ecologist, and Certified Wildlife Biologist, with 473
extensive experience in forest management, this paper is not a reliable high-quality product that 474
can be used with confidence. I am not alone in this opinion. Scientists from the Canadian 475
Wildlife Service identified many serious problems with the paper when they conducted a test of 476
the paper as applied in the Northeast Region15
. A similar test has never been conducted in the 477
Algonquin Region, and thus there is no evidence of its accuracy in the FMP for Algonquin Park. 478
479
Algonquin Park is dominated by relatively stable ecosystems. These ecosystems include maple 480
dominated stands, red and white pine, oak and hemlock, all which tend to persist for long periods 481
of time in forests that are not managed by people. Pileated Woodpeckers are usually associated 482
with mature and older stands of trees, in a wide variety of forests, and the plan predicts that if 483
human management stopped, these birds would lose habitat. That conclusion is not reasonable 484
or ecologically sound. 485
486
Bay-breasted warblers nest in spruce-fir forests primarily, but occasionally in pine and other 487
conifers (Cadman 2007 page 496, Peck and James 1987) and the plan predicts that their habitat 488
13
An Act to Establish the Algonquin National Park of Ontario. And Report of the Royal [Ontario} Commission on
Forest Reservation and National Parks (Toronto: Queen’s Printer, 1893, 6. 14
Holloway, G.L., B. J. Naylor, and W. R. Watt, Editors. 2004. Habitat relationships of wildlife in Ontario. Revised
habitat suitability models for the Great Lakes-St. Lawrence and Boreal East forests. Ontario Ministry of Natural
Resources, Science and Information Branch, Southern Science and Information and Northeast Science and
Information Joint Technical Report #1. 110p. 15
Holmes, S., L. Vernier and B. Naylor. 2007. A test of Ontario’s Habitat Suitability Matrix as a forest
management planning tool for forest birds, Vol. 83, No. 6, page 570-579.

will increase following a major harvest of conifer, although it will decrease in the absence of 489
timber harvest. That conclusion is not credible or ecologically sound. Nothing in the forest 490
management plan will increase the number of suitable nesting trees or quantity of habitat for 491
these warblers. In the absence of forest management, based on the ecological requirements of 492
these warblers, a more credible estimate of habitat would be that it would increase. 493
494
Boreal Chickadees also need mature conifer trees to survive winter and the plan predicts that 495
they would decline in the absence of forest management, but increase following a major harvest 496
of conifer trees. Like the conclusions about migratory birds, these too are suspect. Hadley and 497
Desrochers (2008) studied Boreal Chickadees in Quebec and concluded that mature conifer trees 498
are important for winter survival and the loss of these trees diminishes the habitat for these birds. 499
500
Hermit Thrushes use a broader array of forested habitats than any of the other brown thrushes. 501
(Cadman page 438, Jones and Donovan 1996). The plan predicts that in the absence of logging 502
the habitat for this species would decline. There is no ecological evidence for this prediction. 503
Cadman (page 438) reports this species occupying a wide variety of forest habitats including: 504
coniferous, mixed and deciduous woods, tamarack spruce, peat lands, barrens, savannahs and 505
forests regenerating after fire or logging. 506
507
The projection that the 300,000 hectares of Blackburnian Warbler habitat would remain 508
unchanged, whether a forest management plan is carried out or not, seems bizarre indeed as the 509
FMP suggest will happen in Algonquin Park if the Plan is implemented. Nests of this species are 510
almost always located in mature conifers such as White Spruce, Eastern Hemlock and White 511
Pine (Cadman 2007 page 488). An overall reduction in the area occupied by these trees is 512
planned, and thus it is clearly inappropriate to accept the idea that whether forest management is 513
carried out or not the habitat for this species will be unchanged. 514
515
The current forest management plan for Algonquin Park seems to put the harvest of wood as the 516
most important objective with very little concern for the migratory birds that nest in the Park 517
area. This undoubtedly contributes to the general loss of migratory bird populations as they 518
continue to decline throughout their ranges. 519 520 521