dr helena lim, dr rhod davies and dr steve jackson ir conference 25 june 2008 ‘hark who goes...
TRANSCRIPT

Dr Helena Lim, Dr Rhod Davies and Dr Steve Jackson
IR Conference 25 June 2008
‘Hark Who Goes There?’:Developing a Predictive Model of Student Enrolment
Dr Helena Lim, Dr Rhod Davies and Dr Steve JacksonJune 2008

Dr Helena Lim, Dr Rhod Davies and Dr Steve Jackson
IR Conference 25 June 2008
Session overview
Background Developing a predictive model at SSU Identifying the variables Getting the data Making sense of the data Explaining logistic regressionModelling strategyVariables for consideration in the modelSelecting a modelRunning the model/sInterpreting the modelLessons learnt and next steps

Dr Helena Lim, Dr Rhod Davies and Dr Steve Jackson
IR Conference 25 June 2008
Background
Introduction of variables fees in HE sector in 2006 Access agreements: bursaries UK HEIs beginning to grapple with and understand the implications
of a ‘fees market’ in HE
Summer 2006/7: Bursaries research commissioned by VCO Aim: to find out about student perceptions and understanding of
bursary packages on offer

Dr Helena Lim, Dr Rhod Davies and Dr Steve Jackson
IR Conference 25 June 2008
Predictive models on student price sensitivity
Siefert and Galloway (2006) developed an institutional probability model that they claim predicts an individual student’s financial ‘tipping point’ based on a number of variables
4 years’ of institutional admissions and financial aid data (1998-2001, n=13,308 admitted students)
Used logistic regression to calculate actual amount of award that may positively influence the student’s decision to enrol

Dr Helena Lim, Dr Rhod Davies and Dr Steve Jackson
IR Conference 25 June 2008
UK research on bursaries and student success
Hatt, Hannan and Baxter (2006) compared the performance of 2 groups of students (bursary/non-bursary) in 2 post-92 institutions (n=6,201)
Findings: Bursaries can build a positive relationship between the individual
and the HEI
Bursary holders felt that the money made a difference and demonstrated attitudes to study similar to mature students
Higher continuation rate beyond first year of study for bursary students compared to non-bursary students Bursaries can have positive effects in relation to learner
achievement and continuation

Dr Helena Lim, Dr Rhod Davies and Dr Steve Jackson
IR Conference 25 June 2008
Developing a predictive model at SSU
Predictive modelling: Using past performance data to predict future results
The key to the success of a predictive model is good quality data… If no data are available, then the predictive modelling process can’t be undertaken
Parrott, 2007

Dr Helena Lim, Dr Rhod Davies and Dr Steve Jackson
IR Conference 25 June 2008
Identifying the variables
Progression variable
Qual on Entry
Entry tariff GenderAge on Entry (DOB)
Socio-ec classfcn
(Code/Detail)
EthnicityDistance from Uni
(postcode)
Attended Open Day
Date app received
Date offer ltr sent
Level of offer
Early accept (App
status as of )
Accept/Decline
Summer exam board decision
Household income
Principal earner income
BursaryType
Bursary
Value of Bursary
(net price)
Application
Enrolment
Retention
Progression
Performance
Degree outcome
DLHE outcome
Net price variables
STAGE
Preparedness variables Socio-economic and demographic variables Application variables
Dr Helena Lim, Dr Rhod Davies and Dr Steve Jackson
IR Conference 25 June 2008
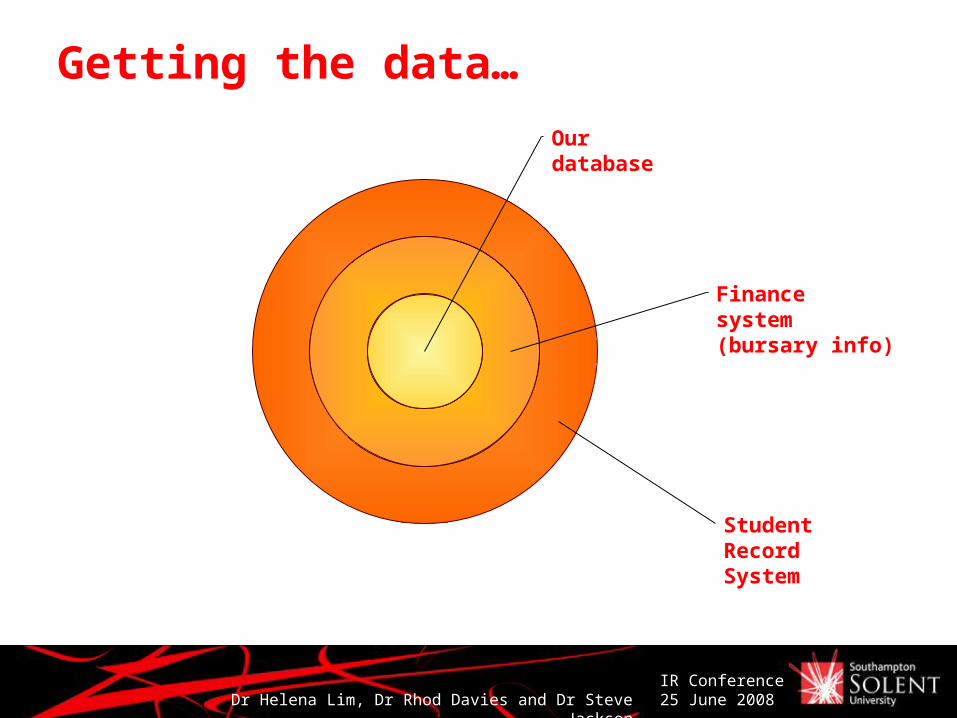
Getting the data…
Student Record System
Finance system (bursary info)
Our database

Dr Helena Lim, Dr Rhod Davies and Dr Steve Jackson
IR Conference 25 June 2008
Student
Record
System
Finance system
Our database
…still getting the data….
Dr Helena Lim, Dr Rhod Davies and Dr Steve Jackson
IR Conference 25 June 2008
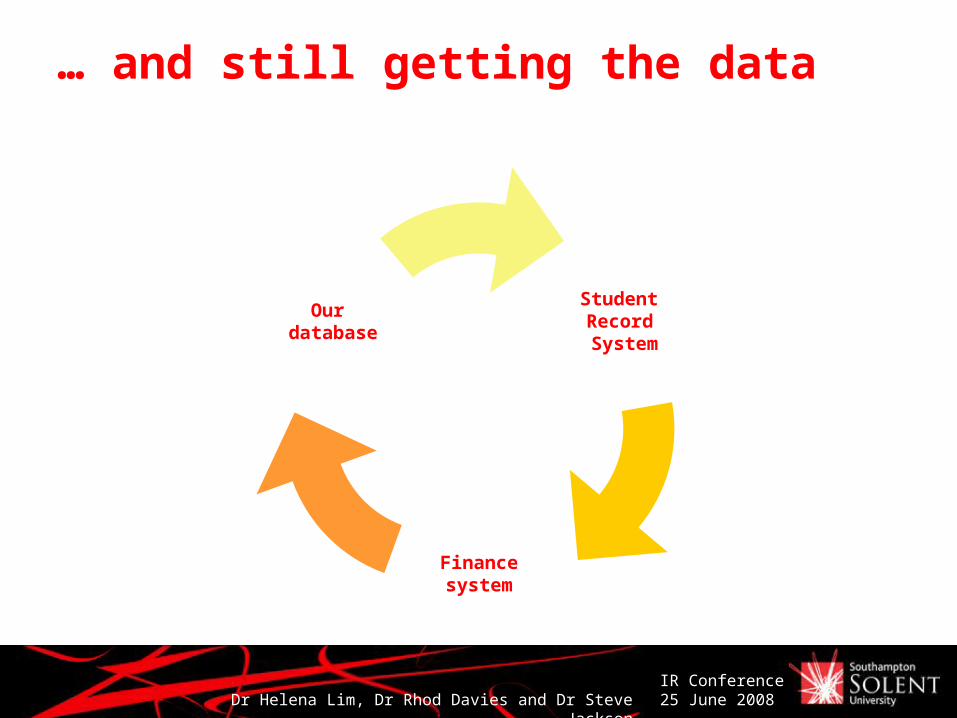
… and still getting the data
Student Record System
Financesystem
Our database

Dr Helena Lim, Dr Rhod Davies and Dr Steve Jackson
IR Conference 25 June 2008
Making sense of the data
Existing data:Collected for a different purposeGaps (eg. ethnicity)Cleaning (eg. age, apparently students of 1 and -37!)Coding/recoding (eg. postcodes)
Programme group
(50)
Faculty (51)
Enrol status (8)
Gender (58)
Age on Entry (18)
Socio-ec classfcn
(63)
Ethnicity (61)
Disability (65)
Postcode (21)
Qual on entry (53)
Previous Instn
Description (56)
Prev Instn locality
(14)
App rc'd from UCAS
(30)
SSU decision turnard time (33)
Applicant decision turnard
time (35)
Offer conditions/
type (73-79)Enrolment
Institutional variables Socio-economic and demographic variables Application variables

Dr Helena Lim, Dr Rhod Davies and Dr Steve Jackson
IR Conference 25 June 2008
Explaining logistic regressionA method for predicting the outcome of a dependent dichotomous variable based on a series of independent variables (maybe nominal, ordinal or scale)
Variables – e.g.age, gender,
location,UCAS offer, etc
BlackBox
Probability ofenrolling
Based on Chan (2004)

Dr Helena Lim, Dr Rhod Davies and Dr Steve Jackson
IR Conference 25 June 2008

Dr Helena Lim, Dr Rhod Davies and Dr Steve Jackson
IR Conference 25 June 2008
Hosmer & Lemeshow (2000)
A] Univariate analysis
B] Variables where p-value < 0.25
Modelling strategy

Dr Helena Lim, Dr Rhod Davies and Dr Steve Jackson
IR Conference 25 June 2008
8 Enrolment status * 51 Solent Faculty Crosstabulation
Count
2045 2221 1549 5815
1086 922 774 2782
3131 3143 2323 8597
Not-enrolled
Enrolled
8 Enrolmentstatus
Total
MAS SBS TEC
51 Solent Faculty
Total
8 Enrolment status * 51 Solent Faculty Crosstabulation
% within 51 Solent Faculty
65.3% 70.7% 66.7% 67.6%
34.7% 29.3% 33.3% 32.4%
100.0% 100.0% 100.0% 100.0%
Not-enrolled
Enrolled
8 Enrolmentstatus
Total
MAS SBS TEC
51 Solent Faculty
Total
Chi-Square Tests
21.850a 2 .000
21.982 2 .000
2.169 1 .141
8597
Pearson Chi-Square
Likelihood Ratio
Linear-by-LinearAssociation
N of Valid Cases
Value dfAsymp. Sig.
(2-sided)
0 cells (.0%) have expected count less than 5. Theminimum expected count is 751.73.
a.

Dr Helena Lim, Dr Rhod Davies and Dr Steve Jackson
IR Conference 25 June 2008
Variables in the Equation
-.018 .001 1080.740 1 .000 .982
.444 .041 119.037 1 .000 1.559
Applicant.Decision.Turnaround.Time
Constant
Step1
a
B S.E. Wald df Sig. Exp(B)
Variable(s) entered on step 1: Applicant.Decision.Turnaround.Time.a.
Classification Tablea
5478 649 89.4
1515 1379 47.7
76.0
ObservedNot-enrolled
Enrolled
8 Enrolment status
Overall Percentage
Step 1Not-enrolled Enrolled
8 Enrolment status PercentageCorrect
Predicted
The cut value is .500a.

Dr Helena Lim, Dr Rhod Davies and Dr Steve Jackson
IR Conference 25 June 2008
Socio-demographic
Age on entry
Gender
Postcode
Previous institution type
Previous institution locality
Institutional structure
Programme group
Faculty
Application process
Timing of application
SSU decision turnaround time
Applicant decision turnaround time
Inducements
UCAS tariff offer level
ALL (except gender) were significantly related (p<0.001) to enrolment status
Variables for consideration in the model

Dr Helena Lim, Dr Rhod Davies and Dr Steve Jackson
IR Conference 25 June 2008
Selecting a model – Considerations
Importance of variables in the analysis Number of applicants in the analysis (data loss) Representativeness of applicants in the analysis (generalisability of
results)

Dr Helena Lim, Dr Rhod Davies and Dr Steve Jackson
IR Conference 25 June 2008
Selecting a model – Number of applicants in the analysisNumber of applicants available for analysis
Model A – Variables Included- Socio-demographic- Institutional structure- Application process
Model B – Variables included- Socio-demographic- Institutional structure- Application process- Inducements
Total dataset 9016 9016
With information for every variable in the Model
5966 (66.2%)
(due to 29.5% missing information for Previous Institution Locality)
4047 (44.9%)
(due to 48.5% missing information for UCAS Tariff Offer Level)

Dr Helena Lim, Dr Rhod Davies and Dr Steve Jackson
IR Conference 25 June 2008
Selecting a model – Characteristics of variables in the analysisEnrolment status
0%
10%
20%
30%
40%
50%
60%
70%
80%
90%
Enrolled Not-enrolled
Total Model A Model B
Age on entry
0%
10%
20%
30%
40%
50%
60%
70%
80%
90%
100%
Under 21 21 and over
Total Model A Model B

Dr Helena Lim, Dr Rhod Davies and Dr Steve Jackson
IR Conference 25 June 2008
Selecting a model – Characteristics of variables in the analysisPostcode
0%
10%
20%
30%
40%
50%
Sout
ham
pton
Port
smou
th
Bour
nem
outh
Basi
ngst
oke
Oth
erre
gion
al
Oth
er U
K
Non
-UK
Total Model A Model B
Previous instituion locality
0%
10%
20%
30%
40%
50%
Com
pact
sch
eme
Oth
er fee
der
Oth
er r
egio
nal
Oth
er n
atio
nal
Oth
er U
K HEI
Non
-UK
Total Model A Model B

Dr Helena Lim, Dr Rhod Davies and Dr Steve Jackson
IR Conference 25 June 2008
Selecting a model – Characteristics of variables in the analysisPrevious institution type
0%
10%
20%
30%
40%
50%
Com
preh
ensi
vesc
hool
Inde
pend
ent
scho
ol
6th
Form
/ F
Eco
lleg
e
Spec
ialist
colleg
e
Lang
uage
scho
ol
Oth
er H
EI
Total Model A Model B
SSU faculty
0%
10%
20%
30%
40%
50%
Med
ia, Ar
tsan
d So
ciet
y
Busi
ness
Tech
nolo
gy
Total Model A Model B

Dr Helena Lim, Dr Rhod Davies and Dr Steve Jackson
IR Conference 25 June 2008
Selecting a model – Characteristics of variables in the analysisTiming of application
0%
10%
20%
30%
40%
50%
60%
70%
80%
On
tim
e
Late
Cle
arin
g
Def
erre
d
Total Model A Model B
UCAS tariff offer level
0%
10%
20%
30%
40%
50%
< 160ponits
160points
180points
200+points
Total Model A Model B

Dr Helena Lim, Dr Rhod Davies and Dr Steve Jackson
IR Conference 25 June 2008
Selecting a model – Characteristics of variables in the analysisSSU decision turnaround time (in days)
Total dataset
Model A dataset
Model B dataset
Mean (Standard deviation) 21.8 (23.7) 23.0 (22.8) 20.8 (19.8)
Minimum 0 0 0
Maximum 243 243 211
Applicant decision turnaround time (in days)
Total dataset
Model A dataset
Model B dataset
Mean (Standard deviation) 71.8 (47.8) 83.6 (44.2) 93.6 (41.9)
Minimum 0 0 0
Maximum 249 249 249

Dr Helena Lim, Dr Rhod Davies and Dr Steve Jackson
IR Conference 25 June 2008
Selecting a model – Conclusion
Importance of variables in the analysis Wanted to look at the effect of inducements (i.e. UCAS tariff offer level
on likelihood of enrolment) Run Model B
Number of applicants in the analysis (data loss) Far fewer applicants lost in the analysis when UCAS tariff offer level
not used Run Model A
Representativeness of applicants in the analysis (generalisability of results)
Greater similarity in variable characteristics between data used in Model A and the total dataset
Run Model A
Overall Conclusion Run BOTH Model A and Model B

Dr Helena Lim, Dr Rhod Davies and Dr Steve Jackson
IR Conference 25 June 2008
Running the models – Steps
Identify variables
in the model
Run Logistic Regression
using SPSS v15.0
Identify & remove variables that are collinear
Identify & remove applicants who have
unusual values
Identify & remove applicants who
unduly influence the regression model
Run Logistic Regression using SPSS v15.0
again (with reduced dataset)
Make baseline categories
equivalent to institutional average

Dr Helena Lim, Dr Rhod Davies and Dr Steve Jackson
IR Conference 25 June 2008
Running the models – Number of applicants in the analysisNumber of applicants
Model A – Variables Included- Socio-demographic- Institutional structure- Application process
Model B – Variables included- Socio-demographic- Institutional structure- Application process- Inducements
Total dataset 9016 9016
With information for every variable in the Model
5966 (66.2%) 4047 (44.9%)
Outliers in the Model
277 (3.1%) 304 (3.4%)
With non-outlying information for every variable in the Model
5689 (63.1%) 3743 (41.5%)

Dr Helena Lim, Dr Rhod Davies and Dr Steve Jackson
IR Conference 25 June 2008
Interpreting the models – Variables important in predicting enrolment
Variables considered in each Model
Important predictors of enrolment in Model A
Important predictors of enrolment in Model B
Age on entry Yes Marginal (p=.06)
Postcode Yes Yes
Previous institution type No No
Previous institution locality No No
Programme group Yes Yes
Timing of application Yes Yes
SSU decision turnaround time No No
Applicant decision turnaround time
Yes Yes
UCAS tariff offer level Yes

Dr Helena Lim, Dr Rhod Davies and Dr Steve Jackson
IR Conference 25 June 2008
Interpreting the models – Age on entryModel AModel B
The odds of enrolling increases significantly with age

Dr Helena Lim, Dr Rhod Davies and Dr Steve Jackson
IR Conference 25 June 2008
Interpreting the models – PostcodeModel AModel B
Compared to Southampton, the odds of enrolling are significantly lower for applicants in all other postcode areas (apart from Basingstoke)
Compared to Southampton, the odds of enrolling are significantly lower for applicants in Portsmouth and the rest of the UK

Dr Helena Lim, Dr Rhod Davies and Dr Steve Jackson
IR Conference 25 June 2008
Interpreting the models – SSU Programme Group
Model AModel B
Compared to the institutional average, the odds of enrolling is significantly higher in the HSW programme group and significantly lower in the ACT and BMT programme groups
Compared to the institutional average, the odds of enrolling is significantly higher in the BF, FAV, MEW and FTP programme groups and significantly lower in the LEI, ECO, ACT, BMT and BGE programme groups

Dr Helena Lim, Dr Rhod Davies and Dr Steve Jackson
IR Conference 25 June 2008
Interpreting the models – Timing of application
Model AModel B
Compared to On time applications, the odds of enrolling are significantly higher for Clearing and Deferred applications
Compared to On time applications, the odds of enrolling are significantly higher for Deferred applications

Dr Helena Lim, Dr Rhod Davies and Dr Steve Jackson
IR Conference 25 June 2008
Interpreting the models – Applicant decision turnaround time
Model AModel B
For BOTH models the odds of enrolling decreases significantly as it takes applicants longer to make a decision

Dr Helena Lim, Dr Rhod Davies and Dr Steve Jackson
IR Conference 25 June 2008
Interpreting the models – UCAS tariff offer level
Model AModel B
Compared to applicants offered 40pts, the odds of enrolling are significantly lower for applicants offered 100pts

Dr Helena Lim, Dr Rhod Davies and Dr Steve Jackson
IR Conference 25 June 2008
Interpreting the models – How accurately is enrolment status predicted?Model A Model B
98.2% of non-enrolled applicants were accurately identified
10.3% of enrolled applicants were accurately identified
Predicted enrolment status
Not-enrolle
d
Enrolled
% Correct
Actual enrolment status
Not-enrolle
d
4037 184 95.6
Enrolled
1171 297 20.2
Overall 76.2
Predicted enrolment status
Not-enrolle
d
Enrolled
% Correct
Actual enrolment status
Not-enrolle
d
2921 53 98.2
Enrolled
690 79 10.3
Overall 80.1
95.6% of non-enrolled applicants were accurately identified
20.2% of enrolled applicants were accurately identified

Dr Helena Lim, Dr Rhod Davies and Dr Steve Jackson
IR Conference 25 June 2008
Lessons learnt and (feasible) next steps… …where thither?Initial conclusions
Approach appropriate but limited because of ‘quality’ of dataModel explains enrolment patterns (to an extent)
Run in second year of dataTo test against current modelSeparate years: Compare yearsTogether: larger sample
Progression modellingMore data available (eg.ethnicity, socio-economic status, etc)

Dr Helena Lim, Dr Rhod Davies and Dr Steve Jackson
IR Conference 25 June 2008
References
Chan, Y. H. (2004) Biostatistics 202: logistic regression analysis. Singapore Med J 45(4), 149-153.
Hatt, S., Hannan, A. and Baxter, A. (2005) ‘Bursaries and Student Success: a Study of Students from Low-Income Groups at Two Institutions in the South West’ Higher Education Quarterly 59 (2) , 111–126.
Hosmer, D.W. and Lemeshow, S. (2000) Applied logistic regression. 2nd ed. New York: Wiley.
Parrott, S. ‘Tuition Discounting Goes Global’ The Maguire Network, Winter 2007 accessed on 5 June 2008 at
http://www.maguireassoc.com/resource/maguire_network_winter2007/newsletter.html
Siefert, L. and Galloway, F. (2006) ‘A new look at solving the undergraduate yield problem: the importance of estimating individual price sensitivities’ College and University Journal 81 11-17.

Dr Helena Lim, Dr Rhod Davies and Dr Steve Jackson
IR Conference 25 June 2008
Please direct further discussion & questions to:
Dr Helena Lim, Dr Rhod Davies and Dr Steve JacksonSouthampton Solent UniversityEast Park TerraceSouthampton SO14 0YN