dr martin füllenbach, ceo frank gumbinger, cfo 25 … · sector industrial business development...
TRANSCRIPT

SEMPERIT GROUP Q1 2018INVESTOR PRESENTATIONDr Martin Füllenbach, CEOFrank Gumbinger, CFO25 May 2018
1
State of restructuring (p. 3)
Operational highlights (p. 7)
Financial performance (p. 11)
Management agenda (p. 20)
Appendix (p. 23)
Agenda
2 Investor Presentation Q1 2018 I 25 May 2018 I Investor Relations

State of restructuring
Operations initiatives Increase output / Overall
Equipment Effectiveness (OEE) Production footprint Reduce waste and scrap Total cost of quality
Sales initiatives Volume growth
(new markets, new regions) Customer benefits/value,
price differentiation by region Brand leverage
Procurement, SG&A initiatives Sustainable customer/supplier
relationship Optimise compound chemicals Backoffice and IT efficiency
3 Investor Presentation Q1 2018 I 25 May 2018 I Investor Relations
1) Financial target based on current segment structure.
Timeline Transformation process
started in late 2017 Restructuring and
transformation until 2020
Financial target of … ~10% EBITDA margin by
end of 20201)
… requires EBITDA uplift of … ~ € 50-70m in total
by end of 2020
Focus on
Portfolio adjustment and growth initiatives only after successful restructuring.
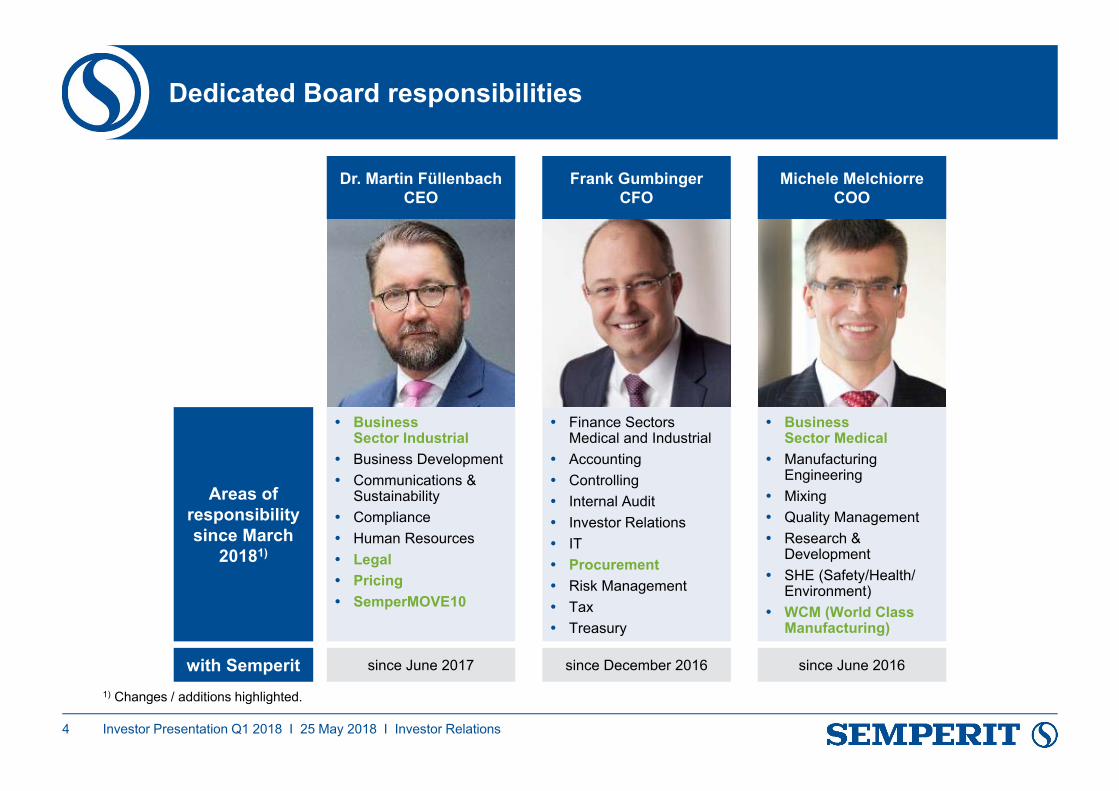
Dedicated Board responsibilities
1) Changes / additions highlighted.
4 Investor Presentation Q1 2018 I 25 May 2018 I Investor Relations
with Semperit since June 2017 since December 2016
Areas of responsibility since March
20181)
Business Sector Industrial
Business Development Communications &
Sustainability Compliance Human Resources Legal Pricing SemperMOVE10
Finance Sectors Medical and Industrial
Accounting Controlling Internal Audit Investor Relations IT Procurement Risk Management Tax Treasury
Dr. Martin FüllenbachCEO
Frank GumbingerCFO
since June 2016
Business Sector Medical
Manufacturing Engineering
Mixing Quality Management Research &
Development SHE (Safety/Health/
Environment) WCM (World Class
Manufacturing)
Michele MelchiorreCOO

Restructuring update by segment
5 Investor Presentation Q1 2018 I 25 May 2018 I Investor Relations
Major profit generators and technology leaders in its sector Strong contributors to profit, cash and innovation
Result of the restructuring analysis: Sempertrans has the potential to become a successful industry player on a sustainable basis
Remains the key focus area of restructuring No further growth CAPEX, only maintenance CAPEX in FY 2018 Fierce competition for market share puts enormous pressure on margins Analytical focus on business model & capability evaluation and operational
execution
Semperflex
Semperform
Sempertrans
Sempermed
Industrial Sector
Medical Sector
Focus of restructuring and transformation process: Achieve target profitability throughout all segments by end of 2020. This will be a key feature for future portfolio discussions.

State of restructuring (p. 3)
Operational highlights (p. 7)
Financial performance (p. 11)
Management agenda (p. 20)
Appendix (p. 23)
Agenda
6 Investor Presentation Q1 2018 I 25 May 2018 I Investor Relations
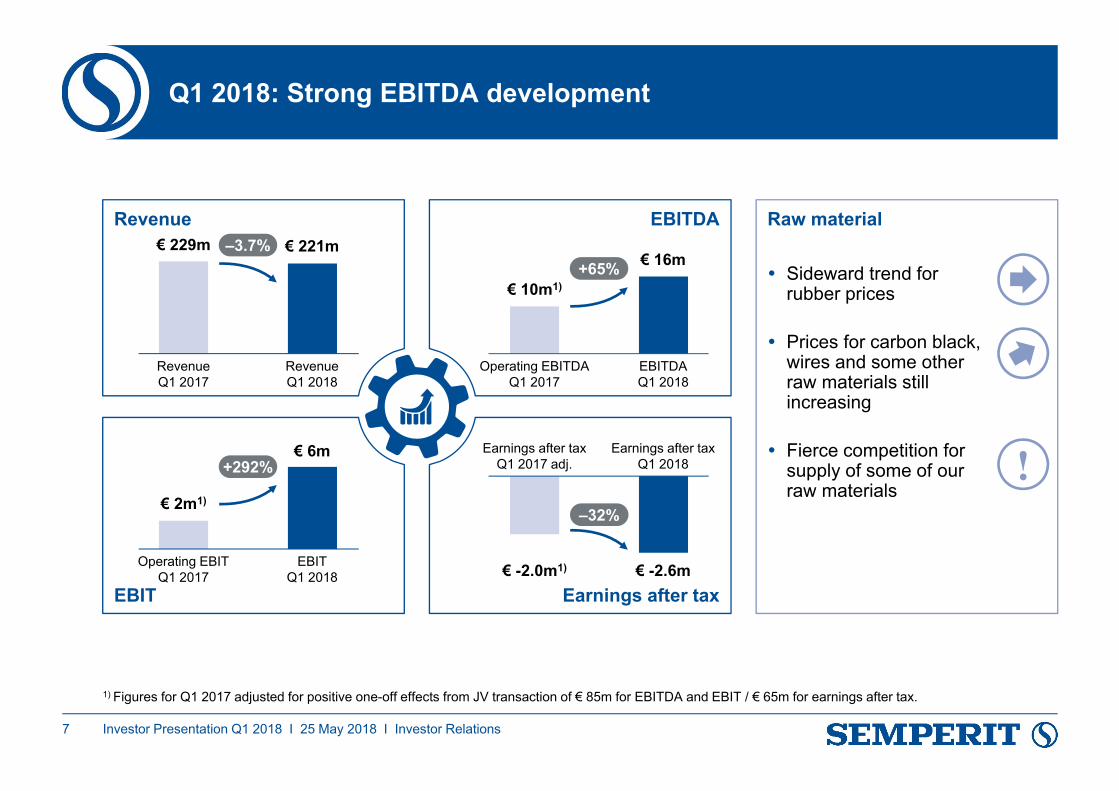
Q1 2018: Strong EBITDA development
7 Investor Presentation Q1 2018 I 25 May 2018 I Investor Relations
Revenue EBITDA
EBIT
Raw material
Sideward trend for rubber prices
Prices for carbon black, wires and some other raw materials still increasing
Fierce competition for supply of some of our raw materials
1) Figures for Q1 2017 adjusted for positive one-off effects from JV transaction of € 85m for EBITDA and EBIT / € 65m for earnings after tax.
RevenueQ1 2017
RevenueQ1 2018
–3.7% € 221m€ 229m
Operating EBITDAQ1 2017
EBITDAQ1 2018
€ 16m
€ 10m1)+65%
Operating EBITQ1 2017
EBITQ1 2018
+292%€ 6m
€ 2m1)
Earnings after taxQ1 2017 adj.
Earnings after taxQ1 2018
€ -2.6m€ -2.0m1)
!
Earnings after tax
–32%
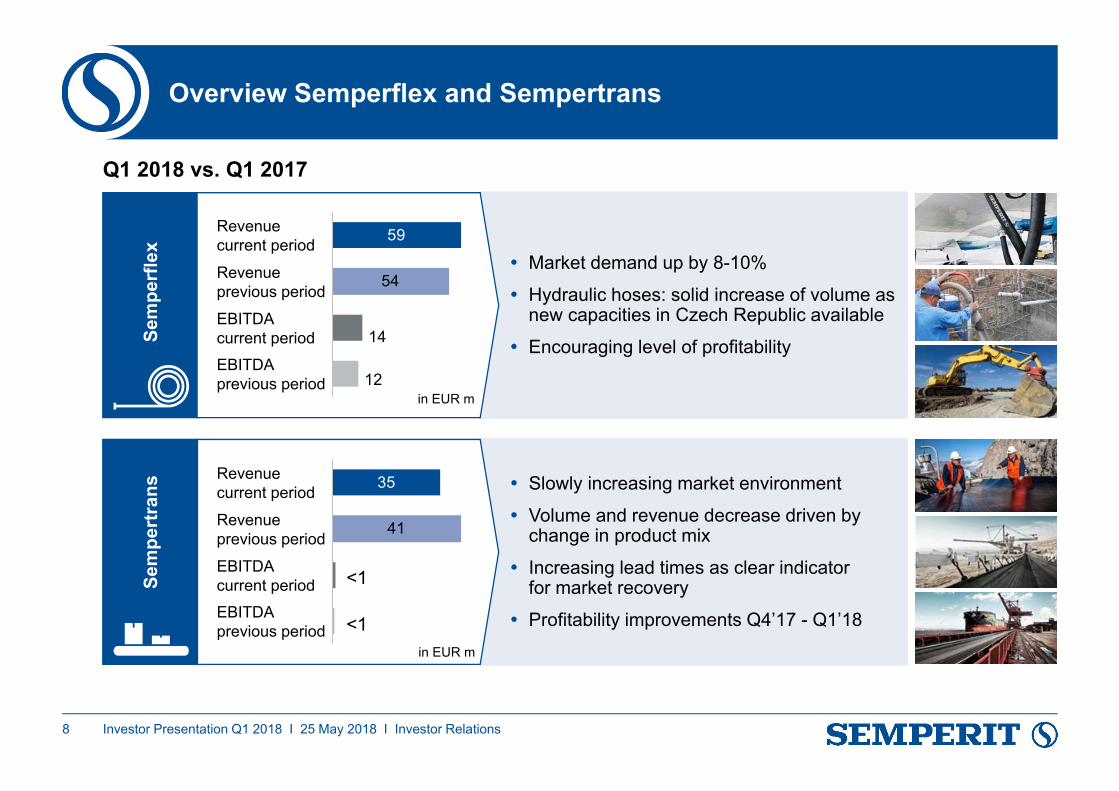
Slowly increasing market environment
Volume and revenue decrease driven by change in product mix
Increasing lead times as clear indicator for market recovery
Profitability improvements Q4’17 - Q1’18
Market demand up by 8-10%
Hydraulic hoses: solid increase of volume as new capacities in Czech Republic available
Encouraging level of profitability
Overview Semperflex and Sempertrans
Q1 2018 vs. Q1 2017
Investor Presentation Q1 2018 I 25 May 2018 I Investor Relations
Sem
perf
lex
Sem
pert
rans
54
12
14
59
Revenue previous period
Revenue current period
EBITDA previous period
EBITDAcurrent period
41
35
Revenue previous periodEBITDAcurrent period
Revenue current period
EBITDA previous period
in EUR m
in EUR m
8
<1
<1

Overview Semperform and Sempermed
Q1 2018 vs. Q1 2017
1) Q1 2017 adjusted for positive one-off effects from JV transaction of € 85m for EBITDA.
9
Fierce competition with regards to sales prices and supply of some of our raw materials
Decrease of volume and revenue as a result of changed product and customer mix
Increase of own production share due to full ramp up of new plant in Malaysia
Operational efficiency still not sufficient
Encouraging overall volume development, mainly due to strong European demand
Window and door profiles: continuous expansion into aluminium windows
Business performance Q1’18 improved compared to Q4’17
Sem
perf
orm
Sem
perm
ed
45
47
EBITDA previous period
Revenue previous period
Revenue current period
EBITDAcurrent period
89
80
EBITDA adj.previous period
Revenue previous periodEBITDAcurrent period
0
Revenue current period
in EUR m
in EUR m
1)
Investor Presentation Q1 2018 I 25 May 2018 I Investor Relations
5
5
>1

State of restructuring (p. 3)
Operational highlights (p. 7)
Financial performance (p. 11)
Management agenda (p. 20)
Appendix (p. 23)
Agenda
10 Investor Presentation Q1 2018 I 25 May 2018 I Investor Relations

Q1 2018 Financials / Profitability Overview
1) Q1 2017 adjusted for positive one-off effects from JV transaction of € 85m for EBITDA and EBIT / € 65m for earnings after tax. 2) Attributable to the shareholders of Semperit AG Holding.
11 Investor Presentation Q1 2018 I 25 May 2018 I Investor Relations
in EUR m Q1 2018 Q1 2017 Change Change in EUR m
Revenue 220.9 229.3 -3.7% -8.4
EBITDA adjusted1) 15.8 9.6 +64.5% 6.2
EBITDA margin adjusted 7.1% 4.2% +2.9 PP –EBITDA 15.8 94.4 -83.3% -78.7EBITDA margin 7.1% 41.2% -34.1 PP –
EBIT adjusted1) 6.0 1.5 > 100% 4.5EBIT margin adjusted 2.7% 0.7% +2.0 PP –EBIT 6.0 86.4 -93.1% -80.4EBIT margin 2.7% 37.7% -35.0 PP –
Earnings after tax adjusted1) -2.6 -2.0 – -0.6Earnings after tax -2.6 62.8 – -65.5
Earnings per share (EPS) adj. 2) , in EUR -0.14 -0.10 – –
Earnings per share (EPS)2), in EUR -0.14 3.06 – –

Revenue development Q1 2018 vs Q1 2017
220.9+2.1+5.3229.3
-3.7%
Sempertrans Q1 2018
-9.2
Semperform Sempermed
-6.7
SemperflexQ1 2017
in EUR m
-10.3%
Industrial Sector Medical Sector
+9.9% -16.2% +4.7%
+0.5%1)
12 Investor Presentation Q1 2018 I 25 May 2018 I Investor Relations
58.8m 34.6m 47.5m 80.0mRevenueQ1 2018 ►
Semperflex: mainly higher volume translates into higher revenue
Sempertrans: Volume and revenue decrease driven by product mix
Semperform: encouraging overall volume development
Sempermed: Decrease of volume and revenue as a result of changed product and customer mix
Revenue development
1) Change of each segment / sector for Q1 2018 vs Q1 2017.

EBITDA Q1 2018 vs Q1 20171)
+2.1+1.5
+3.2
15.8
9.6
Sempertrans Q1 2018Sempermed
-0.4
SemperflexQ1 20171)
+65%
-0.1
CorporateSemperform
in EUR m
13 Investor Presentation Q1 2018 I 25 May 2018 I Investor Relations
1) Q1 2017 adjusted for positive one-off effects from JV transaction of € 85m.
9.6mOperating EBITDA
Q1 20171)
EBITDAQ1 2018
-7.6m
-4.4m 15.8m
11.7m
13.7m
0.6m
0.5m
5.0m
4.5m
0.0m
1.4m
EBITDA marginQ1 2018 – 7.1%23.4% 1.4% 9.6% 1.8%
Increased volume, increased profitability

Operating EBITDA and EBITDA margin by quarter1)
14 Investor Presentation Q1 2018 I 25 May 2018 I Investor Relations
15.8
2.9
10.412.9
9.6
Q4 2017Q3 2017 Q1 2018Q1 2017 Q2 2017
7.1%
1.4%5.0%4.2% 5.6%
EBITDA marginEBITDA, in EURm
1) Q1 2017 adj. for positive one-off effects from JV transaction of € 85m. Q2, Q3 and Q4 2017 adj. for impairment at Sempermed (€ 26m), restructuring expenses/ closure in France (€ 11m), valuation adjustment in IT (€ 4m), expenses resulting from tax audit in Austria (€ 5m, mainly for refund of energy supply charge).
EBITDA in Q1 2018 significantly higher than in Q4 2017
EBITDA margin of 7.1% well below target of ~10% by end of 2020
All segments positive on EBITDA level Semperflex with good profitability level,
Semperform with continuous positive EBITDA contribution
EBITDA development

CAPEX Overview
Semperform
Q1 2018
7.9
11.8
1.6
Q3 2017
1.5
14.1
Q2 2017
0.3
Q4 2017
24.5
7.1
7.4
2.7
6.4
1.5
0.10.2
8.5
19.9
0.05.1
18.8
1.5
Sempertrans5.2
1.4
4.6Semperflex
2.5
21.7
6.9
8.54.6
1.5
Q1 2017
OtherSempermed
0.2
CAPEX per Segmentin EUR m
15 Investor Presentation Q1 2018 I 25 May 2018 I Investor Relations

Working Capital Overview
Components of Working Capitalin EUR m
161.6
31 Dec 2017
168.9
30 Sept 2017
141.5
30 June 2017
-98.0
175.8
-114.0
132.3
31 March 2017
103.6
152.4
137.9
-110.9
159.7145.0
Trade payables
Inventories
Trade receivables
-106.5
31 March 2018
180.9
125.8
147.1
-96.2
168.7
117.8
17.1%1) 20.9%1)
16 Investor Presentation Q1 2018 I 25 May 2018 I Investor Relations
1) Trade Working Capital in % of LTM revenues
19.3%1)20.1%1)19.6%1)
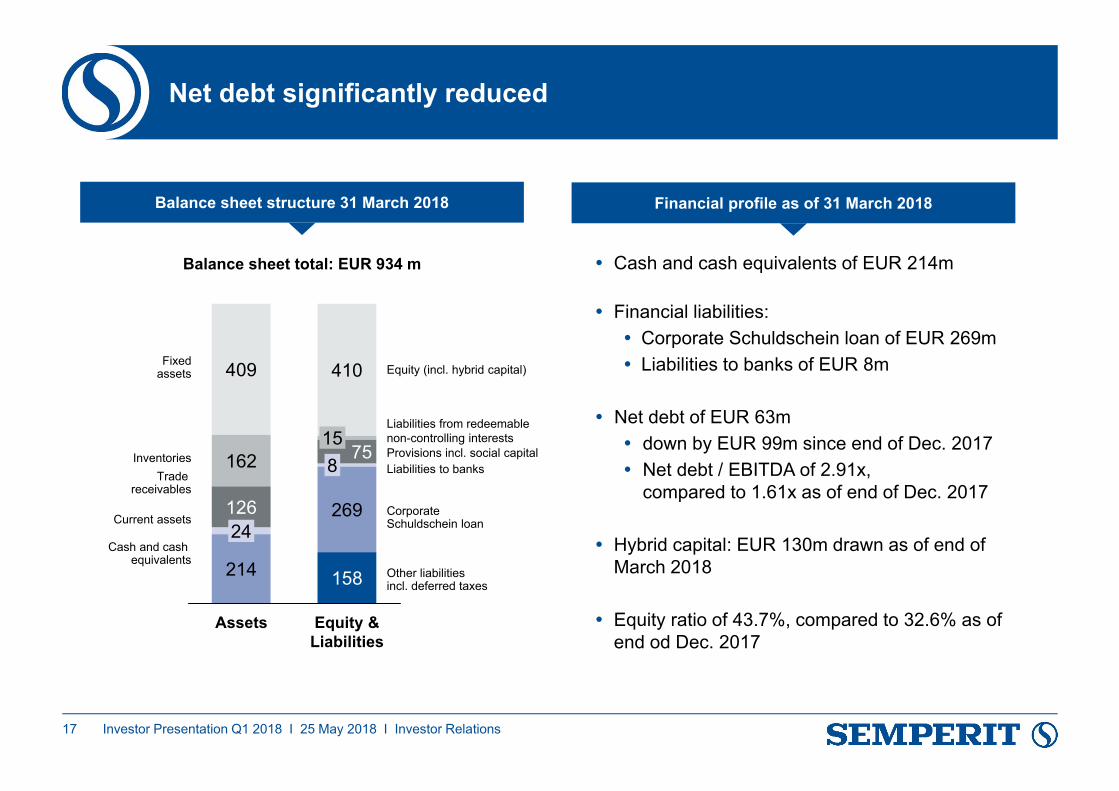
Net debt significantly reduced
Balance sheet structure 31 March 2018
Balance sheet total: EUR 934 m
Equity (incl. hybrid capital)Fixed
assets
InventoriesTrade
receivables
Cash and cash equivalents
Liabilities from redeemable non-controlling interestsProvisions incl. social capital
Other liabilities incl. deferred taxes
Current assetsCorporate Schuldschein loan
Liabilities to banks
Cash and cash equivalents of EUR 214m
Financial liabilities: Corporate Schuldschein loan of EUR 269m Liabilities to banks of EUR 8m
Net debt of EUR 63m down by EUR 99m since end of Dec. 2017 Net debt / EBITDA of 2.91x,
compared to 1.61x as of end of Dec. 2017
Hybrid capital: EUR 130m drawn as of end of March 2018
Equity ratio of 43.7%, compared to 32.6% as of end od Dec. 2017
Financial profile as of 31 March 2018
17
162
409
126
75
410
214
15
24
Assets Equity & Liabilities
8
158
269
Investor Presentation Q1 2018 I 25 May 2018 I Investor Relations

State of restructuring (p. 3)
Operational highlights (p. 7)
Financial performance (p. 11)
Management agenda (p. 20)
Appendix (p. 23)
Agenda
18 Investor Presentation Q1 2018 I 25 May 2018 I Investor Relations
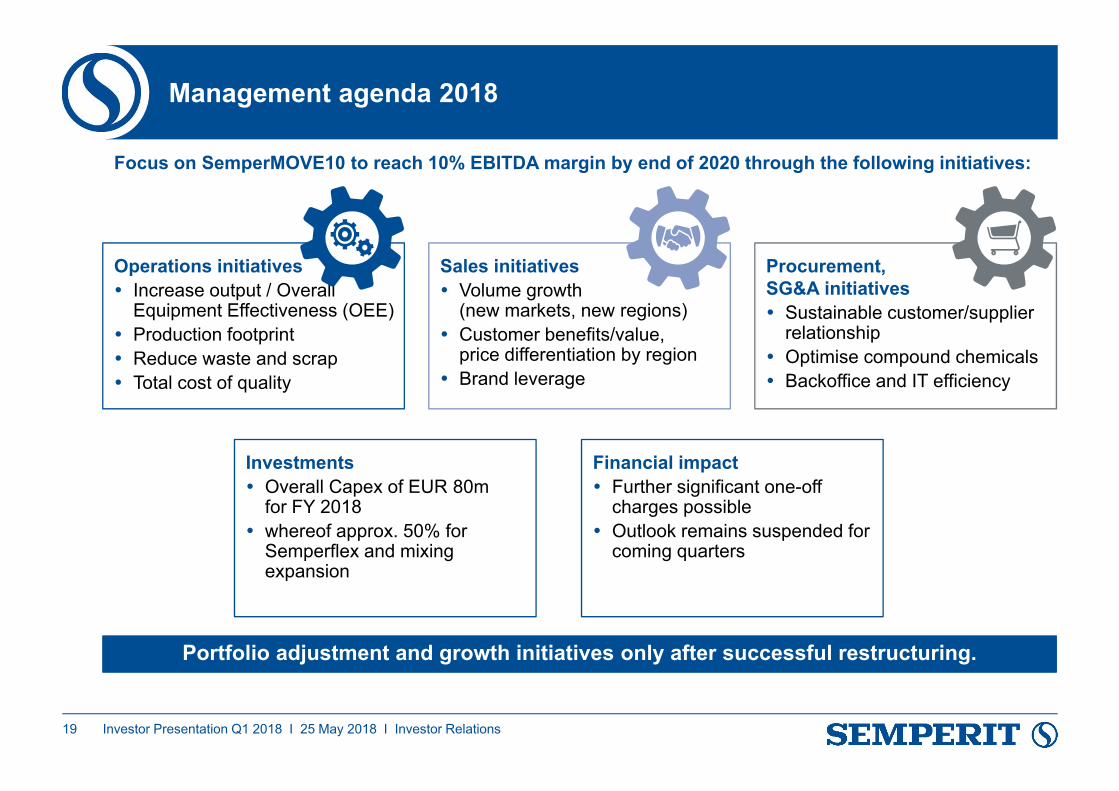
Management agenda 2018
Operations initiatives Increase output / Overall
Equipment Effectiveness (OEE) Production footprint Reduce waste and scrap Total cost of quality
Sales initiatives Volume growth
(new markets, new regions) Customer benefits/value,
price differentiation by region Brand leverage
Procurement, SG&A initiatives Sustainable customer/supplier
relationship Optimise compound chemicals Backoffice and IT efficiency
19 Investor Presentation Q1 2018 I 25 May 2018 I Investor Relations
Financial impact Further significant one-off
charges possible Outlook remains suspended for
coming quarters
Focus on SemperMOVE10 to reach 10% EBITDA margin by end of 2020 through the following initiatives:
Portfolio adjustment and growth initiatives only after successful restructuring.
Investments Overall Capex of EUR 80m
for FY 2018 whereof approx. 50% for
Semperflex and mixing expansion
Contact and financial calendar
Investor Relations Semperit GroupStefan Marin, Head of Investor Relations+43 1 79777 - 210www.semperitgroup.com/en/irModecenterstrasse 22 1031 Vienna, Austria
DisclaimerThe information provided in this presentation does not constitute an offer for the sale of securities nor an invitation to submitan offer to purchase shares of Semperit AG Holding, but exclusively serves information purposes. Rounding of differences inthe totalling of rounded amounts and percentages may arise from the automatic processing of data.The forecasts, plans and forward-looking statements contained in this presentation are based on the knowledge andinformation available and the assessments made at the time that this report was prepared. As is true of all forward-lookingstatements, these statements are subject to risk and uncertainties. As a result, the actual events may deviate significantlyfrom these expectations. No liability whatsoever is assumed for the accuracy of projections or for the achievement of plannedtargets or for any other forward-looking statements.
20 Investor Presentation Q1 2018 I 25 May 2018 I Investor Relations
Financial Calendar 201825.05.2018 Report on the first quarter of 201823.08.2018 Half-year financial report 2018 21.11.2018 Report on the first three quarters 2018

State of restructuring (p. 3)
Operational highlights (p. 7)
Financial performance (p. 11)
Management agenda (p. 20)
Appendix (p. 23)
Agenda
21 Investor Presentation Q1 2018 I 25 May 2018 I Investor Relations
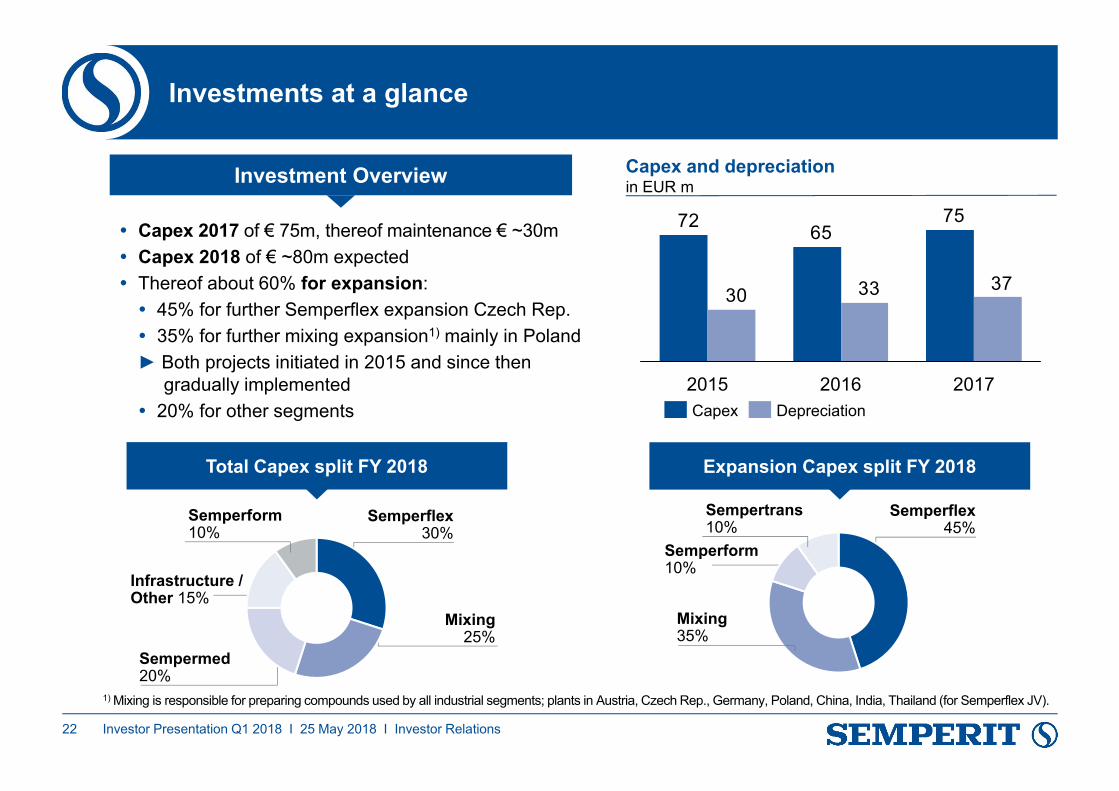
Investments at a glance
22
Investment Overview
Capex 2017 of € 75m, thereof maintenance € ~30m Capex 2018 of € ~80m expected Thereof about 60% for expansion: 45% for further Semperflex expansion Czech Rep. 35% for further mixing expansion1) mainly in Poland► Both projects initiated in 2015 and since then
gradually implemented 20% for other segments
Investor Presentation Q1 2018 I 25 May 2018 I Investor Relations
Capex and depreciationin EUR m
756572
373330
201720162015Capex Depreciation
Semperflex45%
Expansion Capex split FY 2018Total Capex split FY 2018
Sempertrans10%
Infrastructure / Other 15%
Sempermed20%
Mixing25%
Semperflex30%
Semperform10%
Semperform10%
Mixing35%
1) Mixing is responsible for preparing compounds used by all industrial segments; plants in Austria, Czech Rep., Germany, Poland, China, India, Thailand (for Semperflex JV).

Overview price indices rubber
75.0
100.0
125.0
150.0
175.0
200.0
225.0
250.0
275.0
300.0Price indices Synthetic rubber
SBR Europe SBR Asia
ø 2016
ø 2017
Investor Presentation Q1 2018 I 25 May 2018 I Investor Relations
Price movements for raw materials1) became highly unpredictable
1) Selected raw materials are shown for illustration purposes only. Indices based on 01/01/2016 = 100
75
100
125
150
175
200
225
250
275
300Price index Natural Latex rubber
Natur-Latex 60% Malaysia
ø 2017
ø 2016
23
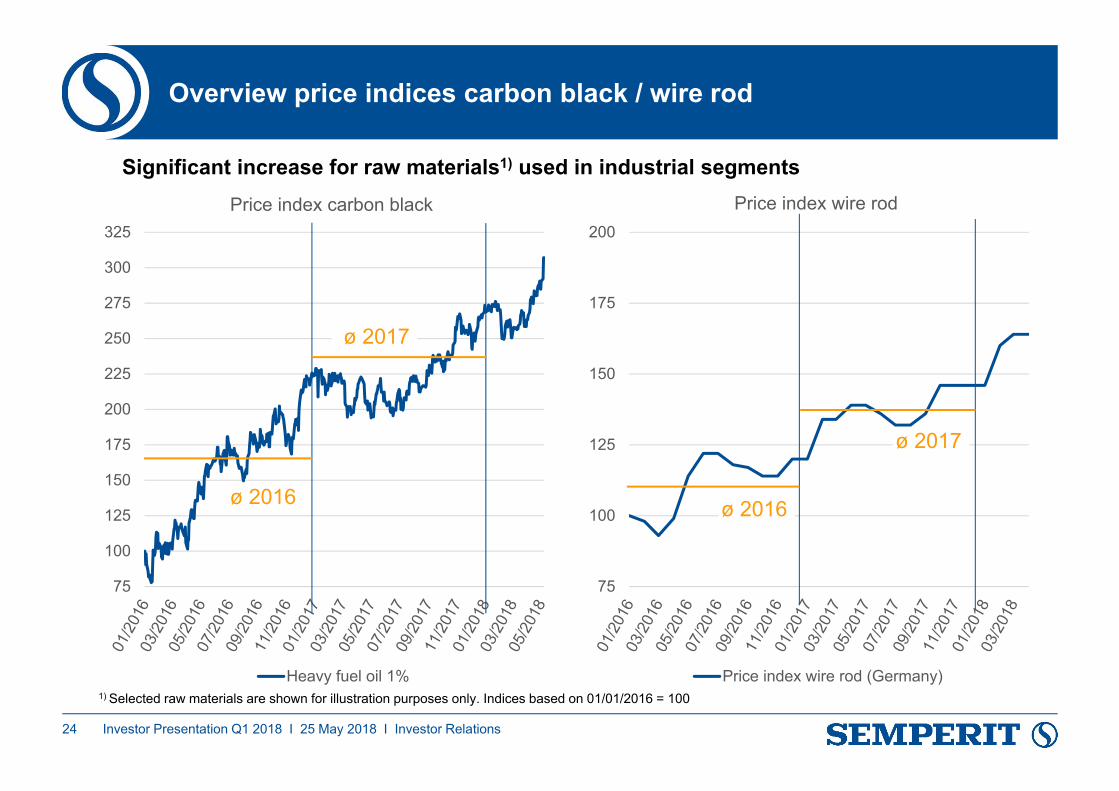
Overview price indices carbon black / wire rod
75
100
125
150
175
200
225
250
275
300
325Price index carbon black
Heavy fuel oil 1%
ø 2016
ø 2017
Investor Presentation Q1 2018 I 25 May 2018 I Investor Relations
Significant increase for raw materials1) used in industrial segments
1) Selected raw materials are shown for illustration purposes only. Indices based on 01/01/2016 = 100
75
100
125
150
175
200
Price index wire rod
Price index wire rod (Germany)
ø 2016
ø 2017
24
Hybrid Capital Line with B & C
Overview– Contract between Semperit AG Holding and B & C Holding GmbH (100% subsidiary
of B & C Industrieholding GmbH) signed on 12th Dec. 2017Total volume of up to EUR 150m
– Can be drawn in up to three tranches until end of 2018– Interest rate agreed amounts to 5.25%,
commitment fee (for unused part of the line) is set at 1.75%– EUR 130mn drawn as of end of March 2018
Benefits for Semperit– Financial support for transformation process– Strengthening of balance sheet
The core shareholder supports the transformation process and emphasises its long-term commitment to Semperit.
Investor Presentation Q1 2018 I 25 May 2018 I Investor Relations25
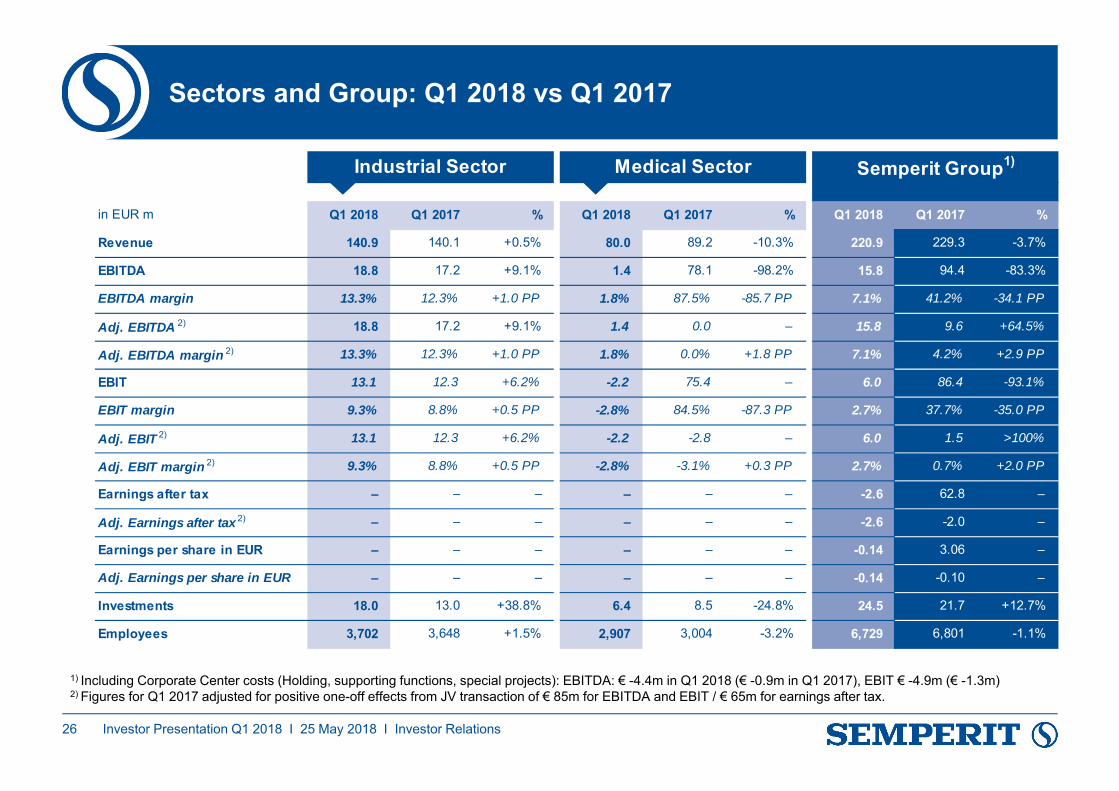
in EUR m Q1 2018 Q1 2017 % Q1 2018 Q1 2017 % Q1 2018 Q1 2017 %
Revenue 140.9 140.1 +0.5% 80.0 89.2 -10.3% 220.9 229.3 -3.7%
EBITDA 18.8 17.2 +9.1% 1.4 78.1 -98.2% 15.8 94.4 -83.3%
EBITDA margin 13.3% 12.3% +1.0 PP 1.8% 87.5% -85.7 PP 7.1% 41.2% -34.1 PP
Adj. EBITDA 2) 18.8 17.2 +9.1% 1.4 0.0 – 15.8 9.6 +64.5%
Adj. EBITDA margin 2) 13.3% 12.3% +1.0 PP 1.8% 0.0% +1.8 PP 7.1% 4.2% +2.9 PP
EBIT 13.1 12.3 +6.2% -2.2 75.4 – 6.0 86.4 -93.1%
EBIT margin 9.3% 8.8% +0.5 PP -2.8% 84.5% -87.3 PP 2.7% 37.7% -35.0 PP
Adj. EBIT 2) 13.1 12.3 +6.2% -2.2 -2.8 – 6.0 1.5 >100%
Adj. EBIT margin 2) 9.3% 8.8% +0.5 PP -2.8% -3.1% +0.3 PP 2.7% 0.7% +2.0 PP
Earnings after tax – – – – – – -2.6 62.8 –
Adj. Earnings after tax 2) – – – – – – -2.6 -2.0 –
Earnings per share in EUR – – – – – – -0.14 3.06 –
Adj. Earnings per share in EUR – – – – – – -0.14 -0.10 –
Investments 18.0 13.0 +38.8% 6.4 8.5 -24.8% 24.5 21.7 +12.7%
Employees 3,702 3,648 +1.5% 2,907 3,004 -3.2% 6,729 6,801 -1.1%
Industrial Sector Medical Sector Semperit Group1)
Sectors and Group: Q1 2018 vs Q1 2017
26 Investor Presentation Q1 2018 I 25 May 2018 I Investor Relations
1) Including Corporate Center costs (Holding, supporting functions, special projects): EBITDA: € -4.4m in Q1 2018 (€ -0.9m in Q1 2017), EBIT € -4.9m (€ -1.3m)2) Figures for Q1 2017 adjusted for positive one-off effects from JV transaction of € 85m for EBITDA and EBIT / € 65m for earnings after tax.

Semperit Group per quarter as reported
in EUR mFY
20151)Q1
2016Q2
2016Q3
2016Q4
2016FY
2016Q1
2017Q2
2017Q3
2017Q4
2017FY
2017Q1
2018
Revenue 914.7 219.5 219.2 208.9 204.8 852.4 229.3 232.3 208.4 204.2 874.2 220.9
EBITDA 96.2 26.7 26.1 19.4 5.7 77.9 94.4 2.9 0.5 2.4 100.2 15.8
EBITDA margin 10.5% 12.2% 11.9% 9.3% 2.8% 9.1% 41.2% 1.2% 0.2% 1.2% 11.5% 7.1%
EBIT 66.7 18.6 17.6 10.4 -19.3 27.3 86.4 -32.0 -8.2 -8.5 37.6 6.0
EBIT margin 7.3% 8.5% 8.0% 5.0% -9.4% 3.2% 37.7% -13.8% -3.9% -4.2% 4.3% 2.7%
Financial result -8.0 -5.9 -4.1 -2.7 -7.2 -19.9 -8.0 -6.5 -6.1 -4.9 -25.5 -5.7
Earnings after tax 46.4 10.1 7.7 5.5 -32.2 -8.8 62.8 -41.6 -16.4 -31.1 -26.3 -2.6
Earnings per share in EUR2) 2.26 0.49 0.38 0.27 -1.57 -0.43 3.06 -2.02 -0.79 -1.49 -1.25 -0.14
Semperit Group (reported)
1) Values for 2015 restated2) Attributable to shareholders of Semperit AG Holding
27 Investor Presentation Q1 2018 I 25 May 2018 I Investor Relations

Semperit Group adj. where applicable
in EUR mFY
20151)
Q1 2016 adj.2)
Q22016 adj.2)
Q3 2016 adj.2)
Q4 2016 adj.2)
FY 2016 adj.2)
Q1 2017adj.3)
Q2 2017
adj. 4)
Q3 2017
adj. 4)
Q4 2017
adj. 4)
FY 2017adj.
Q1 2018
Revenue 914.7 219.5 219.2 208.9 204.8 852.4 229.3 232.3 208.4 204.2 874,2 220.9
EBITDA 96.2 24.6 25.5 17.4 7.2 74.7 9.6 12.9 10.4 2.9 35.8 15.8
EBITDA margin 10.5% 11.2% 11.7% 8.3% 3.5% 8.8% 4.2% 5.6% 5.0% 1.4% 4.1% 7.1%
EBIT 66.7 16.5 17.1 8.4 -0.9 41.1 1.6 4.6 1.7 -8.7 -0.8 6.0
EBIT margin 7.3% 7.5% 7.8% 4.0% -0.4% 4.8% 0.7% 2.0% 0.8% -4.3% -0.1% 2.7%
Semperit Group adj. where applicable
1) Values for 2015 restated2) Figures for 2016 without profit contribution from SSC and adj. in Q4 2016 for JV transaction. 3) Q1 2017 adj. for positive one-off effects from JV transaction of € 85m.4) Figures for Q2, Q3 and Q4 2017 adj. for impairment at Sempermed (€ 26m), restructuring expenses/closure in France (€ 11m) and valuation adjustment in IT (€ 4m),
expenses resulting from tax audit in Austria (€ 5m, mainly for refund of energy supply charge).
28 Investor Presentation Q1 2018 I 25 May 2018 I Investor Relations
6.0
-8.7
1.7
4.6
1.6
Q4 20174)Q3 20174)Q2 20174)Q1 20173) Q1 2018
EBIT adj. per quarterEBITDA adj. per quarter15.8
2.9
10.412.9
9.6
Q1 20173) Q3 20174)Q2 20174) Q4 20174) Q1 2018

EBITDA per quarter (adj. where applicable)
29 Investor Presentation Q1 2018 I 25 May 2018 I Investor Relations
13.710.5
8.710.511.7
Q4 2017
Q2 2017
Q3 2017
Q1 2017
Q1 2018
0.5
-2.1-1.4
-2.4
0.6
Q1 2018
Q4 2017
Q3 2017
Q2 2017
Q1 2017
Semperflex
4.53.6
5.2
7.8
5.0
Q4 2017
Q1 2018
Q1 2017
Q3 2017
Q2 2017
Sempertrans
Semperform
-1.5
Q3 2017
Q1 2018
Q4 2017
1.41.61.7
Q1 2017
Q2 2017
0.0
Sempermed

Semperflex and Sempertrans (adj. where applicable)
in EUR m FY 20151) Q1 2016 adj.2)
Q2 2016 adj.2)
Q3 2016 adj.2)
Q4 2016 adj.2)
FY 2016 adj.2) Q1 2017 Q2 2017 Q3 2017
adj. 3)Q4 2017
adj. 3)FY 2017
adj. Q1 2018
Revenue 203.4 47.8 48.8 43.4 44.9 184.9 53.5 53.2 46.8 52.5 206.1 58.8
EBITDA 46.1 11.8 12.5 8.8 10.3 43.4 11.7 10.5 8.7 10.5 41.4 13.7
EBITDA margin 22.7% 24.7% 25.7% 20.2% 22.9% 23.5% 21.8% 19.8% 18.6% 19.9% 20.1% 23.4%
EBIT 38.2 9.7 10.5 6.7 8.4 35.3 9.6 8.6 6.8 7.8 32.7 11.1
EBITmargin 18.8% 20.4% 21.5% 15.5% 18.6% 19.1% 18.0% 16.1% 14.5% 14.8% 15.9% 18.9%
Semperflex
Sempertransin EUR m FY 20151) Q1 2016 Q2 2016 Q3 2016 Q4 2016 FY 2016 Q1 2017 Q2 2017
adj.4)Q3 2017
adj. 4)Q4 2017
adj. 4) FY 2017
adj. Q1 2018
Revenue 164.9 42.6 38.9 32.7 34.1 148.4 41.3 36.8 35.7 32.1 146.0 34.6
EBITDA 23.2 5.8 5.7 3.0 1.4 15.9 0.6 -2.4 -1.4 -2.1 -5.3 0.5
EBITDA margin 14.0% 13.6% 14.5% 9.2% 4.1% 10.7% 1.4% -6.4% -3.9% -6.6% -3.6% 1.4%
EBIT 19.9 4.8 4.7 2.1 0.5 12.1 -0.3 -3.3 -2.2 -3.1 -8.9 -0.4
EBITmargin 12.1% 11.3% 12.1% 6.3% 1.5% 8.2% -0.8% -8.9% -6.3% -9.6% -6.1% -1.1%
1) Values for 2014 and 2015 restated 2) Values for 2016 restated, the business unit Sheeting was reclassified from segment Semperflex to segment Semperform3) Adj. for expenses resulting from tax audit in Austria, mainly for refund of energy supply charge, (€ 1m)4) Adj. for restructuring expenses/closing in France (€ 11m for EBIT)
30 Investor Presentation Q1 2018 I 25 May 2018 I Investor Relations

Semperform and Sempermed (adj. where applicable)
Semperformin EUR m FY
20151)Q1 2016
adj.2)Q2 2016
adj.2)Q3 2016
adj.2)Q4 2016
adj.2)FY 2016
adj.2) Q1 2017 Q2 2017 Q3 2017adj. 6)
Q4 2017adj. 6)
FY 2017adj. Q1 2018
Revenue 152.8 43.2 47.6 44.3 38.1 173.1 45.3 50.1 46.9 42.7 185.0 47.5
EBITDA 24.3 7.4 9.1 7.6 6.1 30.2 5.0 7.8 5.2 3.6 21.5 4.5
EBITDA margin 15.9% 17.2% 19.0% 17.3% 16.0% 17.4% 10.9% 15.5% 11.0% 8.5% 11.6% 9.6%
EBIT 19.1 5.7 7.2 5.7 4.0 22.5 3.0 5.8 3.2 1.3 13.3 2.4
EBITmargin 12.5% 13.1% 15.2% 12.8% 10.4% 13.0% 6.6% 11.5% 6.8% 3.0% 7.2% 5.0%
1) Values for 2014 and 2015 restated 2) Values for 2016 restated, the business unit Sheeting was reclassified from segment Semperflex to segment Semperform3) Adj. for negative one-off effects in Q4 2016 and without profit contribution from SSC for FY 20164) Q1 2017 Sempermed adj. for positive one-off effects from JV transaction in Q1 2017 of 78m for EBIT 5) Q2 2017 adj. for impairment at Sempermed (26m)6) Adj. for expenses resulting from tax audit in Austria, mainly for refund of energy supply charge (€ 2m for Semperform, € 2m for Sempermed)
31 Investor Presentation Q1 2018 I 25 May 2018 I Investor Relations
in EUR mFY
20151)Q1 2016
adj. 3)Q2 2016
adj. 3)Q3 2016
adj. 3)Q4 2016
adj. 3)FY 2016
adj. 3)Q1 2017
adj. 4)Q2 2017
adj. 5)Q3 2017
adj. 6)Q4 2017
adj.FY 2017
adj. Q1 2018
Revenue 393.7 85.9 83.8 88.6 87.6 346.0 89.2 92.2 78.8 76.9 337.1 80.0
EBITDA 29.4 4.0 1.3 -0.1 -1.7 3.4 0.0 1.7 1.6 -1.5 1.8 1.4
EBITDA margin 7.5% 4.6% 1.6% -0.2% -2.0% 1.0% ±0.0% 1.9% 2.0% -2.0% 0.5% 1.8%
EBIT 17.2 0.8 -2.2 -4.1 -4.6 -10.1 -2.8 -1.2 -1.5 -6.6 -12.1 -2.2
EBIT margin 4.4% 0.9% -2.6% -4.6% -5.3% -2.9% -3.1% -1.3% -1.8% -8.6% -3.6% -2.8%
Sempermed

2017 2016 %
874.2 852.4 +2.6%
100.2 77.9 +28.6%
11.5% 9.1% +2.4 PP
35.8 74.7 -52.1%
4.1% 8.8% -4.7 PP
37.6 27.3 +37.8%
4.3% 3.2% +1.1 PP
-0.8 41.1 –
-0.1% 4.8% -4.9 PP
-26.3 -8.8 > 100%
-43.3 15.2 –
-1.25 -0.43 > 100%
74.5 65.1 +14.5%
6,838 6,974 -1.9%
in EUR m
Revenue
EBITDA
EBITDA margin
Adj. EBITDA2)
Adj. EBITDA margin2)
EBIT
EBIT margin
Adj. EBIT2)
Adj. EBIT margin2)
Earnings after Tax
Adj. Earnings after tax2)
Earnings per share in EUR3)
Investments
Employees
Sectors and Group: FY 2017 vs FY 2016
2017 2016 %
537.0 506.4 +6.0%
42.9 89.5 -52.0%
8.0% 17.7% -9.7 PP
57.6 89.5 -35.6%
10.7% 17.7% -7.0 PP
22.4 70.0 -67.9%
4.2% 13.8% -9.6 PP
37.1 70.0 -47.0%
6.9% 13.8% -6.9 PP
– – –
– – –
– – –
48.5 34.9 +39.0%
3,648 3.637 +0.3%
Industrial Sector Medical Sector
2017 2016 %
337.1 346.0 -2.6%
77.9 6.6 > 100%
23.1% 1.9% +21.2 PP
1.8 3.4 -48.5%
0.5% 1.0% -0.5 PP
38.0 -23.9 –
11.3% -6.9% +18.2 PP
-12.1 -10.1 +19.5%
-3.6% -2.9% -0.7 PP
– – –
– – –
– – –
25.3 25.7 -1.6%
3,051 3,183 -4.2%
Semperit Group1)
1) Including Corporate Center costs (Holding, supporting functions, special projects): € -22.8m in FY 2017 (€ -18.7m in FY 2016). 2) Adj. EBIT: Figures for 2016 without profit contribution from SSC and adjusted for one-off effect trade tax / levies in Brazil and impairment Sempermed. Figures for FY 2017 adjusted for positive one-off effects from JV transaction (€ 85m), impairment at Sempermed (€ 26m), restructuring expenses in France (€ 11m), valuation adjustment in IT (€ 4m) and expenses resulting from tax audit in Austria (€ 5m, mainly for refund of energy supply charge). 3) Attributable to shareholders of Semperit AG Holding
32 Investor Presentation Q1 2018 I 25 May 2018 I Investor Relations

Key figures 2008 – 2017
Key performance figuresin EUR m 2008 2009) 20101) 20111) 2012 2013 20143) 20153) Adj.
20164)Adj.
20175)
Revenue 655.3 588.1 689.4 820.0 828.6 906.3 858.3 914.7 852.4 874.2EBITDA 87.9 102.8 112.3 110.0 108.7 132.5 101.9 96.2 74.7 35.8EBITDA margin 13.4% 17.5% 16.3% 13.4% 13.1% 14.6% 11.9% 10.5% 8.80% 4.10%EBIT 58.7 69.6 82.3 80.4 72.5 87.8 63.8 66.7 41.1 -0.8EBIT margin 9.0% 11.8% 11.9% 9.8% 8.8% 9.7% 7.4% 7.3% 4.80% -0,1%Earnings after tax 44.9 38.8 45.4 51.8 46.2 54.9 37.8 46.4 15.2 -43.9Earnings per share (EPS)2), in EUR 1.83 1.89 2.21 2.52 2.25 2.65 1.85 2.26 0.74 -2.13Gross cash flow 78.0 92.6 91.0 89.4 85.6 116.2 89.9 55.7 32.2Return on equity 12.9% 12.5% 12.9% 13.6% 11.4% 13.3% 8.6% 12.8% 4.6% -15.8%
Balance sheet key figures
in EUR m 2008 2009) 20101) 20111) 2012 2013 20143) 20153) 2016 2017Balance sheet total 485.5 531.5 593.5 616.7 824.5 852.1 826.3 937.8 1,034.5 853.2Equity2) 291.9 310.6 351.1 379.4 406.2 411.5 443.8 363.3 329.3 278.5Equity ratio 60.1% 58.4% 59.2% 61.5% 49.3% 48.3% 53.7% 38.7% 31.8% 32.6%Investments in tangible and intangible assets
27.6 22.7 52.5 45.1 41.2 49.7 67.4 71.8 65.1 74.5
Employees (at balance sheet date) 7,064 6,649 7,019 8,025 9,577 10,276 6,888 7,053 6,974 6,838
1) Values for 2011 restated (see Annual Report 2012, Notes 2.18), values for 2010 not restated. 2) Attributable to shareholders of Semperit AG Holding. 3) Values for 2014 and 2015 restated. 4) Figures for 2016 without profit contribution from SSC, impairment Sempermed and trade tax / levies in Brazil5) Figures for FY 2017 adjusted for positive one-off effects from JV transaction (€ 85m), impairment at Sempermed (€ 26m, only for EBIT), expenses resulting from tax audit in Austria (€ 5m, mainly for refund of energy supply charge), expenses for restructuring / plant closure in France (€ 11m) and for valuation adjustment IT (€ 4m).
33 Investor Presentation Q1 2018 I 25 May 2018 I Investor Relations

> 54%
> 5%
< 41%
B & C Holding Österreich GmbH, Vienna, Austria
FMR Co., Inc (FidelityManagement & Research Company)Free Float
Semperit is listed on the Vienna Stock Exchange since 1890
Total of 20,573,434 shares with a market capitalization of about EUR 400m (mid May 2018)
B & C Holding Österreich GmbH is part of B & C Privatstiftung, an Austrian based private foundation / trust
Primary focus of B & C is pursuing the foundation’s mission to “foster Austrian entrepreneurship”
Semperit benefits from a supportive ownership structure with long-term commitment from B & C
Fidelity Management and Research is an American multinational financial services corporation
Shareholder structure
Shareholder Structure
34 Investor Presentation Q1 2018 I 25 May 2018 I Investor Relations