dr. marty d. matlock - impacts of gmo products on food security and trade
TRANSCRIPT

Marty Matlock, PhD, PE, BCEEExecutive Director, Office for SustainabilityProfessor , Biological and Agricultural Engineering Department
University of Arkansas
Impacts of GMO
Products on Food
Security and Trade2014 NIAA Annual Conference & NIAA/USAHA
Joint Forum on Trichomoniasis Standards

Everything is Connected
2

Everything is changing
3

Security is an issue of Trust
1. Consumer attitudes
2. Social License – freedom to
operate
3. Criteria for legitimacy
4. Market competitiveness
5.Reputational Risks!

The Food Supply Chain
Production Processing
Distribution
RetailDirect Mktg Wholesale
Consumption
Safety
Security
Stability
5

Trade is a Market Process
1. Demand for a product drive trade
2. Trade is tied to safe, secure, and
economical supply
3. Barriers to trade are almost always
rooted in economical nationalism
4. Some barriers are ideological –
cannot be broken with facts
5. Sustainability strategies based on
performance data can open markets

0
2
4
6
8
10
12
1950 1960 1970 1980 1990 2000 2010 2020 2030 2040 2050
Po
pu
lati
on
(B
illio
ns
)
Year
UN Population Projections
What we do in the next
10 years will shape
Earth and Humanity for
the next 100 years
When technology and culture collide
technology prevails, culture changes
7
Population is about Prosperity!
Where the demand will come from…

Billions
0
1
2
3
4
5
6
7
8
9
10
1950 1970 1990 2010 2030 2050
Less Developed Regions
More Developed Regions
Source: United Nations, World Population Prospects: The 2004 Revision (medium scenario), 2005.
Where the demand will come from…
8

Meat Consumption on the Rise

Animal Agriculture Benefits
• Animal Agriculture accounts for 40% of Ag
GDP.
• Currently employs 1.3 billion people.
• Of the 880 million rural poor people living on
less than $1 per day, 70 percent are partially
or completely dependent on livestock for
their livelihoods and food security.
• Global meat production is expected to more
than double to 465 million tonnes by 2050.
• Global milk production is expected to almost
double to 1043 million tonnes by 2050.

Environmental Concerns over
Animal Agriculture
The argument goes something like this:
•As the numbers of farm animals reared for meat, egg, and dairy
production increase, so do emissions from their production.
•By 2050, global farm animal production is expected to double from
present levels.
•The environmental impacts of animal agriculture require that
governments, international organizations, producers, and consumers
focus more attention on the role played by meat, egg, and dairy
production.
•Mitigating and preventing the environmental harms caused by this
sector require immediate and substantial changes in regulation,
production practices, and consumption patterns.Koneswaran, G., & Nierenberg, D. (2008). Global farm animal production and global warming:
impacting and mitigating climate change. Environmental Health Perspectives, 116(5), 578.11

12
• Grazing and pasture
lands account for the
70% of land used in
agricultural production
(30% of land on
Earth).
• Livestock accounts for
8 % of total human
water use, largely
from irrigation of
crops.

Land degradation: Restore damaged land
through soil conservation, silvo-pastoralism, better
management of grazing systems and protection of
sensitive areas.
Greenhouse gas emissions: Sustainable
intensification of livestock and feed crop
production to reduce carbon dioxide emissions
from deforestation and pasture degradation,
improved animal nutrition and manure
management to cut methane and nitrogen
emissions. 13
FAO Recommendations for
Animal Agriculture SustainabilityLivestock's long shadow (FAO, 2006)

FAO Recommendations for
Animal Agriculture Sustainability
Water pollution: Better management of animal
waste in industrial production units, better diets to
improve nutrient absorption, improved manure
management and better use of processed manure
on croplands.
Biodiversity loss: As well as implementing the
measures above, improve protection of wild
areas, maintain connectivity among protected
areas, and integrate livestock production and
producers into landscape management. 14
Livestock's long shadow (FAO, 2006)

15
Livestock GHG emissions
are estimated at 7.1
gigatonnes CO2e per year.
This is 14.5 percent of
human-induced GHG
emissions.

16
Potential GHG emissions
reductions from nutrition,
manure, and husbandry
practices.
Increasing forage digestibility and
digestible forage intake will generally
reduce GHG emissions
from rumen fermentation and stored
manure.
Dietary lipids are effective in reducing
enteric CH4 emissions.
Supplementation with small amounts
of concentrate feed to increase
animal productivity

Global emissions by sector
17

18
• Intensification of animal production is critical:
– Preserving land for other life,
– Providing critical scale for effective manure
management,
– Providing effective scale for diet management,
– Insuring standardized practices for food safety,
quality, and consistency.
• Sustainability is about people, planet, and
profit.
– Unprofitable enterprises are not sustainable and
tend create the most problems for people and
planet.
Sustainable Animal Agriculture

Life Cycle Assessment Case Study:
Carbon Equivalent GHG in Dairy
Production Processing
DistributionConsumption
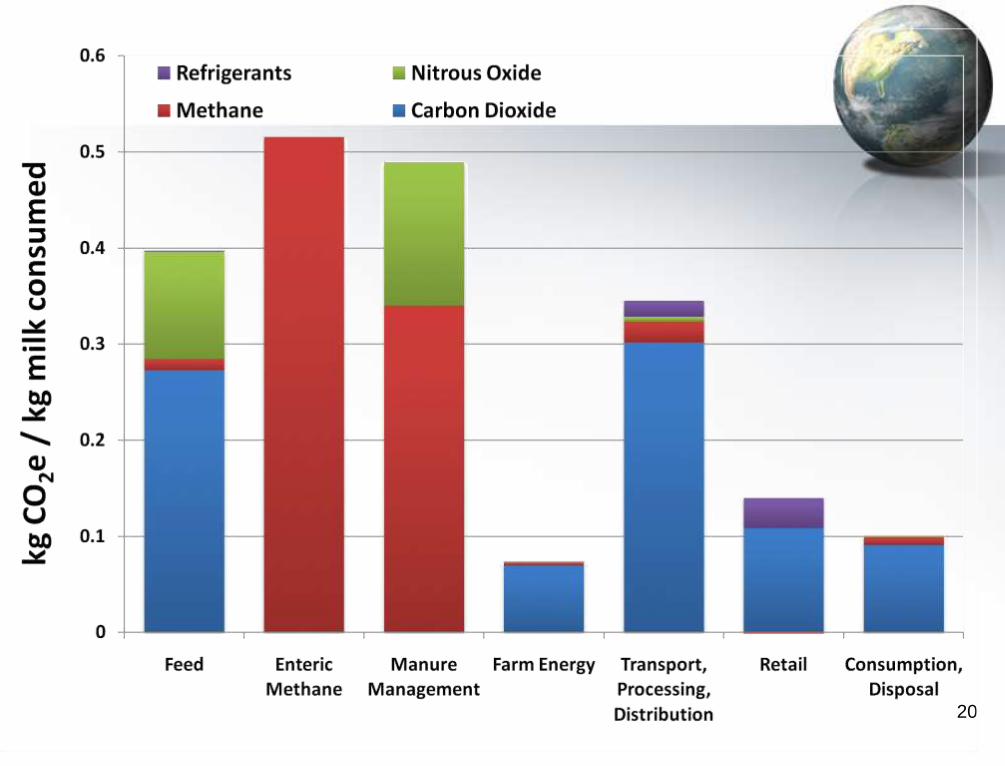
20

Pork Supply Chain LCA

GHG emissions associated with
consumption of pork in the US.

23
It’s All About Improving Feed and
Reducing Manure
• Improving effective feed utilization
(conversion of feed into product) reduces
environmental metrics.
• Feed mixture optimization is a key element
for enhancing sustainability of animal
agriculture sustainability:
– Nutrient digestibility
– Gut function
– Immune system

Measuring US Soybean
Sustainability Metrics
24

Measuring US Corn
Sustainability Metrics
25
Corn: Environmental Results From the 2012 Environmental and Socioeconomic Indicators Report
Field to Market is a diverse alliance working to identify supply chain strategies to define, measure and promote continuous improvement for agriculture. The group provides collaborative leadership that is engaged in industry-wide dialogue, grounded in science and open to the full range of technology choices.
Field to Market is developing and piloting science and outcomes-based sustainability metrics, and tools at a variety of scales, to help measure and advance continuous improvement. The Field to Market 2012 Environmental and Socioeconomic Indicators Report analyzes sustainability trends over time at the national scale for U.S. corn, cotton, potato, rice, soybean and wheat production. Using publicly available data, the report evaluates performance over three decades.
Corn for Grain Results
Over the study period (1980-2011), trends in U.S. corn production were as follows:
Yield: Corn increased in total production (+101%) and yield (bushels per acre) (+64%).
Resource efficiency (per bu shel): Corn im proved on all me asures of resource “efficiency,” with de creases in per bushel land use (-30%), soil erosion (-67%), irrigation water applied (-53%), energy use (-44%), and greenhouse gas emission (-36%).
Resource use/impact per acre: Corn improved (decreased) per acre soil erosion (-43%), irrigation water applied (-28%), and energy use (-6%) and increased per acre greenhouse gas emissions (+8%). Improvements in per acre soil erosion occurred primarily in the first half of the study period; per acre soil erosion has remained relative constant since the late-1990s.
Total resource use/impact: Corn improved (decreased) total soil erosion (-31%) and increased total land use (+21%), irrigation water applied (+27%), energy use (+14%), and greenhouse gas emissions (+31%). Improvements in total soil erosion occurred primarily in the first half of the study period, with more recent trends indicating a slight increase in total annual erosion.
Please note: all results are for corn for grain; corn for grain includes corn for all purposes other than forage; corn for grain includes grain for ethanol. Average percent change values reported for the full study period are based on a least squares trend analyses from 1980-2011.
Index of Per Bushel Resource Impacts to Produce Corn for Grain, United States, 1980-2011
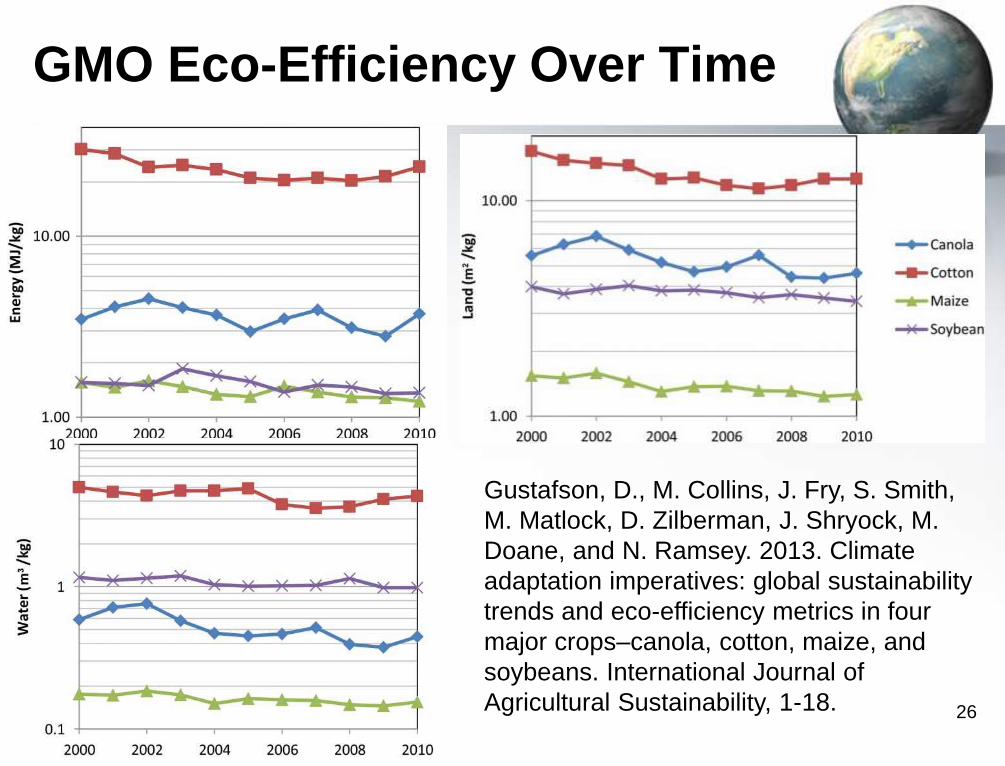
GMO Eco-Efficiency Over Time
26
Gustafson, D., M. Collins, J. Fry, S. Smith,
M. Matlock, D. Zilberman, J. Shryock, M.
Doane, and N. Ramsey. 2013. Climate
adaptation imperatives: global sustainability
trends and eco-efficiency metrics in four
major crops–canola, cotton, maize, and
soybeans. International Journal of
Agricultural Sustainability, 1-18.

Productivity, Eco-Efficiency, and Yield
27Gustafson, D., M. Collins, J. Fry, S. Smith, M. Matlock, D. Zilberman, J. Shryock, M. Doane, and N. Ramsey. 2013.
Climate adaptation imperatives: global sustainability trends and eco-efficiency metrics in four major crops–canola,
cotton, maize, and soybeans. International Journal of Agricultural Sustainability, 1-18.

US Corn Production
28
• In 2013 US produced 10.8 billion bushels
(273.8 million metric tons) of corn
• Almost 30% of global yield on 20% of
corn planted area.
• Roughly 7% of production was exported
to more than 100 different countries.
• Among them, Japan (37%), Mexico
(24%), and China (13%) comprise the
bulk of U.S. corn destinations.
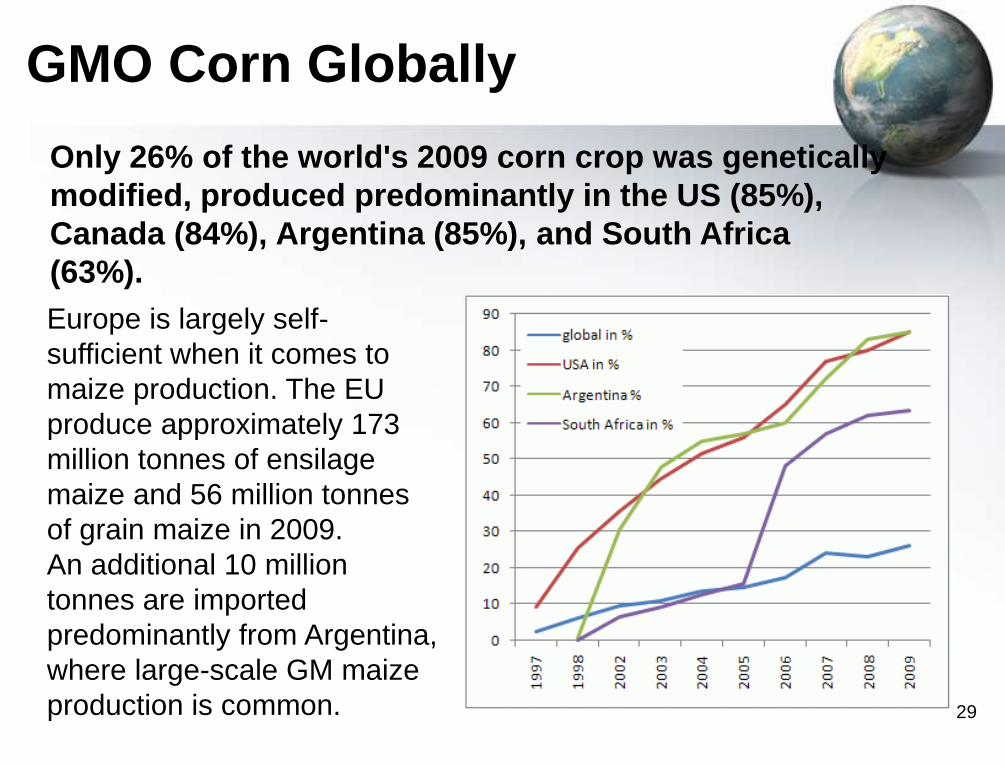
GMO Corn Globally
29
Only 26% of the world's 2009 corn crop was genetically
modified, produced predominantly in the US (85%),
Canada (84%), Argentina (85%), and South Africa
(63%).
Europe is largely self-
sufficient when it comes to
maize production. The EU
produce approximately 173
million tonnes of ensilage
maize and 56 million tonnes
of grain maize in 2009.
An additional 10 million
tonnes are imported
predominantly from Argentina,
where large-scale GM maize
production is common.

30
• U.S. soybean farmers exported 1.7 billion bushels of
U.S. soy in the 2012-13 marketing year.
• The value of these exports set a new record of $28
billion, a 19 percent increase from 2011-2012.
• Includes more than 1.3 billion bushels of whole U.S.
soybeans, the meal from 454 million bushels of U.S.
soybeans and the oil from 186 million bushels. All told,
these exports represent 56 percent of U.S. soybean
production from last year.
• China: 772 million bushels of U.S. soybeans
• Mexico: 98 million bushels of U.S. soybean
• Japan: 63 million bushels of U.S. soybeans
US Soybean Production

GMO Soybeans Globally
31
Over 75% of the world's 2010 soybean crop was
genetically modified, a higher percentage than for
any other crop.
http://www.gmo-compass.org/
Each year, EU
Member States import
~ 40 million tonnes of
soy material, primarily
destined for use as
cattle, swine, and
chicken feed.

32
http://www.gmo-compass.org
European Union GMO Activities
GM maize in the EU: The first lines of GM
maize were approved in the EU in 1997. Spain
became Europe’s first country to put it to use.
Today, 79,269 hectares of Spanish maize
production, is genetically modified. In addition,
production is now taking place to a lesser extent
in the Czech Republic, Portugal and Germany.

33
Cultivation 2009: Field area for Bt maize decreases
The field area for genetically modified plants in the
European Union decreased further in 2009. In France
and Germany, national cultivation bans for genetically
modified Bt maize (MON810) were enacted in 2009. In
the meanwhile, stricter co-existence regulations apply in
almost all EU member states.
http://www.gmo-compass.org
European Union GMO Activities

Persistent vs Important Issues
Persistent Issues Important Issues
Locally grown Water use efficiency
GMO crops Soil erosion
Organic crops Soil organic carbon
Natural Land use change –
biodiversity loss
From Jason Clay, WWF

Meeting Food Needs by 2050
Jason Clay
The role of
research
35
http://www.gmo-compass.org/
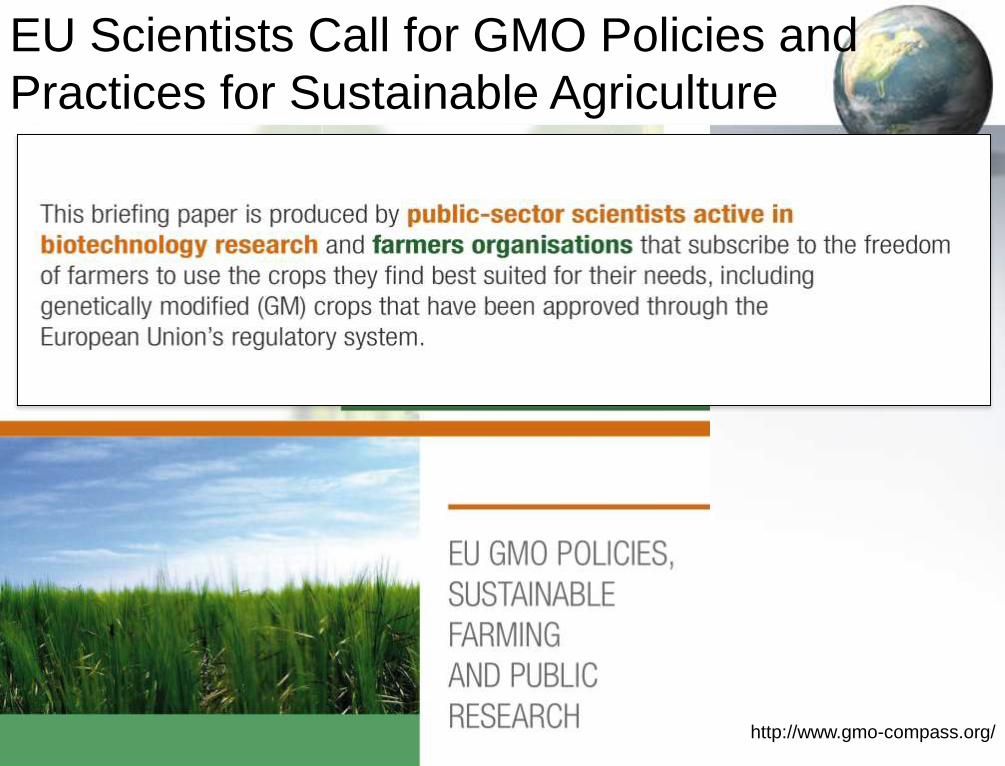
EU Scientists Call for GMO Policies and
Practices for Sustainable Agriculture

37
• There are many constraints in cultivating crops and trees
in Europe for which conventional breeding has limited
potential to provide adequate solutions, and for which
biotechnological tools are already available or in an
advanced stage of development.
• Current GMO policies in the EU deprive farmers of
potential benefits and of the freedom to choose in the 12
countries in which the survey was conducted there are
farmers who wish to have the freedom to use the crops
they find best suited for their needs, including approved
GM crops.
• Much public-sector biotechnology research for
sustainable agriculture in Europe has been slowed,
stopped or moved abroad, because of regulatory hurdles
and costs to prevent destruction of field research.
EU Scientists Call for GMO Policies and
Practices for Sustainable Agriculture

Building Trust Through Key Performance
Indicators of Sustainable Agriculture
Key Performance Indicators (KPIs) are
things we measure to inform decisions.
KPIs should be:
1. Outcomes Based
2. Science Driven
3. Technology Neutral
4. Transparent