dr. matt swantek & david stender - feed management and records for niche markets
TRANSCRIPT

Berkshire Study Western Research Farm
collaborators
J.Mabry, M.Honeyman, W.Roush, D. Stender, M.Swantek
sponsored by the Iowa Pork Producers Association
Iowa Pork Congress
Niche Pork Production
January 24, 2013
Des Moines, Iowa

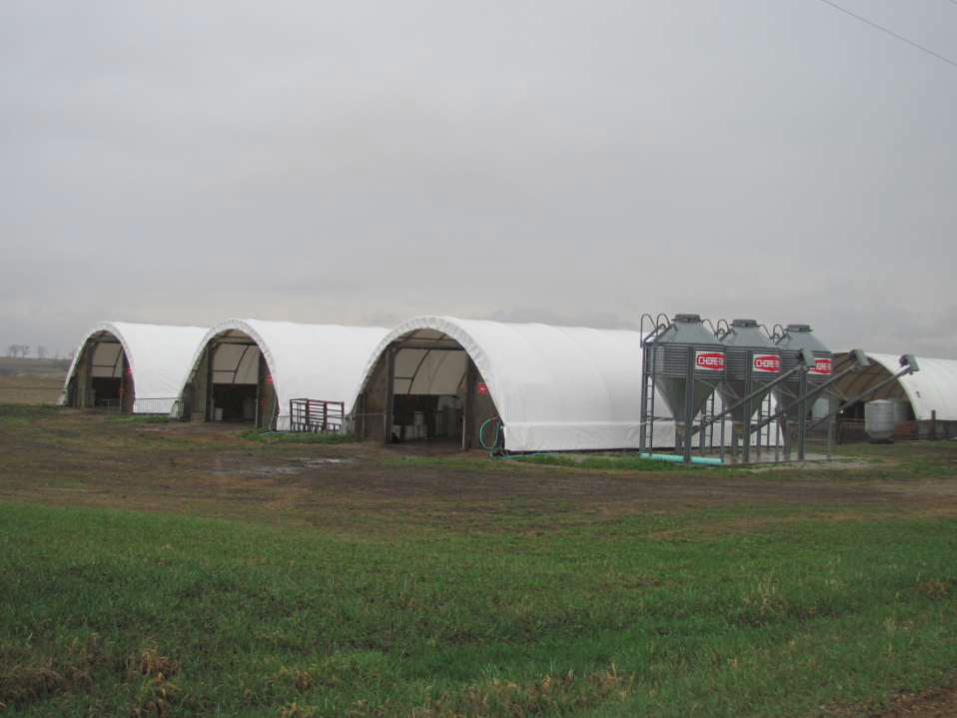
Berkshire Preliminary Study Western Research Farm
• 3 Mini Hoops – 6 pens with 6 pigs/pen
• Split sex – 18 gilts; 18 barrows
• 3 weight blocks (25, 31, 41 avg)
• 2 trials (seasons) - Nov 17, 2011, May 10, 2012
• Avg end weight approximate 270 lb
• 6 diets – 45, 90, 135, 180, 225
• Weigh 21 days
• Backfat and LEA 21 days group avg of 90 lb
• ADG, ADFI, FG, Backfat, LEA, %Lean, Intake and
Gain curves
• SIG International, Boyden IA
• Heritage Pork, Sioux City IA


Growth Performance
Segment Initial wt Final wt Days ADFI ADG F:G
Trial 1 56 271 115 6.51 1.88 3.46
Trial 2 53 268 112 5.92 1.94 3.05
Gilts 53 265 119 5.70 1.78 3.20
Barrows 55 275 108 6.73 2.04 3.31
All pigs 54 270 113 6.21 1.91 3.26

Ultrasonic Scans
Segment 1st Scan Final 1st
ScanFinal
1st
ScanFinal %Lean
Trial 1 88 271 0.41 1.19 2.45 6.23 46.42
Trial 2 90 268 0.37 0.97 2.64 6.52 49.02
Gilts 86 265 0.34 0.90 2.52 6.56 49.84
Barrows 92 275 0.43 1.26 2.57 6.19 45.60
Overall 89 270 0.39 1.08 2.54 6.38 47.72
Body weight Backfat, in Loin Eye Area, in2

Next stepModeling performance

0.00.51.01.52.02.53.03.54.04.55.05.56.06.57.07.58.08.59.09.5
10.0
0 20 40 60 80 100 120 140 160 180 200 220 240 260 280 300 320 340
po
un
ds
pe
r d
ay
Body weight, lb
Figure 1. Berkshire Avg Daily Feed Intake
Trial 1 Barrows Trial 1 Gilts Trial 2 Barrows Trial 2 Gilts

1.00
1.10
1.20
1.30
1.40
1.50
1.60
1.70
1.80
1.90
2.00
2.10
2.20
0 20 40 60 80 100 120 140 160 180 200 220 240 260 280 300 320 340
po
un
d p
er
day
Body weight, lb
Figure 2. Berkshire Avg Daily Gain
Trial 1 Barrows Trial 1 Gilts Trial 2 Barrows Trial 2 Gilts
0.00
0.20
0.40
0.60
0.80
1.00
1.20
1.40
1.60
1.80
0 20 40 60 80 100 120 140 160 180 200 220 240 260 280 300 320 340
bac
kfat
de
pth
, in
che
s
Body weight, lb
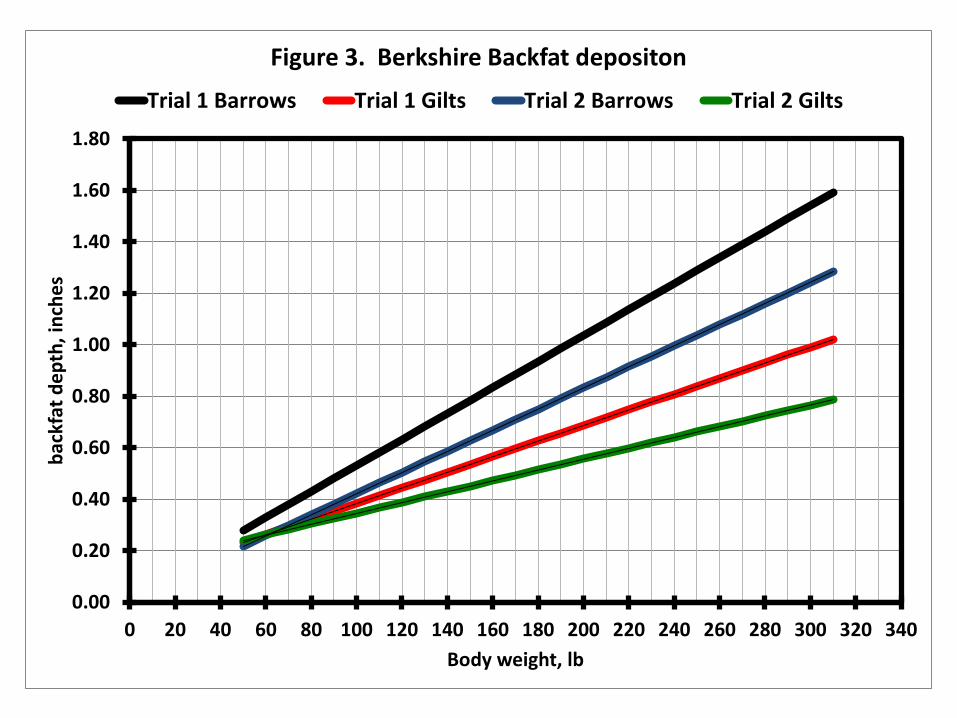
Figure 3. Berkshire Backfat depositon
Trial 1 Barrows Trial 1 Gilts Trial 2 Barrows Trial 2 Gilts

0.00
1.00
2.00
3.00
4.00
5.00
6.00
7.00
8.00
0 20 40 60 80 100 120 140 160 180 200 220 240 260 280 300 320 340
Loin
eye
are
a, in
2
Body weight, lb
Figure 3. Berkshire Loin eye area - Ultrasonic measurement
Trial 1 Barrows Trial 1 Gilts Trial 2 Barrows Trial 2 Gilts

40%
45%
50%
55%
60%
0 20 40 60 80 100 120 140 160 180 200 220 240 260 280 300 320 340
pe
rce
nt
lean
Body weight, lb
Figure 5. Berkshire Lean depositon - adj 75% yield Carcass basis
Trial 1 Barrows Trial 1 Gilts Trial 2 Barrows Trial 2 Gilts

Summary• Weight gains and intake curves are similar but differ between
genders and trial (season)
• Backfat deposition rates differ between genders
• Loin eye area curves are uniform for the first 100 gain then deviate
between barrows and gilts
• Backfat deposition rates differ between genders and trials
• Percent lean differ between genders and trials
• Changes in backfat develop earlier than I expected
• Adjusting pen average weight, feed intakes were similar between
barrows and gilts
• Pen intakes accounted for 76% of the variation in body weight, but
on 28% of ADG.

Validation of results• Additional replications
• Testing model equations
• Adjust nutrition for performance and economics
• Producer database
– Across the state
– Genetic
• Better recommendations

How did we get herethe process

R² = 0.67
0.00
0.10
0.20
0.30
0.40
0.50
0.60
0.70
0.80
0.90
1.00
1.10
1.20
1.30
1.40
1.50
1.60
1.70
1.80
1.90
2.00
2.10
2.20
40 60 80 100 120 140 160 180 200 220 240 260 280 300 320
Body Weight
Backfat

y = 0.0029x + 0.0959R² = 0.7248
0.00
0.10
0.20
0.30
0.40
0.50
0.60
0.70
0.80
0.90
1.00
1.10
1.20
1.30
1.40
1.50
1.60
1.70
1.80
1.90
2.00
2.10
2.20
40 60 80 100 120 140 160 180 200 220 240 260 280 300 320
Body Weight
Backfat - Gilts
y = 0.0052x - 0.0010R² = 0.8718
0.00
0.10
0.20
0.30
0.40
0.50
0.60
0.70
0.80
0.90
1.00
1.10
1.20
1.30
1.40
1.50
1.60
1.70
1.80
1.90
2.00
2.10
2.20
40 60 80 100 120 140 160 180 200 220 240 260 280 300 320
Body Weight
Backfat - BarrowsBackfat by Gender
Barrows
Gilts
0
2
4
6
8
10
12
14
16
18
20
22
0.0%
0.2%
0.4%
0.6%
0.8%
1.0%
1.2%
1.4%
1.6%
1.8%
2.0%
2.2%
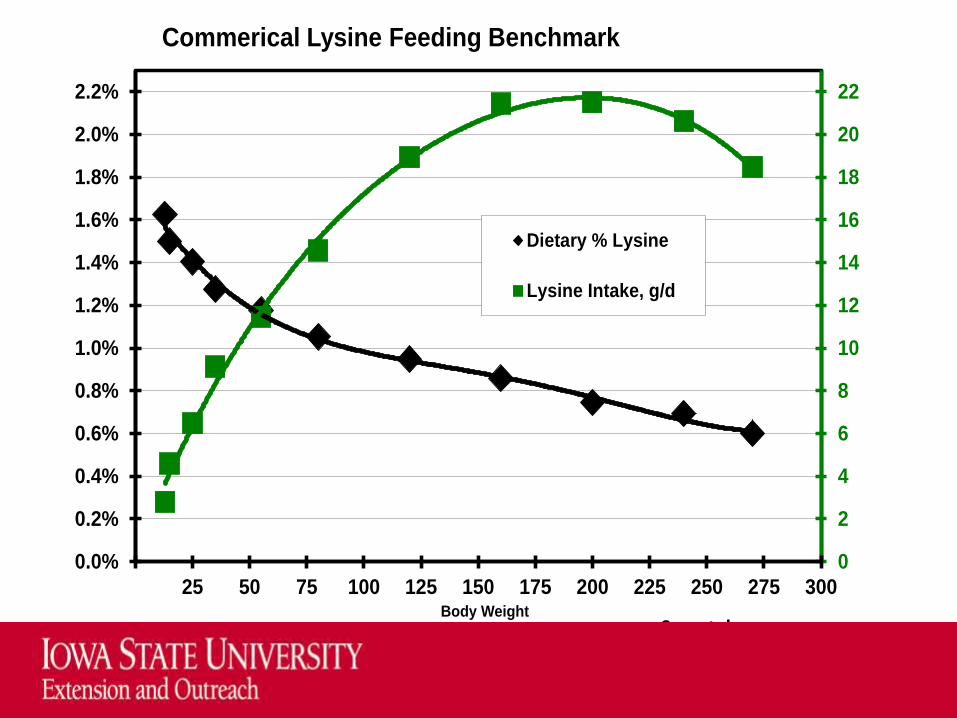
25 50 75 100 125 150 175 200 225 250 275 300Body Weight
Commerical Lysine Feeding Benchmark
Dietary % Lysine
Lysine Intake, g/d
Swantek

0.0
0.5
1.0
1.5
2.0
2.5
3.0
3.5
4.0
4.5
5.0
5.5
6.0
6.5
7.0
7.5
25 50 75 100 125 150 175 200 225 250 275 300
Model's ADFI and ADG Curves
ADFI
ADG
Swantek

0.0
0.5
1.0
1.5
2.0
2.5
3.0
3.5
4.0
4.5
5.0
5.5
6.0
6.5
7.0
7.5
8.0
8.5
9.0
25 50 75 100 125 150 175 200 225 250 275 300
Body weight, lb
Model's Average Daily Intake Curve, lb/d
Projected Intake
Site 1
Site 2
Site 3
Swantek

1.30
1.35
1.40
1.45
1.50
1.55
1.60
1.65
1.70
1.75
1.80
1.85
1.90
1.95
2.00
2.05
2.10
2.15
2.20
2.25
3.00
3.20
3.40
3.60
3.80
4.00
4.20
4.40
4.60
4.80
5.00
5.20
5.40
5.60
5.80
6.00
6.20
6.40
6.60
6.80
0 1 2 3 4 5 6 7 8 9 10 11 12 13 14 15 16 17 18
Daily GainFeed Intake
Group
Finisher
ADFI ADG
Swantek

Iowa Pork Producers Association
Thank you

Feed Management and
Records for Niche
Producers
Dave Stender
ISU Swine Field Specialist
Mobile: (712)261-0225

Measure where you are
• Need to know if you have the large factors
covered
• Need to assess the value of smaller
factors
• Feed intake curve ---budgets
• Lean gain calculation

Intake Curve
Gilts Barrows
60 2.9 2.9
80 3.4 3.4
100 3.8 3.9
120 4.1 4.4
140 4.5 4.8
160 4.8 5.2
180 5 5.5
200 5.3 5.7
220 5.5 6
240 5.6 6.1
260 5.8 6.3 Swantek, 2012

Feed records for an intake
curve individualized for your
pig’s performance
Date and Pounds of feed Number of
ration name pigs on feed
April 6 -- G1 2000 100
April 18 - G2 2000 97
May 2 - F1 2000 95
Continued for all feed
NOTE: Also need to have start date and ending date of sale or transfer
including the number of head and weight

We are willing to give you
a spreadsheet or an input
sheet and help you
determine your intake
curve
• Check out www.ipic.iastate.edu
for a downloadable spreadsheet or input
form(s) to print out

Records
• Weight in and date
• Sell weights and dates
• Death loss
• Weight and date of feed deliveries
• Simple spreadsheet
• Group tracker

Producer: Mich Hogsten Location: West Barn Group: Group ID 060810
City, State Ames, IA Genetics: Home grown Contact Person: Dave Stender
Production Phase Finisher
Date Started: 1/5/13 Date Out 4/28/13
Number of Pigs In: 150 Number of Pigs Out 148 Number of pigs died 2
Total Weight: 7,245 Total Weight 37,942 Avg days on feed 40
Avg Weight: 48.30 Avg Weight 256.36 Avg weight
Feed data Product Used: Total lbs Total $ Product Used: Total lbs Total $
1 1 L 16,000 1,446.03$ 8 -$
2 2 L 12,000 1,021.35$ 9 -$
3 3 L 12,000 1,000.29$ 10 -$
4 4 L 20,000 1,608.06$ 11 -$
5 5 L 27,001 2,103.58$ 12 -$
6 13 -$
7 14 -$
Total Feed 7,179.31$ 87,001 lb
GMD Charges -$
43.50 tons Days Barn Used 114
-$ $/ton Animal Days 16,908
Avg In Wt 48.3
Other Costs Total Dollars Avg Out Wt 256.4
Revenue 23,057.04$ Avg Days on Feed 112.7
Pig Purchase 9,111.00$ Total Gain 30,697
Bales -$ ADG 1.82
Mrkt'g/NPB -$ ADFI 5.15
post pig 20.00$ Feed Eff 2.83
run cultures 15.00$ Death Loss 1.3%
feed grade penecillin 79.20$ Report Date 01/22/13 Feed Cost per Cwt/gain 23.39$
injectable "Excede" 45.10$ Feed Cost per Head Out 48.51$
dexasone 14.00$ To add to your database Total Cost 16,513.85$
Aureomycin 100 50.24$ Email Closeout to Avg cost per Head Out 111.58$
Tylan 40 330.27$ [email protected] Return/Pig sold 44.21$
Return 6,543.19$
Animals that Died
Production Summary

Feed Manufactoring &/or Delivery Start Date # of pigs Start Wt
Producer: ___________________ Site: ______________ / /
Bldg/Rm: ___________ Group: ___________ / /
Date Phase Diet ID Antibiotic Tons Date Phase Diet ID Antibiotic Tons

0.00
0.25
0.50
0.75
1.00
1.25
1.50
1.75
2.00
2.25
2.50
2.75
3.00
3.25
3.50
3.75
4.00
4.25
4.50
4.75
5.00
5.25
0 7 14 21 28 35 42 49 56 63 70 77 84 91 98 105 112 119 126 133 140 147 154
Cu
m F
eed
In
take
Days on Feed
Finisher 50 - 280 Cumulative Avg Daily Feed Intake
First Step is to Verify Data Integrity
Matt Swantek, 2012

Once the data is verified,
how do you know if you
match the standard curve?
• Research work at the ISU research
farm
• Other research data
• A large data base of on-farm records in
our possession
0.40
0.50
0.60
0.70
0.80
0.90
1.00
1.10
1.20
1.30
1.40
1.50
1.60
0.00
0.20
0.40
0.60
0.80
1.00
1.20
1.40
1.60
1.80
2.00
2.20
2.40
0 1 2 3 4 5 6 7 8 9 10 11 12 13 14 15 16 17 18
Daily GainFeed Intake
Group
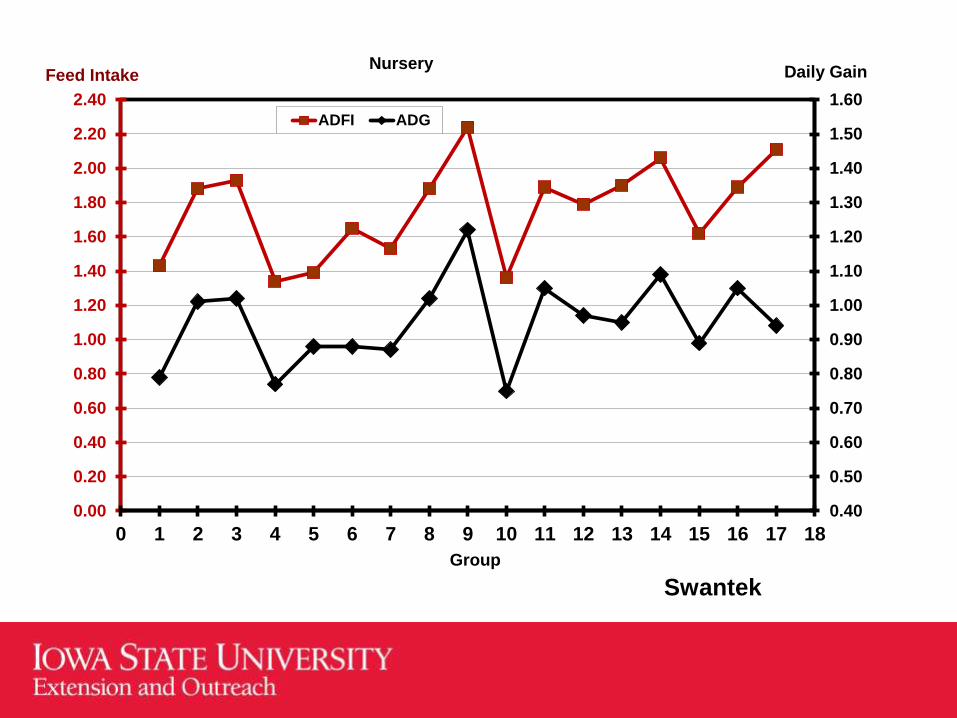
Nursery
ADFI ADG
Swantek
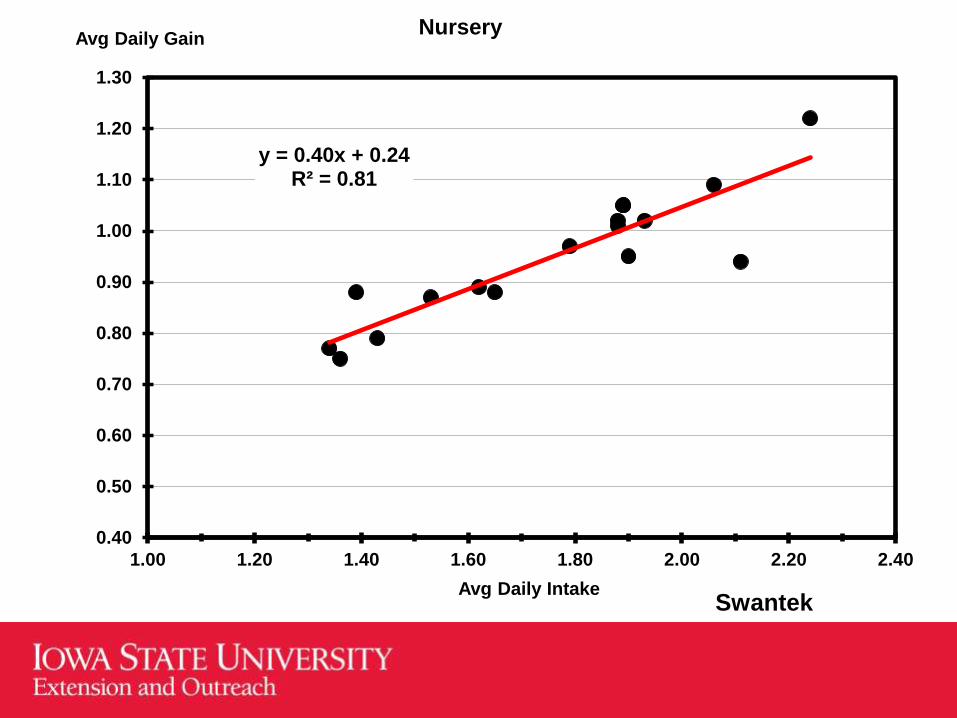
y = 0.40x + 0.24R² = 0.81
0.40
0.50
0.60
0.70
0.80
0.90
1.00
1.10
1.20
1.30
1.00 1.20 1.40 1.60 1.80 2.00 2.20 2.40
Avg Daily Gain
Avg Daily Intake
Nursery
Swantek
Does your curve match the
standard curve?
• Yes, then we can use the curve for 2
key management strategies.
– Proper nutrient level (lysine) based on
amount of feed eaten
– Predict the sell date with amazing accuracy

Does your curve match the
standard curve?
• No, then we use as a diagnostic:
– Feed wastage
– Health, can find undetectable problems
– Deficiencies in nutrition program
– Worm load
– Thermo-neutral issues
– Genetics under performance
– Other management practices
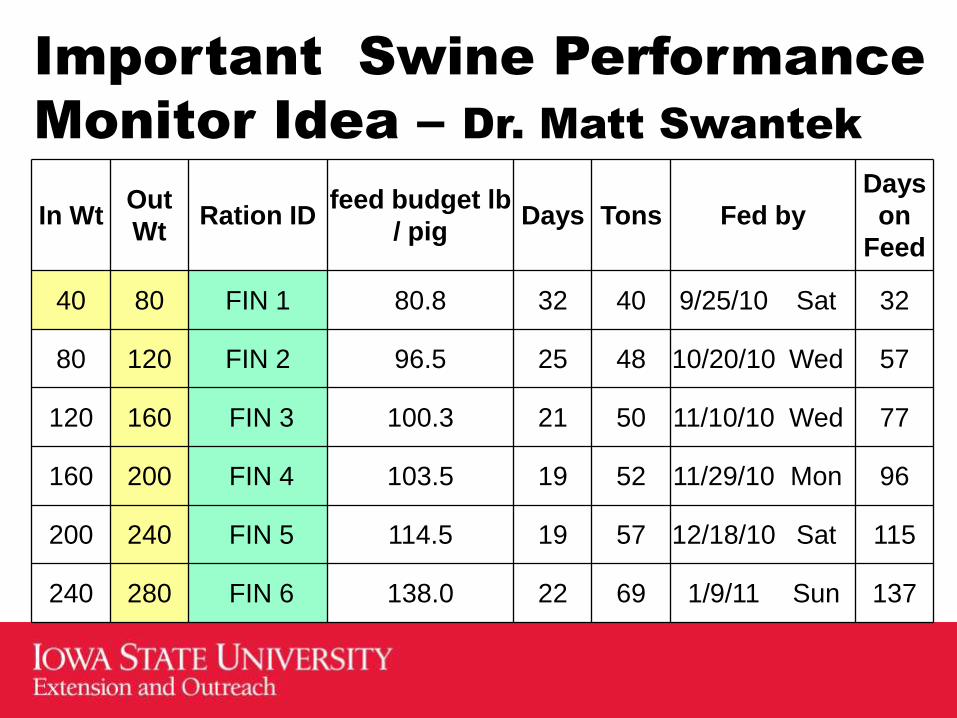
Important Swine Performance
Monitor Idea – Dr. Matt Swantek
In WtOut
WtRation ID
feed budget lb
/ pigDays Tons Fed by
Days
on
Feed
40 80 FIN 1 80.8 32 40 9/25/10 Sat 32
80 120 FIN 2 96.5 25 48 10/20/10 Wed 57
120 160 FIN 3 100.3 21 50 11/10/10 Wed 77
160 200 FIN 4 103.5 19 52 11/29/10 Mon 96
200 240 FIN 5 114.5 19 57 12/18/10 Sat 115
240 280 FIN 6 138.0 22 69 1/9/11 Sun 137

Questions?
• Contact information –
– Dave Stender, Swine Field Specialist
• Location: Cherokee County Extension Office
• Phone: Mobile – 712 261 0225
– Office – 712 225 6196
– FAX – 712 225 3173
– Email – [email protected]