dr. shahid mehmood
TRANSCRIPT
Pakistan Agriculture Issues and Prospects
Sarsabz FertilizersFATIMA GROUP
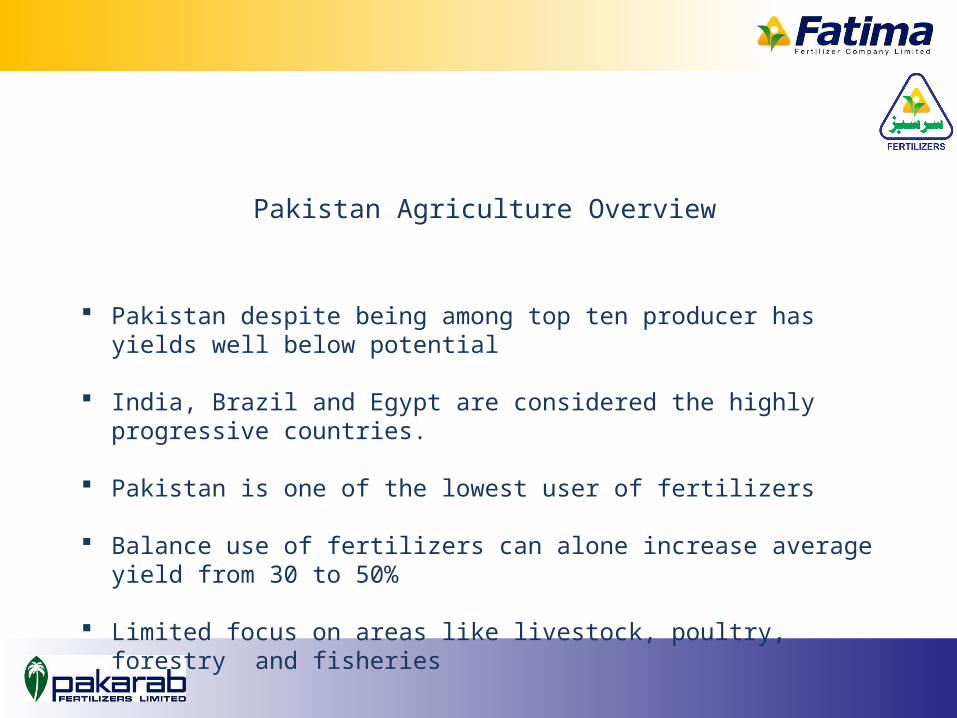
Pakistan despite being among top ten producer has yields well below potential
India, Brazil and Egypt are considered the highly progressive countries.
Pakistan is one of the lowest user of fertilizers
Balance use of fertilizers can alone increase average yield from 30 to 50%
Limited focus on areas like livestock, poultry, forestry and fisheries
Pakistan Agriculture Overview
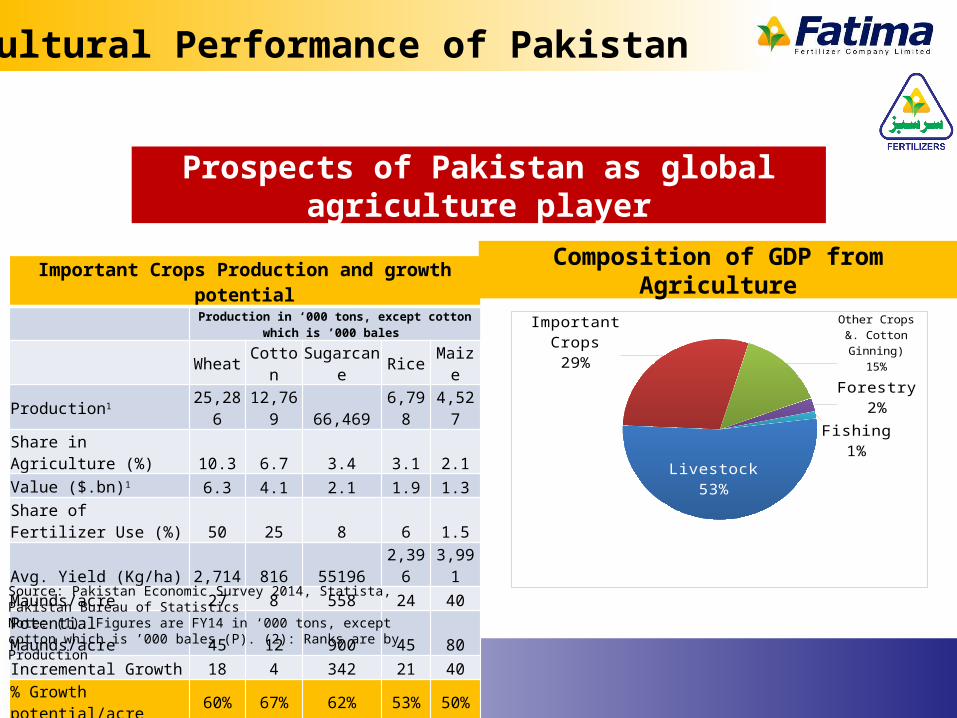
Important Crops Production and growth potentialProduction in ‘000 tons, except cotton which is ’000 bales
Wheat Cotton Sugarcane Rice MaizeProduction1 25,286 12,769 66,469 6,798 4,527Share in Agriculture (%) 10.3 6.7 3.4 3.1 2.1Value ($.bn)1 6.3 4.1 2.1 1.9 1.3Share of Fertilizer Use (%) 50 25 8 6 1.5Avg. Yield (Kg/ha) 2,714 816 55196 2,396 3,991Maunds/acre 27 8 558 24 40Potential Maunds/acre 45 12 900 45 80Incremental Growth 18 4 342 21 40% Growth potential/acre 60% 67% 62% 53% 50%
Source: Pakistan Economic Survey 2014, Statista, Pakistan Bureau of StatisticsNote: (1): Figures are FY14 in ‘000 tons, except cotton which is ’000 bales (P). (2): Ranks are by Production
Prospects of Pakistan as global agriculture player
Agricultural Performance of Pakistan
Livestock53%
Important Crops29%
Other Crops &. Cotton Ginning)
15%Forestry2%
Fishing1%
Composition of GDP from Agriculture

Issues – Pakistan Agriculture
• Degradation of soil – Nutrient mining due to imbalanced fertilizer use & salinity
• Poor seed quality and distribution system
• Weak national agricultural research regime
• High post harvest losses – Rs. 49 billion loss only in fruits and vegetables
• Inefficient use and management of irrigation water
• Poor awareness of the farmer on latest technologies
• Primitive nature of farming (low mechanization)
67% untapped potential on account of the following factors

Pakistan Land Holding Statistics
FARM NUMBER AND AREA TREND (2000 – 2010)
0-5
5-12.5
12.5-50
50-100
100-150
150 and above
10.1815.24
16.094.15
1.405.85
Farm Area (Mill Acres)
0-5
5-12.5
12.5-50
50-100
100-150
150 and above
19%29%30%
8%3%
11%
% to Total Farm Area
0-5
5-12.5
12.5-50
50-100
100-150
150 and above
5.351
2.0490.772
0.0670.0130.013
No. of Farms
0-5
5-12.5
12.5-50
50-100
100-150
150 and above
65%25%
9%1%0%0%
% to Total No. of Farms
(Million)
Source: Pakistan Bureau of Statistics
• 5.35 million farms cover less than 5 acre land which is 65% of the total farming community. These subsistence farmers occupy 10.18 million acres which is 19% of the total cultivated area.
• 2.05 million farms cover 5-12.5 acre of land which is 25% of the total farming community. These subsistence farmers occupy 15.24 million acres which is 29% of the total cultivated area.
• 0.87 million farms cover more than 12.5 acre land which is 10.31% of the total farming community. These medium to large farmers occupy 27.49 million acres which is 52% of the total cultivated area.
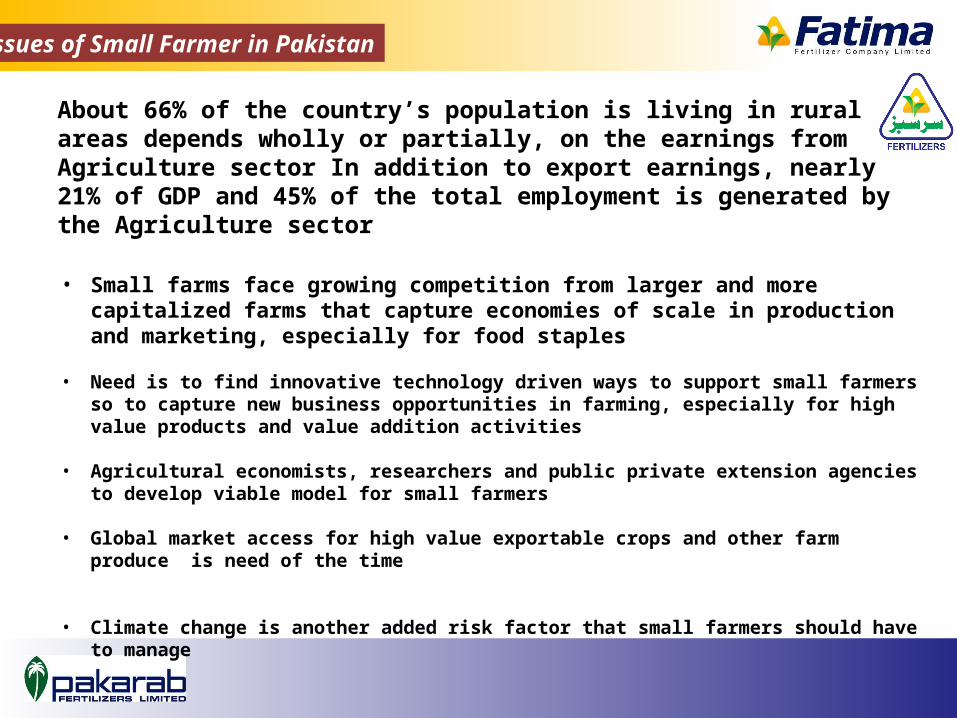
• Small farms face growing competition from larger and more capitalized farms that capture economies of scale in production and marketing, especially for food staples
• Need is to find innovative technology driven ways to support small farmers so to capture new business opportunities in farming, especially for high value products and value addition activities
• Agricultural economists, researchers and public private extension agencies to develop viable model for small farmers
• Global market access for high value exportable crops and other farm produce is need of the time
• Climate change is another added risk factor that small farmers should have to manage
Issues of Small Farmer in Pakistan
About 66% of the country’s population is living in rural areas depends wholly or partially, on the earnings from Agriculture sector In addition to export earnings, nearly 21% of GDP and 45% of the total employment is generated by the Agriculture sector

Area Prod Area Prod Area Prod Area Prod Area ProdCotton Sugarcane Rice Wheat Maize
2879
14800
1124
62472
23115541
8693
24231
10854631
Area under different crops (000 Hectares & Production (000Tons) Cotton in (000bales -
375lb each) -2012-13
Pakistan - Area under Major crops
The agriculture sector recorded a modest improvement, growing by 3.1 percent in FY12-13 compared to 2.4 percent in the previous year.
Wheat 41%Rice 14%
Maize 4%
Jawar/Bajra 2%Cotton 14%
Sugarcane 4% Oil Seeds 2% Pulses 5% Orchards 2%Fodders 9%
Others 4%
% SHARE OF VARIOUS CROPS IN CROPPED AREA- PAKISTANAGRICULTURAL CENSUS 2010

Wheat Cotton Sugarcane Rice
36%
14%
5%
10%
50%
25%
8% 6%
% Crop Area % Use of fertilizers
Source: NFDC; Industry experts
Highest usage in Wheat and Cotton
Fertilizer usage by crop (‘000 tons)Soil Fertility StatusNutrient % DeficiencyOrganic Matter 100%Nitrogen 100%Phosphorus 80-90%Potassium 40-50%Zinc 60-70%Boron 30-40%Iron 20-30%
Reasons of Low fertility
I. Inherent – alluvial, Parent material
II. Leaching – Flood Irrigation, deforestation
III. Erosion - 2.2% forest area, 1,687,000 ha
IV. Fixation – Nutrients fixation due to alkalinity
V. Removal – Imbalance use of fertilizers
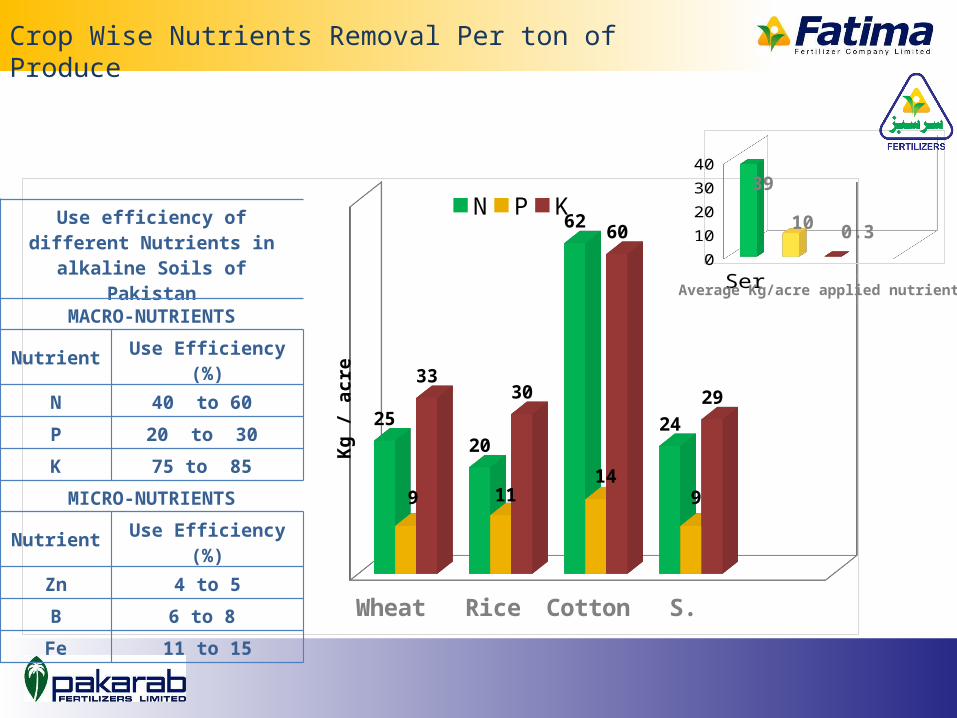
Wheat Rice Cotton S. Cane
2520
62
24
9 1114
9
3330
60
29
N P K
Kg
/ acr
e
Se-ries1
010203040
39
10 0.3
Crop Wise Nutrients Removal Per ton of Produce
Average Kg/acre applied nutrients
Use efficiency of different Nutrients in alkaline Soils of
Pakistan
MACRO-NUTRIENTS
Nutrient Use Efficiency (%)
N 40 to 60
P 20 to 30
K 75 to 85
MICRO-NUTRIENTS
Nutrient Use Efficiency (%)
Zn 4 to 5
B 6 to 8
Fe 11 to 15

Some important Facts
Impact of balanced use of fertilizer on yield kg/hCrop N Only NPK % Increase
Wheat 2,521 4,120 63
Rice 2,800 4,494 60
Maize 2,110 5,084 14
Sugarcane 56,515 126,334 123
NFDC Reports
15
25
35
45
55
65
1980 1983 1986 1989 1992 1995 1998 2001 2004 2007Long term study conducted by IFA for India, China and Pakistan revealed less grain yield due decline in N use efficiency because of imbalance use of fertilizer nutrients
Kg
Gra
ins
per K
g of
N u
sed
IndiaChina
Pakistan

ALL FARMS TRACTOR TUBEWELL THRESHER SHELLER COMBINED/ HARVESTER
REAPER/HARVESTER SEED DRILL SPRAY
MACHINE
8264480 737202 1086198 353768 42113 29344 66958 295184 14389918.9% 13.1% 4.3% 0.5% 0.4% 0.8% 3.6% 17.4%
SPRAY MACHINE
TUBEWELL
TRACTOR
THRESHER
SEED DRILL
REAPER/HARVESTER
SHELLER
COMBINED/ HARVESTER
0 100 200 300 400 500 600 700
14
19
28
58
69
305
485
696
Distribution of farm machinary on number of acres
Agricultural Census of Pakistan 2004
Primitive Nature of Agriculture
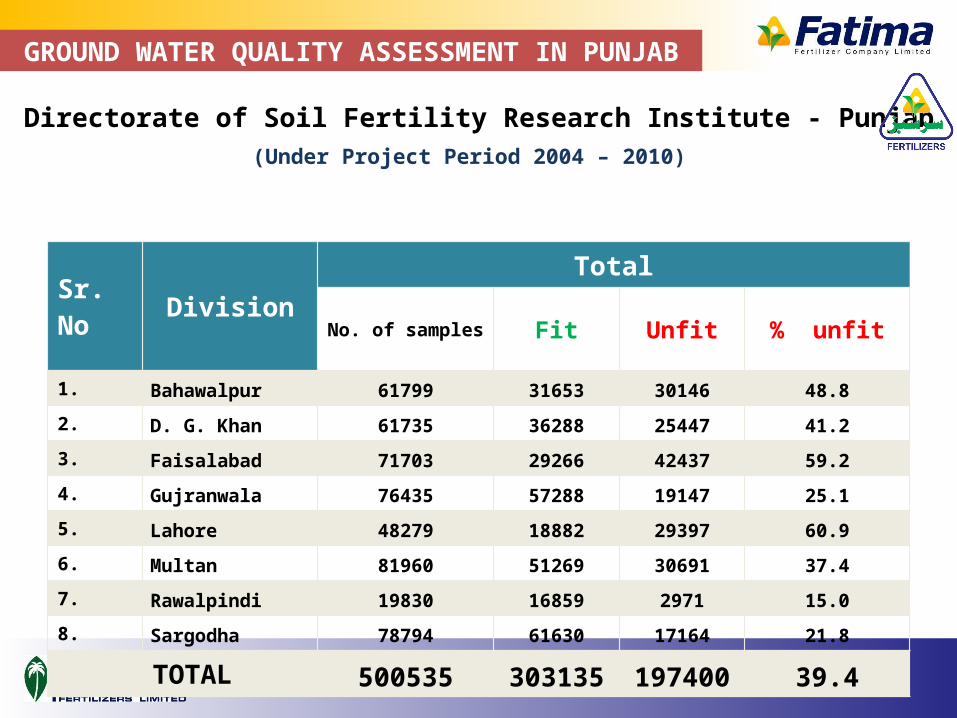
Sr. No DivisionTotal
No. of samples Fit Unfit % unfit1. Bahawalpur 61799 31653 30146 48.8
2. D. G. Khan 61735 36288 25447 41.23. Faisalabad 71703 29266 42437 59.24. Gujranwala 76435 57288 19147 25.15. Lahore 48279 18882 29397 60.96. Multan 81960 51269 30691 37.4
7. Rawalpindi 19830 16859 2971 15.08. Sargodha 78794 61630 17164 21.8
TOTAL 500535 303135 197400 39.4
(Under Project Period 2004 – 2010)
GROUND WATER QUALITY ASSESSMENT IN PUNJAB
Directorate of Soil Fertility Research Institute - Punjab
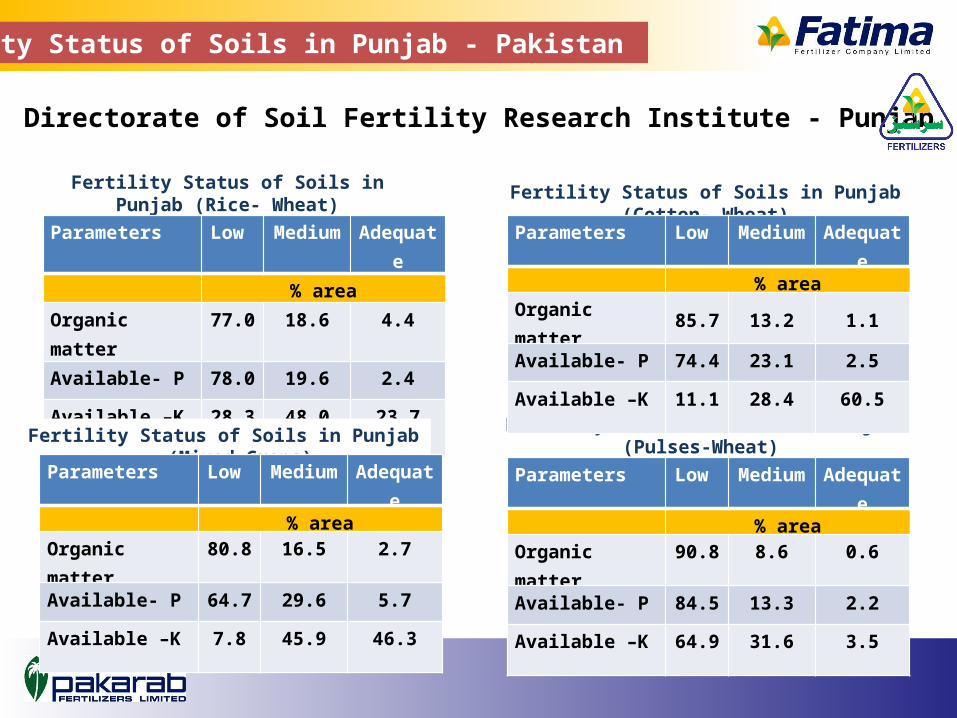
Fertility Status of Soils in Punjab (Rice- Wheat)
Parameters Low Medium Adequate
% areaOrganic matter 77.0 18.6 4.4
Available- P 78.0 19.6 2.4
Available –K 28.3 48.0 23.7
Fertility Status of Soils in Punjab (Cotton- Wheat)
Fertility Status of Soils in Punjab (Mixed Crops)
Fertility Status of Soils in Punjab - Pakistan
Fertility Status of Soils in Punjab (Pulses-Wheat)
Parameters Low Medium Adequate
% areaOrganic matter 85.7 13.2 1.1Available- P 74.4 23.1 2.5
Available –K 11.1 28.4 60.5
Parameters Low Medium Adequate
% areaOrganic matter 80.8 16.5 2.7
Available- P 64.7 29.6 5.7
Available –K 7.8 45.9 46.3
Parameters Low Medium Adequate
% areaOrganic matter 90.8 8.6 0.6
Available- P 84.5 13.3 2.2
Available –K 64.9 31.6 3.5
Directorate of Soil Fertility Research Institute - Punjab
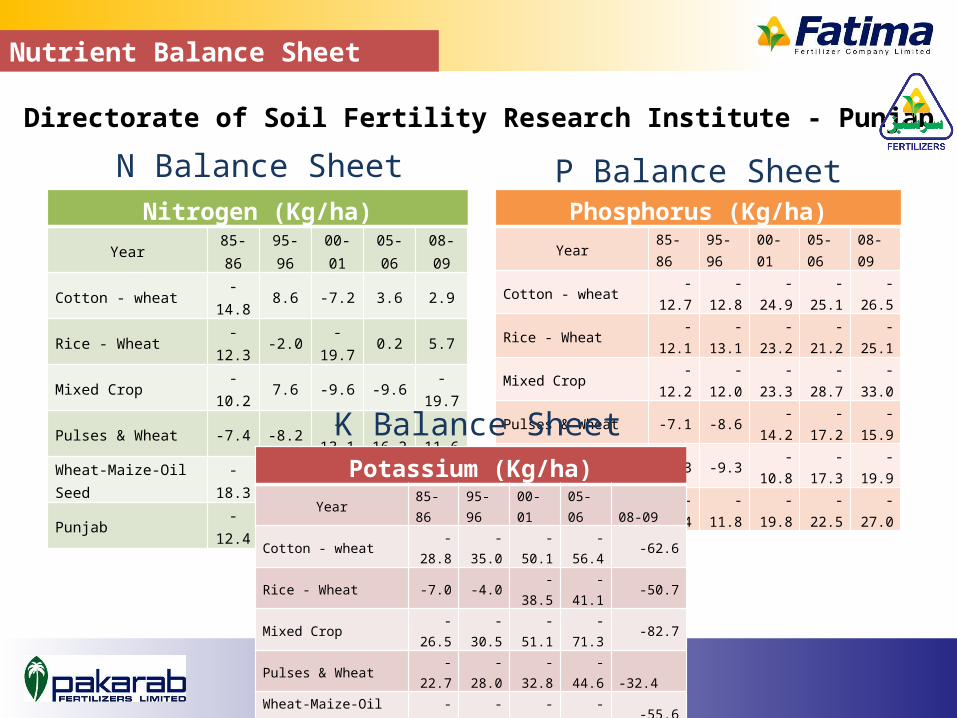
N Balance SheetNitrogen (Kg/ha)
Year 85-86 95-96 00-01 05-06 08-09
Cotton - wheat -14.8 8.6 -7.2 3.6 2.9
Rice - Wheat -12.3 -2.0 -19.7 0.2 5.7
Mixed Crop -10.2 7.6 -9.6 -9.6 -19.7
Pulses & Wheat -7.4 -8.2 -13.1 -16.2 -11.6
Wheat-Maize-Oil Seed -18.3 -18.9 -14.6 -25.4 -25.4
Punjab -12.4 2.4 -6.6 -3.8 -9.1
P Balance SheetPhosphorus (Kg/ha)
Year 85-86 95-96 00-01 05-06 08-09
Cotton - wheat -12.7 -12.8 -24.9 -25.1 -26.5
Rice - Wheat -12.1 -13.1 -23.2 -21.2 -25.1
Mixed Crop -12.2 -12.0 -23.3 -28.7 -33.0
Pulses & Wheat -7.1 -8.6 -14.2 -17.2 -15.9
Wheat-Maize-Oil Seed -8.3 -9.3 -10.8 -17.3 -19.9
Punjab -11.4 -11.8 -19.8 -22.5 -27.0
K Balance SheetPotassium (Kg/ha)
Year 85-86 95-96 00-01 05-06 08-09Cotton - wheat -28.8 -35.0 -50.1 -56.4 -62.6Rice - Wheat -7.0 -4.0 -38.5 -41.1 -50.7Mixed Crop -26.5 -30.5 -51.1 -71.3 -82.7
Pulses & Wheat -22.7 -28.0 -32.8 -44.6 -32.4
Wheat-Maize-Oil Seed -35.1 -37.9 -32.8 -50.3 -55.6Punjab -24.2 -27.9 -45.6 -56.5 -63.5
Nutrient Balance Sheet
Directorate of Soil Fertility Research Institute - Punjab

Up to 15 16 - 30 31 - 45 46 - 60 61 - 750.0
0.5
1.0
1.5
2.0
Age (Years)
Zn p
pm in
blo
od
Non diabetic
Diabetic
Comparative study on status of Zn in diabetic and non-diabetic males in Punjab, Pakistan.
African Journal of Pharmacy and Pharmacology Vol 6(20), 29 May 2013
Impact of Zn level in blood irrespective of age group• > 1 ppm No
diabetes• < 0.6 ppm All diabetic
Primary Reason of deficiency• Daily diet base 72% wheat• Zn in wheat grains 20 - 25 ppm• Human need 45 – 50 ppm• Daily deficit 25 – 30 ppm
Increasing Zn contents in food grains is the most economical and effective
method
Comparative study on status of Zn in diabetic and non-diabetics
0
10
20
30
40
50
60
70
80
50.690645161290345.4743548387097
NP & CAN DAP & UREA
MDs
/ACR
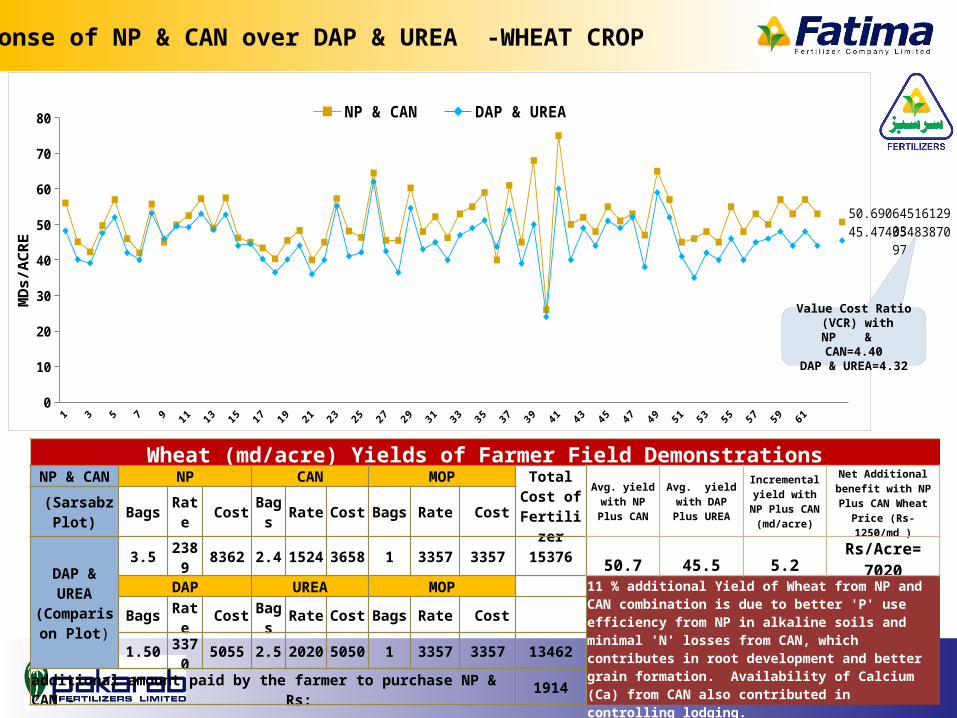
EResponse of NP & CAN over DAP & UREA -WHEAT CROP
Value Cost Ratio (VCR) with
NP & CAN=4.40DAP & UREA=4.32
Wheat (md/acre) Yields of Farmer Field DemonstrationsNP & CAN NP CAN MOP Total Cost
of Fertilizer
Avg. yield with NP Plus CAN
Avg. yield with DAP Plus UREA
Incremental yield with NP Plus CAN
(md/acre)
Net Additional benefit with NP Plus CAN Wheat
Price (Rs- 1250/md ) (Sarsabz Plot) Bags Rate Cost Bags Rate Cost Bags Rate Cost
DAP & UREA (Comparison
Plot)
3.5 2389 8362 2.4 1524 3658 1 3357 3357 15376 50.7 45.5 5.2 Rs/Acre= 7020DAP UREA MOP 11 % additional Yield of Wheat from NP and CAN combination
is due to better 'P' use efficiency from NP in alkaline soils and minimal 'N' losses from CAN, which contributes in root development and better grain formation. Availability of Calcium (Ca) from CAN also contributed in controlling lodging.
Bags Rate Cost Bags Rate Cost Bags Rate Cost 1.50 3370 5055 2.5 2020 5050 1 3357 3357 13462
additional amount paid by the farmer to purchase NP & CAN - Rs: 1914

Current Farming Crisis in PakistanFalling income, rising costs, declining yields

Declining prices of agricultural commodities and increased Inputs’ cost has created severe financial crisis for farmers
• Reduction in commodity prices
• Increase in input costs
o Imposition of 17% GST on all Agricultural inputs, since 2012
o Devaluation of Rs 21 or 25% against US $ in last five years, impacted imported inputs
o Significant increase in gas prices leading to increase in fertilizer and energy cost
Agricultural Commodities Vs Input Costs 2010 - 2015
CropPrice (Rs/md) Rupees per mound
variation in Commodity Prices
Inputs Inputs costs per acre Increased
Cost Rs/Acre2010 2015 2010 2015Wheat 950 1,300 350 UREA 710 1900 1190Cotton 3,800 2,500 -1300 DAP 1900 3200 1300Rice 2000 900 -1100 Land Preparation 2800 5000 2200Maize 1080 800 -280 Irrigation 2400 8000 5600Sugarcane 125 180 55 Pesticide 1000 3200 2200
Source: NFDC for Fertilizer prices, other input costs calculations are derived from the farmers of different cropping zones
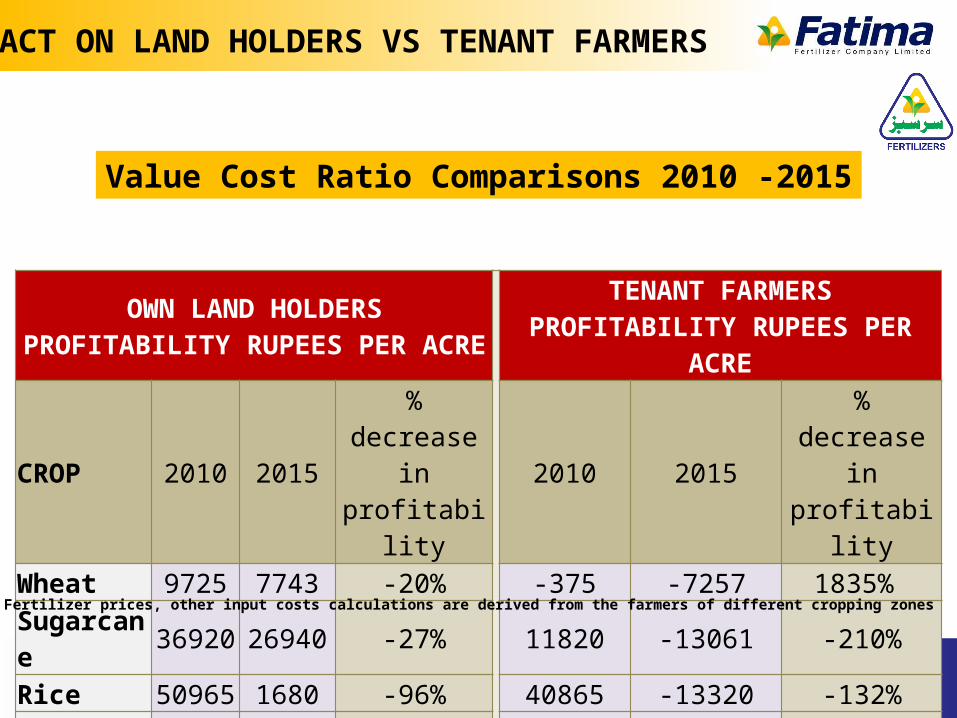
OWN LAND HOLDERS PROFITABILITY RUPEES PER ACRE
TENANT FARMERS PROFITABILITY RUPEES PER ACRE
CROP 2010 2015 % decrease in profitability 2010 2015 % decrease in
profitabilityWheat 9725 7743 -20% -375 -7257 1835% Sugarcane 36920 26940 -27% 11820 -13061 -210%Rice 50965 1680 -96% 40865 -13320 -132%Cotton 18780 -3707 -119% 8680 -18707 -315%Maize 49855 14414 -71% 43755 -5586 -112%
Value Cost Ratio Comparisons 2010 -2015
IMPACT ON LAND HOLDERS VS TENANT FARMERS
Source: NFDC for Fertilizer prices, other input costs calculations are derived from the farmers of different cropping zones
• 30 to 50% increase in average yield can be attained with balanced fertilizer use.
• Pakistan has 17 public research institutes engaged in development of new varieties and support services to the farmer community.
• There are 17 agricultural universities/ colleges involved in agricultural research and education
• Provincial extension department, fertilizer industry and agro based multinationals are also engaged in farmers education and training programs
Opportunities and Available Support
To bring sustainable growth in crop sector, farmer’s easy access to quality seeds, awareness to safe and selective pesticides and IT support are crucial needs of the time.
Holistic Approach For Narrowing The Per Acre Yield Gap
A. Need is to develop viable model for small farmers
B. A significant need to stress the balanced use of fertilizers
C. Need is to stimulate agricultural R & D to encounter with current and future challenges
D. Need for water conservation, storage and usage policy
E. Area Specific Dry Land Technologies Research Needs
F. Reclamation of Saline and saline Sodic Soils

Thanks!