dr. stephen koontz - thinning cash fed cattle trade: how thin is too thin & what to do about it?
TRANSCRIPT
Price Discovery Issues for Fed Cattle:
What’s the Future of the Cash Market
or How Thin Is Too Thin?
Stephen R. Koontz
Professor & extension economist
Department of Agricultural & Resource Economics
Colorado State University
http://webdoc.agsci.colostate.edu/koontz
December, 2014
Des Moines, IA
Objectives
• What is going on in terms of the use of fed cattle
markets?
• What is thinning cash trade and what’s the problem?
• Research results – in the context of the NCBA project.
• Talk through recommendations for the NCBA.
0%
10%
20%
30%
40%
50%
60%
70%
80%Percent
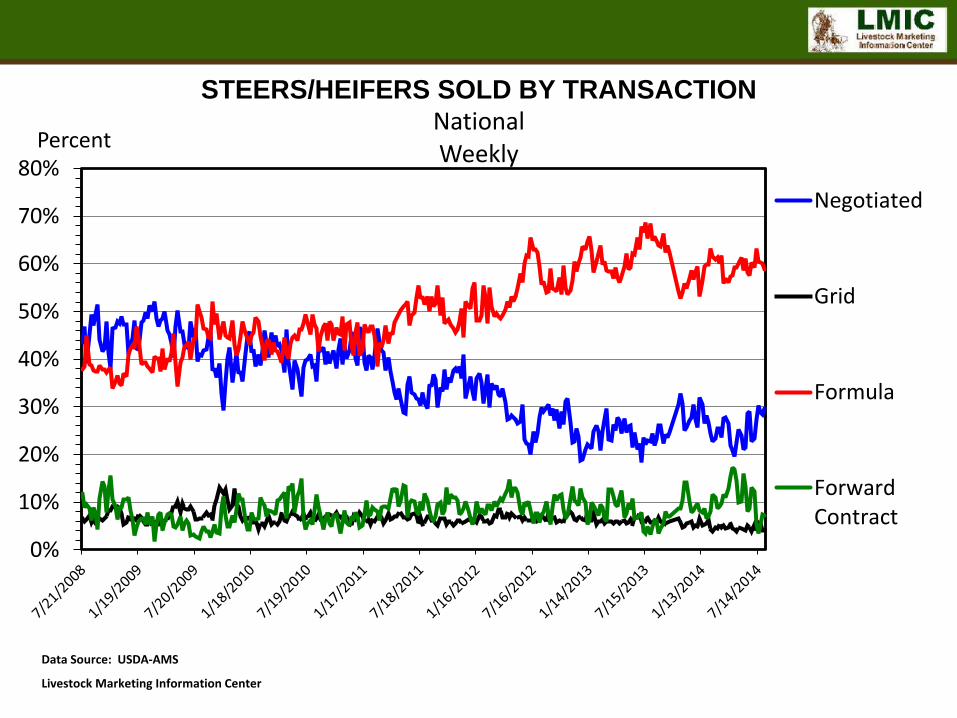
STEERS/HEIFERS SOLD BY TRANSACTIONNationalWeekly
Negotiated
Grid
Formula
ForwardContract
Data Source: USDA-AMS
Livestock Marketing Information Center
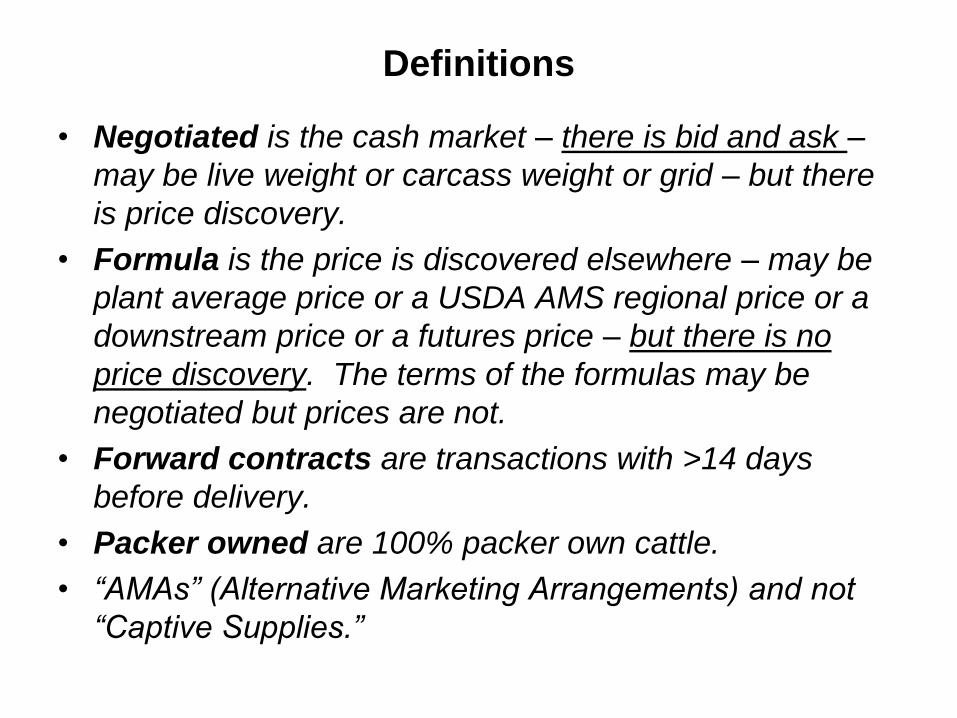
Definitions
• Negotiated is the cash market – there is bid and ask –
may be live weight or carcass weight or grid – but there
is price discovery.
• Formula is the price is discovered elsewhere – may be
plant average price or a USDA AMS regional price or a
downstream price or a futures price – but there is no
price discovery. The terms of the formulas may be
negotiated but prices are not.
• Forward contracts are transactions with >14 days
before delivery.
• Packer owned are 100% packer own cattle.
• “AMAs” (Alternative Marketing Arrangements) and not
“Captive Supplies.”

0%
10%
20%
30%
40%
50%
60%
70%
80%
90%
100%Percent
STEERS/HEIFERS SOLD BY TRANSACTIONTexas, Oklahoma & New Mexico
Weekly
Negotiated
NegotiatedGrid
Formula
ForwardContract
Data Source: USDA-AMS
Livestock Marketing Information Center
0%
20%
40%
60%
80%
100%
Percent
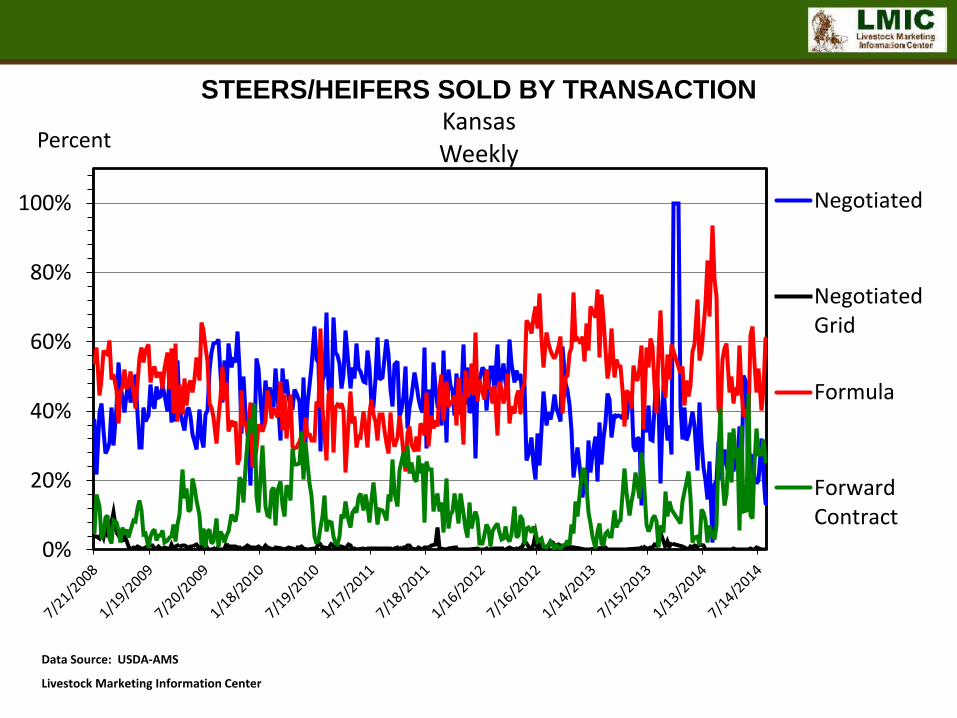
STEERS/HEIFERS SOLD BY TRANSACTIONKansasWeekly
Negotiated
NegotiatedGrid
Formula
ForwardContract
Data Source: USDA-AMS
Livestock Marketing Information Center

0%
10%
20%
30%
40%
50%
60%
70%
80%
90%
100%Percent
STEERS/HEIFERS SOLD BY TRANSACTIONNebraskaWeekly
Negotiated
NegotiatedGrid
Formula
ForwardContract
Data Source: USDA-AMS
Livestock Marketing Information Center
0%
5%
10%
15%
20%
25%
30%
35%
40%
45%
50%Percent
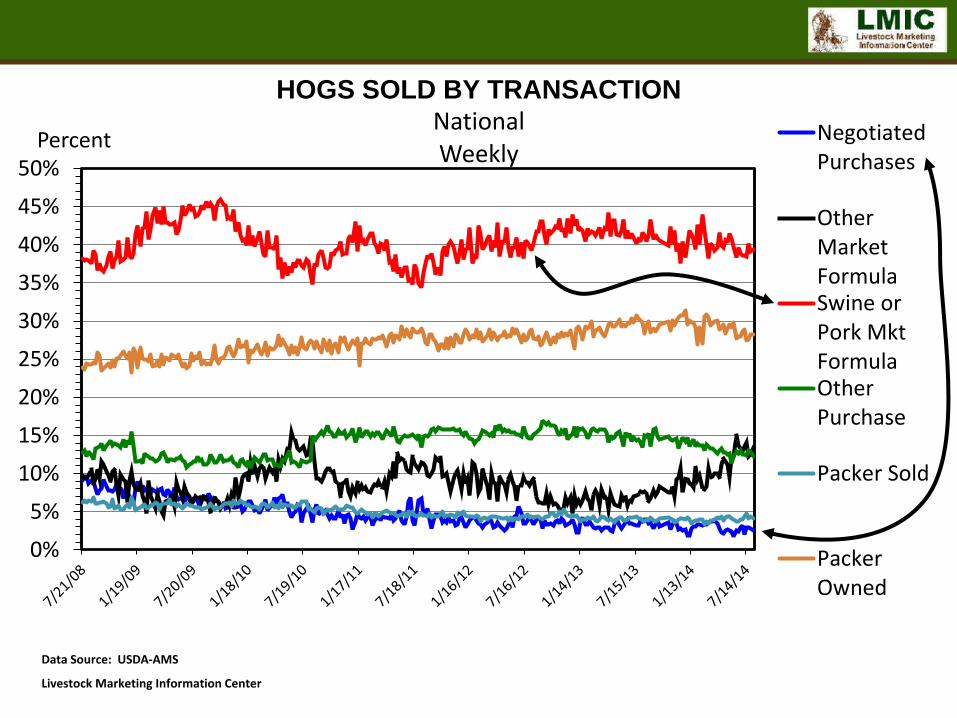
HOGS SOLD BY TRANSACTIONNationalWeekly
NegotiatedPurchases
OtherMarketFormulaSwine orPork MktFormulaOtherPurchase
Packer Sold
PackerOwned
Data Source: USDA-AMS
Livestock Marketing Information Center
0%
10%
20%
30%
40%
50%
60%
70%Percent
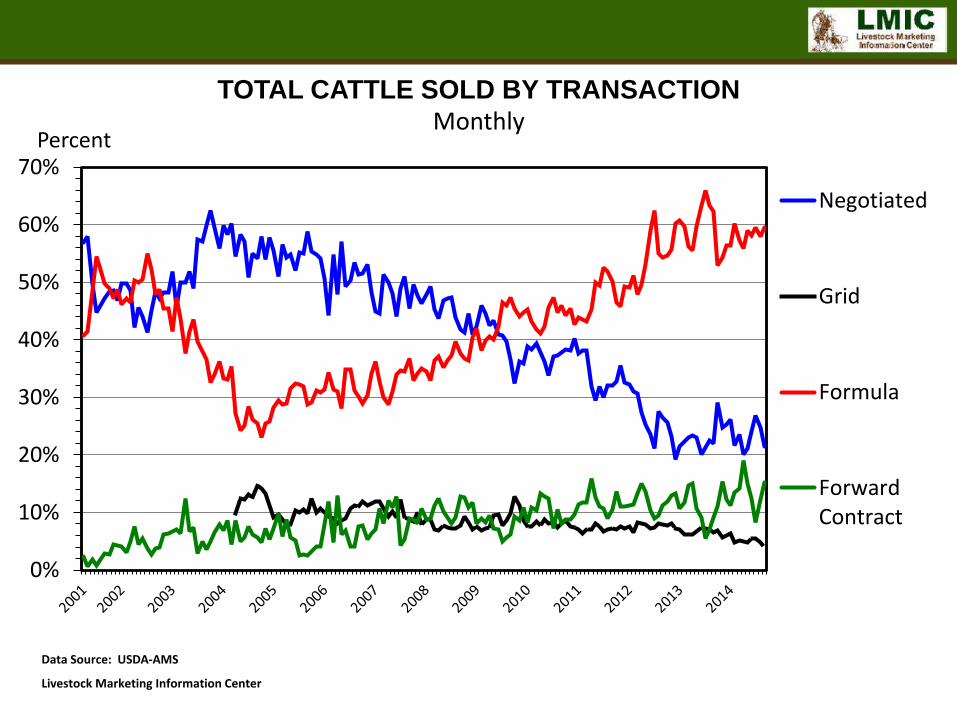
TOTAL CATTLE SOLD BY TRANSACTIONMonthly
Negotiated
Grid
Formula
ForwardContract
Data Source: USDA-AMS
Livestock Marketing Information Center
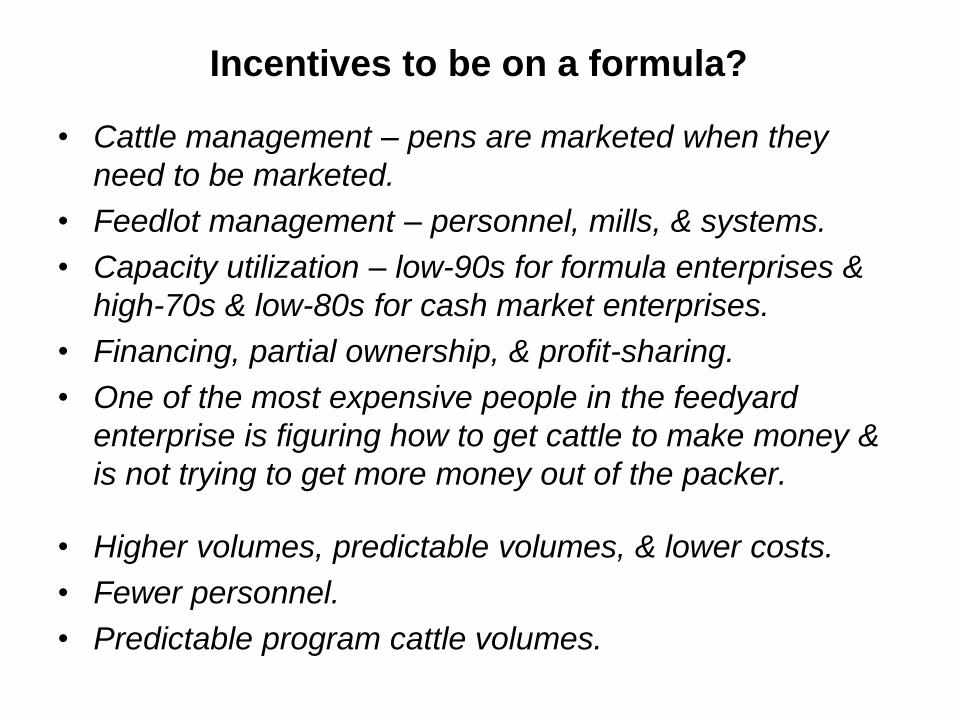
Incentives to be on a formula?
• Cattle management – pens are marketed when they
need to be marketed.
• Feedlot management – personnel, mills, & systems.
• Capacity utilization – low-90s for formula enterprises &
high-70s & low-80s for cash market enterprises.
• Financing, partial ownership, & profit-sharing.
• One of the most expensive people in the feedyard
enterprise is figuring how to get cattle to make money &
is not trying to get more money out of the packer.
• Higher volumes, predictable volumes, & lower costs.
• Fewer personnel.
• Predictable program cattle volumes.
What do we know from AMA Research?
• AMAs are not used to manipulate the cash market price.
• AMAs appear to be demand enhancing.
• AMAs are cost reducing. Packers are more efficient &
feeding enterprises are more efficient.
– No sweet-deals & no coercion.
• AMAs benefit consumers (& all downstream firms), cow-
calf producers (& all upstream firms), & feeding
enterprises that use them. ($9.5 billion in $2003 or
13.8% of a measure of producer economic wellbeing.)
• Just because AMAs are beneficial does not mean that
the cash market should be displaced.
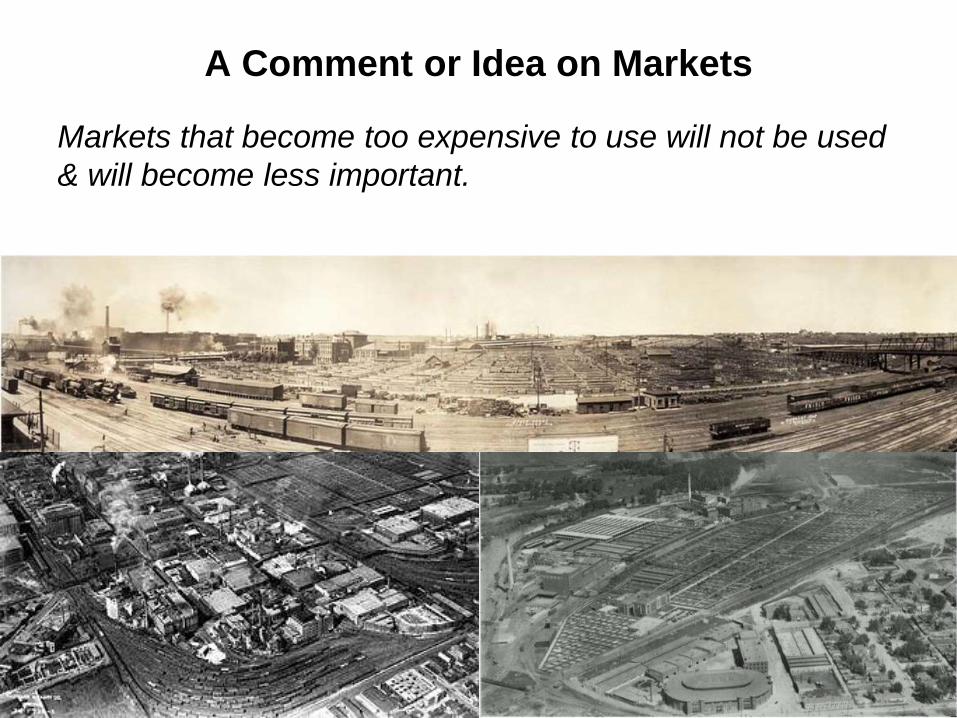
A Comment or Idea on Markets
Markets that become too expensive to use will not be used
& will become less important.
What’s Next?
• The livestock industry wants price information...
– To use as base prices for formula transactions.
– To provide basis information in forward contracts.
– So that there is benchmarking information in evaluating profitability & returns to investment.
• But that industry wants to be able to not use those markets and to not have to do the work of price discovery.
• So negotiated cash trade of fed cattle is next. It will remain small, will shrink further, and will concentrate in some regions...
• And negotiated cash trade of beef has the same problem.
• And this makes problems live cattle for futures contracts.
Example of Public Good
• Suppose a group of cow-calf producers do not have enough of their own land to graze all their animals but have access to common land.
• What happens to that common property?
– It will be over-grazed – or over used.
– Same outcome occurs for open-access fisheries.
• Public goods are overused because each individual does not pay their specific full individual cost.
• There is no market solution to the problem.
• Solution requires collective action – usually through government but an association of interested parties can work – with authority to say who uses, provides & pays for the public good.
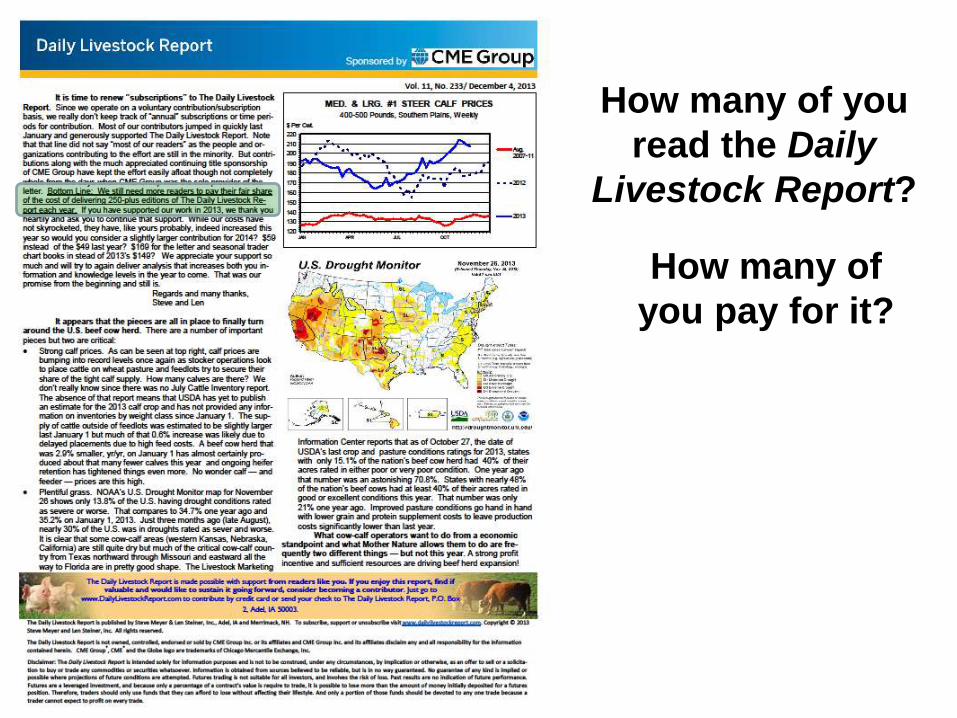
How many of you
read the Daily
Livestock Report?
How many of
you pay for it?

Price Discovery is a Public Good
• Cash market participants invest resources to negotiate & discover cash market prices.
• Formula operations save that investment & make use of the prices discovered by the cash market participants.
• It is exactly the tragedy of the commons. Formula operations use the outcome of the investment by cash market operations without paying.
• Research and group action are needed.
– This is not an “it depends” economist answer. There are questions the answer we don’t know.
– Objective information is needed to support the making of good decisions.
• There will not be a market solution and my evidence is hogs, dairy, fruits & vegetables…

What is cash market information worth?
• What is having a reported cash market price worth?
What is cash volume information worth? What are grid
prices (premiums/discounts) worth?
– What would you be willing to pay to get them?
– What would you be willing to be paid to do that work?
• If the answers are close to “nothing” – well then there’s
your cash market – because we know the AMAs have
substantial value.
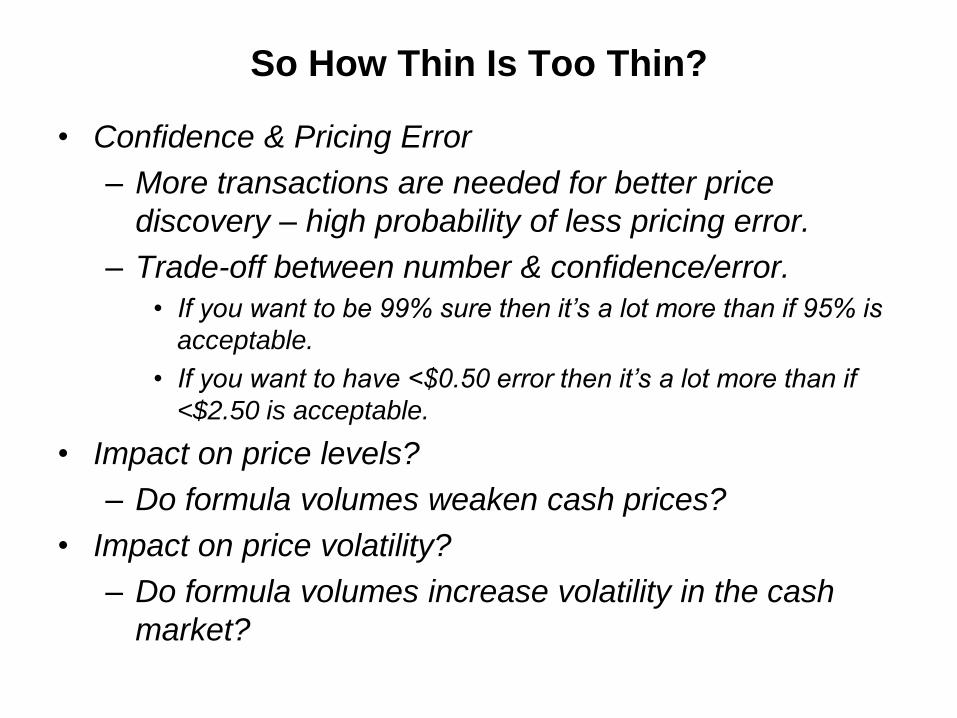
So How Thin Is Too Thin?
• Confidence & Pricing Error
– More transactions are needed for better price
discovery – high probability of less pricing error.
– Trade-off between number & confidence/error.
• If you want to be 99% sure then it’s a lot more than if 95% is
acceptable.
• If you want to have <$0.50 error then it’s a lot more than if
<$2.50 is acceptable.
• Impact on price levels?
– Do formula volumes weaken cash prices?
• Impact on price volatility?
– Do formula volumes increase volatility in the cash
market?
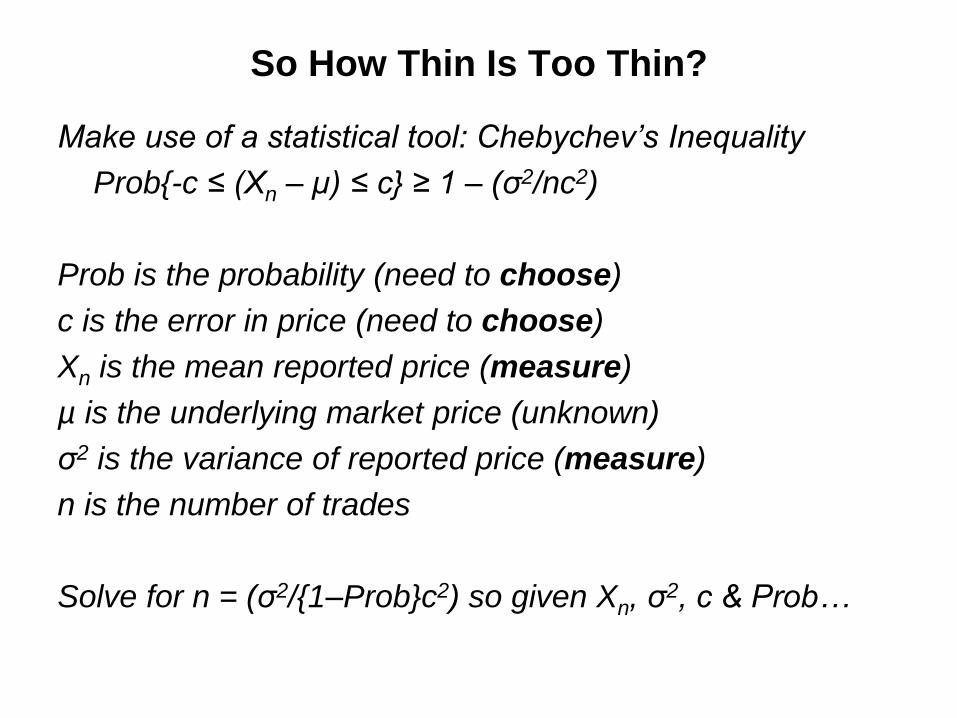
So How Thin Is Too Thin?
Make use of a statistical tool: Chebychev’s Inequality
Prob{-c ≤ (Xn – µ) ≤ c} ≥ 1 – (σ2/nc2)
Prob is the probability (need to choose)
c is the error in price (need to choose)
Xn is the mean reported price (measure)
µ is the underlying market price (unknown)
σ2 is the variance of reported price (measure)
n is the number of trades
Solve for n = (σ2/{1–Prob}c2) so given Xn, σ2, c & Prob…
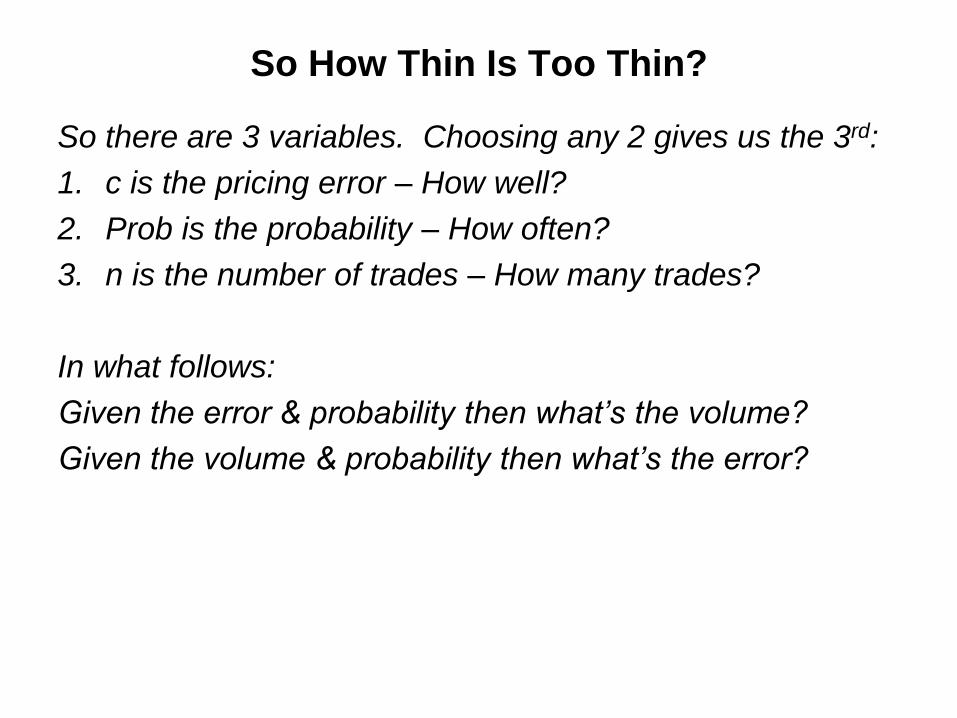
So How Thin Is Too Thin?
So there are 3 variables. Choosing any 2 gives us the 3rd:
1. c is the pricing error – How well?
2. Prob is the probability – How often?
3. n is the number of trades – How many trades?
In what follows:
Given the error & probability then what’s the volume?
Given the volume & probability then what’s the error?
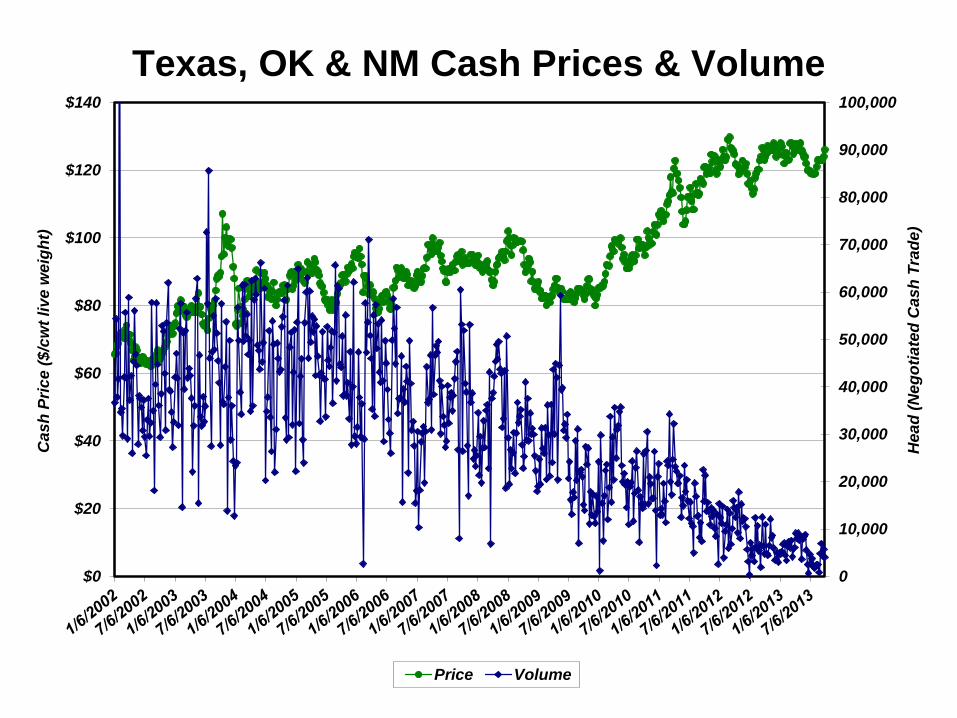
Texas, OK & NM Cash Prices & Volume
0
10,000
20,000
30,000
40,000
50,000
60,000
70,000
80,000
90,000
100,000
$0
$20
$40
$60
$80
$100
$120
$140
Hea
d (
Ne
go
tia
ted
Ca
sh
Tra
de
)
Cas
h P
ric
e (
$/c
wt
liv
e w
eig
ht)
Price Volume
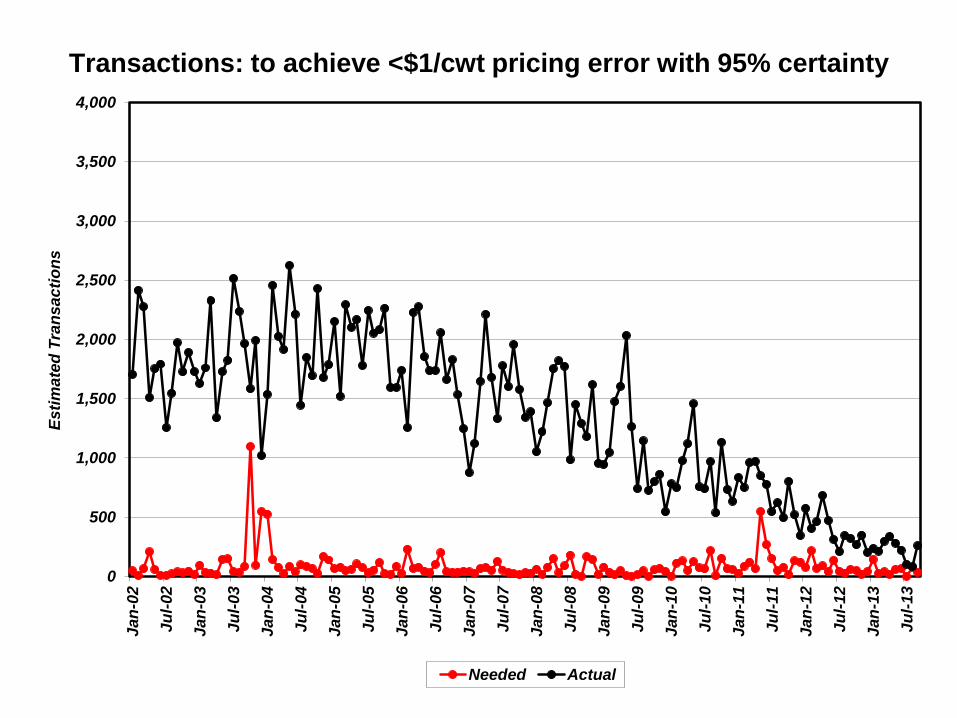
Transactions: to achieve <$1/cwt pricing error with 95% certainty
0
500
1,000
1,500
2,000
2,500
3,000
3,500
4,000
Jan
-02
Ju
l-02
Jan
-03
Ju
l-03
Jan
-04
Ju
l-04
Jan
-05
Ju
l-05
Jan
-06
Ju
l-06
Jan
-07
Ju
l-07
Jan
-08
Ju
l-08
Jan
-09
Ju
l-09
Jan
-10
Ju
l-10
Jan
-11
Ju
l-11
Jan
-12
Ju
l-12
Jan
-13
Ju
l-13
Es
tim
ate
d T
ran
sa
cti
on
s
Needed Actual

Pricing Error at 95% & 99% Needed Confidence
$0.00
$0.50
$1.00
$1.50
$2.00
$2.50
$3.00
Jan
-02
Ju
l-02
Jan
-03
Ju
l-03
Jan
-04
Ju
l-04
Jan
-05
Ju
l-05
Jan
-06
Ju
l-06
Jan
-07
Ju
l-07
Jan
-08
Ju
l-08
Jan
-09
Ju
l-09
Jan
-10
Ju
l-10
Jan
-11
Ju
l-11
Jan
-12
Ju
l-12
Jan
-13
Ju
l-13
Cas
h P
ric
e (
$/c
wt
liv
e w
eig
ht)
95% Pricing Error 99% Pricing Error
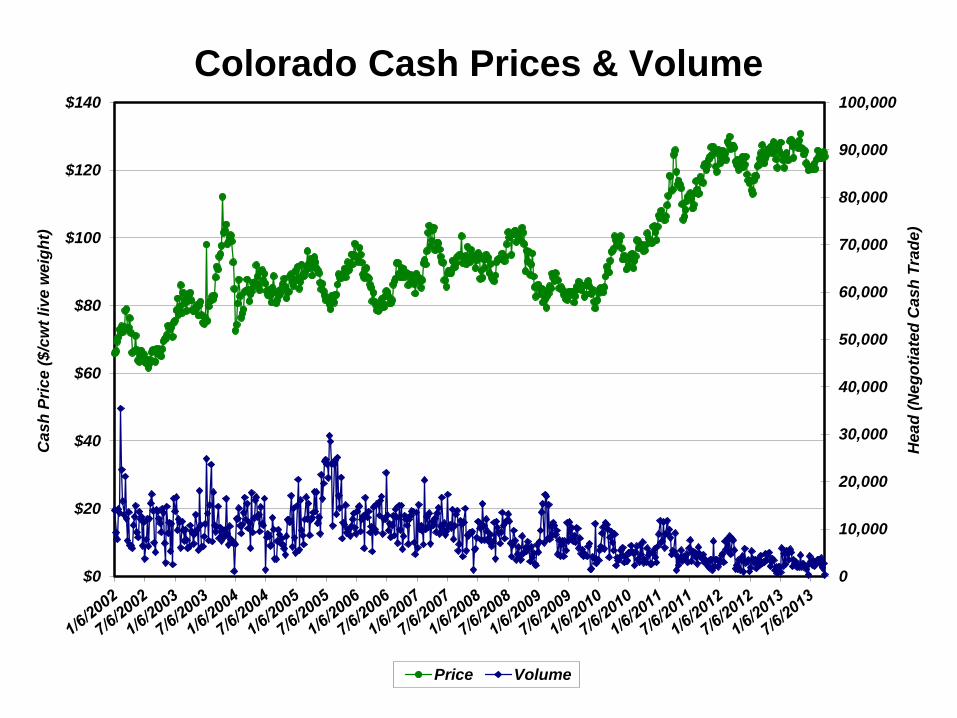
Colorado Cash Prices & Volume
0
10,000
20,000
30,000
40,000
50,000
60,000
70,000
80,000
90,000
100,000
$0
$20
$40
$60
$80
$100
$120
$140
Hea
d (
Ne
go
tia
ted
Ca
sh
Tra
de
)
Cas
h P
ric
e (
$/c
wt
liv
e w
eig
ht)
Price Volume
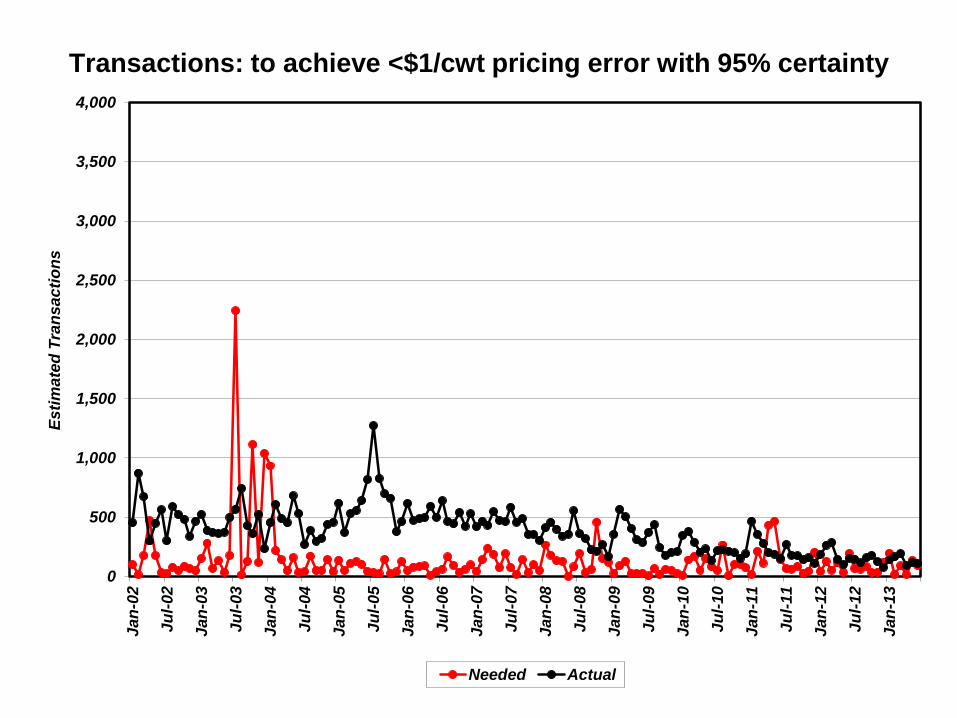
Transactions: to achieve <$1/cwt pricing error with 95% certainty
0
500
1,000
1,500
2,000
2,500
3,000
3,500
4,000
Jan
-02
Ju
l-02
Jan
-03
Ju
l-03
Jan
-04
Ju
l-04
Jan
-05
Ju
l-05
Jan
-06
Ju
l-06
Jan
-07
Ju
l-07
Jan
-08
Ju
l-08
Jan
-09
Ju
l-09
Jan
-10
Ju
l-10
Jan
-11
Ju
l-11
Jan
-12
Ju
l-12
Jan
-13
Es
tim
ate
d T
ran
sa
cti
on
s
Needed Actual
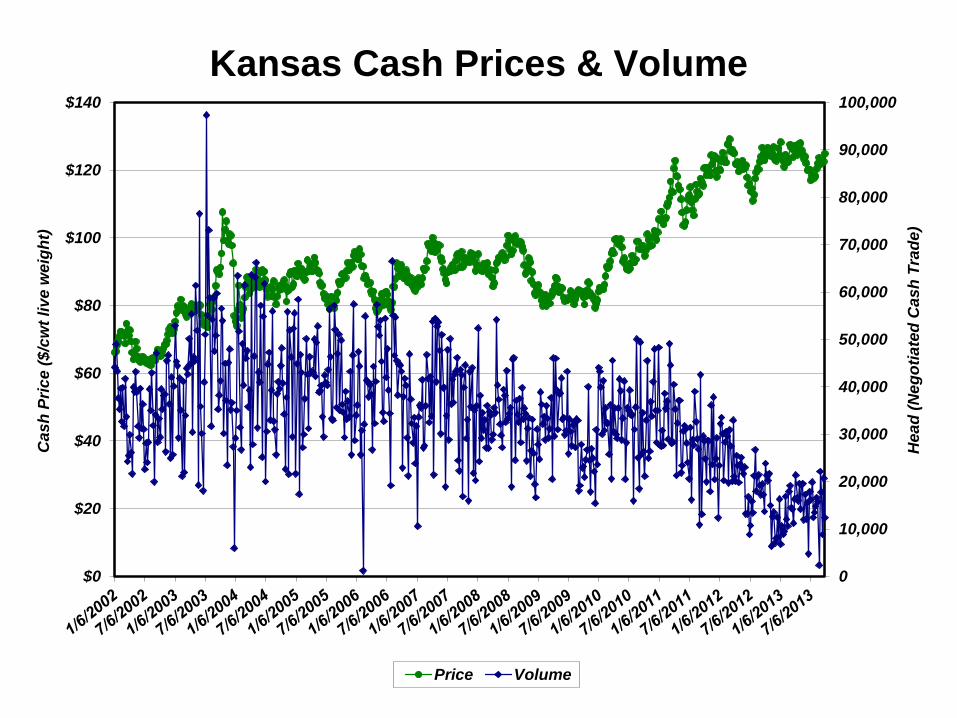
Kansas Cash Prices & Volume
0
10,000
20,000
30,000
40,000
50,000
60,000
70,000
80,000
90,000
100,000
$0
$20
$40
$60
$80
$100
$120
$140
Hea
d (
Ne
go
tia
ted
Ca
sh
Tra
de
)
Cas
h P
ric
e (
$/c
wt
liv
e w
eig
ht)
Price Volume

Transactions: to achieve <$1/cwt pricing error with 95% certainty
0
500
1,000
1,500
2,000
2,500
3,000
3,500
4,000
Jan
-02
Ju
l-02
Jan
-03
Ju
l-03
Jan
-04
Ju
l-04
Jan
-05
Ju
l-05
Jan
-06
Ju
l-06
Jan
-07
Ju
l-07
Jan
-08
Ju
l-08
Jan
-09
Ju
l-09
Jan
-10
Ju
l-10
Jan
-11
Ju
l-11
Jan
-12
Ju
l-12
Jan
-13
Ju
l-13
Es
tim
ate
d T
ran
sa
cti
on
s
Needed Actual
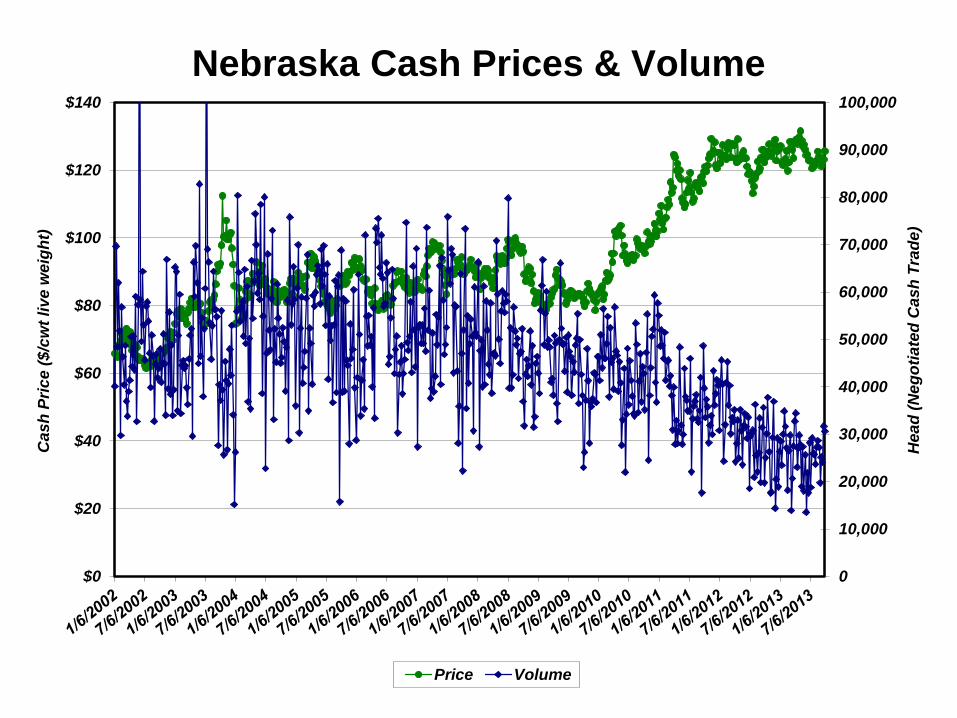
Nebraska Cash Prices & Volume
0
10,000
20,000
30,000
40,000
50,000
60,000
70,000
80,000
90,000
100,000
$0
$20
$40
$60
$80
$100
$120
$140
Hea
d (
Ne
go
tia
ted
Ca
sh
Tra
de
)
Cas
h P
ric
e (
$/c
wt
liv
e w
eig
ht)
Price Volume

Transactions: to achieve <$1/cwt pricing error with 95% certainty
0
500
1,000
1,500
2,000
2,500
3,000
3,500
4,000
Es
tim
ate
d T
ran
sa
cti
on
s
Needed Actual
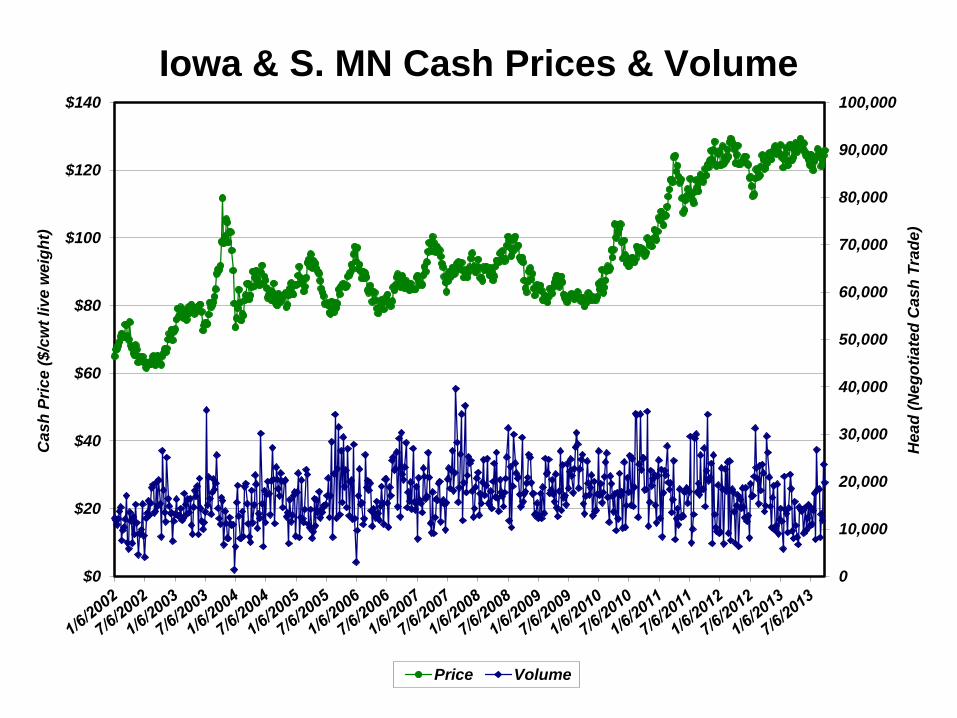
Iowa & S. MN Cash Prices & Volume
0
10,000
20,000
30,000
40,000
50,000
60,000
70,000
80,000
90,000
100,000
$0
$20
$40
$60
$80
$100
$120
$140
Hea
d (
Ne
go
tia
ted
Ca
sh
Tra
de
)
Cas
h P
ric
e (
$/c
wt
liv
e w
eig
ht)
Price Volume
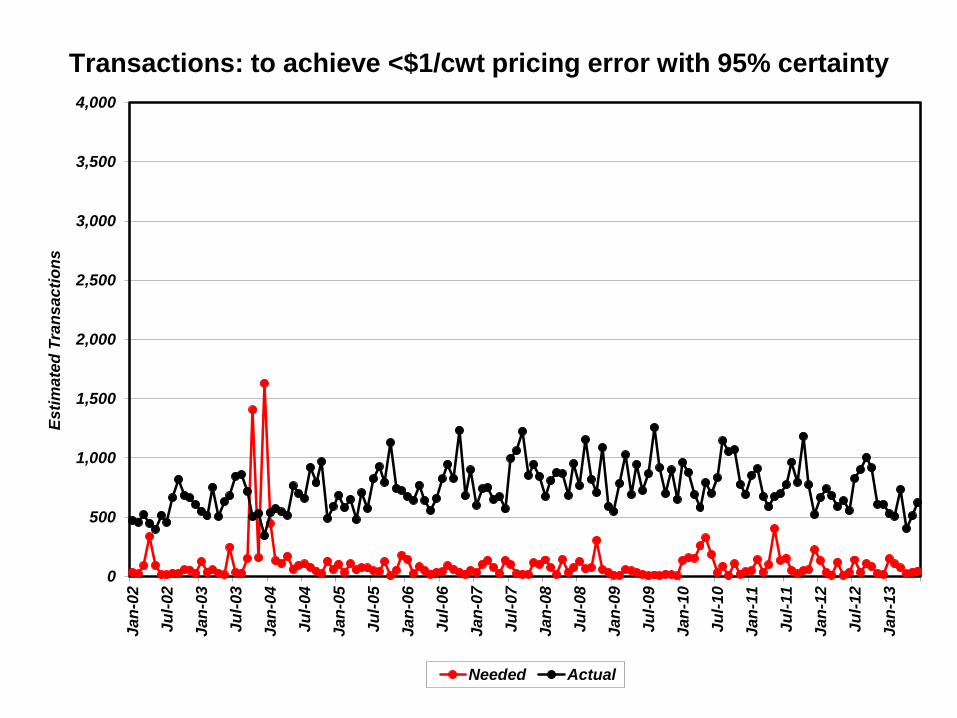
Transactions: to achieve <$1/cwt pricing error with 95% certainty
0
500
1,000
1,500
2,000
2,500
3,000
3,500
4,000
Jan
-02
Ju
l-02
Jan
-03
Ju
l-03
Jan
-04
Ju
l-04
Jan
-05
Ju
l-05
Jan
-06
Ju
l-06
Jan
-07
Ju
l-07
Jan
-08
Ju
l-08
Jan
-09
Ju
l-09
Jan
-10
Ju
l-10
Jan
-11
Ju
l-11
Jan
-12
Ju
l-12
Jan
-13
Es
tim
ate
d T
ran
sa
cti
on
s
Needed Actual
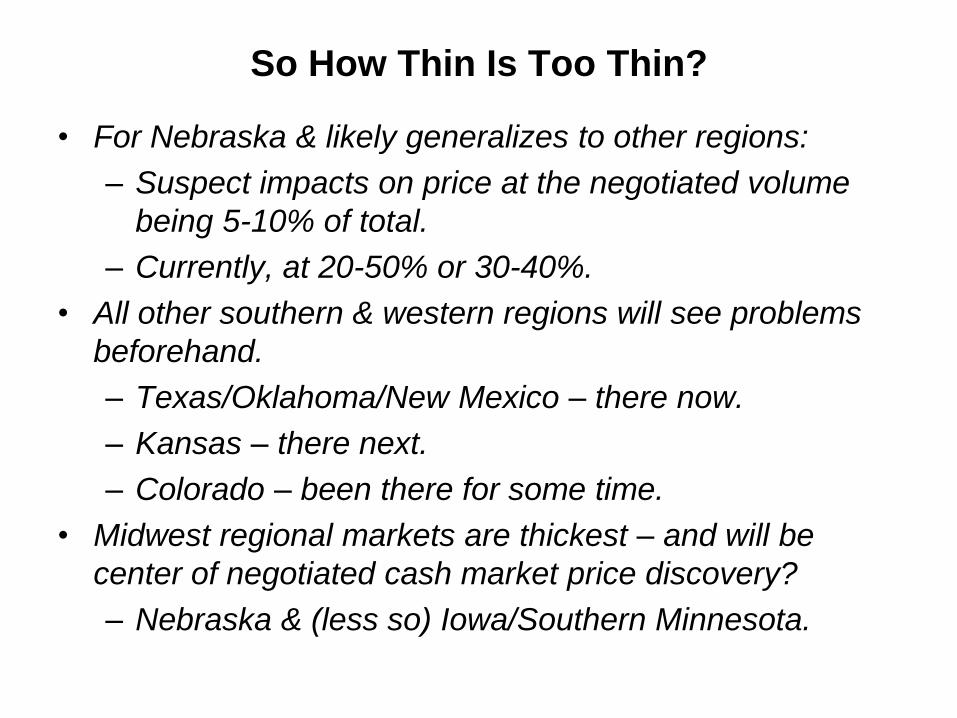
So How Thin Is Too Thin?
• For Nebraska & likely generalizes to other regions:
– Suspect impacts on price at the negotiated volume
being 5-10% of total.
– Currently, at 20-50% or 30-40%.
• All other southern & western regions will see problems
beforehand.
– Texas/Oklahoma/New Mexico – there now.
– Kansas – there next.
– Colorado – been there for some time.
• Midwest regional markets are thickest – and will be
center of negotiated cash market price discovery?
– Nebraska & (less so) Iowa/Southern Minnesota.
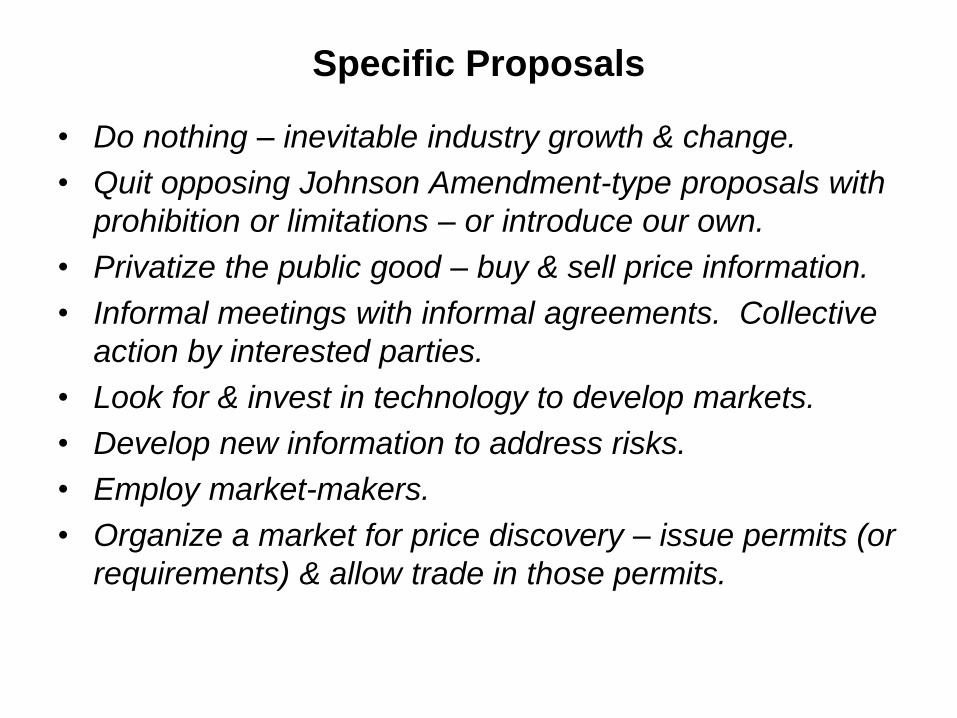
Specific Proposals
• Do nothing – inevitable industry growth & change.
• Quit opposing Johnson Amendment-type proposals with
prohibition or limitations – or introduce our own.
• Privatize the public good – buy & sell price information.
• Informal meetings with informal agreements. Collective
action by interested parties.
• Look for & invest in technology to develop markets.
• Develop new information to address risks.
• Employ market-makers.
• Organize a market for price discovery – issue permits (or
requirements) & allow trade in those permits.
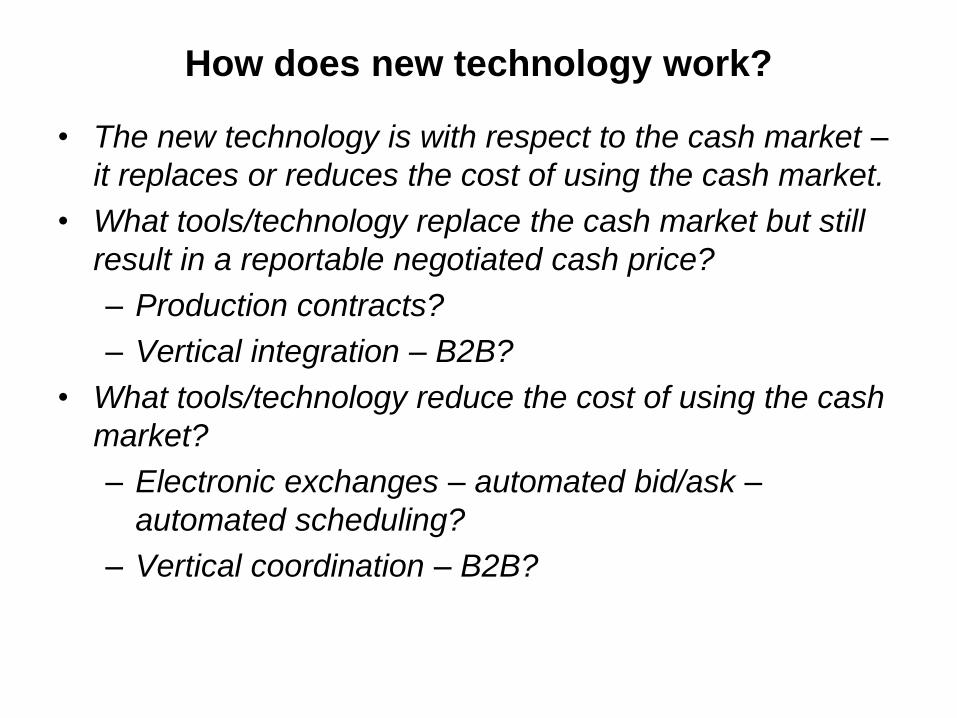
How does new technology work?
• The new technology is with respect to the cash market –
it replaces or reduces the cost of using the cash market.
• What tools/technology replace the cash market but still
result in a reportable negotiated cash price?
– Production contracts?
– Vertical integration – B2B?
• What tools/technology reduce the cost of using the cash
market?
– Electronic exchanges – automated bid/ask –
automated scheduling?
– Vertical coordination – B2B?
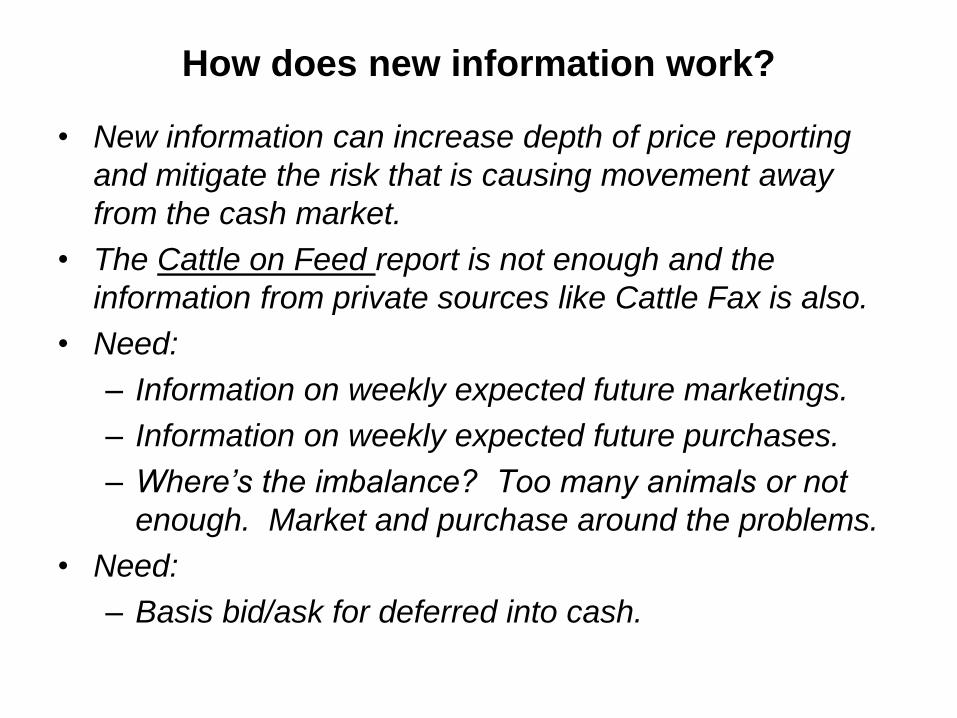
How does new information work?
• New information can increase depth of price reporting
and mitigate the risk that is causing movement away
from the cash market.
• The Cattle on Feed report is not enough and the
information from private sources like Cattle Fax is also.
• Need:
– Information on weekly expected future marketings.
– Information on weekly expected future purchases.
– Where’s the imbalance? Too many animals or not
enough. Market and purchase around the problems.
• Need:
– Basis bid/ask for deferred into cash.
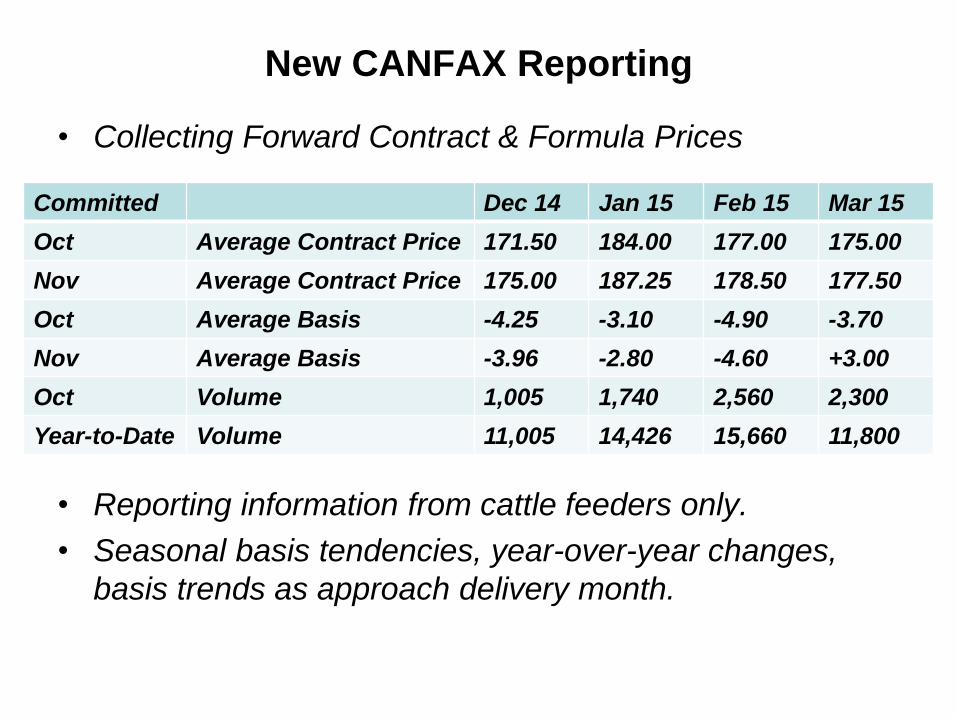
New CANFAX Reporting
• Collecting Forward Contract & Formula Prices
• Reporting information from cattle feeders only.
• Seasonal basis tendencies, year-over-year changes,
basis trends as approach delivery month.
Committed Dec 14 Jan 15 Feb 15 Mar 15
Oct Average Contract Price 171.50 184.00 177.00 175.00
Nov Average Contract Price 175.00 187.25 178.50 177.50
Oct Average Basis -4.25 -3.10 -4.90 -3.70
Nov Average Basis -3.96 -2.80 -4.60 +3.00
Oct Volume 1,005 1,740 2,560 2,300
Year-to-Date Volume 11,005 14,426 15,660 11,800
How do market-makers work?
• All stock markets – even e-markets – employ market makers and multiple market makers for a given security.
• Successful because if you trade the stock then you will use the market maker – so they generate commissions.
• The fed cattle industry will have to pay market makers or allocate animals to which the market maker can earn a commission.
How does the tradable permit market work?
• Choose a volume for the cash market, e.g., 10%.
• Issue permits to the largest cattle feeders & stop with some designated modest size.
– Formula feeders will want to sell (pay to get rid of) permits & cash feeders will want to purchase (be compensated).
– And there will be a cash fed cattle market.
• The permit market will provide information as to how much price discovery is wanted/needed.
– High priced permits implies the % was too large.
– Low priced permits implies the % was too small.
– But there are issues with regions…
– Should the market be closed?
Final Comment on Markets
• Free markets are not free.
• Markets require & consume resources for use,
maintenance, & development.
• We all want the information that comes from markets but
we also want the option to not use them.
• Make market function & survival the result of an industry-
level decision & not something that just happens.
• Will need to take group action & do something specific to
maintain & protect the negotiated cash fed cattle market.
• Need to remember the Public Good aspect of price
discovery – and information in general.