dr syed-ibrar-value-addition-in-livestock-and-dairy-products
TRANSCRIPT

“Value addition in livestock & dairy products for socio-economic uplift“
Ibrar
December 16th 2014


Pakistan
• Pakistan Total Population 180 million
• Avg. No. of People/ House 5
• No. of Household 36 million
• Avg. Household milk consumption 1.52 liters/ day
• Rural Milk Consumption 11.8 billion liters/ annum
• Urban Milk Consumption 07.9 billion liters/ annum
• Total Milk in Trade 19.7 billion liters/ annum
• Process Industry 01.3 billion liters/ annum
16.48 % of total dairy trade in urban areas
06.59 % of total dairy trade in Pakistan
• Informal Trade 18.4 billion liters/ annum
Karachi 01.9 billion liters/ annum

84 % 16 %

This is what I understand as VALUE ADDITION
Which may be at a low or high cost…..

• A product from cow can be – < Rs. 50/ kg (Plain Raw Milk)
– > Rs 288 million/ kg (Lactoferrin ~90 % Pure)
– > Rs 877 million/ kg (Folate Binding Proteins)
• Lactoferrin Concentration in milk (~1 kg/ 50000 liters)
– Normal Milk 20 – 2100 mg/ ml
– Mastitis Milk 44 – 3100 mg/ ml
• We choose….. To Add Value
• Milk is a white liquid comprising hundreds of thousands of moietiescoexisting in an emulsion, suspension and true solution form
• These moieties singly or in combination can be used to formthousands of new products
Raw 2 Rewarding
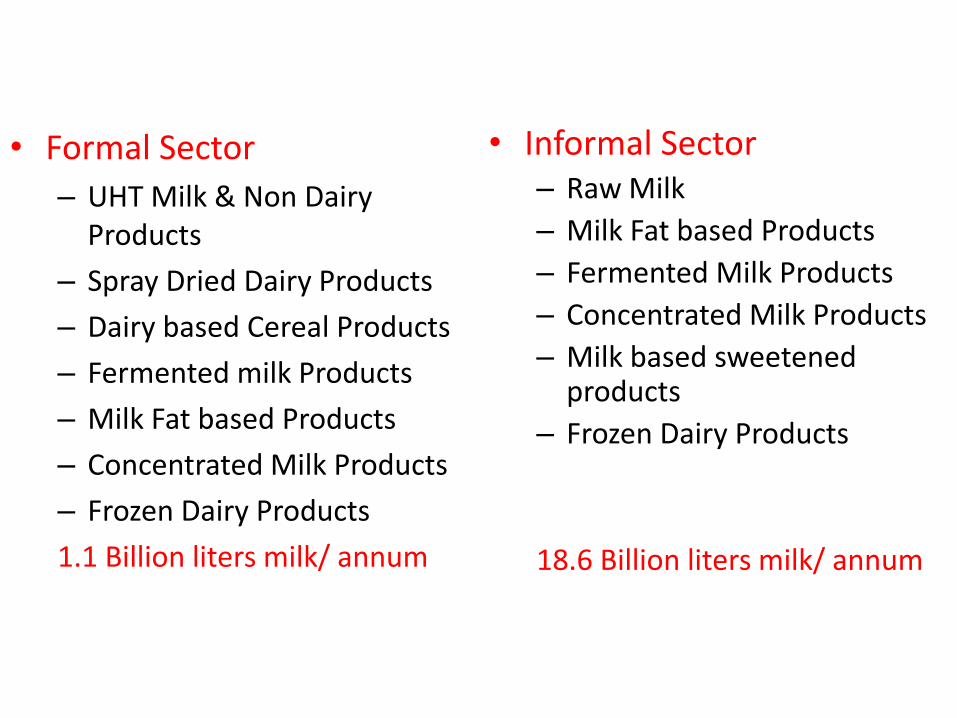
• Formal Sector
– UHT Milk & Non Dairy Products
– Spray Dried Dairy Products
– Dairy based Cereal Products
– Fermented milk Products
– Milk Fat based Products
– Concentrated Milk Products
– Frozen Dairy Products
1.1 Billion liters milk/ annum
• Informal Sector– Raw Milk
– Milk Fat based Products
– Fermented Milk Products
– Concentrated Milk Products
– Milk based sweetened products
– Frozen Dairy Products
18.6 Billion liters milk/ annum

13-23
4 - 6
28 - 48
5-6
1 1
10 - 12
23 3
0
UHT Milk Low FatMilk
FlavoredMilk
Cream UHTYoghurt
Sweet Milk TeaWhitener
ImitationCream
Dairy Drink FortifiedMilk
Functional
Positioning & Products 1978 - 2013

2012
Pure is the New NaturalGreen is a Given Location, Location, Location Premium Stands OutSeniors Draw AttentionForty is the New TwentyGrounded in ScienceRegulators Force a RethinkImmeasurable NichesBoom for Protein
2013
The Aware ShopperHealth Traffic Jam Gray but Healthy
Just Say "No""Natural" Cracks Emerge
Protein OverdriveBeating the Sugar Demon
Sensory ExperienceMore with Less
Interest at the Extremes
Global Trends

Range No. of Animals/ Farm
Total Animals Total Farms Avg. Animal/ Farm
0 - 50 19203 613 31 51 - 100 43842 561 78 101 - 150 37697 307 123 151 - 200 32027 176 182 201 - 250 15568 66 236 251 - 300 9590 33 291 301 - 350 6835 18 380 351 - 400 5540 14 396 >400 9856 16 616 Total 180158 1804 100
0 - 50 51 - 100101 -150
151 -200
201 -250
251 -300
301 -350
351 -400
>400
Total Farms 613 561 307 176 66 33 18 14 16
Avg. Animal/ Farm 31 78 123 182 236 291 380 396 616
Total Animals 19203 43842 37697 32027 15568 9590 6835 5540 9856
05000100001500020000250003000035000400004500050000
0
100
200
300
400
500
600
700
No
.
Farm Size Distribution
Major Avenues
• 18.4 billion liters has a potential of transformation and value addition for the ultimate benefit of consumer in terms of Health & Safety and immediate routes are:
– Products
– Product
– Product…..


Present Dynamics
• Women involvement in Dairy production at grass root level
• Changing dynamics Generation-Y to urbanization
• Milk Production & Sales– Self Consumption
– B2B Sales
– Director consumer
– Products

Farmer/ Entrepreneurial Value Addition Expectation?
Additional CM of ? % Financial KPI’s
ROI ? ROE? IRR?
Various Models across globe Fonterra Land O Lakes Amul

Products
• Milk
• Yoghurt
• Cheese
• Ice cream
• Butter
• Ghee
• Khoa

Value Addition at Farm Level
• Approach
– Back to Basics
• Informal to formal
– CRISP
• Cooperate
• Regulate
• Innovative
• Simple
• Processes & Products


