draft aquatic life ambient estuarine/marine water quality ... · ii epa-822-p-16-001 draft aquatic...
TRANSCRIPT

________________________________________________________________________________ United States Office of Water EPA-822-P-16-001 Environmental Protection 4304T July 2016 Agency
DRAFT AQUATIC LIFE AMBIENT
ESTUARINE/MARINE WATER
QUALITY CRITERIA FOR
COPPER - 2016

ii
EPA-822-P-16-001
DRAFT AQUATIC LIFE
AMBIENT ESTUARINE/MARINE WATER QUALITY CRITERIA FOR
COPPER - 2016
(CAS Registry Number 7440-50-8)
July 2016
U.S. ENVIRONMENTAL PROTECTION AGENCY
OFFICE OF WATER
OFFICE OF SCIENCE AND TECHNOLOGY
HEALTH AND ECOLOGICAL CRITERIA DIVISION
WASHINGTON, D.C.

iii
NOTICES
This document provides information for states and tribes authorized to administer a water
quality standards program, to consider in adopting water quality standards under the Clean Water
Act (CWA), to protect aquatic life from toxic effects of copper in estuarine/marine
environments. Under the CWA, states and tribes are to adopt water quality criteria to protect
designated uses. State and tribal decision makers retain the discretion to adopt approaches on a
case-by-case basis that differ from these criteria when appropriate. While this document contains
EPA’s scientific recommendations regarding ambient concentrations of copper in
estuarine/marine environments that protect aquatic life, it does not substitute for the CWA or
EPA’s regulations; nor is it a regulation itself. Thus, it cannot impose legally binding
requirements on EPA, states, tribes, or the regulated community, and might not apply to a
particular situation based upon the circumstances. EPA may change this document in the future.
This document has been approved for publication by the Office of Science and Technology,
Office of Water, U.S. Environmental Protection Agency.
Mention of trade names or commercial products does not constitute endorsement or
recommendation for use. This document can be downloaded from:
http://www.epa.gov/waterscience/criteria/aqlife.html.

iv
FOREWORD
Section 304(a) (l) of the Clean Water Act, 33 U.S.C. § 1314(a)(1), directs the
Administrator of the Environmental Protection Agency to publish water quality criteria that
accurately reflect the latest scientific knowledge on the kind and extent of all identifiable effects
on health and welfare that might be expected from the presence of pollutants in any body of
water, including ground water. This document is EPA’s new recommended ambient water
quality criteria (AWQC) for the protection of aquatic life based upon consideration of available
information relating to effects of copper on estuarine/marine organisms, and consideration of
independent external peer review and EPA workgroup comments.
The term "water quality criteria" is used in two sections of the Clean Water Act: section
304(a)(l) and section 303(c)(2). The term has different meanings in each section. In section 304,
the term represents a non-regulatory, scientific assessment of ecological and human health
effects. The criteria presented in this document are such a scientific assessment of ecological
effects. In section 303(c), the term water quality criteria refer to criteria adopted by a state or
authorized tribe as part of their legally-binding water quality standards. Criteria in water quality
standards establish the maximum acceptable pollutant concentrations in ambient waters
protective of the state’s designated uses. States and authorized tribes may adopt water quality
criteria in their water quality standards that have the same numerical values as EPA’s
recommended section 304(a)(1) criteria. However, states and authorized tribes may decide to
adopt water quality criteria different from EPA’s section 304 recommendations to reflect local
environmental conditions and human exposure patterns. Alternatively, states and authorized
tribes may use different data and assumptions than EPA in deriving numeric criteria that are
scientifically defensible and protective of designated uses. It is not until their adoption as part of
state or tribal water quality standards and approved by EPA (or in limited instances promulgated
by EPA) under section 303(c) that criteria become applicable water quality standards for Clean
Water Act purposes. Information to assist the states and authorized tribes in modifying the
recommended criteria presented in this document is contained in the Water Quality Standards
Handbook (U.S. EPA 2014). This handbook and additional information on the development of
water quality standards and other water-related programs of this agency have been developed by
the Office of Water.
This document does not establish or affect legal rights or obligations. It does not establish
a binding norm and cannot be finally determinative of the issues addressed. Agency decisions in
any particular situation will be made by applying the Clean Water Act and EPA regulations on
the basis of specific facts presented and scientific information then available.
Elizabeth Southerland
Director
Office of Science and Technology

v
AUTHORS / REVIEWERS / ACKNOWLEDGEMENTS
Technical Analysis Leads
Michael Elias, Office of Water, Office of Science and Technology, Health and Ecological
Criteria Division, Washington, DC
Joseph Beaman, Office of Water, Office of Science and Technology, Health and Ecological
Criteria Division, Washington, DC
Reviewers (2016)
Elizabeth Behl, Colleen Flaherty, Kathryn Gallagher, Office of Water, Office of Science and
Technology, Health and Ecological Criteria Division, Washington, DC
EPA Peer Reviewers (2016)
Cindy Roberts, U.S. EPA, Office of Research and Development, Office of Science Policy,
Washington, DC
Russ Erickson, U.S. EPA, Office of Research and Development, Mid-Continent Ecology
Division, Duluth, MN
Glynis Hill, U.S. EPA, Office of Policy, Office of Regulatory Policy and Management,
Washington, DC
Jeff Gallagher, U.S. EPA, Office of Chemical Safety and Pollution Prevention, Office of
Pollution Prevention and Toxics, Washington, DC
Keith Sappington, U.S. EPA, Office of Chemical Safety and Pollution Prevention, Office of
Pesticides Programs, Arlington, VA
Lars Wilcut and Heather Goss, U.S. EPA, Office of Water, Office of Science and Technology,
Washington, DC
David Hair and William Cooper, U.S. EPA, Office of Water, Office of Wastewater Management,
Washington, DC
Joel Hansel, U.S. EPA Region 4, Atlanta, GA
Candice Bauer, U.S. EPA Region 5, Chicago, IL
Lareina Guenzel, U.S. EPA Region 8, Denver, CO
Jane Hashimoto and Terrence Fleming, U.S. EPA Region 9, San Francisco, CA
Mark Jankowski, U.S. EPA Region 10, Seattle, WA

vi
EXECUTIVE SUMMARY
Guidance documents containing aquatic life criteria recommendations for copper (Cu)
have been updated and published by EPA over the past 30 years as new science becomes
available (e.g., U.S. EPA 1980, 1984, 1986a, 1995a, 1996, 2003, 2007). EPA’s most recent 2007
updated recommended criteria for copper only provided an update for freshwater organisms, and
differed from EPA’s previous metals criteria in that the biotic ligand model (BLM) (Di Toro et
al. 2001) addressed the metal availability to organisms. The complexing ligands in water
compete with the biotic ligand for metals and other cations in the water. Unlike the empirical
toxicity to water hardness relationships, which EPA used to establish copper criteria prior to
2007, the BLM explicitly accounts for individual water quality variables, is not linked to a
particular correlation amongst the variables, and can address variables that are not a factor in the
hardness relationship. EPA did not update estuarine/marine criteria in 2007 because a saltwater
BLM had not been sufficiently developed and tested at that time.
This document utilizes the recently developed saltwater BLM to provide updated BLM-
based acute and chronic water quality criteria (WQC) for copper that are applicable to both
estuarine and marine waters. This saltwater BLM includes a new characterization of copper
binding to natural organic matter (NOM) in estuarine/marine systems and considers the binding
of copper to the surface membranes of embryo-larval stages of several sensitive marine
invertebrates. Development of the saltwater BLM for copper is detailed in Chadwick et al.
(2008).
EPA is developing the recommended ambient WQC for copper in estuarine/marine
waters pursuant to its authority under §304(a)(1) of the Clean Water Act (CWA). EPA developed
the copper aquatic life criteria using peer reviewed methods and data that EPA determined to be
acceptable for their derivation as described in U.S. EPA’s “Guidelines for Deriving Numerical
National Water Quality Criteria for the Protection of Aquatic Organisms and Their Uses”
(Guidelines) (Stephan et al. 1985). This update includes the evaluation of data submitted in
support of the registration of copper-containing pesticides that were reviewed by EPA’s Office
of Pesticide Programs and studies reported in the open literature.
The resulting recommended ambient WQC indicate that estuarine/marine aquatic
organisms would have an appropriate level of protection if the 1-hour average and four-day

vii
average dissolved copper concentrations do not respectively exceed the acute and chronic criteria
concentrations calculated by the saltwater BLM more than once every three years on average.
For the 2016 draft acute criteria, EPA has changed the duration to 1 hour from the 24 hours EPA
recommended in the 2003 draft copper criteria for estuarine/marine organisms and the 2007
recommended freshwater copper criteria. EPA made this change to the 2016 criteria to reflect the
acute criteria duration recommended in EPA’s Guidelines (see Section 4.1.2). Because this
updated WQC relies on the BLM, the numeric WQC change accordingly in response to changes
in water quality parameters (i.e., temperature, salinity, dissolved organic carbon and pH). At an
example pH of 8.0, temperature of 22°C, DOC of 1.0 mg/L and salinity of 32 ppt, the 2016 acute
criterion magnitude is 2.0 µg/L copper (lowered to protect the commercially important red
abalone Haliotis rufescens), and the chronic criterion magnitude is 1.3 µg/L copper. Additional
examples at different water chemistry conditions are provided in Appendix I.
This document provides guidance to states and authorized tribes to consider in adopting
water quality standards under the CWA to protect estuarine/marine aquatic life from the acute
and chronic effects of copper. Under the CWA, states and authorized tribes may adopt these
WQC into water quality standards to protect designated uses. While this document constitutes
EPA’s scientific recommendations regarding ambient concentrations of copper, this document
does not substitute for the CWA or EPA’s regulations, nor is it a regulation itself. Thus, it cannot
impose legally binding requirements on EPA, states, authorized tribes, or the regulated
community, and it might not apply to a particular situation based upon the circumstances. State
and tribal decision-makers retain the discretion to adopt approaches on a case-by-case basis that
differ from this guidance when appropriate.

viii
TABLE OF CONTENTS
NOTICES ....................................................................................................................................... iii
FOREWORD ................................................................................................................................. iv
AUTHORS / REVIEWERS / ACKNOWLEDGEMENTS ............................................................ v
EXECUTIVE SUMMARY ........................................................................................................... vi
TABLE OF CONTENTS ............................................................................................................. viii
LIST OF FIGURES ....................................................................................................................... ix
LIST OF TABLES .......................................................................................................................... x
LIST OF APPENDICIES ............................................................................................................... x
ACRONYMS ................................................................................................................................. xi
1 INTRODUCTION .................................................................................................................. 1
2 PROBLEM FORMULATION................................................................................................ 4
2.1 Overview of Copper Sources and Occurrence ................................................................ 4
2.2 Environmental Fate and Transport of Copper in the Aquatic Environment ................. 12
2.3 Overview of Copper Toxicity ....................................................................................... 14
2.4 Overview of Historic and BLM Criteria Development Methods ................................. 17
2.5 Conceptual Model ......................................................................................................... 29
2.6 Assessment Endpoints .................................................................................................. 31
2.7 Measurement Endpoints................................................................................................ 31
2.7.1 Overview of Toxicity Data Requirements ................................................................ 32
2.7.2 Measures of Effect .................................................................................................... 33
2.8 Analysis Plan ................................................................................................................ 36
2.8.1 Acute Criterion Derivation ....................................................................................... 37
2.8.2 Chronic Criterion Derivation .................................................................................... 38
2.8.3 BLM Evaluation........................................................................................................ 38
3 EFFECTS ANALYSES FOR AQUATIC ORGANISMS .................................................... 41
3.1 Summary of Acute Studies ........................................................................................... 41
3.2 Summary of Chronic Studies ........................................................................................ 46
3.3 Summary of BLM Water Quality Input Parameters ..................................................... 47
3.4 Bioaccumulation ........................................................................................................... 48
3.5 Toxicity to Aquatic Plants ............................................................................................ 48
3.6 The National Estuarine/Marine Criteria for Copper ..................................................... 49
3.6.1 Acute Criterion Calculation ...................................................................................... 49
3.6.2 Chronic Criterion Calculation ................................................................................... 53
3.7 Summary of National Criteria ....................................................................................... 55
3.8 Identification of Data Gaps for Aquatic Organisms ..................................................... 56
3.8.1 Chronic Toxicity Data for Estuarine/Marine Animals .............................................. 56
3.8.2 Chronic Toxicity Data for Aquatic Vascular Plants and Algae ................................ 56
3.8.3 BLM Uncertainties and Performance ....................................................................... 57
4 EFFECTS CHARACTERIZATION .................................................................................... 58
4.1 Estuarine/Marine Acute Toxicity Data ......................................................................... 58
4.1.1 Uncertainty in the Estuarine/Marine FAV Calculation ............................................ 59
4.1.2 Acute Criteria Duration............................................................................................. 60
4.2 Estuarine/Marine Chronic Toxicity Data ...................................................................... 61
4.2.1 Uncertainty in the Estuarine/Marine FCV Calculation ............................................. 62

ix
4.3 Bioaccumulation ........................................................................................................... 63
4.3.1 Uncertainty with Copper Exposure Routes............................................................... 63
4.4 Effects on Aquatic Plants .............................................................................................. 67
4.5 Protection of Endangered Species ................................................................................ 68
4.5.1 Acute Toxicity Data for Listed Species .................................................................... 69
4.5.2 Chronic Toxicity Data for Listed Species ................................................................. 69
4.6 Comparison of Draft 2003 and 2016 Criteria Values ................................................... 69
5 REFERENCES ..................................................................................................................... 72
LIST OF FIGURES
Figure 1. Copper Usage Data for Agriculture. ................................................................................ 7
Figure 2. Environmental Bridging Chemical Species for Copper (Cu) Minerals and Complexes.
........................................................................................................................................ 14
Figure 3. Conceptual Diagram Showing Relationship between Chemical Speciation, Metal
Binding at Biotic Ligand (BL) Sites, and Competition at These BL Sites for Other
Cations. .......................................................................................................................... 20
Figure 4. Percent Abnormal Cells in Test Waters with Different Composition (primarily DOC)
for M. galloprovincialis (Panel A) and S. purpuratus (Panel B). .................................. 23
Figure 5. Predicted Copper Binding to Biotic Ligand Sites on Cell Membranes (solid lines) by
the Saltwater BLM for Copper with a Single Set of Parameters Compared with
Measured Copper Accumulation for Embryo-larval Stages of M. galloprovincialis
(Panel A) and S. purpuratus (Panel B). ......................................................................... 24
Figure 6. Predicted Copper Toxicity by the Saltwater BLM for Copper (solid lines) in Response
to Changing DOC from a Variety of Estuarine and Marine Sites Compared with
Measured Copper Toxicity for Embryo-larval Stages of M. galloprovincialis (Panel A)
and S. purpuratus (Panel B). .......................................................................................... 26
Figure 7. Predicted Copper Toxicity by the Saltwater BLM for Copper (solid lines) in Response
to Changing DOC from a Variety of Estuarine and Marine Sites Compared with
Measured Copper Toxicity for Embryo-larval Stages of Dendraster (Panel A) and
Crassostrea (Panel B). ................................................................................................... 27
Figure 8. Conceptual Model for Copper Effects on Aquatic Organisms. ..................................... 30
Figure 9. Ranked Estuarine/Marine GMAVs. .............................................................................. 51
Figure 10. Reported Dissolved Cu LC50s Ranked by the Geomean of the Normalized Cu Values
(i.e., SMAVs). ................................................................................................................ 52
Figure 11. Ranked Estuarine/Marine GMCVs.............................................................................. 55

x
LIST OF TABLES
Table 1. Ambient Dissolved and Total Copper Concentrations Reported for Coastal Harbors and
Marinas. ......................................................................................................................... 12
Table 2. Summary of Assessment Endpoints and Measures of Effect Used in Criteria Derivation.
........................................................................................................................................ 32
Table 3. Summary Table of Acceptable Toxicity Data Used to Meet the Minimum Data
Requirements in the “1985 Guidelines” and Count of Phyla, Families, Genera and
Species. .......................................................................................................................... 35
Table 4. Water Quality Input Parameters for the Freshwater and Saltwater Versions of the BLM.
........................................................................................................................................ 39
Table 5. Ranked Estuarine/Marine Genus Mean Acute Values. .................................................. 42
Table 6. Ranked Estuarine/Marine Genus Mean Chronic Values with Species Mean Acute-
Chronic Ratios. .............................................................................................................. 47
Table 7. Water Quality Input Parameters Used for Saltwater BLM-Normalization. ................... 48
Table 8. Estuarine/Marine Water Final Acute Value (FAV) and Criteria Calculations. .............. 50
Table 9. Comparison of the Four Most Sensitive Taxa Used to Calculate the Estuarine/Marine
FAV and CMC in the 2003 Draft Copper Document and 2016 Update. ....................... 71
LIST OF APPENDICIES
Appendix A Acceptable Estuarine/Marine Acute Toxicity Data ............................................ A-1
Appendix B Acceptable Chronic Toxicity Data...................................................................... B-1
Appendix C Estuarine/Marine Plant Toxicity Data ................................................................ C-1
Appendix D Acceptable Estuarine/Marine Bioaccumulation Data ......................................... D-1
Appendix E Other Estuarine/Marine Toxicity Data................................................................. E-1
Appendix F Data Not Used in the Development of the Aquatic Life Ambient Estuarine/Marine
Water Quality Criteria for Copper ....................................................................... F-1
Appendix G Species Numbers Used in BLM Analysis ........................................................... G-1
Appendix H Water Chemistry Used in BLM Analysis ........................................................... H-1
Appendix I Discussion of BLM Water Quality Parameters in the Estuarine/Marine
Environment and Example Numeric Criteria Values ........................................... I-1

xi
ACRONYMS
ACR Acute-Chronic Ratio
ALC Aquatic Life Criteria
BL Biotic Ligand
BLM Biotic Ligand Model
CCC Criterion Continuous Concentration
CF Conversion Factors
CHESS Chemical Equilibria in Soils and Solutions
CMC Criterion Maximum Concentration
CWA Clean Water Act
DIC Dissolved Inorganic Carbon
DOC Dissolved Organic Carbon
DOM Dissolved Organic Matter
EC50/EC20 Effect concentration to 50%/20% of the test population
ELS Early Life Stage
EPA Environmental Protection Agency
FACR Final Acute-Chronic Ratio
FAV Final Acute Value
FCV Final Chronic Value
FFDCA Federal Food, Drug and Cosmetic Act
FIAM Free Ion Activity Model
FQPA Food Quality Protection Act
GDCI Generic Data Call-In
GMAV Genus Mean Acute Value
GMCV Genus Mean Chronic Value
GSIM Gill Surface Interaction Model
HA Humic Acid
IC50 Inhibition Concentration where effect is inhibited 50% compared to control organism
LA50 Lethal Level of Accumulation at 50% effect level
LC50 Lethal Concentration to 50% of the test population
LOAEC Lowest Observed Adverse Effect Concentration
LOEC Lowest Observed Effect Concentration
MATC Maximum Acceptable Toxicant Concentration (geometric mean of NOEC and LOEC)
MDR Minimum Data Requirements
Me:BL Metal-Biotic Ligand Complex
MSE Mean Square Error
NASQAN National Stream Quality Accounting Network
NOAEC No Observed Adverse Effect Concentration
NOEC No Observed Effect Concentration
NOM Natural Organic Matter
PLC Partial Life-Cycle
RED Reregistration Eligibility Decision
SMAV Species Mean Acute Value
SMCV Species Mean Chronic Value
SSD Species Sensitivity Distribution
TSS Total Suspended Solids
WER Water-Effect Ratio
WET Whole Effluent Toxicity
WHAM Windermere Humic Aqueous Model
WQC Water Quality Criteria

1
1 INTRODUCTION
The U.S. Environmental Protection Agency (EPA) is developing ambient water quality
criteria (WQC) for copper (Cu) for the protection of aquatic life in estuarine/marine waters
through its authority under §304(a)(1) of the Clean Water Act (CWA). Over the past 30 years the
EPA has published a number of guidance documents containing aquatic life criteria
recommendations for copper (U.S. EPA 1980, 1984, 1986a, 1995a, 1996, 2003, and 2007). The
most recent 2007 updated recommended WQC document only provided an update for freshwater
criteria, and differed from EPA’s previous metals criteria primarily with regard to how metal
availability to organisms is addressed. EPA based previous criteria recommendations on
empirical relationships between toxicity and water hardness. In the 2007 freshwater acute and
chronic recommended criteria, EPA instead used the biotic ligand model (BLM) (Di Toro et al.
2001). The BLM is based on the premise that: (1) toxicity is related to the amount of metal
bound to a biochemical site (the biotic ligand); and (2) binding is related to the total dissolved
metal and complexing ligand concentrations in water. The biotic ligand is a binding site on
biological membranes which is associated with the mechanism of toxicity in the organism. Some
ligands and cations complex with metals in water, while other elements compete for binding sites
on the biotic ligand with the uncomplexed, bioavailable metals in water. Unlike the empirical
hardness relationships, the BLM explicitly accounts for a broader range of water quality
variables, including variables that are not a factor in the hardness relationship. The BLM is not
linked to a particular correlation amongst these variables.
EPA’s current recommended estuarine/marine criteria for copper are based on data for 33
species representing 26 genera (U.S. EPA 1995a). EPA last updated the estuarine/marine criteria
as draft in 2003 and were derived without normalization of the available toxicity data. EPA
based the draft 2003 acute criterion on Species Mean Acute Values (SMAVs) for 52 species in
44 genera (34 invertebrates and 18 fish species), with mussels, oysters and the summer flounder
identified as the most sensitive species. Chronic saltwater tests were available only for the
sheepshead minnow, Cyprinodon variegatus in the 2003 draft document. Sufficient toxicity data
were available to fulfill requirements to calculate an acute estuarine/marine criterion using a
species sensitivity distribution (SSD), as described in EPA’s Guidelines (Stephan et al. 1985).
The Final Acute Value (FAV) and Criterion Maximum Concentration (CMC) were lowered to be

2
protective of the commercially and recreationally important mussel, Mytilus. Data were not
sufficient to calculate the chronic estuarine/marine criterion using a SSD, and therefore Acute-
Chronic Ratios (ACRs) were used to derive the 2003 draft criterion.
EPA did not update the estuarine/marine criteria at the time of the 2007 release of the
BLM-based freshwater criteria because the saltwater BLM had not been sufficiently developed
or tested. This has now been addressed and details about the development of the saltwater
version of the copper BLM were published in Chadwick et al. (2008). The saltwater BLM for
copper includes a new description of copper binding to natural organic matter (NOM)
represented by dissolved organic carbon (DOC) in the model. DOC is an analytical measurement
used to quantify NOM in marine systems, and considers copper binding to the biological
membranes of embryo-larval stages of several sensitive marine invertebrates. The chemical
properties of NOM in saltwater and freshwater are similar as NOM from either medium can
strongly affect the chemistry and bioavailability of copper to aquatic biota. However, the
distribution of binding sites for NOM in marine waters differs enough from those in freshwater
that a new BLM model was developed for saltwater. This document utilizes an updated version
of the saltwater BLM, which was originally published in Chadwick et al. (2008), to provide
BLM-based water quality criteria for copper that are applicable to both estuarine and marine
waters. Although the original development of the BLM (Chadwick et al. 2008) focused on
several sensitive marine invertebrates, application of the model to the development of
estuarine/marine WQC required changes to the model to account for additional species over a
wider range of copper concentrations.
The present document contains EPA’s criteria recommendations for the protection of
aquatic life in ambient estuarine/marine water from both acute and chronic toxic effects of
copper. EPA updated the estuarine/marine WQC provided in this document in accordance with
methods outlined in the Agency’s “Guidelines for Deriving Numerical National Water Quality
Criteria for the Protection of Aquatic Organisms and Their Uses” (EPA Guidelines) (Stephan et
al. 1985). This document describes scientifically defensible water quality criteria values for
copper in estuarine/marine waters pursuant to CWA §304(a)(1), derived utilizing best available
data in a manner consistent with the EPA Guidelines and reflecting the latest available scientific
information and best professional scientific judgments of toxicological effects. Once finalized,

3
these criteria will supersede EPA’s previously published recommendations for copper in
estuarine/marine water.
This criteria document provides updated guidance to states and authorized tribes to adopt
water quality standards under the CWA to protect estuarine/marine aquatic life from copper.
Under the CWA, states and authorized tribes adopt WQC to protect designated uses. Although
this document constitutes EPA’s scientific recommendations regarding ambient concentrations
of copper in estuarine/marine waters, it does not substitute for the CWA or EPA’s regulations,
nor is it a regulation itself. Thus, it cannot impose legally binding requirements on EPA, states,
authorized tribes, or the regulated community, and might not apply to a particular situation based
on the circumstances. State and tribal decision makers retain the discretion in adopting
approaches, on a case-by-case basis, that differ from this guidance when appropriate.

4
2 PROBLEM FORMULATION
Problem formulation provides a strategic framework to develop water quality criteria by
providing an overview of a chemical’s sources and occurrence, fate and transport in the
environment, and toxicological characteristics and factors affecting toxicity. A problem
formulation uses this information to develop a conceptual model and identify the most relevant
chemical properties and endpoints for evaluation. The structure of the problem formulation
developed for copper in estuarine/marine waters is consistent with U.S. EPA’s Guidelines for
Ecological Risk Assessment (U.S. EPA 1998) and the approach used by EPA for pesticide
effects assessment (U.S. EPA 2004).
Since copper is a registered pesticide in the United States, EPA issued Registration
Standards in 1986 for copper sulfate (U.S. EPA 1986a) and in 1987 for Group II copper
compounds (U.S. EPA 1987). As a result, Generic Data Call-In (GDCI) notices were issued to
registrants in 1987 and 1993. The GDCI notices required registrants to submit ecological
fate/effects studies and product chemistry/residue and avian toxicity studies for various copper
compounds as part of the 40 CFR Part 158 data necessary to support reregistration (U.S. EPA
2010a). In further support of reregistration, and as required by FIFRA and the Federal Food,
Drug and Cosmetic Act (FFDCA) and amended by the Food Quality Protection Act (FQPA),
EPA completed the copper Reregistration Eligibility Decision (RED). The RED was signed in
July 2006 and was published, along with supporting documents, for public comment in August
2006. The revised RED, which addressed the public comments, is available online (U.S. EPA
2009).
2.1 Overview of Copper Sources and Occurrence
Copper is a naturally occurring element in the earth's crust, with concentrations typically
ranging from 55 to 70 mg/kg (Nriagu 1979). U.S. soil levels commonly range from 1 to 40
mg/kg and average around 9 mg/kg (Tisdale et al. 1985). Copper ranks 14th in relative abundance
amongst all elements and is typically found combined with other minerals in the form of oxides,
carbonates and sulfides (CDA 2003; Chemicool 2012). The highest copper concentrations are
found in basaltic igneous rocks (averaging approximately 90 mg/kg), while much lower
concentrations (averaging 4 mg/kg) are found in sedimentary limestones (CDA 2003).
5
Copper is commonly found in aquatic systems as a result of both natural and
anthropogenic sources (Nriagu 1979). Natural sources of copper to aquatic systems include
geological deposits, weathering and erosion of rocks and soils and volcanic activity (Kious and
Tilling 1996). It is estimated that, on average, approximately 68% of the copper released to
surface waters originates from these sources (ATSDR 1990). Naturally occurring copper
concentrations have been reported to range from 0.03 to 0.23 µg/L in surface seawaters (Bowen
1985). In a review paper, Kennish (1998) reported copper concentrations ranging from 0.3 to 3.8
μg/L in estuarine waters and from 0.1 to 2.5 μg/L in coastal waters of the United States.
Copper concentrations in estuarine environments receiving anthropogenic inputs can
range from background to more than 15 µg/L, and concentrations in impacted coastal waters
have been reported to range from 0.5 to 2.6 µg/L (International Copper Association 2003). It
should be noted, however, that much of the quantitative metals data for samples collected from
natural waters prior to the mid-1970s are considered inaccurate due to contamination from
sampling methods or containers.
Elevated concentrations of copper in the aquatic environment can result from both natural
sources, such as from the erosion of soils, and from numerous anthropogenic point and nonpoint
sources. The following discussion provides a description of some of the most notable
anthropogenic sources.
A broad range of mining/resource extraction activities can represent a source of copper to
the aquatic environment via both permitted discharges from active mines and uncontrolled
releases from abandoned mines. Abandoned mines are a notable source of copper due to acid
mine drainage, which solubilizes and transports a broad range of metals, including copper, to
adjacent waterbodies. Copper mining activities can, in particular, represent a source of copper to
the environment, with the majority of both historic and ongoing copper mining activity in the
U.S. occurring in Arizona, Utah, New Mexico, Nevada and Montana (CDA 2012). EPA
estimated that mining has impacted headwater streams in more than 40 percent of watersheds in
the western United States (U.S. EPA 1994b, 2012a).
Copper is widely used in pesticides and elevated concentrations of copper in the
environment can result from the application and use of registered pesticides. The first copper-
containing pesticide registration was issued in 1956. Currently, there are 19 copper compounds

6
that have active food use registrations (12 for agricultural uses and 7 for antimicrobial uses) and
that are subject to tolerance reassessment and registration review (U.S. EPA 2010a).
Copper is widely used as a broad-spectrum bactericide, fungicide, antimicrobial,
herbicide, algaecide, and molluscicide for a variety of agricultural, commercial and urban
purposes. Marketed trade names include Kocide, CuproFix, Basicop, K-Tea, Cutrine Ultra and
Triangle. In 2002, for example, it was estimated that approximately 106 million pounds of
copper was applied nationwide as an agricultural fungicide (Figure 1). Primary applications
were to rice (25%), citrus fruit (23%), walnuts (10%) and grapes (7%), with lesser amounts used
on tomatoes, peaches, almonds, apples, cherries, and potatoes (U.S. EPA 2010a).
As pesticidal products, copper-containing compounds are also applied directly to aquatic
systems to control algae, cyanobacteria, aquatic weeds, leeches, mollusks and tadpole shrimp
(TDC Environmental 2004; U.S. EPA 2010a). Antimicrobial pesticide uses include wood
preservatives including surface and pressure treatments, architectural and antifoulant paints,
algae resistant roofing shingles, human drinking water treatment, and other material
preservatives. Urban uses include application to control algae and moss in lawns, algae in
outdoor swimming pools, and root growth in sewage and irrigation systems.

7
Figure 1. Copper Usage Data for Agriculture.
(Source: http://water.usgs.gov/nawqa/pnsp/usage/maps/show_map.php?year=02&map=m5011, accessed
on May 25, 2010).
Copper is an essential micronutrient for plant growth and agricultural fertilizers and
biosolids containing copper are applied to bolster deficient soils and increase crop yields (CDA
2003; University of Minnesota 2009). Copper is also used as a feed supplement for cattle and
other livestock to prevent a deficiency that can make cattle less responsive to vaccines and more
susceptible to disease (Oregon State University 2011), and to improve weight gain. Other
agricultural uses include copper sulfate in dairy cattle foot baths to control hairy heel warts
(Jokela et al. 2010), which can introduce copper to the environment.
A number of other industries have been identified as sources of copper to the
environment, including leather and leather product manufacturers, metal fabricators, and
electrical equipment manufacturers, amongst others (Patterson et al. 1998; CDA 2003; TDC
Environmental 2004). Copper is also released to the environment from the burning of fossil fuels
(oil, diesel and coal) and wood (CDA 2003).
Urban runoff from the numerous and unrelated upland sources can cumulatively
represent an important anthropogenic source of copper to surface water. In addition to the uses

8
already discussed, sources of copper to runoff include copper roofs and gutters, chromate copper
arsenate (CCA) treated wood1, automotive brake pads and tailpipe emissions, asphalt, coolant
leaks and construction erosion. Storm water runoff is estimated to contribute approximately 2%
of the total copper released to waterways (ASTDR 1990) compared to 68% contributed from
soils through natural weathering and disturbance (Georgopoulis et al. 2001). However, in a study
of copper sources to the San Francisco Bay, urban runoff was estimated to contribute
approximately 53 percent of the copper loading to the Bay (45,000 to 47,000 pounds per year;
TDC Environmental 2004).
In estuarine and marine waters, and to lesser extent freshwater environments, antifouling
paints and coatings (also known as Antifouling Systems or AFS’s) are pesticidal products used to
protect boat/ship hulls, underwater surfaces, buoys and barges, while CCA-impregnated timbers
are used for the decking and pilings of boat docks and marine structures. Antifouling paints and
coatings are intended to retard the growth of algae, weeds, and other encrusting organisms such
as barnacles and mussels on the underwater portion of vessel hulls and underwater surfaces.
These encrusting organisms can foul hulls and other underwater surfaces, increasing corrosion
and drag, reducing safety and maneuverability, decreasing fuel efficiency and economy, and
lengthening transit times (WHOI 1952). The development of antifouling paints and coatings has
a long history, as mariners have tried for centuries to keep vessel hulls free from barnacles and
other fouling growth (Thomas and Brooks 2010). In the late 1950s and early 1960s, antifouling
paint formulations using tributyltin (TBT) were introduced and proved to be excellent at
preventing hull fouling. However, restrictions on the use of TBT-based compounds due to severe
environmental impacts opened the market for manufacturers to develop new biocides for use on
vessels (Kiaune and Singhasemanon 2011). Alternative metals, including copper and zinc, are
currently used as substitutes for TBT.
The most common form of copper used in antifouling paints and coatings is cuprous
oxide, which acts as a preventative biocide by leaching into the water. Most marine antifouling
paints contain 40 to 70 percent cuprous oxide by weight. Since cuprous oxide is comprised of 89
percent copper by weight, typical cuprous oxide marine antifouling paints are 36 to 62 percent
copper by weight (TDC Environmental 2004). Although not as common, copper thiocyanate and
1 In December 2003, chromated arsenicals manufacturers voluntarily discontinued manufacturing chromated
arsenicals-treated wood products for homeowner uses (U.S. EPA 2010b)

9
copper hydroxide are also used as biocides in antifouling paints and coatings. Copper thiocyanate
has the advantage of being compatible with aluminum. The contribution of copper to receiving
waters from copper thiocyanate and copper hydroxide paints is small relative to biocides
containing cuprous oxide (TDC Environmental 2004).
Antifouling paints and coatings applied to vessel hulls represent one of the most
commonly identified sources of copper in marinas. A number of studies have been done to
estimate the loading of copper from these paints and coatings. EPA estimated that copper loading
from the use of these biocides in California’s Lower Newport Bay, which harbors approximately
10,000 boats, contributed more than 62,000 pounds of copper annually through passive leaching
and underwater hull cleaning (U.S. EPA 2002). This release could account for as much as 80
percent of the copper input into the Lower Newport Bay. Although this may represent an
extreme case, based on the high number and density of boats that are docked and the minimal
water circulation and flushing of the harbor, it illustrates the potential significance of antifouling
paints and coatings as a source of copper to the aquatic environment.
The U.S. Navy and private researchers conducted two copper source loading studies for
the San Diego Bay in the late 1990s (Johnson et al. 1998; PRC Environmental Management,
Inc.1997). Both studies concluded that antifouling paints and coatings accounted for the majority
of dissolved copper loading to the bay. The San Diego Regional Water Quality Control Board
estimated that passive leaching and the underwater hull cleaning of the 2,400 boats berthed in the
Shelter Island Yacht Basin marina collectively contribute 98 percent of the copper discharged to
the basin (Singhasemanon et al. 2009). Approximately 95 percent of the 1.8 pounds of copper
estimated to be released by each boat per year is believed to leach from antifouling paints and
coatings while boats are moored at the dock, while the remaining five percent is believed to be
released during underwater hull cleaning activities (TDC Environmental 2004).
Copper leaching from vessel hulls represents a potential water quality concern in ports
throughout the United States, including ports in the Chesapeake Bay, Port Canaveral and Indian
River Lagoon in Florida, and various harbors in Washington State (Carson et al. 2009). In
addition to AFS, antifouling paint particles are generated during boat maintenance and from
abandoned structures and ships. These particles have the potential to leach metals more rapidly
due to the increased surface area and also may be consumed by benthic invertebrates (Turner
2010).

10
As presented in EPA’s Study of Discharges Incidental to Normal Operation of
Commercial Fishing Vessels and Other Non-Recreational Vessels Less than 79 Feet (U.S. EPA
2010b), elevated levels of copper were found in the ambient water associated with a number of
harbors and marinas (Table 1). A recent study of AFS biocides in California marinas found
dissolved copper concentrations ranging from 0.1-18.4 μg/L in the water, which are similar to the
range of concentrations reported in U.S. EPA (2010b). Concentrations were significantly higher
in salt- and brackish water marinas than in freshwater marinas (Singhasemanon 2008).

11
Case Study: Mass Balance for Sources of Copper to the San Francisco Bay
There is a long history of investigation of copper sources to the San Francisco Bay and
surrounding area, where copper has been a pollutant of concern since the late 1980s. The 1989
designation of the lower South San Francisco Bay as impaired by copper (listing under §303(d) of
the CWA) caused government agencies and businesses to make a significant investment in copper
source identification andreduction measures. These activities created a wealth of information on
copper releases to surface waters and greatly expanded the understanding of options to prevent or
reduce copper releases to San Francisco Bay.
Copper Sources in Urban Runoff and Shoreline Activities (TDC Environmental 2004) was
prepared for the Clean Estuary Partnership to summarize available information about the sources
of copper in urban runoff that is released directly into the Bay from shoreline activities. Marine
antifouling paint and copper algaecides applied to shoreline lagoons were included in the
evaluation of direct release sources. The report did not address discharges from industrial or
municipal wastewater treatment plants or non-urban copper sources, such as sediment erosion
from open space, agricultural pesticide use, mine drainage, and reservoir releases. These were not
considered to be significant sources of copper to urban runoff or from shoreline activities.
Nine categories of copper sources were found to have the potential to make a significant
contribution to copper levels in the San Francisco Bay Area via urban runoff and releases from
shoreline activities. These sources are listed below, ordered from highest to lowest based on the
estimated magnitude of loading:
Marine antifouling coatings
Vehicle brake pads
Architectural copper
Copper pesticides (including shoreline algaecides) and CCA-treated wood
Industrial copper uses
Copper air emissions
Soil erosion
Copper in domestic water discharged to storm drains
Vehicle fluid leaks and dumping
In theory, there are thousands of potential sources for copper in urban runoff and shoreline
activities. Additional information characterizing sources of copper is summarized in Diffuse
Sources of Environmental Copper in the United States (CDA 2003).

12
Table 1. Ambient Dissolved Copper Concentrations Reported for Coastal Harbors and
Marinas.
Location Ambient Water
Copper Dissolved
(µg/L)
Baltimore (Fort McHenry), MD 18.7
Baltimore (Fells Point), MD 24.2
Gloucester, MA <5a
New Bedford, MA <5a
Philadelphia, PA <5a
Havre de Grace, MD <5a
Pensacola, FL 1.8
Gulf Breeze, FL 3.1
Lafitte, LA 3
Bayou La Batre, AL 4.3
Pass Christian, MS 4
Slidell, LA 2.4
Convent, LA 2.4
Sitka SB, AK <5a
Sitka, AK <5a a Limit of detection
(Source: U.S. EPA 2010b).
Monitoring in the Southern California Bight demonstrated that sediment from marinas
throughout southern California had consistently elevated copper levels compared to surrounding
waters (Bay et al. 2000). Surveys around the United States routinely find elevated copper
concentrations in marina and harbor sediments relative to other areas with less vessel traffic or
shoreline activities (NOAA 1994; U.S. EPA 1999).
2.2 Environmental Fate and Transport of Copper in the Aquatic Environment
Elemental copper, atomic number 29, is a reddish solid with a molecular weight of
63.546 g/mol. Copper has a density of 8.94 g/mL at 20°C, a melting point of 1,083°C and is
insoluble in water. Copper naturally occurs as two stable isotopes (63Cu and 65Cu) along with
numerous unstable radioisotopes. Being a metallic element, copper will not break down and
continues to cycle in the environment after it is released (Eisler 1998).
Copper exists in four oxidation states: Cu0, Cu+, Cu2+, and Cu3+. The cupric ion (Cu2+)
oxidation state is the form of copper generally encountered in water. Elemental copper (Cu0) is
slightly soluble in dilute ammonia and is not oxidized in water, cuprous copper (Cu+) is only

13
found in water when complexed (oxides, hydroxides and ligands), and trivalent copper (Cu3+)
does not occur naturally. The pH of the medium and presence of other chemical species usually
controls which forms of Cu+ or Cu2+ are found (ATSDR 1990; Eisler 1998). In oxic natural
waters with neutral pH and above, the free cupric (Cu2+) ion is generally a minor species (Stumm
and Morgan 1981). The cupric ion instead generally reacts with inorganic and organic chemicals
in solution and in suspension, and forms moderate to strongly complexed solutes and precipitates
with the numerous inorganic and organic constituents of natural waters (e.g., carbonate,
phosphate, and organic materials). An overview of the chemistry of copper in aqueous systems is
provided in Figure 2 (U.S. EPA 2010a).
Copper hydroxide, copper carbonate and cupric ion are the dominant copper species in
seawater (U.S. EPA 1980). This is in contrast to freshwater, where cupric salts (chloride, nitrate
and sulfate) are generally highly soluble and where solubility decreases under reducing
conditions and is modified by water pH, temperature and hardness. Copper flux from
estuarine/marine sediments is influenced by the presence of ligands in the sediment pore waters.
In a study of two contrasting types of organic rich estuarine sediments from the Chesapeake Bay,
it was determined that most of the total dissolved copper fluxing from these sediments would be
complexed by ligands during the sediment-water exchange, and these sediments will influence
the copper speciation in overlying waters when these ligands are released (Skrabal et al. 2000).
Due to the complexation of the copper from the pore waters, only a small fraction of the copper
is exchanged as an organic species (the most bioavailable form) (Skrabal et al. 2000), indicating
that the geochemistry of copper from estuarine/marine sediments is an important determinant of
the fate and transport of copper to aquatic organisms.

14
Figure 2. Environmental Bridging Chemical Species for Copper (Cu) Minerals and
Complexes.
2.3 Overview of Copper Toxicity
Copper is a micronutrient for organisms at low concentrations and is recognized as
essential to virtually all plants and animals (Kapustka et al. 2004). It is also a key atom in the
oxygen carrying protein (hemocyanin) of some invertebrates. However, it can become toxic to
some forms of aquatic life at elevated concentrations. The specific mode of toxic action depends
on the organism. In bacteria, fungi and algae, excess copper causes disruption of cell membrane
integrity and the subsequent leakage of the cell contents (Borkow and Gabbay 2005). In
mollusks, copper alters the normal function of peroxidase enzymes and surface epithelia, often
producing peroxidation products that lethally disrupt vital functions of membranes and cells
(Cheng 1979). In the mussel, Mytilus galloprovincialis, elevated copper concentrations have
been found to interfere with Ca+2 homeostasis in the gill, and disrupt Na/K ATPase and Ca+2

15
ATPase activities (Viarengo et al. 1996). Copper also affects the gills of crabs, reducing
hemocyanin-oxygen affinity in these organisms. Hansen et al. (1992) attributed copper exposed
crab (Carcinus maenas) mortality to reduced oxygen transport and subsequent tissue hypoxia,
with reductions in the activities of regulatory enzymes of ATP-synthesizing pathways.
In marine fish, copper adversely affects osmoregulatory processes, ATP-synthesizing
pathways and ion transport across the gills, and causes oxidative stress damage. The osmotic
balance maintained by the gastrointestinal tract and gills in marine teleost fish is disrupted when
elevated copper levels inhibit water absorption by the gut (active uptake of Na+ and Cl-) and/or
the secretion of Na+ and Cl- by the gills (inhibition of branchial Na+/K+-ATPase) (Marshall and
Grosell 2005; Stagg and Shuttleworth 1982). Excretion of nitrogenous waste by teleost fish can
also be impacted by copper, with elevated plasma ammonia concentrations observed in seawater-
acclimated rainbow trout exposed to 400 µg/L copper (Wilson and Taylor 1993). In contrast,
marine elasmobranchs retain nitrogenous compounds for osmoregulatory purposes, and exposure
of spiny dogfish (Squalus acanthias) to 1,000 µg/L copper resulted in a loss of plasma urea (De
Boeck et al. 2007). Dodoo et al. (1992) observed inhibited calcium transport in juvenile flounder
(Paralichthys sp.) exposed to copper, and speculated that it was caused by copper interference
with gill chloride cells.
Copper can also induce cellular oxidative stress, through the formation of reactive
oxygen species (ROS), inhibition of antioxidant enzymes, alteration of the mitochondrial
electron-transfer chain, or depletion of cellular glutathione (Shukla et al. 1987; Freedman et al.
1989; Stohs and Bagchi 1995; Rau et al. 2004; Wang et al. 2004). Oxidative stress is normally
mitigated with cellular antioxidant mechanisms, but prolonged exposure to elevated copper
concentrations can exhaust these defenses, and may result in the oxidation of DNA (strand
break), lipids (impaired cell membrane permeability) and proteins (Grosell 2012). ROS
neutralization includes antioxidant enzymes such as catalase, glutathione peroxidase and
reductase, and Cu/Zn superoxide dismutase. Detoxifying mechanisms include the induction of
metallothioneins and heat shock protein 70 (Sato and Bremner 1993; McDuffee et al. 1997;
Evans and Halliwell 2001). In summary, excessive copper concentrations compromise normal
cell functions by disrupting osmoregulation and ion flow, inhibiting enzymes and ATP-driven
pumps, and inducing oxidative stress, resulting in cell toxicity from oxidative damage and

16
disruption of cell homeostasis, and leading to changes in internal pH balance, membrane
potential, and osmosis (Okocha and Adedeji 2012).
Copper concentrations typically build up in tissues at the site of exposure, such as the gill
surface and gut tract wall (Chevreuil et al. 1995). Copper is then transferred via circulation to
other tissues and organs, with the liver and kidney typically accumulating high concentrations
relative to muscle tissues (Grosell 2012). Although copper bioaccumulates in some aquatic
species, there does not appear to be a consistent relationship between body burden and
toxicological effect (Meyer et al. 2005; DeForest and Meyer 2015). This inconsistent relationship
between whole body tissue concentration and toxic effect may be related to specific organs
and/or tissues where the accumulation is occurring. Therefore, it may not be accurately
quantified by whole body tissue residue analysis, and/or the metabolic bioavailability of copper
in tissues.
Since copper is an important trace nutrient, some organisms may have mechanisms for
maintaining homeostasis, such as detoxification, making it more difficult to study the
relationship between body burden and toxic effect. Detoxification mechanisms in aquatic
organisms, including the formation and activation of antioxidants, metallothionein, glutathione,
and heat shock proteins (McGeer et al. 2011) effectively sequester the metal in a detoxified form,
thereby allowing the organism to accumulate elevated levels of copper before displaying a toxic
response. While the amount of detoxified metal that an aquatic organism can accumulate is
theoretically unlimited, an organism will only experience toxic effects once the concentration of
metabolically required metal is exceeded (Rainbow 2002; Rainbow and Smith 2013). Under
natural conditions, most accumulated copper in tissues is expected to exist in a detoxified state,
which may explain the poor relationship between whole body tissue residue concentrations and
toxic effect observed in tested aquatic invertebrates and fish (Rainbow 2002).
An additional consideration is the potential for copper in aquatic prey items (e.g.,
invertebrates) to adversely affect higher trophic level organisms, such as fish and aquatic-
dependent wildlife via dietary exposure. This exposure pathway does not show a consistent dose-
response relationship because the bioavailability of copper to top predators differs substantially
among prey species that are consumed (U.S. EPA 1993). Further, there are numerous different
prey types and amounts eaten by each predator, thus complicating the estimate of a safe dose to
higher trophic level organisms (this and other uncertainties are discussed in Section 4.3.1).

17
Overall, however, the risk to higher trophic level species is considered low because researchers
have found that copper generally does not accumulate or biomagnify in aquatic food chains
(Lewis and Cave 1982; Suedel et al. 1994). The evaluation of effects from the direct exposure of
organism tissues (e.g., gills and other biological membranes) to copper in water is therefore
considered more applicable to the development of criteria for aquatic life and was the focus of
the development of criteria for estuarine/marine aquatic life.
The toxicity of copper to aquatic life is related primarily to the activity of the cupric ion,
and possibly to some hydroxy complexes (Allen and Hansen 1996; Andrew 1976; Andrew et al.
1977; Borgmann and Ralph 1983; Chakoumakos et al. 1979; Chapman and McCrady 1977;
Dodge and Theis 1979; Howarth and Sprague 1978; Pagenkopf 1983; Petersen 1982; Rueter
1983). Examples of the response of organisms to cupric ion activity, and limited exceptions, are
reviewed by Campbell (1995). Any changes in water quality that would be expected to decrease
free copper ion activity also would be expected to decrease copper bioavailability and resulting
toxicity. For example, increases in pH, alkalinity, and NOM (as represented by DOC) would all
tend to decrease copper bioavailability and be associated with increased copper LC50 values. The
following section discusses in detail the characterization of water quality parameters and their
effect on bioavailability.
2.4 Overview of Historic and BLM Criteria Development Methods
Early national recommended aquatic life criteria for copper (U.S. EPA 1980, 1984,
1995a, 1996, 2003) considered bioavailability effects for freshwater organisms based on water
hardness by incorporating linear regression equations into the criterion-calculation procedure to
account for the decreasing acute and chronic toxicity of copper to freshwater biota with
increasing water hardness. Temperature did not vary significantly for tests with most species, pH
values were often not reported or were highly variable, and alkalinity and DOC were rarely
reported. Accordingly, freshwater criteria for copper, and those for several other metals, were
established as functions of water hardness alone. However, the regression coefficients for
hardness did not only reflect how hardness affected copper toxicity. Hardness was instead a
surrogate for other co-varying water quality parameters that were not included in the regression
analyses and the criteria based on hardness alone did not explicitly account for the modifying
effects of these other water parameters.

18
An alternate approach that has been proposed to predict metal toxicity is to (1) identify
the bioavailable form(s) of the metal; (2) analyze or calculate the concentration(s) of the
bioavailable form(s) in the exposure water; and (3) predict the toxicity based on an empirical
relationship between the biological response and the concentration(s) of the bioavailable forms
(Santore et al. 2001). This approach only requires the direct measure or calculation (using a
geochemical-speciation model) of the free metal ion (Cu2+) concentration, which is the
bioavailable-fraction of copper in water. The concentration of Cu2+ has been demonstrated to be
an accurate indicator of acute toxicity, as characterized by trends in the LC50 values, even in the
presence of varying levels of inorganic or organic ligands, which can complex with copper and
alter the Cu2+ concentration (e.g., Borgmann 1983; Santore et al. 2001). This approach, however,
loses accuracy when other cations are present in water that can interact with biota. For example,
the LC50 of Cu2+ increases significantly as the concentration of Ca2+ (a major component of
water hardness) increases (Campbell 1995; Meyer et al. 1999). This trend indicates that the
concentration of cupric ion alone is not always sufficient to predict toxicity.
In general, there is no universally constant bioavailable fraction of a metal that can be
identified by chemical analyses (Meyer et al. 2002). The interactions amongst the key abiotic
components in exposure water must be considered in conjunction with the interactions of those
key abiotic components directly with biota. Metal bioavailability may also be modified by
competitive interactions at the biotic ligand (i.e. biological membranes of toxic interaction).
Increased sodium and calcium concentrations, for example, can reduce the binding of copper to
physiologically active binding sites and can thereby reduce copper bioavailability. Cation
competition also has an effect on the complexation of copper by DOC, and this interaction will
partially offset competitive interactions that occur at the biotic ligand. The complex interactions
of Cu2+ with dissolved components, suspended particles, and biota therefore must be
simultaneously considered in order to accurately predict copper toxicity.
The chemical speciation of copper in natural waters and explanatory power of the free
copper ion in characterizing copper toxicity were first recognized more than 30 years ago
(Anderson and Morel 1978; Sunda and Gillespie 1979; Sunda and Guillard 1976; Sunda and
Lewis 1978; Zitko et al. 1973). These concepts were eventually formalized in models that linked
metal chemistry and biological effects, such as the gill surface interaction model (GSIM)
(Pagenkopf 1983) and the free ion activity model (FIAM) (Morel 1983). Playle and others

19
demonstrated that copper binding to fish gills can be modeled using a chemical speciation
approach (Playle et al. 1993a, 1993b). MacRae and others demonstrated that copper binding on
the gill shows a dose-response relationship with mortality (MacRae et al. 1999). Although early
models showed remarkable utility, several critical issues remained. Perhaps most notably, and
until recently, few models could predict metal chemistry in the presence of NOM over a range of
environmental conditions (Bergman and Dorward-King 1997). A considerable amount of
information about metals speciation in the environment has since become available and
computing techniques have been further developed to simulate metal speciation (e.g., Nordstrom
et al. 1979). These early efforts, however, laid the foundation for the development and use of the
BLM to predict adverse effect levels of metals as a function of site-specific water chemistry (Di
Toro et al. 2001). A more comprehensive review of these historical developments is presented in
Paquin et al. (2002).
The BLM is a metal bioavailability model that considers chemical and physiological
effects information for metals in aquatic environments and was originally developed for
freshwater settings (Di Toro et al. 2001; Paquin et al. 2002; Santore et al. 2001). The approach
was first presented to EPA’s Science Advisory Board in 1999 where it received a generally
favorable response (U.S. EPA 1999, 2000). Like the FIAM and GSIM, the BLM is based on a
description of the chemical speciation of metals in aqueous systems (Figure 3). Chemical
speciation is simulated as an equilibrium system that includes the complexation of inorganic ions
and NOM. The chemical system for the original freshwater BLM was simulated by the chemical
equilibria in soils and solutions (CHESS) model (Santore and Driscoll 1995), including a
description of metal interactions with NOM based on the Windermere humic aqueous model
(WHAM) (Tipping 1994). A significant advantage of the NOM chemistry developed for WHAM
is that reactions and parameter values were developed by simultaneously considering numerous
NOM samples and numerous metals. A chemical description was needed specifically
characterizing chemical speciation for the saltwater BLM, but the basic principles of metal
speciation are similar to those established by the development of the models used for the original
freshwater BLM (Chadwick et al. 2008).

20
Figure 3. Conceptual Diagram Showing Relationship between Chemical Speciation, Metal
Binding at Biotic Ligand (BL) Sites, and Competition at These BL Sites for Other Cations.
(Adapted from Santore et al. 2001).
In addition to considering chemical speciation, the BLM also includes reactions that
describe the chemical interactions of copper and other cations with physiologically active sites,
termed biotic ligands (BLs). BLs correspond to the proximate site of action of toxicity in aquatic
organisms and can be present on any biological membrane. The model parameters define the
degree of interaction based on binding affinity characteristics measured in gill-loading
experiments. The BL is represented by a characteristic binding site density and conditional
stability constant for each of the dissolved chemical species with which it reacts. Predictions of
metal toxicity are made by assuming that the dissolved metal LC50, which varies with water
chemistry, is always associated with a fixed critical level of metal binding with the BL. This
fixed level of metal-biotic ligand (Me:BL) accumulation at 50 percent mortality has been
referred to as the “lethal accumulation 50%” (LA50), but since the BLM can also apply to sub-
lethal endpoints, this parameter has been more generically termed “critical accumulation.”
Copper accumulation on the BL is characterized by a rapid and reversible chemical interaction
with binding sites on biological membranes, and is not in any other way similar to accumulation
that results from uptake within the organism. It is assumed to be constant, regardless of the
chemical characteristics of the water (Meyer et al. 1999, 2002). This combination of reactions

21
that describe aqueous metal speciation and organism interactions allows the BLM to predict
copper toxicity to a variety of organisms over a variety of water quality conditions (Santore et al.
2001).
The saltwater BLM for copper was developed from independent datasets that could be
used to characterize copper speciation, surficial copper binding to membranes, and toxicity
(Chadwick et al. 2008). The chemistry model used to represent interactions between copper and
dissolved organic matter (DOM, usually measured as DOC) included four discrete ligands and
was calibrated to titration results with over 60 water samples. The calibrated model was then
validated using an additional dataset that was similar in breadth (>60 titrations). The established
relationship between free copper, dissolved copper, and DOC in marine waters was demonstrated
to describe the range of copper concentrations that bracketed anticipated marine criteria values
that would be protective of sensitive marine invertebrates (Chadwick et al. 2008). The
development effort included calibration and validation steps. Extensive datasets from San Diego
Bay and Pearl Harbor were used in the analysis. Subsets of the data from each site were assigned
as calibration or validation data. Calibration data were used in the parameterization of the model,
while the validation data were only used to test overall goodness of fit (Chadwick et al. 2008).
Validation was performed by comparison with chemical speciation data (i.e., free copper ion),
and measured copper toxicity to sensitive marine invertebrates.
Binding constants for copper and other cations to the BL for the saltwater BLM were
developed from data reported by Rosen et al. (2008), which included copper accumulation data
for both Mytilus galloprovincialis and Strongylocentrotus purpuratus. These accumulation data
were measured in short-term exposures designed to quantify copper interactions with the
surficial membranes of embryolarval forms of these marine organisms and should not be equated
with whole-body accumulation in more well-developed life stages, which may represent uptake
and incorporation of copper in the tissue of multiple organs. The dose-response (percent
abnormal) curves for different water samples having different DOC levels differed from each
other when the exposure was characterized only on the basis of dissolved copper. However, a
single dose-response curve can characterize copper toxicity in these different samples when
exposure is expressed as embryo-larvae whole body copper concentrations (Figure 4). The
ability of a single relationship between accumulation and toxicity in different samples indicates
that the surficial copper binding to cell membranes (which can be measured as whole body

22
accumulation in embryolarval forms of these organisms) on the larval life stages is directly
related to the copper bound to the site of toxic action. The resulting saltwater BLM is thus
demonstrated to consistently simulate accumulated copper using a single model representation
for both M. galloprovincialis and S. purpuratus, as shown in Figure 5.
An advantage of the BLM is that most of the parameters are invariant for different
organisms, despite the complexity of the modeling framework. All of the thermodynamic
constants used to simulate inorganic and organic chemical equilibrium reactions are determined
by characteristics of the metal and the available ligands. As such, the constants do not change for
simulations involving different organisms. This is an important consideration in the development
of the BLM. In a recent review, Erickson (2013) cautioned against the introduction of additional
parameters that weaken the mechanistic framework of the model. In particular, Erickson
cautioned about inferring accumulation-based effects from toxicity measurements. In the
development of the marine copper BLM, the critical accumulation for several sensitive
organisms were taken from direct measurements (Figure 4) rather than inferred from toxicity
data. These measurements confirmed several assumptions made during the development of the
freshwater model. First, that the same accumulation model (and hence the same BL parameters)
could be used to describe accumulation to different organisms [for example Mytilus in Figure 4
(Panel A) and Strongylocentrotus in Figure 4 (Panel B)]. Second, that the difference in
sensitivity between these organisms is due to different critical accumulation levels (vertical
dashed lines in Figure 4). The critical accumulation, therefore, is the only model parameter that
is needed to account for differences in organism sensitivity.

23
A
B
Figure 4. Percent Abnormal Cells in Test Waters with Different Composition (primarily
DOC) for M. galloprovincialis (Panel A) and S. purpuratus (Panel B).
(Samples collected from different areas are labeled with the sample identifier (N or S). Values collapse
into a single dose response when compared with measured copper accumulation). (Chadwick et al.
2008).

24
A
B
Figure 5. Predicted Copper Binding to BL Sites on Cell Membranes (solid lines) by the
Saltwater BLM for Copper with a Single Set of Parameters Compared with Measured
Copper Accumulation for Embryo-larval Stages of M. galloprovincialis (Panel A) and S.
purpuratus (Panel B).
(Samples collected from different areas are labeled with the sample identifier (N or S). (Chadwick et al.
2008).

25
Toxicity data were used to evaluate the critical accumulation values for M.
galloprovincialis and S. purpuratus and to predict EC50 values for these two organisms. Coupled
with the toxicity data, the BLM can predict how much dissolved copper is associated with
critical accumulation in waters of varying composition, and how toxicity changes in response to
changes in key environmental variables, such as DOC. The resulting model can predict toxicity
to both M. galloprovincialis and S. purpuratus over a wide range of conditions for waters from
different geographic regions (Figure 6).
Accumulation values that were available for M. galloprovincialis and S. purpuratus were
not available for other organisms having toxicity data. To incorporate other organisms into the
BLM, water effect concentrations (ECs) were extrapolated for the biological species for which
accumulation data are not available. This is the same approach as was used for the BLM-based
copper criteria for fresh water (U.S. EPA 2007). The general procedure used for the freshwater
criteria development was to normalize all available toxicity data to selected water chemistry
values, calculate criteria values at these conditions, and then use the normalization procedure to
compute criteria at other water chemistry conditions. With this approach, the BL parameter
values developed from M. galloprovincialis and S. purpuratus accumulation measurements are
assumed to be constant for other sensitive marine invertebrates. This approach has been shown to
work well when used to predict copper effect levels for other freshwater organisms (U.S. EPA
2007). The same accumulation model was first used to evaluate the critical accumulation for the
additional organisms, and then used to predict effect levels. It was determined that 94% of all
predictions were within a factor of two of the measured EC50 (Figure 7).

26
A
B
Figure 6. Predicted Copper Toxicity by the Saltwater BLM for Copper (solid lines) in
Response to Changing DOC from a Variety of Estuarine and Marine Sites Compared with
Measured Copper Toxicity for Embryo-larval Stages of M. galloprovincialis (Panel A) and
S. purpuratus (Panel B).
(Dashed lines indicate plus or minus a factor of two around the solid line. Variation within these
boundaries represents the variability of replicate toxicity tests).

27
A
B
Figure 7. Predicted Copper Toxicity by the Saltwater BLM for Copper (solid lines) in
Response to Changing DOC from a Variety of Estuarine and Marine Sites Compared with
Measured Copper Toxicity for Embryo-larval Stages of Dendraster (Panel A) and
Crassostrea (Panel B).
(Dashed lines indicate plus or minus a factor of two around the solid line. Variation within these
boundaries represents the variability of replicate toxicity tests).

28
While many of the concepts and conditions applicable to the freshwater BLM for copper
also apply to estuarine/marine waters, there are some differences. First, the concentrations of all
ions in saltwater are much higher than in freshwater (Morel and Hering 1983). Second, in waters
with constant salinity, the ionic composition is well defined and consistent so the likelihood that
changes in ionic composition could result in observable bioavailability effects is lower than for
freshwater (Stumm and Morgan 1981). Although water samples from estuaries may be collected
across a range of salinities, toxicity tests with copper are typically conducted with embryo-larval
stages of sensitive marine invertebrates such as Mytilus or Crassostrea (Arnold et al. 2010a;
Rosen et al. 2005). Available toxicity data indicate that the early life stages of these bivalve
molluscs are amongst the most sensitive marine organisms to copper (U.S. EPA 1995a; Table 3).
However, the early life stages of these species have a narrow range of salinity tolerance. When
used to test copper toxicity in estuarine samples, standard procedures therefore require that the
salinity of test solutions be increased to full marine salinity (e.g., 30 to 32 ppt; U.S. EPA 1995a).
Although it is expected that cation competition plays a role in determining metal bioavailability
along salinity gradients, the effects of salinity on copper bioavailability are absent in the majority
of toxicity data sets that are available, due to the standard practice of adjusting samples to full
strength salinity. In tests where estuarine samples have been salted up to marine salinity, the
potential effects of variable salinity on copper toxicity have been eliminated, leaving only DOC
as the primary toxicity modifying factor (such as in Figure 6 and Figure 7).
Recent tests with sensitive invertebrates capable of tolerating a wide range of salinities
have shown that the same bioavailability relationships involving pH, DOC, and salinity also
apply in estuarine conditions when tested over a range of salinities (Arnold et al. 2010b, 2010c;
Cooper et al. 2012; Hall et al. 1997, 2008). These studies have shown that copper bioavailability
is reduced at high salinity, which is consistent with effects predicted by the saltwater BLM for
copper. For example, Arnold et al. (2010c) found that EC50s for Brachionus plicatilis ranged
from less than 40 µg/L at a salinity of 5 ppt, to approximately 70 µg/L at a salinity of 30 ppt.
Similar results were reported by Cooper et al. (2012) for B. plicatilis. The overall results from
Cooper et al. (2012) suggest that both salinity and DOC are important in estuarine samples and
the combined effects are consistent with predictions by the saltwater BLM. Increasing salinity
was also shown to have variable effects to the polychaete Hediste (Ozoh 1992a,b). In exposures

29
with sediment, the effect of salinity on copper toxicity was small and variable depending on the
temperature, while in water-only exposures there was a reduction in copper bioavailability with
increasing salinity similar to that seen in rotifers (Ozoh 1992a,b). The saltwater BLM for copper
is therefore considered predictive of copper effects to sensitive estuarine invertebrates.
2.5 Conceptual Model
A conceptual model characterizes relationships between human activities, stressors and
ecological effects on the assessment endpoints identified for evaluation (U.S. EPA 1998). The
conceptual model links exposure characteristics with the ecological endpoints important for the
development of management goals. Under the CWA, these management goals are established by
states and tribes as designated uses of waters of the United States (for example, the protection of
aquatic life). In deriving aquatic life criteria, U.S. EPA is developing acceptable thresholds for
pollutants that, if not exceeded, are expected to be protective of aquatic life. A state and/or tribe
may implement these criteria by adopting them into their respective water quality standards.
The conceptual model depicted in Figure 8 provides a broad overview of how aquatic
organisms could be exposed to copper in the estuarine/marine environment. As depicted in
Figure 8 and discussed in Section 2.1, copper enters the environment from both natural and
anthropogenic sources. The environmental fate properties of copper indicate that weathering and
erosion of natural sources and inputs from a variety of anthropogenic sources represent potential
mechanisms that can transport copper from these sources to surface water (TDC Environmental
2004; U.S. EPA 2010a). The model also depicts exposure pathways for potential biological
receptors (e.g., non-target aquatic animals) and potential attribute changes (e.g., reduced
survival, growth and reproduction) in those receptors due to copper exposure. The conceptual
model diagram (Figure 8) depicts where the BLM predicts how water quality parameters
(especially DOC) influence the uptake/gill or integument exposure pathway. Copper also has the
potential for adsorption to sediment and to bioaccumulate in aquatic organism tissues. There is
accordingly the potential for the exposure of benthic organisms to copper in sediment (pore
water) and the potential for the exposure of carnivorous mammals and birds via the consumption
of aquatic invertebrates and fish that have accumulated copper (terrestrial effects were not
assessed). Aquatic toxicity assessments assume anthropogenic exposure occurs primarily as a
result of direct release/discharge to surface water and/or following partitioning from sediment to

30
surface water. The transport and leaching of copper from groundwater to surface water is
assumed to be negligible (U.S. EPA 2010a).
The conceptual model is intended to provide a broad overview of how aquatic organisms
can potentially be exposed to copper. Transport mechanisms and exposure pathways are not
considered in the derivation of aquatic life criteria. Derivation of criteria instead focuses on the
effects of copper on survival, growth and reproduction of aquatic organisms based on its
presence in the aquatic environment. However, the pathways, receptors, and attribute changes
depicted in Figure 8 may be helpful for states and authorized tribes as they adopt criteria into
standards and need to evaluate potential exposure pathways affecting designated uses.
Figure 8. Conceptual Model for Copper Effects on Aquatic Organisms.
(Dotted arrows indicate exposure pathways that have a low likelihood of contributing to ecological risk).
31
2.6 Assessment Endpoints
Assessment endpoints are defined as the explicit expressions of the environmental values
to be protected and are comprised of both the ecological entity (e.g., a species, community, or
other entity) and the attributes or characteristics of the entity to be protected (U.S. EPA 1998).
Assessment endpoints may be identified at any level of organization (e.g., individual organism,
population, community). In context of the CWA, aquatic life criteria for toxic substances are
typically determined based on the results of toxicity tests with aquatic organisms, for which
adverse effects on growth, reproduction or survival are measured. This information is aggregated
into a species sensitivity analysis that characterizes an impact to the aquatic community. Criteria
are designed to be protective of the vast majority of aquatic organisms in an aquatic community
(i.e., approximately the 95th percentile of tested aquatic organisms representing the aquatic
community). Assessment endpoints consistent with the criteria developed in this document are
summarized in Table 2.
2.7 Measurement Endpoints
Assessment endpoints require one or more measures of ecological effect, which are
termed “measurement endpoints.” Measurement endpoints are the measures of ecological effect
used to characterize or quantify changes in the attributes of an assessment endpoint or changes in
a surrogate entity or attribute, in this case a response to chemical exposure. Toxicity data are
used as measures of direct and indirect effects on representative biological receptors. The
selected measures of effect for the development of aquatic life criteria encompass changes in the
growth, reproduction, and survival of aquatic organisms.
The toxicity data used for development of the aquatic life criteria depend on the
availability of applicable toxicity test outcomes, the acceptability of test methodologies, and an
in-depth evaluation of the acceptability of each specific test, as performed by the U.S. EPA per
its Guidelines (1985). Measurement endpoints for the development of aquatic life criteria are
derived using acute and chronic toxicity studies for representative test species, which are then
quantitatively and qualitatively analyzed, as described in the Analysis Plan below. Measurement
endpoints considered for each assessment endpoint in this criteria document are summarized in
Table 2. The following sections discuss toxicity data requirements for the fulfillment of these
measurement endpoints.

32
Table 2. Summary of Assessment Endpoints and Measures of Effect Used in Criteria
Derivation.
Assessment Endpoints for the Aquatic
Community
Measures of Effect
Survival, growth, biomass, and reproduction of
fish and invertebrates (estuarine/marine)
Acute: LC50, EC50
Chronic: EC20, MATC (only used when an EC20
could not be calculated for the genus)
Maintenance and growth of aquatic plants from
standing crop or biomass (estuarine/marine)
LOEC, EC20, EC50, IC50, reduced growth rate, cell
viability, calculated MATC MATC=Maximum acceptable toxicant concentration (geometric mean of NOEC and LOEC)
NOEC=No observed effect concentration
LOEC=Lowest observed effect concentration
LC50=Lethal concentration to 50% of the test population
EC50/EC20=Effect concentration to 50%/20% of the test population
IC50=Concentration of copper at which some effect is inhibited 50% compared to control organism
2.7.1 Overview of Toxicity Data Requirements
U.S. EPA has specific data requirements to assess the potential effects of a stressor on an
aquatic ecosystem and develop 304(a) aquatic life criteria under the CWA. To develop 304(a)
criteria for estuarine/marine aquatic life under CWA, EPA typically requires the following:
Acute toxicity test species data from a minimum of eight diverse taxonomic groups as
follows:
o two families in the phylum Chordata
o a family in a phylum other than Arthropoda or Chordata
o a family from either Mysidae or Peneidae
o three other families not in the phylum Chordata (may include Mysidae or
Penaeidae, whichever was not used above)
o any other family
Chronic toxicity test data (longer-term survival, growth, or reproduction) are generally
required for a minimum of three taxa, with at least one chronic test being from an
acutely-sensitive species. Acute-chronic ratios can be calculated with data for species of
aquatic animals from at least three different families if the following data requirements
are met:
o at least one is a fish
o at least one is an invertebrate
o at least one is an acutely sensitive saltwater species (the other two may be
freshwater species)

33
2.7.2 Measures of Effect
Acute measures of effect
The acute measures of effect used for organisms in this document are the LC50, EC50, and
IC50. LC stands for “Lethal Concentration” and an LC50 is the concentration of a chemical that is
estimated to kill 50 percent of the test organisms. EC stands for “Effective Concentration” and
the EC50 is the concentration of a chemical that is estimated to produce a specific effect in 50
percent of the test organisms. IC stands for “Inhibitory Concentration” and the IC50 is the
concentration of a chemical that is estimated to inhibit some biological process (i.e. growth, etc.)
by 50 percent compared to a control.
Chronic measures of effect
The endpoints for chronic measures of exposure are the NOEC, LOEC, MATC and EC20.
The NOEC (i.e., “No-Observed-Effect-Concentration”) is the highest test concentration at which
none of the observed effects were statistically different from the control. The LOEC (i.e.,
“Lowest-Observed-Effect-Concentration”) is the lowest test concentration at which observed
effects is statistically different from the control. The Maximum Acceptable Toxicant
Concentration (MATC) is the calculated geometric mean of the NOEC and LOEC. The EC20,
which represents a 20 percent effect/inhibition concentration, is a low level of effect that is
generally significantly different from the control treatment.
Data available for measuring effect
Effect data for copper were obtained from studies published in the open literature and
identified in a search of the ECOTOXicology database (Available online at:
https://cfpub.epa.gov/ecotox/). ECOTOX is a source of high quality toxicity data for aquatic life,
terrestrial plants, and wildlife. The database was created and is maintained by the EPA, Office of
Research and Development, National Health and Environmental Effects Research Laboratory's
Mid-Continent Ecology Division. The latest comprehensive literature search for this document
was conducted in April 2016.
Following initial identification with the ECOTOX database search, a further evaluation of
available data was performed by EPA to determine test acceptability. The amount of toxicity
testing data available for any given pollutant varies significantly, depending primarily on
whether it has raised any significant environmental issues and, in the case of a pesticide, how

34
long it has been registered. Appendix A of Quality Criteria for Water 1986 (U.S. EPA 1986b)
provides an in-depth discussion of the minimum data requirements and data quality requirements
for aquatic life criteria development.
As discussed above, the assessment endpoints for aquatic life criteria are based on the
growth, reproduction, and survival of the assessed taxa, while the specific measures of effect are
provided by the acute and chronic toxicity data (Table 2). The toxicity endpoints derived from
these data are expressed as the geometric means of acute values for all species of the same genus
(GMAVs) or geometric means of the chronic values for all species of the same genus (GMCVs).
GMAVs and GMCVs are used in the applicable species sensitivity distributions of the available
aquatic community data to derive the acute and chronic aquatic life criteria.
Table 3 provides a summary of the data used to fulfill the minimum data requirements
(MDR) outlined in the EPA Guidelines (Stephan et al. 1985) for derivation of the
estuarine/marine acute criterion for copper. It also provides a summary of the number of
families, genera, and species with acceptable acute and chronic toxicity data. There are a total of
seven phyla in the acute copper toxicity database representing 63 families, 78 genera, and 89
species. The copper toxicity dataset far exceeds the MDRs for derivation of an estuarine/marine
acute criterion. Acceptable estuarine/marine copper chronic values are available for only two
species, the euryhaline rotifer, Brachionus plicatilis (Arnold et al. 2010b) and the sheepshead
minnow, Cyprinodon variegatus (Hughes et al. 1989). Consistent with U.S. EPA’s Guidelines,
freshwater toxicity data were therefore integrated into the derivation of the chronic criterion.
Data that were determined to have acceptable quality and to be useable in the derivation of water
quality criteria as described in U.S. EPA’s Guidelines for the derivation of acute and chronic
criteria are presented in Appendix Table A-1 and Appendix Table B-1, respectively.

35
Table 3. Summary Table of Acceptable Toxicity Data Used to Meet the Minimum Data Requirements in EPA’s Guidelines and
Count of Phyla, Families, Genera and Species.
Family Minimum Data Requirement
(Estuarine/Marine)
Acute
Phylum / Family / Genus
Chronic
Phylum / Family / Genus
Family in the phylum Chordata Chordata / Atherinopsidae / Menidia Chordata / Cyprinodontidae / Cyprinodon
Family in the phylum Chordata Chordata / Sciaenidae / Leiostomus -
Either the Mysidae or Penaeidae family Arthropoda / Mysidae / Americamysis -
Family in a phylum other than Arthropoda or Chordata Mollusca / Mytilidae / Mytilus Rotifera / Brachionidae / Brachionus
Family in a phylum other than Chordata Rotifera / Brachionidae / Brachionus -
Family in a phylum other than Chordata Echinodermata / Diadematidae / Diadema -
Family in a phylum other than Chordata Cnidaria / Aiptasiidae / Aiptasia -
Any other family Arthropoda / Crangonida / Crangon -
Dash (-) indicates requirement not met (i.e., no acceptable data).
Estuarine/Marine Acute Estuarine/Marine Chronic
Phylum Families GMAVs SMAVs Families GMAVs SMAVs
Annelida 4 5 5 - - -
Arthropoda 23 31 34 - - -
Chordata 18 21 24 1 1 1
Cnidaria 1 1 1 - - -
Echinodermata 5 5 6 - - -
Mollusca 11 14 18 - - -
Rotifera 1 1 1 1 1 1
Total 63 78 89 2 2 2

36
2.8 Analysis Plan
Although the BLM-based approach for copper in estuarine/marine waters has now been
developed for use in place of the former, non-BLM-based approach, the updated criteria
derivations in this document are still based on the principles set forth in EPA’s Guidelines
(Stephan et al. 1985). Therefore, it is useful to review how the Guidelines are applied.
During CWA §304(a) criteria development, U.S. EPA reviews and considers all relevant
toxicity test data. Information available for all relevant species and genera are reviewed to
identify: (1) data from acceptable tests that meet data quality standards; and (2) whether the
acceptable data meet the MDRs as outlined in U.S. EPA’s Guidelines (Stephan et al. 1985; U.S.
EPA 1986b). The taxa represented by the different groups comprising the MDRs are comprised
of taxa with different ecological, trophic, taxonomic and functional characteristics in aquatic
ecosystems, and are intended to be a representative subset of the diversity within a typical
aquatic community. Although the aquatic life criteria process is based on selected toxicity
endpoints from the most sensitive species tested, the criteria derived may not necessarily reflect
the most sensitive species existing in a specific environment. If plants are more sensitive than
vertebrates and invertebrates, plant criteria are developed if sufficient data are available to
support its derivation.
Application of the saltwater BLM to the derivation of the estuarine/marine Final Acute
Value is analogous to procedures already described in EPA’s criteria for metals criteria using
empirical hardness regressions. For these hardness-dependent metals criteria, LC50s at various
hardness levels are normalized to a selected hardness using the regression slopes. Similarly, the
acceptable acute and chronic data are normalized to the selected water chemistry conditions
using the BLM, and then the criteria are derived according to the Guidelines. The values
presented below are relative only to the selected water chemistry for comparison purposes. The
saltwater BLM-based criteria will in some cases be more stringent and in other cases less
stringent than the previous criteria, depending on specific water conditions used with the BLM.
As there is not a single criterion value to use for comparison purposes, it will only be possible to
provide illustrative examples of each situation.

37
2.8.1 Acute Criterion Derivation
As recommended by the Guidelines, acute criteria are based on a species sensitivity
distribution (SSD) comprised of genus mean acute values (GMAVs), which are calculated from
species mean acute values (SMAVs) for available and acceptable data. SMAVs are calculated
using the geometric mean for all acceptable toxicity tests for a given species (e.g. all tests for
Mytilus edulis). If only one test is available, the SMAV is that test value by default. GMAVs are
then calculated using the geometric means of all SMAVs within a given genus (e.g. all SMAVs
for the genus Mytilus - Mytilus edulis, Mytilus galloprovincialis).
The estuarine/marine acute criterion is based on the Final Acute Value (FAV). The FAV
is determined by first ordering the GMAVs by rank from most sensitive (Rank 1) to least
sensitive (Rank N) for linear regression analysis. The regression analysis is typically driven by
the four most sensitive genera reflecting the lowest GMAVs in the sensitivity distribution, based
on the need to interpolate or extrapolate (as appropriate) to the 5th percentile of the distribution
represented by the tested genera. The FAV represents a hypothetical genus more sensitive than
95 percent of representative genera. Consistent with EPA’s Guidance, because more than 59
GMAVs were available for copper, the FAV was derived from the four GMAVs that have
cumulative probabilities closest to the 5th percentile toxicity value for all the tested genera. The
acute criterion, defined as the Criterion Maximum Concentration (CMC), is then calculated by
dividing the FAV by two, which is intended to provide an acute criterion protective of nearly all
individuals in the distribution (Stephan et al. 1985). The FAV may be lowered to protect
recreationally or commercially important species.
As discussed above, acute toxicity test data must be available for species from a
minimum of eight genera with a specified minimum required taxonomic diversity as established
by the MDRs. The diversity of tested species required by the MDRs is intended to ensure the
protection of various components of an aquatic ecosystem. Although the aquatic life criteria
derivation process relies on selected toxicity endpoints from the sensitive species tested, it does
not necessarily mean that the selected toxicity endpoints reflect the sensitivity of the most
sensitive species existing within a given habitat. The intent of the eight MDRs is instead to serve
as a representative sample of the aquatic community, with the MDRs representative of the
different ecological, trophic, taxonomic and functional differences observed in the natural
aquatic ecosystem. Use of the SSD method where the criteria values are based on the four most

38
sensitive taxa is reflective of the whole distribution, representing a censored statistical approach
that improves estimation of the lower tail when the shape of the whole distribution is uncertain.
2.8.2 Chronic Criterion Derivation
A chronic criterion is typically determined by one of two methods. If MDRs are met with
acceptable chronic test data available for all eight families, then the chronic criteria can be
derived using the same method as for the acute criteria, employing chronic values (e.g., EC20)
estimated from acceptable toxicity tests. In cases where less chronic data are available, but where
there are at least three chronic tests from taxa that also have appropriate acute toxicity data, the
chronic criterion can be derived by determining an appropriate acute-chronic ratio (ACR). The
ACR is a way of establishing a relationship between the acute and chronic toxicities of a
chemical to aquatic organism. ACRs can be used to derive chronic criteria with data for species
of aquatic animals provided that the MDR of at least three species is met and that:
at least one species is a fish
at least one species is an invertebrate
at least one species is an acutely sensitive estuarine/marine species (the other two species
data may be freshwater or estuarine/marine, as appropriate, for the derivation).
ACRs are calculated by dividing the acute toxicity test values by a “paired” chronic test value.
Tests for a chemical are considered paired when they are conducted by the same laboratory, with
the same test organism and with the same dilution water. A chronic criterion is not derived if
there is more than a ten-fold difference amongst ACRs and if there is no clear trend related to
species sensitivity (Stephan et al. 1985). If these criteria are met, the Final Acute-Chronic Ratio
(FACR) may be the geometric mean of the available ACRs or an individual ACR (or
combination therefore), based on the most sensitive taxa. The Final Chronic Value (FCV) is then
estimated by dividing the FAV by the FACR. This serves as the basis for the chronic criterion.
The FCV then may be lowered if necessary to protect recreationally or commercially important
species.
2.8.3 BLM Evaluation
Use of the BLM to predict the bioavailability and toxicity of copper to estuarine/marine
organisms under site-specific conditions is a significant modification from the previous criteria
derivation methodology, which used no relationships (e.g., salinity) to adjust the criteria. As
detailed in Section 2.4, the BLM is based on the premise that toxicity is related to metal bound to

39
a biochemical site (the biotic ligand) and that binding is related to total dissolved metal
concentrations and complexing ligands in the water, with the BLM explicitly accounting for
individual water quality variables that affect bioavailability and toxicity. This document utilizes
the recently developed saltwater BLM to provide an updated BLM-based water quality criterion
that is applicable to marine and estuarine waters.
Table 4 summarizes the water quality input parameters required for the freshwater and
marine copper BLMs. As shown in Table 4, the saltwater BLM for copper has relatively few
input parameters, compared with the freshwater BLM.
Table 4. Water Quality Input Parameters for the Freshwater and Saltwater Versions of the
BLM.
Freshwater BLM Input Parameters Saltwater BLM Input Parameters
Temperature Temperature
pH pH
DOC DOC
Calcium Salinity
Magnesium
Sodium
Potassium
Sulfate
Chloride
Alkalinity
Sulfide
Because the ionic composition of marine water is relatively constant (Turekian 1968), all
of the cations, anions, and alkalinity are estimated from salinity. The major dissolved ions in
seawater (Cl, Na, Mg, SO4, Ca, K, HCO3), and used in toxicity tests, are present in constant
ratios. Individual ion concentrations can therefore be easily calculated from a known salinity or
from the known concentration of a single ion (Pilson 1998). The defined and consistent ionic
composition of saltwater is what reduces the needed input parameters for the copper saltwater
BLM to just temperature, pH, DOC, and salinity. Approximating the ionic content of variable
salinity samples in this way assumes that the freshwater component mixing with the marine
water is devoid of ions. Actual freshwaters mixing into estuaries will, of course, have variable

40
ionic content. The deviation from this simplified assumption and the actual chemistry of the
estuary will depend on how ionically rich the freshwater is, and how far upstream the estuary
(i.e., to how low a salinity level) the estimation is used. It is clear, however, that to the extent that
the actual ionic content is different, it will always be higher than the estimate, and therefore the
estimate will always be conservative. Despite the reduction in the number of parameters needed,
much of the currently available aquatic toxicity literature for metals does not include the
measurement or reporting of all key BLM input parameters. Additional data were therefore
obtained from the authors, additional measurements were made in relevant water sources, or
input parameters were estimated when necessary to fill in these data gaps. As with any modeling
effort, however, the reliability of the BLM-derived accumulation and toxicity values for this
project are subject to the limitations of the input measurements and estimation procedures
described above.
The criteria presented herein are the agency’s best estimate of maximum concentrations
of copper to protect most estuarine/marine aquatic organisms from any unacceptable short- or
long-term effects. Results of such intermediate calculations such as SMAV and chronic values
are specified to four significant figures to prevent rounding errors in subsequent calculations and
the number of places beyond the decimal point does not reflect the precision of the value.

41
3 EFFECTS ANALYSES FOR AQUATIC ORGANISMS
3.1 Summary of Acute Studies
The acute criterion or CMC was calculated according to the procedure described in the
following section. The reported acute toxicity values (LC50s or EC50s) determined to be
acceptable for use in criteria development (summarized in Appendix Table A-1) and individual
test water chemistry parameters were first used to calculate lethal accumulation values (LA50s).
The LA50s represent the critical threshold concentrations at the biotic ligand that result in acute
toxicity and were used to normalize toxicity values (e.g., LC50s) to a standard water condition
(Appendix Table A-1, footnote e). As used here, “normalization” refers to the procedure by
which all of the measured effect levels were adjusted, via use of the BLM, to predict effect
concentrations that would have been expected in the selected water chemistry (see Section 3.3).
LA50s were determined by running the saltwater BLM in speciation mode (see BLM User’s
Guide)2. The resulting normalized effect concentrations were then used to calculate the Species
Mean Acute Values (SMAVs), Genus Mean Acute Values (GMAVs), and the Final Acute Value
(FAV) according to EPA’s Guidelines procedure. These values are relevant (for comparison
purposes across species) only at the selected water chemistry values specified, but are used to
allow the BLM model to predict the FAV and criteria in any water chemistry condition. Data that
were identified during the review, but that were not considered to be acceptable and not included
in the criteria calculations are listed in Appendix Table E-1.
Acceptable data on the acute effects of copper on estuarine/marine species were available
for 89 species representing 78 genera (Table 5). BLM-normalized (at the selected water
chemistry) SMAVs ranged from 3.944 μg/L for the most sensitive species, the red abalone,
Haliotis rufescens, to 81,550 μg/L for the least sensitive species, the amphipod Corophium
volutator. Molluscs were among the most sensitive species, with H. rufescens, Mytilus edulis and
M. galloprovincialis, having three of the five lowest SMAVs. The other two of five lowest
SMAVs were for the copepod, Tigriopus californicus, and the purple sea urchin,
Strongylocentrotus purpuratus (Arnold et al. 2010a; City of San Jose 1998; Dinnel et al. 1989;
2 The saltwater BLM has the same two prediction modes (speciation and toxicity) as the freshwater model. The
speciation mode is only used in the context of a data processing step and is not a mode that is needed or publicly
available in the software distributed for calculating estuarine/marine criteria.

42
O’Brien et al. 1988; Rosen et al. 2008). Invertebrates, including molluscs, were generally more
sensitive than fish, representing 19 of the 20 lowest GMAVs (Table 5).
Table 5. Ranked Estuarine/Marine Genus Mean Acute Values.
(All values were normalized to select water chemistry conditions, see Section 3.3).
Rank
Genus Mean
Acute Value
(μg/L) Genus Species
Species Mean
Acute Value
(μg/L)
78 81,550 Corophium Amphipod,
Corophium volutator 81,550
77 43,694 Rangia Clam,
Rangia cuneata 43,694
76 >33,000 Opsanus Gulf toadfish,
Opsanus beta >33,000
75 31,716 Limulus Horseshoe crab,
Limulus polyphemus 31,716
74 >29,733 Gammarus Amphipod,
Gammarus duebeni >29,733
73 8,976 Callinectes Blue crab,
Callinectes sapidus 8,976
72 8,863 Micropogonias Atlantic croaker,
Micropogonias undulatus 8,863
71 8,423 Rivulus Mangrove killifish,
Rivulus marmoratus 8,423
70 4,898 Mugil Striped mullet,
Mugil cephalus 4,898
69 4,428 Centropomus Fat snook,
Centropomus parallelus 4,428
68 4,145 Lagodon Pinfish,
Lagodon rhomboides 4,145
67 3,715 Nitokra Copepod,
Nitokra spinipes 3,715
66 3,690 Boleophthalmus Mud-skipper,
Boleophthalmus sp. 3,690
65 3,014 Litopenaeus Whiteleg shrimp,
Litopenaeus vannamei 3,014
64 2,590 Palaemonetes Grass shrimp,
Palaemonetes pugio 2,590
63 2,512 Terapon Thornfish,
Terapon jarbua 2,512
62 2,492 Emerita Sand crab,
Emerita analoga 2,492
61 2,163 Palaemon Decapod,
Palaemon elegans 2,163
60 2,057 Amphiascoides Copepod,
Amphiascoides atopus 2,057

43
Rank
Genus Mean
Acute Value
(μg/L) Genus Species
Species Mean
Acute Value
(μg/L)
59 1,675 Eurythoe Polychaete,
Eurythoe complanata 1,675
58 1,672 Sphaeroma Isopod,
Sphaeroma serratum 1,672
57 1,538 Crepidula
Gastropod,
Crepidula convexa 1,105
Gastropod,
Crepidula fornicata 2,141
56 1,534 Archosargus Sheepshead,
Archosargus probatocephalus 1,534
55 1,416 Turbo Whelk,
Turbo coronatus 1,416
54 1,089 Planaxis Grooved snail,
Planaxis sulcatus 1,089
53 1,058 Penaeus Tiger shrimp,
Penaeus monodon 1,058
52 875.7 Trachinotus Pompano,
Trachinotus carolinus 875.7
51 730.8 Carcinus Shore crab,
Carcinus maenas 730.8
50 646.9 Perna Asian green mussel,
Perna viridis 646.9
49 623.4 Hediste Polychaete,
Hediste (Nereis) diversicolor 623.4
48 611.0 Cymatogaster Shiner perch,
Cymatogaster aggregata 611.0
47 589.5 Ophionereis Bristle star,
Ophionereis dubia 589.5
46 556.3 Fundulus Mummichog,
Fundulus heteroclitus 556.3
45 515.7 Allorchestes Amphipod,
Allorchestes compressa 515.7
44 512.2 Cyprinodon
Leon Springs pupfish, *
Cyprinodon bovinus 778.0
Sheepshead minnow,
Cyprinodon variegatus 337.2
43 445.6 Oncorhynchus Coho salmon, *
Oncorhynchus kisutch 445.6
42 350.2 Mercenaria Hard clam,
Mercenaria mercenaria 350.2
41 341.6 Balanus
Barnacle,
Balanus amphitrite 139.7
Barnacle,
Balanus eburneus 835.4
40 260.8 Farfantepenaeus Pink shrimp,
Farfantepenaeus duorarum 260.8

44
Rank
Genus Mean
Acute Value
(μg/L) Genus Species
Species Mean
Acute Value
(μg/L)
39 255.4 Crangon Shrimp,
Crangon crangon 255.4
38 229.9 Morone Striped bass,
Morone saxatilis 229.9
37 222.9 Loligo Squid,
Loligo opalescens 222.9
36 190.6 Leiostomus Spot,
Leiostomus xanthurus 190.6
35 185.0 Atherinops Topsmelt,
Atherinops affinis 185.0
34 130.1 Echinogammarus Amphipod,
Echinogammarus olivii 130.1
33 112.8 Neanthes Polychaete,
Neanthes arenaceodentata 112.8
32 106.8 Metapenaeus Shrimp,
Metapenaeus sp. 106.8
31 106.4 Pseudopleuronectes Winter flounder,
Pseudopleuronectes americanus 106.4
30 101.2 Pseudodiaptomus Copepod,
Pseudodiaptomus coronatus 101.2
29 99.77 Tisbe Copepod,
Tisbe furcata 99.77
28 87.98 Hydroides Polychaete,
Hydroides elegans 87.98
27 85.48 Orchomenella Amphipod,
Orchomenella pinguis 85.48
26 82.57 Americamysis
Mysid,
Americamysis bahia 96.60
Mysid,
Americamysis bigelowi 70.57
25 75.27 Elasmopus Amphipod,
Elasmopus rapax 75.27
24 72.63 Aiptasia Sea anemone,
Aiptasia pallida 72.63
23 64.47 Menidia
Inland silverside,
Menidia beryllina 46.01
Atlantic silverside,
Menidia menidia 85.97
Tidewater silverside,
Menidia peninsulae 67.73
22 64.20 Scorpaenichthys Cabezon,
Scorpaenichthys marmoratus 64.20
21 53.80 Anaitides Polychaete,
Anaitides maculata 53.80
20 35.72 Cancer Dungeness crab,
Cancer magister 35.72

45
Rank
Genus Mean
Acute Value
(μg/L) Genus Species
Species Mean
Acute Value
(μg/L)
19 32.60 Neomysis Mysid,
Neomysis mercedis 32.60
18 28.37 Homarus Lobster,
Homarus americanus 28.37
17 28.35 Spisula Surf clam,
Spisula solidissima 28.35
16 23.03 Mya Softshell clam,
Mya arenaria 23.03
15 23.03 Brachionus Rotifer,
Brachionus plicatilis 23.03
14 22.44 Eurytemora Copepod,
Eurytemora affinis 22.44
13 16.49 Dendraster Sand dollar,
Dendraster excentricus 16.49
12 16.40 Acartia
Copepod,
Acartia clausi 21.86
Copepod,
Acartia tonsa 12.31
11 15.35 Argopecten Bay scallop,
Argopecten irradians 15.35
10 13.85 Arbacia Sea urchin,
Arbacia punctulata 13.85
9 12.58 Diadema Long-spined sea urchin,
Diadema antillarum 12.58
8 12.38 Mulinia Coot clam,
Mulinia lateralis 12.38
7 10.29 Strongylocentrotus
Green sea urchin,
Strongylocentrotus droebachiensis 13.29
Purple sea urchin,
Strongylocentrotus purpuratus 7.971
6 10.10 Crassostrea
Pacific oyster,
Crassostrea gigas 11.94
Eastern oyster,
Crassostrea virginica 8.537
5 9.572 Holmesimysis Mysid,
Holmesimysis costata 9.572
4 9.153 Haliotis
Black abalone,*
Haliotis cracherodii 21.24
Red abalone,
Haliotis rufescens 3.944
3 8.848 Paralichthys Summer flounder,
Paralichthys dentatus 8.848
2 7.847 Tigriopus Copepod,
Tigriopus californicus 7.847
1 5.577 Mytilus Blue mussel,
Mytilus edulis 4.238

46
Rank
Genus Mean
Acute Value
(μg/L) Genus Species
Species Mean
Acute Value
(μg/L)
Mediterranean mussel,
Mytilus galloprovincialis 7.338
a From Appendix Table A-1.
* Listed species.
3.2 Summary of Chronic Studies
Acceptable estuarine/marine copper chronic values are available for only two species, the
euryhaline rotifer, Brachionus plicatilis (Arnold et al. 2010b) and the sheepshead minnow,
Cyprinodon variegatus (Hughes et al. 1989) (Appendix Table B-1). These chronic toxicity
values were obtained from a multigeneration life-cycle test with the rotifer, and a flow-through
early life stage (ELS) test with the sheepshead minnow. Copper concentrations were measured in
the test chambers of both tests. As for the acute values, the chronic values presented below are
BLM-normalized and are relevant (for comparison purposes across species) only at the selected
water chemistry values specified, but are used to allow the BLM model to predict the criteria in
any water chemistry condition.
The static multigeneration life cycle test with the rotifer, conducted by Arnold et al.
(2010b), was used to develop an acute-chronic ratio for the species (Table 6). Neonates were
exposed to seven copper concentrations in artificial seawater for 96 hours (Note: due to the life
history of this short-lived organism, this duration represents a chronic exposure). The intrinsic
rate of rotifer population increase was negatively affected (37% decrease) at 10.3 μg/L dissolved
copper, but not at 6.1 μg/L, with a MATC value of 7.927 μg/L. The authors reported an EC20 of
10.9 μg/L dissolved copper, or 13.23 μg/L once BLM normalized. Dividing the 48-hr LC50s from
this study by the EC20 resulted in an ACR of 1.229 (13.4 μg/L/10.9 μg/L) when the rotifers were
not fed in the acute test, and an ACR of 1.908 (20.8 μg/L /10.9 μg/L) when the rotifers were fed
in the acute test (Appendix Table B-2).
The ELS test with sheepshead minnow did not provide concentration-response data and
regression analysis could not be done. In the 28-day ELS test, growth was reported to be a more
sensitive endpoint than mortality, and the chronic value for growth was 249 μg total Cu/L (or
226.8 μg dissolved Cu/L). The BLM normalized MATC is 204.1 μg/L dissolved copper.

47
Dividing the 96-hr LC50 from this study by the 28-day chronic value (368/249 μg/L) resulted in
an ACR of 1.475 (Appendix Table B-2).
Table 6. Ranked Estuarine/Marine Genus Mean Chronic Values with Species Mean Acute-
Chronic Ratios.
(All values were normalized to select water chemistry conditions, see Section 3.3).
Rank
Genus Mean
Chronic Value
(μg/L) Genus Species
Species Mean
Chronic Value
(μg/L)a ACR
2 204.1 Cyprinodon Sheepshead minnow,
Cyprinodon variegatus 204.1 1.475
1 13.23 Brachionus Rotifer,
Brachionus plicatilis 13.23
1.229 /
1.908 fed a From Appendix Table B-1.
Other chronic toxicity data deemed unacceptable for quantitative use in the criteria
derivation (Appendix Table E-1), but generally considered to be representative were evaluated
to determine ACRs for additional species for purposes of comparison. A 28-day LC50 of 56 μg/L
was reported for the polychaete, Neanthes arenaceodentata (Pesch and Hoffman 1982), which
yields an ACR of 2.298 when divided into the SMAV of 128.7 μg/L. Pesch et al. (1979) reported
an EC50 of 5.8 μg/L for reduced growth for the bay scallop, Argopecten irradians, based on
exposure to copper for 42 days. Division of the SMAV (25.01 μg/L) by this value gives an ACR
of 4.312. Data for these two additional invertebrate species, although not used quantitatively in
the criteria derivation, are consistent with and generally support the lower (<2) ACRs given for
the rotifer and sheepshead minnow.
3.3 Summary of BLM Water Quality Input Parameters
Table 7 summarizes the selected water quality input parameters used for the saltwater
BLM normalization. The designation of these parameters is not in and of itself important other
than to define a consistent set of conditions to which to normalize all the data. The LC50 and
EC50 values presented in Appendix Table A-1 were standardized to these specified water
chemistry conditions (see footnote “e”). The reported chemistry for each individual study is
presented in Appendix Table H-1 and summary statistics of all the test conditions are provided
in Appendix Table H-2. Likewise, the estuarine/marine chronic values in Appendix Table B-1
are normalized to the same specified water chemistry conditions. These inputs were standardized

48
in order to perform calculations with a consistent set of parameters and to ensure the selection of
these parameters does not affect either the rank order of the species sensitivity distribution or the
resulting criteria calculations (Di Toro et al. 2001). Following normalization of the data
presented in Appendix Table A-1, the BLM can be used to calculate an FAV which accounts for
changes to any variable included in the model (i.e., temperature, pH, salinity, and DOC). DOC is
typically the most important variable because pH tends to have limited variation in marine water,
while salinity and temperature have a lesser effect on copper bioavailability than does DOC.
Table 7. Water Quality Input Parameters Used for Saltwater BLM-Normalization.
Saltwater BLM Input Parameters Saltwater BLM Input Value
Temperature 22°C
pH 8
DOC 1.0 mg/L
Salinity 32 ppt
3.4 Bioaccumulation
Copper bioaccumulates in aquatic organisms, although increased accumulation through
trophic levels in aquatic food chains (i.e., biomagnification) is not usually observed (Lewis and
Cave 1982; Suedel et al. 1994). Total uptake generally depends on the environmental copper
concentration, exposure route and the duration of exposure (McGeer et al. 2000).
Bioconcentration Factors (BCFs) typically vary with the bioavailable concentration of copper in
water, with higher BCFs occurring at lower copper concentrations (McGeer et al. 2003; U.S.
EPA 2010a). Some of the highest reported BCFs for copper are for marine and freshwater
bivalves (Hamelink et al. 1994). Copper bioavailability and toxicity is promoted by oxine and
other lipid soluble synthetic organic chelators in marine ecosystems (Bryan and Langston 1992).
In marine sediments, bioavailability is altered by increased acid volatile sulfide (AVS) content
(Casas and Crecelius 1994), and ligand concentration (Skrabal et al. 2000). A more detailed
discussion of bioaccumulative factors is provided in the Effects Characterization (Section 4.3).
3.5 Toxicity to Aquatic Plants
No acceptable estuarine/marine copper toxicity tests are available for algal or aquatic
vascular plant species for which the concentrations of test material were measured. Therefore, a

49
Final Plant Value (FPV) could not be determined. Effects on aquatic plants are discussed
qualitatively in the Effects Characterization (Section 4.4).
3.6 The National Estuarine/Marine Criteria for Copper
3.6.1 Acute Criterion Calculation
Acceptable acute toxicity values are available for 89 species representing 63 taxonomic
families (Table 3). The ranked GMAVs are presented in Figure 9 and the ranked SMAVs and
summaries of acute toxicity test data for individual species are shown in Figure 10 for
comparison. Because more than 59 GMAVs were available for copper, the FAV was derived
from the four GMAVs that have cumulative probabilities closest to the 5th percentile toxicity
value for all the tested genera. The 5th percentile of the species sensitivity distribution, equivalent
to the FAV, was estimated as 9.138 µg/L (Table 8) (Note: the FAV changes with respect to the
conditions at the site, and the values represented below only apply to the selected conditions in
Table 7). For previous estuarine/marine criteria, the FAV was lowered to protect commercially
and recreationally important mussel species. For these data, a value that is protective of
commercially and recreationally important species would involve lowering the FAV to the
SMAV for Haliotis rufescens, which is the lowest SMAV amongst commercially and
recreationally important species with a value of 3.944 μg/L. The calculated FAV was therefore
lowered to the SMAV for H. rufescens and the CMC was set to this lowered FAV divided by
two (3.944/2=2.0 μg/L) (Table 8).

50
Table 8. Estuarine/Marine Water Final Acute Value (FAV) and Criteria Calculations.
(All values were normalized to select water chemistry conditions see Section 3.3).
N Rankb Genus GMAV ln(GMAV) ln(GMAV)2 P=R/(N+1) sqrt(P)
78 5 Holmesimysis 9.572 2.26 5.10 0.063 0.252
4 Haliotis 9.153 2.21 4.90 0.051 0.225
3 Paralichthys 8.848 2.18 4.75 0.038 0.195
2 Tigriopus 7.847 2.06 4.24 0.025 0.159
Sum:
8.71 19.00 0.177 0.831
S2 = 4.575
L = 1.734
A = 2.212
FAV (calculated) = 9.138
FAV (H. rufescens lowered) = 3.944
CMCa = 2.0
Where, S=slope, L=intercept, A=ln(FAV); and FAV=final acute value a When the temperature=22°C, pH=8, DOC=1.0 mg/L, and salinity=32 ppt. b According to the Guidelines, ranks 2-5 are used in the calculation of the FAV (Stephan et al.
1985).
The recommended CMC of 2.0 μg/L is specific for the seawater chemistry specified in
Table 7, which consists of the following physical and chemical parameter assumptions:
temperature=22°C, pH=8, DOC=1.0 mg/L and salinity=32 ppt. The BLM analysis can be
adjusted to incorporate different physical and chemical parameters to be protective of aquatic life
under varied conditions (see Appendix I).

51
Figure 9. Ranked Estuarine/Marine GMAVs.

52
Figure 10. Reported Dissolved Cu LC50s Ranked by the Geomean of the Normalized Cu Values (i.e., SMAVs).
(For each species, the box shows the range from the 25th to the 75th percentile of the available BLM normalized EC50s, and the geometric mean
SMAV is shown by the horizontal line within the box. The whiskers show the maximum and minimum values, exclusive of outlier points. Outliers
are shown as individual symbols. Test species are identified on the x-axis labels using species numbers listed in Appendix Table G-1).

53
3.6.2 Chronic Criterion Calculation
The Criterion Continuous Concentration (CCC) can be derived either from chronic values
if the MDRs are met, or from the FAV divided by a FACR (Stephan et al. 1985). Since
estuarine/marine chronic values are available for only two species and the MDR is not met, the
FAV divided by the FACR was used to determine the CCC.
Two valid estuarine/marine ACRs are available for copper (Table 6). The sheepshead
minnow, Cyprinodon variegatus, is a relatively insensitive estuarine/marine water species on an
acute basis, with a GMAV falling at approximately the midway point of sensitivity of all the
tested estuarine/marine genera (Rank 44), while the rotifer Brachionus plicatilis is more
sensitive, with a GMAV falling within the lower quarter of the all tested species (Rank 15)
(Table 5). The lowest estuarine/marine acute values are from tests with embryos and larvae of
molluscs and embryos of summer flounder, which are also likely to be the most sensitive life
stages of these species. Although estuarine/marine ACRs are not available for these sensitive
species, ACRs are available for the most acutely sensitive freshwater species tested to date for
copper (Appendix Table B-2).
Individual ACRs varied amongst studies ranging from <1 (0.142) for Ceriodaphnia dubia
(Harmon et al. 2003) to 191.6 for the snail, Campeloma decisum (Arthur and Leonard 1970).
Species mean ACRs ranged from 1.229 for the rotifer, B. plicatilis to 171.2 for the freshwater
snail, C. decisum. The Guidelines outline four primary ways to combine ACRs to calculate an
appropriate FACR.
If the species mean acute-chronic ratios seems to increase or decrease as the SMAV
increases, the Final Acute-Chronic Ratio should be calculated as the geometric mean of
the acute-chronic ratios for species whose SMAVs are close to the Final Acute Value.
If no major trend is apparent and the acute-chronic ratios for a number of species are
within a factor of ten, the Final Acute-Chronic Ratio should be calculated as the
geometric mean of all the species mean acute-chronic ratios available for both freshwater
and saltwater species.
For acute tests conducted on metals and possibly other substances with embryos and
larvae of barnacles, bivalve molluscs, sea urchins, lobsters, crabs, shrimp, and abalones,
it is probably appropriate to assume that the acute-chronic ratio is 2. Thus, if the lowest
available SMAVs were determined with embryos and larvae of such species, the Final
Acute-Chronic Ratio should probably be assumed to be 2, so that the Final Chronic Value
is equal to the Criterion Maximum Concentration.

54
If the most appropriate species mean acute-chronic ratios are less than 2.0, and especially
if they are less than 1.0, acclimation has probably occurred during the chronic test.
Because continuous exposure and acclimation cannot be assured to provide adequate
protection in field situations, the Final Acute-Chronic Ratio should be assumed to be 2,
so that the Final Chronic Value is equal to the Criterion Maximum Concentration.
Since the available ACRs are not within a factor of 10, and because a relationship is
evident between acute sensitivity and ACRs, the FACR was calculated as the geometric mean of
the ACRs for species with SMAVs close to the FAV, and that have taxonomically related marine
species. The FACR of 3.022 was calculated as the geometric mean of the genus mean ACRs for
five sensitive freshwater genera, Ceriodaphnia (3.268), Daphnia (4.057), Oncorhynchus (3.630),
Acipenser (5.757) and Cottus (2.075), along with the two estuarine/marine genus mean ACRs for
Cyprinodon (raised to 2.0) and Brachionus (raised to 2.0) (Appendix Table B-2). The final
chronic value (FCV) for copper at the selected water chemistry (Table 7) is the FAV of 3.944
μg/L (lowered to protect H. rufescens) divided by the FACR and equals 1.3 μg/L Cu. The CCC,
which is equivalent to the FCV, is lower than the two acceptable GMCVs available for copper
(Figure 11) at the specified chemistry.

55
Figure 11. Ranked Estuarine/Marine GMCVs.
3.7 Summary of National Criteria
The resulting recommended ambient WQC indicate that estuarine/marine aquatic
organisms would have an appropriate level of protection if the 1-hour average and four-day
average dissolved copper concentrations do not respectively exceed the acute and chronic criteria
concentrations calculated by the saltwater BLM more than once every three years on average.
For the 2016 acute criteria, EPA has changed the duration to 1 hour from the 24 hours EPA
applied in the 2003 draft copper criteria document and the 2007 freshwater copper criteria
document. EPA made this change to the 2016 criteria to reflect the acute criteria duration
recommended in the Guidelines (see Section 4.1.2). The WQC numeric values will change in
response to changes in water quality parameters (i.e., temperature, salinity, dissolved organic
carbon and pH).

56
For example, at the selected water chemistry conditions chosen for BLM-normalization
(temperature=22°C, pH=8, DOC=1.0 mg/L and salinity=32 ppt), the resulting recommended
ambient WQC indicate that estuarine/marine aquatic organisms would have an appropriate level
of protection if the 1-hour average dissolved copper concentration does not exceed 2.0 µg/L
more than once every three years on average, and if the four-day average dissolved copper
concentration does not exceed 1.3 µg/L more than once every three years on average. There may
be an exception, however, if a locally important species is more sensitive.
The BLM can be used to adjust criteria values to be protective under different
temperature, pH, DOC, and salinity conditions. For example, when the site conditions are
changed to assume a temperature=20°C, pH=8, DOC=4.0 mg/L and salinity=15 ppt (which may
be typical conditions for an estuary with moderate DOC concentrations), the resulting CMC and
CCC are 7.1 and 4.7 µg/L, respectively. Appendix I provides a discussion of temperature, pH,
DOC and salinity conditions expected to occur in estuarine and marine waters around the United
States, a discussion of environmental variables affecting each of these conditions, and additional
examples of numeric criteria values for copper depending on selected water quality inputs.
3.8 Identification of Data Gaps for Aquatic Organisms
3.8.1 Chronic Toxicity Data for Estuarine/Marine Animals
Limited acceptable chronic copper toxicity data are available for estuarine/marine animal
species. Studies are available for only two estuarine/marine animal species, as discussed in
Section 3.2. The FCV is therefore based on the use of a FACR. The FACR assumes that the
relationship between acute and chronic toxicity for each species is constant. Acceptable ACRs
are averaged across taxa to calculate the final overall relationship between the acute and chronic
toxicity values. Since freshwater ACRs are used to bolster the calculation of the FACR, due to
only two estuarine/marine genus-level ACRs being available, this creates an additional
uncertainty in the estuarine/marine FCV.
3.8.2 Chronic Toxicity Data for Aquatic Vascular Plants and Algae
Acceptable toxicity data are limited for aquatic vascular plants and algae for which the
concentrations of test material were measured. Accordingly, the available plant data did not meet
the MDRs established in the Guidelines to support the derivation of a plant-based value
(Appendix Table C-1). However, analysis of the toxicity data that are available for

57
estuarine/marine plant species, which is discussed in Section 4.4, suggests that a chronic
criterion value that is protective of estuarine/marine animals would also be protective of aquatic
plants (see Section 4.4).
3.8.3 BLM Uncertainties and Performance
The BLM used to update the estuarine/marine copper criteria employs equilibrium
reactions for copper and other anions/cations using a single and simple type of surface ligand to
characterize the effects of all physical and chemical exposure conditions on toxicity. As such, the
model is a simplified and approximate representation of a complex set of chemical reactions and
transfers that are involved with environmental copper eliciting toxicity. As already noted, cation
effects may involve mechanisms in addition to competition for a surface ligand. Further, the
microenvironment at the gill surface and other biological membranes of toxic interaction for
juvenile and adult fish might change copper speciation, but the most sensitive organisms to
which the criteria are applicable (and likely to determine the FAV) are embryo-larval life stages
of invertebrates that do not have a gill microenvironment. Finally, because the biotic ligand
refers to specific binding sites in the organism, accumulation measurements taken from digests
of whole embryonic stages, or based on bulk gill tissue could include metal in addition to that
bound to the biotic ligand, including metal that has been taken up and transported by the cell or
organ.
Despite the uncertainties described in this section, the BLM provides a reasonable
mechanistic framework for the well-established effects of copper speciation, explicitly
addressing the relative bioavailability of different copper species. It also includes a plausible
mechanism that allows the effects of cations to be addressed and uses a comprehensive model for
calculating the concentrations of various copper species. Even if the mechanistic descriptions are
incomplete, this model allows the major empirical effects of complexing ligands and competing
cations to be described in a more comprehensive and reasonable fashion than other approaches
(U.S. EPA 2007).

58
4 EFFECTS CHARACTERIZATION
The Effects Characterization section evaluates the potential effects of copper on
estuarine/marine aquatic life based on available test data and describes additional lines of
evidence that were not used directly in the criteria calculations, but which support the 2016
aquatic life criteria values. This section also provides a summary of uncertainties and
assumptions, and explanations for decisions about the acceptability and use of data in the effects
assessment. Finally, this section describes substantive differences between the 2003 draft copper
ALC and the 2016 update, based on incorporation of the latest scientific information.
All acceptable acute and chronic values used to derive criteria are presented in Appendix
Table A-1 and Appendix Table B-1, respectively. Studies that were determined to be
scientifically sound, but not meeting with screening guidelines for inclusion in criteria
calculations are presented in Appendix Table E-1. Studies that were not used qualitatively or
quantitatively in the criteria development and the reason they were not used are provided in
Appendix Table F-1.
4.1 Estuarine/Marine Acute Toxicity Data
Acceptable acute toxicity data are available for 89 estuarine/marine species representing
78 genera. These data were used to support the development of an estuarine/marine acute
criterion.
Aquatic invertebrates are more acutely sensitive to copper than fish in the marine
environment. Amongst the ten most sensitive genera to copper, nine are invertebrates and are
primarily represented by bivalves and echinoderms. BLM-normalized SMAVs for copper range
from 3.944 to 81,550 µg/L. The most sensitive genus is the mussel Mytilus, followed by the
copepod, Tigriopus, with BLM-normalized GMAVs of 5.577 and 7.847 µg/L, respectively. The
two most tolerant genera were the amphipod, Corophium, and the clam, Rangia, with BLM-
normalized GMAVs of 81,550 and 43,694 µg/L, respectively (Table 5).
Several studies were identified as not meeting screening guidelines for inclusion in
criteria calculations (Appendix Table E-1), but showed similar ranges of toxicity for a number
of the most sensitive species (Note: the values below were BLM-normalized to the same water
quality parameters in Table 7). Manley et al. (1984) reported a 72-hr LOEC of 4.258 µg/L
copper to Mytilus edulis, which is similar to the GMAV for the genus (5.577 µg/L). Similarly,

59
Fitzpatrick et al. (2008) observed increased abnormal larval development of Mytilus trossulus
embryos exposed to 4.623 µg/L copper for 48 hours. The Pacific oyster, Crassostrea gigas, was
investigated by several authors and acute effect levels were observed at concentrations ranging
from 1.890 to 65.90 µg/L copper for embryos exposed from one to three days, which is similar to
the SMAV of 11.94 µg/L for the species (Brooks et al. 2007; Harrison et al. 1981; Worboys et al.
2002). Eisler (1977) reported a 7-day LC50 of 16.22 µg/L copper for the soft-shell clam Mya
arenaria, which is close to the GMAV of 23.03 µg/L reported for this species.
For fish, Anderson et al. (1994) reported 7-day LC50s for topsmelt, Atherinops affinis,
larva that ranged from 25.46 to 78.71 µg/L copper. Pacific herring embryos, Clupea harengus
pallasi, non BLM-normalized acute effect levels ranged from 33 to 900 µg/L copper (Rice and
Harrison 1978). A 4-day LC50 of >164.4 µg/L copper was reported for larva of the sheepshead
minnow, Cyprinodon variegates (Hutchinson et al. 1994). Cobia, Rachycentron canadum, 4-day
LC50s ranged from 25.75 to 130.1 µg/L copper (Dung et al. 2005). The acute effect levels
observed for all these species are similar to the BLM-normalized GMAV (64.20 µg/L copper)
reported for the cabezon, Scorpaenichthys marmoratus, which was the second most sensitive fish
species (Rank 22, Table 5) with acceptable acute data.
4.1.1 Uncertainty in the Estuarine/Marine FAV Calculation
A number of uncertainties are associated with calculation of the FAV as described in the
Guidelines (Stephan et al. 1985), and include use of limited data for a species or genus,
application of safety factors, and extrapolation of laboratory data to the field. There are a number
of cases in the acute database where only one acute test is used to determine the SMAV, and
subsequently the GMAV is based on the one acute test. In this situation, species variability
within a particular genus is unknown. The GMAV is still valid, in spite of absence of these
additional data.
The final step in the acute criteria derivation process is to divide the FAV by a safety
factor of 2 to yield the CMC. The CMC is set as equal to half of the FAV to represent a low level
of effect for the fifth percentile genus, rather than a 50% effect. This adjustment factor was
derived from an analysis of 219 acute toxicity tests with a variety of chemicals (see 43 FR
21506-21518 for a complete description) where mortality data were used to determine the
highest tested concentration that did not cause mortality greater than that observed in the control

60
(or between 0 and 10%). Application of this safety factor is justified because that concentration
represents minimal acute toxicity to the species.
Application of water-only laboratory toxicity tests to develop water quality criteria to
protect aquatic species is a basic premise of the Guidelines, supported by the requirements of a
diverse assemblage of eight families and the protection of 95 percent of all species. Confirmation
has been reported by a number of researchers (Clements and Kiffney 1996; Clements et al. 2002;
Mebene 2006; Norgberg-King and Mount 1986), thereby indicating that on the whole,
extrapolation from the laboratory to the field is a scientifically valid and protective approach for
aquatic life criteria development.
4.1.2 Acute Criteria Duration
For the 2016 acute estuarine/marine copper criteria, EPA has changed the duration to 1-
hour from the 24 hours EPA applied in the 2003 draft copper criteria document and the 2007
freshwater copper document. EPA made this change to the 2016 criteria to reflect the acute
criteria duration recommended in the Guidelines. Both the 2003 and 2007 copper criteria
documents used a 24-hour duration, but did not detail the rationale for this duration, and EPA has
further examined this issue as part of the 2016 criteria update.
EPA revised the acute duration in this document to be consistent with the more protective
1-hour duration, which is generally supported by and consistent with the Guidelines. The
Guidelines, for example, states the following:
“For the CMC the averaging period should again be substantially less than the lengths of
the tests it is based on, i.e., substantially less than 48 to 96 hours. One hour is probably
an appropriate averaging period because high concentrations of some materials can
cause death in one to three hours. Even when organisms do not die within the first hour
or so, it is not known how many might have died due to delayed effects of this short of an
exposure. Thus it is not appropriate to allow concentrations above the CMC to exist for
as long as one hour. The durations of the averaging periods in national criteria have
been made short enough to restrict allowable fluctuations in the concentration of the
pollutant in the receiving water and to restrict the length of time that the concentration in
the receiving water can be continuously above a criterion concentration.” (Stephan et al.
1985, page 5)

61
…“the one-hour average should never exceed the CMC.” (Stephan et al. 1985, page 6)
Additional information supporting the 1-hour averaging period is presented in the
Technical Support Document for Water Quality-based Toxics Control (U.S. EPA 1991) which
states:
“For acute criteria, EPA recommends an averaging period of 1-hour. That is, to protect
against acute effects, the 1-hour average exposure should not exceed the CMC. The 1-
hour acute averaging period was derived primarily from data on response time for
toxicity to ammonia, a fast-acting toxicant. The l-hour averaging period is expected to be
fully protective for the fastest-acting toxicants, and even more protective for slower-
acting toxicants.” (U.S. EPA 1991, page 35)
The frequency of allowed exceedances is once in three years on average, as recommended
in the Guidelines (Stephan et al. 1985). This is based on the ability of aquatic ecosystems to
recover from criteria exceedances, which will depend in part on the magnitude and duration of
the exceedance(s).
4.2 Estuarine/Marine Chronic Toxicity Data
Data for only two estuarine/marine species are suitable for derivation of a chronic
criterion. Suitable data are available for the rotifer, Brachionus plicatilis (BLM-normalized
SMCV=13.23 µg/L dissolved Cu) and the sheepshead minnow, Cyprinodon variegatus (BLM-
normalized SMCV=204.1 µg/L dissolved Cu).
Several studies that were identified as not meeting with screening guidelines for inclusion
in criteria calculations reported chronic sublethal effects of copper on estuarine/marine
invertebrates (Appendix Table E-1). The following data are BLM-normalized, unless noted.
Three scleractinian coral species along with their algal symbionts were exposed to three
measured copper concentrations for five weeks under flow-through conditions (Bielmyer et al.
2010). The authors reported reduced growth chronic values of 14.69, >20.31 and <4.04 µg/L
copper (not BLM-normalized) for Acropora cervicornis, Montastraea faveolata and Pocillopora
damicornis, respectively. Pesch et al. (1979) reported reduced growth for the bay scallop,
Argopecten irradians, after exposure to 3.681 µg/L copper for 42-days. Gill alterations were
observed by Frias-Espericueta et al. (2008a) in juvenile whiteleg shrimp, Litopenaeus vannamei,

62
after exposure to 80.61 µg/L copper for 28 days. The 26 to 28-day LC50s for the polychaete
worms, Cirriformia spirabranchia and Neanthes arenaceodentata, ranged from 25.53 to 35.97
µg/L copper (Milanovich et al. 1976; Pesch and Hoffman 1982; Pesch and Morgan 1978).
Channeled whelk, Busycon canaliculatum, Mediterranean mussel, Mytilus galloprovincialis, and
quahog clam, Mercenaria, 28- to 77-day LC50 effect levels ranged from 25 to 470 µg/L copper
(not BLM-normalized) (Bat et al. 2013; Betzer and Yevich 1975; Shuster and Pringle 1968).
Limited chronic data are available for estuarine/marine fish species. Lacoue-Labarthe et
al. (2010) exposed cuttlefish (Sepia officinalis) eggs to four unmeasured copper concentrations
for 50 days and reported a hatchling weight NOEC and LOEC of 2.3 and 23 µg/L (not BLM-
normalized), respectively. Several authors (Engel et al. 1976; Swedmark and Granmo 1981)
conducted 14-day exposures for different species and reported copper not BLM-normalized LC50
effect levels of 10 µg/L for the Atlantic cod, Gadus morhua, 150 µg/L for the pinfish, Lagodon
rhomboids, 160 µg/L for the spot, Leiostomus xanthurus, 210 µg/L for the Atlantic croaker,
Micropogonias undulates, and 610 µg/L for the Atlantic menhaden, Brevoortia tyrannus.
Although the exposure periods were shorter than typically used for chronic studies, these data
indicate response concentrations that are generally similar to the chronic effect level reported by
Hughes et al. (1989) for sheepshead minnow, Cyprinodon variegatus (BLM-normalized
SMCV=204.1 µg/L dissolved Cu), which was the only estuarine/marine fish for which
acceptable chronic toxicity data were available.
4.2.1 Uncertainty in the Estuarine/Marine FCV Calculation
In addition to the uncertainties described above for the acute criteria derivation (Section
4.1.1) and identification of data gaps (Section 3.8.1), the estuarine/marine FCV calculation is
also influenced by the estimation of chronic values with MATC methods. The estimation of
chronic values with an EC20 regression analysis is preferred over the use of MATCs because
MATCs are highly dependent on the concentrations tested and can therefore potentially bias the
chronic value either higher or lower than the EC20. Point estimates also provide additional
information that is difficult to determine with an MATC, such as a measure of effect level across
a range of tested concentrations. A MATC was used to determine the chronic value for the
sheepshead minnow, whereas an EC20 was estimated for the rotifer.

63
4.3 Bioaccumulation
Bioconcentration factors (BCFs) for copper in estuarine/marine water are provided in
Appendix Table D-1. In estuarine/marine water, the polychaete worms, Phyllodoc maculate,
Neanthes arenaceodentata and Eudistylia vancouveri, had copper BCFs of 2,500, 2,950 and
1,006, respectively (McLusky and Phillips 1975; Pesch and Morgan 1978; Young et al. 1979).
BCFs for six species of estuarine/marine bivalve molluscs range from 790 for the soft-shell clam,
Mya arenaria (Shuster and Pringle 1968), to 57,000 for the Pacific oyster, Crassostrea gigas
(Han and Hung 1990). Similarly, Shuster and Pringle (1968) found that the eastern oyster,
Crassostrea virginica, could concentrate copper to levels 27,800 times greater than ambient
water concentrations during a 140-day continuous exposure to 25 μg/L copper. Even though the
tissue of the oyster became bluish-green, mortalities were only slightly greater than in the
controls. There are no BCF data for estuarine/marine fish or crustaceans meeting the data quality
objectives required for inclusion in Appendix Table D-1 of this document.
4.3.1 Uncertainty with Copper Exposure Routes
Aquatic organisms can accumulate copper from both aqueous and dietary exposure
routes. The relative importance of each, however, is dependent upon the species. The filter
feeding oyster Crassostrea gigas was found to accumulate more copper from ambient water than
from phytoplankton food items (Ettajani et al. 1992), as did the suspension feeding cockle,
Cerastoderma edule (Absil et al. 1996). Guo et al. (2013) exposed the abalone, Haliotis discus
hannai, for eight weeks to either aqueous or dietary copper and observed that substantially more
copper was accumulated in muscle tissue from the water exposure (10.8 fold increase) than the
macroalgae diet (2.0 fold increase). Similar copper absorption efficiency or accumulation levels
from water and diet were observed by Absil et al. (1994) for the sediment-dwelling bivalve,
Macoma balthica (efficiencies ranged from 71-87% in aqueous exposures and from 78-90% in
foodborne exposures), and by Long and Wang (2005) for the marine target fish, Terapon jarbua
(approximately two-fold increase for both). Pinho et al. (2007) also observed similar waterborne
and waterborne plus dietborne copper accumulation for the copepod Acartia tonsa, irrespective
of the salinity level (5, 15 and 30 ppt). Although accumulation decreased as salinity increased, no
significant differences were observed between the exposure routes at each salinity exposure
(from approximately 6.5 to 11.5 fold increases). Copper burdens in blackhead seabream
Acanthopagrus schlegelii schlegelii intestine and liver after aqueous exposure (130 and 110 µg/g

64
dw, respectively) were comparable to those after dietary exposure (140 and 95 µg/g dw,
respectively) (Dang et al. 2012). In contrast, Bielmyer et al. (2005a) found significantly higher
copper accumulation in the intestine and liver of saltwater-acclimated hybrid striped bass
(Morone chrysops x Morone saxatilis) exposed to dietary copper (approximately 8-fold and 2-
fold increases, respectively) than those exposed to aqueous copper (no significant increases). In
summary, the primary route of copper accumulation varies among species, with no consistent
pattern.
The specific tissues/organs affected in an aquatic organism are also dependent on the
exposure route. Several authors have postulated that copper speciation influences exposure route
and the subsequent tissues and organs affected (Henry et al. 2012; Martins et al. 2011; Wang and
Fisher 1996). Bivalve molluscs and crustaceans primarily accumulate dissolved metals across the
gills, and particulate forms within the gut. In crustaceans, aqueous metals can be adsorbed to the
body surface or taken up internally by ingestion, passive diffusion, or facilitated transport (Wang
and Fisher 1998). For example, dissolved copper adsorbs onto the chitosan exoskeleton of
pelagic and benthic crustaceans (Henry et al. 2012; Hook and Fisher 2001), or inert chitin
surfaces of insects (Hare 1992), where it is rendered unavailable to interfere with internal
metabolic processes. In contrast, ingested copper can accumulate into internal tissues potentially
interfering with a variety of metabolic and reproductive processes (Hook and Fisher 2001).
Copper assimilated from food is stored in the soft tissue of oysters (Amiard-Triquet et al. 1992).
Lobsters accumulate aqueous copper primarily in their gills (Canli and Furness 1993), with most
of the dietary copper deposited in the digestive gland (Chou et al. 1987).
In marine fish, uptake of dissolved copper is either by the gills or the intestinal tract, and
is sometimes influenced by ambient water and dietary levels (Grosell 2012). Accumulation of
dissolved copper by the gills can be by either passive (diffusion) or active (pump) transport (Neff
2002). Aqueous accumulation of copper via intestinal tissues is due to the ingestion of seawater
for osmoregulatory purposes (Grosell et al. 2003, 2004). Fish exposed to metals in the presence
of food initially absorb copper in the intestinal tract and to some degree the stomach, and
subsequently transfer it to other tissues via the circulatory system (Wood et al. 2012). Water-
borne copper primarily accumulated in the gill of the skate, Raja erinacea, and the sculpin,
Myoxocephalus octodecemspinosus (Gosell et al. 2003). However, Blanchard and Grosell (2005)
exposed the killifish, Fundulus heteroclitus, to aqueous copper at different salinities and

65
observed the highest accumulations in the liver, gill and intestine. In comparison, dietary copper
(as copper contaminated oysters) accumulated mainly in the intestine and to some extent the gill
of the killifish, Fundulus heteroclitus (Blanchard et al. 2009).
In an effort to determine the most toxic exposure route, three studies have compared the
adverse effects of copper to marine organisms exposed separately to both aqueous and dietary
copper. Bielmyer et al. (2005a) exposed saltwater-acclimated (15 ppt salinity) hybrid striped bass
(Morone chrysops x Morone saxatilis) to dietary (571 to 1013 µg Cu/g), aqueous (22 to 44 µg
Cu/L) and dietary plus aqueous copper concentrations for 42 days. None of the exposures
scenarios had significant growth effects when compared to controls, although the authors noted
that the dietary copper exposed fish had significant liver and intestinal copper accumulation.
Conversely, Lauer and Bianchini (2010) observed exposure route differences when a copepod
(Acartia tonsa) was exposed for six days to either dietary, aqueous or dietary plus aqueous
copper concentrations at three different salinities (5, 15, 30 ppt). The copepods were exposed to
three concentrations of aqueous copper, fed diatoms that were exposed to three aqueous
concentrations of copper for 24 hours, or a combination of both. Pulsed exposures lasted 12
hours each day over the six-day experiment, after which the copepods were transferred to clean
media and allowed to reproduce for 24 hours. The water only exposure was the most toxic
exposure route, with reduced egg production EC50s of 9.9, 36.8 and 48.8 μg/L dissolved copper,
followed by the dietary plus aqueous exposure with EC50s of 40.1, 63.7 and 109.9 μg/L dissolved
copper at 5, 15 and 30 ppt, respectively. The diet only exposures exhibited the least effect, with a
maximum of 43 percent reduction in reproduction regardless of exposure concentration or test
salinity. A similar toxicological difference in exposure routes was observed in a 28-day study of
juvenile blackhead seabream (Acanthopagrus schlegelii schlegelii) that was either fed a
contaminated diet of copper or exposed to only copper in seawater. When based on similar
estimated influx rates, the aqueous exposure was more toxic (31 percent mortality) than the diet
only exposure (<10 percent mortality) (Dang et al. 2012).
Several other investigators examined the toxic effects of dietary copper exposures to
marine organisms. Roberts et al. (2006) observed reduced survival of juvenile amphipods
(Peramphithoe parmerong) fed a contaminated macroalgae that was cultured in a spiked solution
containing 100 μg/L copper for 30 days. However, spiked solutions of up to 300 μg/L copper had
no effect on the growth of survivors. Juvenile grey mullet (Chelon labrosus) fed a high-Cu diet

66
of 2,400 μg/g dry weight for 67 days did not experience any mortality, but growth rate was
reduced by 43 percent (Baker et al. 1998). Sea urchins (Lytechinus variegatus) fed two copper
containing formulated diets (36 or 144 μg Cu/g) over twelve weeks had no significant difference
in mortality, total diameter and total dry weight compared to the controls that were fed 12 µg
Cu/g (Powell et al. 2010). Similarly, no death was observed when juvenile rock fish (Sebastes
schlegeli) were fed one of four copper diets (50, 100, 250, 500 μg/g) for 60 days, but the specific
growth rates for weight and length were reduced at 100 μg Cu/g and 250 μg Cu/g, respectively
(Kang et al. 2005; Kim and Kang 2004). Lin et al. (2008) fed juvenile grouper (Epinephelus
malabaricus) copper diets with eight different copper concentrations ranging from 0.11 to 20.05
µg Cu/g for eight weeks. Weight gain and feed efficiency was significantly greater in diets
containing 4.37 and 6.56 μg Cu/g, but was less in diets with ≤1.66 or ≥11.03 μg Cu/g. Survival
in all exposures was ≥80 percent with no dose-response observed amongst treatments. No
mortality was observed when adult male crabs (Neohelice granulata) were fed copper dosed
algae (300 μg Cu/g) twice a week for five weeks. However, it should be noted that the exposure
regime was equivalent to mean weekly doses of 6 μg Cu/g per crab (Sabatini et al. 2009).
Bielmyer et al. (2006b) exposed adult copepods (Acartia tonsa) to four copper-enriched
diatom diets for seven days at a salinity of 30 ppt. The authors reported the 7-day reproductive
EC20 as 22.3 µg Cu/g dry weight, or 1.2 µg Cu/L (the lowest diatom medium exposure
concentration). In contrast, Lauer and Bianchini (2010) observed a diet-only 6-day reproductive
EC20 of 23 µg Cu/g dry weight at a salinity of 30 ppt, or 40.1 µg Cu/L based on the diatom
culture medium. In addition, they reported waterborne reproductive EC20s ranging from 8.3 to
27.4 μg Cu/L. A review by Deforest and Meyer (2015) compared the results of these two studies
and noted the following study design differences which may explain why the waterborne copper
effect levels are different: 1) the dilution water in the Lauer and Bianchini (2010) study had a
higher DOC level; 2) two different species of diatoms were used; 3) the diatoms were exposed
for seven days in the Bielmyer et al. (2006b) study versus only 24 hours; and 4) the feeding
regimes differed between the two studies. In addition, the Bielmyer et al. (2006b) study had
unacceptable control survival (<80 percent) for a chronic test, which suggests that the test
organisms may have been subjected to stresses other than copper during the exposure. So, while
the 1.2 μg Cu/L effect concentration from the Bielmyer et al. (2006b) appears to be low, it may
not be representative of the copper water effect concentration to this species. And as discussed

67
earlier in Section 2.3, the apparent lack of aquatic food chain biomagnification (Lewis and Cave
1982; Suedel et al. 1994) reduces the risk to higher trophic level predators including aquatic
dependent wildlife.
Understanding the toxicological link between accumulated metal tissue levels and the
observation of adverse effects remains difficult to characterize, and therefore has received
considerable interest in recent years (Adams et al. 2011; Mebane 2006; Wood et al 2012). The
poorly understood link between copper tissue levels and corresponding adverse effects is in part
due to the various mechanisms utilized by different species to detoxify and/or sequester copper,
thereby rendering it biologically unavailable. A well-known and widespread copper
detoxification mechanism is the production of metal binding proteins (e.g., metallothioneins) by
a number of invertebrates and fish in response to a metal exposure. Adams et al. (2011) noted
that aquatic organisms contain a diverse array of homeostatic mechanisms that are both metal-
and species-specific, and therefore the risk to the aquatic organism could not be determined by
whole-body tissue residue levels for metals, further suggesting tissue-based copper criteria may
not accurately reflect ecotoxicological effects of copper under real-world exposure scenarios at
the national-level. Thus, it is unclear if the copper accumulated in a specific fish organ is
bioavailable or sequestered. Therefore, the link between total copper tissue levels and adverse
effects is difficult to quantify since the majority of accumulated copper may be in a detoxified
form.
4.4 Effects on Aquatic Plants
Data are available on the toxicity of copper to 26 species of estuarine/marine aquatic
plants; however, these data were not used quantitatively in this effects assessment because they
did not meet the MDRs established in the Guidelines to support the derivation of a plant-based
value (Appendix Table C-1). The species for which toxicity data are available encompass
several classes of aquatic plants, inclusive of microalga, cyanobacterium, diatoms,
dinoflagellates, green and red alga, and two species of kelp. The following data are not BLM
normalized. A copper concentration of 60 μg/L copper caused a 50% decrease in photosynthesis
in the giant kelp, Macrocystis pyrefera (Clendenning and North 1959), whereas a 21-day
exposure to 5 μg/L copper reduced gametophyte development rate in the kelp, Laminaria
saccharina (Chung and Brinkhuis 1986). Zhu et al. (2011) reported a 7-day growth rate LOEC of
50 μg/L copper for the brown alga, Hizikia fusiformis, and the less sensitive green seaweed, Ulva

68
pertusa, had a chlorophyll fluorescence EC50 of 711 μg/L copper (Kumar et al. 2009). Growth
reduction in the red alga, Champia parvula, occurred in both the tetrasporophyte and female
plants exposed to copper concentrations of 4.6 and 4.7 μg/L copper, respectively (Steele and
Thursby 1983). Another red algal species, Ceramium tenuicorne, had a 7-day growth EC50 of 6.4
μg/L copper. Dinoflagellates were equally sensitive to copper with growth rate reductions
occurring at concentrations that ranged from 5 to 12,740 μg/L copper, with most reductions
occurring at concentrations <50 μg/L copper. Diatoms were also sensitive to copper, with the
most sensitive species, Thalassiosira aestevallis, having reduced growth at 19 μg/L copper with
a 3-4 day exposure period (Hollibaugh et al. 1980).
The most sensitive plant effect concentrations were BLM-normalized to the same water
chemistry to allow comparison to the FCV. All of the normalized values were greater than the
FCV except a static, unmeasured 4-day IC50 for reduced growth of 0.8320 μg/L dissolved copper
for the golden/brown flagellate (Isochrysis sp.) (Garr 2012). Saifullah (1978) reported a BLM
normalized growth LOEC of 2.257 μg/L copper for two dinoflagellates (Prorocentrum micans
and Scrippsiella faeronense) at 8 and 5 days, respectively. The red alga, Champia parvula, had
BLM-normalized effect concentrations that ranged from 2.078 to 6.159 μg/L based on reduced
growth and reproduction (Steele and Thursby 1983). Giant kelp, Macrocystis pyrifera, exposed
to measured copper for 19-20 days using renewal procedures exhibited reduced sporophyte
production at a BLM-normalized concentration of 4.552 μg/L copper (Anderson et al. 1990). The
most sensitive effect concentration of 0.8320 μg/L copper reported by Garr (2012) was based on
nominal concentrations and, as recommended by the Guidelines (Stephan et al. 1985), cannot be
used to calculate a FPV. Since the majority of the other values show sensitivity to copper that is
similar to animals, a chronic criterion that protects estuarine/marine animals should also protect
plants.
4.5 Protection of Endangered Species
The estuarine/marine dataset for copper is extensive for the evaluation of acute toxicity,
but few data are available for the evaluation of chronic toxicity. Only limited data are available
for species that are Federally-listed as threatened or endangered by the NOAA National Marine
Fisheries Service. Summaries are provided here of data that are available for listed species and
demonstrate that, based on the best and most current available data, the draft copper criteria in
this 2016 update are protective of threatened or endangered species.

69
4.5.1 Acute Toxicity Data for Listed Species
There are only three endangered and/or threatened estuarine/marine species that have
acceptable acute toxicity data. The black abalone, Haliotis cracherodii, was tested as an adult in
an acute static-renewal exposure with a BLM-normalized value of 21.24 µg/L copper (Martin et
al. 1977). The genus Haliotis was the fourth most sensitive genus with the embryo non-
endangered abalone species H. rufescens with a BLM-normalized value of 3.944 µg/L copper.
The endangered/threatened Coho salmon smolt (Oncorhynchus kisutch) was the 43rd most
sensitive genera tested and had a BLM-normalized value of 445.6 µg/L copper. The Leon
Springs pupfish, Cyprinodon bovinus, had a BLM-normalized SMAV of 778.0 µg/L copper,
with the genus ranking 44th.
4.5.2 Chronic Toxicity Data for Listed Species
There is no threatened and/or endangered estuarine/marine species with acceptable or
other chronic toxicity data for copper.
4.6 Comparison of Draft 2003 and 2016 Criteria Values
New acute data for estuarine/marine species have been added to the 2016 update. A total
of 78 genera are used to derive the estuarine/marine CMC of 2.0 µg/L in the 2016 update (when
selected water chemistry values were used for BLM normalization) in comparison to the 44
genera used for the 2003 draft criteria, which resulted in a CMC of 3.1 µg/L (Table 9). The draft
2003 acute criterion is more stringent than the current recommended 1995 criterion of 4.8 µg/L,
because of additional data for sensitive organisms (U.S. EPA 1995a, 2003). The 2016 update
uses the BLM to incorporate the interaction and effect of water physical and chemical parameters
(pH, temperature, salinity and DOC) that affect the bioavailability of copper to aquatic
organisms. Thus, the numeric water quality criteria values derived from the BLM are dependent
upon site-specific water quality parameters. The updated BLM-based WQC will in some cases
be more stringent and in other cases less stringent than the previous criteria (which are not
adjusted based on water chemistry condition). As there is not a single WQC value to use for
comparison purposes, the values presented in Table 9 are illustrative only at the selected water
chemistry values used for BLM-normalization (Table 7).
The four most sensitive genera with available data were used to calculate the CMC in the
2003 draft document (because n<59 GMAVs), while the second to fifth more sensitive genera

70
are used in the 2016 update (because n≥59 GMAVs). The CMC reported in U.S. EPA 1995a,
2003 (draft), and this 2016 (draft) document were lowered to protect commercially important
aquatic species, Mytilus edulis, Mytilus sp. and H. rufescens, respectively. The approximately 35
percent decrease in the 2016 CMC relative to the 2003 draft CMC is primarily due to the use of
the BLM model and the default selected water quality parameters, and the additional genera used
to calculate the new CMC including the following: amphipods (Allorchestes, Echinogammarus,
Gammarus and Orchomonella), barnacle Balanus, mussel Perna, crabs (Callinectes and
Emerita), horseshoe crab Limulus, bristle star Ophionereis, copepods (Nitokra and Tisbe),
decapod Palaemon, gastropods (Crepidula, Planaxis and Turbo), shrimps (Farfantepenaeus,
Metapenaeus, Litopenaeus, Palaemonetes and Penaeus), hard clam Mercenaria, isopod
Sphaeroma, sea urchins (Arbacia and Diadema), polychaetes (Eurythoe and Hydroides), rotifer
Brachionus, sand dollar Dendraster, sea anemone Aiptasia, Gulf toadfish Opsanus, mud-skipper
Boleophthalmus, fat snook Centropomus and thornfish Terapon.
One new estuarine/marine species with acceptable chronic data, the rotifer, Brachionus
plicatilis, was included in the 2016 update. The addition of this species, along with sheepshead
minnow data, which was included in the 2003 draft document, results in a total of two species
with chronic values and ACRs. (Note: the chronic value used in the 1995 ALC from Lussier et
al. 1985 for the mysid, Americamysis bahia, is no longer considered valid because of poor
control survival). The 2016 CCC of 1.3 µg/L copper was derived from division of the FAV of
3.944 µg/L by the FACR of 3.022, which is less than the 1995 CCC of 3.1 µg/L (FAV of 9.625
µg/L divided by an FACR of 3.127), and the 2003 draft CCC of 1.9 µg/L (FAV of 6.188 µg/L
divided by an FACR of 3.23) at the selected water chemistry conditions. As noted for the acute
criterion, the lower CCC presented in the 2016 update relative to the previous criteria reflects use
of the BLM that incorporates water physical and chemistry interactions that affect the
bioavailability of copper to aquatic organisms.

71
Table 9. Comparison of the Four Most Sensitive Taxa Used to Calculate the
Estuarine/Marine FAV and CMC in the 2003 Draft Copper Document and 2016 Update.
2003 Draft Copper Estuarine/Marine FAV and CMC 2016 Copper Update Estuarine/Marine FAV and
CMC (at selected chemistry conditions)
Species SMAV (µg/L)
GMAV
[Rank] (µg/L) Species
SMAV (µg/L)
GMAV
[Rank] (µg/L)
Mysid,
Holmesimysis costata 9.572
9.572
[5]
Sea urchin,
Strongylocentrotus purpuratus 12.81
12.81
[4]
Black abalone,
Haliotis cracherodii 21.24
9.153
[4] Summer flounder,
Paralichthys dentatus 12.66
12.66
[3]
Red abalone,
Haliotis rufescens 3.944
Eastern oyster,
Crassostrea virginica 14.49
12.60
[2]
Summer flounder,
Paralichthys dentatus 8.848
8.848
[3]
Pacific oyster,
Crassostrea gigas 10.96
Copepod,
Tigriopus californicus 7.847
7.847
[2]
Blue mussel,
Mytilus edulis 21.50
11.53
[1]
Blue mussel,
Mytilus edulis 4.238
5.577*
[1] Mussel,
Mytilus sp. 6.19
Mediterranean mussel,
Mytilus galloprovincialis 7.338
Number of GMAVs 44 Number of GMAVs 78
FAV (calculated) 12.34 FAV (calculated) 9.138
CMC (calculated) 6.170 CMC (calculated) 4.6
Lowered FAVa 6.188 Lowered FAVb 3.944
Recommended CMC 3.1 Recommended CMC 2.0c
* Not used to calculate CMC since number of GMAVs ≥59. a Dissolved copper final acute value (FAV) was lowered from 12.34 to 6.188 to protect Mytilus sp. b Dissolved copper final acute value (FAV) was lowered from 9.138 to 3.944 to protect Haliotis rufescens. c When Temperature=22°C, pH=8, DOC=1.0 mg/L, and Salinity=32 ppt.

72
5 REFERENCES
Aanand, S., C.S. Purushothaman, A.K. Pal and K.V. Rajendran. 2010. Toxicological studies on
the effect of copper, lead and zinc on selected enzymes in the adductor muscle and intestinal
diverticula of the green mussel Perna viridis. Indian J. Mar. Sci. 39(2): 299-302.
Absil, M.P.C., J.J. Kroon and H.T. Wolterbeek. 1994. Availability of copper from phytoplankton
and water for the bivalve Macoma baltica. II Uptake and elimination from 64Cu-labelled diatoms
and water. Mar. Bio. 118: 129-135.
Abbasi, A.R. and S.E. Sheckley. 1995. Effects of copper on newly hatched larvae of herring,
Clupea harengus L. Pakistan J. Zool. 27(4): 285-290.
Abbe, G.R. and J.G. Sanders. 1986. Condenser replacement in a coastal power plant: Copper
uptake and incorporation in the American oyster, Crassostrea virginica. Mar. Environ. Res.
19(2): 93-113.
Abbe, G.R., G.F. Riedel and J.G. Sanders. 2000. Factors that influence the accumulation of
copper and cadmium by transplanted eastern oysters (Crassostrea virginica) in the Patuxent
River, Maryland. Mar. Environ. Res. 49: 377-396.
Absil, M.C.P., L.J.A. Gerringa and B.T. Wolterbeek. 1993. The relation between salinity and
copper complexing capacity of natural estuarine waters and the uptake of dissolved 64Cu by
Macoma balthica. Chem. Spec. Bioavail. 5(4): 119-128.
Absil, M.C.P., M. Berntssen and L.J.A. Gerringa. 1996. The influence of sediment, food and
organic ligands on the uptake of copper by sediment-dwelling bivalves. Aquat. Tox. 34(1): 13-
29.
Adema, D.M.M., S.I. Deswaaf-Mooy and P. Bais. 1972. Laboratory investigations concerning
the influence of copper on mussels (Mytilus edulis) (Laboratoriumonderzoek over de invloed van
koper op mosselen (Mytilus edulis). TNO Nieuws 27(9): 482-487.
Adema-Hannes, R. and J. Shenker. 2008. Acute lethal and teratogenic effects of tributyltin
chloride and copper chloride on mahi mahi (Coryphaena hippurus) eggs and larvae. Environ.
Toxicol. Chem. 27(10): 2131-2135.
Adeyemi, J.A. and P.L. Klerks. 2012. Salinity acclimation modulates copper toxicity in the
sheepshead minnow, Cyprinodon variegatus. Environ. Toxicol. Chem. 31(7): 1573-1578.
Adeyemi, J.A., L.E. Deaton, T.C. Pesacreta and P.L. Klerks. 2012. Effects of copper on
osmoregulation in sheepshead minnow, Cyprinodon variegatus acclimated to different salinities.
Aquat. Toxicol. 109: 111-117.
Agell, G., M.J. Uriz, E. Cebrain and R. Marti. 2001. Does stress protein induction by copper
modify natural toxicity in sponges? Environ. Toxicol. Chem. 20(11): 2588-2593.

73
Ahmad, I., M. Oliveira, M. Pacheco and M.A. Santos. 2005. Anguilla anguilla L. oxidative stress
biomarkers responses to copper exposure with or without beta-naphthoflavone pre-exposure.
Chemo. 61(2): 267-275.
Ahmad, I., V.L. Maria, M. Oliveira, M. Pacheco and M.A. Santos. 2008. Modulatory role of
copper on beta-naphthoflavone-induced DNA damage in European eel (Anguilla anguilla L.).
Ecotoxicol. Environ. Saf. 71(3): 806-812.
Ahmed, M.R., M. Elumalal, S.E. Balasubramanian and M.P. Balasubramanian. 1997. Individual
and combined effect of copper and chromium on oxygen consumption and phosphatases of a
marine edible crab, Scylla serrata. Biomed. Lett. 55(219-220): 147-152.
Ahsanullah, M. and A.R. Williams. 1991. Sublethal effects and bioaccumulation of cadmium,
chromium, copper, and zinc in the marine amphipod Allorchestes compressa. Mar. Biol. 108: 59-
65.
Ahsanullah, M., M.C. Mobley and P. Rankin. 1988. Individual and combined effects of zinc,
cadmium and copper on the marine amphipod Allorchestes compressa. Aust. J. Mar. Freshwater
Res. 39(1): 33-37.
Aitkenhead-Peterson, J.A., W.H. McDowell and J.C. Neff. 2003. Sources, production and
regulation of allochthonous dissolved organic matter inputs to surface waters. In: Findlay,
S.E.G., Sinsabaugh, R.L. (Eds.), Aquatic Ecosystems, Interactivity of Dissolved Organic Matter.
Academic Press/Elsevier, San Diego, CA, pp. 25–70.
Albergoni, V., A. Cassini, O. Coppellotti, N. Favero, P. Irato, E. Piccinni and G. Santovito. 2000.
Physiological responses to heavy metals and adaptation to increased oxygen partial pressure in
Antarctic fish and protozoa. Ital. J. Zool. 1: 1-11.
Alekseev, V., A. Makrushin, J.S. Hwang and V. Alekseev. 2010. Does the survivorship of
activated resting stages in toxic environments provide cues for ballast water treatment? Mar.
Pollut. Bull. 61(4-6): 254-258.
Allen, H.E. and D.J. Hansen. 1996. The importance of trace metal speciation to water quality
criteria. Water Environ. Res. 68(1): 42-54.
Alquezar, R. and A. Anastasi. 2013. The use of the cyanobacteria, Cyanobium sp., as a suitable
organism for toxicity testing by flow cytometry. Bull. Environ. Contam. Toxicol. 90: 684-690.
Al-Subiai, S.N., A.J. Moody, S.A. Mustafa and A.N. Jha. 2011. A multiple biomarker approach
to investigate the effects of copper on the marine bivalve mollusc, Mytilus edulis. Ecotoxicol.
Environ. Saf. 74(7): 1913-1920.
Alvarado, N.E., A. Buxens, L.I. Mazon, I. Marigomez and M. Soto. 2005. Cellular biomarkers of
exposure and biological effect in hepatocytes of turbot (Scophthalmus maximus) exposed to
cadmium, copper, zinc and after depuration. Aquat. Toxicol. 74: 110-125.

74
Alvarado, N.E., I. Quesada, K. Hylland, I. Marigomez, M. Soto. 2006. Quantitative changes in
metallothionein expression in target cell-types in the gills of turbot (Scophthalmus maximus)
exposed to cadmium, copper, zinc and after a depuration treatment. Aquat. Toxicol. 77: 64-77.
Amaroli, A., S. Ferrando, M.C. Gagliani, L. Gallus and M.A. Masini. 2013. Identification of
aquaporins in eggs and early embryogenesis of the sea urchin Paracentrotus lividus. Acta
Histochem. 115(3): 257-263.
Amiard, J.C., C. Amiard-Triquet and C. Metayer. 1985. Experimental study of bioaccumulation,
toxicity and regulation of some trace metals in various estuarine and coastal organisms. Symp.
Biol. Hung. 29: 313-325.
Amiard-Triquet, C., B. Berthet, C. Metayer and J.C. Amiard. 1986. Contribution to the
ecotoxicological study of cadmium, copper, and zinc in the mussel Mytilus edulis. Mar. Biol.
92(1): 7-13.
Amiard-Triquet, C., R. Martoja and C. Marcaillou. 1992. Alternative methodologies for
predicting metal transfer in marine food webs including filter-feeders. Water Sci. Tech. 25(11):
197-204.
Amorim, M.J.B. and J.J. Scott-Fordsmand. 2012. Toxicity of copper nanoparticles and CuCl2 salt
to Enchytraeus albidus worms: Survival, reproduction and avoidance responses. Environ. Pollut.
164(0): 164-168.
Andersen, H.B., R.S. Caldwell, J. Toll, T. Do and L. Saban. 2010. Sensitivity of lamprey
ammocoetes to six chemicals. Arch. Environ. Contam. Toxicol. 59(4): 622-631.
Anderson, B.S., J.W. Hunt, S.L. Turpen, A.R. Coulon and M. Martin. 1990. Copper toxicity to
microscopic stages of giant kelp Macrocystis pyrifera: Interpopulation comparisons and temporal
variability. Mar. Ecol. Prog. Ser. 68(1-2): 147-156.
Anderson, B.S., D.P. Middaugh, J.W. Hunt and S.L. Turpen. 1991. Copper toxicity to sperm,
embryos and larvae of topsmelt Atherinops affinis, with notes on induced spawning. Mar.
Environ. Res. 21: 17-35.
Anderson, B.S., J.W. Hunt, H.R. McNulty, S.L. Turpen and M. Martin. 1994. Off-season
spawning and factors influencing toxicity test development with topsmelt Atherinops affinis.
Environ. Toxicol. Chem. 13(3): 479-485.
Anderson, D.M. and F.M.M. Morel. 1978. Copper sensitivity of Gonyaulax tamarensis. Limnol.
Oceanog. 23(2): 283-295.
Anderson, S.L. and T.J. Norberg-King. 1991. Precision of short-term chronic toxicity tests in the
real world. Environ. Toxicol. Chem. 10: 143-145.

75
Andrew, R.W. 1976. Toxicity relationships to copper forms in natural waters. In: Toxicity to
Biota of Metal Forms in Natural Water. R.W. Andrew, P.V. Hodosn and D.E. Konasewich (Eds.)
International Joint Commission, Windsor, Ontario, Canada. p. 127.
Andrew, R.W., K.E. Biesinger and G.E. Glass. 1977. Effects of inorganic complexing on the
toxicity of copper to Daphnia magna. Water Res. 11(3): 309-315.
Angel, B.M., S.L. Simpson and D.F. Jolley. 2010. Toxicity to Melita plumulosa from
intermittent and continuous exposures to dissolved copper. Environ. Toxicol. Chem. 29(12):
2823-2830.
Angel, B.M., S.L. Simpson, A.A. Chariton, J.L. Stauber and D.F. Jolley. 2015. Time-averaged
copper concentrations from continuous exposures predicts pulsed exposure toxicity to the marine
diatom, Phaeodactylum tricornutum: Importance of uptake and elimination. Aquat. Toxicol. 164:
1-9.
Anjos, V.A., F.M.R. da Silva-Junior and M.M. Souza. 2014. Cell damage induced by copper: An
explant model to study anemone cells. Toxicol. In Vitro 28: 365-372.
Araujo, C.V.M., F.R. Diz, I. Moreno-Garrido, L.M. Lubian and J. Blasco. 2008. Effects of cold
storage on growth of Cylindrotheca closterium and its sensitivity to copper. Chemospere 72:
1366-1372.
Arizza, V., G. Di Fazio, M. Celi, N. Parrinello and M. Vazzana. 2009. Cadmium, copper and
tributyltin effects on fertilization of Paracentrotus lividus (Echinodermata). Ital. J. Anim. Sci.
8(Suppl. 2): 839-841.
Arnold, W.R. 2005. Effects of dissolved organic carbon on copper toxicity: Implications for
saltwater copper criteria. Integrat. Environ. Assess. Monit. 1(1): 34-39.
Arnold, W.R. and J.S. Cotsifas. 2008. An assessment of the application factor used to derive the
saltwater acute ambient water copper criterion. Integ. Environ. Assess. Manag. 4(2): 252-254.
Arnold, W.R., R.C. Santore and J.S. Cotsifas. 2005. Predicting copper toxicity in estuarine and
marine waters using the biotic ligand model. Mar. Pollut. Bull. 50(12): 1634-1640.
Arnold, W.R., J.S. Cotsifas and K.M. Corneillie. 2006. Validation and update of a model used to
predict copper toxicity to the marine bivalve Mytilus sp. Environ. Toxicol. 21(1): 65-70.
Arnold, W.R., J.S. Cotsifas, A.R. Winter, J.S. Klinck, D.S. Smith and R.C. Playle. 2007. Effects
of using synthetic sea salts when measuring and modeling copper toxicity in saltwater toxicity
tests. Environ. Toxicol. Chem. 26(5): 935-943.

76
Arnold, W.R., J.S. Cotsifas, D.S. Smith, S. Le Page and K.M. Gruenthal. 2008. A comparison of
the copper sensitivity of two economically important saltwater mussel species and a review of
previously reported copper toxicity data for mussels: Important implications for determining
future ambient copper saltwater criteria in the USA. Environ. Toxicol. 24(6): 618-628.
Arnold, W.R., J.S. Cotsifas, R.S. Ogle, S.G.S. DePalma and D.S. Smith. 2010a. A comparison of
the copper sensitivity of six invertebrate species in ambient salt water of varying dissolved
organic matter concentrations. Environ. Toxicol. Chem. 29(2): 311-319.
Arnold, W.R., R.L. Diamond and D.S. Smith. 2010b. Acute and chronic toxicity of copper to the
euryhaline rotifer, Brachionus plicatilis (“L” strain). Arch. Environ. Contam. Toxicol. 60(2):
250-260.
Arnold, W.R., R.L. Diamond and D.S. Smith. 2010c. The effects of salinity, pH, and dissolved
organic matter on acute copper toxicity to the rotifer, Brachionus plicatilis “L” strain. Arch.
Environ. Contam. Toxicol. 59: 225-234.
Arockia Vasanthi, L., P. Revathi, C. Arulvasu and N. Munuswamy. 2012. Biomarkers of metal
toxicity and histology of Perna viridis from Ennore Estuary, Chennai, South East Coast of India.
Ecotoxicol. Environ. Saf. 84: 92-98.
Arockia Vasanthi, L., P. Revathi, J. Mini and N. Munuswamy. 2013. Integrated use of
histological and ultrastructural biomarkers in Mugil cephalus for assessing heavy metal pollution
in Ennore Estuary, Chennai. Chemosphere 91(8): 1156-1164.
Arthur, J.W. and E.N. Leonard. 1970. Effects of copper on Gammarus pseudolimnaeus, Physa
integra, and Campeloma decisum in soft water. J. Fish. Res. Board Can. 27: 1277-1283.
Arumugam, M. and M.H. Ravindranath. 1987. Copper toxicity in the crab, Scylla serrata, copper
levels in tissues and regulation after exposure to a copper-rich medium. Bull. Environ. Contam.
Toxicol. 39: 708-715.
ATSDR (Agency for Toxic Substances and Disease Registry). 1990. Toxicological profile for
copper. U.S. Public Health Service, Atlanta, Georgia, TP-90-08. 143 pp.
Ayling, G.M. 1974. Uptake of cadmium, zinc, copper, lead and chromium in the Pacific oyster,
Crassostrea gigas, grown in the Tamar River, Tasmania. Water Res. 8(10): 729-738.
Bach, L., L. Ferguson, V. Feltelius and J. Sondergaard. 2014. Orchomenella pinguis
(Amphipoda) - a possible species for heavy metal biomonitoring of marine sediments. J. Coast.
Life Med. 2(2): 116-123.
Bailey, H.C., J.L. Miller, M.J. Miller and B.S. Dhaliwal. 1995. Application of toxicity
identification procedures to the echinoderm fertilization assay to identify toxicity in a municipal
effluent. Environ. Toxicol. Chem. 14(12): 2181-2186.

77
Baker, J.T.P. 1969. Histological and electron microscopical observations on copper poisoning in
the winter flounder (Pseudopleuronectes americanus). J. Fish. Res. Board Can. 26: 2785-2793.
Baker, R.T.M., R.D. Handy, S.J. Davies and J.C. Snook. 1998. Chronic dietary exposure to
copper affects growth, tissue lipid peroxidation, and metal composition of the grey mullet,
Chelon labrosus. Mar. Environ. Res. 45: 357-365.
Bakhmet, I.N., N.P. Kantserova, L.A. Lysenko and N.N. Nemova. 2012. Effect of copper and
cadmium ions on heart function and calpain activity in blue mussel Mytilus edulis. J. Environ.
Sci. Health Part A 47: 1528-1535.
Bao, V.W.W., K.M.Y. Leung, K.W.H. Kwok, A.Q. Zhang and G.C.S. Lui. 2008. Synergistic
toxic effects of zinc pyrithione and copper to three marine species: Implications on setting
appropriate water quality criteria. Mar. Pollut. Bull. 57(6-12): 616-623.
Bao, V.W., K.M. Leung, J.W. Qiu, M.H. Lam and V.W. Bao. 2011. Acute toxicities of five
commonly used antifouling booster biocides to selected subtropical and cosmopolitan marine
species. Mar. Pollut. Bull. 62(5): 1147-1151.
Bao, V.W.W., K.M.Y. Leung, G.C.S. Lui and M.H.W. Lam. 2013. Acute and chronic toxicities
of Irgarol alone and in combination with copper to the marine copepod Tigriopus japonicas.
Chemosphere 90: 1140-1148.
Bao, W.Y., O.O. Lee, H.C. Chung, M. Li and P.Y. Qian. 2010. Copper affects biofilm
inductiveness to larval settlement of the serpulid polychaete Hydroides elegans (Haswell).
Biofoul. 26(1): 119-128.
Baraj, B., F. Niencheski, G. Fillmann and C. De Martinez Gaspar Martins. 2011. Assessing the
effects of Cu, Cd, and exposure period on metallothionein production in gills of the Brazilian
brown mussel Perna perna by using factorial design. Environ. Monit. Assess. 179(1-4): 155-62.
Barka, S. 2007. Insoluble detoxification of trace metals in a marine copepod Tigriopus
brevicornis (Muller) exposed to copper, zinc, nickel, cadmium, silver and mercury. Ecotoxicol.
16(7): 491-502.
Barka, S., J.F. Pavillon and C. Amiard-Triquet. 2010. Metal distributions in Tigriopus
brevicornis (Crustacea, Copepoda) exposed to copper, zinc, nickel, cadmium, silver, and
mercury, and implication for subsequent transfer in the food web. Environ. Toxicol. 25(4): 350-
360.
Barrera-Garcia, A., T. O'hara, F. Galvan-Magana, L.C. Mendez-Rodriguez, J.M. Castellini and
T. Zenteno-Savin. 2013. Trace elements and oxidative stress indicators in the liver and kidney of
the blue shark (Prionace glauca). Comp. Biochem. Physiol. Part A 165(4): 483-490.
Bat, L., D. Raffaelli and I.L. Marr. 1998. The accumulation of copper, zinc and cadmium by the
amphipod Corophium volutator (Pallas). J. Exper. Mar. Biol. Ecol. 223: 167-184.
78
Bat, L., A. Gundogdu, M. Sezgin, M. Culha, G. Gonlugur and M. Akbulut. 1999a. Acute toxicity
of zinc, copper and lead to three species of marine organisms from the Sinop Peninsula, Black
Sea. Turk. J. Biol. 23: 537-544.
Bat, L., M. Sezgin, A. Gundogdu and M. Culha. 1999b. Toxicity of zinc, copper and lead to
Idotea baltica (Crustacea, Isopoda). Turk. J. Biol. (Turk. Biol. Derg.) 23(4): 465-472.
Bat, L., F. Ustun, O.G. Baki and F. Sahin. 2013. Effects of some heavy metals on the sizes of the
Mediterranean mussel Mytilus galloprovincialis Lamarck, 1819. Fres. Environ. Bull. 22(7):
1933-1938.
Bauer, J.E. and T.S. Bianchi. 2011. Dissolved organic carbon cycling and transformation. In: E.
Wolanski and D.S. McLusky (Eds.), Treatise on Estuarine and Coastal Science, Waltham,
Academic Press. Vol 5, pp. 7–67.
Bautista-Covarrubias, J.C., M.G. Frias-Espericueta, G.J. Velarde-Montes, D. Voltolina, L.M.
Garcia-de la Parra and M.F. Soto-Jimenez. 2015. Relationships between copper and stress
indicators in the Pacific white shrimp, Litopenaeus vannamei. Mar. Fresh. Behav. Physiol. 48(3):
193-203.
Bay, S.M., P.S. Oshida and K.D. Jenkins. 1983. A simple new bioassay based on echinochrome
synthesis by larval sea urchins. Mar. Environ. Res. 8: 29-39.
Bay, S., R. Burgess and D. Nacci. 1993. Status and applications of echinoid (Phylum
Echniodermata) toxicity test methods. In: Environmental Toxicology and Risk Assessment,
ASTM STP 1179. W.G. Landis, J.S. Hughes and M.A. Lewis (Eds.). Philadelphia: American
Society for Testing and Materials, pp. 281-302.
Bay, S.M., D. Lapota, J. Anderson, J. Armstrong, T. Mikel, A.W. Jirik and A. Asato. 2000.
Southern California Bight 1998 regional monitoring program: IV. Sediment toxicity. Southern
California Coastal Water Research Project. Westminster, CA.
Becerra-Huencho, R.M. 1984. The effect of organotin and copper sulfate on the late
development and presettlement behavior of the hard clam Mercenaria mercenaria. M.S. Thesis,
Univ. of Maryland, College Park, MD, 85 pp.
Bechmann, R.K. 1994. Use of life tables and LC50 tests to evaluate chronic and acute toxicity
effects of copper on the marine copepod Tisbe furcata (Baird). Environ. Toxicol. Chem. 13(9):
1509-1517.
Belanger, S.E., J.L. Farris and D.S. Cherry. 1989. Effects of diet, water hardness, and population
source on acute and chronic copper toxicity to Ceriodaphnia dubia. Arch. Environ. Contam.
Toxicol. 18(4): 601-611.

79
Bengtsson, B.E. 1978. Use of a harpacticoid copepod in toxicity tests. Mar. Pollut. Bull. 9: 238-
241.
Benoit, D.A. 1975. Chronic effects of copper on survival, growth, and reproduction of the
bluegill (Lepomis macrochirus). Trans. Am. Fish. Soc. 104: 353-358.
Bergman, H.L. and E.J. Doward-King (Eds.) 1997. Reassessment of metals criteria for aquatic
life protection: Priorities for research and implementation. SETAC Press, Pensacola, FL. 114 pp.
Berry, K.L., J. Seemann, O.S. Dellwig, W.C. Ulrich and R.R. Leinfelder. 2013. Sources and
spatial distribution of heavy metals in Scleractinian coral tissues and sediments from the Bocas
Del Toro Archipelago, Panama. Environ. Monit. Assess. 185(11): 9089-9099.
Bertilsson, S. and J.B. Jones. 2003. Supply of dissolved organic matter to aquatic systems:
Autochthonous sources. In: S.E.G. Findlay and R.L. Sinsabaugh (Eds.), Aquatic Ecosystems,
Interactivity of Dissolved Organic Matter. Academic Press/Elsevier, San Diego, CA, pp. 3-24.
Besser, J.M., J.F. Dwyer, C.G. Ingersoll and N. Wang. 2001. Early life-stage toxicity of copper
to endangered and surrogate fish species. EPA Project No. DW14937809-01-0. Office of
Research and Development, Washington, DC.
Betzer, S.B. and P.P. Yevich. 1975. Copper toxicity in Busycon canaliculatun L. Biol. Bull. 148:
16-25.
Bhat, U.G. and K. Vamsee. 1993. Toxicity of heavy metals copper, cadmium and mercury to the
gammarid amphipod Parhalella natalensis (Stebbing). Sci. Total Environ. 134: 887-897.
Bianchi, T.S., J.E. Bauer, E.R.M. Druffel and C. Lambert. 1998. Pyrophaeophorbide – as a tracer
of suspended particulate organic matter from the Eastern North Pacific continental margin. Deep
Sea Res. I 45: 715–773.
Bielmyer, G.K., D. Gatlin, J.J. Isely, J. Tomasso and S.J. Klaine. 2005a. Responses of hybrid
striped bass to waterborne and dietary copper in freshwater and saltwater. Comp. Biochem.
Physiol. Part C 140(1): 131-137.
Bielmyer, G.K., K.V. Brix, T.R. Capo and M. Grosell. 2005b. The effects of metals on embryo-
larval and adult life stages of the sea urchin, Diadema antillarum. Aquat. Toxicol. 74(3): 254-
263.
Bielmyer, G.K., J. Tomasso and S.J. Klaine. 2006a. Physiological responses of hybrid striped
bass to aqueous copper in freshwater and saltwater. Arch. Environ. Contam. Toxicol. 50(3): 531-
538.
Bielmyer, G.K., M. Grosell and K.V. Brix. 2006b. Toxicity of silver, zinc, copper, and nickel to
the copepod Acartia tonsa exposed via a phytoplankton diet. Environ. Sci. Technol. 40(6): 2063-
2068.

80
Bielmyer, G.K., M. Grosell, R. Bhagooli, A.C. Baker, C. Langdon, P. Gillette and T.R. Capo.
2010. Differential effects of copper on three species of Scleractinian corals and their algal
symbionts (Symbiodinium spp.). Aquat. Toxicol. 97(2): 125-133.
Bielmyer, G.K., T.A. Jarvis, B.T. Harper, B. Butler, L. Rice, S. Ryan and P. McLoughlin. 2012.
Metal accumulation from dietary exposure in the sea urchin, Strongylocentrotus droebachiensis.
Arch. Environ. Contam. Toxicol. 63(1): 86-94.
Birch, G.F. and T.D. Hogg. 2011. Sediment quality guidelines for copper and zinc for filter-
feeding estuarine oysters? Environ. Pollut. 159(1): 108-115.
Birdsong, C.L. and J.W. Avault. 1971. Toxicity of certain chemicals to juvenile pompano. Prog.
Fish Culturist. 33: 76-80.
Bisbal, G. 1987. Does copper affect the mating behavior of Gammarus annulatus Smith, 1873
(Amphipoda: Gammaridae)? Biol. Bull. 173(2): 429 (ABS).
Biswas, T., P.K. Bandyopadhyay and S.N. Chatterjee. 2013. Accumulation of cadmium, copper,
lead, zinc and iron in the edible oyster, Saccostrea cucullata in coastal areas of west Bengal.
African J. Biotechnol. 12(24): 3872-3877.
Blanchard, J. and M. Grosell. 2005. Effects of salinity on copper accumulation in the common
killifish (Fundulus heteroclitus). Environ. Toxicol. Chem. 24(6): 1403-1413.
Blanchard, J. and M. Grosell. 2006. Copper toxicity across salinities from freshwater to seawater
in the euryhaline fish Fundulus heteroclitus: Is copper an ionoregulatory toxicant in high
salinities? Aquat. Toxicol. 80(2): 131-139.
Blanchard, J., K. Brix and M. Grosell. 2009. Subcellular fractionation of Cu exposed oysters,
Crassostrea virginica, and Cu accumulation from a biologically incorporated Cu rich oyster diet
in Fundulus heteroclitus in fresh and sea water. Comp. Biochem. Physiol. C 149(4): 531-537.
Blaylock, B.G., M.L. Frank and J.F. McCarthy. 1985. Comparative toxicity of copper and
acridine to fish, Daphnia and algae. Environ. Toxicol. Chem. 4(1): 63-71.
Blaxter, J.H.S. 1977. The effect of copper on the eggs and larvae of plaice and herring. J. Mar.
Biol. Assoc. U.K. 57: 849-858.
Bodammer, J.E. 1985. Corneal damage in larvae of striped bass Morone saxatilis exposed to
copper. Trans. Am. Fish. Soc. 114(4): 577-583.
Bodammer, J.E. 1987. A preliminary study on the corneas of American sand lance larvae
exposed to copper. In: W.A. Vernberg, A. Calabrese, F.P. Thurberg and F.J. Vernberg (Eds.),
Pollution of Estuarine Organisms, University of SC Press, Columbia, SC. pp. 439-448.

81
Bolognesi, C., E. Landini, P. Roggieri, R. Fabbri and A. Viarengo. 1999. Genotoxicity
biomarkers in the assessment of heavy metal effects in mussels: Experimental studies. Environ.
Mol. Mutagen. 33(4): 287-292.
Borgmann, U. 1983. Metal speciation and toxicity of free metal ions to aquatic biota. In: J.O.
Nriagu (Ed.). Aquatic Toxicology, Vol 13. John Wiley and Sons, New York, NY. p. 47-72.
Borgmann, U. and K.M. Ralph. 1983. Complexation and toxicity of copper and the free metal
bioassay technique. Water Res. 17(11): 1697-1703.
Borkow, G. and J. Gabbay. 2005. Copper as a biocidal tool. Curr. Med. Chem. 12: 2163-2175.
Botton, M.L. and T. Itow. 2009. The effects of water quality on horseshoe crab embryos and
larvae. In: J.T. Tanacredi, M.L. Botton and D.R. Smith (Eds.), Intl. Symp. on the Science and
Conservation of Horseshoe Crabs, Jun.11-17, 2007, Springer, NY. pp. 439-454.
Botton, M.L., K. Johnson and L. Helleby. 1998. Effects of copper and zinc on embryos and
larvae of the horseshoe crab, Limulus polyphemus. Arch. Environ. Contam. Toxicol. 35(1): 25-
32.
Boudjema, K., S. Kourdali, N. Bounakous, A. Meknachi and A. Badis. 2014. Catalase activity in
brown mussels (Perna perna) under acute cadmium, lead, and copper exposure and depuration
tests. J. Mar. Biol. 830657.
Bowen, H.J.M. 1985. Part D: The Natural environment and biogeochemical cycles. In: D.
Hutzinger (Ed.), The Handbook of Environmental Chemistry, Vol. 1, Springer-Verlag, NY. p. 1-
26.
Bowmer, T., R.G.V. Boelens, B.F. Keegan and J. O'Neill. 1986. The use of marine benthic ‘key’
species in ecotoxicological testing: Amphiura filiformis (O.F. Muller) (Echinodermata:
Ophiuroidea). Aquat. Toxicol. 8(2): 93-109.
Boyle, R.T., L.F. Oliveria, A. Bianchini and M.M. Souza. 2013. The effects of copper on
Na+/K+-ATPase and aquaporin expression in two euryhaline invertebrates. Bull. Environ.
Contam. Toxicol. 90: 387-390.
Brandt, O.M., R.W. Fujimura and B.J. Finlayson. 1993. Use of Neomysis mercedis (Crustacea:
Mysidacea) for estuarine toxicity tests. Trans. Am. Fish. Soc. 122(2): 279-288.
Bright, G.R. 1995. Variability of the "water effect ratio" for copper toxicity - a case study. Proc.
Toxic Subst. Water Environ. May 23-30, Water Environ. Fed., Alexandria, VA, 5.23-5.30.
Brooks, A., R.M. White and D.C. Paton. 1995. Effects of heavy metals on the survival of
Diacypris compacta (Herbst) (Ostracoda) from the Coorong, South Australia. Int. J. Salt Lake
Res. 4(2): 133-163.

82
Brooks, S.J., T. Bolam, L. Tolhurst, J. Bassett, J. La Roche, M. Waldock, J. Barry and K.V.
Thomas. 2007. Effects of dissolved organic carbon on the toxicity of copper to the developing
embryos of the Pacific oyster (Crassostrea gigas). Environ. Toxicol. Chem. 26(8): 1756-1763.
Brooks, S.J., E. Farmen, L.S. Heier, E. Blanco-Rayon and U. Izagirre. 2015. Differences in
copper bioaccumulation and biological responses in three Mytilus species. Aquat. Toxicol. 160:
1-12.
Brown, M.T., J.E. Newman and T. Han. 2012. Inter-population comparison of copper resistance
and accumulation in the red seaweed, Gracilariopsis longissima. Ecotoxicol. 21: 591-600.
Bryan, G.W. 1983. Brown seaweed, Fucus vesiculosus, and the gastropod, Littorina littoralis, as
indicators of trace-metal availability in estuaries. Sci. Total Environ. 28: 91-104.
Bryan, G.W. and W.J. Langston. 1992. Bioavailability, accumulation and effects of heavy metals
in sediments with special reference to United Kingdom estuaries: A review. Environ. Pollut. 76:
89-131.
Buffet, P.E., O.F. Tankoua, J.F. Pan, D. Berhanu, C. Herrenknecht, L. Poirier, C. Amiard-
Triquet, J.C. Amiard, J.B. Berard, C. Risso, M. Guibbolini, M. Romeo, P. Reip, E. Valsami-
Jones and C. Mouneyrac. 2011. Behavioural and biochemical responses of two marine
invertebrates Scrobicularia plana and Hediste diversicolor to copper oxide nanoparticles.
Chemosphere 84(1): 166-174.
Burlinson, F.C. and A.J Lawrence. 2007a. A comparison of acute and chronic toxicity tests used
to examine the temporal stability of a gradient in copper tolerance of Hediste diversicolor from
the Fal Estuary, Cornwall, UK. Mar. Pollut. Bull. 54(1): 66-71.
Burlinson, F.C. and A.J. Lawrence. 2007b. Development and validation of a behavioral assay to
measure the tolerance of Hediste diversicolor to copper. Environ. Pollut. 145(1): 274-278.
Calabrese, A., J.R. MacInnes, D.A. Nelson and J.E. Miller. 1977. Survival and growth of bivalve
larvae under heavy-metal stress. Mar. Biol. 41: 179-1984.
Calabrese, A., J.R. MacInnes, D.A. Nelson, R.A. Greig and P.P. Yevich. 1984. Effects of long-
term exposure to silver or copper on growth, bioaccumulation and histopathology in the blue
mussel Mytilus edulis. Mar. Environ. Res. 11(4): 253-274.
Caldeira, K. and M.E. Wickett. 2003. Oceanography: Anthropogenic carbon and ocean pH.
Nature 425: 365.
Caldwell, G.S., C. Lewis, G. Pickavance, R.L. Taylor and M.G. Bentley. 2011. Exposure to
copper and a cytotoxic polyunsaturated aldehyde induces reproductive failure in the marine
polychaete Nereis virens (Sars). Aquat. Toxicol. 104(1/2): 126-134.

83
Campana, O., S.L. Simpson, D.A. Spadaro and J. Blasco. 2012. Sub-lethal effects of copper to
benthic invertebrates explained by sediment properties and dietary exposure. Environ. Sci.
Technol. 46(12): 6835-6842.
Campbell, P.G.C. 1995. Interactions between trace metals and aquatic organisms: A critique of
the free-ion activity model. In: Metal Speciation and Bioavailability in Aquatic Systems, A.
Tessier and D.R. Turner (Eds.), John Wiley and Sons, NY. pp. 45-102.
Canli, M. and R.W. Furness. 1993. Toxicity of heavy metals dissolved in sea water and
influences of sex and size on metal accumulation and tissue distribution in the Norway lobster
Nephrops norvegicus. Mar. Environ. Res. 36: 217-236.
Cao, L., W. Huang, J. Liu, Z. Ye, S. Dou and L. Cao. 2010. Toxicity of short-term copper
exposure to early life stages of Red Sea bream, Pagrus major. Environ. Toxicol. Chem. 29(9):
2044-2052.
Caramujo, M.J., C.C.C.R. de Carvalho, S.J. Silva and K.R. Carman. 2012. Dietary carotenoids
regulate astaxanthin content of copepods and modulate their susceptibility to UV light and
copper toxicity. Mar. Drugs 10: 998-1018.
Cardeilhac, P.T., C.F. Simpson, R.L. Lovelock, S.F. Yosha, H.W. Calderwood and J.C. Gudat.
1979. Failure of osmoregulation with apparent potassium intoxication in marine teleosts: A
primary toxic effect of copper. Aquacult. 17(3): 231-239.
Cardin, J.A. 1982. EPA. (Memorandum to John H. Gentile). EPA, Narragansett, RI.
Cardin, J.A. 1985. Results of acute toxicity tests conducted with copper at ERL, Narragansett.
(Memorandum to David Hansen). EPA, Narragansett, RI.
Carlson, A.R., H. Nelson and D. Hammermeister. 1986. Development and validation of site-
specific water quality criteria for copper. Environ. Toxicol. Chem. 5(11): 997-1012.
Carson, R.T., M. Damon, L.T. Johnson and J.A. Gonzalez. 2009. Conceptual issues in designing
a policy to phase out metal-based antifouling paints on recreational boats in San Diego Bay. J.
Environ. Manag. 90(8): 2460-2468.
Casado-Martinez, C.M., B.D. Smith, S.N. Luoma, P.S. Rainbow and C.M. Casado-Martinez.
2010. Metal toxicity in a sediment-dwelling polychaete: Threshold body concentrations or
overwhelming accumulation rates? Environ. Pollut. 158(10): 3071-3076.
Casas, A.M. and E.A. Crecelius. 1994. Relationship between acid volatile sulfide and toxicity of
zinc, lead and copper in marine sediments. Environ. Toxicol. Chem. 13: 529-536.
Casas, S., J.L. Gonzalez, B. Andral and D. Cossa. 2008. Relation between metal concentration in
water and metal content of marine mussels (Mytilus galloprovincialis): Impact of physiology.
Environ. Toxicol. Chem. 27(7): 1543-1552.

84
Catarino, A.I., H.N. Cabral, K. Peeters, P. Pernet, U. Punjabi and P. Dubois. 2008. Metal
concentrations, sperm motility, and RNA/DNA ratio in two echinoderm species from a highly
contaminated fjord (the Sorfjord, Norway). Environ. Toxicol. Chem. 27(7): 1553-1560.
Cauwet, G. 2002. DOM in the coastal zone. In: D.A. Hansell and C.A. Carlson (Eds.),
Biogeochemistry of Marine Dissolved Organic Matter. Academic Press/Elsevier Science, New
York, NY, pp. 579–602.
CDA (Copper Development Association). 1988. Copper in plant, animal and human nutrition.
CDA Publication TN35. 106 pp., Available online at:
http://www.copperinfo.co.uk/health/downloads/tn35-copper-plant-animal-human-nutrition.pdf.
CDA (Copper Development Association). 2003. Diffuse sources of environmental copper in the
United States. Report submitted to the CDA by Parametrix, Inc. in association with Meridian
Environmental, Co. and D-Squared A-Consulting. New York, NY. 151 pp.
CDA (Copper Development Association). 2012. Copper Facts (Fact Sheet A9007). Available
online at: http://www.copper.org/publications/pub_list/homepage.html.
Cebrian, E. and M.J. Uriz. 2007a. Contrasting effects of heavy metals and hydrocarbons on
larval settlement and juvenile survival in sponges. Aquat. Toxicol. 81(2): 137-143.
Cebrian, E. and M.J. Uriz. 2007b. Do heavy metals play an active role in sponge cell behavior in
the absence of calcium? Consequences in larval settlement. J. Exp. Mar. Biol. Ecol. 346(1/2): 60-
65.
Cebrian, E. and M.J. Uriz. 2007c. Contrasting effects of heavy metals on sponge cell behavior.
Arch. Environ. Contam. Toxicol. 53(4): 552-558.
Cebrian, E., G. Agell, R. Marti and M.J. Uriz. 2006. Response of the Mediterranean sponge
Chondrosia reniformis Nardo to copper pollution. Environ. Pollut. 141(3): 452-458.
CH2MHill. 1999a. Bioassay report acute toxicity of copper to summer flounder (Paralichthys
dentatus). Final Report to U.S. Navy. Norfolk, VA.
CH2MHill. 1999b. Bioassay report acute toxicity of copper to blue mussel (Mytilus edulis). Final
Report to U.S. Navy. Norfolk, VA.
Chadwick, D.B., I. Rivera-Duarte, P.F. Wang, G. Rosen, R. Santore, P. Paquin and A. Ryan.
2008. Demonstration of an integrated compliance model for predicting copper fate and effects in
DoD Harbors, Environmental Security Technology Certification Program (ESTCP). Project ER-
0523, Final Report, November 1, 2008. Available online at:
http://www.dtic.mil/dtic/tr/fulltext/u2/a499564.pdf.

85
Chaharlang, B.H., A.R. Bakhtiari and V. Yavari. 2012. Assessment of cadmium, copper, lead
and zinc contamination using oysters (Saccostrea cucullata) as biomonitors on the coast of the
Persian Gulf, Iran. Bull. Environ. Contam. Toxicol. 88(6): 956-961.
Chairi, H., C. Fernandez-Diaz, J.I. Navas, M. Manchado, L. Rebordinos and J. Blasco. 2010. In
vivo genotoxicity and stress defenses in three flatfish species exposed to CuSO4. Ecotoxicol.
Environ. Saf. 73(6): 1279-1285.
Chakoumakos, C., R.C. Russo and R.V. Thurston. 1979. Toxicity of copper to cutthroat trout
(Salmo clarki) under different conditions of alkalinity, pH, and hardness. Environ. Sci. Technol.
13(2): 213-219.
Chang, E.Y., S.L. Coon, M. Walch and R. Weiner. 1996. Effects of hyphomonas PM-1 biofilms
on the toxicity of copper and zinc to Crassostrea gigas and Crassostrea virginica larval set. J.
Shellfish Res. 15(3): 589-595.
Chang, Y.Y.E. 1995. Impact of microbial biofilms on the toxicity of copper and zinc to oyster
larval development. Ph.D. Thesis, Univ. of Maryland, College Park, MD. 218 pp.
Chapman, G.A. 1975. Toxicity of copper, cadmium, and zinc to Pacific Northwest salmonids.
Interim Report, Task 002 ROAP 10CAR, U.S.EPA, Corvallis, OR, 27 p. (Letter to C.E. Stephan,
U.S. EPA, Duluth, MN: 5 p.) (1982) (Publ in Part as 2123, 2060, 2027) (Author Communication
Used).
Chapman, G.A. 1982. U.S. EPA, Corvallis, OR (Letter to Charles E. Stephan. U.S. EPA, Duluth,
MN. December 6).
Chapman, G.A. and J.K. McCrady. 1977. Copper toxicity: A question of form. In: Recent
Advances in Fish Toxicology. Tubb, R.A. (Ed.). EPA-600/3-77-085. National Technical
Information Service, Springfield, VA. p. 132.
Chapman, G.A., S. Ota and F. Recht. Manuscript. Effects of water hardness on the toxicity of
metals to Daphnia magna. U.S. EPA, Corvallis, OR.
Chelomin, V.P., N.N. Belcheva and M.V. Zakhartsev. 1998. Biochemical mechanisms of
adaptation to cadmium and copper ions in the mussel Mytilus trossulus. Russ. J. Mar. Biol. (Biol.
Morya) 24(5): 330-336.
Chemicool. 2012. Copper. Chemicool Periodic Table. Chemicool.com. 16 Oct. 2012. Accessed:
11/27/2012. Available at: http://www.chemicool.com/elements/copper.html.
Chen, J.C. and C.H. Lin. 2001. Toxicity of copper sulfate for survival, growth, molting and
feeding of juveniles of the tiger shrimp, Penaeus monodon. Aquacult. 192(1): 55-65.

86
Chen, Q.L., Z. Luo, X. Liu, Y.F. Song, C.X. Liu, J.L. Zheng and Y.H. Zhao. 2013. Effects of
waterborne chronic copper exposure on hepatic lipid metabolism and metal-element composition
in Synechogobius hasta. Arch. Environ. Contam. Toxicol. 64: 301-315.
Cheng, T.C. 1979. Use of copper as a molluscicide. In: J.O. Nriagu (Ed.). Copper in the
environment. Part 2: Health effects. John Wiley, NY: 401-432.
Cheng, T.C. 1988a. In vivo effects of heavy metals on cellular defense mechanisms of
Crassostrea virginica: Phagocytic and endocytotic indices. J. Invert. Pathol. 51(3): 215-220.
Cheng, T.C. 1988b. In vivo effects of heavy metals on cellular defense mechanisms of
Crassostrea virginica: Total and differential cell counts. J. Invert. Pathol. 51(3): 207-214.
Cheung, S.G. and L.S. Wong. 1998. Physiological responses of the subtidal prosobranch,
Babylonia lutosa (Gastropoda: Buccinidae), to copper. Sci. Total Environ. 214(1-3): 185-191.
Cheung, S.G., K.K. Tai, C.K. Leung and Y.M. Siu. 2002. Effects of heavy metals on the survival
and feeding behaviour of the sandy shore scavenging gastropod Nassarius festivus (Powys). Mar.
Pollut. Bull. 45(1-12): 107-113.
Chevreuil, M., A.M. Carru, A. Chesterikoff, P. Boet, E. Tales and J. Allardi. 1995.
Contamination of fish from different areas of the river Seine (France) by organic (PCB and
pesticides) and metallic (Cd, Cr, Cu, Fe, Mn, Pb and Zn) micropollutants. Sci. Total Environ.
162: 31-42.
Chiu, K.H. and H.K. Mok. 2011. Study on the accumulation of heavy metals in shallow-water
and deep-sea hagfishes. Arch. Environ. Contam. Toxicol. 60(4): 643-653.
Cho, Y.S., B.N. Choi, K.H. Kim, S.K. Kim, D.S. Kim, I.C. Bang and Y.K. Nam. 2006.
Differential expression of Cu/Zn superoxide dismutase mRNA during exposures to heavy metals
in rockbream (Oplegnathus fasciatus). Aquacult. 253(1-4): 667-679.
Choi, J.S., S.E. Kang, J.Y. Cho, H.W. Shin and Y.K. Hong. 2005. A simple screening method for
anti-attachment compounds using monospores of Porphyra yezoensis Ueda. J. Fish. Sci.
Technol. 8(2): 51-55.
Chou, C.L., J. F. Uthe, J. D. Castell and J. C. Keanz. 1987. Effect of dietary cadmium on growth,
survival, and tissue concentrations of cadmium, zinc, copper, and silver in juvenile American
lobster (Homarus americanus). Can. J. Fish. Aquat. Sci. 44(8): 1443-1450.
Christensen, E.R., J. Scherfig and P.S. Dixon. 1979. Effects of manganese, copper, and lead on
Selenastrum capricornutum and Chlorella stigmatophora. Water Res. 13: 79-92.
Chu, K.Y. 1976. Effects of environmental factors on the molluscicidal activities of slow-release
hexabutyldistannoxane and copper sulfate. Bull. W.H.O. 54(4): 417-420.

87
Chung, K.S. 1980. Effects of selected heavy metals on the survival of tropical grass shrimp
(Palaemon northropi). Bol. Inst. Oceanogr. Univ. Oriente 19(1/2): 53-57.
Chung, I.K. and B.H. Brinkhuis. 1986. Copper effects in early life stages of the kelp, Laminaria
saccharina. Mar. Pollut. Bull. 17(5): 213-218.
Cirik, Y., Z.M. Bekci, Y. Buyukates, I. Ak and M. Merdivan. 2012. Heavy metals uptake from
aqueous solution using marine algae (Colpomenia sinuosa): kinetics and isotherms. Chem. Ecol.
28(5): 469-480.
City of San Jose. 1998. Development of a site-specific water quality criterion for copper in South
San Francisco Bay. San Jose/Santa Clara Water Pollution Control Plant. San Jose, CA.
Clearwater, S.J., K.J. Thompson and C.W. Hickey. 2014. Acute toxicity of copper, zinc, and
ammonia to larvae (glochidia) of a native freshwater mussel Echyridella menziesii in New
Zealand. Arch. Environ. Contam. Toxicol. 66: 213-226.
Clements, W.H. and P.M. Kiffney. 1996. Validation of whole effluent toxicity tests: Integrated
studies using field assessments, microcosms, and mesocosms, In Grothe, D.L., Dickson, K.L.,
and Reed-Judkins, D.K., eds., Whole effluent toxicity testing: an evaluation of methods and
prediction of receiving system impacts: Pensacola, Fla., Society of Environmental Toxicology
and Chemistry (SETAC), p. 229–244.
Clements, W.H. D.M. Carlisle, L.A. Courtney and E.A. Harrahy. 2002, Integrating observational
and experimental approaches to demonstrate causation in stream biomonitoring studies. Environ.
Toxicol. Chem. 21(6): 1138–1146.
Clendenning, K.A. and W.J. North. 1959. Effects of wastes on the giant kelp, Macrocystis
pyrifera. In: Proceedings of the First International Conference on Waste Disposal in the Marine
Environment. E.A. Pearson (Ed.). Berkeley, CA. p. 82.
Cloern, J.E. 1996. Phytoplankton bloom dynamics in coastal ecosystems: a review with some
general lessons from sustained investigation of San Francisco Bay, California. Rev. Geophys. 34:
127–168.
Coglianese, M.P. 1982. The effects of salinity on copper and silver toxicity to embryos of the
Pacific oyster. Arch. Environ. Contam. Toxicol. 11(3): 297-303.
Coglianese, M.P. and M. Martin. 1981. Individual and interactive effects of environmental stress
on the embryonic development of the Pacific oyster, Crassostrea gigas. I. The toxicity of copper
and silver. Mar. Environ. Res. 5(1): 13-27.
Company, R., A. Serafim, R.P. Cosson, A. Fiala-Medioni, L. Camus, A. Colaco, R. Serrao-
Santos and M.J. Bebianno. 2008. Antioxidant biochemical responses to long-term copper
exposure in Bathymodiolus azoricus from Menez-Gwen hydrothermal vent. Sci. Total Environ.
389(2/3): 407-417.

88
Connan, S. and D.B. Stengel. 2011. Impacts of ambient salinity and copper on brown algae: 1.
Interactive effects on photosynthesis, growth, and copper accumulation. Aquat. Toxicol.
104(1/2): 94-107.
Connor, P.M. 1972. Acute toxicity of heavy metals to some marine larvae. Mar. Pollut. Bull.
3(12): 190-192.
Conrad, G.W. 1988. Heavy metal effects on cellular shape changes, cleavage, and larval
development of the marine gastropod mollusk, (Ilyanassa obsoleta Say). Bull. Environ. Contam.
Toxicol. 41(1): 79-85.
Contreras, L., M.H. Medina, S. Andrade, V. Oppliger and J.A. Correa. 2007. Effects of copper
on early developmental stages of Lessonia nigrescens Bory (Phaeophyceae). Environ. Pollut.
145(1): 75-83.
Cooper, C.A., T. Tait, H. Gray, G. Webster, R.C. Santore, J.C. McGeer and D.S. Smith. 2012.
Influence of salinity and dissolved organic carbon on acute Cu toxicity to the rotifer Brachionus
plicatilis. Environ. Sci. Technol. Submitted.
Correia, A.D., G. Lima, M.H. Costa and D.R. Livingstone. 2002a. Studies on biomarkers of
copper exposure and toxicity in the marine amphipod Gammarus locusta (Crustacea): I.
Induction of metallothionein and lipid peroxidation. Biomarkers 7(5): 422-437.
Correia, A.D., M.H. Costa, K.P. Ryan and J.A. Nott. 2002b. Studies on biomarkers of copper
exposure and toxicity in the marine amphipod Gammarus locusta (Crustacea): I. Copper-
containing granules within the midgut gland. J. Mar. Biol. Assoc. U.K. 82(5): 827-834.
Cotou, E., M. Henry, G. Rigos and M. Alexis. 2009. Cellular responses of the farmed sea bass
Dicentrarchus labrax to copper oxide antifoulants. In: 9th Hellenic Symposium on
Oceanography and Fisheries, Patra, Greece, 13-16 May 2009. Panellinio Symp. Okeanografias
Alieias, Patra, Greece. pp. 1295-1302.
Cotou, E., M. Henry, C. Zeri, G. Rigos, A. Torreblanca and V.A. Catsiki. 2012. Short-term
exposure of the European sea bass Dicentrarchus labrax to copper-based antifouling treated nets:
Copper bioavailability and biomarkers responses. Chemosphere 89(9): 1091-1097.
Coulibaly, S., B.C. Atse, K.M. Koffi, S. Sylla, K.J. Konan and N.J. Kouassi. 2012. Seasonal
accumulations of some heavy metal in water, sediment and tissues of black-chinned tilapia
Sarotherodon melanotheron from Bietri Bay in Ebrie Lagoon, Ivory Coast. Bull. Environ.
Contam. Toxicol. 88(4): 571-576.
Crecelius, E.A., J.T. Hardy, C.I. Gibson, R.L. Schmidt, C.W. Apts, J.M. Gurtisen and S.P. Joyce.
1982. Copper bioavailability to marine bivalves and shrimp: Relationship to cupric ion activity.
Mar. Environ. Res. 6: 13-26.

89
Crespo, E., P. Lozano, J. Blasco and I. Moreno-Garrido. 2014. Epiphyte toxicity bioassay for
ecotoxicological and coastal monitoring. Environ. Monit. Assess.186: 4647-4654.
Cripe, G.M. 1994. Comparative acute toxicities of several pesticides and metals to Mysidopsis
bahia and postlarval Penaeus duorarum. Environ. Toxicol. Chem. 13(11): 1867-1872.
Curtis, M.W. and C.H. Ward. 1981. Aquatic toxicity of forty industrial chemicals: Testing in
support of hazardous substance spill prevention regulation. J. Hydrol. 51: 359-367.
Curtis, M.W., T.L. Copel and C.H. Ward. 1979. Acute toxicity of 12 industrial chemicals to
freshwater and saltwater organisms. Water Res. 13: 137-141.
Curtis, T.M., R. Williamson and M.H. Depledge. 2000. Simultaneous, long-term monitoring of
valve and cardiac activity in the blue mussel Mytilus edulis exposed to copper. Mar. Biol.
(Berlin) 136(5): 837-846.
Daka, E.R. and S.J. Hawkins. 2004. Tolerance to heavy metals in Littorina saxatilis from a metal
contaminated estuary in the Isle of Man. J. Mar. Biol. Assoc. U.K. 84(2): 393-400.
Damiens, G., C. Mouneyrac, F. Quiniou, E. His, M. Gnassia-Barelli and M. Romeo. 2006. Metal
bioaccumulation and metallothionein concentrations in larvae of Crassostrea gigas. Environ.
Pollut. 140(3): 492-499.
Dang, F., H. Zhong and W.X. Wang. 2009. Copper uptake kinetics and regulation in a marine
fish after waterborne copper acclimation. Aquat. Toxicol. 94: 238-244.
Dang, F., W.X. Wang and P.S. Rainbow. 2012. Unifying prolonged copper exposure,
accumulation, and toxicity from food and water in a marine fish. Environ. Sci. Technol. 46:
3465-3471.
D'Asaro, C.N. 1985. Effects assessment of selected chemicals on estuarine and marine
organisms. EPA-600/X-85/056, EPA, Gulf Breeze, FL. 77 pp.
Davies, I.M. and J.D. Paul. 1986. Accumulation of copper and nickel from anti-fouling
compounds during cultivation of scallops (Pecten maximus L.) and Pacific oysters (Crassostrea
gigas Thun.). Aquacult. 55(2): 93-102.
Davis, A. and D. Ashenberg. 1989. The aqueous geochemistry of the Berkeley Pit, Butte,
Montana, U.S.A. Appl. Geochem. 4: 23-36.
De Boeck, G., J. Hattink, N.M. Franklin, C.P. Bucking, S. Wood, P.J. Walsh and C.M. Wood.
2007. Copper toxicity in the spiny dogfish (Squalus acanthias): Urea loss contributes to the
osmoregulatory disturbance. Aquat. Toxicol. 84(2): 133-141.

90
De Boeck, G., M. Eyckmans, I. Lardon, R. Bobbaers, A.K. Sinha and R. Blust. 2010. Metal
accumulation and metallothionein induction in the spotted dogfish Scyliorhinus canicula. Comp.
Biochem. Physiol. Part A Molec. Integr. Physiol. 155(4): 503-508.
DeForest, D.K and J.S. Meyer. 2015. Critical review: Toxicity of dietborne metals to aquatic
organisms. Crit. Rev. Environ. Sci. Tech. 45: 1176-1241.
Del Giorgio, P.A., and J. Davis. 2003. Patterns in dissolved organic matter lability and
consumption across aquatic systems. In: S.E.G. Findlay and R.L. Sinsabaugh (Eds.), Aquatic
Ecosystems, Interactivity of Dissolved Organic Matter. Academic Press/Elsevier, San Diego,
CA, pp. 399–424.
Denton, R.W. and C. Burdon-Jones. 1982. The influence of temperature and salinity upon the
acute toxicity of heavy metals to the banana prawn (Penaeus merguiensis de Man). Chem. Ecol.
1(2): 131-143.
Denton, G.R.W. and C. Burdon-Jones. 1986. Environmental effects on toxicity of heavy metals
to two species of tropical marine fish from Northern Australia. Chem. Ecol. 2(3): 233-249.
DePalma, S.G.S., W.R. Arnold, J.C. McGeer, D.G. Dixon and D.S. Smith. 2011. Effects of
dissolved organic matter and reduced sulphur on copper bioavailability in coastal marine
environments. Ecotoxicol. Environ. Saf. 74(3): 230-237.
De Pirro, M. and D.J. Marshall. 2005. Phylogenetic differences in cardiac activity, metal
accumulation and mortality of limpets exposed to copper: A prosobranch-pulmonate comparison.
J. Exp. Mar. Biol. Ecol. 322(1): 29-37.
Deruytter, D., M. Vandegehuchte, J. Garrevoet, E. Vergucht, R. Blust, K. De Schamphelaere, L.
Vincze and C.R. Janssen. 2013. The combined effects of DOC and salinity on the accumulation
and toxicity of copper in mussel larvae. Comm. Appl. Biol. Sci. 78(1): 15-19.
Deruytter, D., M.B. Vandegehuchte, J. Garrevoet, F. De Laender, E. Vergucht, K. Delbeke, R.
Blust, K.A.C. De Schamphelaere, L. Vincze and C.R. Janssen. 2015. Salinity and dissolved
organic carbon both affect copper toxicity in mussel larvae: Copper speciation or competition
cannot explain everything. Environ. Toxicol. Chem. 34(6): 1330-1336.
de Souza Machado, A.A., M.L.M. Hoff, R.D. Klein, J.G. Cardozo, M.M. Giacomin, G.L.L.
Pinho and A. Bianchini. 2013. Biomarkers of waterborne copper exposure in the guppy Poecilia
vivipara acclimated to salt water. Aquat. Toxicol. 138/139: 60-69.
Devi, K.M. and V. Gopal. 1986. Efficiency of biological heavy metal depollution technique.
Indian J. Environ. Health 29(3): 189-193.
Ding, A. and C. Wang. 2010. Effects of accumulated copper sulfate on cellular ultrastructure in
four tissues of Charybdis japonica. S. China Fish. Sci. 6(2): 21-28.

91
Dinnel, P.A. Q.J. Stober, J.M Link, M.W. Letourneau, W.E. Roberts, S.P. Felton and R.E.
Nakatani. 1983. Methodology and validation of a sperm cell toxicity test for testing toxic
substances in marine waters. Final Report – Grant R/Tox-1-FRI-UW-8306. University of
Washington Sea Grant Program and the U.S. Environmental Protection Agency. Seattle, WA.
Dinnel, P.A., J.M. Link, Q.J. Stober, M.W. Letourneau and W.E. Roberts. 1989. Comparative
sensitivity of sea urchin sperm bioassays to metals and pesticides. Arch. Environ. Contam.
Toxicol. 18: 748-755.
Di Toro, D.M., E.A. Herbert, H.L. Bergman, J.S. Meyer, P.R. Paquin and R.C. Santore. 2001.
Biotic ligand model of the acute toxicity of metals. I. Technical Basis. Environ. Toxicol. Chem.
20(10): 2383-2396.
Diz, F.R., C.V.M. Araujo, I. Moreno-Garrido, M. Hampel and J. Blasco. 2009. Short-term
toxicity tests on the harpacticoid copepod Tisbe battagliai: Lethal and reproductive endpoints.
Ecotoxicol. Environ. Saf. 72(7): 1881-1886.
Dodge, E.E. and T.L. Theis. 1979. Effect of chemical speciation on the uptake of copper by
Chironomus tentans. Environ. Sci. Technol. 13(10): 1287-1288.
Dodoo, D.K., D.W. Engel and W.G. Sunda. 1992. Effect of cupric ion activity on calcium
accumulation in juvenile flounder (Paralichthys spp.). Mar. Environ. Res. 33: 101-109.
Dorfman, D. 1977. Tolerance of Fundulus heteroclitus to different metals in salt waters. Bull.
New Jersey Acad. Sci. 22(2): 21-23.
Dragun, Z., M. Erk, D. Ivankovic, R. Zaja, V. Filipovic Marijic and B. Raspor. 2010.
Assessment of low-level metal contamination using the Mediterranean mussel gills as the
indicator tissue. Environ. Sci. Pollut. Res. Intern. 17(4): 977-986.
Dung, L.Q., N.M. Cuong, N.T. Huyen and N.D. Cu. 2005. Acute toxicity test to determine the
effects of copper, zinc and cyanide on cobia (Rachycentron canadum) resources in North
Vietnam. Australas. J. Ecotoxicol. 11(3): 163-166.
Duran, I. and R. Beiras. 2013. Ecotoxicologically based marine acute water quality criteria for
metals intended for protection of coastal areas. Sci. Total Environ. 463-464: 446-453.
Durkina, V.B. 1995. Morphofunctional changes in development of sea urchin offspring as a
result of adult exposure to copper and zinc. Russ. J. Mar. Biol. (Biol. Morya) 21(6): 351-355.
Durou, C., C. Mouneyrac and C. Amiard-Triquet. 2005. Tolerance to metals and assessment of
energy reserves in the Polychaete Nereis diversicolor in clean and contaminated estuaries.
Environ. Toxicol. 20(1): 23-31.

92
Dwyer, F.J., L.C. Sappington, D.R. Buckler and S.B. Jones. 1995. Use of surrogate species in
assessing contaminant risk to endangered and threatened fishes. EPA/600/R-96/029, U.S.EPA,
Washington, DC. 78 pp.
Dwyer, F.J., F.L. Mayer, L.C. Sappington, D.R. Buckler, C.M. Bridges, I.E. Greer, D.K.
Hardesty, C.E. Henke, C.G. Ingersoll, J.L. Kunz, D.W. Whites, T. Augspurger, D.R. Mount, K.
Hattala and G.N. Neuderfer. 2005. Assessing contaminant sensitivity of endangered and
threatened aquatic species: Part I. Acute toxicity of five chemicals. Arch. Environ. Contam.
Toxicol. 48(2): 143-154.
Ebenezer, V. and J.S. Ki. 2012. Evaluation of the sub-lethal toxicity of Cu, Pb, bisphenol A and
polychlorinated biphenyl to the marine dinoflagellate Cochlodinium polykrikoides. Algae 27(1):
63-70.
Edullantes, B. and R.P. Galapate. 2014. Embryotoxicity of copper and zinc in tropical sea urchin
Tripneustes gratilla. Sci. Diliman 26(1): 25-40.
Eisler, R. 1977. Acute toxicities of selected heavy metals to the softshell clam, Mya arenaria.
Bull. Environ. Contam. Toxicol. 17(2): 138-146.
Eisler, R. 1998. Copper hazards to fish, wildlife, and invertebrates: A synoptic review. U.S.
Geological Survey, Biological Resources Division, Biological Science Report USGS/BRD/BSR-
-1997-0002. 98 pp.
Eisler, R. and G.R. Gardner. 1973. Acute toxicology to an estuarine teleost of mixtures of
cadmium, copper and zinc salts. J. Fish Biol. 5(2): 131-142.
Eldon, J., M. Pekkarinen and R. Kristoffersson. 1980. Effects of low concentrations of heavy
metals on the bivalve Macoma balthica. Ann. Zool. Fenn. 17: 233-242.
Elfwing, T. and M. Tedengren. 2002. Effects of copper on the metabolism of three species of
tropical oysters, Saccostrea cucullata, Crassostrea lugubris and C. belcheri. Aquacult. 204(1/2):
157-166.
Elliott, N.G., D.A. Ritz and R. Swain. 1985a. Interaction between copper and zinc accumulation
in the barnacle Elminius modestus Darwin. Mar. Environ. Res. 17(1): 13-17.
Elliott, N.G., R. Swain and D. A. Ritz. 1985b. The influence of cyclic exposure on the
accumulation of heavy metals by Mytilus edulis planulatus (Lamarck). Mar. Environ. Res. 15(1):
17-30.
El-Sorogy, A.S., M.A. Mohamed and H.E. Nour. 2012. Heavy metals contamination of the
Quaternary coral reefs, Red Sea Coast, Egypt. Environ. Earth Sci. 67: 777-785.
Elumalai, M., C. Antunes and L. Guilhermino. 2005. Alterations of reproductive parameters in
the crab Carcinus maenas after exposure to metals. Water Air Soil Pollut. 160(1-4): 245-258.

93
Engel, D.W. and B.A. Fowler. 1979. Copper and cadmium induced changes in the metabolism
and structure of molluscan gill tissue. In: W.B. Vernberg, F.P. Thurberg, A. Calabrese and F.J.
Vernberg (Eds.), Marine Pollution: Functional Responses, Acad., NY: 239-256.
Engel, D.W., W.G. Sunda and R.M Thuotte. 1976. Effects of copper on marine eggs and larvae.
Environ. Health Perspect. 17: 288-289.
Engelhaupt, E. and T.S. Bianchi. 2001. Sources and composition of high-molecular-weight
dissolved organic carbon in a southern Louisiana tidal stream (Bayou Trepagnier). Limnol.
Oceanog. 46: 917–926.
Erickson, R.J. 2013. The biotic ligand model approach for addressing effects of exposure water
chemistry on aquatic toxicity of metals: Genesis and challenges. Environ. Toxicol. Chem. 32(6):
1212-1214.
Erickson, S.J., N. Lackie and T.E. Maloney. 1970. A screening technique for estimating copper
toxicity to estuarine phytoplankton. J. Water Pollut. Control Fed. 42: R270-R278.
Ettajani, H., C. Amiard-Triquet and J.C. Amiard. 1992. Experimental study of the transfer of two
trace elements (Ag, Cu) in a marine food chain water - particles (natural sediment, microalgae) -
filter feeding molluscs (Crassostrea gigas Thunberg). Water Air Soil Pollut. 65(3): 215-236.
Evans, P. and B. Halliwell. 2001. Micronutrients: Oxidant/antioxidant status. Br. J. Nutr.
85(Suppl. 2): S67-S74.
Fabbri, E. and A. Capuzzo. 2006. Adenylyl cyclase activity and its modulation in the gills of
Mytilus galloprovincialis exposed to Cr6+ and Cu2+. Aquat. Toxicol. 76(1): 59-68; Erratum.
Aquat. Toxicol. 83(2): 159.
Fabbri, R., M. Montagna, T. Balbi, E. Raffo, F. Palumbo and L. Canesi. 2014. Adaptation of the
bivalve embryotoxicity assay for the high throughput screening of emerging contaminants in
Mytilus galloprovincialis. Mar. Environ. Res. 99: 1-8.
Fabbrocini, A. and R. D’Adamo. 2011. Gametes and embryos of sea urchins (Paracentrotus
lividus, Lmk., 1816) reared in confined conditions: their use in toxicity bioassays. Chem. Ecol.
27(S2): 105-115.
Fabrizio, F. and C. Rodolfo. 2012. The response of benthic foraminiferal assemblages to copper
exposure: A pilot mesocosm investigation. J. Environ. Protect. 3: 342-352.
Fafandel, M., N. Bihari, L. Peric and A. Cenov. 2008. Effect of marine pollutants on the acid
DNAse activity in the hemocytes and digestive gland of the mussel Mytilus galloprovincialis.
Aquat. Toxicol. 86(4): 508-513.

94
Fathallah, S., M.N. Medhioub, A. Medhioub, M.M. Kraiem and S. Fathallah. 2010. Toxicity of
Hg, Cu and Zn on early developmental stages of the European clam (Ruditapes decussatus) with
potential application in marine water quality assessment. Environ. Monit. Assess. 171(1-4): 661-
669.
Feely, R.A., C.L. Sabine, J.M. Hernandez-Ayon, D. Ianson and B. Hales. 2008. Evidence for
upwelling of corrosive "acidified" water onto the continental shelf. Science 320(5882): 1490-
1492.
Fernandez, T.V., G. Thomas, R. Manoj Kumar and Y. Shibu Vardhanan. 1996. Toxicity of
certain pollutants to aquatic organisms. Proc. Acad. Environ. Biol. 5(2): 165-176.
Ferreira-Cravo, M., J. Ventura-Lima, J.Z. Sandrini, L.L. Amado, L.A. Geracitano, M. Rebelo, A.
Bianchini and J.M. Monserrat. 2009. Antioxidant responses in different body regions of the
polychaeta Laeonereis acuta (Nereididae) exposed to copper. Ecotoxicol. Environ. Saf. 72(2):
388-393.
Ferrer, L.D., J.S. Andrade, E.T. Contardi, R.O. Asteasuain and J.E. Marcovecchio. 2003. Copper
and zinc concentrations in Bahia Blanca Estuary (Argentina), and their acute lethal effects on
larvae of the crab Chasmagnathus granulata. Chem. Spec. Bioavail. 15(1): 7-14.
Ferrer, L., S. Andrade, R. Asteasuain and J. Marcovecchio. 2006. Acute toxicities of four metals
on the early life stages of the crab Chasmagnathus granulata from Bahia Blanca Estuary,
Argentina. Ecotoxicol. Environ. Saf. 65(2): 209-217.
Ferro, D., N. Franchi, V. Mangano, R. Bakiu, M. Cammarata, N. Parrinello, G. Santovito and L.
Ballarin. 2013. Characterization and metal-induced gene transcription of two new copper zinc
superoxide dismutases in the solitary ascidian Ciona intestinalis. Aquat. Toxicol. 140/141: 369-
379.
Filenko, O.F. and T.A. Samoylova. 2008. Effect of heavy metals on samples and model
population of rotifers Brachionus plicatilis Muller at different salinity. Mosc. Univ. Biol. Sci.
Bull. 63(2): 80-83.
Findik, O. and E. Cicek. 2011. Metal concentrations in two bioindicator fish species, Merlangius
merlangus, Mullus barbatus, captured from the West Black Sea Coasts (Bartin) of Turkey. Bull.
Environ. Contam. Toxicol. 87(4): 399-403.
Fitzpatrick, J.L., S. Nadella, C. Bucking, S. Balshine and C.M. Wood. 2008. The relative
sensitivity of sperm, eggs and embryos to copper in the blue mussel (Mytilus trossulus). Comp.
Biochem. Physiol. C. 147(4): 441-449.
Fletcher, R.L. 1989. A bioassay technique using the marine fouling green alga entermorpha. Int.
Biodeterior. 25(6): 407-422.

95
Fokina, N.N. and N.N. Nemova. 2012. Fatty acid composition of blue mussels Mytilus edulis
changes in response to cadmium and copper effects. Comp. Biochem. Pysiol. Part A. 163: S10-
S27 (ABS).
Fokina, N.N., T.R. Ruokolainen, N.N. Nemova and I.N. Bakhmet. 2013. Changes of blue
mussels Mytilus edulis L. lipid composition under cadmium and copper toxic effect. Biol. Trace.
Elem. Res. 154: 217-225.
Fonseca, V., A. Serafim, R. Company, M.J. Bebianno and H. Cabral. 2009. Effect of copper
exposure on growth, condition indices and biomarker response in juvenile sole Solea
senegalensis. Sci. Mar. (Barcelona). 73(1): 51-58.
Forget, J., J.F. Pavillon, B. Beliaeff and F. Bocquene. 1999. Joint action of pollutant
combinations (pesticides and metals) on survival (LC50 values) and acetylcholinesterase activity
of Tigriopus brevicornis (Copepod, Harpacticoida). Environ. Toxicol. Chem. 18(5): 912-918.
Franchi, N., D. Ferro, L. Ballarin and G. Santovito. 2012. Transcription of genes involved in
glutathione biosynthesis in the solitary tunicate Ciona intestinalis exposed to metals. Aquat.
Toxicol. 114/115: 14-22.
Frazier, J.M. 1976. The dynamics of metals in the American oyster, Crassostrea virginica. II.
Environmental effects. Chesapeake Sci. 17(3): 188-197.
Frias-Espericueta, M.G., D. Voltolina and J.I. Osuna-Lopez. 2003. Acute toxicity of copper,
zinc, iron, and manganese and of the mixtures copper-zinc and iron-manganese to whiteleg
shrimp Litopenaeus vannamei postlarvae. Bull. Environ. Contam. Toxicol. 71(1): 68-74.
Frias-Espericueta, M.G., S. Abad-Rosales, A.C. Nevarez-Velazquez, I. Osuna-Lopez, F. Paez-
Osuna, R. Lozano-Olvera and D. Voltolina. 2008a. Histological effects of a combination of
heavy metals on Pacific white shrimp Litopenaeus vannamei juveniles. Aquat. Toxicol. 89(3):
152-157.
Frias-Espericueta, M.G., R. Castro-Longoria, G.J. Barron-Gallardo, J.I. Osuna-Lopez, S.M.
Abad-Rosales, F. Paez-Osuna and D. Voltolina. 2008b. Histological changes and survival of
Litopenaeus vannamei juveniles with different copper concentrations. Aquacult. 278(1-4): 97-
100.
Freedman, J.H., M.R. Ciriolo and J. Peisach. 1989. The role of glutathione in copper metabolism
and toxicity. J. Biol. Chem. 264: 5598-5605.
Furuta, T., N. Iwata and K. Kikuchi. 2008. Effects of fish size and water temperature on the
acute toxicity of copper for Japanese flounder, Paralichthys olivaceus, and Red Sea bream,
Pagrus major. J. World Aquac. Soc. 39(6): 766-773.

96
Gabbianelli, R., G. Lupidi, M. Villarini and G. Falcioni. 2003. DNA damage induced by copper
on erythrocytes of gilthead sea bream Sparus aurata and mollusk Scapharca inaequivalvis. Arch.
Environ. Contam. Toxicol. 45(3): 350-356.
Galindo, M.D., J.A. Jurado, M. Garcia, M.L.G. De Canales, M. Oliva, F. Lopez, M.S.A.D.
Granado and E. Espada. 2012. Trace metal accumulation in tissues of sole (Solea senegalensis)
and the relationships with the abiotic environment. Intern. J. Environ. Anal. Chem. 92(9): 1072-
1092.
Gall, M.L., S.P. Homes, K.A. Daffron and E.L. Johnston. 2013. Differential tolerance to copper,
but no evidence of population-level genetic differences in a widely-dispersing native barnacle.
Ecotoxicol. 22: 929-937.
Galletly, B.C., M.W. Blows and D.J. Marshall. 2007. Genetic mechanisms of pollution resistance
in a marine invertebrate. Ecol. Appl. 17(8): 2290-2297.
Gama-Flores, J.L., S.S.S. Sarma and S. Nandini. 2005. Interaction among copper toxicity,
temperature and salinity on the population dynamics of Brachionus rotundiformis (Rotifera).
Hydrobiol. 546: 559-568.
Gambardella, C., A. De Benedictis, S.M. Guarino and M. De Nicola. 1998. Metal determination
by atomic absorption spectrophotometry and X-ray microanalysis in Idotea baltica exposed to
iron and copper. Ann. Chim. 88(3/4): 223-234.
Garcia, K., J.B.R. Agard and A. Mohammed. 2008. Comparative sensitivity of a tropical mysid
Metamysidopsis insularis and the temperate species Americamysis bahia to six toxicants.
Toxicol. Environ. Chem. 90(4): 779-785.
Gardner, G.R. and G. LaRoche. 1973. Copper induced lesions in estuarine teleosts. J. Fish. Res.
Board Can. 30: 363.
Garr, A.L. 2012. Toxicity and availability of copper and zinc to queen conch: Implications for
larval recruitment in the Florida Keys. Ph.D. Thesis, Florida Atlantic University, Baco Raton,
FL.
Gentile, S.M. 1982. Memorandum to John H. Gentile. EPA, Narragansett, RI.
Gentile, S. and J. Cardin. 1982. Unpublished nickel toxicity data generated by ERL –
Narragansett. EPA Environmental Research Lab, Narragansett, RI.
Georgiades, E.T., D.C. Gillan, P. Pernet, P. Dubois, A. Temara and D.A. Holdway. 2006. Copper
accumulation and expression of heat-stable low molecular mass proteins in Coscinasterias
muricata. Australas. J. Ecotoxicol. 12(1): 9-19.

97
Georgopoulos, P.G., A. Roy, M.J. Yonone-Lioy, R.E. Opiekun and P.J. Lioy. 2001.
Environmental copper: Its dynamics and human exposure issues. J. Toxicol. Environ. Health Part
B Crit. Rev. 4(4): 341-394.
Geracitano, L., J.M. Monserrat and A. Bianchini. 2002. Physiological and antioxidant enzyme
responses to acute and chronic exposure of Laeonereis acuta (Polychaeta, Nereididae) to copper.
J. Exp. Mar. Biol. Ecol. 277: 145-156.
Geracitano, L.A., R. Bocchetti, J.M. Monserrat, F. Regoli and A. Bianchini. 2004. Oxidative
stress responses in two populations of Laeonereis acuta (Polychaeta, Nereididae) after acute and
chronic exposure to copper. Mar. Environ. Res. 58(1): 1-17.
Geret, F., A. Jouan, V. Turpin, M.J. Bebianno and R.P. Cosson. 2002a. Influence of metal
exposure on metallothionein synthesis and lipid peroxidation in two bivalve mollusks: The oyster
(Crassostrea gigas) and the mussel (Mytilus edulis). Aquat. Liv. Res. 15(1): 61-66.
Geret, F., A. Serafim, L. Barreira and M.J. Bebianno. 2002b. Response of antioxidant systems to
copper in the gills of the clam Ruditapes decussatus. Mar. Environ. Res. 54(3-5): 413-417.
Giarratano, E., L. Comoglio and O. Amin. 2007. Heavy metal toxicity in Exosphaeroma gigas
(Crustacea, Isopoda) from the coastal zone of Beagle Channel. Ecotoxicol. Environ. Saf. 68(3):
451-462.
Gibson. 1976. Some effects of temperature, chlorine, and copper on the survival and growth of
the coon stripe shrimp. In: G. Esch and R.W. McFarlane (Eds.), Thermal ecology II. Proc. of
1975 Symp., Augusta, GA. pp. 88-92.
Gireesh, R. and C.P. Gopinathan. 2009. Effects of copper on development and survival rate of
Paphia malabarica Chemnitz larvae under low saline condition. Environ. Monit. Assess. 155(1-
4): 455-458.
Gissi, F., M.T. Binet and M.S. Adams. 2013. Acute toxicity testing with the tropical marine
copepod Acartia sinjiensis: Optimisation and application. Ecotoxicol. Environ. Saf. 97: 86-93.
Gissi, F., M.S. Adams, C.K. King and D.F. Jolley. 2015. A robust bioassay to assess the toxicity
of metals to the Antarctic marine macroalga Phaeocystis antarctica. Environ. Toxicol. Chem.
34(7): 1578-1587.
Glubokov, A.I. 1990. Growth of three species of fish during early ontogeny under normal and
toxic conditions. J. Ichthyol. 30(2):51-59. (Originally published in Vopr. Ikhtiol. 30(1): 137-
143).
Goh, B.P.L. and L.M. Chou. 1997. Effects of the heavy metals copper and zinc on zooxanthellae
cells in culture. Environ. Monitor. Assess. 44(1-3): 11-19.

98
Golding, C., R. Krassoi and E. Baker. 2006. The development and application of a marine
toxicity identification evaluation (TIE) protocol for use with an Australian bivalve. Australas. J.
Ecotoxicol. 12(1): 37-44.
Gomes, T., J.P. Pinheiro, I. Cancio, C.G. Pereira, C. Cardoso and M.J. Bebianno. 2011. Effects
of copper nanoparticles exposure in the mussel Mytilus galloprovincialis. Environ. Sci. Technol.
45(21): 9356-9362.
Gomes, T., C.G. Pereira, C. Cardoso, J.P. Pinheiro, I. Cancio and M.J. Bebianno. 2012.
Accumulation and toxicity of copper oxide nanoparticles in the digestive gland of Mytilus
galloprovincialis. Aquat. Toxicol. 118/119: 72-79.
Gomes, T., O. Araujo, R. Pereira, A.C. Almeida, A. Cravo and M.J. Bebianno. 2013.
Genotoxicity of copper oxide and silver nanoparticles in the mussel Mytilus galloprovincialis.
Mar. Environ. Res. 84: 51-59.
Gomiero, A. and A. Viarengo. 2014. Effects of elevated temperature on the toxicity of copper
and oxytetracycline in the marine model, Euplotes crassus: A climate change perspective.
Environ. Pollut. 194: 262-271.
Gomiero, A., A. Dagnino, S. Sforzini, A. Negri and A. Viarengo. 2012a. Heat stress effects on
toxicity of copper and oxytetracycline on the marine protozoa Euplotes crassus in a climate
change perspective. Comp. Biochem. Physiol. Part A. 163: S4-S9.
Gomiero, A., S. Sforzini, A. Dagnino, C. Nasci and A. Viarengo. 2012b. The use of multiple
endpoints to assess cellular responses to environmental contaminants in the interstitial marine
ciliate Euplotes crassus. Aquat. Toxicol. 114-115: 206-216.
Gopalakrishnan, S., H. Thilagam and P.V. Raja. 2007. Toxicity of heavy metals on
embryogenesis and larvae of the marine sedentary polychaete Hydroides elegans. Arch. Environ.
Contam. Toxicol. 52(2): 171-178.
Gorski, J. and D. Nugegoda. 2006a. Toxicity of trace metals to juvenile abalone, Haliotis rubra
following short-term exposure. Bull. Environ. Contam. Toxicol. 77(5): 732-740.
Gorski, J. and D. Nugegoda. 2006b. Sublethal toxicity of trace metals to larvae of the blacklip
abalone, Haliotis rubra. Environ. Toxicol. Chem. 25(5): 1360-1367.
Gould, E., R.A. Greig, D. Rusanowsky and B.C. Marks. 1985. Metal-exposed sea scallops,
Placopecten magellanicus (Gmelin): A comparison of the effects and uptake of cadmium and
copper. In: F.J. Vernberg, F.P. Thurberg, A. Calabrese and W. Vernberg (Eds.), Marine Pollution
and Physiology: Recent Advances. pp. 157-186.
Gould, E., R.J. Thompson and L.J. Buckley. 1986. Exposure of the scallop Placopecten
magellanicus (Gmelin) to sublethal copper and cadmium: Effects on the reproductive effort.
Aquat. Sci. Fish. Abstr. 16(10): (ABS No. 16035-1Q16).

99
Govindarajan, S., C.P. Valsaraj, R. Mohan, V. Hariprasad and R. Ramasubramanian. 1993.
Toxicity of heavy metals in aquaculture organisms: Penaeus indicus, Perna viridis, Artemia
salina and Skeletonema costatum. Pollut. Res. 12(3): 187-189.
Gravato, C., M. Teles, M. Oliveira and M.A. Santos. 2006. Oxidative stress, liver
biotransformation and genotoxic effects induced by copper in Anguilla anguilla L. - the
influence of pre-exposure to beta-naphthoflavone. Chemosphere 65(10): 1821-1830.
Grosell, M. 2012. Copper. In: C.M. Wood, A.P. Farrell and C.J. Brauner (Eds.), Homeostatis and
toxicology of essential metals: Fish Physiology, Volume 31A. Academic Press/Elsevier,
Waltham, MA.
Grosell, M., C.M. Wood and P.J. Walsh. 2003. Copper homeostasis and toxicity in the
elasmobranch Raja erinacea and the teleost Myoxocephalus octodecemspinosus during exposure
to elevated water-borne copper. Comp. Biochem. Physiol. C. 135(2): 179-190.
Grosell, M., M.D. McDonald, C.M. Wood and P.J. Walsh. 2004. Effects of prolonged copper
exposure in the marine gulf toadfish (Opsanus beta): I. Hydromineral balance and plasma
nitrogenous waste products. Aquat. Toxicol. 68(3): 249-262.
Grosell, M., J. Blanchard, K.V. Brix and R. Gerdes. 2007. Physiology is pivotal for interactions
between salinity and acute copper toxicity to fish and invertebrates. Aquat. Toxicol. 84(2): 162-
172.
Guida, M., M. Inglese and S. Meric. 2008. A multi-battery toxicity investigation on fungicides.
Desalination 226(1-3): 262-270.
Guo, F., R. Tu and W.X. Wang. 2013. Different responses of abalone Haliotis discus hannai to
waterborne and dietary-borne copper and zinc exposure. Ecotoxicol. Environ. Saf. 91: 10-17.
Guo, R. and J.S. Ki. 2012. Differential transcription of heat shock protein (HSP90) in the
dinoflagellate Prorocentrum minimum by copper and endocrine-disrupting chemicals.
Ecotoxicol. 21: 1448-1457.
Guo, R., V. Ebenezer and J.S. Ki. 2012. Transcriptional responses of heat shock protein 70
(Hsp70) to thermal, bisphenol A, and copper stresses in the dinoflagellate Prorocentrum
minimum. Chemosphere 89: 512-520.
Guo, L., P.H. Santschi and T.S. Bianchi. 1999. Dissolved organic matter in estuaries of the Gulf
of Mexico. In: T.S. Bianchi, J. Pennock and R.R. Twilley (Eds.), Biogeochemistry of Gulf of
Mexico Estuaries. Wiley, New York, NY, pp. 269-299.
Guo, L. and P.H. Santschi. 1997. Isotopic and elemental characterization of colloidal organic
matter from the Chesapeake Bay and Galveston Bay. Mar. Chem. 59: 1-15.

100
Hajimad, T. and V.J. Vedamanikam. 2014. Temperature effects on the toxicity of four trace
metals to adult spotted Babylonia snails (Babylonia areolata). Toxicol. Environ. Chem. 95(8):
1380-1387.
Hall, L.W., Jr., R.D. Anderson and J.V. Kilian. 1997. Acute and chronic toxicity of copper to the
estuarine copepod Eurytemora affinis: Influence of organic complexation and speciation.
Chemosphere 35(7): 1567-1597.
Hall, L.W., Jr., R.D. Anderson, B.L. Lewis and W.R. Arnold. 2008. The influence of salinity and
dissolved organic carbon on the toxicity of copper to the estuarine copepod, Eurytemora affinis.
Arch. Environ. Contam. Toxicol. 54(1): 44-56.
Hamelink, J., Landrum, P.F., Bergman, H. and W.H. Benson. 1994. Bioavailability: Physical,
Chemical, and Biological Interactions. CRC Press. Boca Raton, FL. 256 pp.
Han, B.C. and T.C. Hung. 1990. Green oysters caused by copper pollution on the Taiwan coast.
Environ. Pollut. 64(4): 347-362.
Handy, R.D. 2003. Chronic effects of copper exposure versus endocrine toxicity: Two sides of
the same toxicological process? Comp. Biochem. Physiol. A. 135(1): 25-38.
Hanna, S.K., R.J. Miller, D. Zhou, A.A. Keller and H.S. Lenihan. 2013. Accumulation and
toxicity of metal oxide nanoparticles in a soft-sediment estuarine amphipod. Aquat. Toxicol.
142-143: 441-446.
Hansell, D.A. and C.A. Carlson (Eds.). 2002. Biogeochemistry of marine dissolved organic
matter. Academic Press, New York, NY, 774 pp.
Hansen, P.J. 2002. Effect of high pH on the growth and survival of marine phytoplankton:
Implications for species succession. Aquat. Microb. Ecol. 28: 279-288.
Hansen, D.J. 1983. Section on acute toxicity tests to be inserted in the April 1983 report on site
specific FAV’s. Memorandum to W. Brungs, March 21, 1983.
Hansen, J.I., T. Mustafa and M. Depledge. 1992. Mechanisms of copper toxicity in the shore
crab, Carcinus maenas I. Effects on Na, K-ATPase activity, haemolymph electrolyte
concentrations and tissue. Mar. Biol. (Berlin) 114(2): 253-257.
Hare, L. 1992. Aquatic insects and trace metals: bioavailability, bioaccumulation, and toxicity.
Critic. Rev. Toxicol. 22(5/6): 327-369.
Harrison, F.L., J.P. Knezovich and J.S. Tucker. 1981. The sensitivity of embryos of the Pacific
oyster 'Crassostrea gigas' to different chemical forms of copper. Technical Report UCRL-
52725, Lawrence Livermore National Lab., CA. 30 pp.

101
Harrison, F.L., J.R. Lam and R. Berger. 1983. Sublethal responses of Mytilus edulis to increased
dissolved copper. Sci. Total Environ. 28: 141-158.
Hasegawa, R., Y. Nakaji, Y. Kurokawa and M. Tobe. 1989. Acute toxicity tests on 113
environmental chemicals. Sci. Rep. Res. Inst. Tohoku Univ. Ser. C Med. 36(1-4): 10-16.
Hateley, J.G., A. Grant and N.V. Jones. 1989. Heavy metal tolerance in estuarine populations of
Nereis diversicolor. In: J.S. Ryland and P.A. Tyler (Eds.), 23rd Eur. Mar. Biol. Symp. on
Reprod., Genetics and Distributions of Marine Organisms, Sept.5-9, 1988, Swansea, Wales,
U.K., Olsen and Olsen, Fredensborg, Denmark. pp. 379-386.
Hebel, D.K., M.B. Jones, R.M. Moate and M.H. Depledge. 1999. Differing sensitivities of
respiratory and osmoregulatory gill tissue of Carcinus maenas (Crustacea: Decapoda) to water-
borne copper. Mar. Biol. (Berlin) 133(4): 675-681.
Hedouin, L. and R.D. Gates. 2013. Assessing fertilization success of the coral Montipora
capitata under copper exposure: Does the night of spawning matter? Mar. Pollut. Bull. 66: 221-
224.
Hellou, J., P. Yeats, S. Steller and F. Gagne. 2003. Chemical contaminants and biological
indicators of mussel health during gametogenesis. Environ. Toxicol. Chem. 22(9): 2080-2087.
Hem, J.D. 1989. Study and interpretation of the chemical characteristics of natural water, 3rd Ed.
U.S. Geological Survey water-supply paper 2253. Government Printing Office.
Henry, R.P., C. Lucu, H. Onken and D. Weihrauch. 2012. Multiple functions of the crustacean
gill: Osmotic/ionic regulation, acid-base balance, ammonia excretion, and bioaccumulation of
toxic metals. Front Physiol. 3: 431-443.
Herzi, F., N. Jean, H. Zhao, S. Mounier, H.H. Mabrouk and A.S. Hlaili. 2013. Copper and
cadmium effects on growth and extracellular exudation of the marine toxic dinoflagellate
Alexandrium catenella: 3D-fluorescence spectroscopy approach. Chemosphere 93: 1230-1239.
Hetrick, F.M., B.S. Roberson and C.F. Tsai. 1982. Effect of heavy metals on the susceptibility
and immune response of striped bass to bacterial pathogens. Office of Marine Pollution
Assessment, National Oceanic and Atmospheric Administration, Rockville. MD.
NOAA82112603.
Hilmy, A.M., N.F. Abdel-Hamid and K.S. Ghazaly. 1985. Toxic effects of both zinc and copper
on size and sex of Portunus pelagicus (L.) (Crustacea: Decapoda). Bull. Inst. Oceanogr. Fish.
Cairo ARE. 11: 207-215.
Hines, A., F.J. Staff, J. Widdows, R.M. Compton, F. Falciani and M.R. Viant. 2010. Discovery
of metabolic signatures for predicting whole organism toxicology. Toxicol. Sci. 115(2): 369-378.

102
Ho, K.T., A. Kuhn, M.C. Pelletier, T.L. Hendricks and A. Helmstetter. 1999. pH dependent
toxicity of five metals to three marine organisms. Environ. Toxicol. Water Qual. 14(2): 235-240.
Hodgson, A.N. and M. Hoebeke. 1984. Short-term behavioural responses of Perna perna
(Mollusca: Bivalvia) subjected to copper concentrations. Trans. R. Soc. S. Afr. 45(P2): 177-186.
Hoher, N., F. Regoli, A. Dissanayake, M. Nagel, M. Kriews, A. Kohler and K. Broeg. 2013.
Immunomodulating effects of environmentally realistic copper concentrations in Mytilus edulis
adapted to naturally low salinities. Aquat. Toxicol. 140-141: 185-195.
Hollibaugh, J.T., D.L.R. Siebert and W.H. Thomas. 1980. A comparison of the acute toxicities of
ten heavy metals to phytoplankton from Saanich Inlet, B.C., Canada. Estuar. Coast. Mar. Sci. 10:
93-105.
Hook, S.E. and N.S. Fisher. 2001. Reproductive toxicity of metals in calanoid copepods. Mar.
Biol. (Berlin) 138(6): 1131-1140.
Hook, S.E., H.L. Osborn, F. Gissi, P. Moncuquet, N.A. Twine, M.R. Wilkins and M.S. Adams.
2014. RNA-Seq analysis of the toxicant-induced transcriptome of the marine diatom, Ceratoneis
closterium. Mar. Genomics 16: 45-53.
Hori, H., M. Tateishi, K. Takayanagi and H. Yamada. 1996. Applicability of artificial seawater
as a rearing seawater for toxicity tests of hazardous chemicals by marine fish species. Bull.
Japan. Soc. Sci. Fish. (4): 614-622.
Horning, W.B. and T.W. Neiheisel. 1979. Chronic effect of copper on the bluntnose minnow,
Pimephales notatus (Rafinesque). Arch. Environ. Contam. Toxicol. 8: 545-552.
Hornung, E., E. Fischer and S. Farkas. 1998. Isopod reproduction as a tool for sublethal-toxicity
tests. Isr. J. Zool. 44(3/4): 445-450.
Horta-Puga, G., S. Chazaro-Olvera, I. Winfield, M. Avila-Romero and M. Moreno-Ramirez.
2013. Cadmium, copper and lead in macroalgae from the Veracruz Reef System, Gulf of
Mexico: Spatial distribution and rainy season variability. Mar. Pollut. Bull. 68(1-2): 127-133.
Howarth, R.S. and J.B. Sprague. 1978. Copper lethality to rainbow trout in waters of various
hardness and pH. Water Res. 12: 455-462.
Howe, P.L., A.J. Reichelt-Brushett and M.W. Clark. 2012. Aiptasia pulchella: A tropical
cnidarian representative for laboratory ecotoxicological research. Environ. Toxicol. Chem.
31(11): 2653-2662.
Howe, P.L., A.J. Reichelt-Brushett and M.W. Clark. 2014. Effects of Cd, Co, Cu, Ni and Zn on
asexual reproduction and early development of the tropical sea anemone Aiptasia pulchella.
Ecotoxicol. 23(9): 1593-1606.

103
Howell, R. 1984. Acute toxicity of heavy metals to two species of marine nematodes. Mar.
Environ. Res. 11(3): 153-161.
Hrovat, M., H. Segner, S. Jeram and M. Hrovat. 2009. Variability of in vivo fish acute toxicity
data. Reg. Toxicol. Pharmacol. 54(3): 294-300.
Huang, H., J. Liang, X. Wu, H. Zhang, Q. Li and Q. Zhang. 2013. Comparison in copper
accumulation and physiological response of Gracilaria lemaneiformis and G. lichenoides
(Rhodophyceae). Chin. J. Oceanol. Limnol. 31(4): 803-812.
Hughes, M.M., M.A. Heber, G.E. Morrison, S.C. Schimmel and W.J. Berry. 1989. An evaluation
of a short-term chronic effluent toxicity test using sheepshead minnow (Cyprinodon variegates)
larvae. Environ. Pollut. 60: 1-14.
Hummel, H., P. Magni, C. Amiard-Triquet, F. Rainglet, R. Modderman, Y. Van Duijn, M.
Herssevoort, J. De Jong, L. Snitsevorg, M. Ytsma, R. Bogaards and L. De Wolf. 1998. Influence
of the level of oxygenation in sediment and water on copper bioavailability to marine bivalves:
Laboratory experiments and translocation experiments in the field. Hydrobiol. 373/374(1-3):
297-310.
Hunt, J.W., B.S. Anderson, S.L. Turpen, A.R. Coulon, M. Martin, F.H. Palmer and J.J. Janik.
1989. Experimental evaluation of effluent toxicity testing protocols with giant kelp, mysids, red
abalone, and topsmelt. Division of Water Quality Report NO. 89-5WQ. 144 pp.
Huovinen, P., P. Leal and I. Gomez. 2010. Interacting effects of copper, nitrogen and ultraviolet
radiation on the physiology of three south Pacific kelps. Mar. Fresh. Res. 61(3): 330-341.
Hutchins, C.M., P.R. Teasdale, S.Y. Lee and S.L. Simpson. 2008. The influence of small-scale
circum-neutral pH change on Cu-bioavailability and toxicity to an estuarine bivalve (Austriella cf
plicifera) in whole-sediment toxicity tests. Sci. Total Environ. 405(1-3): 87-95.
Hutchins, C.M., P.R. Teasdale, S.Y. Lee and S.L. Simpson. 2009. Influence of sediment metal
spiking procedures on copper bioavailability and toxicity in the estuarine bivalve Indoaustriella
lamprelli. Environ. Toxicol. Chem. 28(9): 1885-1892.
Hutchinson, T.H., T.D. Williams and G.J. Eales. 1994. Toxicity of cadmium, hexavalent
chromium and copper to marine fish larvae (Cyprinodon variegates) and copepods (Tisbe
battagliai). Mar. Environ. Res. 38: 275-290.
Hwang, D.F. and Y.H. Lu. 2000. Influence of environmental and nutritional factors on growth,
toxicity, and toxin profile of dinoflagellate Alexandrium minutum. Toxicon. 38(11): 1491-1503.
Hwang, D.S., K.W. Lee, J. Han, H.G. Park, J. Lee, Y.M. Lee, and J.S. Lee. 2010. Molecular
characterization and expression of vitellogenin (Vg) genes from the cyclopoid copepod,
Paracyclopina nana exposed to heavy metals. Comp. Biochem. Physiol. Part C 151(3): 360-368.

104
Hyne, R.V. and D.A. Everett. 1998. Application of a benthic euryhaline amphipod, Corophium
sp., as a sediment toxicity testing organism for both freshwater and estuarine systems. Arch.
Environ. Contam. Toxicol. 34(1): 26-33.
Inda, J. and G.M. Cuturrufo. 1999. Valve closure by juvenile scallops as a protective mechanism
in response to elevated levels of environmental copper. Bull. Environ. Contam. Toxicol. 63(4):
520-523.
International Copper Association. 2003. Diffuse sources of environmental copper in the United
States. International Copper Association, Ltd., New York, NY. 154 pp.
Isani, G., G. Sarli, G. Andreani, B. Brunetti, R. Marrocco, E. Carpene, G. Beha, F. Morandi and
C. Benazzi. 2012. Effects of waterborne copper on gills catalase and blood biochemistry in
gilthead seabream (Sparus aurata L.). J. Elem. S: 255-267.
Ittoop, G., K.C. George, R.M. George, K.S. Sobhana, N.K. Sanil and P.C. Nisha. 2009. Effect of
copper toxicity on the hemolymph factors of the Indian edible oyster, Crassostrea madrasensis
(Preston). Indian J. Fish. 56(4): 301-306.
Ivanina, A.V., E. Beniash, M. Etzkorn, T.B. Meyers, A.H. Ringwood and I.M. Sokolova. 2013.
Short-term acute hypercapnia affects cellular response to trace metals in the hard clams
Mercenaria mercenaria. Aquat. Toxicol. 140-141: 123-133.
Jackim, E. 1973. Influence of lead and other metals on d-aminolevulinate dehydrase activity. J.
Fish. Res. Board Can. 30: 560-562.
Janssen, C.R., G. Persoone and T.W. Snell. 1994. Cyst-based toxicity tests. VIII. Short-chronic
toxicity tests with the freshwater rotifer Brachionus calyciflorus. Aquat. Toxicol. 28: 243-258.
Jara-Marini, M.E., J.N. Tapia-Alcaraz, J.A. Dumer-Gutierrez, L. Garcia-Rico, J. Garcia-
Hernandez and F. Paez-Osuna. 2013. Comparative bioaccumulation of trace metals using six
filter feeder organisms in a coastal lagoon ecosystem (of the central-east Gulf of California).
Environ. Monit. Assess. 185(2): 1071-1085.
Jeong, C.B., B.M. Kim, R.K. Kim, H.G. Park, S.J. Lee, K.H. Shin, K.M.Y. Leung, J.S. Rhee and
J.S. Lee. 2014. Functional characterization of P-glycoprotein in the intertidal copepod Tigriopus
japonicus and its potential role in remediating metal pollution. Aquat. Toxicol.156: 135-147.
Jing, G., Y. Li, L. Xie and R. Zhang. 2006. Metal accumulation and enzyme activities in gills
and digestive gland of pearl oyster (Pinctada fucata) exposed to copper. Comp. Biochem.
Physiol. C. 144(2): 184-190.
Jiraungkoorskul, W., S. Sahaphong and N. Kangwanrangsan. 2007. Toxicity of copper in
butterfish (Poronotus triacanthus): Tissues accumulation and ultrastructural changes. Environ.
Toxicol. 22(1): 92-100.

105
Johnson, H.D., J.G. Grovhoug and A.O. Valkirs. 1998. Copper loading to U.S. Navy harbors:
Norfolk, VA; Pearl Harbor, HI; and San Diego, CA. Technical Document 3052. Space and Naval
Systems Center. Systems Center (SPAWAR), U.S. Navy, San Diego, CA.
Johnson, M.W. and J.H. Gentile. 1979. Acute toxicity of cadmium, copper, and mercury to larval
American lobster Homarus americanus. Bull. Environ. Contam. Toxicol. 22: 258-264.
Johnson, S.K. 1974. Toxicity of several management chemicals to penaeid shrimp. Texas Agric.
Ext. Serv. Fish Dis. Diagn. Lab Report FDDL-S3: 12 pp.
Jokela, W.E., J.P. Tilley and D.S. Ross. 2010. Manure nutrient content on Vermont dairy farms:
Long-term trends and relationships. Comm. Soil Sci. Plant Anal. 41(5): 623-637.
Jonczyk, E., G. Gilron and B. Zajdlik. 2001. Sea urchin fertilization assay: An evaluation of
assumptions related to sample salinity adjustment and use of natural and synthetic marine waters
for testing. Environ. Toxicol. Chem. 20(4): 804-809.
Jones, K.H., D.M. Sanderson and D.N. Noakes. 1968. Acute toxicity data for pesticides (1968).
World Rev. Pest Control. 7(3): 135-143.
Jones, L.H., N.V. Jones and A.J. Radlett. 1976. Some effects of salinity on the toxicity of copper
to the polychaete Nereis diversicolor. Estuar. Coast. Mar. Sci. 4: 107-111.
Jones, M.B. 1975. Effects of copper on survival and osmoregulation in marine and brackish
water isopods (Crustacea). In: M. Barnes (Ed.), Proceedings of the 9th European Marine Biology
Symposium, University of Aberdeen, Scotland: 419-431.
Jorgensen, K.F. and K. Jensen. 1977. Effect of copper (II) chloride on the hatching rate of
Artemia salina (L.). Chemosphere 6(6): 287-291.
Kalle, T. 1971. Salinity: General Introduction. In: O. Kinne (Ed.), Marine Ecology: A
Comprehensive, Integrated Treatise on Life in Oceans and Coastal Waters, Vol. 1 (Part 2),
Wiley-Interscience, London.
Kanduc, T., D. Medakovic and B. Hamer. 2011. Mytilus galloprovincialis as a bioindicator of
environmental conditions: The case of the eastern coast of the Adriatic Sea. Isotopes Environ.
Health Stud. 47(1): 42-61.
Kang, J.C., S.G. Kim and S.W. Jang. 2005. Growth and hematological changes of rockfish,
Sebastes schlegeli (Hilgendorf) exposed to dietary Cu and Cd. J. World Aquacult. Soc. 36: 188-
195.
Kannupandi, T., K. Pasupathi and P. Soundarapandian. 2001. Chronic toxicity bioassay and
effect of endosulfan, HCH, copper and zinc on the survival and intermoult duration of larvae of
mangrove crab Macrophthalmus erato De Man. Indian J. Exp. Biol. 39: 814-817.

106
Kapustka, L.A., W.H. Clements, L. Ziccardi, P.R. Paquin, M. Sprenger and D. Wall. 2004. Issue
paper on the ecological effects of metals. EPA Risk Assessment Forum: Papers Addressing
Scientific Issues in the Risk Assessment of Metals. 74 pp. Available at online:
http://cfpub.epa.gov/ncea/cfm/recordisplay.cfm?deid=86119.
Kennish, M.J. 1998. Trace metal-sediment dynamics in estuaries: pollution assessment. Rev.
Environ. Contam. Toxicol. 155: 69-110.
Kentouri, M., G.V. Vlachonis, P. Divanach and N. Papandroulakis. 1993. On the effect of a
bronze pump propeller on the copper water quality and survival of sea bass (Dicentrarchus
labrax) eggs in intensive larval aquaculture closed system. In: M. Carrillo, L. Dahle, J. Morales,
P. Sorgeloos, N. Svennevig and J. Wyban (Eds.), From discovery to commercialization: World
Aquaculture '93 Int. Conf., Special Publ. No. 19, European Aquacult. Soc., Oostende, Belgium.
pp. 397 (ABS).
Ketpadung, R. and N. Tangkrock-Olan. 2006. Changes in oxygen consumption and heart rate of
the blue swimming crab, Portunus pelagicus (Linnaeus, 1766) following exposure to sublethal
concentrations of copper. J. Environ. Biol. 27(1): 7-12.
Khan, M.A. and M.F. Khan. 1999. Effects of copper on Aphanius dispar from mangrove area at
Sandspit, Karachi. Pak. J. Mar. Biol. 5(2): 155-159.
Khan, S.M.M.K., C. Yoshimura, M. Arikawa, G. Omura, S. Nishiyama, Y. Suetomo, S. Kakuta
and T. Suzaki. 2006. Axopodial degradation in the heliozoon Raphidiophrys contractilis: A
novel bioassay system for detecting heavy metal toxicity in an aquatic environment. Environ.
Sci. 13(4): 193-200.
Ki, J.S., S. Raisuddin, K.W. Lee, D.S. Hwang, J. Han, J.S. Rhee, I.C. Kim, H.G. Park, J.C. Ryu
and J.S. Lee. 2009. Gene expression profiling of copper-induced responses in the intertidal
copepod Tigriopus japonicus using a 6K oligochip microarray. Aquat. Toxicol. 93(4): 177-187.
Kiaune, L. and N. Singhasemanon. 2011. Pesticidal copper (I) oxide: Environmental fate and
aquatic toxicity. D.M. Whitacre (Ed.). Rev. Environ. Contam. Toxicol. 213: 1-26.
Kidwai, S. and M. Ahmed. 1999. Heavy metal bioassays on selected fauna from the Karachi
Coast (Northwest Arabian Sea). Pak. J. Zool. 30(2): 147-157.
Kim, B.M., J.S. Rhee, J.S. Seo, I.C. Kim, Y.M. Lee and J.S. Lee. 2012. 8-Oxoguanine DNA
glycosylase 1 (OGG1) from the copepod Tigriopus japonicas: Molecular characterization and its
expression in response to UV-B and heavy metals. Comp. Biochem. Physiol. Part C 155: 290-
299.
Kim, S.G. and J.C. Kang. 2004. Effect of dietary copper exposure on accumulation, growth and
hematological parameters of the juvenile rockfish, Sebastes schlegeli. Mar. Environ. Res. 58: 65-
82.

107
King, C.K., S.A. Gale, R.V. Hyne, J.L. Stauber, S.L. Simpson and C.W. Hickey. 2006a.
Sensitivities of Australian and New Zealand amphipods to copper and zinc in waters and metal-
spiked sediments. Chemosphere 63(9): 1466-1476.
King, C.K., S.A. Gale and J.L. Stauber. 2006b. Acute toxicity and bioaccumulation of aqueous
and sediment-bound metals in the estuarine amphipod Melita plumulosa. Environ. Toxicol.
21(5): 489-504.
King, C.K., M.C. Dowse and S.L. Simpson. 2010. Toxicity of metals to the bivalve Tellina
deltoidalis and relationships between metal bioaccumulation and metal partitioning between
seawater and marine sediments. Arch. Environ. Contam. Toxicol. 58(3): 657-665.
Kious, W.J. and R.I. Tilling. 1996. This dynamic earth: The story of plate tectonics: USGS
general interest publication. USGS. U.S Government Printing Office. 77pp.
Klumpp, D.W. and C. Burdon-Jones. 1982. Investigations of the potential of bivalve molluscs as
indicators of heavy metal levels in tropical marine waters. Aust. J. Mar. Fresh. Res. 33(2): 285-
300.
Knezovich, J.P., F.L. Harrison and J.S. Tucker. 1981. The influence of organic chelators on the
toxicity of copper to embryos of the Pacific oyster, Crassostrea gigas. Arch. Environ. Contam.
Toxicol. 10: 241-249.
Kobayashi, N. and H. Okamura. 2002. Effects of new antifouling compounds on the
development of sea urchin. Mar. Pollut. Bull. 44: 748-751.
Kolyuchkina, G.A. and A.D. Ismailov. 2011. Morpho-functional characteristics of bivalve
mollusks under the experimental environmental pollution by heavy metals. Oceanol. 51(5): 804-
813.
Koukouzika, N. and V.K. Dimitriadis. 2008. Aspects of the usefulness of five marine pollution
biomarkers, with emphasis on MN and lipid content. Mar. Pollut. Bull. 56(5): 941-949.
Krang, A.S. and M. Ekerholm. 2006. Copper reduced mating behaviour in male shore crabs
(Carcinus maenas (L.). Aquat. Toxicol. 80(1): 60-69.
Krassoi, R., I. Anderson and D. Everett. 1997. Larval abnormalities in doughboy scallops
Chlamys (Mimachlamys) asperrima L. in response to test conditions and six reference toxicants.
Australas. J. Ecotoxicol. 3(1): 65-74.
Krell, B., M. Moreira-Santos and R. Ribeiro. 2011. An estuarine mudsnail in situ toxicity assay
based on postexposure feeding. Environ. Toxicol. Chem. 30(8): 1935-1942.
Krishnamurthy, S. 1994. Effects of physiochemical differences and concentration on assimilation
and depuration of copper and silver in Crassostrea virginica. Ph.D. Thesis, Univ. of Maryland,
Eastern Shore, MD. 98 pp.

108
Krishnani, K.K., I.S. Azad, M. Kailasam, A.R. Thirunavukkarasu, B.P. Gupta, K.O. Joseph, M.
Muralidhar and M. Abraham. 2003. Acute toxicity of some heavy metals to Lates calcarifer fry
with a note on its histopathological manifestations. J. Environ. Sci. Health Part A. 38(4): 645-
655.
Kulac, B., G. Atli and M. Canli. 2013. Response of ATPases in the osmoregulatory tissues of
freshwater fish Oreochromis niloticus exposed to copper in increased salinity. Fish Physiol.
Biochem. 39(2): 391-401.
Kumar, K.S., Y.S. Han, K.S. Choo, J.A. Kong and T. Han. 2009. Chlorophyll fluorescence based
copper toxicity assessment of two algal species. Toxicol. Environ. Health Sci. 1(1): 17-23.
Kumar, R. 2012. Acute toxicity of cadmium, copper, lead and zinc to tiger shrimp Penaeus
monodon postlarvae. Intern. J. Environ. Sci. 3(1): 305-311.
Kumaraguru, A.K. and K. Ramamoorthi. 1978. Toxicity of copper to three estuarine bivalves.
Mar. Environ. Res. 1: 43-48.
Kumari, L.K. and V.R. Nair. 1992. Uptake and bioconcentration of copper and zinc by the
molluscs Saccostrea cucullata (Born) and Cerithium rubus (Desh) from the coastal waters of
Bombay. Indian J. Mar. Sci. 21(1): 74-76.
Kwok, C.K. and P.O. Ang Jr. 2013. Inhibition of larval swimming activity of the coral
(Platygyra acuta) by interactive thermal and chemical stresses. Mar. Pollut. Bull. 74: 264-273.
Kwok, K.W.H. and K.M.Y. Leung. 2005. Toxicity of antifouling biocides to the intertidal
harpacticoid copepod Tigriopus japonicus (Crustacea, Copepoda): Effects of temperature and
salinity. Mar. Pollut. Bull. 51(8-12): 830-837.
Kwok, K.W.H., K.M.Y. Leung, V.W.W. Bao and J.S. Lee. 2008. Copper toxicity in the marine
copepod Tigropus japonicus: Low variability and high reproducibility of repeated acute and life-
cycle tests. Mar. Pollut. Bull. 57(6-12): 632-636.
Kwok, K.W.H., E.P.M. Grist and K.M.Y. Leung. 2009. Acclimation effect and fitness cost of
copper resistance in the marine copepod Tigriopus japonicus. Ecotoxicol. Environ. Saf. 72(2):
358-364.
Lacoue-Labarthe, T., P. Bustamante, E. Horlin, A. Luna-Acosta, A. Bado-Nilles and H. Thomas-
Guyon. 2009. Phenoloxidase activation in the embryo of the common cuttlefish Sepia officinalis
and responses to the Ag and Cu exposure. Fish Shellfish Immunol. 27(3): 516-521.
Lacoue-Labarthe, T., E. Le Bihan, D. Borg, N. Koueta and P. Bustamante. 2010. Acid
phosphatase and cathepsin activity in cuttlefish (Sepia officinalis) eggs: The effects of Ag, Cd,
and Cu exposure. ICES J. Mar. Sci. 67(7): 1517-1523.

109
Lahbib, Y., A. Mleiki, I. Marigomez and N.T. Menif. 2013. Copper, zinc, and cadmium body
concentrations in Hexaplex trunculus collected from the Tunisian Coast. Environ. Monit. Assess.
185(11): 8967-8975.
Laib, E. and E. Leghouchi. 2012. Cd, Cr, Cu, Pb, and Zn concentrations in Ulva lactuca, Codium
fragile, Jania rubens, and Dictyota dichotoma from Rabta Bay, Jijel (Algeria). Environ. Monit.
Assess. 184(3): 1711-1718.
Lan, W. and N. Chen. 1991. Acute toxicity of Hg, Cu, Cd, Zn to larvae of red sea bream,
Chrysophrys major. Mar. Sci. (Qingdao) 5: 56-60.
Lander, L. and L. Lindeström. 1999. Copper in society and in the environment. Swedish
Environmental Research Group, Centraltryckeriet, AB, Boras. 329 pp
Lauer, M.M. and A. Bianchini. 2010. Chronic copper toxicity in the estuarine copepod Acartia
tonsa at different salinities. Environ. Toxicol. Chem. 29(10): 2297-2303.
Lauer, M.M., C.B. de Oliveira, N.L.I. Yano and A. Bianchini. 2012. Copper effects on key
metabolic enzymes and mitochondrial membrane potential in gills of the estuarine crab
Neohelice granulate at different salinities. Comp. Biochem. Physiol. Part C. 156: 140-147.
Lavolpe, M., L.L. Greco, D. Kesselman and E. Rodriguez. 2004. Differential toxicity of copper,
zinc, and lead during the embryonic development of Chasmagnathus granulatus (Brachyura,
Varunidae). Environ. Toxicol. Chem. 23(4): 960-967.
Lawrence, A. and C. Poulter. 1996. The potential role of the estuarine amphipod Gammarus
duebeni in sub-lethal ecotoxicology testing. Water Sci. Technol. 34(7/8): 93-100.
Leano, E.M. and K.L. Pang. 2010. Effect of copper(II), lead(II), and zinc(II) on growth and
sporulation of Halophytophthora from Taiwan mangroves. Water Air Soil Pollut. 213(1-4): 85-
93.
Le Cadre, V. and J.P. Debenay. 2006. Morphological and cytological responses of ammonia
(Foraminifera) to copper contamination: Implication for the use of Foraminifera as bioindicators
of pollution. Environ. Pollut. 143(2): 304-317.
Lee, C.H., T.K. Ryu, M. Chang and J.W. Choi. 2004. Effect of silver, cadmium, chromium,
copper, and zinc on the fertilization of the northern Pacific asteroid, Asterias amurensis. Bull.
Environ. Contam. Toxicol. 73(4): 613-619.
Lee, J.A., I.D. Marsden and C.N. Glover. 2010. The influence of salinity on copper accumulation
and its toxic effects in estuarine animals with differing osmoregulatory strategies. Aquat.
Toxicol. 99(1): 65-72.
Lee, K.M. and E.L. Johnston. 2007. Low levels of copper reduce the reproductive success of a
mobile invertebrate predator. Mar. Environ. Res. 64(3): 336-346.

110
Lee, K.W., S. Raisuddin, D.S. Hwang, H.G. Park and J.S. Lee. 2007. Acute toxicities of trace
metals and common xenobiotics to the marine copepod Tigriopus japonicus: Evaluation of its
use as a benchmark species for routine ecotoxicity tests in western Pacific coastal regions.
Environ. Toxicol. 22(5): 532-538.
Lee, K.W., S. Raisuddin, J.S. Rhee, D.S. Hwang, I.T. Yu, Y.M. Lee, H.G. Park and J.S. Lee.
2008a. Expression of glutathione S-transferase (GST) genes in the marine copepod Tigriopus
japonicas exposed to trace metals. Aquat. Toxicol. 89(3): 158-166.
Lee, K.W., S. Raisuddin, D.S. Hwang, H.G. Park, H.U. Dahms, I.Y. Ahn and J.S. Lee. 2008b.
Two-generation toxicity study on the copepod model species Tigriopus japonicus. Chemosphere
72: 1359-1365.
Lee, R. and Y. Oshima. 1998. Effects of selected pesticides, metals and organometallics on
development of blue crab (Callinectes sapidus) embryos. Mar. Environ. Res. 46(1-5): 479-482.
Lee, R.F., S.A. Steinert, K. Nakayama and Y. Oshima. 1999. Use of DNA strand damage (comet
assay) and embryo hatching effects to assess contaminant exposure in blue crab (Callinectes
sapidus) embryos. In: D.S. Henshel, M.C. Black and M.C. Harrass (Eds.), Environmental
Toxicology and Risk Assessment: Standardization of Biomarkers for Endocrine Disruption and
Environmental Assessment, 8th Volume, ASTM STP 1364, West Conshohocken, PA. pp. 341-
349.
Lehtonen, K.K. and S. Leinio. 2003. Effects of exposure to copper and malathion on
metallothionein levels and acetylcholinesterase activity of the mussel Mytilus edulis and the clam
Macoma balthica from the northern Baltic Sea. Bull. Environ. Contam. Toxicol. 71(3): 489-496.
Levinton, J.S. 2001. Marine biology. Oxford University Press, Chapter 4 – The Chemical and
Physical Environment.
Lewis, A.G. and W.R. Cave. 1982. The biological importance of copper in oceans and estuaries.
Oceanogr. Mar. Biol. Annu. Rev. 20: 471-692.
Lewis, A.G., P.H. Whitfield and A. Ramnarine. 1972. Some particulate and soluble agents
affecting the relationship between metal toxicity and organism survival in the calanoid copepod
Euchaeta japonica. Mar. Biol. (Berlin). 17(3): 215-221.
Lewis, C., K. Clemow and W.V. Holt. 2013. Metal contamination increases the sensitivity of
larvae but not gametes to ocean acidification in the polychaete Pomatoceros lamarckii
(Quatrefages). Mar. Biol. 160: 2089-2101.
Li, L., X. Huang, D. Borthakur and H. Ni. 2012b. Photosynthetic activity and antioxidative
response of seagrass Thalassia hemprichii to trace metal stress. Acta Oceanol Sin. 31(3): 98-108.

111
Li, X., J. Li, Y. Wang, L. Fu, J. Zhu and Q. Duan. 2010. Kinetic study of the bioaccumulation of
heavy metals (Cu, Pb, and Cd) in Chinese domestic oyster Ostrea plicatula. J. Environ. Sci.
Health Part A 45(7): 836-845.
Li, X.B., X.L. Hou, Q. Mao, Y.L. Zhao, Y.X. Cheng and Q. Wang. 2009. Toxic effects of copper
on antioxidative and metabolic enzymes of the marine gastropod, Onchidium struma. Arch.
Environ. Contam. Toxicol. 56(4): 776-784.
Li, Y., Z. Gu, H. Liu, H. Shen and J. Yang. 2012a. Biochemical response of the mussel Mytilus
coruscus (Mytiloida: Mytilidae) exposed to in vivo sub-lethal copper concentrations. Chin. J.
Oceanol. Limnol. 30(5): 738-745.
Liao, I.C. and C.S. Hsieh. 1988. Toxicity of heavy metals to Penaeus japonicus 1. Toxicities of
copper, cadmium and zinc to Penaeus japonicus. J. Fish. Soc. Taiwan. 15(2): 69-78.
Liess, M., O. Champeau, M. Riddle, R. Schulz and S. Duquesne. 2001. Combined effects of
ultraviolet-B radiation and food shortage on the sensitivity of the Antarctic amphipod Paramoera
walkeri to copper. Environ. Toxicol. Chem. 20(9): 2088-2092.
Lin, H.C. and W.A. Dunson. 1993. The effect of salinity on the acute toxicity of cadmium to the
tropical, estuarine, hermaphroditic fish, Rivulus marmoratus: A comparison of Cd, Cu, and Zn
tolerance with Fundulus heteroclitus. Arch. Environ. Contam. Toxicol. 25: 41-47.
Lin, Y.H., Y.Y. Shie and S.Y. Shiau. 2008. Dietary copper requirements of juvenile grouper,
Epinephelus malabaricus. Aquacult. 274: 161-165.
Lind, D., Alto and Chatterton. 1978. Regional copper-nickel study: Aquatic toxicology study.
Preliminary draft report, Minnesota Environmental Quality Board, St. Paul, MN.
Linder, M.C. 1991. Biochemistry of copper. Plenium Press, NY. pp. 34-45.
Liu, F., D.Z. Wang and W.X. Wang. 2012. Cadmium-induced changes in trace element
bioaccumulation and proteomics perspective in four marine bivalves. Environ. Toxicol. Chem.
31(6): 1292-1300.
Liu, M., G. Li, S. Zhang, W. Bao and H. Gu. 1995. Influence of toxicity of metal ions on
survival of larval of Penaeus orientalis. Stud. Mar. Sin. (Haiyang Kexue Jikan). 36(10): 165-
174.
Liu, X.J., Z. Luo, B.X. Xiong, X. Liu, Y.H. Zhao, G.F. Hu and G.J. Lv. 2010. Effect of
waterborne copper exposure on growth, hepatic enzymatic activities and histology in
Synechogobius hasta. Ecotoxicol. Environ. Saf. 73(6): 1286-1291.
Long, A. and W.X. Wang. 2005. Metallothionein induction and bioaccumulation kinetics of Cd
and Ag in the marine fish Terapon jarbua challenged with dietary or waterborne Ag and Cu.
Mar. Ecol. Prog. Ser. 291: 215-226.

112
Lopez, J.M. and G.F. Lee. 1977. Environmental chemistry of copper in Torch Lake, Michigan.
Water Air Soil. Pollut. 8: 373.
Lopez Greco, L.S., E.M. Rodriguez, G. Hernandez and J. Bolanos. 2002. Effects of copper on
hatching of larvae and prezoea survival of Petrolisthes galathinus (Porcellanidae): Assays with
ovigerous females and isolated eggs. Environ. Res. Sect. A. 90(1): 40-46.
Lorenzo, J.I., R. Beiras, V.K. Mubiana and R. Blust. 2005. Copper uptake by Mytilus edulis in
the presence of humic acids. Environ. Toxicol. Chem. 24(4): 973-980.
Lozano, P., C. Trombini, E. Crespo, J. Blasco and I. Moreno-Garrido. 2014. ROI-scavenging
enzyme activities as toxicity biomarkers in three species of marine microalgae exposed to model
contaminants (copper, Irgarol and atrazine). Ecotoxicol. Environ. Saf. 104: 294-301.
Lundebye, A.K. and M.H. Depledge. 1998a. Molecular and physiological responses in shore
crabs Carcinus maenas following exposure to copper. Mar. Environ. Res. 46(1-5): 567-572.
Lundebye, A.K. and M.H. Depledge. 1998b. Automated interpulse duration assessment (AIDA)
in the shore crab Carcinus maenas in response to copper exposure. Mar. Biol. (Berlin). 130(4):
613-620.
Lunz, J.D. 1972. The importance of particulate clay minerals in the uptake and accumulation of
copper by the American oyster, Crassostrea virginica (Gmelin). M.S. Thesis, Long Island
University, Greenvale, NY. 48 pp.
Lussier, S.M. and J.A. Cardin. 1985. Results of acute toxicity tests conducted with copper at
ERL, Narragansett. EPA, Narragansett, RI. 3 pp.
Lussier, S.M., J.H. Gentile and J. Walker. 1985. Acute and chronic effects of heavy metals and
cyanide on Mysidopsis bahia (Crustacea: Mysidacea). Aquat. Toxicol. 7: 25-35.
Lyla, P.S. and S.A. Khan. 2011. Pattern of accumulation of heavy metals (copper and zinc) in the
estuarine hermit crab Clibanarius longitarsus (De Hann). Indian J. Geo-Marine Sci. 40(1): 117-
120.
Macey, B.M., M.J. Jenny, H.R. Williams, L.K. Thibodeaux, M. Beal, J.S. Almeida, C.
Cunningham, A. Mancia, G.W. Warr, E.J. Burge, A.F. Holland, P.S. Gross, S. Hikima, K.G.
Burnett, L. Burnett and R.W. Chapman. 2010. Modelling interactions of acid-base balance and
respiratory status in the toxicity of metal mixtures in the American oyster Crassostrea virginica.
Comp. Biochem. Physiol. Part A Mol. Integr. Physiol. 155(3): 341-349.
Machado, A.A.S., M.L.M. Hoff, R.D. Klein, J.G. Cardozo, M.M. Giacomin, G.L.L. Pinho and
A. Bianchini. 2013. Biomarkers of waterborne copper exposure in the guppy Poecilia vivipara
acclimated to salt water. Aquat. Toxicol. 138-139: 60-69.

113
MacInnes, J.R. 1981. Response of embryos of the American oyster, Crassostrea virginica, to
heavy metal mixtures. Mar. Environ. Res. 4(3): 217-227.
MacInnes, J.R. and A. Calabrese. 1978. Response of embryos of the American oyster,
Crassostrea virginica, to heavy metals at different temperatures. In: Physiology and Behavior of
Marine Organisms. D. S. McLusky and A. J. Berry (Eds.). Proc. 12th Eur. Mar. Biol. Symp. pp.
195-202. Oxford, Pergammon Press.
MacInnes, J.R. and F.P. Thurberg. 1973. Effects of metals on the behavior and oxygen
consumption of the mud snail. Mar. Pollut. Bull. 4(12): 185-186.
Macken, A., M. Giltrap, K. Ryall, B. Foley, E. McGovern, B. McHugh and M.A. Davoren. 2009.
Test battery approach to the ecotoxicological evaluation of cadmium and copper employing a
battery of marine bioassays. Ecotoxicol. 18(4): 470-480.
Mackereth, F.J. and W.J.P. Smyly. 1951. Toxicity of copper in solution to the stone-loach.
Nature 168: 1130.
MacRae, R.K., D.E. Smith and N. Swoboda-Colberg. 1999. Copper binding affinity of rainbow
trout (Oncorhynchus mykiss). Environ. Toxicol. Chem. 18(6): 1180-1189.
Maharajan, A. and M. Vijayakumaran. 2004. Copper toxicity in the spiny lobster, Panulirus
homarus (Linnaeus). In: Proc. Natl. Sem. on New Frontiers in Marine Bioscience Research, Jan.
22-23. pp. 205-212.
Maharajan, A., B. Vaseeharan, S. Rajalakshmi, M. Vijayakumaran, P. Kumarasamy and J.C.
Chen. 2011. Effect of copper on morphology, weight, and chromosomal aberrations in the spiny
lobster, Panulirus homarus (Linnaeus, 1758). Biol. Trace Elem. Res. 144: 769-780.
Maharajan, A., S. Rajalakshmi, M. Vijayakumaran and P. Kumarasamy. 2012a. Sublethal effect
of copper toxicity against histopathological changes in the spiny lobster, Panulirus homarus
(Linnaeus, 1758). Biol. Trace Elem. Res. 145: 201-210.
Maharajan, A., S. Rajalakshmi and M. Vijayakumaran. 2012b. Effect of copper in protein,
carbohydrate and lipid contents of the juvenile lobster, Panulirus homarus homarus (Linnaeus,
1758). Sri Lanka J. Aquat. Sci. 17: 19-34.
Mahaut, M.L., O. Basuyaux, E. Baudiniere, C. Chataignier, J. Pain and C. Caplat. 2013. The
porifera Hymeniacidon perlevis (Montagu, 1818) as a bioindicator for water quality monitoring.
Environ. Sci. Pollut. Res. Int. 20(5): 2984-2992.
Mai, H., J. Cachot, J. Brune, O. Geffard, A. Belles, H. Budzinski and B. Morin. 2012.
Embryotoxic and genotoxic effects of heavy metals and pesticides on early life stages of Pacific
oyster (Crassostrea gigas). Mar. Pollut. Bull. 64: 2663-2670.

114
Main, W.P.L., C. Ross and G.K. Bielmyer. 2010. Copper accumulation and oxidative stress in
the sea anemone, Aiptasia pallida, after waterborne copper exposure. Comp. Biochem. Physiol.
C Pharmacol. Toxicol. Endocrinol. 151(2): 216-221.
Manimaran, K., P. Karthikeyan, S. Ashokkumar, V. Ashok Prabu and P. Sampathkumar. 2012.
Effect of copper on growth and enzyme activities of marine diatom, Odontella mobiliensis. Bull.
Environ. Contam. Toxicol. 88: 30-37.
Manley, A.R. and J. Davenport. 1979. Behavioural responses of some marine bivalves to
heightened seawater copper concentrations. Bull. Environ. Contam. Toxicol. 22: 739-744.
Manley, A.R., L.D. Gruffydd and P.C. Almada-Villela. 1984. The effect of copper and zinc on
the shell growth of Mytilus edulis measured by a laser diffraction technique. J. Mar. Biol. Ass.
U.K. 64: 417-427.
Mantoura, R.F.C. and E.M.S. Woodward. 1983. Conservative behaviour of riverine dissolved
organic carbon in the Severn Estuary: Chemical and geochemical implications. Geochim.
Cosmochim. Acta 47: 1293-1309.
Manyin, T.A. 2008. Bioenergetic, reproductive, and population-level effects of dissolved copper
and cadmium on the grass shrimp Palaemonetes pugio. Ph.D. Thesis. Univ. of Maryland,
College Park, MD. 152 pp.
Manyin, T. and C.L. Rowe. 2009. Bioenergetic effects of aqueous copper and cadmium on the
grass shrimp Palaemonetes pugio. Comp. Biochem. Phys. Part C. 150(1): 65-71.
Manyin, T. and C.L. Rowe. 2010. Reproductive and life stage-specific effects of aqueous copper
on the grass shrimp, Palaemonetes pugio. Mar. Environ. Res. 69: 152-157.
Manzo, S., S. Buono and C. Cremisini. 2008. Predictability of copper, irgarol, and diuron
combined effects on sea urchin Paracentrotus lividus. Arch. Environ. Contam. Toxicol. 54(1):
57-68.
Marcano, L., O. Nusetti, J. Rodriguez-Grau and J. Vilas. 1996. Uptake and depuration of copper
and zinc in relation to metal-binding protein in the polychaete Eurythoe complanata. Comp.
Biochem. Physiol. C. 114(3): 179-184.
Marchan, S., M.S. Davies, S. Fleming and H.D. Jones. 1999. Effects of copper and zinc on the
heart rate of the limpet Patella vulgata L. Comp. Biochem .Physiol. A. 123(1): 89-93.
Marshall, W.S. and M. Grosell 2005. Ion transport, osmoregulation and acid–base balance. In: D.
Evans and J.B. Claiborne (Eds.). Physiology of Fishes, 3rd Ed. CRC Press, Boca Raton, FL: 177-
230.

115
Martin, J.M., F.M. Piltz and D.J. Reish. 1975. Studies on the Mytilus edulis community in
Alamitos Bay, California. V. The effects of heavy metals on byssal thread production. Veliger
18(2): 183-187.
Martin, M., M.D. Stephenson and J.H. Martin. 1977. Copper toxicity experiments in relation to
abalone deaths observed in a power plant’s cooling waters. Calif. Fish Game. 63(2): 95-100.
Martin, M., K.E. Osborn, P. Billig and N. Glickstein. 1981. Toxicities of ten metals to
Crassostrea gigas and Mytilus edulis embryos and Cancer magister larvae. Mar. Pollut. Bull.
12(9): 305-308.
Martin, M., J.W. Hunt, B.S. Anderson and S.L. Turpen. 1989. Experimental evaluation of the
mysid Holmesimysis costata as a test organism for effluent toxicity testing. Environ. Toxicol.
Chem. 8: 1003-1012.
Martincic, D., Z. Kwokal, Z. Peharec, D. Margus and M. Branica. 1992. Distribution of Zn, Pb,
Cd and Cu between seawater and transplanted mussels (Mytilus galloprovincialis). Sci. Total
Environ. 119: 211-230.
Martin-Diaz, M.L, J. Blasco, M.G. De Canales, D. Sales and T.A. Del Valls. 2005.
Bioaccumulation and toxicity of dissolved heavy metals from the Guadalquivir Estuary after the
Aznalcollar mining spill using Ruditapes philippinarum. Arch. Environ. Contam. Toxicol. 48(2):
233-241.
Martins, C.M.G., D.V. Almeida, L.F.F. Marins and A. Bianchini. 2011a. mRNA expression and
activity of ion-transporting proteins in gills of the blue crab Callinectes sapidus: Effects of
waterborne copper. Environ. Toxicol. Chem. 30(1): 206-211.
Martins, C.D.G., I.F. Barcarolli, E.J. De Menezes, M.M. Giacomin, C.M. Wood and A.
Bianchini. 2011b. Acute toxicity, accumulation and tissue distribution of copper in the blue crab
Callinectes sapidus acclimated to different salinities: In vivo and in vitro studies. Aquat. Toxicol.
101(1): 88-99.
Mashroofeh, A., A.R. Bakhtiari and M. Pourkazemi. 2012. Bioaccumulation of Zn, Cu and Mn
in the caviar and muscle of Persian sturgeon (Acipenser persicus) from the Caspian Sea, Iran.
Bull. Environ. Contam. Toxicol. 89(6): 1201-1204.
Mathew, R. and N.R. Menon. 1984. Filtration in Perna viridis and Meretrix casta under heavy
metal stress. Mahasagar Bull. Natl. Inst. Ocean. 17(3): 183-186.
Mathew, S. and R. Damodaran. 1997. Lipofuscin as physiological indicator of heavy metal stress
in Sunetta scripta (yellow clam) and Perna viridis (green mussel). Indian J. Mar. Sci. 26(1): 64-
67.

116
Matranga, V., A. Pinsino, D. Randazzo, A. Giallongo and P, Dubois. 2012. Long-term
environmental exposure to metals (Cu, Cd, Pb, Zn) activates the immune cell stress response in
the common European sea star (Asterias rubens). Mar. Environ. Res. 76: 122-127.
Mayer, F.L., D.R. Buckler, F.J. Dwyer, M.R. Ellersieck, L.C. Sappington, J.M. Besser and C.M.
Bridges. 2008. Endangered aquatic vertebrates: Comparative and probabilistic-based toxicology.
EPA/600/R-08/045, U.S.EPA, Washington, DC: 43 p.
Mayor, D.J., M. Solan, I. Martinez, L. Murray, H. McMillan, G.I. Paton and K. Killham. 2008.
Acute toxicity of some treatments commonly used by the salmonid aquaculture industry to
Corophium volutator and Hediste diversicolor: Whole sediment bioassay tests. Aquacult. 285:
102-108.
McDuffee, A.T., G. Senisterra, S. Huntley, J.R. Lepock, K.R. Sekhar, M.J. Meredith, M.J.
Borrelli, J.D. Morrow and M.L. Freeman. 1997. Proteins containing non-native disulfide bonds
generated by oxidative stress can act as signals for the induction of the heat shock response. J.
Cell Physiol. 171: 143-151.
McGee, B.L., D.J. Fisher, L.T. Yonkos, G.P. Ziegler and S. Turley. 1999. Assessment of
sediment contamination, acute toxicity, and population viability of the estuarine amphipod
Leptocheirus plumulosus in Baltimore Harbor, Maryland, USA. Environ. Toxicol. Chem. 18(10):
2151-2160.
McGeer, J.C., R.C. Playle, C.M. Wood and F. Galvez. 2000. A physiologically based biotic
ligand model for predicting the acute toxicity of waterborne silver to rainbow trout in
freshwaters. Environ. Sci. Technol. 34: 4199-4207.
McGeer, J.C., K.V. Brix, J.M. Skeaff, D.K. DeForest, S.I. Brigham, W.J. Adams and A.S.
Green. 2003. The inverse relationship between bioconcentration factor and exposure
concentration for metals: Implications for hazard assessment of metals in the aquatic
environment. Environ. Toxicol. Chem. 22(5): 1017-1037.
McGeer, J.C., S. Niyogi and D. Smith. 2011. Cadmium. Fish Physiol. 31: 125-184.
McKenzie, L.A., R. Brooks and E.L. Johnston. 2011. Heritable pollution tolerance in a marine
invader. Environ. Res. 111(7): 926-932.
McKim, J.M., J.G. Eaton and G.W. Holcombe. 1978. Metal toxicity to embryos and larvae of
eight species of freshwater fish - II. Copper. Bull. Environ. Contam. Toxicol. 19: 608-616.
McLeese, D.W. 1974. Toxicity of copper at two temperatures and three salinities to the
American lobster (Homarus americanus). J. Fish. Res. Board. Can. 31: 1949-1952.
McLeese, D.W. 1976. Toxicity studies with lobster larvae and adults and a freshwater crayfish in
1975. Manuscr. Rep. Ser. No.1384, Fish. Res. Board of Can., Environ. Can., St. Andrews, New
Brunswick, Canada. 15 pp.

117
McLeese, D.W. and S. Ray. 1986. Toxicity of CdCl2, CdEDTA, CuCl2, and CuEDTA to marine
invertebrates. Bull. Environ. Contam. Toxicol. 36(5): 749-755.
McLusky, D.S. and C.N.K. Phillips. 1975. Some effects of copper on the polychaete Phyllodoce
maculate. Estuar. Coast. Mar. Sci. 3: 103-108.
McNulty, H.R., B.S. Anderson, J.W. Hunt, S.L. Turpen and M.M. Singer. 1994. Age-specific
toxicity of copper to larval topsmelt Atherinops affinis. Environ. Toxicol. Chem. 13(3): 487-492.
Mebane, C.A. 2006. Cadmium risks to freshwater life: Derivation and validation of low-effect
criteria values using laboratory and field studies. U.S. Geological Survey Scientific Investigation
Report 2006-5245 (2010 rev.). Available online at: http://pubs.usgs.gov/sir/2006/5245/.
Medesani, D.A., L.S. Lopez Greco and E.M. Rodriguez. 2004a. Disruption of endocrine
regulation of glycemia levels by cadmium and copper in the estuarine crab Chasmagnathus
granulata. Bull. Environ. Contam. Toxicol. 73(5): 942-946.
Medesani, D.A., L.S.L. Greco and E.M. Rodriguez. 2004b. Interference of cadmium and copper
with the endocrine control of ovarian growth, in the estuarine crab Chasmagnathus granulata.
Aquat. Toxicol. 69(2): 165-174.
Medina, M.H., B. Morandi and J.A. Correa. 2008. Copper effects in the copepod Tigriopus
angulatus Lang, 1933: Natural broad tolerance allows maintenance of food webs in copper-
enriched coastal areas. Mar. Fresh. Res. 59(12): 1061-1066.
Menchaca, I., M.J. Belzunce, J. Franco, J.M. Garmendia, N. Montero, M. Revilla and I.
Menchaca. 2010. Sensitivity comparison of laboratory-cultured and field-collected amphipod
Corophium multisetosum in toxicity tests. Bull. Environ. Contam. Toxicol. 84(4): 390-394.
Mendez, N. and C. Green-Ruiz. 2005. Preliminary observations of cadmium and copper effects
on juveniles of the polychaete Capitella sp. (Annelida: Polychaeta) from Estero del Yugo,
Mazatlan, Mexico. Rev. Chilena Hist. Nat. 78(4): 701-710.
Mendez, N. and C. Green-Ruiz. 2006. Cadmium and copper effects on larval development and
mortality of the polychaete Capitella sp. Y from Estero del Yugo, Mazatlan, Mexico. Water Air
Soil Pollut. 171: 291-299.
Metaxas, A. and A.G. Lewis. 1991. Copper tolerance of Skeletonema costatum and Nitzschia
thermalis. Aquat. Toxicol. 19(4): 265-280.
Metzger, D.C., P. Pratt and S.R. Roberts. 2012. Characterizing the effects of heavy metal and
Vibrio exposure on HSP70 expression in Crassostrea gigas gill tissue. J. Shell. Res. 31(3): 627-
630.

118
Meyer, J.S. 2002. The utility of the terms “bioavailability” and “bioavailable fraction” for
metals. Mar. Environ. Res. 53:417-423.
Meyer, J.S., R.C. Santore, J.P. Bobbitt, L.D. Debrey, C.J. Boese, P.R. Paquin, H.E. Allen, H.L.
Bergman and D.M. DiToro. 1999. Binding of nickel and copper to fish gills predicts toxicity
when water hardness varies, but free-ion activity does not. Environ. Sci. Technol. 33(6): 913-
916.
Meyer, J.S., C.J. Boese and S.A. Collyard. 2002. Whole-body accumulation of copper predicts
acute toxicity to an aquatic oligochaete (Lumbriculus variegatus) as pH and calcium are varied.
Comp. Biochem. Physiol. Part C 133(1-2): 99-109.
Meyer, J.S., W.J Adams, K.V. Brix, S.N. Luoma, D.R. Mount, W.A. Stubblefield and C.M.
Wood. 2005. Toxicity of dietborne metals to aquatic organisms. SETAC Press, Pensacola, FL.
Mhadhbi, L., M. Boumaiza and R. Beiras. 2010. A standard ecotoxicological bioassay using
early life stages of the marine fish Psetta maxima. Aquat. Living Resour. 23: 209-216.
Miao, A.J., W.X. Wang and P. Juneau. 2005. Comparison of Cd, Cu, and Zn toxic effects on four
marine phytoplankton by pulse-amplitude-modulated fluorometry. Environ. Toxicol. Chem.
24(10): 2603-2611.
Milanovich, F.P., R. Spies, M.S. Guram and E.E. Sykes. 1976. Uptake of copper by the
polychaete Cirriformia spirabranchia in the presence of dissolved yellow organic matter of
natural origin. Estuar. Coast. Mar. Sci. 4: 585-588.
Miller, E. 1986. Responses of Geukensia demissa to dissolved copper at various salinities. J.
Shellfish Res. 7(1): 127.
Miller, E.R. 1988. Physiological, exfoliative cytological, histological, and biochemical responses
of Geukensia demissa (Mollusca) exposed to dissolved copper at various salinities. Ph.D. Thesis,
Univ. of Connecticut, CT. 252 pp.
Millward, R.N., K.R. Carman, J.W. Fleeger, R.P. Gambrell, R.T. Powell and M.A.M. Rouse.
2001. Linking ecological impact to metal concentrations and speciation: A microcosm
experiment using a salt marsh meiofaunal community. Environ. Toxicol. Chem. 29(9): 2029-
2037.
Minghetti, M., M.J. Leaver, E. Carpene and S.G. George. 2008. Copper transporter 1,
metallothionein and glutathione reductase genes are differentially expressed in tissues of sea
bream (Sparus aurata) after exposure to dietary or waterborne copper. Comp. Biochem. Physiol.
C. 147(4): 450-459.
Misra, S.K., A.K. Panda and S.N. Padhy. 2005. Growth performance of post larvae of Penaeus
monodon in response to copper sulphate. J. Appl. Zool. Res. 16(1): 91-92.

119
Mizrahi, L. and Y. Achituv. 1989. Effect of heavy metals ions on enzyme activity in the
Mediterranean mussel, Donax trunculus. Bull. Environ. Contam. Toxicol. 42(6): 854-859.
Mizrahi, L., L. Newberger-Cywiak and Y. Achituv. 1993. Effect of heavy metals ions on enzyme
activity, mortality and behaviour of the Mediterranean white mussel Donax trunculus. In: Final
Reports on Research Projects (Activity G), UNEP, Athens, Greece, MAP Tech. Rep. Ser. No.48.
pp. 73-88.
Mochida, K., K. Ito, H. Harino, A. Kakuno and K. Fujii. 2006. Acute toxicity of pyrithione
antifouling biocides and joint toxicity with copper to red sea bream (Pagrus major) and toy
shrimp (Heptacarpus futilirostris). Environ. Toxicol. Chem. 25(11): 3058-3064.
Mochida, K., K. Ito, H. Harino, T. Onduka, A. Kakuno and K. Fujii. 2008. Early life-stage
toxicity test for copper pyrithione and induction of skeletal anomaly in a teleost, the mummichog
(Fundulus heteroclitus). Environ. Toxicol. Chem. 27(2): 367-374.
Mohan, M., M. Deepa, E.V. Ramasamy and A.P. Thomas. 2012. Accumulation of mercury and
other heavy metals in edible fishes of Cochin Backwaters, southwest India. Environ. Monit.
Assess. 184(7): 4233-4245.
Mohapatra, B.C. and K. Rengarajan. 1997. Acute toxicities of copper sulphate, zinc sulphate and
lead nitrate to Liza parsia (Hamilton-Buchanan). J. Mar. Biol. Assoc. India 39(1/2): 69-78.
Mokhtar, M.B., S.M. Praveena, A.Z. Aris, O.C. Yong and A.P. Lim. 2012. Trace metal (Cd, Cu,
Fe, Mn, Ni and Zn) accumulation in scleractinian corals: A record for Sabah, Borneo. Mar.
Pollut. Bull. 64(11): 2556-2563.
Money, C., C.B. Braungardt, A.N. Jha, P.J. Worsfold, E.P. Achterberg and C. Money. 2011.
Metal speciation and toxicity of Tamar estuary water to larvae of the Pacific oyster, Crassostrea
gigas. Mar. Environ. Res. 72(1-2): 3-12.
Monteiro, S.C.R., G.L.L. Pinho, K. Hoffman, I.F. Barcarolli and A. Bianchini. 2013. Acute
waterborne copper toxicity to the euryhaline copepod Acartia tonsa at different salinities:
Influence of natural freshwater and marine dissolved organic matter. Environ. Toxicol. Chem.
32(6): 1412-1419.
Moore, M.N. and A.R.D. Stebbing. 1976. The quantitative cytochemical effects of three metal
ions on the lysosomal hydrolase of a hydroid. J. Mar. Biol. Assoc. U.K. 56: 995-1005.
Moore, M.N., A. Viarengo, P. Donkin and A.J.S. Hawkins. 2007. Autophagic and lysosomal
reactions to stress in the hepatopancreas of blue mussels. Aquat. Toxicol. 84(1): 80-91.
Moraga, D., A.L. Meistertzheim, S. Tanguy-Royer, I. Boutet, A. Tanguy and A. Donval. 2005.
Stress response in Cu2+ and Cd2+ exposed oysters (Crassostrea gigas): An
immunohistochemical approach. Comp. Biochem. Physiol. C. 141(2): 151-156.

120
Moraitou-Apostolopoulou, M. 1978. Acute toxicity of copper to a copepod. Mar. Pollut. Bull. 9:
278-280.
Moraitou-Apostolopoulou, M. and G. Verriopoulos. 1982. Individual and combined toxicity of
three heavy metals, Cu, Cd and Cr for the marine copepod Tisbe holothuriae. Hydrobiol. 87: 83.
Morel, F.M., 1983. Chapter 6. Complexation: Trace metals and microorganisms. In: F.M.M.
Morel and J.G. Hering (Eds.). Principles of Aquatic Chemistry. Wiley-Interscience Publication,
New York, NY, pp. 301-308.
Morel, F.M. 1993. Complexation. Trace Metals and Microorganisms. In: F.M.M. Morel and J.G.
Hering (Eds.) Principles and Applications of Aquatic Chemistry, Chapter 6, Wiley Interscience,
NY. pp. 405-414.
Morel, F.M. and J.G. Hering (Eds.). 1983. Principles of aquatic chemistry. Wiley-Interscience
Publication, New York, NY.
Moreno-Garrido, I., L.M. Lubian and A.M.V.M. Soares. 2000. Influence of cellular density on
determination of EC50 in microalgal growth inhibition tests. Ecotoxicol. Environ. Saf. 47: 112-
116.
Morley, N.J., K.M.Y. Leung, D. Morritt and M. Crane. 2003. Toxicity of anti-fouling biocides to
Parorchis acanthus (Digenea: Philophthalmidae) cercarial encystment. Dis. Aquat. Org. 54(1):
55-60.
Morris, O.P. and G. Russell. 1973. Effect of chelation on toxicity of copper. Mar. Pollut. Bull.
4(10): 159-160.
Moulder, S.M. 1980. Combined effect of the chlorides of mercury and copper in sea water on the
euryhaline amphipod Gammarus duebeni. Mar. Biol. 59: 193-200.
Mouneyrac, C., O. Mastain, J.C. Amiard, C. Amiard-Triquet, P. Beaunier, A.Y. Jeantet, B.D.
Smith and P.S. Rainbow. 2003. Trace-metal detoxification and tolerance of the estuarine worm
Hediste diversicolor chronically exposed in their environment. Mar. Biol. (Berlin) 143(4): 731-
744.
Mukhopadhyay, M.K. 1983. Effects of copper on fish and aquatic ecosystem. Aquat. Sci. Fish.
Abstr. 14(6 Pt.1): 264 (ABS No.14285-1Q14) (1984) / Environ. Ecol. 1(1): 53-59.
Munari, C. and M. Mistri. 2007. Effect of copper on the scope for growth of clams (Tapes
philippinarum) from a farming area in the northern Adriatic Sea. Mar. Environ. Res. 64(3): 347-
357.
Munshi, A.B., S.Y. Quan and S.J. Li. 1996a. Acute toxicity of copper, cadmium and copper-
cadmium mixture to the larvae of the shrimp Penaeus monodon. Pak. J. Sci. Ind. Res. 39(1-4):
68-71.

121
Munshi, A.B., Y.Q. Su and S.J. Li. 1996b. Acute toxicities of copper, cadmium and Cu: Cd
mixture to larvae of the shrimp Penaeus penicillatus. Chin. J. Oceanol. Limnol. 14(2): 170-174.
Mutlu, C., M. Turkmen, A. Turkmen and Y. Tepe. 2011. Comparison of metal concentrations in
tissues of blue crab, Callinectes sapidus from Mediterranean lagoons. Bull. Environ. Contam.
Toxicol. 87: 282-286.
Nabavi, S.F., S.M. Nabavi, A.M. Latifi, S. Eslami and M.A. Ebrahimzadeh. 2012. Determination
of trace elements level of pikeperch collected from the Caspian Sea. Bull. Environ. Contam.
Toxicol. 88: 401-405.
Nadella, S.R., J.L. Fitzpatrick, N. Franklin, C. Bucking, S. Smith and C.M. Wood. 2009.
Toxicity of dissolved Cu, Zn, Ni and Cd to developing embryos of the blue mussel (Mytilus
trossolus) and the protective effect of dissolved organic carbon. Comp. Biochem. Physiol. C.
149(3): 340-348.
Nair, A., Z.A. Ansari, S.N. Harkantra and A.H. Parulekar. 1977. Uptake of copper by the mussel
Mytilus viridis L. Indian J. Mar. Sci. 6(1): 90-91.
Nassiri, Y., J.L. Mansot, J. Wery, T. Ginsburger-Vogel and J.C. Amiard. 1997. Ultrastructural
and electron energy loss spectroscopy studies of sequestration mechanisms of Cd and Cu in the
marine diatom Skeletonema costatum. Arch. Environ. Contam. Toxicol. 33(2): 147-155.
Naylor, G.P.L. 1987. The responses of cockles to heavy metal pollution and their use in the study
of metal to metal uptake interactions. Ph.D. Thesis, University of Manchester, UK: 169 p.
Nebeker, A.V., C. Savonen, R.J. Baker and J.K. McCrady. 1984. Effects of copper, nickel and
zinc on the lifecycle of the caddisfly Clistoronia magnifica (Limnephilidae). Environ. Toxicol.
Chem. 3(4): 645-649.
Neff, J.M. 2002. Bioaccumulation in marine organisms: Effect of contaminants from oil well
produced water. Elsevier, New York, NY. 452 pp.
Neff, J.M. and J.W. Anderson. 1977. The effects of copper (II) on molting and growth of
juvenile lesser blue crabs Callinectes similis Williams. In: C.S. Giam (Ed.), Pollutant Effects on
Marine Organisms, D.C. Heath and Co., Lexington, MA. pp. 155-165.
Negri, A., C. Oliveri, S. Sforzini, F. Mignione, A. Viarengo and M. Banni. 2013. Transcriptional
response of the mussel Mytilus galloprovincialis (Lam.) following exposure to heat stress and
copper. PLOS ONE 8(6): e66802.
Neiheisel, T.W. and M.E. Young. 1992. Use of three artificial sea salts to maintain fertile sea
urchins (Arbacia punctulata) and to conduct fertilization tests with copper and sodium dodecyl
sulfate. Environ. Toxicol. Chem. 11: 1179-1185.

122
Nelson, D.A., J.E. Miller and A. Calabrese. 1988. Effect of heavy metals on bay scallops, surf
clams, and blue mussels in acute and long-term exposures. Arch. Environ. Contam. Toxicol. 17:
595-600.
Nelson, R.W., M. Nipper, A. Lawrence and S. Watts. 2010. Parental dietary effect on
embryological development response to toxicants with the sea urchin Arbacia punctulata. Bull.
Environ. Contam. Toxicol. 84(1): 71-75.
Neuhoff, H.G. and H. Theede. 1984. Long-term effects of low copper concentrations at normal
and reduced oxygen tensions. Limnologica (Berlin) 15(2): 513-521.
Ng, T.Y.T and W.X. Wang. 2007. Interactions of silver, cadmium, and copper accumulation in
green mussels (Perna viridis). Environ. Toxicol. Chem. 26(8): 1764-1769.
Nicholson, S. 1999. Cardiac and lysosomal responses to periodic copper in the mussel Perna
viridis (Bivalvia: Mytilidae). Mar. Pollut. Bull. 38(12): 1157-1162.
NOAA (National Oceanic and Atmospheric Administration). 1991. Contaminant trends in the
Southern California Bight: Inventory and assessment. NOAA Technical Memorandum, NOS
ORCA 62, National Oceanic and Atmospheric Administration, National Ocean Service,
Rockville, MD.
NOAA (National Oceanic and Atmospheric Administration). 1994. Inventory of chemical
concentrations in coastal and estuarine sediments. NOAA Technical Memorandum, NOS ORCA
76, National Oceanic and Atmospheric Administration, National Ocean Service, Silver Springs,
MD.
Norgberg-King, T. and D. Mount. 1986. Validity of effluent and ambient toxicity tests for
predicting biological impact, Skeleton Creek, Enid, Oklahoma. Environmental Research
Laboratory, Office of Research and Development, U.S. EPA. Duluth, MN. EPA/600/8-86/002.
Nordstrom, D.K., L.N. Plummer, T.M.L. Wigley, T.J. Wolery, J.W. Ball, E.A. Jenne, R.I.
Bassett, R.E. McDuff, F. Morel, M.M. Reddy, G. Sposito and J. Thrailkill. 1979. Comparison of
computerized chemical models for equilibrium calculations in aqueous systems. In: E.A. Jenne
(Ed.) Chemical modeling in aqueous systems. ACS, Washington, DC, pp. 857-892.
Novelli, A.A., C. Losso, P.F. Ghetti and A.V. Ghirardini. 2003. Toxicity of heavy metals using
sperm cell and embryo toxicity bioassays with Paracentrotus lividus (Echinodermata:
Echinoidea): Comparisons with exposure concentrations in the Lagoon of Venice, Italy. Environ.
Toxicol. Chem. 22(6): 1295-1301.
Nriagu, J.O. (Ed.) 1979. Copper in the Environment. Part I: Ecological Cycling; Part II: Health
Effects. Wiley and Sons, Inc. New York, NY.

123
Nunes, B., R.C. Capela, T. Sergio, C. Caldeira, F. Goncalves and A.T. Correia. 2014. Effects of
chronic exposure to lead, copper, zinc, and cadmium on biomarkers of the European eel,
Anguilla Anguilla. Environ. Sci. Pollut. Res. 21(8): 5689-5700.
Nusetti, O., R. Salazar-Lugo, J. Rodrigues-Grau and J. Vilas. 1998. Immune and biochemical
responses of the polychaete Eurythoe complanata exposed to sublethal concentrations of copper.
Comp. Biochem. Physiol. 119C(2): 177-183.
O’Brien, P., H. Feldman, E.V. Grill and A.G. Lewis. 1988. Copper tolerance of the life history
stages of the splashpool copepod Tigriopus californicus (Copepod, Harpacticoida). Mar. Ecol.
Prog. Ser. 44: 59-64.
Okazaki, R.K. 1976. Copper toxicity in the Pacific oyster Crassostrea gigas. Bull. Environ.
Contam. Toxicol. 16: 658-665.
Okocha, R.O. and O.B. Adedeji. 2012. Overview of copper toxicity to aquatic life. Rep. Opinion
4(8): 57-67.
Oliva, M., M.D.C. Garrido, E. Perez and M.L.G. De Canales. 2007. Evaluation of acute copper
toxicity during early life stages of gilthead seabream, Sparus aurata. J. Environ. Sci. Health Part
A. 42(4): 525-533.
Oliva, M., M.C. Garrido, D. Sales Marquez and M.L. Gonzalez de Canales. 2009. Sublethal and
lethal toxicity in juvenile Senegal sole (Solea senegalensis) exposed to copper: A preliminary
toxicity range-finding test. Exp. Toxicol. Pathol. 61(2): 113-121.
Oliveira, M., A. Serafim, M.J. Bebianno, M. Pacheco and M.A. Santos. 2008. European eel
(Anguilla anguilla L.) metallothionein, endocrine, metabolic and genotoxic responses to copper
exposure. Ecotoxicol. Environ. Saf. 70(1): 20-26.
Oliveira, B.L., L.F. Loureiro Fernandes, A. Bianchini, A.R. Chippari-Gomes, B.F. Silva, G.P.
Brandao and L.C. Gomes. 2014. Acute copper toxicity in juvenile fat snook Centropomus
parallelus (Teleostei: Centropomidae) in sea water. Neotrop. Ichthyol. 12(4): 845-852.
Olmedo, P., A.F. Hernández, A. Pla, P. Femia, A. Navas-Acien and F. Gil. 2013. Determination
of essential elements (copper, manganese, selenium and zinc) in fish and shellfish samples. Risk
and nutritional assessment and mercury-selenium balance. Food Chem. Toxicol. 62: 299-307.
Olsen, K.H. 2011. Effects of pollutants on olfactory mediated behaviors in fish and crustaceans.
In: T. Breithaupt and M. Thiel (Eds.), Chemical Communication in Crustaceans, Springer, NY:
507-529.
Olson, K.R. and R.C. Harrel. 1973. Effect of salinity on acute toxicity of mercury, copper, and
chromium for Rangia cuneata (Pelecypoda, Mactridae). Contrib. Mar. Sci. 17: 9-13.

124
Ong, M.C., N.A.M. Shazili, D. Menier and A.W.M. Effendy. 2013. Levels of trace elements in
tissue of Ostrea edulis and Crassostrea gigas from Quiberon Bay, Brittany, France. J. Fish.
Aquat. Sci. 8(2): 378.
Oregon State University. 2011. Copper deficiency in beef cattle. Extension Service Coos County,
Myrtle Point, Oregon. Available at: http://extension.oregonstate.edu/coos/ (Accessed Nov. 13,
2013)
Oris, J.T., R.W. Winner and M.V. Moore. 1991. A four-day survival and reproduction toxicity
test for Ceriodaphnia dubia. Environ. Toxicol. Chem. 10(2): 217-224.
Ortiz, J.B., M.L. Gonzalez de Canales and C. Sarasquete. 1999. Quantification and
histopathological alterations produced by sublethal concentrations of copper in Fundulus
heteroclitus. Cienc. Mar. 25(1): 119-143.
Osborn, H.L. and S.E. Hook. 2013. Using transcriptomic profiles in the diatom Phaeodactylum
tricornutum to identify and prioritize stressors. Aquat. Toxicol. 138/139: 12-25.
Otitoloju, A.A. and K.N. Don-Pedro. 2006. Determination of types of interactions exhibited by
binary mixtures of heavy metals tested against the hermit crab, Clibanarius africanus. Toxicol.
Environ. Chem. 88(2): 331-343.
Owen, J.R., C.A. Morris, B. Nicolaus, J.L. Harwood and P. Kille. 2012. Induction of expression
of 14-3-3 gene in response to copper exposure in the marine alga, Fucus vesiculosus. Ecotoxicol.
21: 124-138.
Oya, T., Y. Usui, M. Kimata and K. Isikawa. 1939. Effects of chemical substances dissolved in
water on pisces and mollusca. I. Nippon Suisan Gakkaishi 7(5): 281-287.
Ozoh, P.T.E. 1992a. The effects of salinity, temperature and sediment on the toxicity of copper
to juvenile Hediste (Nereis) diversicolor (O.F. Muller). Environ. Monitor. Assess. 21: 1-10.
Ozoh, P.T.E. 1992b. The importance of adult Hediste (Nereis) diversicolor in managing heavy
metal pollution in shores and estuaries. Environ. Monitor. Assess. 21: 165-171.
Ozsuer, M. and U. Sunlu. 2013. Temporal trends of some trace metals in Lithophaga lithophaga
(L., 1758) from Izmir Bay (eastern Aegean Sea). Bull. Environ. Contam. Toxicol. 91(4): 409-
414.
Paganini, C.L. and A. Bianchini. 2009. Copper accumulation and toxicity in isolated cells from
gills and hepatopancreas of the blue crab (Callinectes sapidus). Environ. Toxicol. Chem. 28(6):
1200-1205.

125
Pagano, G., M. Cipollaro, G. Corsale, A. Esposito, E. Ragucci, G.G. Giordano and N.M. Trieff.
1986. The sea urchin: Bioassay for the assessment of damage from environmental contaminants.
In: J. Cairns, Jr. (Ed.), Community Toxicity Testing, ASTM STP 920, Philadelphia, PA. pp. 66-
92.
Pagano, G., A. de Baise, M. Iaccarino, S. Meric, D. Petruzzelli, O. Tunay, M. Warnau and N.M.
Trieff. 2002. Bauxite manufacturing residues from Gardanne (France) and Portovesme (Italy)
exert different patterns of pollution and toxicity to sea urchin embryos. Environ. Toxicol. Chem.
21(6): 1272-1278.
Pagenkopf, G.K. 1983. Gill surface interaction model for trace-metal toxicity to fishes: Role of
complexation, pH, and water hardness. Environ. Sci. Technol. 17: 342-347.
Palawski, D., J.B. Hunn and F.J. Dwyer. 1985. Sensitivity of young striped bass to organic and
inorganic contaminants in fresh and saline waters. Trans. Am. Fish. Soc. 114(5): 748-753.
Pan, L., N. Liu, H. Zhang, J. Wang and J. Miao. 2011. Effects of heavy metal ions (Cu2+, Pb2+
and Cd2+) on DNA damage of the gills, hemocytes and hepatopancreas of marine crab,
Charybdis japonica. J. Ocean Univ. China 10(2): 177-184.
Paquin, P.R., J.W. Gorsuch, S. Apte, G.E. Batley, K.C. Bowles, P.G.C. Campbell, C.G. Delos,
D.M. DiToro, R.L. Dwyer, F. Galvez, R.W. Gensemer, G.G. Goss, C. Hogstrand, C.R. Janssen,
J.C. McGeer, R.B. Naddy, R.C. Playle, R.C. Santore, U. Schneider, W.A. Stubblefield, C.M.
Wood and K.B. Wu. 2002. The biotic ligand model: A historical overview. Comp. Biochem.
Physiol. Part C. 133: 3-35.
Park, J., S. Kim, J. Yoo, J.S. Lee, J.W. Park, and J. Jung. 2014. Effect of salinity on acute copper
and zinc toxicity to Tigriopus japonicus: The difference between metal ions and nanoparticles.
Mar. Pollut. Bull. 85(2): 526-531.
Patterson, J.W., R.A. Minear, E. Gasca and C. Petropoulou. 1998. Industrial discharges of metals
to water. In: H.E. Allen, A.W. Garrison and G.W. Luther III (Eds.). Metals in Surface Waters.
Ann Arbor Press, Chelsea, MI. pp. 37-66.
Paul, J.D. and I.M. Davies. 1986. Effects of copper and tin-based anti-fouling compounds on the
growth of scallops (Pecten maximus) and oysters (Crassostrea gigas). Aquacult. 54(3): 191-203.
Peppard, E.M., W.R. Wolters and J.W. Avault Jr. 1991. Toxicity of chelated copper to juvenile
red drum Scianeops ocellatus. J. World Aquacult. Soc. 22(2): 101-108.
Pereira, C.D.S., D.M.D.S. Abessa, A.C.D. Bainy, L.P. Zaroni, M.R. Gasparro, M.C. Bicego, S.
Taniguchi, T.H. Furley, E.C.P.M. De Sousa. 2007. Integrated assessment of multilevel
biomarker responses and chemical analysis in mussels from Sao Sebastiao, Sao Paulo, Brazil.
Environ. Toxicol. Chem. 26(3): 462-469.

126
Perez, S. and R. Beiras. 2010. The mysid Siriella armata as a model organism in marine
ecotoxicology: Comparative acute toxicity sensitivity with Daphnia magna. Ecotoxicol. 19(1):
196-206.
Perumal, P. and P. Subramanian. 1985. Effects of salinity and copper on larval development in
pistol prawn, Alpheus malabaricus malabaricus Fabricius. Indian J. Mar. Sci. 14(1): 35-37.
Pesch, C.E. 1979. Influence of three sediment types on copper toxicity to the polychaete
Neanthes arenaceodentata. Mar. Biol. (Berlin). 52(3): 237-245.
Pesch, C.E. and G.L. Hoffman. 1982. Adaptation of the polychaete Neanthes arenaceodentata to
copper. Mar. Environ. Res. 6(4): 307-317.
Pesch, C.E. and D. Morgan. 1978. Influence of sediment in copper toxicity tests with the
polychaete Neanthes arenaceodentata. Water Res. 12: 747-751.
Pesch, C.E., P.S. Schauer and M.A. Balboni. 1986. Effect of diet on copper toxicity to Neanthes
arenaceodentata (Annelida: Polychaeta). ASTM Spec. Tech. Publ. 9: 369-383.
Pesch, G., N. Stewart and C. Pesch. 1979. Copper toxicity to the bay scallop (Argopecten
irradians). Bull. Environ. Contam. Toxicol. 23: 759-765.
Petersen, R. 1982. Influence of copper and zinc on the growth of a freshwater alga, Scenedesmus
quadricauda: The significance of chemical speciation. Environ. Sci. Technol. 16(8): 443-447.
Pillai, S. and N.R. Menon. 1998. Structural alterations accompanying acute and chronic toxicity
of heavy metal exposure in hepatopancreas of green mussel Perna viridis (class-Pelycypoda).
Indian J. Mar. Sci. 27(3/4): 416-420.
Pilson, M.E.Q. 1998. An Introduction to the Chemistry of the Sea. Prentice Hall Publ. Co. 431
pp.
Pinheiro, M.A.A., P.P.G. Silva, L.F.A. Duarte, A.A. Almeida and F.P. Zanotto. 2012.
Accumulation of six metals in the mangrove crab Ucides cordatus (Crustacea: Ucididae) and its
food source, the red mangrove Rhizophora mangle (Angiosperma: Rhizophoraceae). Ecotoxicol.
Environ. Saf. 81: 114-121.
Pinho, G.L. and A. Bianchini. 2010. Acute copper toxicity in the euryhaline copepod Acartia
tonsa: Implications for the development of an estuarine and marine biotic ligand model. Environ.
Toxicol. Chem. 29(8): 1834-1840.
Pinho, G.L.L., M.S. Pedroso, S.C. Rodrigues, S.S. De Souza and A. Bianchini. 2007.
Physiological effects of copper in the euryhaline copepod Acartia tonsa: Waterborne versus
waterborne plus dietborne exposure. Aquat. Toxicol. 84(1): 62-70.

127
Pinsino, A., G. Turturici, G. Sconzo and F. Geraci. 2011. Rapid changes in heat-shock cognate
70 levels, heat-shock cognate phosphorylation state, heat-shock transcription factor, and metal
transcription factor activity levels in response to heavy metal exposure during sea urchin
embryonic development. Ecotoxicol. 20(1): 246-254.
Piola, R.F. and E.L. Johnston. 2006. Differential resistance to extended copper exposure in four
introduced bryzoans. Mar. Ecol. Prog. Ser. 311: 103-114.
Piola, R.F. and E.L. Johnston. 2009. Comparing differential tolerance of native and non-
indigenous marine species to metal pollution using novel assay techniques. Environ. Pollut. 157:
2853-2864.
Playle, R.C., D.G. Dixon and K. Burnison. 1993a. Copper and cadmium binding to fish gills:
Modification by dissolved organic carbon and synthetic ligands. Canadian J. Fish. Aquat. Sci.
50(12): 2667-2677.
Playle, R.C., D.G. Dixon and K. Burnison. 1993b. Copper and cadmium binding to fish gills:
Estimates of metal-gill stability constants and modelling of metal accumulation. Canadian J.
Fish. Aquat. Sci. 50(12): 2678-2687.
Pook, C., C. Lewis and T. Galloway. 2009. The metabolic and fitness costs associated with metal
resistance in Nereis diversicolor. Mar. Pollut. Bull. 58(7): 1063-1071.
Powell, M.L., W.T. Jones, V.K. Gibbs, H.S. Hammer, J.M. Lawrence, J. Fox, A.L. Lawrence
and S.A. Watts. 2010. Dietary copper affects survival, growth, and reproduction in the sea urchin
Lytechinus variegatus. J. Shell. Res. 29: 1043-1049.
Prato, E. and F. Biandolino. 2005. Gammarus aequicauda (Crustacea: Amphipoda): A potential
test species in marine sediment toxicity assessment. Aquat. Ecosyst. Health Manag. 8(4): 475-
482.
Prato, E., F. Biandolino, A.P. Bisci and C. Caroppo. 2011. Preliminary assessment of Ostreopsis
cfr. ovata acute toxicity by using a battery bioassay. Chem. Ecol. 27(S2): 117-125.
Prato, E., I. Parlapiano, G. Portacci and F. Biandolino. 2012. Contaminant sensitivity of Balanus
perforatus and B. eburneus compared to Balanus amphitrite (Amphibalanus amphitrite). Protect.
Restor. Environ. North America. Available online at:
http://www.pre11.org/ocs/index.php/pre/pre11/paper/view/233.
Prato, E., I. Parlapiano and F. Biandolino. 2013a. Assessment of individual and combined
toxicities of three heavy metals (Cu, Cd and Hg) by using Tigriopus fulvus. Chem. Ecol. 29(7):
635-642.
Prato, E., I. Parlapiano and F. Biandolino. 2013b. Sublethal effects of copper on some biological
traits on the amphipod Gammarus aequicauda reared under laboratory conditions. Chemosphere

128
PRC Environmental Management, Inc. 1997. Report of copper loading to San Diego Bay,
California. Prepared for California Regional Water Quality Control Board, San Diego Region
and the San Diego Bay Interagency Water Quality Panel.
Prytherch, H.F. 1931. The role of copper in the setting and metamorphosis of the oyster. Sci. 73:
429-431.
Pytharopoulou, S., K. Grintzalis, E. Sazakli, M. Leotsinidis, C.D. Georgiou and D.L. Kalpaxis.
2011. Translational responses and oxidative stress of mussels experimentally exposed to Hg, Cu
and Cd: One Pattern does not fit at all. Aquat. Toxicol. 105(1/2): 157-165.
Pytharopoulou, S., G.G. Kournoutou, M. Leotsinidis, C.D. Georgiou and D.L. Kalpaxis. 2013.
Cadmium versus copper toxicity: Insights from an integrated dissection of protein synthesis
pathway in the digestive glands of mussel Mytilus galloprovincialis. J. Hazard. Mat. 260: 263-
271.
Qiu, J.W., V. Thiyagarajan, S. Cheung and P.Y. Qian. 2005. Toxic effects of copper on larval
development of the barnacle Balanus amphitrite. Mar. Pollut. Bull. 51(8-12): 688-693.
Radenac, G., D. Fichet and P. Miramand. 2001. Bioaccumulation and toxicity of four dissolved
metals in Paracentrotus lividus sea-urchin embryo. Mar. Environ. Res. 51: 151-166.
Rainbow, P.S. 2002. Trace metal concentrations in aquatic invertebrates: Why and so what?
Environ. Pollut. 120(3): 497-507.
Rainbow, P.S. and B.D. Smith. 2013. Accumulation and detoxification of copper and zinc by the
decapod crustacean Palaemonetes varians from diets of field-contaminated polychaetes Nereis
diversicolor. J. Exper. Mar. Biol. Ecol. 449: 312-330.
Rajkumar, J.S.I. 2012. Marine organisms in toxicological approach for the assessment of
environmental risk associated with Cd, Cu, Pb and Zn. Univ. J. Environ. Res. Technol. 2(2): 19-
25.
Rajkumar, J.S.I. and M.C.J. Milton. 2011a. Biochemical markers of oxidative stress in Mugil
cephalus exposed to cadmium, copper, lead and zinc. Int. J. Pharm. Bio. Sci. 2(3): B41- B50.
Rajkumar, J.S.I. and M.C.J. Milton. 2011b. Biochemical changes induced by cadmium, copper,
lead and zinc exposure to Perna viridis under longterm toxicity test. Int. J. Pharm. Bio. Sci. 2(3):
B.50-B.59.
Rajkumar, J.S.I., M.C. John Milton and T. Ambrose. 2011. Acute toxicity of water borne Cd, Cu,
Pb, and Zn to Mugil cephalus fingerlings. Int. J. Chem. Sci. 9(2): 477-480.
Ramadan, S.E., A.N. Khalil, N.M. Dowidar and S.F. Elsonbaty. 1997. Toxicity and
bioaccumulation of Cu2+ and Zn2+ in two isopod species (Crustacea). Bull. Natl. Inst. Ocean.
Fish. 23: 135-154.

129
Ramakritinan, C.M., R. Chandurvelan and A.K. Kumaraguru. 2012. Acute toxicity of metals:
Cu, Pb, Cd, Hg and Zn on marine molluscs, Cerithedia cingulate G., and Modiolus
philippinarum H. Indian J. Geo-Mar. Sci. 41(2): 141-145.
Rao, A.J. and V.R. Nair. 2008. Effects of salinity on the toxicity of copper and zinc to the fish
Therapon jarbua (Forsskal). Nat. Environ. Pollut. Technol. 7(2): 303-306.
Rau, M.A., J. Whitaker, J.H. Freedman and R.T. Di Giulio. 2004. Differential susceptibility of
fish and rat liver cells to oxidative stress and cytotoxicity upon exposure to pro-oxidants. Comp.
Biochem. Physiol. Part C 137: 335-342.
Rayburn, J.R. and W.S. Fisher. 1999. Developmental toxicity of copper chloride, methylene
chloride, and 6-aminoniotinamide to embryos of the grass shrimp Palaemonetes pugio. Environ.
Toxicol. Chem. 18(2): 950-957.
Raymond, P.A. and J.E. Bauer. 2001. Coupled 14C and 13C natural abundances as a tool for
evaluating freshwater, estuarine and coastal organic matter sources and cycling. Organic
Geochem. 32: 469-485.
Raymont, J.E.G. and J. Shields. 1963. Toxicity of copper and chromium in the marine
environment. Int. J. Air Wat. Pollut. 7: 435-443.
Reardon, I.S. and R.M. Harrell. 1990. Acute toxicity of formalin and copper sulfate to striped
bass fingerlings held in varying salinities. Aquacult. 87: 255-270.
Reddy, P.S. 1997. Modulations in antioxidant enzymes in the gill and hepatopancreas of the
edible crab Scylla serrata during exposure to cadmium and copper. Fresenius Environ. Bull.
6(9/10): 589-597.
Reed, R.H. and L. Moffat. 1983. Copper toxicity and copper tolerance in Enteromorpha
compressa (L.) Grev. J. Exp. Mar. Biol. Ecol. 69(1): 85-103.
Reeve, M.R., G.D. Grice, V.R. Gibson, M.A. Walter, K. Darcy and T. Ikeda. 1976. A controlled
environmental pollution experiment (CEPEX) and its usefulness in the study of larger marine
zooplankton under toxic stress. In: Effects of pollutants on aquatic organisms. Lockwood, P.M.
(Ed.). Cambridge University Press, New York, NY. p. 145.
Regoli, F., M. Nigro, E. Bertoli, G. Principato and E. Orlando. 1997. Defenses against oxidative
stress in the Antarctic scallop Adamussium colbecki and effects of acute exposure to metals.
Hydrobiologia 355(1-3): 139-144.
Regoli, F., M. Nigro and E. Orlando. 1998. Lysosomal and antioxidant responses to metals in the
Antarctic scallop Adamussium colbecki. Aquat. Toxicol. 40(4): 375-392.

130
Reichelt-Brushett, A.J. and P.L. Harrison. 1999. The effect of copper, zinc and cadmium on
fertilization success of gametes from Scleractinian reef corals. Mar. Pollut. Bull. 38(3): 182-187.
Reichelt-Brushett, A.J. and P.L. Harrison. 2004. Development of a sublethal test to determine the
effects of copper and lead on Scleractinian coral larvae. Arch. Environ. Contam. Toxicol. 47(1):
40-55.
Reichelt-Brushett, A.J. and P.L. Harrison. 2005. The effect of selected trace metals on the
fertilization success of several Scleractinian coral species. Coral Reefs. 24(4): 524-534.
Reichelt-Brushett, A.J. and K. Michalek-Wagner. 2005. Effects of copper on the fertilization
success of the soft coral Lobophytum compactum. Aquat. Toxicol. 74(3): 280-284.
Reish, D.J. 1978. The effects of heavy metals on polychaetous annelids. Revue. Int. Oceangr.
Med. 49: 99-104.
Reish, D.J. 1993. Effects of metals and organic compounds on survival and bioaccumulation in
two species of marine gammaridean amphipod, together with a summary of toxicological
research on this group. J. Nat. Hist. 27: 781-794.
Reish, D.J. and R.S. Carr. 1978. The effect of heavy metals on the survival, reproduction,
development, and life cycles for two species of polychaetous annelids. Mar. Pollut. Bull. 9(1):
24-27.
Reish, D.J. and J.A. Le May. 1991. Toxicity and bioconcentration of metals and organic
compounds by polychaeta. Intern. J. Mar. Biol. 5: 653-660.
Reish, D.J., J.M. Martin, F.M. Piltz and J.Q. Word. 1976. The effect of heavy metals on
laboratory populations of two polychaetes with comparisons to the water quality conditions and
standards in southern California marine waters. Water Res. 10: 299-302.
Rhee, J.S., S. Raisuddin, D.S. Hwang, K.W. Lee, I.C. Kim and J.S. Lee. 2009a. Differential
expression of metallothionein (MT) gene by trace metals and endocrine-disrupting chemicals in
the hermaphroditic mangrove killifish, Kryptolebias marmoratus. Ecotoxicol. Environ. Saf.
72(1): 206-212.
Rhee, J.S., S. Raisuddin, K.W. Lee, J.S. Seo, J.S. Ki, I.C. Kim, H.G. Park and J.S. Lee. 2009b.
Heat shock protein (Hsp) gene responses of the intertidal copepod Tigriopus japonicus to
environmental toxicants. Comp. Biochem. Physiol. Part C 149(1): 104-112.
Rhee, J.S., I.T. Yu, B.M. Kim, C.B. Jeong, K.W. Lee, M.J. Kim, S.J. Lee, G.S. Park and J.S.
Lee. 2013. Copper induces apoptotic cell death through reactive oxygen species-triggered
oxidative stress in the intertidal copepod Tigriopus japonicas. Aquat. Toxicol. 132-133: 182-189.
Rice, D.W. Jr. and F.L. Harrison. 1978. Copper sensitivity of Pacific herring, Clupea harengus
pallasi, during its early life history. Fish. Bull. 76: 347-356.

131
Rice, D.W., Jr., F.L. Harrison and A. Jerald Jr. 1980. Effects of copper on early life history
stages of northern anchovy, Engraulis mordax. Fish. Bull. 78(3): 675-683.
Ringwood, A.H. 1992. Comparative sensitivity of gametes and early developmental stages of a
sea urchin species (Echinometra mathaei) and a bivalve species (Isognomon californicum)
during metal exposures. Arch. Environ. Contam. Toxicol. 22: 288-295.
Ringwood, A.H., D.E. Conners and A. DiNovo. 1998. The effects of copper exposures on
cellular responses in oysters. Mar. Environ. Res. 46(1-5): 591-595.
Rinna, F., F. Del Prete, V. Vitiello, G. Sansone and A.L. Langellotti. 2011. Toxicity assessment
of copper, pentachlorophenol and phenanthrene by lethal and sublethal endpoints on nauplii of
Tigriopus fulvus. Chem. Ecol. 27(S2): 77-85.
Rivera-Duarte, I., G. Rosen, D. Lapota, D.B. Chadwick, L. Kear-Padilla and A. Zirino. 2005.
Copper toxicity to larval stages of three marine invertebrates and copper complexation capacity
in San Diego Bay, California. Environ. Sci. Technol. 39(6): 1542-1546.
Roberts, D.A., A.G.B. Poore and E.L. Johnston. 2006. Ecological consequences of copper
contamination in macroalgae: Effects on epifauna and associated herbivores. Environ. Toxicol.
Chem. 25(9): 2470-2479.
Robins, R.G., R.B. Berg, K.D. Dysinger, T.E. Duaime, J.J. Metesh, F.E. Diebold, L.G.
Twidwell, G.G. Mitman, W.H. Chatham, H.H. Huang and C.A. Young. 1997. Chemical,
physical and biological interactions at the Berkeley Pit, Butte, Montana. Tailings and Mine
Waste 97. Bakeman, Rotterdam.
Robinson, C.B., P.S. Wills, M.A. Riche and D.L. Straus. 2013. Tissue-specific copper
concentrations in red drum after long-term exposure to sublethal levels of waterborne copper and
a 21-day withdrawal. North Amer. J. Aquacult. 75: 1-6.
Rodriguez-Ortega, M.J., A. Rodriguez-Ariza, O. Amezcua and J. Lopez-Barea. 2003. Mutagenic
activation of arylamines by subcellular fractions of Chamaelea gallina clams exposed to
environmental pollutants. Environ. Mol. Mutagen. 41(1): 55-63.
Roesijadi, G. 1980. Influence of copper on the clam Protothaca staminea: Effects on gills and
occurrence of copper binding proteins. Biol. Bull. 158: 233.
Romeo, M., S. Gharbi-Bouraoui, M. Gnassia-Barelli, M. Dellali and P. Aissa. 2006. Responses
of Hexaplex (Murex) trunculus to selected pollutants. Sci. Total Environ. 359(1-3): 135-144.
Rose, A., A.M. Carruthers, J. Stauber, R. Lim and S. Blockwell. 2006. Development of an acute
toxicity test with the marine copepod Acartia sinjiensis. Australs. J. Ecotoxicol. 12(2): 73-81.

132
Rosen, G., I. Rivera-Duarte, L. Kear-Padilla and D.B. Chadwick. 2005. Use of laboratory
toxicity tests with bivalve and echinoderm embryos to evaluate the bioavailability of copper in
San Diego Bay, California, USA. Environ. Toxicol. Chem. 24(2): 415-422.
Rosen, G., I. Rivera-Duarte, D.B. Chadwick, A. Ryan, R.C. Santore and P.R. Paquin. 2008a.
Critical tissue copper residues for marine bivalve (Mytilus galloprovincialis) and echinoderm
(Strongylocentrotus purpuratus) embryonic development: Conceptual, regulatory and
environmental implications. Mar. Environ. Res. 66(3): 327-336.
Rosen, G., A. Osorio-Robayo, I. Rivera-Duarte and D. Lapota. 2008b. Comparison of
bioluminescent dinoflagellate (QwikLite) and bacterial (Microtox) rapid bioassay for the
detection of metal and ammonia toxicity. Arch. Environ. Contam. Toxicol. 54: 606-611.
Rosko, J.J. and J.W. Rachlin. 1975. The effect of copper, zinc, cobalt and manganese on the
growth of the marine diatom Nitzschia closterium. Bull. Torrey Bot. Club 102: 100-106.
Rueter, J.G., Jr. 1983. Effect of copper on growth, silicic acid uptake and soluble pools of silicic
acid in the marine diatom, Thalassiosira weissflougii (Bacillariophyceae). J. Phycol. 19: 101-
104.
Ruiz-Azcona, P., O. Moreno, I. Palanco, I. Giraldez, A. Velasco and E. Morales. 2013. Temporal
fluctuation of metals in seawater of the Piedras River estuary and the effects of copper on
Venerupis decussata larvae. J. Shellfish Res. 32(2): 291-296.
Sabatini, S.E., G. Chaufan, A.B. Juarez, I. Coalova, L. Bianchi, M.R. Eppis and M. del Carmen
Rios de Molina. 2009. Dietary copper effects in the estuarine crab, Neohelice (Chasmagnathus)
granulata, maintained at two different salinities. Comp. Biochem. Physiol. Part C 150: 521-527.
Sabdono, A. 2009. Heavy metal levels and their potential toxic effect on coral Galaxea
fascicularis from Java Sea, Indonesia. Res. J. Environ. Sci. 3(1): 96-102.
Saifullah, S.M. 1978. Inhibitory effects of copper on marine dinoflagellates. Mar. Biol. 44: 299-
308.
Sakellari, A., S. Karavoltsos, D. Theodorou, M. Dassenakis and M. Scoullos. 2013.
Bioaccumulation of metals (Cd, Cu, Zn) by the marine bivalves M. galloprovincialis, P. radiata,
V. verrucosa and C. chione in Mediterranean coastal microenvironments: Association with metal
bioavailability. Environ. Monit. Assess. 185(4): 3383-3395.
Salazar, M.H. and S.M. Salazar. 1986. Acute effects of (bis)tributyltin oxide on marine
organisms. Naval Ocean Systems Center San Diego, CA. 88 pp.
Salazar, M.H. and S.M. Salazar. 1989. Acute effects of (bis)tributyltin oxide on marine
organisms. Summary of Work Performed - 1981 to 1983. Tech Report. No. 1299, Naval Ocean
Systems Center. 88 pp.

133
Saliba, L.J. and R.M. Krzyz. 1976. Acclimation and tolerance of Artemia salina to copper salts.
Mar. Biol. (Berlin) 38(3): 231-238.
Sanchez-Marin, P., J.I. Lorenzo, V.K. Mubiana, R. Blust and R. Beiras. 2012. Copper uptake by
the marine mussel Mytilus edulis in the presence of fulvic acids. Environ. Toxicol. Chem. 31(8):
1807-1813.
Sanders, B.M. and L.S. Martin. 1994. Copper inhibits the induction of stress protein synthesis by
elevated temperatures in embryos of the sea urchin Strongylocentrus purpuratus. Comp.
Biochem. Physiol. C. 109(3): 295-307.
Sanders, B.M., K.D. Jenkins, W.G. Sunda and J.D. Costlow. 1984. Free cupric ion activity in
seawater: Effects on metallothionein and growth in crab larvae. Sci. 222: 53-55.
Santore, R.C. and C.T. Driscoll. 1995. The chess model for calculating chemical equilibria in
soils and solutions. Chapter 17. In: Chemical Equilibrium and Reaction Models. SSSA Special
Publication 42. Proceedings of an International Symposium Sponsored by Divisions S-1, S-2,
and S-4 of the Soil Science Society of America, and Division a-5 of the American Society of
Agronomy in San Antonio, Texas, 23 and 24 October 1990. R.H. Loeppert, A.P. Schwab and S.
Goldberg (Eds.), 357-375, Soil Science Society of America, Madison, WI.
Santore, R.C., D.M. Di Toro and P.R. Paquin, H.E. Allen and J.S. Meyer. 2001. A biotic ligand
model of the acute toxicity of metals. II. Application to acute copper toxicity in freshwater fish
and Daphnia. Environ. Toxicol. Chem. 20(10): 2397-2402.
Sappington, L.C., F.L. Mayer, F.J. Dwyer, D.R. Buckler, J.R. Jones and M.R. Ellersieck. 2001.
Contaminant sensitivity of threatened and endangered fishes compared to standard surrogate
species. Environ. Toxicol. Chem. 20(12): 2869-2876.
Sastre, M.P., E. Collado, G. Collazo, S. Lebron, L. Mena, S. Morales, R. Muller, L. Perez, P.
Rivera and Y. Velez. 2005. DNA damage in the Caribbean mussel Brachiodontes exustus: A
comet assay evaluation. Bull. Mar. Sci. 77(1): 73-81.
Sathyanathan, B., S.M. Nair, J. Chacko and P.N.K. Nambisan. 1988. Sublethal effects of copper
and mercury on some biochemical constituents of the estuarine clam Villorita cyprinoides var.
cochinensis (Hanley). Bull. Environ. Contam. Toxicol. 40(4): 510-516.
Sato, M. and I. Bremner. 1993. Oxygen free radicals and metallothionein. Free Radic. Biol. Med.
14: 325-337.
Saunders, C.E. 2012. Effects of dissolved organic matter and salinity on the toxicity of individual
and metal mixtures of copper with zinc and silver to the saltwater rotifers, Brachionus plicatilis.
M.S. Thesis, Stephen F. Austin State Univ.

134
Sauter, S., K.S. Buxton, K.J. Macek and S.R. Petrocelli. 1976. Effects of exposure to heavy
metals on selected freshwater fish. Toxicity of copper, cadmium, chromium and lead to eggs and
fry of seven fish species. EPA-600/3-76-105. National Technical Information Service,
Springfield, VA.
Sayin, D., D.T. Cakir, N. Gencer and O. Arslan. 2012. Effects of some metals on paraoxonase
activity from shark Scyliorhinus canicula. J. Enzyme Inhib. Med. Chem. 27(4): 595-598.
Schwarz, J.A., C.L. Mitchelmore, R. Jones, A. O’Dea and S. Seymour. 2013. Exposure to copper
induces oxidative and stress responses and DNA damage in the coral Montastraea franksi.
Comp. Biochem. Physiol. Part C 157: 272-279.
Science Applications International Corporation. 1993. Toxicity testing to support the New
York/New Jersey Harbor site-specific copper criteria study. Final Rep. to EPA, Off. Wastewater
Enforcement and Compliance (Contract No.68-C8-0066, Work Assignment C-4-94), Sci. Appl.
Int. Corp., Narragansett, RI. 176 pp.
Scott, D.M. and C.W. Major. 1972. The effect of copper (II) on survival, respiration, and heart
rate in the common blue mussel, Mytilus edulis. Biol. Bull. 143: 679-688.
Scott, K.J., P.P. Yevich and W.S. Boothman. Manuscript. Toxicological methods using the
benthic amphipod Ampelisca abdita Mills. U.S. EPA, Narragansett, RI.
Scott-Fordsmand, J.J. and M.H. Depledge. 1997. Changes in the tissue concentrations and
contents of calcium, copper and zinc in the shore crab Carcinus maenas (L.) (Crustacea:
Decapoda) during the moult cycle and following copper exposure during ecdysis. Mar. Environ.
Res. 44(4): 397-414.
Seim, W.K., L.R. Curtis, S.W. Glenn and G.A. Chapman. 1984. Growth and survival of
developing steelhead trout (Salmo gairdneri) continuously or intermittently exposed to copper.
Can. J. Fish. Aquat. Sci. 41(3): 433-438.
Selvakumar, S., S. Ajmalkhan and R. Natarajan. 1987. Copper toxicity on the ontogeny of the
grapsid crab Neoepisesarma (Neoepisesarma) mederi (H. Milne Edwards). In: N.B. Nair (Ed.),
Proc. Natl. Semin. Estuarine Management, June 4-5, 1987, Trivandrum, Indi. pp. 468-471.
Serafim, A. and M.J. Bebianno. 2009. Metallothionein role in the kinetic model of copper
accumulation and elimination in the clam Ruditapes decussatus. Environ. Res. 109(4): 390-399.
Sharma, S.R.K. and S. Thomas. 2007. Hemolymph acid phosphatase activity in the green muscle
(Perna viridis Linnaeus, 1758) exposed to copper and mercury. J. Mar. Biol. Assoc. India 49(2):
226-229 .
Sharma, S.R.K., P.K. Asokan and A.K. Sahoo. 2006. Effect of sub-lethal level of copper and
mercury on digestive gland cells and lysosomal enzyme activity in the green mussel (Perna
viridis L.). J. Mar. Biol. Assoc. India 48(2): 245-248.

135
Shi, D. and W.X. Wang. 2004. Modification of trace metal accumulation in the green mussel
Perna viridis by exposure to Ag, Cu, and Zn. Environ. Pollut. 132(2): 265-277.
Shukla, G.S., T. Hussain and S.V. Chandra. 1987. Possible role of regional superoxide dismutase
activity and lipid peroxide levels in cadmium neurotoxicity: In vivo and in vitro studies in
growing rats. Life Sci. 41: 2215-2221.
Shuster, C.N., Jr. and B.H. Pringle. 1968. Effects of trace metals on estuarine molluscs. In:
Proceedings of the first Mid-Atlantic Industrial Waste Conference, November 13-15, 1967.
Department of Civil Engineering, University of Delaware, Newark, DE. pp. 285-304.
Siddiqui, S., R.H. Goddard and G.K. Bielmyer-Fraser. 2015. Comparative effects of dissolved
copper and copper oxide nanoparticle exposure to the sea anemone, Exaiptasia pallida. Aquat.
Toxicol. 160: 205-213.
Sigleo, A.C. 1996. Biochemical components in suspended particles and colloids: Carbohydrates
in the Potomac and Patuxent Estuaries. Organic Geochem. 24: 83-93.
Silva-Aciares, F., D. Moraga and C. Riquelme. 2013. Effect of copper on the immunomodulatory
activities of haemocytes in juveniles of the abalone Haliotis rufescens cultivated under hatchery
conditions. Aquacult. 410-411: 72-78.
Simonetti, P., S.E. Botte, S.M. Fiori and J.E. Marcovecchio. 2012. Heavy-metal concentrations
in soft tissues of the burrowing crab Neohelice granulata in Bahia Blanca Estuary, Argentina.
Arch. Environ. Contam. Toxicol. 62(2): 243-253.
Simpson, S.L., H. Yverneau, A. Cremazy, C.V. Jarolimek, H.L. Price and D.F. Jolley. 2012.
DGT-induced copper flux predicts bioaccumulation and toxicity to bivalves in sediments with
varying properties. Environ. Sci. Technol. 46: 9038-9046.
Singhasemanon, N. 2008. Assessment of antifouling paint use indicators in California marinas.
CA Department of Pesticide Regulation. Presented at: CAHMPC Annual Conference, Ventura,
CA.
Singhasemanon, N., E. Pyatt and J. Bacey. 2009. Monitoring for indicators of antifouling paint
pollution in California marinas. EH08-05. California Environmental Protection Agency,
Environmental Monitoring Branch, California Department of Pesticide Regulation, Sacramento,
CA.
Sivadasan, C.R., P.N.K. Nambisan and R. Damodaran. 1986. Toxicity of mercury, copper, and
zinc to the prawn Metapenaeus dobsoni (Mier). Curr. Sci. 55(7): 337-340.
Skrabal, S.A., J.R. Donat and D.J. Burdige. 2000. Pore water distributions of dissolved copper
and copper-complexing ligands in estuarine and coastal marine sediments. Geochim. Cosmoch.
Acta 64(11): 1843-1857.

136
Sobral, P. and J. Widdows. 1997. Effects of copper exposure on the scope for growth of the clam
Ruditapes decussatus from Southern Portugal. Mar. Pollut. Bull. 34(12): 992-1000.
Soegianto, A., B. Irawan and N. Usman. 2013. Effects of sublethal copper concentrations on gills
of white shrimp (Litopenaeus vannamei, Boone 1931). Bull. Environ. Contam. Toxicol. 91: 630-
634.
Song, Y.F., Z. Luo, C. Huang, X. Liu, Y.X. Pan and Q.L. Chen. 2013. Effects of calcium and
copper exposure on lipogenic metabolism, metal element compositions and histology in
Synechogobius hasta. Fish Physiol. Biochem. 39: 1641-1656.
Song, Y.F., Z. Luo, Y.X. Pan, X. Liu, C. Huang and Q.L. Chen. 2014. Effects of copper and
cadmium on lipogenic metabolism and metal element composition in the javelin goby
(Synechogobius hasta) after single and combined exposure. Arch. Environ. Contam. Toxicol.
67(2): 167-180.
Sordet, C., L. Contreras-Porcia, C. Lovazzano, S. Goulitquer, S. Andrade, P. Potin and J.A.
Correa. 2014. Physiological plasticity of Dictyota kunthii (Phaeophyceae) to copper excess.
Aquat. Toxicol. 150: 220-228.
Sosnowski, S.L. and J.H. Gentile. 1978. Toxicological comparison of natural and cultured
populations of Aractia tonsa to cadmium, copper, and mercury. J. Fish. Res. Board Can. 35(10):
1366-1369.
Sosnowski, S.L., D.J. Germond and J.H. Gentile. 1979. The effect of nutrition on the response of
field populations of the calanoid copepod Acartia tonsa to copper. Water Res. 13: 449-452.
Soto, M., X. Lekube and I. Marigomez. 1999. Autometallographical localisation of Cu and Zn
within target cell compartments of winkles following exposure to Cu & Zn mixtures. Eur. J.
Histochem. 43(4): 323-334.
Sousa, A., L. Genio, S. Mendo and C. Barrosoi. 2005. Comparison of the acute toxicity of
tributyltin and copper to veliger larvae of Nassarius reticulatus (L.). Appl. Organomet. Chem.
19: 324-328.
S.R. Hansen and Associates. 1992. Final Report: Development of a site-specific criterion for
copper for San Francisco Bay. Prepared for California Regional Water Quality Control Board,
Oakland, CA. 124 pp.
SRC (Syracuse Research Corporation). 1990. Toxicological profile for copper. Prepared for the
Agency for Toxic Substances and Disease Registry, U.S. Public Health Service. December 1990.
Available at: http://www.atsdr.cdc.gov/toxprofiles/tp132-p.pdf.
Stagg, R. M. and T.J. Shuttleworth. 1982. The effects of copper on ionic regulation by the gills
of the seawater-adapted flounder (Platichthys flesus L.). J. Comp. Physiol. 149: 83-90.

137
Stebbing, A.R.D. 1976. The effects of low metal levels on a colonial hydroid. J. Mar. Biol.
Assoc. U.K. 56: 977.
Stebbing, A.R.D. 1981. Hormesis - stimulation of colony growth in Campanularia flexuosa
(Hydrozoa) by copper, cadmium and other toxicants. Aquat. Toxicol. 1(3/4): 227-238.
Steele, C.W. 1983. Comparison of the behavioural and acute toxicity of copper to sheepshead,
Atlantic croaker and pinfish. Mar. Pollut. Bull. 14(11): 423-428.
Steele, R.L. and G.B. Thursby. 1983. A toxicity test using life stages of Champia parvula
(Rhodophyta). In: Aquatic toxicology and hazard assessment. Bishop, W.E. et al. (Eds.). ASTM
STP 802. American Society for Testing and Materials. Philadelphia, PA. p. 73.
Steinert, S.A. and G.V. Pickwell. 1985. Multiple forms of lysozyme in copper stressed mussels
(Mytilus edulis). Mar. Environ. Res. 17(2-4): 211-214.
Stephan, C.E., D.I. Mount, D.J. Hansen, J.H. Gentile, G.A. Chapman and W.A. Brungs. 1985.
Guidelines for deriving numerical national water quality criteria for the protection of aquatic
organisms and their uses. National Technical Information Service No. PB85-227049.
Stofberg, R.L., C.A. Simon and R.G. Snyman. 2011. Effects of heavy metals on the development
and survival of abalone Haliotis midae larvae. African J. Mar. Sci. 33(2): 339-345.
Stohs, S.J. and D. Bagchi. 1995. Oxidative mechanisms in the toxicity of metal ions. Free Radic.
Biol. Med. 18: 321-336.
Strom, D., S.L. Simpson, G.E. Batley and D.F. Jolley. 2011. The influence of sediment particle
size and organic carbon on toxicity of copper to benthic invertebrates in oxic/suboxic surface
sediments. Environ. Toxicol. Chem. 30(7): 1599-1610.
Stromgren, T. 1979. The effect of copper on length increase in Ascophyllum nodosum (L.) Le
Jolis. J. Exp. Mar. Biol. Ecol. 37: 153-159.
Stuart, R.K., C.L. Dupont, D.A. Johnson, I.T. Paulsen and B. Palenik. 2009. Coastal strains of
marine Synechococcus species exhibit increased tolerance to copper shock and a distinctive
transcriptional response relative to those of open-ocean strains. Appl. Environ. Microbiol.
75(15): 5047-5057.
Stumm, W. and J.T. Morgan. 1981. An introduction emphasizing chemical equilibria in natural
waters. John Wiley and Sons Inc., New York, NY.
Sturesson, U. 1984. In situ studies of copper and zinc enrichment in shell and soft tissue of
Mytilus edulis. In: G. Persoone, E. Jaspers and C. Claus (Eds.), Ecotoxicol. Testing for the Mar.
Environ., Vol. 2, State Univ. Ghent and Inst. Mar. Sci. Res., Bredene, Belgium. pp. 511-533.

138
Suedel, B.C., J.A. Boraczek, R.K. Peddicord, P.A. Clifford and T.M. Dillon. 1994. Trophic
transfer and biomagnification potential of contaminants in aquatic ecosystems. Rev. Environ.
Contam. Toxicol. 136: 22-89.
Sulaiman, N. and W.E.W.M. Noor. 1996. Acute toxicity testing of copper, cadmium and
ammonia to Penaeus monodon and Lates calcarifer. FRI News. 2(2): 5-7.
Sullivan, B.K., E. Buskey, D.C. Miller and P.J. Ritacco. 1983. Effects of copper and cadmium on
growth, swimming, and predator avoidance in Eurytemora affinis (Copepoda). Mar. Biol. 77:
299-306.
Sun, F., Q. Zhou, M. Wang and J. An. 2009. Joint stress of copper and petroleum hydrocarbons
on the polychaete Perinereis aibuhitensis at biochemical levels. Ecotoxicol. Environ. Saf. 72(7):
1887-1892.
Sunda, W.G. and P.A. Gillespie. 1979. The response of a marine bacterium to cupric ion and its
use to estimate cupric ion activity in seawater. J. Mar. Res. 37(4): 761-777.
Sunda, W. and R.R.L. Guillard. 1976. The relationship between cupric ion activity and the
toxicity of copper to phytoplankton. J. Mar. Res. 34(4): 511-529.
Sunda, W.G. and J.A.M. Lewis. 1978. Effect of complexation by natural organic ligands on the
toxicity of copper to a unicellular alga, Monochrysis lutheri. Limnol. Oceanog. 23(5): 870-876.
Sunda, W.G., P.A. Tester and S.A. Huntsman. 1990. Toxicity of trace metals to Acartia tonsa in
the Elizabeth River and southern Chesapeake Bay. Estuar. Coast. Shelf Sci. 30: 207-221.
Sunila, I. 1988. Acute histological responses of the gill of the mussel, Mytilus edulis, to exposure
by environmental pollutants. J. Invert. Pathol. 52(1): 137-141.
Sunila, I. and R. Lindstrom. 1986. Effects of copper and cadmium on the shell morphology,
length growth and survival of the mussel Mytilus edulis L. In: 3rd Finnish-Swedish Semin. on
the Gulf of Bothnia, Aug. 20-21, 1984, Pori, Finland, Vesientutkimuslaitoksen Julk. 68: 211-214.
Sutherland, J. and C.W. Major. 1981. Internal heavy metal changes as a consequence of exposure
of Mytilus edulis, the blue mussel, to elevated external copper (II) levels. Comp. Biochem.
Physiol. C 68(1): 63-67.
Sverdrup, H.U., M.W. Johnson and R.H. Fleming. 1942. The oceans, their physics, chemistry
and general biology. Prentice-Hall, NY.
Swedmark, M. and A. Granmo. 1981. Effects of mixtures of heavy metals and a sufactant on the
development of cod (Gadus morhua L.). Rapp. P.V. Reun. Cons. Int. Explor. Mer. 178: 95-103.
Syasina, I.G., M.A. Vaschenko and V.B. Durkina. 1992. Histopathological changes in the gonads
of sea urchins exposed to heavy metals. Russ. J. Mar. Biol. (Biol. Morya). 17: 244-251.

139
Sze, P.W.C. and S.Y. Lee. 1995. The potential role of mucus in the depuration of copper from
the mussels Perna viridis (L.) and Septifer virgatus (Wiegmann). Mar. Pollut. Bull. 31(4-12):
390-393.
Tait, T.N. 2013. Determination of copper speciation, bioavailability and toxicity in saltwater
environments. M.S. Thesis, Wilfrid Laurier University, Waterloo, Ontario, Canada: 208 p.
Tanguy, A., I. Boutet, F. Bonhomme, P. Boudry and D. Moraga. 2002. Polymorphism of
metallothionein genes in the Pacific oyster Crassostrea gigas as a biomarker of response to metal
exposure. Biomarkers 7(6): 439-450.
Taylor, D.A., E.L. Thompson, S.V. Nair and D.A. Raftos. 2013. Differential effects of metal
contamination on the transcript expression of immune- and stress-response genes in the Sydney
Rock oyster, Saccostrea glomerata. Environ. Pollut. 178: 65-71.
TDC Environmental. 2004. Copper sources in urban runoff and shoreline activities: Information
update. Prepared for the Clean Estuary Partnership. 72 pp.
Teles, M., M. Pacheco and M.A. Santos. 2005. Physiological and genetic responses of European
eel (Anguilla anguilla L.) to short-term chromium or copper exposure-influence of preexposure
to a PAH-like compound. Environ. Toxicol. 20(1): 92-99.
Thiagarajan, R., S. Gopalakrishnan and H. Thilagam. 2006. Immunomodulation in the marine
green mussel Perna viridis exposed to sub-lethal concentrations of Cu and Hg. Arch. Environ.
Contam. Toxicol. 51(3): 392-399.
Thiyagarajan, D., K.V. Dhaneesh, T.T. Ajith Kumar, S. Kumaresan and T. Balasubramanian.
2012. Metals in fish along the southeast coast of India. Bull. Environ. Contam. Toxicol. 88(4):
582-588.
Thomas, A. 1915. Effects of certain metallic salts upon fishes. Trans. Am. Fish. Soc. 44: 120-
124.
Thomas, K.V. and S. Brooks. 2010. The environmental fate and effects of antifouling biocides.
Biofoul. 26(1): 73-88.
Thurberg, F.P., M.A. Dawson and R.S. Collier. 1973. Effects of copper and cadmium on
osmoregulation and oxygen consumption in two species of estuarine crabs. Mar. Biol. (Berlin)
23(3): 171-175.
Thurman, E.M. 1985. Organic geochemistry of natural waters. Martinus-Nijhoff, Dr. W. Junk
Publishers, Dordrecht, the Netherlands, 497 pp.

140
Tipping, E. 1994. WHAM - a chemical equilibrium model and computer code for waters,
sediments, and soils incorporating a discrete site/electrostatic model of ion-binding by humic
substances. Computers Geosci. 20(6): 973-1023.
Tisdale, S.L., W.L. Nelson and J.D. Beaton. 1985. Soil fertility and fertilizers (4th ed.) Macmillan
Publishing Company, NY.
TOXSCAN Incorporated. 1991a. Results of provision E5F spiked metals toxicity testing 14 to 21
February 1991. Prepared for Kinnetic Lab. Inc. for "Site-Specific Water Quality Objectives for
South San Francisco Bay" Report by Larry Walker Assoc. and Kinnetic Lab. Under Subcontract
to CH2M Hill, 27 pp.
TOXSCAN Incorporated. 1991b. Results of provision E5F spiked metals toxicity testing 27
February to 6 March 1991. Prepared for Kinnetic Lab. Inc. for "Site-Specific Water Quality
Objectives for South San Francisco Bay" Report by Larry Walker Assoc. and Kinnetic Lab.
under Subcontract to CH2M Hill, 27 pp.
TOXSCAN Incorporated. 1991c. Results of provision E5F spiked metals toxicity testing 2 to 9
April 1991. Prepared for Kinnetic Lab. Inc. for "Site-Specific Water Quality Objectives for
South San Francisco Bay" Report by Larry Walker Assoc. and Kinnetic Lab. Under Subcontract
to CH2M Hill, 27 pp.
Trevisan, R., D.F. Mello, A.S. Fisher, P.M. Schuwerack, A.L. Dafre and A.J. Moody. 2011.
Selenium in water enhances antioxidant defenses and protects against copper-induced DNA
damage in the blue mussel Mytilus edulis. Aquat. Toxicol. 101(1): 64-71.
Truchot, J.P. and A. Rtal. 1998. Effects of long-term sublethal exposure to copper on subsequent
uptake and distribution of metal in the shore crab Carcinus maenas. J. Crustac. Biol. 18(2): 224-
231.
Trueman, E.R. and H.B. Akberali. 1981. Responses of an estuarine bivalve, Scrobicularia plana
(Tellinacea) to stress. Malacologia 21(1/2): 15-21.
Tullis, R.E. 1980. Effect of copper on Mytilus californianus and Mytilus edulis. Annual Report.
Lawrence Livermore Laboratory (Subcontract #3567903). California State University, Hayward,
CA, Department of Biological Sciences. 33 pp.
Turekian, K.K. 1968. Oceans. Prentice-Hall, Englewood Cliffs, NJ. 120 pp.
Turner, A. 2010. Marine pollution from antifouling paint particles. Mar. Pollut. Bull. 60: 159-
171.
UC Davis. 1997. Copper nutrition of beef cattle. Vet Views, California Cattleman, May 1997.
Available at: http://www.vetmed.ucdavis.edu/vetext/INF-BE_cca/INF-BE_cca97/INF-
BE_cca9705.html.

141
Umarani, R., A.K. Kumaraguru and N. Nagarani. 2012. Investigation of acute toxicity of heavy
metals in Artemia salina acclimated to different salinity. Toxicol. Environ. Chem. 94(8): 1547-
1556.
University of Minnesota. 2009. Extension Fact Sheet: Copper for crop production. WW-06790-
GO. July 2009. Available at:
http://www.extension.umn.edu/distribution/cropsystems/DC6790.html.
Untersee, S. and J.A. Pechenik. 2007. Local adaptation and maternal effects in two species of
marine gastropod (Genus Crepidula) that differ in dispersal potential. Mar. Ecol. Prog. Ser. 347:
79-85.
U.S. EPA. 1980. Ambient water quality criteria for copper. U.S. Environmental Protection
Agency Report 440/5-80-036.162 pp.
U.S. EPA. 1983a. Water quality standards regulation. Federal Regist. 48:51400-51413.
U.S. EPA. 1983b. Water quality standards handbook. Office of Water Regulations and
Standards, Washington, D.C.
U.S. EPA. 1984. Ambient Water Quality Criteria for Copper - 1984. EPA 440-5-84-031.
U.S. EPA. 1985. Technical support document for water quality-based toxics control. Office of
Water, Washington, D.C.
U.S. EPA 1986a. Guidance for the reregistration of pesticide products containing copper sulfate
as the active ingredient. Office of Pesticides and Toxic Substances. Washington, D.C.
U.S. EPA. 1986b. Quality criteria for water 1986. EPA 440/5-86-001. Office of Water,
Regulation and Standards, Washington, DC..
U.S. EPA. 1987. Guidance for the reregistration of pesticide products containing group II copper
compounds as the active ingredient. Office of Pesticides and Toxic Substances. Washington,
D.C.
U.S. EPA. 1991. Technical support document for water quality-based toxics control. EPA-505/2-
90-001 or PB91-127415. National Technical Information Service, Springfield, VA.
U.S. EPA. 1993. Wildlife Exposure Factors Handbook, 2 vols. EPA/600/R-93/187. Washington,
D.C.: Office of Research and Development.
U.S. EPA. 1994a. Water quality standards handbook: 2nd ed. EPA-823-B-94-005a, b. National
Technical Information Service, Springfield, VA.

142
U.S. EPA. 1994b. Technical document: Acid mine drainage prediction. U.S. Environmental
Protection Agency, Office of Solid Waste, Special Waste Branch. Washington, DC. EPA 530-R-
94-036.
U.S. EPA. 1995a. Ambient water quality criteria - saltwater copper addendum. Draft, April 14,
1995. EPA 440-5-80-036. U.S. EPA, Environmental Research Laboratory, Narragansett, RI.
U.S. EPA. 1995b. Short-term methods for estimating the chronic toxicity of effluents and
receiving waters to west coast marine and estuarine organisms. EPA/600/R-95/136.
U.S. EPA. 1996. 1995 Updates: Water quality criteria documents for the protection of aquatic
life in ambient water. Office of Water. EPA-820-B-96-001.
U.S. EPA. 1998. Guidelines for ecological risk assessment. United States Environmental
Protection Agency. Risk Assessment Forum. Office of Research and Development, Washington,
D.C. EPA/630/R-95/002F.
U.S. EPA. 1999. Integrated Approach to Assessing the Bioavailability and Toxicity of Metals in
Surface Waters and Sediments, a report to the EPA Science Advisory Board, Office of Water,
Office of Research and Development, Washington, DC, USEPA-822-E-99-001.
U.S. EPA. 2000. An SAB Report: Review of the Biotic Ligand Model of the Acute Toxicity of
Metals, prepared by the Ecological Processes and Effects Committee of the Science Advisory
Board, EPA-SAB-EPEC-00- 0006.
U.S. EPA. 2002. Total maximum daily loads for toxic pollutants, San Diego Creek and Newport
Bay, California. EPA Region IX. San Francisco, CA.
U.S. EPA. 2003. 2003 Draft update of ambient water quality criteria for copper. Available at:
http://www.epa.gov/waterscience/criteria/copper/2003/master.pdf.
U.S. EPA. 2004. Overview of the ecological risk assessment process in the Office of Pesticide
Programs. United States Environmental Protection Agency. Environmental Fate and Effects
Division. Office of Pesticide Programs. Available online at:
http://www.epa.gov/espp/consultation/ecorisk-overview.pdf.
U.S. EPA. 2007. Aquatic life ambient freshwater quality criteria – Copper. EPA-822-R-07-001.
Available online at: http://www.epa.gov/waterscience /criteria/copper /2007/criteria-full.pdf.
U.S. EPA. 2009. Revised reregistration eligibility decision for coppers. Available at:
http://www.epa.gov/oppsrrd1/REDs/copper_red_amend.pdf.
U.S. EPA. 2010a. Registration review: Preliminary problem formulation for ecological risk,
environmental fate, and endangered species assessments for coppers. Office of Chemical Safety
and Pollution Prevention. Washington, D.C. 105 pp.

143
U.S. EPA. 2010b. Report to Congress: Study of discharges incidental to normal operation of
commercial fishing vessels and other non-recreational vessels less than 79 feet. Office of Water,
Washington, D.C. EPA 833-R-10-005. 598 pp.
U.S. EPA. 2012a. Liquid assets 2000: Americans pay for dirty water. Available at:
http://water.epa.gov/lawsregs/lawsguidance/cwa/economics/liquidassets/dirtywater.cfm.
U.S. EPA. 2012b. Chromated arsenicals. Available at: https://www.epa.gov/ingredients-used-
pesticide-products/chromated-arsenicals-cca
USDHHS (U.S. Department of Health and Human Services). 2004. Toxicological profile for
copper. Public Health Service. Agency for Toxic Substances and Disease Registry. 272 pp.
Valarmathi, S. and J. Azariah. 2002. Biochemical changes in tissues of crab Sesarma quadratum
(Decapoda) exposed to CuCl2. Indian J. Mar. Sci. 31(3): 246-248.
Valdovinos, C. and M. Zuniga. 2002. Copper acute toxicity tests with the sand crab Emerita
analoga (Decapoda: Hippidae): A biomonitor of heavy metal pollution in Chilean coastal
seawater? Bull. Environ. Contam. Toxicol. 69(3): 393-400.
van Leeuwen, C.J., J.L. Buchner and H. van Dijk. 1988. Intermittent flow system for population
toxicity studies demonstrated with Daphnia and copper. Bull. Environ. Contam. Toxicol. 40(4):
496-502.
Vardy, D.W., A.R. Tompsett, J.L. Sigurdson, J.A. Doering, X.W. Zhang, J.P. Giesy and M.
Hecker. 2011. Effects of subchronic exposure of early life stages of white sturgeon (Acipenser
transmontanus) to copper, cadmium, and zinc. Environ. Toxicol. Chem. 30(11): 2497-2505.
Varo, I., B. Nunes, F. Amat, A. Torreblanca, L. Guilhermino and J.C. Navarro. 2007. Effect of
sublethal concentrations of copper sulphate on seabream Sparus aurata fingerlings. Aquat. Liv.
Res. 20(3): 263-270.
Varshney, P.K. and S.A.H. Abidi. 1988. Toxicity of mercury, copper and lead in the polychaete
Namanereis merukensis Horst. Indian J. Mar. Sci. 17: 83-84.
Vasil'eva, V.S., A.A. Zhuchikhina, L.N. Propp and E.P. Sergeeva. 1979. Effect of copper on the
organism, tissue, and some enzyme systems of the bivalve mollusk Glycymeris yessoensis. Sov.
J. Mar. Biol. 5(6): 504-510.
Vaz, C., S.P. Melegari, C.H.D. Costa, R. Popovic, T. Kleine, R.F.S. Bohm, T.M.N.D. Oliveira
and W.G. Matias. 2011a. The effects of copper oxide nanoparticles on Mysidopsis juniae.
Abstracts of the 47th Congress of the European Societies of Toxicology (EUROTOX). Toxicol.
Letters 205(Supplement 0): S290.
Vaz, C., S.P. Melegari, C.H.D. Costa, R. Popovic, T. Kleine, R.F.S. Bohm, T.M.N.D. Oliveira
and W.G. Matias. 2011b. The effects of copper oxide nanoparticles on Mysidopsis juniae.
Toxicol. Lett. 205S: S290.

144
Vedamanikam, V.J. and T. Hayimad. 2014. Effect of mixtures of metals on the spotted Babylon
snail (Babylonia areolata) under different temperature conditions. Toxicol. Environ. Chem.
95(8): 1388-1394.
Venn, A.A., J. Quinn, R. Jones and A. Bodnar. 2009. P-glycoprotein (multi-xenobiotic
resistance) and heat shock protein gene expression in the reef coral Montastraea franksi in
response to environmental toxicants. Aquat. Toxicol. 93(4): 188-195.
Viant, M.R., J.H. Walton, P.L. TenBrook and R.S. Tjeerdema. 2002. Sublethal actions of copper
in abalone (Haliotis rufescens) as characterized by in vivo 31P NMR. Aquat. Toxicol. 57(3):
139-151.
Viarengo, A., R. Accomando, I. Ferrando, F. Beltrame, M. Fato and G. Marcenaro. 1996. Heavy
metal effects on cytosolic free Ca2+ level in the marine protozoan Euplotes crassus evaluated by
confocal laser scanning microscopy. Comp. Biochem. Physiol. C. 113(2): 161-168.
Vieira, L.R., C. Gravato, A.M.V.M. Soares, F. Morgado and L. Guilhermino. 2009. Acute effects
of copper and mercury on the estuarine fish Pomatoschistus microps: Linking biomarkers to
behaviour. Chemosphere 76: 1416-1427.
Vijayavel, K., S. Gopalakrishnan, H. Thilagam and M.P. Balasubramanian. 2006. Dietary
ascorbic acid and alpha-tocopherol mitigates oxidative stress induced by copper in the thornfish
Terapon jarbua. Sci. Tot. Environ. 372(1): 157-163.
Villar, C.A., S.E. Gomez and C.A. Bentos. 2004. Acute Cu toxicity, metal bioaccumulation and
ion loss in the neotropical cyprinodontiform Jenynsia multidentata. Rev. Mus. Argent. Cienc.
Nat. Nueva Ser. 6(1): 191-195.
Virginia Institute of Marine Science (VIMS). 2016. Shallow water habitats. Available online at:
http://web.vims.edu/bio/shallowwater/physical_characteristics/salinity.html.
Vlahogianni, T.H. and A. Valavanidis. 2007. Heavy-metal effects on lipid peroxidation and
antioxidant defense enzymes in mussels Mytilus galloprovincialis. Chem. Ecol. 23(5): 361-371.
Vosloo, D., J. Sara, A. Vosloo and D. Vosloo. 2012. Acute responses of brown mussel (Perna
perna) exposed to sub-lethal copper levels: Integration of physiological and cellular responses.
Aquat. Toxicol. 106-107: 1-8.
Vranken, G., R. Vanderhaeghen and C. Heip. 1991. Effects of pollutants on life-history of the
marine nematode Monhystera disjuncta. ICES J. Mar. Sci. 48(3): 325-334.
Waddell, D.C. and M.L. Kraus. 1990. Effects of CuCl2 on the germination responses of two
populations of the saltmarsh cordgrass, Spartina alterniflora. Bull. Environ. Contam. Toxicol.
44: 764-769.

145
Wahbeh, M.I. and M.B. Zughul. 1995. Toxicity and accumulation of cadmium, copper and zinc
in two bivalve species from Aqaba, Jordan. Dirasat Ser. B Pure Appl. Sci. 22(6): 1573-1590.
Wang, B., L. Axe, Z.H. Michalopoulou and L. Wei. 2012. Effects of Cd, Cu, Ni, and Zn on
brown tide alga Aureococcus anophagefferens growth and metal accumulation. Environ. Sci.
Technol. 46: 517-524.
Wang, H., Y. Li, H. Huang, X. Xu, Y. Wang and H. Wang. 2011a. Toxicity evaluation of single
and mixed antifouling biocides using the Strongylocentrotus intermedius sea urchin embryo test.
Environ. Toxicol. Chem. 30(3): 692-703.
Wang, T., X. Long, Y. Cheng, Z. Liu and S. Yan. 2014. The potential toxicity of copper
nanoparticles and copper sulphate on juvenile Epinephelus coioides. Aquat. Toxicol. 152: 96-
104.
Wang, W.X. and N.S. Fisher. 1996. Assimilation of trace elements and carbon by the mussel
Mytilus edulis: Effects of food composition. Limnol. Oceanogr. 41(2): 197-207.
Wang, W.X. and N.S. Fisher. 1998. Accumulation of trace elements in a marine copepod.
Limnol. Oceanogr. 43(2): 273-283.
Wang, W., K. Mai, W. Zhang, Q. Ai, C. Yao, H. Li and Z. Liufu. 2009. Effects of dietary copper
on survival, growth and immune response of juvenile abalone, Haliotis discus hannai Ino.
Aquacult. 297(1-4): 122-127.
Wang, Y., J. Fang, S.S. Leonard and K.M. Rao. 2004. Cadmium inhibits the electron transfer
chain and induces reactive oxygen species. Free Radic. Biol. Med. 36: 1434-1443.
Wang, Z.S., H.N. Kong and D.Y. Wu. 2007a. Reproductive toxicity of dietary copper to a
saltwater cladoceran, Moina monogolica Daday. Environ. Toxicol. Chem. 26(1): 126-131.
Wang, Z., H. Kong and D. Wu. 2007b. Acute and chronic copper toxicity to a saltwater
cladoceran Moina monogolica Daday. Arch. Environ. Contam. Toxicol. 53(1): 50-56.
Wang, Z.H., X.N. Wang and Q. Lin. 2011b. The content variation characteristics and risk
analysis for cadmium, copper, lead and zinc in some species of shellfish. J. Agro-Environ. Sci.
30(6): 1208-1213.
Ward, D.J., V. Perez-Landa, D.A. Spadaro, S.L. Simpson and D.F. Jolley. 2011. An assessment
of three harpacticoid copepod species for use in ecotoxicological testing. Arch. Environ. Contam.
Toxicol. 61(3): 414-425.
Warnau, M., M. Iaccarino, A. DeBiase, A. Temara, M. Jangoux, P. Dubois and G. Pagano. 1996.
Spermiotoxicity and embryotoxicity of heavy metals in the echinoid Paracentrotus lividus.
Environ. Toxicol. Chem. 15(11): 1931-1936.

146
Waterman, A.J. 1937. Effect of salts of heavy metals on development of the sea urchin, Arbacia
punctulata. Biol. Bull. 73(3): 401-420.
Watling, H. 1981. The effects of metals on mollusc filtering rates. Trans. R. Soc. S. Afr. 44(3):
441-451.
Wei, L., B. Wang, R. Kang, R. Huo and V. Randhawa. 2013. Aureococcus anophagefferens
growth potential affected by coastal water toxicants. J. Appl. Phycol. 25(1): 145-152.
Wendt, I., A. Arrhenius, T. Backhaus, A. Hilvarsson, K. Holm, K. Langford, T. Tunovic and H.
Blanck. 2013. Effects of five antifouling biocides on settlement and growth of zoospores from
the marine macroalga Ulva lactuca L. Bull. Environ. Contam. Toxicol. 91: 426-432.
WHOI (Woods Hole Oceanographic Institution). 1952. Marine fouling and its prevention.
Contribution No. 580. Woods Hole Oceanographic Institution. United States Naval Institute,
Annapolis, MD.
Williams, P.L. and D.B. Dusenbery. 1990. Aquatic toxicity testing using the nematode,
Caenorhabditis elegans. Environ. Toxicol. Chem. 9(10): 1285-1290.
Wilson, R.W. and E.W. Taylor. 1993. Differential responses to copper in rainbow trout
(Oncorhynchus mykiss) acclimated to sea water and brackish water. J. Comp. Physiol. B. 163:
239-246.
Winner, R.W. 1985. Bioaccumulation and toxicity of copper as affected by interactions between
humic acid and water hardness. Water Res. 19(4): 449-455.
Won, E.J., J.S. Rhee, R.O. Kim, K. Ra, K.T. Kim, K.H. Shin and J.S. Lee. 2012. Susceptibility to
oxidative stress and modulated expression of antioxidant genes in the copper-exposed polychaete
Perinereis nuntia. Comp. Biochem. Physiol. Part C Toxicol. Pharmacol. 155(2): 344-351.
Wong, V.W.T. and P.S. Rainbow. 1986. Apparent and real variability in the presence and metal
contents of metallothioneins in the crab Carcinus maenas including the effects of isolation
procedure and metal induction. Comp. Biochem. Physiol. 83A(1): 157-177.
Wood, C.M., A.P. Farrell and C.J. Brauner. 2012. Homeostatis and toxicology of essential
metals: Volume 31A. Fish Physiology, Academic Press/Elsevier, Waltham, MA.
Worboys, M.A., K.M.Y. Leung, E.P.M. Grist and M. Crane. 2002. Time should be considered in
developmental ecotoxicity test. Mar. Pollut. Bull. 45: 92-99.
Wright, D.A. and C.D. Zamuda. 1987. Copper accumulation by two bivalve molluscs: Salinity
effect is independent of cupric ion activity. Mar. Environ. Res. 23(1): 1-14.
Wu, H. and W.X. Wang. 2010. NMR-based metabolomic studies on the toxicological effects of
cadmium and copper on green mussels Perna viridis. Aquat. Toxicol. 100(4): 339-345.

147
Xie, Z.C., N.C. Wong, P.Y. Qian and J.W. Qiu. 2005. Responses of polychaete Hydroides
elegans life stages to copper stress. Mar. Ecol. Prog. Series 285: 89-96.
Xu, J. and T. Jing. 1995. Effects of temperature, salinity, copper and ammonia on prawn
(Penaeus orientalis kishinouye) postlarvae and clams (Potamocorbula laevis). In: M. Munawar
(Ed.), Ecovision World Monogr. Ser., Aquatic Ecosystems of China: Environmental and
Toxicological Assessment, SPB Acad. Publ., The Hague, Netherlands, pp. 89-94.
Xu, X., X. Wang, Y. Li, Y. Wang and Y. Wang. 2010. Acute toxicity and synergism of binary
mixtures of antifouling biocides with heavy metals to embryos of sea urchin Glyptocidaris
crenularis. Human Exper. Toxicol. 30(8): 1009-1021.
Xu, X., Y. Li, Y. Wang, Y. Wang and X. Xu. 2011. Assessment of toxic interactions of heavy
metals in multi-component mixtures using sea urchin embryo-larval bioassay. Toxicol. In Vitro.
25(1): 294-300.
Yaffe, P.L. 1979. Examination of the effects of 50 ppb copper on the black abalone, Haliotis
cracherodii. Lawrence Livermore Laboratory, University of California, Livermore, CA: 47 p.
Yang, D., Y. Zhou, H. Zhao, X. Zhou, Na Sun, B. Wang and X. Yuan. 2012. Molecular cloning,
sequencing, and expression analysis of cDNA encoding metalloprotein II (MP II) induced by
single and combined metals (Cu(II), Cd (II)) in polychaeta Perinereis aibuhitensis. Environ.
Toxicol. Pharmacol. 34: 841-848.
Young, J.S. 1982. Toxic and adaptive response to copper by the sabellid polychaete, Eudistylia
vancouveri. In: W.B. Vernberg, A. Calabrese, F.P. Thurberg and F.J. Vernberg (Eds.),
Physiological Mechanisms of Marine Pollutant Toxicity, Academic Press, Inc., NY. pp. 53-73.
Young, J.S., J.M. Gurtisen, C.W. Apts and E.A. Crecelius. 1979. The relationship between the
copper complexing capacity of sea water and copper toxicity in shrimp zoeae. Mar. Environ.
Res. 2: 265-273.
Young, L.G. and L. Nelson. 1974. The effects of heavy metal ions on the motility of sea urchin
spermatozoa. Biol. Bull. 147(1): 236-246.
Ytreberg, E., J. Karlsson and B. Eklund. 2010. Comparison of toxicity and release rates of Cu
and Zn from anti-fouling paints leached in natural and artificial brackish seawater. Sci. Total
Environ. 408(12): 2459-2466.
Zang, W., X. Xu, X. Dai, Z. Zhu, G. Xu and R. Xu. 1993. Toxic effects of Zn2+, Cu2+, Cd2+
and NH3 on Chinese prawn. Chin. J. Oceanol. Limnol. 11(3): 254-259.
Zapata, V., L.L. Greco and E.M. Rodriguez. 2001. Effect of copper on hatching and
development of larvae of the estuarine crab Chasmagnathus granulata (Decapoda, Brachyura).
Environ. Toxicol. Chem. 20(7): 1579-1583.

148
Zaroogian, G.E. and M. Johnson. 1983. Copper accumulation in the bay scallop, Argopecten
irradians. Arch. Environ. Contam. Toxicol. 12: 127-133.
Zhang, L., J. Gan, C. Ke, X. Liu, J. Zhao, L. You, J. Yu and H. Wu. 2012. Identification and
expression profile of a new cytochrome P450 isoform (CYP414A1) in the hepatopancreas of
Venerupis (Ruditapes) philippinarum exposed to benzo[a]pyrene cadmium and copper. Environ.
Toxicol. Pharmacol. 33: 85-91.
Zhang, Z. and Q. Zhang. 2012. Molecular cloning, characterization and expression of heat shock
protein 70 gene from the oyster Crassostrea hongkongensis responding to thermal stress and
exposure of Cu2+ and malachite green. Gene 497(2): 172-180.
Zheng, G., Y. Wang and J. Qin. 2012. Microalgal motility measurement microfluidic chip for
toxicity assessment of heavy metals. Anal. Bioanal. Chem. 404: 3061-3069.
Zhu, X., D. Zou and H. Du. 2011. Physiological responses of Hizikia fusiformis to copper and
cadmium exposure. Bot. Mar. 54(5): 431-439.
Zimmer, A.M., I.F. Barcarolli, C.M. Wood and A. Bianchini. 2012. Waterborne copper exposure
inhibits ammonia excretion and branchial carbonic anhydrase activity in euryhaline guppies
acclimated to both fresh water and sea water. Aquat. Toxicol. 122-123: 172-180.
Zitko, P., V.W. Carson and W.G. Carson. 1973. Prediction of incipient lethal levels of copper to
juvenile Atlantic salmon in the presence of humic acid by cupric electrode. Bull. Environ.
Contam. Toxicol. 10(5): 265-271.
Zizza, M., M. Canonaco and R.M. Facciolo. 2014. ORX neuroreceptor system and HSP90 are
linked to recovery strategies against copper toxicity in Thalassoma pavo. Toxicol. Sci. 137(1):
135-146.
Zuniga, M., P. Vallejos, A. Larrain and E. Bay-Schmith. 2003. Toxicity of copper on four
Chilean marine mussels. Bull. Environ. Contam. Toxicol. 71(6): 1167-1174.

A-1
Appendix A Acceptable Estuarine/Marine Acute Toxicity Data

A-2
Appendix Table A-1. Acceptable Estuarine/Marine Acute Toxicity Data.
Species
Organism
Age, Size or
Lifestage Methoda Chemicalb
Reported
LC50/EC50
(total μg/L)c
Reported
LC50/EC50
(dissolved μg/L)d
BLM
Data
Label
BLM
Normalized
LC50/EC50
(μg/L)e
Species
Mean Acute
Value
(μg/L)f Reference
Sea anemone,
Aiptasia pallida - R, M N 148 134.5 12 72.63 72.63 Main et al. 2010
Rotifer,
Brachionus plicatilis
Neonate,
0-3 hr S, M N - 13.4 50 16.55 - Arnold et al. 2010b
Rotifer,
Brachionus plicatilis
Neonate,
0-3 hr S, M N - 20.8 51 26.58 - Arnold et al. 2010b
Rotifer,
Brachionus plicatilis Neonate, <4hr S, M N - <12.80 53 <34.12 - Arnold et al. 2010c
Rotifer,
Brachionus plicatilis Neonate, <4hr S, M N - <12.60 54 <31.66 - Arnold et al. 2010c
Rotifer,
Brachionus plicatilis Neonate, <4hr S, M N - <12.90 55 <29.67 - Arnold et al. 2010c
Rotifer,
Brachionus plicatilis Neonate, <4hr S, M N - <12.50 56 <26.19 - Arnold et al. 2010c
Rotifer,
Brachionus plicatilis Neonate, <4hr S, M N - 10.1 57 20.41 - Arnold et al. 2010c
Rotifer,
Brachionus plicatilis Neonate, <4hr S, M N - 119.1 58 57.15 - Arnold et al. 2010c
Rotifer,
Brachionus plicatilis Neonate, <4hr S, M N - 173.4 59 54.09 - Arnold et al. 2010c
Rotifer,
Brachionus plicatilis Neonate, <4hr S, M N - 80.7 60 58.41 - Arnold et al. 2010c
Rotifer,
Brachionus plicatilis Neonate, <4hr S, M N - 45.5 61 30.52 - Arnold et al. 2010c
Rotifer,
Brachionus plicatilis
Neonate,
0-2 hr S, M - - 27.7 745 62.17 - Saunders 2012
Rotifer,
Brachionus plicatilis
Neonate,
0-2 hr S, M - - 23.3 746 29.42 - Saunders 2012
Rotifer,
Brachionus plicatilis
Neonate,
0-2 hr S, M - - 11.2 747 8.347 - Saunders 2012
Rotifer,
Brachionus plicatilis
Neonate,
0-2 hr S, M - - 19.7 748 31.19 - Saunders 2012
Rotifer,
Brachionus plicatilis
Neonate,
0-2 hr S, M - - 46.8 749 17.47 - Saunders 2012
Rotifer,
Brachionus plicatilis
Neonate,
0-2 hr S, M - - 48.9 750 8.115 - Saunders 2012

A-3
Species
Organism
Age, Size or
Lifestage Methoda Chemicalb
Reported
LC50/EC50
(total μg/L)c
Reported
LC50/EC50
(dissolved μg/L)d
BLM
Data
Label
BLM
Normalized
LC50/EC50
(μg/L)e
Species
Mean Acute
Value
(μg/L)f Reference
Rotifer,
Brachionus plicatilis
Newly
hatched, <6 hr S, M S 42.07 38.24 760 8.034 - Tait 2013
Rotifer,
Brachionus plicatilis
Newly
hatched, <6 hr S, M S 49.44 44.94 761 21.89 - Tait 2013
Rotifer,
Brachionus plicatilis
Newly
hatched, <6 hr S, M S 62.28 56.61 762 7.599 - Tait 2013
Rotifer,
Brachionus plicatilis
Newly
hatched, <6 hr S, M S 46.07 41.88 763 8.182 - Tait 2013
Rotifer,
Brachionus plicatilis
Newly
hatched, <6 hr S, M S 25.1 22.82 764 16.92 - Tait 2013
Rotifer,
Brachionus plicatilis
Newly
hatched, <6 hr S, M S 21.16 19.23 765 15.25 - Tait 2013
Rotifer,
Brachionus plicatilis
Newly
hatched, <6 hr S, M S 58.15 52.86 766 26.75 - Tait 2013
Rotifer,
Brachionus plicatilis
Newly
hatched, <6 hr S, M S 26.82 24.38 767 43.03 - Tait 2013
Rotifer,
Brachionus plicatilis
Newly
hatched, <6 hr S, M S 35.52 32.29 768 29.01 23.03 Tait 2013
Polychaete,
Anaitides maculata - S, U S 120 100.6 505 53.80 53.80
McLusky and Phillips
1975
Polychaete,
Eurythoe complanata
Immature,
1.0 g S, U - 1,300 1,089 170 1,675 1,675 Marcano et al. 1996
Polychaete,
Hediste (Nereis) diversicolor - S, U S 200 167.6 193 125.3 - Jones et al. 1976
Polychaete,
Hediste (Nereis) diversicolor - S, U S 445 372.9 194 792.4 - Jones et al. 1976
Polychaete,
Hediste (Nereis) diversicolor - S, U S 480 402.2 195 726.9 - Jones et al. 1976
Polychaete,
Hediste (Nereis) diversicolor - S, U S 410 343.6 196 403.9 - Jones et al. 1976
Polychaete,
Hediste (Nereis) diversicolor Juvenile R, U N 357 299.2 197 505.9 - Ozoh 1992a
Polychaete,
Hediste (Nereis) diversicolor Juvenile R, U N 357 299.2 198 475.6 - Ozoh 1992a
Polychaete,
Hediste (Nereis) diversicolor Juvenile R, U N 247 207.0 199 177.4 - Ozoh 1992a

A-4
Species
Organism
Age, Size or
Lifestage Methoda Chemicalb
Reported
LC50/EC50
(total μg/L)c
Reported
LC50/EC50
(dissolved μg/L)d
BLM
Data
Label
BLM
Normalized
LC50/EC50
(μg/L)e
Species
Mean Acute
Value
(μg/L)f Reference
Polychaete,
Hediste (Nereis) diversicolor Juvenile R, U N 307 257.3 200 279.7 - Ozoh 1992a
Polychaete,
Hediste (Nereis) diversicolor Juvenile R, U N 400 335.2 201 485.9 - Ozoh 1992a
Polychaete,
Hediste (Nereis) diversicolor Juvenile R, U N 462 387.2 202 597.2 - Ozoh 1992a
Polychaete,
Hediste (Nereis) diversicolor Juvenile R, U N 375 314.3 203 386.0 - Ozoh 1992a
Polychaete,
Hediste (Nereis) diversicolor Juvenile R, U N 362 303.4 204 340.1 - Ozoh 1992a
Polychaete,
Hediste (Nereis) diversicolor Juvenile R, U N 480 402.2 205 539.9 - Ozoh 1992a
Polychaete,
Hediste (Nereis) diversicolor Juvenile R, U N 512 429.1 206 602.1 - Ozoh 1992a
Polychaete,
Hediste (Nereis) diversicolor Juvenile R, U N 360 301.7 207 302.0 - Ozoh 1992a
Polychaete,
Hediste (Nereis) diversicolor Juvenile R, U N 500 419.0 208 508.2 - Ozoh 1992a
Polychaete,
Hediste (Nereis) diversicolor Adult R, U N 402 336.9 209 660.1 - Ozoh 1992b
Polychaete,
Hediste (Nereis) diversicolor Adult R, U N 724 606.7 210 1,718 - Ozoh 1992b
Polychaete,
Hediste (Nereis) diversicolor Adult R, U N 339 284.1 211 389.5 - Ozoh 1992b
Polychaete,
Hediste (Nereis) diversicolor Adult R, U N 776 650.3 212 1,533 - Ozoh 1992b
Polychaete,
Hediste (Nereis) diversicolor Adult R, U N 723 605.9 213 1,286 - Ozoh 1992b
Polychaete,
Hediste (Nereis) diversicolor Adult R, U N 725 607.6 214 1,192 - Ozoh 1992b
Polychaete,
Hediste (Nereis) diversicolor Adult R, U N 900 754.2 215 1,539 - Ozoh 1992b
Polychaete,
Hediste (Nereis) diversicolor Adult R, U N 754 631.9 216 1,127 - Ozoh 1992b
Polychaete,
Hediste (Nereis) diversicolor Adult R, U N 870 729.1 217 1,262 - Ozoh 1992b
Polychaete,
Hediste (Nereis) diversicolor Adult R, U N 890 745.8 218 1,302 - Ozoh 1992b
Polychaete,
Hediste (Nereis) diversicolor Adult R, U N 763 639.4 219 988.6 - Ozoh 1992b

A-5
Species
Organism
Age, Size or
Lifestage Methoda Chemicalb
Reported
LC50/EC50
(total μg/L)c
Reported
LC50/EC50
(dissolved μg/L)d
BLM
Data
Label
BLM
Normalized
LC50/EC50
(μg/L)e
Species
Mean Acute
Value
(μg/L)f Reference
Polychaete,
Hediste (Nereis) diversicolor Adult R, U N 825 691.4 220 1,016 - Ozoh 1992b
Polychaete,
Hediste (Nereis) diversicolor - R, U - 921.5 772.2 221 569.7 623.4 Mouneyrac et al. 2003
Polychaete,
Neanthes arenaceodentata Adult F, M N 77 69.99 469 50.01 -
Pesch and Morgan
1978
Polychaete,
Neanthes arenaceodentata Adult F, M N 200 181.8 470 158.3 -
Pesch and Morgan
1978
Polychaete,
Neanthes arenaceodentata - F, M N 222 201.8 472 181.1 112.8
Pesch and Hoffman
1982
Polychaete,
Hydroides elegans Larva R, U S 100 83.8 230 87.98 87.98 Bao et al. 2011
Black abalone,
Haliotis cracherodii Adult R, U S 50 41.9 187 21.24 21.24 Martin et al. 1977
Red abalone,
Haliotis rufescens Adult R, U S 65 54.47 189 27.77g - Martin et al. 1977
Red abalone,
Haliotis rufescens Larva S, U S 114 95.53 190 49.87g - Martin et al. 1977
Red abalone,
Haliotis rufescens Embryo S, M C 8.8 8 191 3.944 3.944 Hunt et al. 1989
Whelk,
Turbo coronatus
2.36 cm,
7.42 g R, U S 3,790 3,176 577 1,416 1,416
Kidwai and Ahmed
1999
Gastropod,
Crepidula convexa Juvenile R, U C 325 272.4 114 1,105 1,105
Untersee and Pechenik
2007
Gastropod,
Crepidula fornicata Larva R, U C 636.3 533.2 116 2,141 2,141
Untersee and Pechenik
2007
Grooved snail,
Planaxis sulcatus
1.92 cm,
1.38 g R, U S 1,010 846.38 507 1,089 1,089
Kidwai and Ahmed
1999
Blue mussel,
Mytilus edulis
Juvenile,
15.8 mm R, U C 122 - 333 72.69g - Nelson et al. 1988

A-6
Species
Organism
Age, Size or
Lifestage Methoda Chemicalb
Reported
LC50/EC50
(total μg/L)c
Reported
LC50/EC50
(dissolved μg/L)d
BLM
Data
Label
BLM
Normalized
LC50/EC50
(μg/L)e
Species
Mean Acute
Value
(μg/L)f Reference
Blue mussel,
Mytilus edulis Embryo S, U S 5.8 4.86 331 2.445 - Martin et al. 1981
Blue mussel,
Mytilus edulis Embryo S, M S 8.92 8.11 334 4.181 - TOXSCAN, Inc. 1991a
Blue mussel,
Mytilus edulis Embryo S, M S 8.19 7.44 335 3.851 - TOXSCAN, Inc. 1991b
Blue mussel,
Mytilus edulis Embryo S, M S 8.29 7.54 336 3.843 - TOXSCAN, Inc. 1991c
Blue mussel,
Mytilus edulis Embryo R, M S 13.1 12.5 337 8.719 -
Science Applications
International
Corporation 1993
Blue mussel,
Mytilus edulis Embryo R, M S 14.1 14.1 338 10.40 -
Science Applications
International
Corporation 1993
Blue mussel,
Mytilus edulis Embryo R, M S 12.2 11.3 339 7.863 -
Science Applications
International
Corporation 1993
Blue mussel,
Mytilus edulis Embryo R, M S 12.8 11.9 340 8.265 -
Science Applications
International
Corporation 1993
Blue mussel,
Mytilus edulis Embryo S, M S 7.16 5.95 341 3.524 - City of San Jose 1998
Blue mussel,
Mytilus edulis Embryo S, M S 5.85 5.21 342 3.059 - City of San Jose 1998
Blue mussel,
Mytilus edulis Embryo S, M S 5.03 5.05 343 3.022 - City of San Jose 1998
Blue mussel,
Mytilus edulis Embryo S, M S 3.82 3.75 344 2.230 - City of San Jose 1998
Blue mussel,
Mytilus edulis Embryo S, M S 5.86 5.45 345 3.204 - City of San Jose 1998
Blue mussel,
Mytilus edulis Embryo S, M S 4.7 3.8 346 2.241 - City of San Jose 1998
Blue mussel,
Mytilus edulis Embryo S, M S 6.42 4.97 347 2.949 - City of San Jose 1998
Blue mussel,
Mytilus edulis Embryo S, M S 6.22 5.72 348 3.355 - City of San Jose 1998
Blue mussel,
Mytilus edulis Embryo S, M S 6.21 5.84 349 3.423 - City of San Jose 1998
Blue mussel,
Mytilus edulis Embryo S, M S 5.87 5.44 350 3.187 - City of San Jose 1998

A-7
Species
Organism
Age, Size or
Lifestage Methoda Chemicalb
Reported
LC50/EC50
(total μg/L)c
Reported
LC50/EC50
(dissolved μg/L)d
BLM
Data
Label
BLM
Normalized
LC50/EC50
(μg/L)e
Species
Mean Acute
Value
(μg/L)f Reference
Blue mussel,
Mytilus edulis Embryo S, M S 5.4 4.75 351 2.797 - City of San Jose 1998
Blue mussel,
Mytilus edulis Embryo S, M S 6 5.1 352 3.053 - City of San Jose 1998
Blue mussel,
Mytilus edulis Embryo S, M S 9.05 8.3 353 4.912 - City of San Jose 1998
Blue mussel,
Mytilus edulis Embryo S, M S 6.92 5.34 354 3.138 - City of San Jose 1998
Blue mussel,
Mytilus edulis Embryo S, M S 7.19 5.02 355 2.946 - City of San Jose 1998
Blue mussel,
Mytilus edulis Embryo S, M S 5.56 4.39 356 2.548 - City of San Jose 1998
Blue mussel,
Mytilus edulis Embryo S, M S 8.48 7.5 357 4.434 - City of San Jose 1998
Blue mussel,
Mytilus edulis Embryo S, M S 7.36 6.79 358 3.995 - City of San Jose 1998
Blue mussel,
Mytilus edulis Embryo S, M S 7.85 5.29 359 3.090 - City of San Jose 1998
Blue mussel,
Mytilus edulis Embryo S, M S 8.02 6.82 360 3.989 - City of San Jose 1998
Blue mussel,
Mytilus edulis Embryo S, M S 9.5 7.81 361 4.649 - City of San Jose 1998
Blue mussel,
Mytilus edulis Embryo S, M S 7.29 5.59 362 3.270 - City of San Jose 1998
Blue mussel,
Mytilus edulis Embryo S, M S 8.93 6.35 363 3.792 - City of San Jose 1998
Blue mussel,
Mytilus edulis Embryo S, M S 4.54 3.94 364 2.316 - City of San Jose 1998
Blue mussel,
Mytilus edulis Embryo S, M S 4.73 3.9 365 2.315 - City of San Jose 1998
Blue mussel,
Mytilus edulis Embryo S, M N - 3.52 369 7.142 - Arnold et al. 2008
Blue mussel,
Mytilus edulis Embryo S, M N - 4.66 370 5.259 - Arnold et al. 2008
Blue mussel,
Mytilus edulis Embryo S, M N - 21.6 371 4.284 - Arnold et al. 2008
Blue mussel,
Mytilus edulis Embryo S, M N - 25.2 372 4.907 - Arnold et al. 2008
Blue mussel,
Mytilus edulis Embryo S, M N - 8.03 373 4.057 - Arnold et al. 2008

A-8
Species
Organism
Age, Size or
Lifestage Methoda Chemicalb
Reported
LC50/EC50
(total μg/L)c
Reported
LC50/EC50
(dissolved μg/L)d
BLM
Data
Label
BLM
Normalized
LC50/EC50
(μg/L)e
Species
Mean Acute
Value
(μg/L)f Reference
Blue mussel,
Mytilus edulis Embryo S, M N - 9.9 374 4.552 - Arnold et al. 2008
Blue mussel,
Mytilus edulis Embryo S, M N - 14 375 4.048 - Arnold et al. 2008
Blue mussel,
Mytilus edulis Embryo S, M N - 17.5 376 4.665 - Arnold et al. 2008
Blue mussel,
Mytilus edulis
Embryo, 4 hr
post fert S, M S 17.46 17.83 366 13.350 - CH2M Hill 1999b
Blue mussel,
Mytilus edulis
Embryo, 4 hr
post fert S, M S 22.81 21.35 367 16.11 - CH2M Hill 1999b
Blue mussel,
Mytilus edulis
Embryo, 4 hr
post fert S, M S 27.37 26.1 368 19.88 4.238 CH2M Hill 1999b
Mediterranean mussel,
Mytilus galloprovincialis Embryo S, M - - 8.3 380 5.606 - Arnold 2005
Mediterranean mussel,
Mytilus galloprovincialis Embryo S, M - - 8.1 381 5.471 - Arnold 2005
Mediterranean mussel,
Mytilus galloprovincialis Embryo S, M - - 9.5 382 15.94 - Arnold 2005
Mediterranean mussel,
Mytilus galloprovincialis Embryo S, M - - 6 383 10.08 - Arnold 2005
Mediterranean mussel,
Mytilus galloprovincialis Embryo S, M - - 6.9 384 6.984 - Arnold 2005
Mediterranean mussel,
Mytilus galloprovincialis Embryo S, M - - 7.1 385 5.993 - Arnold 2005
Mediterranean mussel,
Mytilus galloprovincialis Embryo S, M - - 9.4 386 4.761 - Arnold 2005
Mediterranean mussel,
Mytilus galloprovincialis Embryo S, M - - 6.8 387 22.14 - Arnold 2005
Mediterranean mussel,
Mytilus galloprovincialis Embryo S, M - - 12.4 388 17.88 - Arnold 2005
Mediterranean mussel,
Mytilus galloprovincialis Embryo S, M - - 21.7 389 8.459 - Arnold 2005
Mediterranean mussel,
Mytilus galloprovincialis Embryo S, M - - 25 390 7.919 - Arnold 2005
Mediterranean mussel,
Mytilus galloprovincialis Embryo S, M - - 19.1 391 8.415 - Arnold 2005
Mediterranean mussel,
Mytilus galloprovincialis Embryo S, M - - 21.3 392 21.65 - Arnold 2005

A-9
Species
Organism
Age, Size or
Lifestage Methoda Chemicalb
Reported
LC50/EC50
(total μg/L)c
Reported
LC50/EC50
(dissolved μg/L)d
BLM
Data
Label
BLM
Normalized
LC50/EC50
(μg/L)e
Species
Mean Acute
Value
(μg/L)f Reference
Mediterranean mussel,
Mytilus galloprovincialis Embryo S, M - - 19.4 393 13.13 - Arnold 2005
Mediterranean mussel,
Mytilus galloprovincialis Embryo S, M - - 19.3 394 9.315 - Arnold 2005
Mediterranean mussel,
Mytilus galloprovincialis Embryo S, M - - 18.9 395 8.705 - Arnold 2005
Mediterranean mussel,
Mytilus galloprovincialis Embryo S, M - - 17 396 17.25 - Arnold 2005
Mediterranean mussel,
Mytilus galloprovincialis Embryo S, M - - 20.1 397 10.19 - Arnold 2005
Mediterranean mussel,
Mytilus galloprovincialis Embryo S, M - - 27.8 398 8.809 - Arnold 2005
Mediterranean mussel,
Mytilus galloprovincialis Embryo S, M - - 17.3 399 6.740 - Arnold 2005
Mediterranean mussel,
Mytilus galloprovincialis Embryo S, M - - 16.3 400 4.713 - Arnold 2005
Mediterranean mussel,
Mytilus galloprovincialis Embryo S, M - - 19.4 401 4.266 - Arnold 2005
Mediterranean mussel,
Mytilus galloprovincialis Embryo S, M - - 30.9 402 9.499 - Arnold 2005
Mediterranean mussel,
Mytilus galloprovincialis Embryo S, M - - 19.6 403 8.275 - Arnold 2005
Mediterranean mussel,
Mytilus galloprovincialis Embryo S, M - - 14.7 404 14.90 - Arnold 2005
Mediterranean mussel,
Mytilus galloprovincialis Embryo S, M - - 20.3 405 13.75 - Arnold 2005
Mediterranean mussel,
Mytilus galloprovincialis Embryo S, M - - 20.7 406 9.538 - Arnold 2005
Mediterranean mussel,
Mytilus galloprovincialis Embryo S, M - - 16.8 407 8.958 - Arnold 2005
Mediterranean mussel,
Mytilus galloprovincialis Embryo S, M - - 16.4 408 16.64 - Arnold 2005
Mediterranean mussel,
Mytilus galloprovincialis Embryo S, M - - 17.8 409 12.04 - Arnold 2005
Mediterranean mussel,
Mytilus galloprovincialis Embryo S, M - - 15.3 410 9.116 - Arnold 2005
Mediterranean mussel,
Mytilus galloprovincialis Embryo S, M - - 16.9 411 10.07 - Arnold 2005
Mediterranean mussel,
Mytilus galloprovincialis Embryo S, M - - 12.4 412 12.55 - Arnold 2005

A-10
Species
Organism
Age, Size or
Lifestage Methoda Chemicalb
Reported
LC50/EC50
(total μg/L)c
Reported
LC50/EC50
(dissolved μg/L)d
BLM
Data
Label
BLM
Normalized
LC50/EC50
(μg/L)e
Species
Mean Acute
Value
(μg/L)f Reference
Mediterranean mussel,
Mytilus galloprovincialis Embryo S, M - - 18.2 413 8.782 - Arnold 2005
Mediterranean mussel,
Mytilus galloprovincialis Embryo S, M - - 24.2 414 5.001 - Arnold 2005
Mediterranean mussel,
Mytilus galloprovincialis Embryo S, M - - 13.8 415 6.655 - Arnold 2005
Mediterranean mussel,
Mytilus galloprovincialis Embryo S, M - - 14.5 416 8.158 - Arnold 2005
Mediterranean mussel,
Mytilus galloprovincialis Embryo S, M - - 16.7 417 11.29 - Arnold 2005
Mediterranean mussel,
Mytilus galloprovincialis Embryo S, M - - 24.8 418 3.085 - Arnold 2005
Mediterranean mussel,
Mytilus galloprovincialis Embryo S, M - - 20.1 419 7.274 - Arnold 2005
Mediterranean mussel,
Mytilus galloprovincialis Embryo S, M - - 19.2 420 9.731 - Arnold 2005
Mediterranean mussel,
Mytilus galloprovincialis Embryo S, M - - 22.4 421 7.567 - Arnold 2005
Mediterranean mussel,
Mytilus galloprovincialis Embryo S, M - - 50.5 422 5.686 - Arnold 2005
Mediterranean mussel,
Mytilus galloprovincialis Embryo S, M - - 23.3 423 5.901 - Arnold 2005
Mediterranean mussel,
Mytilus galloprovincialis Embryo S, M - - 22.7 424 10.01 - Arnold 2005
Mediterranean mussel,
Mytilus galloprovincialis Embryo S, M - - 14.2 425 8.459 - Arnold 2005
Mediterranean mussel,
Mytilus galloprovincialis Embryo S, M - - 30.3 426 6.397 - Arnold 2005
Mediterranean mussel,
Mytilus galloprovincialis Embryo S, M - - 16.5 427 7.597 - Arnold 2005
Mediterranean mussel,
Mytilus galloprovincialis Embryo S, M - - 21.1 428 8.224 - Arnold 2005
Mediterranean mussel,
Mytilus galloprovincialis Embryo S, M - - 14.5 429 6.385 - Arnold 2005
Mediterranean mussel,
Mytilus galloprovincialis Embryo S, M - - 23.4 430 5.266 - Arnold 2005
Mediterranean mussel,
Mytilus galloprovincialis Embryo S, M - - 18.4 431 7.457 - Arnold 2005
Mediterranean mussel,
Mytilus galloprovincialis Embryo S, M - - 19.7 432 9.075 - Arnold 2005

A-11
Species
Organism
Age, Size or
Lifestage Methoda Chemicalb
Reported
LC50/EC50
(total μg/L)c
Reported
LC50/EC50
(dissolved μg/L)d
BLM
Data
Label
BLM
Normalized
LC50/EC50
(μg/L)e
Species
Mean Acute
Value
(μg/L)f Reference
Mediterranean mussel,
Mytilus galloprovincialis Embryo S, M - - 21.1 433 12.60 - Arnold 2005
Mediterranean mussel,
Mytilus galloprovincialis Embryo S, M - - 33.3 434 3.502 - Arnold 2005
Mediterranean mussel,
Mytilus galloprovincialis Embryo S, M - - 21.3 435 7.443 - Arnold 2005
Mediterranean mussel,
Mytilus galloprovincialis Embryo S, M - - 14 436 7.089 - Arnold 2005
Mediterranean mussel,
Mytilus galloprovincialis Embryo S, M - - 30.2 437 3.043 - Arnold 2005
Mediterranean mussel,
Mytilus galloprovincialis Embryo S, M - - 11.1 438 3.501 - Arnold 2005
Mediterranean mussel,
Mytilus galloprovincialis Embryo S, M - - 14.8 439 10.72 - Arnold 2005
Mediterranean mussel,
Mytilus galloprovincialis Embryo S, M - - 13 440 11.98 - Arnold 2005
Mediterranean mussel,
Mytilus galloprovincialis Embryo S, M - - 71 441 8.327 - Arnold 2005
Mediterranean mussel,
Mytilus galloprovincialis Embryo S, M - - 24.8 442 7.663 - Arnold 2005
Mediterranean mussel,
Mytilus galloprovincialis Embryo S, M - - 17.1 443 11.57 - Arnold 2005
Mediterranean mussel,
Mytilus galloprovincialis Embryo S, M - - 16.6 444 12.03 - Arnold 2005
Mediterranean mussel,
Mytilus galloprovincialis Embryo S, M - - 52.9 295 10.60 - Arnold et al. 2006
Mediterranean mussel,
Mytilus galloprovincialis Embryo S, M - - 59.4 296 7.044 - Arnold et al. 2006
Mediterranean mussel,
Mytilus galloprovincialis Embryo S, M - - 47.9 297 5.029 - Arnold et al. 2006
Mediterranean mussel,
Mytilus galloprovincialis Embryo S, M - - 48.2 298 10.26 - Arnold et al. 2006
Mediterranean mussel,
Mytilus galloprovincialis Embryo S, M - - 54 299 8.348 - Arnold et al. 2006
Mediterranean mussel,
Mytilus galloprovincialis Embryo S, M - - 47.8 300 4.867 - Arnold et al. 2006
Mediterranean mussel,
Mytilus galloprovincialis Embryo S, M - - 19.6 301 13.37 - Arnold et al. 2006
Mediterranean mussel,
Mytilus galloprovincialis Embryo S, M - - 34.4 302 4.797 - Arnold et al. 2006

A-12
Species
Organism
Age, Size or
Lifestage Methoda Chemicalb
Reported
LC50/EC50
(total μg/L)c
Reported
LC50/EC50
(dissolved μg/L)d
BLM
Data
Label
BLM
Normalized
LC50/EC50
(μg/L)e
Species
Mean Acute
Value
(μg/L)f Reference
Mediterranean mussel,
Mytilus galloprovincialis Embryo S, M - - 56.8 303 5.261 - Arnold et al. 2006
Mediterranean mussel,
Mytilus galloprovincialis Embryo S, M - - 15.9 304 11.60 - Arnold et al. 2006
Mediterranean mussel,
Mytilus galloprovincialis Embryo S, M - - 33.8 305 5.555 - Arnold et al. 2006
Mediterranean mussel,
Mytilus galloprovincialis Embryo S, M - - 20 306 10.21 - Arnold et al. 2006
Mediterranean mussel,
Mytilus galloprovincialis Embryo S, M - - 22.5 307 4.874 - Arnold et al. 2006
Mediterranean mussel,
Mytilus galloprovincialis Embryo S, M - - 54.4 308 4.614 - Arnold et al. 2006
Mediterranean mussel,
Mytilus galloprovincialis Embryo S, M - - 14.7 309 8.814 - Arnold et al. 2006
Mediterranean mussel,
Mytilus galloprovincialis Embryo S, M - - 16.1 310 4.820 - Arnold et al. 2006
Mediterranean mussel,
Mytilus galloprovincialis Embryo S, M - - 41.6 311 4.273 - Arnold et al. 2006
Mediterranean mussel,
Mytilus galloprovincialis Embryo S, M - - 11.8 312 11.95 - Arnold et al. 2006
Mediterranean mussel,
Mytilus galloprovincialis Embryo S, M - - 11.7 313 9.874 - Arnold et al. 2006
Mediterranean mussel,
Mytilus galloprovincialis Embryo S, M - - 12.3 314 4.296 - Arnold et al. 2006
Mediterranean mussel,
Mytilus galloprovincialis Embryo S, M - - 14.1 315 4.464 - Arnold et al. 2006
Mediterranean mussel,
Mytilus galloprovincialis Embryo S, M N - 9.7 316 1.614 - Arnold et al. 2007
Mediterranean mussel,
Mytilus galloprovincialis Embryo S, M N - 8.6 317 21.80 - Arnold et al. 2007
Mediterranean mussel,
Mytilus galloprovincialis Embryo S, M N - 7.5 318 58.07 - Arnold et al. 2007
Mediterranean mussel,
Mytilus galloprovincialis Embryo S, M N - 5.13 446 7.443 - Arnold et al. 2008
Mediterranean mussel,
Mytilus galloprovincialis Embryo S, M N - 3.56 447 3.602 - Arnold et al. 2008
Mediterranean mussel,
Mytilus galloprovincialis Embryo S, M N - 30.6 448 6.329 - Arnold et al. 2008
Mediterranean mussel,
Mytilus galloprovincialis Embryo S, M N - 21.7 449 3.847 - Arnold et al. 2008

A-13
Species
Organism
Age, Size or
Lifestage Methoda Chemicalb
Reported
LC50/EC50
(total μg/L)c
Reported
LC50/EC50
(dissolved μg/L)d
BLM
Data
Label
BLM
Normalized
LC50/EC50
(μg/L)e
Species
Mean Acute
Value
(μg/L)f Reference
Mediterranean mussel,
Mytilus galloprovincialis Embryo S, M N - 12.2 450 6.503 - Arnold et al. 2008
Mediterranean mussel,
Mytilus galloprovincialis Embryo S, M N - 6.91 451 3.164 - Arnold et al. 2008
Mediterranean mussel,
Mytilus galloprovincialis Embryo S, M N - 20.2 452 6.206 - Arnold et al. 2008
Mediterranean mussel,
Mytilus galloprovincialis Embryo S, M N - 11.5 453 3.053 - Arnold et al. 2008
Mediterranean mussel,
Mytilus galloprovincialis Embryo S, M S - 6.36 454 4.824 - Rosen et al. 2008
Mediterranean mussel,
Mytilus galloprovincialis Embryo S, M S - 8.68 455 5.051 - Rosen et al. 2008
Mediterranean mussel,
Mytilus galloprovincialis Embryo S, M N - 6.28 456 8.040 - Arnold et al. 2010a
Mediterranean mussel,
Mytilus galloprovincialis Embryo S, M N - 14.4 457 5.646 - Arnold et al. 2010a
Mediterranean mussel,
Mytilus galloprovincialis Embryo S, M N - 28.2 458 7.341 - Arnold et al. 2010a
Mediterranean mussel,
Mytilus galloprovincialis Embryo S, M N - 34.8 459 6.205 - Arnold et al. 2010a
Mediterranean mussel,
Mytilus galloprovincialis Embryo S, M N - 10.9 460 9.118 - Arnold et al. 2010a
Mediterranean mussel,
Mytilus galloprovincialis Embryo S, M N - 21 461 10.06 - Arnold et al. 2010a
Mediterranean mussel,
Mytilus galloprovincialis Embryo S, M N - 31.6 462 9.065 - Arnold et al. 2010a
Mediterranean mussel,
Mytilus galloprovincialis Embryo S, M N - 37.2 463 7.459 - Arnold et al. 2010a
Mediterranean mussel,
Mytilus galloprovincialis Embryo, 4 cell S, M N - 12.66 319 11.87 - DePalma et al. 2011
Mediterranean mussel,
Mytilus galloprovincialis Embryo, 4 cell S, M N - 22.72 320 6.452 - DePalma et al. 2011
Mediterranean mussel,
Mytilus galloprovincialis Embryo, 4 cell S, M N - 19.01 321 8.304 - DePalma et al. 2011
Mediterranean mussel,
Mytilus galloprovincialis Embryo, 4 cell S, M N - 20.67 322 6.237 - DePalma et al. 2011
Mediterranean mussel,
Mytilus galloprovincialis Embryo, 4 cell S, M N - 16.04 323 9.176 - DePalma et al. 2011
Mediterranean mussel,
Mytilus galloprovincialis Embryo, 4 cell S, M N - 20.45 324 6.781 - DePalma et al. 2011

A-14
Species
Organism
Age, Size or
Lifestage Methoda Chemicalb
Reported
LC50/EC50
(total μg/L)c
Reported
LC50/EC50
(dissolved μg/L)d
BLM
Data
Label
BLM
Normalized
LC50/EC50
(μg/L)e
Species
Mean Acute
Value
(μg/L)f Reference
Mediterranean mussel,
Mytilus galloprovincialis Embryo, 4 cell S, M N - 31.58 325 4.646 - DePalma et al. 2011
Mediterranean mussel,
Mytilus galloprovincialis Embryo, 4 cell S, M N - 30.96 326 9.895 - DePalma et al. 2011
Mediterranean mussel,
Mytilus galloprovincialis Embryo, 4 cell S, M N - 15.96 327 10.27 - DePalma et al. 2011
Mediterranean mussel,
Mytilus galloprovincialis Embryo, 4 cell S, M N - 31.19 328 4.748 - DePalma et al. 2011
Mediterranean mussel,
Mytilus galloprovincialis 20-39 mm S, U S 1,670 1,399 730 2,285g - Bat et al. 2013
Mediterranean mussel,
Mytilus galloprovincialis 40-59 mm S, U S 1,450 1,215 731 1,946g - Bat et al. 2013
Mediterranean mussel,
Mytilus galloprovincialis 60-79 mm S, U S 1,180 988.8 732 1,529g - Bat et al. 2013
Mediterranean mussel,
Mytilus galloprovincialis 50-80 mm S, U S 800.0 670.4 733 944.8g - Bat et al. 2013
Mediterranean mussel,
Mytilus galloprovincialis Embryo S, M C - 8.9 769 4.345 - Fabbri et al. 2014
Mediterranean mussel,
Mytilus galloprovincialis Embryo S, M C - 8.7 770 4.258 - Fabbri et al. 2014
Mediterranean mussel,
Mytilus galloprovincialis Embryo S, M C - 12.2 752 4.321 - Deruytter et al. 2015
Mediterranean mussel,
Mytilus galloprovincialis Embryo S, M C - 10.1 753 8.568 - Deruytter et al. 2015
Mediterranean mussel,
Mytilus galloprovincialis Embryo S, M C - 13.4 754 3.556 - Deruytter et al. 2015
Mediterranean mussel,
Mytilus galloprovincialis Embryo S, M C - 4.1 755 7.452 - Deruytter et al. 2015
Mediterranean mussel,
Mytilus galloprovincialis Embryo S, M C - 13.6 756 2.946 - Deruytter et al. 2015
Mediterranean mussel,
Mytilus galloprovincialis Embryo S, M C - 10.3 757 3.734 - Deruytter et al. 2015
Mediterranean mussel,
Mytilus galloprovincialis Embryo S, M C - 11.0 758 3.990 - Deruytter et al. 2015
Mediterranean mussel,
Mytilus galloprovincialis Embryo S, M C - 5.0 759 3.385 7.338 Deruytter et al. 2015
Asian green mussel,
Perna viridis
Juvenile,
1.6 cm, 0.12 g R, M C - 500.0 771 646.9 646.9 Rajkumar 2012

A-15
Species
Organism
Age, Size or
Lifestage Methoda Chemicalb
Reported
LC50/EC50
(total μg/L)c
Reported
LC50/EC50
(dissolved μg/L)d
BLM
Data
Label
BLM
Normalized
LC50/EC50
(μg/L)e
Species
Mean Acute
Value
(μg/L)f Reference
Bay scallop,
Argopecten irradians
Juvenile,
21.2 mm R, U C 29 24.30 32 15.35 15.35 Nelson et al. 1988
Pacific oyster,
Crassostrea gigas
Adult,
13-17 cm F, M S 560.00 - 88 662.0g - Okazaki 1976
Pacific oyster,
Crassostrea gigas Embryo S, U C 11.5 9.640 89 4.918 -
Coglianese and Martin
1981
Pacific oyster,
Crassostrea gigas Embryo S,M C 12.06 10.96 90 6.871 - Harrison et al. 1981
Pacific oyster,
Crassostrea gigas Embryo S, M C 12 10.91 93 12.88 - Knezovich et al. 1981
Pacific oyster,
Crassostrea gigas Embryo S, U S 5.3 4.440 94 2.237 - Martin et al. 1981
Pacific oyster,
Crassostrea gigas Embryo S, M Copper 25.8 23.45 96 50.05 -
S.R. Hansen &
Associates 1992
Pacific oyster,
Crassostrea gigas Embryo S, M Copper 30.5 27.72 97 59.35 11.94
S.R. Hansen &
Associates 1992
Eastern oyster,
Crassostrea virginica Embryo S, U C 15.1 12.65 106 6.699 -
MacInnes and
Calabrese 1978
Eastern oyster,
Crassostrea virginica Embryo S, U C 18.7 15.67 107 8.284 -
MacInnes and
Calabrese 1978
Eastern oyster,
Crassostrea virginica Embryo S, U C 18.3 15.34 108 8.110 -
MacInnes and
Calabrese 1978
Eastern oyster,
Crassostrea virginica Embryo S, M N - 11.2 109 14.40 - Arnold et al. 2010a
Eastern oyster,
Crassostrea virginica Embryo S, M N - 22.4 110 8.791 - Arnold et al. 2010a
Eastern oyster,
Crassostrea virginica Embryo S, M N - 30.7 111 7.994 - Arnold et al. 2010a
Eastern oyster,
Crassostrea virginica Embryo S, M N - 40.7 112 7.259 8.537 Arnold et al. 2010a
Coot clam,
Mulinia lateralis Embryo R, M S 25.2 21 286 14.84 -
Science Applications
International
Corporation 1993
Coot clam,
Mulinia lateralis Embryo R, M S 19.1 14.9 287 10.49 -
Science Applications
International
Corporation 1993

A-16
Species
Organism
Age, Size or
Lifestage Methoda Chemicalb
Reported
LC50/EC50
(total μg/L)c
Reported
LC50/EC50
(dissolved μg/L)d
BLM
Data
Label
BLM
Normalized
LC50/EC50
(μg/L)e
Species
Mean Acute
Value
(μg/L)f Reference
Coot clam,
Mulinia lateralis Embryo R, M S 18.4 17.3 288 12.12 -
Science Applications
International
Corporation 1993
Coot clam,
Mulinia lateralis Embryo R, M S 18.6 16.9 289 11.70 -
Science Applications
International
Corporation 1993
Coot clam,
Mulinia lateralis Embryo R, M S 18.9 19.3 290 13.49 -
Science Applications
International
Corporation 1993
Coot clam,
Mulinia lateralis Embryo R, M S 18.4 17.4 291 12.09 12.38
Science Applications
International
Corporation 1993
Clam,
Rangia cuneata - S, U S 8,000 6,704 526 66,022 - Olson and Harrel 1973
Clam,
Rangia cuneata - S, U S 7,400 6,201 527 28,918 43,694 Olson and Harrel 1973
Surf clam,
Spisula solidissima
Juvenile,
15.9 mm R, U C 51 42.74 536 28.35 28.35 Nelson et al. 1988
Hard clam,
Mercenaria mercenaria
Larva,
160-180 µm S, U S 398.2 333.7 274 350.2 350.2 Becerra-Huencho 1984
Softshell clam,
Mya arenaria
38-49 mm,
3.6-6.0 g S, U C 39 32.68 293 23.03 23.03 Eisler 1977
Squid,
Loligo opalescens
Post-hatch
larva S, M C 309 280.9 243 222.9 222.9 Dinnel et al. 1989
Copepod,
Pseudodiaptomus coronatus - S, U C 235.4 197.3 509 127.8 - Gentile 1982
Copepod,
Pseudodiaptomus coronatus - S, U - 138 115.6 510 62.64 -
Gentile and Cardin
1982
Copepod,
Pseudodiaptomus coronatus Adult S, U C 235.4 197.3 511 129.5 101.2
Lussier and Cardin
1985
Copepod,
Eurytemora affinis - S, U C 928.0 - 151 1,361g - Gentile 1982

A-17
Species
Organism
Age, Size or
Lifestage Methoda Chemicalb
Reported
LC50/EC50
(total μg/L)c
Reported
LC50/EC50
(dissolved μg/L)d
BLM
Data
Label
BLM
Normalized
LC50/EC50
(μg/L)e
Species
Mean Acute
Value
(μg/L)f Reference
Copepod,
Eurytemora affinis - S, U - 526.0 - 152 632.5g -
Gentile and Cardin
1982
Copepod,
Eurytemora affinis Nauplii, 24 hr R, M N 30.6 27.82 153 14.27 - Sullivan et al. 1983
Copepod,
Eurytemora affinis Nauplii, 24 hr R, M N 31.1 28.27 154 14.50 - Sullivan et al. 1983
Copepod,
Eurytemora affinis Nauplii, 24 hr R, M N 28.7 26.09 155 13.36 - Sullivan et al. 1983
Copepod,
Eurytemora affinis Nauplii, 24 hr R, M N 7.5 6.82 156 3.453 - Sullivan et al. 1983
Copepod,
Eurytemora affinis Nauplii, 24 hr R, M N 33.7 30.63 157 15.74 - Sullivan et al. 1983
Copepod,
Eurytemora affinis Nauplii, 24 hr S, M C - 69.4 158 22.99 - Hall et al. 1997
Copepod,
Eurytemora affinis Nauplii, 24 hr S, M C - 71 161 28.51 - Hall et al. 2008
Copepod,
Eurytemora affinis Nauplii, 24 hr S, M C - 104 162 54.19 - Hall et al. 2008
Copepod,
Eurytemora affinis Nauplii, 24 hr S, M C - 67.6 163 44.69 - Hall et al. 2008
Copepod,
Eurytemora affinis Nauplii, 24 hr S, M C - 58.1 164 45.39 - Hall et al. 2008
Copepod,
Eurytemora affinis Nauplii, 24 hr S, M C - 76.2 165 37.25 - Hall et al. 2008
Copepod,
Eurytemora affinis Nauplii, 24 hr S, M C - 108 166 34.92 - Hall et al. 2008
Copepod,
Eurytemora affinis Nauplii, 24 hr S, M C - 111 167 24.40 - Hall et al. 2008
Copepod,
Eurytemora affinis Nauplii, 24 hr S, M C - 166 168 23.81 22.44 Hall et al. 2008
Copepod,
Acartia clausi - S, U C 48.80 40.89 1 21.15 - Gentile 1982
Copepod,
Acartia clausi - S, U - 52.00 43.58 2 22.59 21.86
Gentile and Cardin
1982
Copepod,
Acartia tonsa - S, U C 17 14.25 4 8.367 -
Sosnowski and Gentile
1978
Copepod,
Acartia tonsa - S, U C 55 46.09 5 28.36 -
Sosnowski and Gentile
1978

A-18
Species
Organism
Age, Size or
Lifestage Methoda Chemicalb
Reported
LC50/EC50
(total μg/L)c
Reported
LC50/EC50
(dissolved μg/L)d
BLM
Data
Label
BLM
Normalized
LC50/EC50
(μg/L)e
Species
Mean Acute
Value
(μg/L)f Reference
Copepod,
Acartia tonsa - S, U C 31 25.98 6 13.31 -
Sosnowski and Gentile
1978
Copepod,
Acartia tonsa - S, U - 17 14.25 7 7.262 -
Gentile and Cardin
1982
Copepod,
Acartia tonsa Mixed ages R, M C - 41.80 734 609.2g - Monteiro et al. 2013
Copepod,
Acartia tonsa Mixed ages R, M C - 67.40 735 533.7g - Monteiro et al. 2013
Copepod,
Acartia tonsa Mixed ages R, M C - 108.7 736 470.8g 12.31 Monteiro et al. 2013
Copepod,
Amphiascoides atopus Adult, female S, M C 334.24 303.8 737 1,192 - Caramujo et al. 2012
Copepod,
Amphiascoides atopus Adult, female S, M C 538.67 489.7 738 1,905 - Caramujo et al. 2012
Copepod,
Amphiascoides atopus Adult, female S, M C 741.83 674.3 739 2,614 - Caramujo et al. 2012
Copepod,
Amphiascoides atopus Adult, female S, M C 857.19 779.2 740 3,017 2,057 Caramujo et al. 2012
Copepod,
Tigriopus californicus Egg/Embryo R, U N 229 191.9 557 108.6g - O'Brien et al. 1988
Copepod,
Tigriopus californicus
Nauplii,
Stage 1 R, U N 76 63.69 558 31.78g - O'Brien et al. 1988
Copepod,
Tigriopus californicus
Nauplii,
Stage 2 R, U N 19 15.92 559 7.847 - O'Brien et al. 1988
Copepod,
Tigriopus californicus
Nauplii,
Stage 3 R, U N 159 133.24 560 69.79g - O'Brien et al. 1988
Copepod,
Tigriopus californicus
Nauplii,
Stage 4 R, U N 184 154.19 561 82.66g - O'Brien et al. 1988
Copepod,
Tigriopus californicus
Nauplii,
Stage 5 R, U N 261 218.72 562 129.6g - O'Brien et al. 1988
Copepod,
Tigriopus californicus
Nauplii,
Stage 6 R, U N 305 255.59 563 161.9g - O'Brien et al. 1988
Copepod,
Tigriopus californicus
Copepodite,
Stage 1 R, U N 375 314.25 564 218.7g - O'Brien et al. 1988
Copepod,
Tigriopus californicus
Copepodite,
Stage 2 R, U N 496 415.65 565 322.7g - O'Brien et al. 1988
Copepod,
Tigriopus californicus
Copepodite,
Stage 3 R, U N 413 346.09 566 250.9g - O'Brien et al. 1988

A-19
Species
Organism
Age, Size or
Lifestage Methoda Chemicalb
Reported
LC50/EC50
(total μg/L)c
Reported
LC50/EC50
(dissolved μg/L)d
BLM
Data
Label
BLM
Normalized
LC50/EC50
(μg/L)e
Species
Mean Acute
Value
(μg/L)f Reference
Copepod,
Tigriopus californicus
Copepodite,
Stage 4 R, U N 394 330.2 567 234.7g - O'Brien et al. 1988
Copepod,
Tigriopus californicus
Copepodite,
Stage 5 R, U N 394 330.2 568 234.7g - O'Brien et al. 1988
Copepod,
Tigriopus californicus Adult R, U N 762 638.56 569 557.4g 7.847 O'Brien et al. 1988
Copepod,
Tisbe furcata
Newborn
nauplii R, M S - 178 571 99.77 99.77 Bechmann 1994
Copepod,
Nitokra spinipes Adult S, U C 1,800 1,508 478 2,781 - Bengtsson 1978
Copepod,
Nitokra spinipes - S, U C 2,100 1,760 772 4,961 3,715 Ytreberg et al. 2010
Barnacle,
Balanus amphitrite
Nauplii, Stage
2 S, U S 145 121.5 44 64.73 - Qiu et al. 2005
Barnacle,
Balanus amphitrite
Nauplii, Stage
4 S, U S 156 130.7 45 70.50 - Qiu et al. 2005
Barnacle,
Balanus amphitrite
Nauplii, Stage
6 S, U S 213 178.5 46 105.6 - Qiu et al. 2005
Barnacle,
Balanus amphitrite
Nauplii, Stage
2 S, U S 720 603.4 741 791.1 139.7 Prato et al. 2012
Barnacle,
Balanus eburneus
Nauplii, Stage
2 S, U S 750 628.5 742 835.4 835.4 Prato et al. 2012
Mysid,
Americamysis bahia 24 hr F, M N 181 164.5 16 96.60 - Lussier et al. 1985
Mysid,
Americamysis bahia 2-30 hr R, M S 209 164.0 17 153.7h -
Science Applications
International
Corporation 1993
Mysid,
Americamysis bahia
Juvenile,
<24 hr R, U C 72.32 60.60 18 32.34h - Cripe 1994
Mysid,
Americamysis bahia <48 hr S, M - 110 99.99 19 99.37h - Ho et al. 1999
Mysid,
Americamysis bahia <48 hr S, M - 250 227.3 20 189.0h - Ho et al. 1999
Mysid,
Americamysis bahia <48 hr S, M - 360 327.2 21 39.29h 96.60 Ho et al. 1999

A-20
Species
Organism
Age, Size or
Lifestage Methoda Chemicalb
Reported
LC50/EC50
(total μg/L)c
Reported
LC50/EC50
(dissolved μg/L)d
BLM
Data
Label
BLM
Normalized
LC50/EC50
(μg/L)e
Species
Mean Acute
Value
(μg/L)f Reference
Mysid,
Americamysis bigelowi 24 hr F, M N 141 128.2 23 70.57 70.57 Gentile 1982
Mysid,
Holmesimysis costata <3 d S, M C 27 24.54 223 12.08 - Hunt et al. 1989
Mysid,
Holmesimysis costata Juvenile, 3 d S, M C 17 15.45 224 7.588 9.572 Martin et al. 1989
Mysid,
Neomysis mercedis Neonate, >5 d F, M S 28.27 25.7 474 16.73 - Brandt et al. 1993
Mysid,
Neomysis mercedis
Juvenile,
>15 d F, M S 87.58 79.61 475 52.85 - Brandt et al. 1993
Mysid,
Neomysis mercedis
Juvenile,
>15 d F, M S 63.7 57.9 476 39.19 32.60 Brandt et al. 1993
Isopod,
Sphaeroma serratum - S, U S 1,980 1,659 534 1,672 1,672 Bat et al. 1999a
Amphipod,
Corophium volutator Adult, 4-7 mm S, U S 20,740 17,380 79 81,550 81,550 Bat et al. 1998
Amphipod,
Echinogammarus olivii - S, U S 250 209.5 137 130.1 130.1 Bat et al. 1999a
Amphipod,
Gammarus duebeni
Adult,
60-90 mg R, U C >10,000 >8,380 185 >29,733 >29,733 Moulder 1980
Amphipod,
Allorchestes compressa - F, M S 480 436.3 14 515.7 515.7 Ahsanullah et al. 1988
Amphipod,
Elasmopus rapax
Juvenile,
0.54 mm R, U S 78 65.36 141 75.57 - Bao et al. 2008
Amphipod,
Elasmopus rapax Juvenile R, U S 77 64.53 142 74.97 75.27 Bao et al. 2011
Amphipod,
Orchomenella pinguis Adult R, U - 179.8 150.7 773 85.48 85.48 Bach et al. 2014

A-21
Species
Organism
Age, Size or
Lifestage Methoda Chemicalb
Reported
LC50/EC50
(total μg/L)c
Reported
LC50/EC50
(dissolved μg/L)d
BLM
Data
Label
BLM
Normalized
LC50/EC50
(μg/L)e
Species
Mean Acute
Value
(μg/L)f Reference
Pink shrimp,
Farfantepenaeus duorarum
Post-larva,
3-5 d R, U C 393.3 329.6 503 260.8 260.8 Cripe 1994
Tiger shrimp,
Penaeus monodon Post-larva R, U C 660 553.1 743 746.8 - Kumar 2012
Tiger shrimp,
Penaeus monodon
Post-larva,
Stage 12 R, M C - 950.0 774 1,498 1,058 Rajkumar 2012
Whiteleg shrimp,
Litopenaeus vannamei 1.2 cm R, U C 37,000 4,200 239 3,014 3,014
Frias-Espericueta et al.
2003
Shrimp,
Metapenaeus sp.
2.45 cm,
3.905 g R, U S 220 184.36 276 106.8 106.8
Kidwai and Ahmed
1999
Decapod,
Palaemon elegans - S, U S 2,520 2,112 487 2,163 2,163 Bat et al. 1999a
Grass shrimp,
Palaemonetes pugio Embryo, 9 d S, U C 860.3 720.9 489 2,590 2,590
Rayburn and Fisher
1999
Shrimp,
Crangon crangon Larva, 1-3 d S, U S 330 276.5 85 255.4 255.4 Connor 1972
Lobster,
Homarus americanus
Larva stage 1,
24 hr S, U N 48 40.22 226 28.37 28.37
Johnson and Gentile
1979
Dungeness crab,
Cancer magister Larva S, U S 49 41.06 68 20.60 - Martin et al. 1981
Dungeness crab,
Cancer magister Zoea S, M C 96 87.26 69 61.93 35.72 Dinnel et al. 1989
Blue crab,
Callinectes sapidus
Juvenile,
8.3 cm R, M C - 337.2 65 6,403 - Martins et al. 2011
Blue crab,
Callinectes sapidus
Juvenile,
8.3 cm R, M C - 3,365 66 12,583 8,976 Martins et al. 2011
Shore crab,
Carcinus maenas Larva, 1-3 d S, U S 600 502.8 71 730.8 730.8 Connor 1972

A-22
Species
Organism
Age, Size or
Lifestage Methoda Chemicalb
Reported
LC50/EC50
(total μg/L)c
Reported
LC50/EC50
(dissolved μg/L)d
BLM
Data
Label
BLM
Normalized
LC50/EC50
(μg/L)e
Species
Mean Acute
Value
(μg/L)f Reference
Sand crab,
Emerita analoga
Immature,
8-10 mm S, U C 2,000 1,676 144 2,492 2,492
Valdovinos and Zuniga
2002
Horseshoe crab,
Limulus polyphemus
Embryo,
Stage 20,
Sandy Hook
R, U S 2,000 1,676 775 3,473 Botton et al. 1998
Horseshoe crab,
Limulus polyphemus
Embryo,
Stage 20,
Delaware Bay
R, U S 171,000 143,298 776 289,605 Botton et al. 1998
Horseshoe crab,
Limulus polyphemus
Larva,
Sandy Hook R, U S 637,000 533,806 777 1,066,174g 31,716 Botton et al. 1998
Bristle star,
Ophionereis dubia 0.14 g R, U S 960 804.48 483 589.5 589.5
Kidwai and Ahmed
1999
Sea urchin,
Arbacia punctulata Embryo S, M S 30 27 778 13.85 13.85 Nelson et al. 2010
Green sea urchin,
Strongylocentrotus droebachiensis Embryo S, M C 21 19.09 538 13.29 13.29 Dinnel et al. 1989
Purple sea urchin,
Strongylocentrotus purpuratus Embryo S, M C 6.3 5.73 543 3.966 - Dinnel et al. 1989
Purple sea urchin,
Strongylocentrotus purpuratus Embryo S, M S 14.38 13.52 547 8.030 - City of San Jose 1998
Purple sea urchin,
Strongylocentrotus purpuratus Embryo S, M S 15.05 12.77 548 7.593 - City of San Jose 1998
Purple sea urchin,
Strongylocentrotus purpuratus Embryo S, M S - 14.3 549 5.768 - Rosen et al. 2008
Purple sea urchin,
Strongylocentrotus purpuratus Embryo S, M N - 14.8 550 12.41 - Arnold et al. 2010a
Purple sea urchin,
Strongylocentrotus purpuratus Embryo S, M N - 24.3 551 11.66 - Arnold et al. 2010a
Purple sea urchin,
Strongylocentrotus purpuratus Embryo S, M N - 30.2 552 8.661 - Arnold et al. 2010a
Purple sea urchin,
Strongylocentrotus purpuratus Embryo S, M N - 46.4 553 9.320 7.971 Arnold et al. 2010a
Sand dollar,
Dendraster excentricus Embryo S, M C 33 30 125 21.43 - Dinnel et al. 1989

A-23
Species
Organism
Age, Size or
Lifestage Methoda Chemicalb
Reported
LC50/EC50
(total μg/L)c
Reported
LC50/EC50
(dissolved μg/L)d
BLM
Data
Label
BLM
Normalized
LC50/EC50
(μg/L)e
Species
Mean Acute
Value
(μg/L)f Reference
Sand dollar,
Dendraster excentricus Embryo S, M N - 18.9 129 15.89 - Arnold et al. 2010a
Sand dollar,
Dendraster excentricus Embryo S, M N - 36.4 130 17.57 - Arnold et al. 2010a
Sand dollar,
Dendraster excentricus Embryo S, M N - 46.2 131 13.31 - Arnold et al. 2010a
Sand dollar,
Dendraster excentricus Embryo S, M N - >75.80 132 >15.32 16.49 Arnold et al. 2010a
Long-spined sea urchin,
Diadema antillarum Adult, ~1 yr F, M S - 25 134 12.58 12.58 Bielmyer et al. 2005b
Coho salmon,
Oncorhynchus kisutch
Smolt,
132 mm F, M C 601 546.3 481 445.6 445.6 Dinnel et al. 1989
Mangrove killifish,
Rivulus marmoratus 4-6 week F, M S - 1,250 529 7,419 - Lin and Dunson 1993
Mangrove killifish,
Rivulus marmoratus 4-6 week F, M S - 1,610 530 9,563 8,423 Lin and Dunson 1993
Leon Springs pupfish,
Cyprinodon bovinus 0.42 g S, U S 1306 1094.4 781 5,304
Sappington et al. 2001;
Dwyer et al. 2005;
Mayer et al. 2008
Leon Springs pupfish,
Cyprinodon bovinus 0.42 g S, U S >204 >171.0 782 >114.1 778.0
Sappington et al. 2001;
Dwyer et al. 2005;
Mayer et al. 2008
Sheepshead minnow,
Cyprinodon variegatus
Larva,
>24 hr F, M S/C 368 334.5 120 337.2 - Hughes et al. 1989
Sheepshead minnow,
Cyprinodon variegatus
Juvenile,
0.24 g S, U S 630 527.9 779 1,946h -
Sappington et al. 2001;
Dwyer et al. 2005;
Mayer et al. 2008
Sheepshead minnow,
Cyprinodon variegatus
Juvenile,
0.24 g S, U S >204 >171.0 780 >114.1h 337.2
Sappington et al. 2001;
Dwyer et al. 2005;
Mayer et al. 2008
Mummichog,
Fundulus heteroclitus 2.7 g S, U S 3,100 2,598 172 10,647g - Dorfman 1977
Mummichog,
Fundulus heteroclitus 2.7 g S, U S 2,000 1,676 173 3,452g - Dorfman 1977

A-24
Species
Organism
Age, Size or
Lifestage Methoda Chemicalb
Reported
LC50/EC50
(total μg/L)c
Reported
LC50/EC50
(dissolved μg/L)d
BLM
Data
Label
BLM
Normalized
LC50/EC50
(μg/L)e
Species
Mean Acute
Value
(μg/L)f Reference
Mummichog,
Fundulus heteroclitus 2.7 g S, U C 2,300 1,927 174 7,401g - Dorfman 1977
Mummichog,
Fundulus heteroclitus 2.7 g S, U C 400 335.2 175 386.2g - Dorfman 1977
Mummichog,
Fundulus heteroclitus 4-6 week F, M S - 1,690 176 10,040g - Lin and Dunson 1993
Mummichog,
Fundulus heteroclitus 7 d R, M S ~360.00 ~327.20 178 578.9 - Grosell et al. 2007
Mummichog,
Fundulus heteroclitus 7 d R, M S ~640.00 ~581.80 179 1,837 - Grosell et al. 2007
Mummichog,
Fundulus heteroclitus 7 d R, M S >937.00 >851.70 180 >2,345 - Grosell et al. 2007
Mummichog,
Fundulus heteroclitus 7 d R, M S ~500.00 ~454.50 181 476.9 - Grosell et al. 2007
Mummichog,
Fundulus heteroclitus 7 d R, M S ~340.00 ~309.10 182 190.8 - Grosell et al. 2007
Mummichog,
Fundulus heteroclitus 7 d R, M S 294 267.25 183 130.6 556.3 Grosell et al. 2007
Topsmelt,
Atherinops affinis Larva, 8 d S, M C 288 261.8 36 249.8 - Anderson et al. 1991
Topsmelt,
Atherinops affinis Larva, 8 d S, M C 212 192.7 37 145.5 - Anderson et al. 1991
Topsmelt,
Atherinops affinis Larva, 8 d S, M C 235 213.6 38 174.1 185.0 Anderson et al. 1991
Inland silverside,
Menidia beryllina - S, M S 115.41 104.9 262 55.31 - TOXSCAN, Inc. 1991a
Inland silverside,
Menidia beryllina - S, M S 63.05 57.31 263 29.97 - TOXSCAN, Inc. 1991b
Inland silverside,
Menidia beryllina - S, M S 123 111.8 264 58.77 46.01 TOXSCAN, Inc. 1991c
Atlantic silverside,
Menidia menidia Larva, 3 wk F, M N 66.6 60.54 266 42.95 - Cardin 1982; 1985
Atlantic silverside,
Menidia menidia Larva, 1 wk F, M N 216.5 196.8 267 176.4 - Cardin 1982; 1985
Atlantic silverside,
Menidia menidia Larva, 3 d F, M N 97.6 88.72 268 64.33 - Cardin 1982; 1985

A-25
Species
Organism
Age, Size or
Lifestage Methoda Chemicalb
Reported
LC50/EC50
(total μg/L)c
Reported
LC50/EC50
(dissolved μg/L)d
BLM
Data
Label
BLM
Normalized
LC50/EC50
(μg/L)e
Species
Mean Acute
Value
(μg/L)f Reference
Atlantic silverside,
Menidia menidia Larva, 2 wk F, M N 155.9 141.7 269 112.1 85.97 Cardin 1982; 1985
Tidewater silverside,
Menidia peninsulae Larva, 19 d S, U N 140 117.3 271 67.46 - Hansen 1983
Tidewater silverside,
Menidia peninsulae 19 d S, U - 141 118.2 272 68.00 67.73 D'Asaro 1985
Striped mullet,
Mugil cephalus
Fingerling,
1.5 cm, 0.13 g R, M C - 2,740 744 4,898 4,898 Rajkumar 2012
Shiner perch,
Cymatogaster aggregata Adult, 97 mm F, M C 418 380.0 118 611.0 611.0 Dinnel et al. 1989
Mud-skipper,
Boleophthalmus sp.
2.84 cm, 0.13
g R, U S 3,710 3,109 48 3,690 3,690
Kidwai and Ahmed
1999
Striped bass,
Morone saxatilis 45.6-60.6 mm F, M C 8,400 7,636 280 74,083g - Hetrick et al. 1982
Striped bass,
Morone saxatilis 70 d S, U S 69.4 58.16 281 229.9 - Palawski et al. 1985
Striped bass,
Morone saxatilis
Fingerling,
1-2 mo. S, U S 2,680 2,246 282 656.4g -
Reardon and Harrell
1990
Striped bass,
Morone saxatilis
Fingerling,
1-2 mo. S, U S 8,080 6,771 283 2,207g -
Reardon and Harrell
1990
Striped bass,
Morone saxatilis
Fingerling,
1-2 mo. S, U S 7,880 6,603 284 16,706g 229.9
Reardon and Harrell
1990
Spot,
Leiostomus xanthurus
Adult,
0.5-0.6 g S, U N 280 234.6 236 189.3 - Hansen 1983
Spot,
Leiostomus xanthurus 0.5-0.6 g S, U - 282 236.3 237 191.9 190.6 D'Asaro 1985
Atlantic croaker,
Micropogonias undulatus 16-19 cm S, U C 5,660 4,743 278 8,863 8,863 Steele 1983
Sheepshead,
Archosargus probatocephalus 18-21 cm S, U C 1,140 955.3 30 1,534 1,534 Steele 1983

A-26
Species
Organism
Age, Size or
Lifestage Methoda Chemicalb
Reported
LC50/EC50
(total μg/L)c
Reported
LC50/EC50
(dissolved μg/L)d
BLM
Data
Label
BLM
Normalized
LC50/EC50
(μg/L)e
Species
Mean Acute
Value
(μg/L)f Reference
Pinfish,
Lagodon rhomboides 13-17 cm S, U C 2,750 2,305 234 4,145 4,145 Steele 1983
Thornfish,
Terapon jarbua
Juvenile,
10 cm, 25 g R, U - 2,500 2,095 555 2,512 2,512 Vijayavel et al. 2006
Pompano,
Trachinotus carolinus
Juvenile,
0.25 g, 25 mm S, U S 557.3 467.0 573 920.9 -
Birdsong and Avault
1971
Pompano,
Trachinotus carolinus
Juvenile,
0.25 g, 25 mm S, U S 597.2 500.5 574 770.0 -
Birdsong and Avault
1971
Pompano,
Trachinotus carolinus
Juvenile,
0.25 g, 25 mm S, U S 796.2 667.2 575 947.0 875.7
Birdsong and Avault
1971
Summer flounder,
Paralichthys dentatus
Juvenile, 46 d,
18-22 mm S, M S 610 586.0 499 2,265h - CH2M Hill 1999a
Summer flounder,
Paralichthys dentatus
Juvenile, 48 d,
20-24 mm S, M S 1,029 928.0 500 3,990h - CH2M Hill 1999a
Summer flounder,
Paralichthys dentatus
Juvenile, 57 d,
24-28 mm S, M S 606 597.0 501 1,775h - CH2M Hill 1999a
Summer flounder,
Paralichthys dentatus
Embryo -
Early cleavage F, M C 16.3 14.82 496 10.36 - Cardin 1982; 1985
Summer flounder,
Paralichthys dentatus
Embryo -
Early cleavage F, M C 11.9 10.82 497 7.556 - Cardin 1982; 1985
Summer flounder,
Paralichthys dentatus
Embryo -
Blastula F, M C 111.8 - 498 75.97g 8.848 Cardin 1982; 1985
Winter flounder,
Pseudopleuronectes americanus Blastula F, M N 167.3 152.1 513 129.8 - Cardin 1982; 1985
Winter flounder,
Pseudopleuronectes americanus Blastula F, M N 158 143.6 514 121.0 - Cardin 1982; 1985
Winter flounder,
Pseudopleuronectes americanus
Blastula -
Embryo F, M C 173.7 157.9 515 135.7 - Cardin 1982; 1985
Winter flounder,
Pseudopleuronectes americanus
Fertilization/
Pre-cleavage F, M C 132.8 120.7 516 94.46 - Cardin 1982; 1985
Winter flounder,
Pseudopleuronectes americanus
Blastula -
Embryo F, M N 148.2 134.7 517 109.3 - Cardin 1982; 1985
Winter flounder,
Pseudopleuronectes americanus
Early cleavage
- Embryo F, M N 98.2 89.26 518 65.94 106.4 Cardin 1982; 1985

A-27
Species
Organism
Age, Size or
Lifestage Methoda Chemicalb
Reported
LC50/EC50
(total μg/L)c
Reported
LC50/EC50
(dissolved μg/L)d
BLM
Data
Label
BLM
Normalized
LC50/EC50
(μg/L)e
Species
Mean Acute
Value
(μg/L)f Reference
Gulf toadfish,
Opsanus beta 22-53 g F, M S >21,607 >19,641 485 >33,000 >33,000 Grosell et al. 2004
Cabezon,
Scorpaenichthys marmoratus
Post-hatch
larva S, M C 95 86.36 532 64.20 64.20 Dinnel et al. 1989
Fat snook,
Centropomus parallelus
Juvenile, 3.5
g, 6.8 cm S, M C 1,880 1,709 751 4,428 4,428 Oliveria et al. 2014
a S=static, R=renewal, F=flow-through, U=unmeasured, M=measured.
b S=copper sulfate, N=copper nitrate, C=copper chloride.
c Values in this column are total copper LC50 or EC50 values as reported by author.
d Values in this column are dissolved copper LC50 or EC50 values either reported by the author, or if the author did not report a dissolved value, then a conversion factor (CF)
was applied to the total copper LC50 to estimate dissolved copper values (If copper was unmeasured, the total copper was multiplied by 0.838, if it was measured, it was
multiplied by 0.909).
e Normalization Chemistry (only Temp, pH, DOC, and Salinity are needed for the model, but values for other ions are shown for reference).
Temperature
(°C) pH
DOC
(mg/L)
Salinity
(ppt)
Ca
(mg/L)
Mg
(mg/L)
Na
(mg/L)
K
(mg/L)
SO4
(mg/L)
Cl
(mg/L)
Alkalinity
(mg/L)
22 8 1.0 32 367.2 1144.0 9607.5 355.7 2417.0 17244.3 89.8
f Bolded BLM Normalized values were used in the SMAV calculation.
g Value not used in the SMAV calculation, only the most sensitive life stage of the species.
h Value not used in the SMAV calculation because flow-through measured tests available.

B-1
Appendix B Acceptable Chronic Toxicity Data

B-2
Appendix Table B-1. Acceptable Estuarine/Marine Chronic Toxicity Data.
Species Testa Chemicalb Endpoint
Salinity
(g/kg)
Chronic
Limits
(μg/L)
Chronic
Value
(total μg/L)
Chronic Value
(dissolved μg/L)
BLM
Data
Label
BLM
Normalized
Chronic Value
(Dissolved μg/L)c Reference
Rotifer,
Brachionus plicatilis LC N
Intrinsic rate of
rotifer population 15 6.1-10.3 -
10.9
(EC20) C1 13.23 Arnold et al. 2010b
Sheepshead minnow,
Cyprinodon variegatus ELS C Growth 30 172-362 249.5 226.8 C2 204.1 Hughes et al. 1989
a LC=life-cycle; PLC=partial life-cycle; ELS=early life stage.
b S=copper sulfate, N=copper nitrate, C=copper chloride.
c Normalization Chemistry (only Temp, pH, DOC, and Salinity are needed for the model, but values for other ions are shown for reference).
Temperature
(°C) pH
DOC
(mg/L)
Salinity
(ppt)
Ca
(mg/L)
Mg
(mg/L)
Na
(mg/L)
K
(mg/L)
SO4
(mg/L)
Cl
(mg/L)
Alkalinity
(mg/L)
22 8 1.0 32 367.2 1144.0 9607.5 355.7 2417.0 17244.3 89.8
Appendix Table B-2. Acute-Chronic Ratios.
Species
Hardness
(mg/L as
CaCO3)
Acute Value
(μg/L)
Chronic Value
(μg/L)
Acute to Chronic
Ratio Reference
Species Mean
ACR
Used in
FACR
calculation
FRESHWATER
Snail,
Campeloma decisum 35-55 1,673a 8.73 191.6 Arthur and Leonard 1970
171.2 Snail,
Campeloma decisum 35-55 1,673a 10.94 153.0 Arthur and Leonard 1970
Pond snail,
Lymnaea stagnalis 123 24.9 5.307 4.692 Ng et al. 2011 4.692
Oyster mussel,
Epioblasma capsaeformis 162 26 7.530 3.453 Wang et al. 2007b 3.453
Fatmucket,
Lampsilis siliquoidea 165 34 7.201 4.722 Wang et al. 2007b 4.722

B-3
Species
Hardness
(mg/L as
CaCO3)
Acute Value
(μg/L)
Chronic Value
(μg/L)
Acute to Chronic
Ratio Reference
Species Mean
ACR
Used in
FACR
calculation
Rainbow mussel,
Villosa iris 171 27 7.679 3.516 Wang et al. 2007b
2.733
Rainbow mussel,
Villosa iris
101
(DOC=0.5) 15 8.3 1.807 Wang et al. 2011a
Rainbow mussel,
Villosa iris
100
(DOC=10) 72 35 2.057 Wang et al. 2011a
Rainbow mussel,
Villosa iris
98
(DOC=2.5) 32 7.5 4.267 Wang et al. 2011a
Cladoceran,
Ceriodaphnia dubia 179 28.42b 7.9 3.597 Belanger et al. 1989
3.268 x
Cladoceran,
Ceriodaphnia dubia 94.1 63.33b 19.36 3.271 Belanger et al. 1989
Cladoceran,
Ceriodaphnia dubia 57 13.4 24.5 0.5469g Oris et al. 1991
Cladoceran,
Ceriodaphnia dubia - 17.974c 9.17 1.960 Carlson et al. 1986
Cladoceran,
Ceriodaphnia dubia 54-72 4.16 29.34 0.1418g Harmon et al. 2003
Cladoceran,
Ceriodaphnia dubia 82.4 18 3.641 4.944 Cooper et al. 2009
Cladoceran,
Daphnia ambigua 54-72 6.53 22.38 0.2918g Harmon et al. 2003 -
Cladoceran,
Daphnia magna 51 26 12.58 2.067
Chapman et al.
(Manuscript)
3.419 x Cladoceran,
Daphnia magna 104 33.76d 19.89 1.697
Chapman et al.
(Manuscript)
Cladoceran,
Daphnia magna 211 69 6.06 11.39
Chapman et al.
(Manuscript)
Cladoceran,
Daphnia pulex 57.5 25.737 2.83 9.094 Winner 1985
4.814 x Cladoceran,
Daphnia pulex 115 27.6 7.07 3.904 Winner 1985
Cladoceran,
Daphnia pulex 230 28.79 9.16 3.143 Winner 1985
Rainbow trout,
Oncorhynchus mykiss 120 80 27.77 2.881 Seim et al. 1984 2.357 x

B-4
Species
Hardness
(mg/L as
CaCO3)
Acute Value
(μg/L)
Chronic Value
(μg/L)
Acute to Chronic
Ratio Reference
Species Mean
ACR
Used in
FACR
calculation
Rainbow trout,
Oncorhynchus mykiss 104 83 35.08 2.366 Besser et al. 2007
Rainbow trout,
Oncorhynchus mykiss 100 61.48h 32 1.921
Wang et al. 2014;
Ingersoll and Mebane
2014
Chinook salmon,
Oncorhynchus tshawytscha 20-45 33.1 5.92 5.591 Chapman 1975, 1982 5.591 x
White sturgeon,
Acipenser transmontanus 100 8.06 1.4 5.757
Wang et al. 2014;
Ingersoll and Mebane
2014
5.757 x
Mottled sculpin,
Cottus bairdii 102 45 28.47 1.581 Besser et al. 2007
2.075 x Mottled sculpin,
Cottus bairdii 104 12 4.408 2.722 Besser et al. 2007
Bluntnose minnow,
Pimephales notalus 172 - 230 231.9e 18 12.88
Horning and Neiheisel
1979 12.88
Fathead minnow,
Pimephales promelas 200 449.6i 12.86 34.96 Mount 1968
21.25
Fathead minnow,
Pimephales promelas 202 474.8j 19.72 24.08 Pickering et al. 1977
Fathead minnow,
Pimephales promelas 45 106.9f 9.38 11.40 Lind et al. 1978
Fathead minnow,
Pimephales promelas - 250 <61 >4.098k Scudder et al. 1988
Bluegill,
Lepomis macrochirus 21-40 1,100 27.15 40.52 Benoit 1975 40.52
Species
Salinity
(g/kg)
Acute Value
(μg/L)
Chronic Value
(μg/L)
Acute to Chronic
Ratio Reference
Species Mean
ACR
Used in
FACR
calculation
ESTUARINE/MARINE WATER
Rotifer,
Brachionus plicatilis 15
13.4
(unfed) 10.9 1.229 Arnold et al. 2010b
1.229
(unfed) x
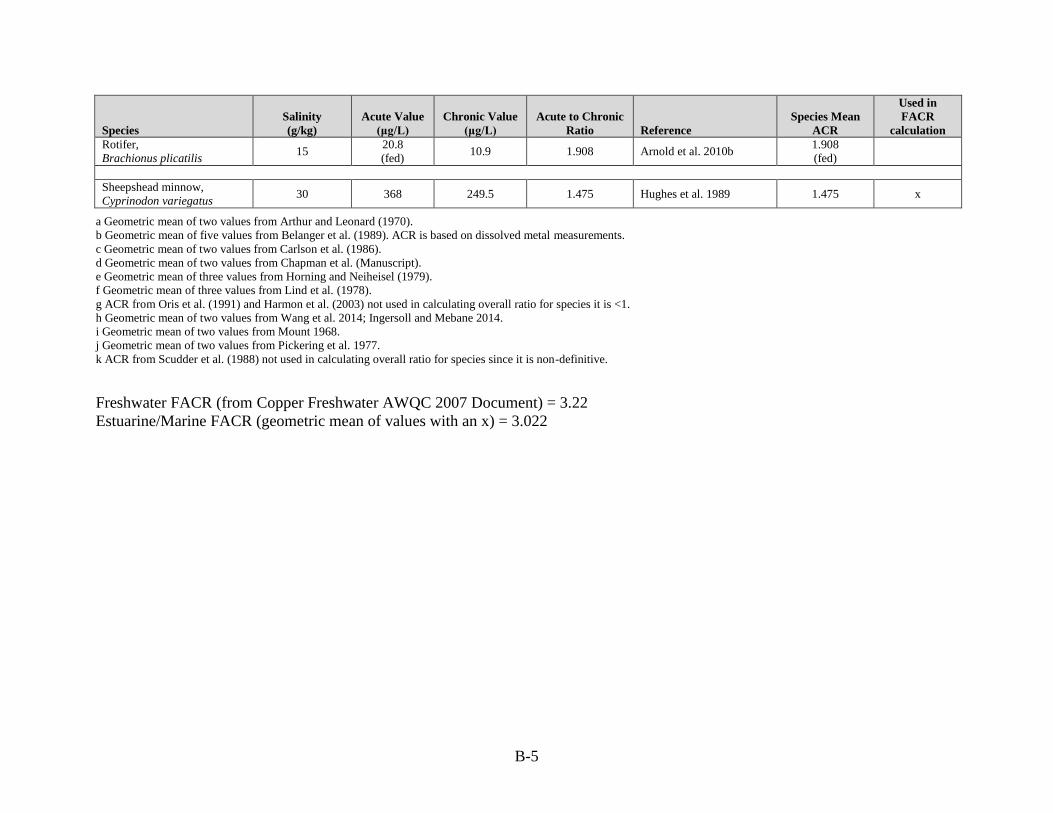
B-5
Species
Salinity
(g/kg)
Acute Value
(μg/L)
Chronic Value
(μg/L)
Acute to Chronic
Ratio Reference
Species Mean
ACR
Used in
FACR
calculation
Rotifer,
Brachionus plicatilis 15
20.8
(fed) 10.9 1.908 Arnold et al. 2010b
1.908
(fed)
Sheepshead minnow,
Cyprinodon variegatus 30 368 249.5 1.475 Hughes et al. 1989 1.475 x
a Geometric mean of two values from Arthur and Leonard (1970).
b Geometric mean of five values from Belanger et al. (1989). ACR is based on dissolved metal measurements.
c Geometric mean of two values from Carlson et al. (1986).
d Geometric mean of two values from Chapman et al. (Manuscript).
e Geometric mean of three values from Horning and Neiheisel (1979).
f Geometric mean of three values from Lind et al. (1978).
g ACR from Oris et al. (1991) and Harmon et al. (2003) not used in calculating overall ratio for species it is <1.
h Geometric mean of two values from Wang et al. 2014; Ingersoll and Mebane 2014.
i Geometric mean of two values from Mount 1968.
j Geometric mean of two values from Pickering et al. 1977.
k ACR from Scudder et al. (1988) not used in calculating overall ratio for species since it is non-definitive.
Freshwater FACR (from Copper Freshwater AWQC 2007 Document) = 3.22
Estuarine/Marine FACR (geometric mean of values with an x) = 3.022

C-1
Appendix C Estuarine/Marine Plant Toxicity Data

C-2
Appendix Table C-1. Estuarine/Marine Plant Toxicity Data.
Species Methoda Chemical
Salinity
(g/kg)
Duration
(days) Effect
Result
(total μg/L)
Result
(dissolved μg/L) Reference
Dinoflagellate,
Amphidinium carteri S, U
Copper
chloride 21 21 83% reduction in growth <50 Erickson et al. 1970
Dinoflagellate,
Cochlodinium polykrikoides S, U
Copper
sulfate - 3 EC50 12,740 Ebenezer and Ki 2012
Dinoflagellate,
Cochlodinium polykrikoides S, U
Copper
sulfate - 3 EC50 5,030 Ebenezer and Ki 2012
Dinoflagellate,
Gymnodinium splendens S, U
Copper
sulfate 31.6-33.3 5
LOEC
(growth) 20 18.18 Saifullah 1978
Dinoflagellate,
Prorocentrum micans S, U
Copper
sulfate 31.6-33.3 8
LOEC
(growth) 5 4.545 Saifullah 1978
Dinoflagellate,
Prorocentrum minimum S, U
Copper
sulfate 30-35 3
EC50
(biomass) 1,074 Guo and Ki 2012
Dinoflagellate,
Prorocentrum minimum S, U Copper - 3
EC50
(cell #) 1,070 Guo et al. 2012
Dinoflagellate,
Scrippsiella faeroense S, U
Copper
sulfate 31.6-33.3 5
LOEC
(growth) 5 4.545 Saifullah 1978
Dinoflagellate,
Simbiodinium microadriaticum S, M
Copper
sulfate
Full strength
seawater 23
46% reduction in growth
(significant) 40 Goh and Chou 1997
Dinoflagellate,
Simbiodinium microadriaticum S, M
Copper
sulfate
Full strength
seawater 23
26% reduction in growth (not
significant) 42 Goh and Chou 1997
Golden/brown flagellate,
Isochrysis sp. S, U
Copper
sulfate 36 4
IC50
(growth) 2 1.8 Garr 2012
Brown alga,
Hizikia fusiformis S, U
Copper
sulfate - 7
NOEC-LOEC
(relative growth rate) 25-50 Zhu et al. 2011
Cyanobacterium,
Cyanobium sp. S, M
Copper
sulfate 33 3
EC50
(cell #) 500
Alquezar and Anastasi
2013
Alga,
Platymonas helgolandica var.
tsingtaoensis
S, U Copper
sulfate - 1.5 hr
EC50
(% motile cells) 848.4 Zheng et al. 2012
Alga,
Platymonas subcordiformis S, U
Copper
sulfate - 1.5 hr
EC50
(% motile cells) 320.9 Zheng et al. 2012
Green alga,
Chlorella stigmatophora S, M
Copper
chloride 35 21
EC50
(cell volume) 70 Christensen et al. 1979
Green alga (zoospores),
Enteromorpha intestinalis S, U - - 5
EC50
(development to 2+ cell stage) 10 Fletcher 1989
Green alga,
Olisthodiscus luteus S, U
Copper
chloride 21 14 74% reduction in growth <50 Erickson et al. 1970
Alga,
Ulva pertusa S, U - 26-35 4
EC50
(chlorophyll fluorescence) 711 Kumar et al. 2009

C-3
Species Methoda Chemical
Salinity
(g/kg)
Duration
(days) Effect
Result
(total μg/L)
Result
(dissolved μg/L) Reference
Alga,
Ulva lactuca R, M
Copper
chloride 32 3
EC50
(growth) 127 Wendt et al. 2013
Diatom,
Odontella mobiliensis S, M
Copper
chloride 30 3
EC50
(growth) 298.4 Manimaran et al. 2012
Diatom,
Nitzschia closterium - - - 4
EC50
(growth) 33 Rosko and Rachlin 1975
Diatom,
Nitzschia thermalis S, U
Copper
sulfate 35.7 Several No growth 38.1 Metaxas and Lewis 1991
Diatom,
Skeletonema costatum S, U
Copper
chloride 21 14 58% reduction in growth 50 Erickson et al. 1970
Diatom,
Skeletonema costatum S, U
Copper
sulfate 35.7 Several
LOEC
(no growth) 31.8 Metaxas and Lewis 1991
Diatom,
Skeletonema costatum S, U
Copper
chloride - 4
EC50
(growth) 45 Nassiri et al. 1997
Diatom,
Thalassiosira aestevallis S, U
Copper
chloride - 3.0 - 4 Reduced growth 19 Hollibaugh et al. 1980
Red alga,
Ceramium tenuicorne S, U
Copper
chloride 7 7
EC50
(growth) 6.4 Ytreberg et al. 2010
Red alga (tetrasporophyte),
Champia parvula R, M
Copper
chloride 30 11 Reduced growth 4.6 4.181 Steele and Thursby 1983
Red alga (tetrasporophyte),
Champia parvula R, M
Copper
chloride 30 11 Reduced production 13.3 12.09 Steele and Thursby 1983
Red alga (mature),
Champia parvula R, M
Copper
chloride 30 14 Reduced female growth 4.7 4.272 Steele and Thursby 1983
Red alga (mature),
Champia parvula R, M
Copper
chloride 30 14 Stopped sexual reproduction 7.3 6.636 Steele and Thursby 1983
Red seaweed,
Gracilaria lemaneiformis S, U
Copper
sulfate 25 6
LOEC
(growth rate) 50 Huang et al. 2013
Red seaweed,
Gracilariopsis longissima S, U
Copper
sulfate 33 7
EC50
(growth)
Plants collected from clean and
polluted sites-April
31.1 28.27 Brown et al. 2012
Red seaweed,
Gracilariopsis longissima S, U
Copper
sulfate 33 7
EC50
(growth)
Plants collected from clean and
polluted sites-Oct.
25.8 23.45 Brown et al. 2012
Red seaweed,
Gracilariopsis longissima S, U
Copper
sulfate 33 7
EC20
(growth)
Plants collected from clean and
polluted sites-April
12.6 11.45 Brown et al. 2012

C-4
Species Methoda Chemical
Salinity
(g/kg)
Duration
(days) Effect
Result
(total μg/L)
Result
(dissolved μg/L) Reference
Red seaweed,
Gracilariopsis longissima S, U
Copper
sulfate 33 7
EC20
(growth)
Plants collected from clean and
polluted sites-Oct.
11.3 10.27 Brown et al. 2012
Kelp (meiospore),
Laminaria saccharina R, U
Copper
sulfate - 21
Reduced gametophyte
development rate 5
Chung and Brinkhuis
1986
Kelp (1-3 cm sporophyte),
Laminaria saccharina S, U
Copper
sulfate - 9
LOEC
(100% mortality) 100
Chung and Brinkhuis
1986
Kelp (8-10 cm sporophyte),
Laminaria saccharina S, U
Copper
sulfate - - 23% decrease in blade growth 10
Chung and Brinkhuis
1986
Giant kelp,
Macrocystis pyrifera S, U - - 4
EC50
(photosynthesis) 60
Clendenning and North
1959
Giant kelp,
Macrocystis pyrifera R, M
Copper
chloride 36 19-20
NOEC
(sporophyte production) <10.2 <9.2718 Anderson et al. 1990
Giant kelp,
Macrocystis pyrifera R, M
Copper
chloride 36 19-20
LOEC
(sporophyte production) 10.2 9.2718 Anderson et al. 1990
a S=static, R=renewal, F=flow-through, U=unmeasured, M=measured.

D-1
Appendix D Acceptable Estuarine/Marine Bioaccumulation Data

D-2
Appendix Table D-1. Acceptable Estuarine/Marine Bioaccumulation Data.
Species Chemical
Concentration
in water
(μg/L)
Salinity
(g/kg)
Duration
(days) Tissue
BCF
or
BAF Reference
Polychaete,
Phyllodoce maculata
Copper
sulfate 40
Full strength
seawater 35 Whole body 2,500
McLusky and
Phillips 1975
Polychaete,
Neanthes arenaceodentata
Copper
nitrate 40 31 28 Whole body 2,950
Pesch and Morgan
1978
Polychaete,
Eudistylia vancouveri
Copper
chloride 6 30.4 29 Body (less radioles) 1,006 Young et al. 1979
Blue mussel (0.45 cm),
Mytilus edulis
Copper
chloride 3 25 550 Soft tissue 7,730
Calabrese et al.
1984
Blue mussel (0.45 cm),
Mytilus edulis
Copper
chloride 7.9 25 550 Soft tissue 4,420
Calabrese et al.
1984
Blue mussel (0.45 cm),
Mytilus edulis
Copper
chloride 12.7 25 550 Soft tissue 5,320
Calabrese et al.
1984
Mediterranean mussel
(6.02-6.34 cm),
Mytilus galloprovincialis
Field study 0.285 37-38 266 Soft tissue 3,263 Martincic et al.
1992
Mediterranean mussel
(6.02-6.34 cm),
Mytilus galloprovincialis
Field study 0.446 37-38 266 Soft tissue 2,491 Martincic et al.
1992
Mediterranean mussel
(6.02-6.34 cm),
Mytilus galloprovincialis
Field study 0.203 37-38 266 Soft tissue 4,384 Martincic et al.
1992
Mediterranean mussel
(6.02-6.34 cm),
Mytilus galloprovincialis
Field study 0.177 37-38 266 Soft tissue 4,915 Martincic et al.
1992
Bay scallop (5.12-6.26 cm),
Argopecten irradians
Copper
chloride 4.56 29-32 56 Muscle 185
Zaroogian and
Johnson 1983
Bay scallop (5.12-6.26 cm),
Argopecten irradians
Copper
chloride 4.56 29-32 56 Viscera 3,816
Zaroogian and
Johnson 1983
Pacific oyster,
Crassostrea gigas Field study 25.45 - 32 Soft tissue 34,600
Han and Hung
1990
Pacific oyster,
Crassostrea gigas Field study 9.66 - 32 Soft tissue 57,000
Han and Hung
1990
Pacific oyster,
Crassostrea gigas Field study 10.37 - 32 Soft tissue 33,400
Han and Hung
1990

D-3
Species Chemical
Concentration
in water
(μg/L)
Salinity
(g/kg)
Duration
(days) Tissue
BCF
or
BAF Reference
Eastern oyster,
Crassostrea virginica Field study 25 31 140 Soft tissue 27,800
Shuster and Pringle
1968
Soft-shell clam,
Mya arenaria Field study 100 31 35 Soft tissue 790
Shuster and Pringle
1968

E-1
Appendix E Other Estuarine/Marine Toxicity Data

E-2
Appendix Table E-1. Other Estuarine/Marine Toxicity Data.
Species Chemical
Duration
(days) Effect
Effect
Concentration
(total µg/L)
Effect
Concentration
(dissolved µg/L) Reference
Ciliate,
Euplotes crassus - 8 hr
NOEC
(survival) 31,775 - Gomiero et al. 2012b
Bacterium,
Vibrio fischeri
Copper
sulfate 15 min
EC50
(luminescence) 397 - Rosen et al. 2008
Bacterium,
Vibrio fischeri
Copper
chloride 15 min
EC50
(luminescence) 800 - Ytreberg et al. 2010
Dinoflagellate,
Ceratocorys horrida
Copper
sulfate 1
EC50
(luminescence) 166 - Rosen et al. 2008
Dinoflagellate,
Lingulodinium polyedrum
Copper
sulfate 1
EC50
(luminescence) 90 - Rosen et al. 2008
Dinoflagellate,
Pyrocystis noctiluca
Copper
sulfate 1
EC50
(luminescence) 185 - Rosen et al. 2008
Fungus,
Halophytophthora elongata
Copper
chloride 5
NOEC-LOEC
(biomass) 10,000 - 100,000 - Leano and Pang 2010
Fungus,
Halophytophthora spinosa
Copper
chloride 5
NOEC-LOEC
(biomass) 1,000 - 10,000 - Leano and Pang 2010
Fungus,
Halophytophthora vesicula
Copper
chloride 5
NOEC-LOEC
(biomass) 1,000 - 10,000 - Leano and Pang 2010
Green alga,
Chlorella autotrophyca
Copper
sulfate 3
EC50
(biomass)
(initial cell density=103 cells/ml)
9.6 - Moreno-Garrido et al.
2000
Green alga,
Chlorella autotrophyca
Copper
sulfate 3
EC50
(biomass)
(initial cell density =5x10³ cells/ml)
19.3 - Moreno-Garrido et al.
2000
Green alga,
Chlorella autotrophyca
Copper
sulfate 3
EC50
(biomass)
(initial cell density=104 cells/ml)
38.3 - Moreno-Garrido et al.
2000
Green alga,
Isochrysis galbana
Copper
sulfate 3
EC50
(biomass)
(initial cell density=103 cells/ml)
0.4 - Moreno-Garrido et al.
2000
Green alga,
Isochrysis galbana
Copper
sulfate 3
EC50
(biomass)
(initial cell density=5x10³ cells/ml)
3.6 - Moreno-Garrido et al.
2000
Green alga,
Isochrysis galbana
Copper
sulfate 3
EC50
(biomass)
(initial cell density=104 cells/ml)
4.4 - Moreno-Garrido et al.
2000
Green alga,
Nannochloris atomus
Copper
sulfate 3
EC50
(biomass)
(initial cell density=103 cells/ml)
16.7 - Moreno-Garrido et al.
2000

E-3
Species Chemical
Duration
(days) Effect
Effect
Concentration
(total µg/L)
Effect
Concentration
(dissolved µg/L) Reference
Green alga,
Nannochloris atomus
Copper
sulfate 3
EC50
(biomass)
(initial cell density=5x10³ cells/ml)
27.3 - Moreno-Garrido et al.
2000
Green alga,
Nannochloris atomus
Copper
sulfate 3
EC50
(biomass)
(initial cell density=104 cells/ml)
46.2 - Moreno-Garrido et al.
2000
Diatom,
Ceratoneis closterium
Copper
sulfate 3
IC50
(growth rate) 7.1 - Hook et al. 2014
Diatom,
Cylindrotheca closterium
Copper
sulfate 72 hr
EC50
(growth) 29 - Araujo et al. 2008
Diatom,
Cylindrotheca closterium
Copper
sulfate 72 hr
EC50
(growth) 22 - Araujo et al. 2008
Diatom,
Cylindrotheca closterium
Copper
sulfate 72 hr
EC50
(growth) 23 - Araujo et al. 2008
Diatom,
Cylindrotheca closterium
Copper
sulfate 72 hr
EC50
(growth) 23 - Araujo et al. 2008
Diatom,
Phaeodactylum tricornutum
Copper
sulfate 3
EC50
(biomass)
(initial cell density=103 cells/ml)
9.8 - Moreno-Garrido et al.
2000
Diatom,
Phaeodactylum tricornutum
Copper
sulfate 3
EC50
(biomass)
(initial cell density=5x10³ cells/ml)
34.4 - Moreno-Garrido et al.
2000
Diatom,
Phaeodactylum tricornutum
Copper
sulfate 3
EC50
(biomass)
(initial cell density=104 cells/ml)
35.0 - Moreno-Garrido et al.
2000
Diatom,
Phaeodactylum tricornutum
Copper
sulfate 3
IC50
(growth) 8.5 -
Osborn and Hook
2013
Coral (explants),
Montastraea franksi
Copper
sulfate 8 hr
NOEC
(paling/tissue loss) 100 - Venn et al. 2009
Coral (explants),
Montastraea franksi
Copper
sulfate 8 hr
NOEC-LOEC
(increase hsp70, hsp90 & P-gp
expression)
10.0 - 30 - Venn et al. 2009
Bryzoan,
Bugula neritina - 2 100% mortality 500 -
Piola and Johnston
2006
Bryzoan,
Watersipora subtorquata - 2 100% mortality 500 -
Piola and Johnston
2006
Bryzoan,
Schizoporella errata - 2 100% mortality 500 -
Piola and Johnston
2006
Bryzoan,
Tricellaria occidentalis - 2 100% mortality 500 -
Piola and Johnston
2006

E-4
Species Chemical
Duration
(days) Effect
Effect
Concentration
(total µg/L)
Effect
Concentration
(dissolved µg/L) Reference
Hydroid,
Campanularia flexuosa - 11 Growth rate inhibition 10.0 - 13 - Stebbing 1976
Hydroid,
Campanularia flexuosa - - Enzyme inhibition 1.43 -
Moore and Stebbing
1976
Hydromedusa,
Phlalldium sp. - 1 LC50 36 - Reeve et al. 1976
Ctenophore,
Pleurobrachia pileus - 1 LC50 33 - Reeve et al. 1976
Ctenophore,
Mnemiopsis mccrdayi - 1 LC50 17 - 29 - Reeve et al. 1976
Rotifer,
Brachionus plicatillis - 1 LC50 100 - Reeve et al. 1976
Polychaete,
Phyllodoce maculata - 9 LC50 80 -
McLusky and Phillips
1975
Polychaete (adult),
Neanthes arenaceodentata
Copper
nitrate 28 LC50 44 40
Pesch and Morgan
1978
Polychaete,
Neanthes arenaceodentata
Copper
nitrate 7 LC50 137 -
Pesch and Hoffman
1982
Polychaete,
Neanthes arenaceodentata
Copper
nitrate 10 LC50 98 -
Pesch and Hoffman
1982
Polychaete,
Neanthes arenaceodentata
Copper
nitrate 28 LC50 56 -
Pesch and Hoffman
1982
Polychaete (larva, 0.10 mg),
Neanthes arenaceodentata
Copper
chloride 4 LC50 311 - Pesch et al. 1986
Polychaete (larva, 0.10 mg),
Neanthes arenaceodentata
Copper
chloride 4 LC50 252 - Pesch et al. 1986
Polychaete (larva, 0.10 mg),
Neanthes arenaceodentata
Copper
chloride 4 LC50 224 - Pesch et al. 1986
Polychaete (larva, 0.10 mg),
Neanthes arenaceodentata
Copper
chloride 28 LC50 83 - Pesch et al. 1986
Polychaete (larva, 0.10 mg),
Neanthes arenaceodentata
Copper
chloride 28 LC50 81 - Pesch et al. 1986
Polychaete (larva, 0.10 mg),
Neanthes arenaceodentata
Copper
chloride 28 LC50 86 - Pesch et al. 1986
Polychaete,
Nereis virens
Copper
sulfate 8 LC50 20.97 - Caldwell et al. 2011
Polychaete,
Cirriformia spirabranchia
Copper
nitrate 26 LC50 40 - Milanovich et al. 1976
Polychaete (adult),
Hydroides elegans
Copper
sulfate 2 LC50 715 649.9 Xie et al. 2005

E-5
Species Chemical
Duration
(days) Effect
Effect
Concentration
(total µg/L)
Effect
Concentration
(dissolved µg/L) Reference
Polychaete (larva),
Hydroides elegans
Copper
sulfate 2 LC50 120 100.6 Bao et al. 2008
Flatworm,
Parorchis acanthus
Copper
sulfate 2
NOEC-LOEC
(successful encystment) 10-100 Morley et al. 2003
Nematode (adult, 3-4 d),
Caenorhabditis elegans
Copper
chloride 4 LC50 256 214.5
Williams and
Dusenbery 1990
Annelids (mixed species, larva) - 1 LC50 89 - Reeve et al. 1976
Black abalone,
Hailotis cracherodil - 4 Histopathological gill abnormalities >32 - Martin et al. 1977
Barnacle (nauplii),
Amphibalanus variegatus - 1
EC50
(swimming) 81.29 - Gall et al. 2013
Red abalone,
Hailotis rufescens - 4 Histopathological gill abnormalities >32 - Martin et al. 1977
Channeled whelk,
Busycon canaliculatum - 77 LC50 470 -
Betzer and Yevich
1975
Mud snail,
Nassarius obsoletus - 3 Decrease in oxygen consumption 100 -
MacInnes and
Thurberg 1973
Blue mussel,
Mytilus edulis
Copper
chloride 7
LOEC
(mortality) 200 167.6 Scott and Major 1972
Blue mussel (10-15 mm),
Mytilus edulis - 3
LOEC
(growth) 10 8.38 Manley et al. 1984
Blue mussel (51-58 mm),
Mytilus edulis
Copper
sulfate 5
LOEC
(mortality) 100 83.8 Al-Subiai et al. 2011
Mediterranean mussel (adult, 5 cm),
Mytilus galloprovincialis
Copper
chloride 5
LOEC
(lysosomal membrane stability) 2.3 1.927 Bolognesi et al. 1999
Mediterranean mussel (50-80 mm),
Mytilus galloprovincialis - 28
LC50
(no sediment present) 100 Bat et al. 2013
Mediterranean mussel (50-80 mm),
Mytilus galloprovincialis - 28
LC50
(sediment present) 250 Bat et al. 2013
Mediterranean mussel (5-6 cm),
Mytilus galloprovincialis -
4
(16°C)
NOEC-LOEC
(decrease lysosomal membrane
stability in digestive gland)
20 - 40 Negri et al. 2013
Mediterranean mussel (5-6 cm),
Mytilus galloprovincialis -
4
(20°C)
NOEC-LOEC
(decrease lysosomal membrane
stability in digestive gland)
20 - 40 Negri et al. 2013
Pacific blue mussel (sperm),
Mytilus trossulus
Copper
chloride 100 min. Reduced sperm swimming speed 100 90.9 Fitzpatrick et al. 2008
Pacific blue mussel (sperm),
Mytilus trossulus
Copper
chloride 100 min. Reduced fertilization success 100 90.9 Fitzpatrick et al. 2008
Pacific blue mussel (embryo),
Mytilus trossulus
Copper
chloride 2 Increased abnormal larval development 10 9.09 Fitzpatrick et al. 2008

E-6
Species Chemical
Duration
(days) Effect
Effect
Concentration
(total µg/L)
Effect
Concentration
(dissolved µg/L) Reference
Bay scallop,
Argopecten irradians - 42
EC50
(growth) 5.8 Pesch et al. 1979
Bay scallop,
Argopecten irradians - 119 100% mortality 5
Zaroogian and Johnson
1983
Pacific oyster (embryo),
Crassostrea gigas
Copper
chloride 2
EC50
(development) 10 9.09 Harrison et al. 1981
Pacific oyster (embryo),
Crassostrea gigas
Copper
chloride 2
EC50
(development)
(2 mg/L humic matter added)
28 25.45 Harrison et al. 1981
Pacific oyster (embryo),
Crassostrea gigas
Copper
chloride 2
NOEC
(development) 2 1.676 Coglianese 1982
Pacific oyster (embryo, ≤4 hr),
Crassostrea gigas
Copper
sulfate 3
EC50
(arrested development) 4.46 3.737 Worboys et al. 2002
Pacific oyster (embryo),
Crassostrea gigas
Copper
chloride 1
EC50
(normal D-stage larval development) 20.77 18.88 Brooks et al. 2007
Pacific oyster (embryo),
Crassostrea gigas
Copper
chloride 1
EC50
(normal D-stage larval development) 24.33 22.12 Brooks et al. 2007
Pacific oyster (embryo),
Crassostrea gigas
Copper
chloride 1
EC50
(normal D-stage larval development) 41.09 37.35 Brooks et al. 2007
Pacific oyster (embryo),
Crassostrea gigas
Copper
chloride 1
EC50
(normal D-stage larval development) 37.87 34.42 Brooks et al. 2007
Pacific oyster (embryo),
Crassostrea gigas
Copper
chloride 1
EC50
(normal D-stage larval development) 38.17 34.70 Brooks et al. 2007
Pacific oyster (embryo),
Crassostrea gigas
Copper
chloride 1
EC50
(normal D-stage larval development) 40.52 36.83 Brooks et al. 2007
Eastern oyster (larva),
Crassostrea virginica - 12 LC50 46 - Calabrese et al. 1977
Common rangia,
Rangla cuneata - 4
LC50
(<1 g/kg salinity) 210 - Olson and Harrel 1973
Quahog clam (larva),
Mercenaria mercenaria - 8.0 - 10 LC50 30 - Calabrese et al. 1977
Quahog clam (larva),
Mercenaria mercenaria - 77 LC50 25 -
Shuster and Pringle
1968
Common Pacific littleneck,
Protothaca staminea - 17 LC50 39 - Roesijadi 1980
Soft-shell clam,
Mya arenaria - 7 LC50 35 - Eisler 1977
Copepod,
Undinula vulgaris - 1 LC50 192 - Reeve et al. 1976
Copepod,
Euchaeta marina - 1 LC50 188 - Reeve et al. 1976

E-7
Species Chemical
Duration
(days) Effect
Effect
Concentration
(total µg/L)
Effect
Concentration
(dissolved µg/L) Reference
Copepod,
Metridia pacifica - 1 LC50 176 - Reeve et al. 1976
Copepod,
Labidocera scotti - 1 LC50 132 - Reeve et al. 1976
Copepod,
Acartia clausi - 2 LC50 34-82 -
Moraitou-
Apostolopoulou 1978
Copepod,
Acartia tonsa - 6 LC50 9.0 - 7.3 - Sosnowski et al. 1979
Copepod,
Acartia tonsa - 1 LC50 104 - 311 - Reeve et al. 1976
Copepod (adult),
Acartia tonsa
Copper
chloride 2 LC50 ~40 36.36
Pinho and Bianchini
2010
Copepod (adult),
Acartia tonsa
Copper
chloride 2 LC50 ~90 81.81
Pinho and Bianchini
2010
Copepod (adult),
Acartia tonsa
Copper
chloride 2 LC50 ~110 99.99
Pinho and Bianchini
2010
Copepod (adult),
Nitokra spinipes
Copper
sulfate 3 LC50 323 293.6 Ward et al. 2011
Copepod (nauplii, 24 hr),
Eurytemora affinis
Copper
chloride 2 LC50 - 83.0 Hall et al. 1997
Copepod (nauplii, 24 hr),
Eurytemora affinis
Copper
chloride 8 LC50 - 64.0 Hall et al. 1997
Copepod (nauplii, <24 hr),
Tisbe battagliai
Copper
sulfate 2 LC50 83.1 - Diz et al. 2009
Copepod (adult gravid female),
Tisbe battagliai
Copper
sulfate 3 LC50 157 - Diz et al. 2009
Copepod (adult gravid female),
Tisbe battagliai
Copper
sulfate 3
EC50
(fecundity) 30.8 - Diz et al. 2009
Copepod,
Tisbe holothuriae - 2 LC50 80 -
Moraitou-
Apostolopoulou and
Verriopoulos 1982
Copepod (mixed species, nauplii) - 1 LC50 90 - Reeve et al. 1976
Amphipod,
Ampelisca abdita - 7 LC50 90 -
Scott et al.
(Manuscript)
Euphauslid,
Euphausia pacifica - 1 LC50 14 - 30 - Reeve et al. 1976
Grass shrimp,
Palaemonetes pacifica - 4 LC50 12,600 -
Curtis et al. 1979;
Curtis and Ward 1981
Coon stripe shrimp
(larva/zoea, stage 1),
Pandalus danae
Copper
sulfate 46 Development 13.42 12.20 Young et al. 1979

E-8
Species Chemical
Duration
(days) Effect
Effect
Concentration
(total µg/L)
Effect
Concentration
(dissolved µg/L) Reference
Sand shrimp (adult, 61 mm),
Crangon sp.
Copper
chloride 4 LC50 898 - Dinnel et al. 1989
Shrimp (adult),
Crangon crangon
Copper
sulfate 2 LC50 29,500 24,721 Connor 1972
Whiteleg shrimp
(juvenile, 5-6.5 cm),
Litopenaeus vannamei
Copper
chloride 28 Gill alterations 186.5 156.3
Frias-Espericueta et al.
2008a
Whiteleg shrimp (juvenile, 1.5-2 g),
Litopenaeus vannamei
Copper
sulfate 4 LC50 35,120 29,431
Frias-Espericueta et al.
2008b
Whiteleg shrimp
(juvenile, 11.74 cm, 9.40 g),
Litopenaeus vannamei
Copper
chloride 4
NOEC-LOEC
(increase hemolymph clotting time) 370-3,730 -
Bautista-Covarrubias
et al. 2015
Pacific asteroid (sperm/egg),
Asterias amurensis
Copper
chloride 80 min.
EC50
(fertilization) 200 167.6 Lee et al. 2004
Sand dollar (gamete),
Dendraster excentricus
Copper
sulfate 40 min.
NOEC
(fertilization) 10 8.380 Bailey et al. 1995
Sand dollar (gamete),
Dendraster excentricus
Copper
sulfate 40 min.
NOEC
(fertilization) 13.1 10.98 Bailey et al. 1995
Sand dollar (sperm),
Dendraster excentricus
Copper
chloride 80 min.
EC50
(fertilization) 26 23.63 Dinnel et al. 1989
Blue crab (juvenile, 8.3 cm, 43.4 g),
Callinectes sapidus
Copper
chloride 4 LC50 - 33.75 Martins et al. 2011b
Blue crab (juvenile, 8.3 cm, 43.4 g),
Callinectes sapidus
Copper
chloride 4 LC50 - 3,367 Martins et al. 2011b
Shore crab (adult),
Carcinus maenas
Copper
sulfate 2 LC50 109,000 91,342 Connor 1972
Long-spined sea urchin (embryo),
Diadema antillarum
Copper
sulfate ~ 40 hr
EC50
(abnormal development) - 11 Bielmyer et al. 2005b
Sea urchin (sperm),
Arbacia punctulata - - 58% decrease in sperm motility 300 -
Young and Nelson
1974
Sea urchin (sperm/egg),
Arbacia punctulata - 80 min.
IC50
(fertilization) 27.7 23.21
Neiheisel and Young
1992
Sea urchin (sperm/egg),
Arbacia punctulata - 80 min.
IC50
(fertilization) 34.6 28.99
Neiheisel and Young
1992
Sea urchin (sperm/egg),
Arbacia punctulata - 80 min.
IC50
(fertilization) 47.7 39.97
Neiheisel and Young
1992
Sea urchin (embryo, 1 hpf),
Arbacia punctulata
Copper
sulfate 2
IC50
(fertilization) 28.0 21.4
Science Applications
International
Corporation 1993
Green sea urchin (sperm),
Strongylocentrotus droebachiensis
Copper
chloride 80 min.
EC50
(fertilization) 59 53.63 Dinnel et al. 1989

E-9
Species Chemical
Duration
(days) Effect
Effect
Concentration
(total µg/L)
Effect
Concentration
(dissolved µg/L) Reference
Red sea urchin (sperm),
Strongylocentrotus franciscanus
Copper
chloride 80 min.
EC50
(fertilization) 1.9 1.727 Dinnel et al. 1989
Sea urchin (embryo),
Paracentrotus lividus - 2 LC50 >500 >419.0 Radenac et al. 2001
Sea urchin (embryo),
Paracentrotus lividus - 2
LOEC
(development) 50 41.9 Radenac et al. 2001
Purple sea urchin (sperm),
Strongylocentrotus purpuratus
Copper
chloride 80 min.
EC50
(fertilization) 25 22.73 Dinnel et al. 1989
Purple sea urchin (gamete),
Strongylocentrotus purpuratus
Copper
sulfate 40 min.
NOEC
(fertilization) 20 16.76 Bailey et al. 1995
Purple sea urchin (gamete),
Strongylocentrotus purpuratus
Copper
sulfate 40 min.
NOEC
(fertilization) 19.7 16.51 Bailey et al. 1995
White sea urchin (egg/sperm),
Lytechinus pictus
Copper
sulfate 20 min.
IC50
(fertilization) 180 150.8 Jonczyk et al. 2001
White sea urchin (egg/sperm),
Lytechinus pictus
Copper
sulfate 20 min.
IC50
(fertilization) 90.9 76.17 Jonczyk et al. 2001
White sea urchin (egg/sperm),
Lytechinus pictus
Copper
sulfate 20 min.
IC50
(fertilization) 277 232.1 Jonczyk et al. 2001
White sea urchin (egg/sperm),
Lytechinus pictus
Copper
sulfate 20 min.
IC50
(fertilization) 120 100.6 Jonczyk et al. 2001
White sea urchin (egg/sperm),
Lytechinus pictus
Copper
sulfate 20 min.
IC50
(fertilization) 122 102.2 Jonczyk et al. 2001
White sea urchin (egg/sperm),
Lytechinus pictus
Copper
sulfate 20 min.
IC50
(fertilization) 152 127.4 Jonczyk et al. 2001
White sea urchin (egg/sperm),
Lytechinus pictus
Copper
sulfate 20 min.
IC50
(fertilization) 135 113.1 Jonczyk et al. 2001
White sea urchin (egg/sperm),
Lytechinus pictus
Copper
sulfate 20 min.
IC50
(fertilization) 249 208.7 Jonczyk et al. 2001
White sea urchin (egg/sperm),
Lytechinus pictus
Copper
sulfate 20 min.
IC50
(fertilization) 33.4 27.99 Jonczyk et al. 2001
White sea urchin (egg/sperm),
Lytechinus pictus
Copper
sulfate 20 min.
IC50
(fertilization) 51.8 43.41 Jonczyk et al. 2001
White sea urchin (egg/sperm),
Lytechinus pictus
Copper
sulfate 20 min.
IC50
(fertilization) 243 203.6 Jonczyk et al. 2001
White sea urchin (egg/sperm),
Lytechinus pictus
Copper
sulfate 20 min.
IC50
(fertilization) 20.8 17.43 Jonczyk et al. 2001
White sea urchin (egg/sperm),
Lytechinus pictus
Copper
sulfate 20 min.
IC50
(fertilization) 20.9 17.51 Jonczyk et al. 2001
White sea urchin (egg/sperm),
Lytechinus pictus
Copper
sulfate 20 min.
IC50
(fertilization) 55.7 46.68 Jonczyk et al. 2001

E-10
Species Chemical
Duration
(days) Effect
Effect
Concentration
(total µg/L)
Effect
Concentration
(dissolved µg/L) Reference
White sea urchin (egg/sperm),
Lytechinus pictus
Copper
sulfate 20 min.
IC50
(fertilization) 126 105.6 Jonczyk et al. 2001
White sea urchin (egg/sperm),
Lytechinus pictus
Copper
sulfate 20 min.
IC50
(fertilization) >200 >167.6 Jonczyk et al. 2001
Arrow worm,
Sagitta hispida - 1 LC50 43 - 460 - Reeve et al. 1976
Cuttlefish (egg),
Sepia officinalis
Copper
chloride 50
NOEC-LOEC
(hatchling weight) 2.3 - 23 -
Lacoue-Labarthe et al.
2010
Atlantic menhaden,
Brevoortia tyrannus - 14 LC50 610 - Engel et al. 1976
Topsmelt (larva, 9d),
Atherinops affinis
Copper
chloride 7
LC50
(test species fed) 162 147.3 Anderson et al. 1994
Topsmelt (larva, 9d),
Atherinops affinis
Copper
chloride 7
LC50
(test species fed) 55.7 50.63 Anderson et al. 1994
Topsmelt (larva),
Atherinops affinis
Copper
chloride 7 LC50 365 331.8 McNulty et al. 1994
Topsmelt (larva, 9d),
Atherinops affinis
Copper
chloride 7 LC50 134 121.8 McNulty et al. 1994
Pacific herring (embryo),
Clupea harengus pallasi - 6 Incipient LC50 33 -
Rice and Harrison
1978
Pacific herring (larva),
Clupea harengus pallasi - 2 Incipient LC50 900 -
Rice and Harrison
1978
Atlantic cod (embryo),
Gadus morhua - 14 LC50 10 -
Swedmark and
Granmo 1981
Mummichog,
Fundulus heteroclitus - 21 Histopathological lesions <500 -
Gardner and La Roche
1973
Mummichog,
Fundulus heteroclitus - 4 Enzyme inhibition 600 - Jackim 1973
Atlantic silverside,
Menidia menidia - 4 Histopathological lesions <500 -
Gardner and La Roche
1973
Sheepshead minnow (larva, ≤24 hr),
Cyprinodon variegatus
Copper
nitrate 4
LC50
(test species fed) >220 >200.0 Hutchinson et al. 1994
Sheepshead minnow (larva, ≤24 hr),
Cyprinodon variegatus
Copper
nitrate 7 Survival 160 145.4 Hutchinson et al. 1994
Northern anchovy (embryo),
Engraulis mordax
Copper
chloride 32 hr LC50 185 168.2 Rice et al. 1980
Northern anchovy (larva),
Engraulis mordax
Copper
chloride 46 hr LC50 372 338.1 Rice et al. 1980
Pinfish,
Lagodon rhomboides - 14 LC50 150 - Engel et al. 1976

E-11
Species Chemical
Duration
(days) Effect
Effect
Concentration
(total µg/L)
Effect
Concentration
(dissolved µg/L) Reference
Spot,
Leiostomus xanthurus - 14 LC50 160 - Engel et al. 1976
Atlantic croaker,
Micropogonias undulatus - 14 LC50 210 - Engel et al. 1976
Winter flounder,
Pseudopleuronectes americanus - 14 Histopathological lesions 180 - Baker 1969
Cobia (egg),
Rachycentron canadum
Copper
sulfate 1 LC50 91 76.26 Dung et al. 2005
Cobia (larva, 1 d),
Rachycentron canadum
Copper
sulfate 4 LC50 60 50.28 Dung et al. 2005
Cobia (juvenile, 20 d),
Rachycentron canadum
Copper
sulfate 4 LC50 87 72.91 Dung et al. 2005
Cobia (young, 40 d),
Rachycentron canadum
Copper
sulfate 4 LC50 240 201.1 Dung et al. 2005
Mahi mahi (4 hpf, blastula stage),
Coryphaena hippurus
Copper
chloride 2 LC50 15.5 14.09
Adema-Hannes and
Shenker 2008
Mangrove killifish
(adult, 2.5 cm, 0.5 g),
Kryptolebias marmoratus
Copper
chloride 2
LOEC
(MT transcript induction) 10 8.380 Rhee et al. 2009

F-1
Appendix F Data Not Used in the Development of the Aquatic Life Ambient
Estuarine/Marine Water Quality Criteria for Copper

F-2
Appendix Table F-1. Unused Studies Along with Reason.
Species Reference Reason Data Classified as Unused
Green mussel,
Perna viridis Aanand et al. 2010 Only one exposure concentration
Herring,
Clupea harengus Abbasi and Sheckley 1995 Only three exposure concentrations
Oyster,
Crassostrea virginica Abbe and Sanders 1986 Mixture
Oyster,
Crassostrea virginica Abbe and Sanders 2000 Mixture, Field exposure
Bivalve,
Malcoma balthica Absil et al. 1993
Steady state not reached for bioaccumulation
study; Exposed in situ
Blue mussel,
Mytilus edulis Adema et al. 1972 Lack of detail (foreign language)
Sheepshead minnow,
Cyprinodon variegatus Adeyemi and Klerks 2012 Only one exposure concentration
Sheepshead minnow,
Cyprinodon variegatus Adeyemi et al. 2012 Only one exposure concentration
Mediterranean sponge,
Crambe crambe Agel et al. 2001 Pre-exposure to toxicant
European eel,
Anguilla anguilla Ahmad et al. 2005 Only two exposure concentrations
European eel,
Anguilla anguilla Ahmad et al. 2008 Only two exposure concentrations
Crab,
Scylla serrata Ahmed et al. 1997 Only one exposure concentration
Amphipod,
Allorchestes compressa Ahsanullah and Williams 1991 Low control survival (77.5%)
Teleost,
Trematomus bernacchii
Teleost,
Chionodraco hamatus
Albergoni et al. 2000 Mixture; Survey, so prior exposure to many
chemicals
Various species Alekseev et al. 2010 Dilution water not characterized
Cyanobacteria,
Cyanobium sp. Alquezar and Anastasi 2013 Algal study
Turbot,
Scophthalmus maximus Alvarado et al. 2005
Only two exposure concentrations; No
information on seawater
Turbot,
Scophthalmus maximus Alvarado et al. 2006 Only two exposure concentrations
Sea urchin,
Paracentrotus lividus Amaroli et al. 2013 Only one exposure concentration
Polychaete,
Nereis diversicolor
Peppery furrow shell,
Scrobicularia plana
Common shrimp,
Crangon crangon
European flounder,
Platichthys flesus
Amiard et al. 1985 No control information; No information on
dilution water
Blue mussel,
Mytilus edulis Amiard-Triquet et al. 1986
Bioaccumulation: steady state not documented
(16 day exposure)
Potworm,
Enchytraeus albidus
Amorim and Scott-Fordsmand
2012 Terrestrial exposure

F-3
Species Reference Reason Data Classified as Unused
Various species Anderson and Norberg-King
1991
Lack of exposure details; dilution water not
characterized
Diatom,
Phaeodactylum tricornutum Angel et al. 2015 Only one exposure; Pulsed exposure
Anemone,
Bunodosoma cangicum Anjos et al. 2014
Not North American species; Only two
exposure concentrations
Mediterranean mussel,
Mytilus galloprovincialis Arnold et al. 2005 Modeling study (BLM)
Mussel,
Mytilus sp. Arnold and Cotsifas 2008
Review and analysis of previously reported
data
Green Mussel,
Perna viridis Arockia Vasanthi et al. 2012
Field survey, exposure concentration not
known
Flathead mullet,
Mugil cephalus Arockia Vasanthi et al. 2013
Field survey, exposure concentration not
known
Mangrove crab,
Scylla serrata
Arumugam and Ravindranath
1987 Not North American species; No LC50 data
Oyster,
Crassostrea virginica Ayling 1974 Mixture
Blue mussel,
Mytilus edulis Bakhmet et al. 2012 Only three exposure concentrations
Polychaete,
Hydroides elegans Bao et al. 2010
Effect of copper on biofilm development and
larval settlement
Copepod,
Tigriopus japonicus Bao et al. 2013 Not North American species
Brown mussel,
Perna perna Baraj et al. 2011 Only one exposure concentration
Copepod,
Tigriopus brevicornis Barka 2007 Only three exposure concentrations
Copepod,
Tigriopus brevicornis Barka et al. 2010 Only three exposure concentrations
Blue shark,
Prionace glauca Barrera-Garcia et al. 2013
Field survey, exposure concentration not
known
Isopod,
Idotea baltica Bat et al. 199b LT50 is the endpoint
Sea urchin,
Strongylocentrotus purpuratus Bay et al. 1983 Only two exposure concentrations
Echinoid,
Phylum Echinodermata Bay et al. 1993 Review
Coral Berry et al. 2013 Field survey, exposure concentration not
known
Amphipod,
Parhalella natalensis Bhat and Vamsee 1993 Discrepancy in results; No control information
Hybrid striped bass,
Morone chrysops x Morone
saxatilis
Bielmyer et al. 2005a Bioaccumulation: steady state not documented
Hybrid striped bass,
Morone chrysops x Morone
saxatilis
Bielmyer et al. 2006a Only two fish per concentration
Copepod,
Acartia tonsa Bielmyer et al. 2006b Dietary exposure

F-4
Species Reference Reason Data Classified as Unused
Coral,
Acropora cervicornis
Coral,
Pocillopora damicornis
Coral,
Montastrea faveolata
Dinoflagellate,
Symbiodinium sp.
Bielmyer et al. 2010 Exposed coral and algal species at the same
time
Sea urchin,
Strongylocentrotus
droebachiensis
Bielmyer et al. 2012 Dietary exposure
Sydney rock oyster,
Saccostrea commercialis Birch and Hogg 2011
Not North American species; Sediment
exposure
Amphipod,
Gammarus annulatus Bisbal 1987 Only two exposure concentrations
Oyster,
Saccostrea cucullata Biswas et al. 2013
Field survey, exposure concentration not
known
Killifish,
Fundulus heteroclitus Blanchard and Grosell 2005 Bioaccumulation: steady state not documented
Killifish,
Fundulus heteroclitus Blanchard and Grosell 2006 Only two exposure concentrations
Oyster,
Crassostrea virginica Blanchard et al. 2009 Bioaccumulation: steady state not documented
Plaice,
Pleuronectes platessa
Herring,
Clupea harengus
Blaxter 1977 Only one exposure concentration
Striped bass,
Morone saxatilis Bodammer 1985
No control information; Culture water
contained 57 ug/L copper
American sand lance,
Ammodytes americanus Bodammer 1987 Only two exposure concentrations
Atlantic horseshoe crab,
Limulus polyphemus Botton and Itow 2009 Review
Brown mussel,
Perna perna Boudjema et al. 2014 Only three exposure concentrations
Crab,
Neohelice granulata
Clam,
Mesodesma mactroides
Boyle et al. 2013 Not North American species; Only one
exposure concentration
Ostracod,
Diacypris compacta Brooks et al. 1995 Hypersaline conditions in exposure media
Three Mytlius species Brooks et al. 2015 Bioaccumulation: unmeasured exposure
Red seaweed,
Gracilariopsis longissima Brown et al. 2012 Algal study
Gastropod,
Littorina littoralis
Brown seaweed,
Fucus vesiculosus
Bryan 1983 Mixture
Peppery furrow shell,
Scrobicularia plana
Polychaete,
Hediste diversicolor
Buffet et al. 2011 Only one exposure concentration
Polychaete,
Hediste diversicolor Burlinson and Lawrence 2007a Mixture (field exposure)

F-5
Species Reference Reason Data Classified as Unused
Polychaete,
Hediste diversicolor Burlinson and Lawrence 2007b
Prior exposure (sequentially exposed to
increasing copper)
Amphipod,
Melita plumulosa
Copepod,
Nitocra spinipes
Campana et al. 2012 Sediment exposure
Sheepshead,
Archosargus probatocephalus Cardeilhac et al. 1979 Only one exposure concentration
Polychaete,
Arenicola marina Casado-Martinez et al. 2010 Sediment exposure
Mediterranean mussel,
Mytilus galloprovincialis Casas et al. 2008 Mixture
Starfish,
Asterias rubens
White sea urchin,
Echinus acutus
Catarino et al. 2008 Mixture
Mediterranean sponge,
Chondrosia reniformis Cebrian et al. 2006 Mixture
Mediterranean sponge,
Crambe crambe
Mediterranean sponge,
Scopalina lophyropoda
Cebrian and Uriz 2007a Only one exposure concentration
Mediterranean sponge,
Scopalina lophyropoda Cebrian and Uriz 2007b Only one exposure concentration
Sponge cell Cebrian and Uriz 2007c Only two exposure concentrations
Wedge sole,
Dicologlossa cuneata
Brill,
Scophthalmus rhombus
Senegalese sole,
Solea senegalensis
Chairi et al. 2010 Injected toxicant; Not North American species
Oyster,
Saccostrea cucullata Chaharlang et al. 2012
Field survey, exposure concentration not
known
Oyster,
Crassostrea virginica
Oyster,
Crassostrea gigas
Chang 1995 Exposure via biofilm
Oyster,
Crassostrea virginica
Oyster,
Crassostrea gigas
Chang et al. 1996 Exposure via biofilm
Mussel,
Mytilus trossulus Chelomin et al. 1998 Mixture
Goby,
Synechogobius hasta Chen et al. 2013
Not North American species; Only two
exposure concentrations
Oyster,
Crassostrea gigas Cheng 1988a Only one exposure concentration
Oyster,
Crassostrea gigas Cheng 1988b Only one exposure concentration
Gastropod,
Babylonia lutosa Cheung and Wong 1998 Only three exposure concentrations
Hagfish Chiu and Mok 2011 Field survey, exposure concentration not
known

F-6
Species Reference Reason Data Classified as Unused
Rockbream,
Oplegnathus fasciatus Cho et al. 2006 Only three exposure concentrations
Red alga,
Porphya yezoensis Choi et al. 2005
Lack of exposure details; number of exposure
concentrations not provided
Snail,
Bulinus rohlfsi Chu 1976 Formulation (50% copper sulfate)
Alga,
Colpomenia sinuosa Cirik et al. 2012 Adsorption study
Mussel,
Echyridella menziesii Clearwater et al. 2014 Not North American species
Bivalve,
Bathymodiolus azoricus Company et al. 2008 Only one exposure concentration
Brown seaweed,
Ascophyllum nodosum
Brown seaweed,
Fucus vesiculosus
Connan and Stengel 2011 Only three exposure concentrations
Snail,
Ilyanassa obsoleta Conrad 1988 Mixture (copper and antibiotic)
Kelp,
Lessonia nigrescens Contreras et al. 2007 Not North American species
Amphipod,
Gammarus locusta Correia et al. 2002a Only three exposure concentrations
Amphipod,
Gammarus locusta Correia et al. 2002b Only three exposure concentrations
Sea bass,
Dicentrarchus labrax Cotou et al. 2009
Mixture (source of copper was antifouling
painted nets); Not North American species
European sea bass,
Dicentrarchus labrax Cotou et al. 2012
Inappropriate form of toxicant (copper-treated
nets)
Black-chinned tilapia,
Sarotherodon melanotheron Coulibaly et al. 2012
Field survey, exposure concentration not
known
Epibionts Crespo et al. 2014 Only one exposure concentration
Blue mussel,
Mytilus edulis Curtis et al. 2000 Only four organisms per concentration
Rough periwinkle,
Littorina saxatilis Daka and Hawkins 2004 Mixture
Pacific oyster,
Crassostrea gigas Damiens et al. 2006 Only three exposure concentrations
Black sea bream,
Acanthopagrus schlegeli Dang et al. 2009 Prior exposure
Blackhead seabream,
Acanthopagrus schlegelii
schlegelii
Dang et al. 2012 Not North American species
Scallop,
Pecten maximus
Pacific oyster,
Crassostrea gigas
Davies and Paul 1986 Inappropriate form of toxicant (copper oxide-
based anti-fouling paint)
Spiny dogfish,
Squalus acanthias De Boeck et al. 2007 Only three exposure concentrations
Spotted dogfish,
Scyliorhinus canicula De Boeck et al. 2010
Only one exposure concentration; Not North
American species
Mediterranean mussel,
Mytilus galloprovincialis Deruytter et al. 2013
Test results not reported, only the model
developed
Guppy,
Poecilia vivipara de Souza Machado et al. 2013 Not North American species

F-7
Species Reference Reason Data Classified as Unused
Snakehead catfish,
Channa striata Devi and Gopal 1986 Not North American species
Asian paddle crab,
Charybdis japonica Ding and Wang 2010
Not North American species; Text in foreign
language
Mediterranean mussel,
Mytilus galloprovincialis Dragun et al. 2010
Mixture; Survey, so prior exposure to many
chemicals
Duran and Beiras 2013 Review of previously published studies
Sea urchin,
Strongylocentrotus intermedius
Sea urchin,
Strongylocentrotus nudus
Durkina 1995 Only three exposure concentrations
Polychaete,
Nereis diversicolor Durou et al. 2005 LT50 is the endpoint
Dinoflagellate,
Cochlodinium polykrikoides Ebenezer and Ki 2012 Algal study
Sea urchin,
Tripneustes gratilla Edullantes and Galapate 2014 Not North American species
Mummichog,
Fundulus heteroclitus Eisler and Gardner 1973 Mixture
Clam,
Macoma balthica Eldon et al. 1980 Dilution water not characterized
Oyster,
Saccostrea cucullata
Oyster,
Crassostrea lugubris
Oyster,
Crassostrea belcheri
Elfwing and Tedengren 2002 Only one exposure concentration
Barnacle,
Elminius modestus Elliott et al. 1985a Bioaccumulation: static, unmeasured exposure
Mussel,
Mytilus edulis planulatus Elliott et al. 1985b Bioaccumulation: steady state not achieved
Crab,
Carcinus maenas Elumalai et al. 2005 Only nine animals per concentration
Coral El-Sorogy et al. 2012 Field survey, exposure concentration not
known
Oyster Engel and Fowler 1979 Only two exposure concentration
Mediterranean mussel,
Mytilus galloprovincialis Fabbri and Capuzzo 2006 Only one exposure concentration
Sea urchin,
Paracentrotus lividus Fabbrocini and D'Adamo 2011
Not North American species; Lack of details
(no control information/procedures)
Benthic foraminiferal
assemblages Fabrizio and Rodolfo 2012 Sediment present in media
Mediterranean mussel,
Mytilus galloprovincialis Fafandel et al. 2008 Only three exposure concentrations
Fish,
Etroplus maculatus
Clam,
Villorita cyprinoides var.
cochinensis
Prawn,
Macrobranchium idella idella
Crab,
Paratelphusa hydrodromus
Fernandez et al. 1996 Dilution water not characterized

F-8
Species Reference Reason Data Classified as Unused
Polychaete,
Laeonereis acuta Ferreira-Cravo et al. 2009 Only one exposure concentration
Ascidian,
Ciona intestinalis Ferro et al. 2013 Only one exposure concentration
Rotifer,
Brachionus plicatilis Filenko and Samoylova 2008 Dilution water not characterized
Whiting,
Merlangius merlangus
Goatfish,
Mullus barbatus
Findik and Cicek 2011 Field survey, exposure concentration not
known
Blue mussel,
Mytilus edulis Fokina and Nemova 2012 Lack of detail (abstract only)
Blue mussel,
Mytilus edulis Fokina et al. 2013 Only three exposure concentrations
Sole,
Solea senegalensis Fonseca et al. 2009 Only three exposure concentrations
Copepod,
Tigriopus brevicornis Forget et al. 1999 Mixture
Ascidian,
Ciona intestinalis Franchi et al. 2012 Only one exposure concentration
Oyster,
Crassostrea gigas Frazier 1976 Mixture
Japanese flounder,
Paralichthys olivaceus
Red Sea bream,
Pagrus major
Furuta et al. 2008 Not North American species
Seam bream,
Sparus aurata
Bivalve,
Scapharca inaequivalvis
Gabbianelli et al. 2003 Only one exposure concentration
Sole,
Solea senegalensis Galindo et al. 2012
Field survey, exposure concentration not
known
Barnacle,
Amphibalanus variegatus Gall et al. 2013 Not North American species
Sea squirt,
Styela plicata Galletly et al. 2007 Only three exposure concentrations
Rotifer,
Brachionus rotundiformis Gama-Flores et al. 2005 Not North American species
Isopod,
Idotea baltica Gambardella et al. 1998 Only acclimated one day
Brown flagellate,
Isochvysis sp. Garr 2012 Algal study
Asteroid,
Coscinasterias muricata Georgiades et al. 2006 Only three exposure concentrations
Polychaete,
Laeonereis acuta Geracitano et al. 2002 Only two exposure concentrations
Polychaete,
Laeonereis acuta Geracitano et al. 2004 Only two exposure concentrations
Oyster,
Crassostrea gigas
Mussel,
Mytilus edulis
Geret et al. 2002a Bioaccumulation: unmeasured exposure and
steady state not achieved
Clam,
Ruditapes decussatus Geret et al. 2002b Only three exposure concentrations
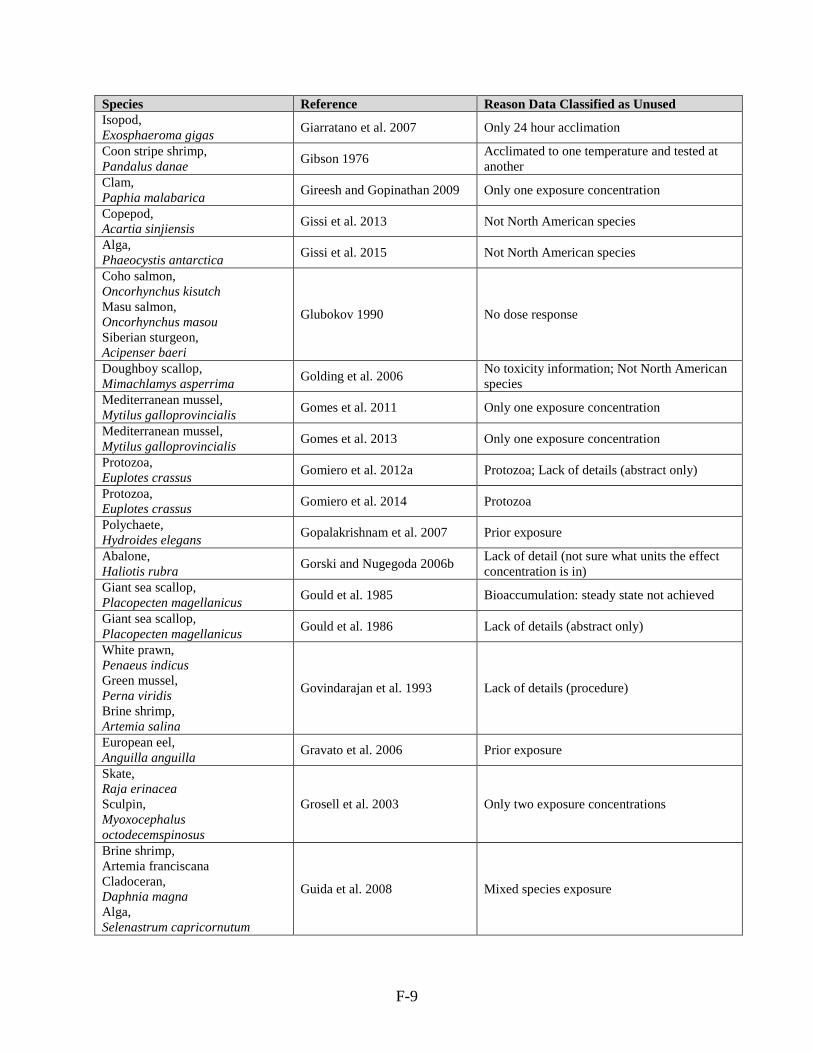
F-9
Species Reference Reason Data Classified as Unused
Isopod,
Exosphaeroma gigas Giarratano et al. 2007 Only 24 hour acclimation
Coon stripe shrimp,
Pandalus danae Gibson 1976
Acclimated to one temperature and tested at
another
Clam,
Paphia malabarica Gireesh and Gopinathan 2009 Only one exposure concentration
Copepod,
Acartia sinjiensis Gissi et al. 2013 Not North American species
Alga,
Phaeocystis antarctica Gissi et al. 2015 Not North American species
Coho salmon,
Oncorhynchus kisutch
Masu salmon,
Oncorhynchus masou
Siberian sturgeon,
Acipenser baeri
Glubokov 1990 No dose response
Doughboy scallop,
Mimachlamys asperrima Golding et al. 2006
No toxicity information; Not North American
species
Mediterranean mussel,
Mytilus galloprovincialis Gomes et al. 2011 Only one exposure concentration
Mediterranean mussel,
Mytilus galloprovincialis Gomes et al. 2013 Only one exposure concentration
Protozoa,
Euplotes crassus Gomiero et al. 2012a Protozoa; Lack of details (abstract only)
Protozoa,
Euplotes crassus Gomiero et al. 2014 Protozoa
Polychaete,
Hydroides elegans Gopalakrishnam et al. 2007 Prior exposure
Abalone,
Haliotis rubra Gorski and Nugegoda 2006b
Lack of detail (not sure what units the effect
concentration is in)
Giant sea scallop,
Placopecten magellanicus Gould et al. 1985 Bioaccumulation: steady state not achieved
Giant sea scallop,
Placopecten magellanicus Gould et al. 1986 Lack of details (abstract only)
White prawn,
Penaeus indicus
Green mussel,
Perna viridis
Brine shrimp,
Artemia salina
Govindarajan et al. 1993 Lack of details (procedure)
European eel,
Anguilla anguilla Gravato et al. 2006 Prior exposure
Skate,
Raja erinacea
Sculpin,
Myoxocephalus
octodecemspinosus
Grosell et al. 2003 Only two exposure concentrations
Brine shrimp,
Artemia franciscana
Cladoceran,
Daphnia magna
Alga,
Selenastrum capricornutum
Guida et al. 2008 Mixed species exposure

F-10
Species Reference Reason Data Classified as Unused
Dinoflagellate,
Prorocentrum minimum Guo and Ki 2012 Algal study
Dinoflagellate,
Prorocentrum minimum Guo et al. 2012 Algal study
Abalone,
Haliotis discus Guo et al. 2013 Not North American species
Babylon snail,
Babylonia areolata
Hajimad and Vedamanikam
2014 Not North American species
Handy 2003 Review
Amphipod Hanna et al. 2013 Inappropriate form of toxicant (nanoparticles)
Shore crab,
Carcinus maenas Hansen et al. 1992 Only one exposure concentration
Blue mussel,
Mytilus edulis Harrison et al. 1983 Only three exposure concentrations
Rats and Mice Hasegawa et al. 1989 Non-aquatic organisms
Polychaete,
Nereis diversicolor Hateley et al. 1989 Mixture (field exposure)
Shore crab,
Carcinus maenas Hebel et al. 1999 Only five organisms per concentration
Coral,
Montipora capitata Hedouin and Gates 2013 Not North American species
Blue mussel,
Mytilus edulis Hellou et al. 2003 Mixture
Dinoflagellate,
Alexandrium catenella Herzi et al. 2013 Contaminated dilution water
Flower crab,
Portunus pelagicus Hilmy et al. 1985
Dilution water not characterized; Not North
American species
Blue mussel,
Mytilus edulis Hines et al. 2010 Only two exposure concentrations
Brown mussel,
Perna perna Hodgson and Hoebeke 1984 Only five organisms per concentration
Blue mussel,
Mytilus edulis Hoher et al. 2013 Only three exposure concentrations
Hori et al. 1996 Lack of details (foreign language)
Isopod,
Porcellio scaber Hornung et al. 1998 Sediment present in media
Alga Horta-Puga et al. 2013 Field survey, exposure concentration not
known
Sea anemone,
Aiptasia pulchella Howe et al. 2012 Not North American species
Sea anemone,
Aiptasia pulchella Howe et al. 2014 Not North American species
Nematode,
Enoplus brevis Howell 1984 LT50 is the endpoint
Various species Hrovat et al. 2009 Review
Red alga,
Gracilaria lemaneiformis
Red alga,
Gracilaria lichenoides
Huang et al. 2013 Algal study
Baltic clam,
Macoma balthica
Cockle,
Cerastoderma edule
Hummel et al. 1998 Sediment present in media
Pacific kelps Huovinen et al. 2010 Only one exposure concentration

F-11
Species Reference Reason Data Classified as Unused
Bivalve,
Austriella cf plicifera Hutchins et al. 2008 Sediment present in media
Bivalve,
Indoaustriella lamprelli Hutchins et al. 2009 Sediment present in media
Protozoa,
Alexandrium minutum Hwang and Lu 2000 Protozoa
Copepod,
Paracyclopina nana Hwang et al. 2010 Only one exposure concentration
Amphipod,
Corophium sp. Hyne and Everett 1998
No control survival information, and author
suggests poor control survival if no sediment
present
Seabream,
Sparus aurata Isani et al. 2012 Not North American species
Indian edible oyster,
Crassostrea madrasensis Ittoop et al. 2009
Not North American species; Only three
exposure concentrations; Dilution water not
characterized
Hard clam,
Mercenaria mercenaria Ivanina et al. 2013 Only two exposure concentrations
Filter feeders Jara-Marini et al. 2013 Field survey, exposure concentration not
known
Copepod,
Tigriopus japonicus Jeong et al. 2014 Not North American species
Pearl oyster,
Pinctada fucata Jing et al. 2006 Only two exposure concentrations
Butterfish,
Poronotus triacanthus Jiraungkoorskul et al. 2007 Only one exposure concentration
Pink shrimp,
Penaeus duorarum
Shrimp,
Penaeus stylirostris
Shrimp,
Penaeus setiferus
Johnson 1974 Only two or three exposure concentrations;
Purity of test material questionable
Jones et al. 1968 Review
Isopods Jones 1975 Only two exposure concentrations
Brine shrimp,
Artemia salina Jorgensen and Jensen 1977 Brine shrimp used
Mediterranean mussel,
Mytilus galloprovincialis Kanduc et al. 2011
Field survey, exposure concentration not
known
Mangrove crab,
Macrophthalmus erato Kannupandi et al. 2001 Only three exposure concentrations
Sea bass,
Dicentrarchus labrax Kentouri et al. 1993 Only one exposure concentration
Killifish,
Aphanius dispar Khan and Khan 1999
Dilution water not characterized; Not North
American species
Heliozoon,
Raphidiophrys contractilis Khan et al. 2006
Lack of exposure details; dilution water not
characterized
Copepod,
Tigriopus japonicus Ki et al. 2009
Only one exposure concentration; Not North
American species
Copepod,
Tigriopus japonicus Kim et al. 2012
Not North American species; Lack of
exposure details
Various bivalves Klumpp and Burdon-Jones
1982 Mixture (field exposure)

F-12
Species Reference Reason Data Classified as Unused
Sea urchin,
Hemicentrotus pulcherrimus
Sea urchin,
Anthocidaris crassispina
Kobayashi and Okamura 2002 Inappropriate form of toxicant (copper
pyrithione)
Black sea bivalve mollusks,
Anadara inaequivalvis &
Chamelea gallina
Kolyuchlina and Ismailov 2011 Not North American species
Mediterranean mussel,
Mytilus galloprovincialis
Koukouzika and Dimitriadis
2008 Only one exposure concentration
Shore crab,
Carcinus maenas Krang and Ekerholm 2006 Only two exposure concentrations
Eastern oyster,
Crassostrea virginica Krishnamurthy 1994 Bioaccumulation: static exposure
Nile tilapia,
Oreochromis niloticus Kulac et al. 2013 Only one exposure concentration
Oyster,
Saccostrea cucullata
Snail,
Cerithium rubus
Kumari and Nair 1992 Bioaccumulation: static, unmeasured exposure
Coral,
Platygyra acuta Kwok and Ang 2013 Not North American species
Copepod,
Tigriopus japonicus Kwok et al. 2009 Prior exposure; Not North American species
Cuttlefish,
Sepia officinalis Lacoue-Labarthe et al. 2009
Only one exposure concentration; Not North
American species
Sea snail,
Hexaplex trunculus Lahbib et al. 2013
Field survey, exposure concentration not
known
Green alga,
Ulva lactuca
Seaweed,
Codium fragile
Seaweed,
Jania rubens
Alga,
Dictyota dichotoma
Laib and Leghouchi 2012 Field survey, exposure concentration not
known
Red sea bream,
Chrysophrys major Lan and Chen 1991 Lack of detail (text in foreign language)
Copepod,
Acartia tonsa Lauer and Bianchini 2010
Intermittent exposure (12hr exposed and 12hr
clean)
Estuarine crab,
Neohelice granulata Lauer et al. 2012
Not North American species; Only one
exposure concentration
Crab,
Chasmagnathus granulatus Lavolpe et al. 2004 Only two exposure concentrations
Ammonia (foraminifera) Le Cadre and Debenay 2006 Protozoa
Flatworm,
Stylochus pygmaeus Lee and Johnston 2007 Only two exposure concentrations
Blue crab,
Callinectes sapidus Lee and Oshima 1998
Lack of exposure details; dilution water not
characterized
Blue crab,
Callinectes sapidus Lee et al. 1999 Dilution water not characterized
Copepod,
Tigriopus japonicus Lee et al. 2008a
Only two exposure concentrations; Not North
American species

F-13
Species Reference Reason Data Classified as Unused
Hairy-handed crab,
Hemigrapsus crenulatus
Shield shell limpet,
Scutus breviculus
Lee et al. 2010 Only two exposure concentrations; Not North
American species
Blue mussel,
Mytilus edulis
Clam,
Macoma balthica
Lehtonen and Leinio 2003 Only two exposure concentrations
Copepod,
Euchaeta japonica Lewis et al. 1972 Only three exposure concentrations
Polychaete,
Spirobranchus lamarckii Lewis et al. 2013 Not North American species
Gastropod,
Onchidium struma Li et al. 2009 Sediment present in media
Chinese oyster,
Ostrea plicatula Li et al. 2010 Not North American species
Mussel,
Mytilus coruscus Li et al. 2012a Not North American species
Seagrass,
Thalassia hemprichii Li et al. 2012b
Not North American species; Only three
exposure concentrations
Shrimp,
Penaeus japonicus Liao and Hsieh 1988
LT50 is the endpoint in the acute exposure;
Chronic and bioaccumulation exposure was
not measured
Shrimp,
Penaeus chinensis Liu 1995 Lack of detail (text in foreign language)
Fish,
Synechogobius hasta Liu et al. 2010
Not North American species; Only two
exposure concentrations
Four marine bivalves Liu et al. 2012 Mixture
Crescent-banded tigerfish,
Terapon jarbua Long and Wang 2005 Prior exposure
Crab,
Petrolisthes galathinus Lopez Greco et al. 2002 Only two exposure concentrations
Blue mussel,
Mytilus edulis Lorenzo et al. 2005 Bioaccumulation: steady state not achieved
Diatoms Lozano et al. 2014 Only two exposure concentrations
Shore crab,
Carcinus maenas Lundebye and Depledge 1998a Only six organisms per concentration
Shore crab,
Carcinus maenas Lundebye and Depledge 1998b Only six organisms per concentration
Eastern oyster,
Crassostrea virginica Lunz 1972
River water used as dilution water;
Bioaccumulation: steady state not achieved
Hermit crab,
Clibanarius longitarsus Lyla and Khan 2011 Not North American species
Eastern oyster,
Crassostrea virginica Macey et al. 2010
Only four organisms per concentration; Only
three exposure concentrations
Guppy,
Poecilia vivipara Machado et al. 2013
Not North American species; Only three
exposure concentrations
Eastern oyster,
Crassostrea virginica MacInnes 1981 Mixture
Mud snail,
Nassarius obsoletus MacInnes and Thurberg 1973
Too few organisms per exposure concentration
(n=5)
Stone-loach,
Nemacheilus barbatulus Mackereth and Smyly 1951 Lack of details (abstract only)

F-14
Species Reference Reason Data Classified as Unused
Spiny lobster,
Panulirus homarus Maharajan et al. 2011
Not North American species; Only two
exposure concentrations
Spiny lobster,
Panulirus homarus Maharajan et al. 2012a
Not North American species; Only two
exposure concentrations
Spiny lobster,
Panulirus homarus Maharajan et al. 2012b Not North American species
Sponge,
Hymeniacidon perlevis Mahaut et al. 2013
Field survey, exposure concentration not
known
Pacific oyster,
Crassostrea gigas Mai et al. 2012 Only three exposure concentrations
Diatom,
Odontella mobiliensis Manimaran et al. 2012 Algal study
Various bivalves Manley and Davenport 1979 Review
Grass shrimp,
Palaemonetes pugio Manyin 2008
Only acclimated for 24 hours; Only two
exposure concentrations
Grass shrimp,
Palaemonetes pugio Manyin and Rowe 2009 Only three exposure concentrations
Grass shrimp,
Palaemonetes pugio Manyin and Rowe 2010 Only two exposure concentrations
Limpet,
Patella vulgata Marchan et al. 1999 Surgically altered test species
Blue mussel,
Mytilus edulis Martin et al. 1975 Chelating agent used in exposure media
Shore clam,
Ruditapes philippinarum Martin-Diaz et al. 2005 Only one exposure concentration
Blue crab,
Callinectes sapidus Martins et al. 2011a Only one exposure concentration
Persian sturgeon,
Acipenser persicus Mashroofeh et al. 2012
Field survey, exposure concentration not
known
Clam,
Sunetta scripta
Mussel,
Perna viridis
Mathew and Damodaran 1997 Only one exposure concentration
Mussel,
Perna viridis
Clam,
Meretrix casta
Mathew and Menon 1984 Insufficient acclimation time
European sea star,
Asterias rubens Matranga et al. 2012 Mixture; Not North American species
Amphipod,
Corophium volutator
Polychaete,
Hediste diversicolor
Mayor et al. 2008 Sediment toxicity test
Amphipod,
Leptocheirus plumulosus McGee et al. 1999 Mixture and sediment exposure
Bryzoa,
Watersipora subtorquata McKenzie et al. 2011 Only two exposure concentrations
Lobster,
Homarus americanus McLeese 1974
LT50 is the endpoint; Only five organisms per
concentration
McLeese 1976 Species name not given

F-15
Species Reference Reason Data Classified as Unused
Clam,
Macoma balthica
Shrimp,
Crangon septemspinosa
Shrimp,
Pandalus montagui
Polychaete,
Nereis virens
McLeese and Ray 1986 Only six organisms per concentration
Crab,
Chasmagnathus granulata Medesani et al. 2004a Only one exposure concentration
Crab,
Chasmagnathus granulata Medesani et al. 2004b Only one exposure concentration
Amphipod,
Corophium multisetosum Menchaca et al. 2010
Not North American species; Sediment
exposure
Polychaete,
Capitella sp. Mendez and Green-Ruiz 2005 Only three exposure concentrations
Polychaete,
Capitella sp. Mendez and Green-Ruiz 2006 Only three exposure concentrations
Pacific oyster,
Crassostrea gigas Metzger et al. 2012 Only one exposure concentration
Turbot,
Psetta maxima Mhadhbi et al. 2010 Not North American species
Blue-green alga,
Synechococcus sp.
Diatom,
Thalassiosira weissflogii
Dinoflagellate,
Prorocentrum minimum
Miao et al. 2005 Algal study; Excessive NTA in the media
Ribbed mussel,
Geukensia demissa Miller 1986 Lack of details (abstract only)
Ribbed mussel,
Geukensia demissa Miller 1988 Only two exposure concentrations
Meiofaunal community Millward et al. 2001 Mixture
Sea bream,
Sparus aurata Minghetti et al. 2008 Prior exposure
Diatom,
Haslea ostrearia Minier et al. 1998 Algal study
Shrimp,
Penaeus monodon Misra et al. 2005
Not North American species; Dilution water
not characterized
White mussel,
Donax trunculus Mizrahi and Achituv 1989
Not North Americans species; Only five
organisms per concentration
White mussel,
Donax trunculus Mizrahi et al. 1993
Not North Americans species; Only three
exposure concentrations
Mummichog,
Fundulus heteroclitus Mochida et al. 2008 Mixture
Fish Mohan et al. 2012 Field survey, exposure concentration not
known
Coral Mokhtar et al. 2012 Field survey, exposure concentration not
known
Pacific oyster,
Crassostrea gigas Money et al. 2011 Mixture

F-16
Species Reference Reason Data Classified as Unused
Mediterranean mussel,
Mytilus galloprovincialis
Blue mussel,
Mytilus edulis
Moore et al. 2007 Only one exposure concentration
Oyster,
Crassostrea gigas Moraga et al. 2005 Only two exposure concentrations
Brown alga,
Ectocarpus siliculosus Morris and Russell 1973 Algal study; Prior exposure (tolerant strain)
Mozambique tilapia,
Oreochromis mossambica Mukhopadhyay 1983 Lack of details (abstract only)
Clam,
Tapes philippinarum Munari and Mistri 2007
Only one exposure concentration; Possible
prior exposure
Shrimp,
Penaeus monodon Munshi et al. 1996a
Not North American species; Variable time for
LC50 values
Shrimp,
Penaeus penicillatus Munshi et al. 1996b Only acclimated for one hour
Blue crab,
Callinectes sapidus Mutlu et al. 2011
Field survey, exposure concentration not
known
Pikeperch Nabavi et al. 2012 Field survey, exposure concentration not
known
Mussel,
Mytilus trossolus Nadella et al. 2009 Only acclimated for 24 hours
Mussel,
Mytilus viridis Nair et al. 1977 Only eight animals per concentration
Common cockle,
Cerastoderma edule Naylor 1987 Not North American species
Blue crab,
Callinectes similis Neff and Anderson 1977 Only three exposure concentrations
Polychaete,
Pectinaria koreni
Polychaete,
Nephthys ciliata
Mussel,
Mytilus calcarea
Mussel,
Mytilus baltica
Neuhoff and Theede 1984 Lack of details (procedure)
Mussel,
Perna viridis Nicholson 1999 Only three exposure concentrations
Green mussel,
Perna viridis Ng and Wang 2007 Mixture
European eel,
Anguilla anguilla Nunes et al. 2014 Only three exposure concentrations
Polychaete,
Eurythoe complanata Nusetti et al. 1998 Only one exposure concentration
Senegal sole,
Solea senegalensis Oliva et al. 2009
Not North American species; Only acclimated
for 24 hours
European eel,
Anguilla anguilla Oliveira et al. 2008 Only one exposure concentration
Fish and shellfish Olmedo et al. 2013 Field survey, exposure concentration not
known
Fish and crustaceans Olsen 2011 Review of previously published studies

F-17
Species Reference Reason Data Classified as Unused
Flat oyster,
Ostrea edulis
Pacific oyster,
Crassostrea gigas
Ong et al. 2013 Field survey, exposure concentration not
known
Mummichog,
Fundulus heteroclitus Ortiz et al. 1999
Bioaccumulation: static, unmeasured
exposure, steady state not achieved
Hermit crab,
Clibanarius africanus Otitoloju and Don-Pedro 2006 Sediment present in media
Alga,
Fucus vesiculosus Owen et al. 2012 Algal study; Only two exposure concentrations
Fish and mollusks Oya et al. 1939 Text in foreign language
Mussel,
Lithophaga lithophaga Ozsuer and Sunlu 2013
Field survey, exposure concentration not
known
Blue crab,
Callinectes sapidus Paganini and Bianchini 2009 Excised cells
Sea urchin,
Paracentrotus lividus
Sea urchin,
Echinus esculentus
Pagano et al. 1986 Lack of details (procedures; dilution water not
characterized)
Sea urchin Pagano et al. 2002 Mixture
Crab,
Charybdis japonica Pan et al. 2011 Not North American species
Copepod,
Tigriopus japonicus Park et al. 2014 Not North American species
Scallop,
Pecten maximus
Oyster,
Crassostrea gigas
Paul and Davies 1986 Formulation (Hard Racing Red)
Red drum,
Sciaenops ocellatus Peppard et al. 1991 Formulation (Copper Control®, 8.5% copper)
Mussel,
Perna perna Pereira et al. 2007 Mixture
Pistol prawn,
Alpheus malabaricus malabaricus
Perumal and Subramanian
1985 Excessive control mortality (20%)
Polychaete,
Neanthes arenaceodentata Pesch 1979 Only one exposure concentration
Green mussel,
Perna viridis Pillai and Menon 1998 Excised tissue
Mangrove crab,
Ucides cordatus Pinheiro et al. 2012 Mixture
Copepod,
Acartia tonsa Pinho et al. 2007 Only one exposure concentration
Sea urchin,
Paracentrotus lividus Pinsino et al. 2011 Only one exposure concentration
Bryzoans Piola and Johnston 2009 Surgically altered test species
Polychaete,
Nereis diversicolor Pook et al. 2009 Prior exposure
Amphipod,
Gammarus aequicauda Prato and Biandolino 2005 Sediment toxicity test
Copepod,
Tigriopus fulvus Prato et al. 2013a Not North American species
Amphipod,
Gammarus aequicauda Prato et al. 2013b Only two exposure concentrations
Oyster Prytherch 1931 Mixture (field exposure)

F-18
Species Reference Reason Data Classified as Unused
Mediterranean mussel,
Mytilus galloprovincialis Pytharopoulou et al. 2011 Only three exposure concentrations
Mediterranean mussel,
Mytilus galloprovincialis Pytharopoulou et al. 2013 Only one exposure concentration
Decapod,
Palaemonetes varians Rainbow and Smith 2013 Not North American species
Mullet,
Mugil cephalus Rajkumar and Milton 2011a Dilution water not characterized
Green mussel,
Perna viridis Rajkumar and Milton 2011b Dilution water not characterized
Snail,
Cerithidae cingulata
Bivalve,
Modiolus philippinarum
Ramakritinan et al. 2012 Not North American species
Polychaete,
Nereis sp. Raymont and Shields 1963
Inappropriate form of toxicant (copper sodium
citrate)
Crab,
Scylla serrata Reddy 1997 Only one exposure concentration
Green alga,
Enteromorpha compressa Reed and Moffat 1983 Plant study
Antarctic scallop,
Adamussium colbecki Regoli et al. 1997 Only one exposure concentration
Antarctic scallop,
Adamussium colbecki Regoli et al. 1998 Only two exposure concentrations
Coral,
Goniastrea aspera
Reichelt-Brushett and Harrison
1999 Only three exposure concentrations
Coral,
Lobophytum compactum
Reichelt-Brushett and
Michalek-Wagner 2005
Not North American species; Lack of details
(exposure duration not given)
Polychaetes Reish 1978 Lack of details (procedure)
Amphipod,
Corophium insidiosum
Amphipod,
Elasmopus bampo
Reish 1993 No control survival information
Polychaete,
Ctenodrilus serratus
Polychaete,
Ophryotrocha diadema
Reish and Carr 1978 Citrate added to dilution water
Polychaetes Reish and LeMay 1991 Dilution water not characterized
Polychaete,
Neanthes arenaceodentata
Polychaete,
Capitella capitata
Reish et al. 1976 Citrate added to dilution water
Copepod,
Tigriopus japonicus Rhee et al. 2009 Not North American species
Copepod,
Tigriopus japonicus Rhee et al. 2013
Not North American species; Only three
exposure concentrations
Eastern oyster,
Crassostrea virginica Ringwood et al. 1998 Only two exposure concentrations
Copepod,
Tigriopus fulvus Rinna et al. 2011 Not North American species
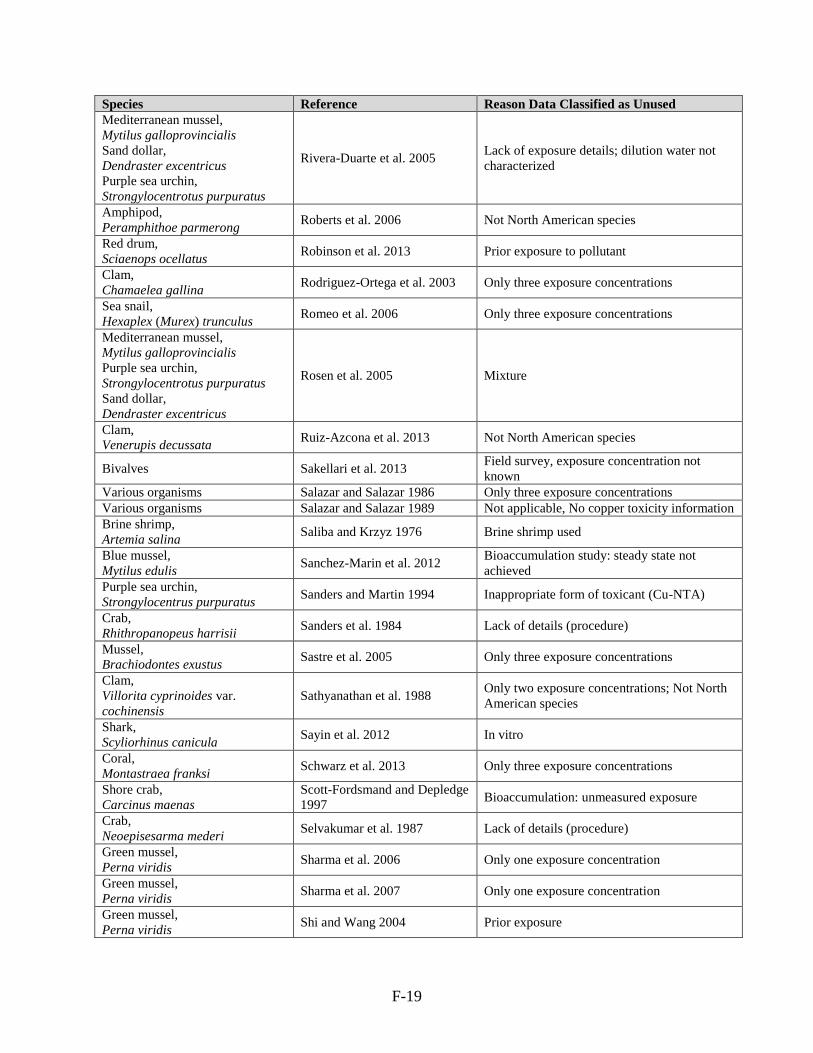
F-19
Species Reference Reason Data Classified as Unused
Mediterranean mussel,
Mytilus galloprovincialis
Sand dollar,
Dendraster excentricus
Purple sea urchin,
Strongylocentrotus purpuratus
Rivera-Duarte et al. 2005 Lack of exposure details; dilution water not
characterized
Amphipod,
Peramphithoe parmerong Roberts et al. 2006 Not North American species
Red drum,
Sciaenops ocellatus Robinson et al. 2013 Prior exposure to pollutant
Clam,
Chamaelea gallina Rodriguez-Ortega et al. 2003 Only three exposure concentrations
Sea snail,
Hexaplex (Murex) trunculus Romeo et al. 2006 Only three exposure concentrations
Mediterranean mussel,
Mytilus galloprovincialis
Purple sea urchin,
Strongylocentrotus purpuratus
Sand dollar,
Dendraster excentricus
Rosen et al. 2005 Mixture
Clam,
Venerupis decussata Ruiz-Azcona et al. 2013 Not North American species
Bivalves Sakellari et al. 2013 Field survey, exposure concentration not
known
Various organisms Salazar and Salazar 1986 Only three exposure concentrations
Various organisms Salazar and Salazar 1989 Not applicable, No copper toxicity information
Brine shrimp,
Artemia salina Saliba and Krzyz 1976 Brine shrimp used
Blue mussel,
Mytilus edulis Sanchez-Marin et al. 2012
Bioaccumulation study: steady state not
achieved
Purple sea urchin,
Strongylocentrus purpuratus Sanders and Martin 1994 Inappropriate form of toxicant (Cu-NTA)
Crab,
Rhithropanopeus harrisii Sanders et al. 1984 Lack of details (procedure)
Mussel,
Brachiodontes exustus Sastre et al. 2005 Only three exposure concentrations
Clam,
Villorita cyprinoides var.
cochinensis
Sathyanathan et al. 1988 Only two exposure concentrations; Not North
American species
Shark,
Scyliorhinus canicula Sayin et al. 2012 In vitro
Coral,
Montastraea franksi Schwarz et al. 2013 Only three exposure concentrations
Shore crab,
Carcinus maenas
Scott-Fordsmand and Depledge
1997 Bioaccumulation: unmeasured exposure
Crab,
Neoepisesarma mederi Selvakumar et al. 1987 Lack of details (procedure)
Green mussel,
Perna viridis Sharma et al. 2006 Only one exposure concentration
Green mussel,
Perna viridis Sharma et al. 2007 Only one exposure concentration
Green mussel,
Perna viridis Shi and Wang 2004 Prior exposure

F-20
Species Reference Reason Data Classified as Unused
Sea anemone,
Exaiptasia pallida Siddiqui et al. 2015 Only two exposure concentrations
Abalone,
Haliotis rufescens Silva-Aciares et al. 2013 Only two exposure concentrations
Burrowing crab,
Neohelice granulata Simonetti et al. 2012
Field survey, exposure concentration not
known
Bivalve,
Tellina deltoidalis Simpson et al. 2012
Not North American species; Sediment
exposure
Prawn,
Metapenaeus dobsoni Sivadasan et al. 1986 Not North American species; Test species fed
Clam,
Ruditapes decussatus Sobral and Widdows 1997
Bioaccumulation: unmeasured exposure,
steady state not achieved
White shrimp,
Litopenaeus vannamei Soegianto et al. 2013 Only three exposure concentrations
Javelin goby,
Synechogobius hasta Song et al. 2013
Not North American species; Only three
exposure concentrations
Javelin goby,
Synechogobius hasta Song et al. 2014 Not North American species
Brown alga,
Dictyota kunthii Sordet et al. 2014 Only one exposure concentration
Winkle,
Littorina littorea Soto et al. 1999 Excised tissue
Snail,
Nassarius reticulatus Sousa et al. 2005 Not North American species
Hydroid,
Campanularia flexuosa Stebbing 1981 Colony exposure
Blue mussel,
Mytilus edulis Steinert and Pickwell 1985 Excised tissue
Abalone,
Haliotis midae Stofberg et al. 2011
Not North American species; Poor control
survival (≤20%)
Amphipod,
Melita plumulosa
Bivalve,
Spisula trigonella
Bivalve,
Tellina deltoidalis
Strom et al. 2011 Sediment exposure
Brown alga,
Ascophyllum nodosum Stromgren 1979 Algal study
Alga,
Synechococcus Stuart et al. 2009 Inappropriate form of toxicant (Cu-EDTA)
Blue mussel,
Mytilus edulis Sturesson 1984 Bioaccumulation: unmeasured exposure
Polychaete,
Perinereis aibuhitensis Sun et al. 2009 Not North American species
Copepod,
Acartia tonsa Sunda et al. 1990 Mixture
Blue mussel,
Mytilus edulis Sunila 1988 Only one exposure concentration
Blue mussel,
Mytilus edulis Sutherland and Major 1981 Only one exposure concentration
Sea urchin,
Strongylocentrotus intermedius
Sea urchin,
Strongylocentrotus nudus
Syasina et al. 1992 Only two exposure concentrations

F-21
Species Reference Reason Data Classified as Unused
Green mussel,
Perna viridis
Mussel,
Septifer virgatus
Sze and Lee 1995 Only one exposure concentration
Pacific oyster,
Crassostrea gigas Tanguy et al. 2002 Only one exposure concentration
Sydney rock oyster,
Saccostrea glomerata Taylor et al. 2013 Only one exposure concentration
European eel,
Anguilla anguilla Teles et al. 2005 Only two exposure concentrations
Green mussel,
Perna viridis Thiagarajan et al. 2006 Only one exposure concentration
Fish Thiyagarajan et al. 2012 Field survey, exposure concentration not
known
Mummichog,
Fundulus heteroclitus Thomas 1915 Only one exposure concentration
Green crab,
Carcinus maenas
Rock crab,
Cancer irroratus
Thurberg et al. 1973 Copper level high in dilution water
Blue mussel,
Mytilus edulis Trevisan et al. 2011 Only one exposure concentration
Shore crab,
Carcinus maenas Truchot and Rtal 1998 Bioaccumulation: steady state not achieved
Mussel,
Mytilus californianus
Blue mussel,
Mytilus edulis
Tullis 1980 Only four organisms per concentration
Brine shrimp,
Artemia salina Umarani et al. 2012 Brine shrimp used
Crab,
Sesarma quadratum Valarmathi and Azariah 2002 Only two exposure concentrations
Gilthead seabream,
Sparus aurata Varo et al. 2007 Only three exposure concentrations
Bivalve,
Glycymeris yessoensis Vasil'eva et al. 1979 Bioaccumulation: unmeasured exposure
Mysid,
Mysidopsis juniae Vaz et al. 2011a
Lack of details (procedure); Not North
American species
Mysid,
Mysidopsis juniae Vaz et al. 2011b
Inappropriate form of toxicant (nanoparticles);
Not North American species
Babylon snail,
Babylonia areolata
Vedamanikam and Hayimad
2014 Not North American species
Abalone,
Haliotis rufescens Viant et al. 2002 Only two exposure concentrations
Protozoa,
Euplotes crassus Viarengo et al. 1996 Protozoa
Brown mussel,
Perna perna Vosloo et al. 2012
Bioaccumulation study: steady state not
achieved
Nematode,
Monhystera disjuncta Vranken et al. 1991 Agar media used
Saltmarsh cordgrass,
Spartina alterniflora Waddell and Kraus 1990 Terrestrial exposure
Cladoceran,
Moina monogolica Wang et al. 2007a Dietary exposure

F-22
Species Reference Reason Data Classified as Unused
Abalone,
Haliotis discus hannai Wang et al. 2009 Not North American species
Sea urchin,
Strongylocentrotus intermedius Wang et al. 2011a Not North American species; Mixture
Bivalves Wang et al. 2011b Field survey, exposure concentration not
known
Grouper,
Epinephelus coioides Wang et al. 2014 Only two exposure concentration
Alga,
Aureococcus anophagefferens Wange et al. 2012 Algal study; Excessive EDTA in the media
Rock sea urchin,
Paracentrotus lividus Warnau et al. 1996
Not North American species; Dilution water
not characterized
Sea urchin,
Arbacia punctulata Waterman 1937 Lack of details (procedure)
Mollusks Watling 1981 Lack of exposure details; dilution water not
characterized
Brown alga,
Aureococcus anophagefferens Wei et al. 2013 Only three exposure concentrations
Macroalga,
Ulva lactuca Wendt et al. 2013 Algal study
Polychaete,
Perinereis nuntia Won et al. 2012
Only one exposure concentration; Not North
American species
Shore crab,
Carcinus maenas Wong and Rainbow 1986 Method paper
Soft shell clam,
Mya arenaria
Eastern oyster,
Crassostrea virginica
Wright and Zamuda 1987 Bioaccumualtion: steady state not achieved;
Chelator (NTA) added to dilution water
Green mussel,
Perna viridis Wu and Wang 2010 Only one exposure concentration
Prawn,
Penaeus orientalis kishinouye
Clam,
Potamocorbula laevis
Xu and Jing 1995 Dilution water not characterized
Sea urchin,
Glyptocidaris crenularis Xu et al. 2010
Not North American species; Lack of
exposure details
Black abalone,
Haliotis cracherodii Yaffe 1979
Only one exposure concentration; No true
control croup
Polychaeta,
Perinereis aibuhitensis Yang et al. 2012 Only three exposure concentrations
Sea urchin,
Arbacia punctulata Young and Nelson 1974 Only one exposure concentration
Chinese prawn,
Penaeus orientalis Zang et al. 1993
Dilution water not characterized; Not North
American species
Oyster,
Crassostrea hongkongensis Zhang and Zhang 2012 Not North American species
Clam,
Venerupis (Ruditapes)
philippinarum
Zhang et al. 2012 Only two exposure concentrations
Guppy,
Poecilia vivipara Zimmer et al. 2012
Not North American species; Only one
exposure concentrations
Ornate wrasse,
Thalassoma pavo Zizza et al. 2014 Not North American species

G-1
Appendix G Species Numbers Used in BLM Analysis

G-2
Appendix Table G-1. Species Numbers Used in BLM Analysis.
Organism Species
Species
Number
Blue mussel Mytilus edulis 1
Mussel Mytilus galloprovincialis 2
Copepod Tigriopus californicus 3
Summer flounder Paralichthys dentatus 4
Red abalone Haliotis rufescens 5
Black abalone Haliotis cracherodii 6
Mysid Holmesimysis costata 7
Eastern oyster Crassostrea virginica 8
Pacific oyster Crassostrea gigas 9
Purple sea urchin Strongylocentrotus purpuratus 10
Green sea urchin Strongylocentrotus droebachiensis 11
Coot clam Mulinia lateralis 12
Long-spined sea urchin Diadema antillarum 13
Sea urchin Arbacia punctulata 14
Bay scallop Argopecten irradians 15
Copepod Acartia tonsa 16
Copepod Acartia clausi 17
Sand dollar Dendraster excentricus 18
Copepod Eurytemora affinis 19
Softshell clam Mya arenaria 20
Rotifer Brachionus plicatilis 21
Surf clam Spisula solidissima 22
Lobster Homarus americanus 23
Mysid Neomysis mercedis 24
Dungeness crab Cancer magister 25
Polychaete Anaitides maculata 26
Cabezon Scorpaenichthys marmoratus 27
Inland silverside Menidia beryllina 28
Tidewater silverside Menidia peninsulae 29
Atlantic silverside Menidia menidia 30
Sea anemone Aiptasia pallida 31
Amphipod Elasmopus rapax 32
Mysid Americamysis bigelowi 33
Mysid Americamysis bahia 34
Amphipod Orchomenella pinguis 35
Polychaete Hydroides elegans 36
Copepod Tisbe furcata 37
Copepod Pseudodiaptomus coronatus 38
Winter flounder Pseudopleuronectes americanus 39
Shrimp Metapenaeus sp. 40
Polychaete Neanthes arenaceodentata 41
Amphipod Echinogammarus olivii 42
Topsmelt Atherinops affinis 43
Spot Leiostomus xanthurus 44
Squid Loligo opalescens 45

G-3
Organism Species
Species
Number
Striped bass Morone saxatilis 46
Shrimp Crangon crangon 47
Pink shrimp Farfantepenaeus duorarum 48
Barnacle Balanus amphitrite 49
Barnacle Balanus eburneus 50
Hard clam Mercenaria mercenaria 51
Coho salmon Oncorhynchus kisutch 52
Sheepshead minnow Cyprinodon variegatus 53
Leon Springs pupfish Cyprinodon bovinus 54
Amphipod Allorchestes compressa 55
Mummichog Fundulus heteroclitus 56
Bristle star Ophionereis dubia 57
Shiner perch Cymatogaster aggregata 58
Polychaete Hediste diversicolor 59
Asian green mussel Perna viridis 60
Shore crab Carcinus maenas 61
Pompano Trachinotus carolinus 62
Tiger shrimp Penaeus monodon 63
Grooved snail Planaxis sulcatus 64
Whelk Turbo coronatus 65
Sheepshead Archosargus probatocephalus 66
Gastropod Crepidula convexa 67
Gastropod Crepidula fornicata 68
Isopod Sphaeroma serratum 69
Polychaete Eurythoe complanata 70
Copepod Amphiascoides atopus 71
Decapod Palaemon elegans 72
Sand crab Emerita analoga 73
Thornfish Terapon jarbua 74
Grass shrimp Palaemonetes pugio 75
Whiteleg shrimp Litopenaeus vannamei 76
Mud-skipper Boleophthalmus sp. 77
Copepod Nitokra spinipes 78
Pinfish Lagodon rhomboides 79
Fat snook Centropomus parallelus 80
Striped mullet Mugil cephalus 81
Mangrove killifish Rivulus marmoratus 82
Atlantic croaker Micropogonias undulatus 83
Blue crab Callinectes sapidus 84
Amphipod Gammarus duebeni 85
Horseshoe crab Limulus polyphemus 86
Gulf toadfish Opsanus beta 87
Clam Rangia cuneata 88
Amphipod Corophium volutator 89

H-1
Appendix H Water Chemistry Used in BLM Analysis

H-2
Normalizing the toxicity data with the marine BLM requires four water chemistry
parameters in seawater: salinity, pH, DOC, and temperature. The marine BLM calculation uses
all the same ions that are needed in the freshwater BLM (i.e., Ca, Mg, Na, K, SO4, Cl, and
alkalinity), but these ion concentrations are calculated from salinity with the assumption that ion
composition of marine waters is constant. To normalize the toxicity data included in this
document the complete BLM chemistry for each reported value is needed. If any of the four
marine BLM parameters were missing from the data source, values for the missing parameters
were estimated.
Several strategies were used to in the process for determining suitable estimates for
missing parameters.
1. If the missing data were from a natural water body and other data were reported for the
same or similar location, then an average value from the reported values was used as an
estimate for missing values. Similarly, if the missing data were from a study in artificial
seawater and other studies reported chemistry for the same type of artificial seawater,
then an average value from the reported chemistry was used to estimate missing values.
2. For DOC in artificial seawaters, the reported DOC concentrations in Arnold et al. (2007)
were used for any test conducted in either Instant Ocean or Tropic Marine salts.
3. If there were no other data for a location or artificial water, or the location was not given,
then default values were used. These values were 30 ppt of salinity, pH of 7.8, 2.00 mg
C/L of DOC, and a temperature of 20°C. These values were chosen based on the typical
composition of seawater, and the average conditions reported in other toxicity tests.

H-3
Appendix Table H-1. Water Chemistry Used in BLM Analysis.
BLM
Data
Label
Genus
Reported chemistry Reported plus assumed chemistrya
Source water type Salinity,
g/kg pH
DOC,
mg C/L
Temp,
°C
Salinity,
g/kg pH
DOC,
mg C/L
Temp,
°C
1 Acartia 30 30.00 7.80 2.00 20.00
2 Acartia Artificial saltwater 30 10 30.00 7.80 2.00 10.00
4 Acartia Natural saltwater (location not given) 10 10.00 7.80 2.00 20.00
5 Acartia Natural saltwater (location not given) 10 10.00 7.80 2.00 20.00
6 Acartia Natural saltwater (location not given) 30 30.00 7.80 2.00 20.00
7 Acartia Natural saltwater (location not given) 30 20 30.00 7.80 2.00 20.00
12 Aiptasia Natural seawater, filtered (SW; Whitney Laboratory) 35.00 23.00 35.00 7.80 2.00 23.00
14 Allorchestes Natural saltwater (location not given) 34.1 7.8 20.3 34.10 7.80 2.00 20.30
16 Americamysis Natural saltwater (location not given) 30 22.5 30.00 7.80 2.00 22.50
17 Americamysis Natural saltwater (Narragansett Bay, Narragansett, RI) 31 7.755 20 31.00 7.76 1.45 20.00
18 Americamysis Natural saltwater (Santa Rosa Sound, FL) 25 7.95 25 25.00 7.95 2.00 25.00
19 Americamysis Natural saltwater (Narragansett Bay, RI) 30 7 20 30.00 7.00 1.45 20.00
20 Americamysis Natural saltwater (Narragansett Bay, RI) 30 8 20 30.00 8.00 1.45 20.00
21 Americamysis Natural saltwater (Narragansett Bay, RI) 30 9 20 30.00 9.00 1.45 20.00
23 Americamysis 30 30.00 7.80 2.00 20.00
30 Archosargus Artificial saltwater (Sea Lakes Systems, Euclid, OH) 30 22 30.00 7.80 2.00 22.00
32 Argopecten Natural saltwater (location not given) 25 7.2 20 25.00 7.20 2.00 20.00
36 Atherinops Natural saltwater (Granite Canyon, Monterey County, CA) 35 7.8 21 35.00 7.80 1.74 21.00
37 Atherinops Natural saltwater (Granite Canyon, Monterey County, CA) 35 7.8 21 35.00 7.80 1.74 21.00
38 Atherinops Natural saltwater (Granite Canyon, Monterey County, CA) 35 7.8 21 35.00 7.80 1.74 21.00
44 Balanus Artificial saltwater 34 24 34.00 7.80 2.00 24.00
45 Balanus Artificial saltwater 34 24 34.00 7.80 2.00 24.00
46 Balanus Artificial saltwater 34 24 34.00 7.80 2.00 24.00
48 Boleophthalmus Natural saltwater (location not given) 37.54 7.92 20 37.54 7.92 2.00 20.00
50 Brachionus Artificial saltwater (Instant Ocean®) 15 7.45 <1.0 25 15.00 7.45 1.00 25.00
51 Brachionus Artificial saltwater (Instant Ocean®) 15 7.45 <1.0 25 15.00 7.45 1.00 25.00
53 Brachionus Artificial saltwater (Instant Ocean®) 6 7.6 <0.5 25.05 6.00 7.60 0.50 25.05
54 Brachionus Artificial saltwater (Instant Ocean®) 11 7.6 <0.5 25.05 11.00 7.60 0.50 25.05
55 Brachionus Artificial saltwater (Instant Ocean®) 15 7.8 <0.5 25.05 15.00 7.80 0.50 25.05
56 Brachionus Artificial saltwater (Instant Ocean®) 24 7.9 <0.5 25.05 24.00 7.90 0.50 25.05
57 Brachionus Artificial saltwater (Instant Ocean®) 29 7.9 <0.5 25.05 29.00 7.90 0.50 25.05
58 Brachionus Natural saltwater (Little Egg Harbor, NJ) 7 6.8 4.1 25.05 7.00 6.80 4.10 25.05
59 Brachionus Natural saltwater (Little Egg Harbor, NJ) 7 8.3 4 25.05 7.00 8.30 4.00 25.05
60 Brachionus Natural saltwater (Little Egg Harbor, NJ) 13 7.6 1.7 25.05 13.00 7.60 1.70 25.05
61 Brachionus Natural saltwater (Little Egg Harbor, NJ) 13 8.6 1.7 25.05 13.00 8.60 1.70 25.05
65 Callinectes Natural saltwater (Cassino Beach, Rio Grande, Brazil) 2.00 7.12 0.41 20.10 2.00 7.12 0.41 20.10
66 Callinectes Natural saltwater (Cassino Beach, Rio Grande, Brazil) 30 7.28 5.20 20.30 30.00 7.28 5.20 20.30

H-4
BLM
Data
Label
Genus
Reported chemistry Reported plus assumed chemistrya
Source water type Salinity,
g/kg pH
DOC,
mg C/L
Temp,
°C
Salinity,
g/kg pH
DOC,
mg C/L
Temp,
°C
68 Cancer Natural saltwater (Big Sur, Monterey County, CA) 33.79 8.1 15 33.79 8.10 2.00 15.00
69 Cancer Natural saltwater (Puget Sound at West Point, Seattle, WA) 30 8.1 8.5 30.00 8.10 1.46 8.50
71 Carcinus Natural saltwater (location not given) 15 30.00 7.80 2.00 15.00
79 Corophium Natural saltwater (Ythan estuary, Aberdeenshire, Scotland) 32 7.2 11 32.00 7.20 2.00 11.00
85 Crangon Natural saltwater (location not given) 15 30.00 7.80 2.00 15.00
88 Crassostrea Natural seawater, unfiltered 33 8 13 33.00 7.80 2.00 20.00
89 Crassostrea Natural saltwater (Monterey, CA) 33 8.2 20 33.00 8.20 2.00 20.00
90 Crassostrea Natural saltwater (Bodega Bay, CA) 30 7.6 1.68
(TOC) 20 30.00 7.60 1.68 20.00
93 Crassostrea Natural saltwater (Bodega Bay, CA) 30 7.6 20 30.00 7.60 0.89 20.00
94 Crassostrea Natural saltwater (Big Sur, Monterey County, CA) 33.79 8.1 20 33.79 8.10 2.00 20.00
96 Crassostrea Natural saltwater (U.C. Marine Laboratory, Bodega Bay, CA) 30 <0.5 16 30.00 7.60 0.50 16.00
97 Crassostrea Natural saltwater (U.C. Marine Laboratory, Bodega Bay, CA) 30 <0.5 16 30.00 7.60 0.50 16.00
106 Crassostrea Natural saltwater (location not given) 26 7.7 20 26.00 7.70 2.00 20.00
107 Crassostrea Natural saltwater (location not given) 26 7.7 25 26.00 7.70 2.00 25.00
108 Crassostrea Natural saltwater (location not given) 26 7.7 30 26.00 7.70 2.00 30.00
109 Crassostrea Natural and Artificial saltwater 29.8 7.75 0.8 25 29.80 7.75 0.80 25.00
110 Crassostrea Natural and Artificial saltwater 29.6 7.82 2.6 25 29.60 7.82 2.60 25.00
111 Crassostrea Natural and Artificial saltwater 29.7 7.92 3.9 25 29.70 7.92 3.90 25.00
112 Crassostrea Natural and Artificial saltwater 29.6 7.97 5.7 25 29.60 7.97 5.70 25.00
114 Crepidula Artificial saltwater (Instant Ocean) 30 20 30.00 7.43 0.20 20.00
116 Crepidula Artificial saltwater (Instant Ocean) 30 20 30.00 7.43 0.20 20.00
118 Cymatogaster Natural saltwater (Puget Sound at West Point, Seattle, WA) 29.5 7.8 13.2 29.50 7.80 1.46 13.20
120 Cyprinodon Natural saltwater (ERLN, Narragansett, RI) 30 25 30.00 7.92 1.45 25.00
125 Dendraster Natural saltwater (Puget Sound at West Point, Seattle, WA) 30 8.5 12.75 30.00 8.50 1.46 12.75
129 Dendraster Natural and Artificial saltwater 32 7.85 1.2 15 32.00 7.85 1.20 15.00
130 Dendraster Natural and Artificial saltwater 32 7.84 2.1 15 32.00 7.84 2.10 15.00
131 Dendraster Natural and Artificial saltwater 32 7.88 3.5 15 32.00 7.88 3.50 15.00
132 Dendraster Natural and Artificial saltwater 32 7.89 5 15 32.00 7.89 5.00 15.00
134 Diadema Natural saltwater 33 33.00 7.80 2.00 20.00
137 Echinogammarus Natural saltwater (location not given) 17 8.1 15 17.00 8.10 2.00 15.00
141 Elasmopus Artificial saltwater (Tropic Marine) 33 8.25 25 33.00 8.25 0.60 25.00
142 Elasmopus Artificial seawater (FAS; sea salt: Tropic Marine, Germany) 33.00 8.25 25.00 33.00 8.25 0.60 25.00
144 Emerita Natural saltwater (Pingueral Beach, Concepcion, Chile) 30 7.9 15 30.00 7.90 2.00 15.00
151 Eurytemora 30 30.00 7.80 2.00 20.00
152 Eurytemora Artificial saltwater 30 20 30.00 7.80 2.00 20.00
153 Eurytemora Natural saltwater (location not given) 30.00 7.80 2.00 20.00
154 Eurytemora Natural saltwater (location not given) 30.00 7.80 2.00 20.00
155 Eurytemora Natural saltwater (location not given) 30.00 7.80 2.00 20.00

H-5
BLM
Data
Label
Genus
Reported chemistry Reported plus assumed chemistrya
Source water type Salinity,
g/kg pH
DOC,
mg C/L
Temp,
°C
Salinity,
g/kg pH
DOC,
mg C/L
Temp,
°C
156 Eurytemora Natural saltwater (location not given) 30.00 7.80 2.00 20.00
157 Eurytemora Natural saltwater (location not given) 30.00 7.80 2.00 20.00
158 Eurytemora Natural estuarine water (Choptank River, Cambridge, MA) 15.5 8.35 24.55 15.50 8.35 3.63 24.55
161 Eurytemora Natural estuarine water (Choptank River, Cambridge, MA) 2.5 7.95 3.31 25 2.50 7.95 3.31 25.00
162 Eurytemora Natural estuarine water (Choptank River, Cambridge, MA) 5 8.28 2.39 25 5.00 8.28 2.39 25.00
163 Eurytemora Natural estuarine water (Choptank River, Cambridge, MA) 15 8.38 1.68 25 15.00 8.38 1.68 25.00
164 Eurytemora Natural estuarine water (Choptank River, Cambridge, MA) 25 8.09 1.34 25 25.00 8.09 1.34 25.00
165 Eurytemora Natural estuarine water (Choptank River, Cambridge, MA) 10 8.1 2.48 25 10.00 8.10 2.48 25.00
166 Eurytemora Natural estuarine water (Choptank River, Cambridge, MA) 10 8.17 3.8 25 10.00 8.17 3.80 25.00
167 Eurytemora Natural estuarine water (Choptank River, Cambridge, MA) 10 8.17 5.6 25 10.00 8.17 5.60 25.00
168 Eurytemora Natural estuarine water (Choptank River, Cambridge, MA) 10 7.94 8.47 25 10.00 7.94 8.47 25.00
170 Eurythoe Natural saltwater (location not given) 36 7.8 36.00 7.80 2.00 20.00
172 Fundulus Natural saltwater (Horseshoe Cove or Asbury Park, NJ) 5.5 20 5.50 7.80 2.00 20.00
173 Fundulus Natural saltwater (Horseshoe Cove or Asbury Park, NJ) 23.6 20 23.60 7.80 2.00 20.00
174 Fundulus Natural saltwater (Horseshoe Cove or Asbury Park, NJ) 6.1 20 6.10 7.80 2.00 20.00
175 Fundulus Natural saltwater (Horseshoe Cove or Asbury Park, NJ) 24 20 24.00 7.80 2.00 20.00
176 Fundulus Artificial saltwater (Instant Ocean TM) 14 26.5 14.00 7.43 0.20 26.50
178 Fundulus Natural saltwater (Bear Cut, FL) 2.5 7.67 2.497 25 2.50 7.67 2.50 25.00
179 Fundulus Natural saltwater (Bear Cut, FL) 5 7.72 2.33 25 5.00 7.72 2.33 25.00
180 Fundulus Natural saltwater (Bear Cut, FL) 10 7.74 2.395 25 10.00 7.74 2.40 25.00
181 Fundulus Natural saltwater (Bear Cut, FL) 15 7.88 2.588 25 15.00 7.88 2.59 25.00
182 Fundulus Natural saltwater (Bear Cut, FL) 22 7.96 2.438 25 22.00 7.96 2.44 25.00
183 Fundulus Natural saltwater (Bear Cut, FL) 35 8.07 2.308 25 35.00 8.07 2.31 25.00
185 Gammarus Natural saltwater (location not given) 33 7.5 15 33.00 7.50 2.00 15.00
187 Haliotis Natural saltwater (location not given) 33 14 33.00 7.80 2.00 14.00
189 Haliotis Natural saltwater (location not given) 33 14 33.00 7.80 2.00 14.00
190 Haliotis Natural saltwater (location not given) 30.4 8 13 30.40 8.00 2.00 13.00
191 Haliotis Natural saltwater (location not given) 34.5 7.875 14.75 34.50 7.88 2.00 14.75
193 Hediste Natural saltwater (location not given) 5 7 5.00 7.80 2.00 7.00
194 Hediste Natural saltwater (location not given) 10 7 10.00 7.80 2.00 7.00
195 Hediste Natural saltwater (location not given) 17.5 7 17.50 7.80 2.00 7.00
196 Hediste Natural saltwater (location not given) 34 7 34.00 7.80 2.00 7.00
197 Hediste Natural saltwater (location not given) 7.3 12 7.30 7.80 2.00 12.00
198 Hediste Natural saltwater (location not given) 7.3 17 7.30 7.80 2.00 17.00
199 Hediste Natural saltwater (location not given) 7.3 22 7.30 7.80 2.00 22.00
200 Hediste Natural saltwater (location not given) 14.6 12 14.60 7.80 2.00 12.00
201 Hediste Natural saltwater (location not given) 14.6 17 14.60 7.80 2.00 17.00
202 Hediste Natural saltwater (location not given) 14.6 22 14.60 7.80 2.00 22.00
203 Hediste Natural saltwater (location not given) 21.9 12 21.90 7.80 2.00 12.00

H-6
BLM
Data
Label
Genus
Reported chemistry Reported plus assumed chemistrya
Source water type Salinity,
g/kg pH
DOC,
mg C/L
Temp,
°C
Salinity,
g/kg pH
DOC,
mg C/L
Temp,
°C
204 Hediste Natural saltwater (location not given) 21.9 17 21.90 7.80 2.00 17.00
205 Hediste Natural saltwater (location not given) 21.9 22 21.90 7.80 2.00 22.00
206 Hediste Natural saltwater (location not given) 29.2 12 29.20 7.80 2.00 12.00
207 Hediste Natural saltwater (location not given) 29.2 17 29.20 7.80 2.00 17.00
208 Hediste Natural saltwater (location not given) 29.2 22 29.20 7.80 2.00 22.00
209 Hediste Natural saltwater (location not given) 7.6 12 7.60 7.80 2.00 12.00
210 Hediste Natural saltwater (location not given) 7.6 17 7.60 7.80 2.00 17.00
211 Hediste Natural saltwater (location not given) 7.6 22 7.60 7.80 2.00 22.00
212 Hediste Natural saltwater (location not given) 15.25 12 15.25 7.80 2.00 12.00
213 Hediste Natural saltwater (location not given) 15.25 17 15.25 7.80 2.00 17.00
214 Hediste Natural saltwater (location not given) 15.25 22 15.25 7.80 2.00 22.00
215 Hediste Natural saltwater (location not given) 22.8 12 22.80 7.80 2.00 12.00
216 Hediste Natural saltwater (location not given) 22.8 17 22.80 7.80 2.00 17.00
217 Hediste Natural saltwater (location not given) 22.8 22 22.80 7.80 2.00 22.00
218 Hediste Natural saltwater (location not given) 30.5 12 30.50 7.80 2.00 12.00
219 Hediste Natural saltwater (location not given) 30.5 17 30.50 7.80 2.00 17.00
220 Hediste Natural saltwater (location not given) 30.5 22 30.50 7.80 2.00 22.00
221 Hediste Artificial saltwater (Tropic Marin Neu) 16.3 10 16.30 8.25 0.60 10.00
223 Holmesimysis Natural saltwater (location not given) 37 7.8 14 37.00 7.80 2.00 14.00
224 Holmesimysis Natural saltwater (Big Sur, Monterey County, CA) 36.5 7.8 13 36.50 7.80 2.00 13.00
226 Homarus Natural seawater (Narragansett Bay, RI) 30.5 20 30.50 7.92 1.45 20.00
230 Hydroides Artificial seawater (FAS; sea salt: Tropic Marine, Germany) 33.00 8.25 25.00 33.00 8.25 0.60 25.00
234 Lagodon Artificial saltwater (Sea Lakes Systems, Euclid, OH) 30 22 30.00 7.80 2.00 22.00
236 Leiostomus Natural saltwater (location not given) 20 25 20.00 7.80 2.00 25.00
237 Leiostomus Natural saltwater (location not given) 20 25.15 20.00 7.80 2.00 25.15
239 Litopenaeus Natural saltwater (Mazatlan Bay, Mexico) 34 8.05 27.2 34.00 8.05 2.00 27.20
243 Loligo Natural saltwater (Puget Sound at West Point, Seattle, WA) 30 8.1 8.6 30.00 8.10 1.46 8.60
262 Menidia Artificial saltwater 27.5 8.05 24.9 27.50 8.05 2.00 24.90
263 Menidia Artificial saltwater 28 8.125 24.45 28.00 8.13 2.00 24.45
264 Menidia Artificial saltwater 29 8.03 24.4 29.00 8.03 2.00 24.40
266 Menidia Natural saltwater (ERL, Narragansett, RI) 31 19 31.00 7.92 1.45 19.00
267 Menidia Natural saltwater (ERL, Narragansett, RI) 30.4 18.5 30.40 7.92 1.45 18.50
268 Menidia Natural saltwater (ERL, Narragansett, RI) 31 20 31.00 7.92 1.45 20.00
269 Menidia Natural saltwater (ERL, Narragansett, RI) 30 20 30.00 7.92 1.45 20.00
271 Menidia Natural saltwater (location not given) 20 25 20.00 7.80 2.00 25.00
272 Menidia Natural saltwater (location not given) 20 25.25 20.00 7.80 2.00 25.25
274 Mercenaria Natural saltwater (location not given) 30.00 7.80 2.00 20.00
276 Metapenaeus Natural saltwater (location not given) 38 7.81 28 38.00 7.81 2.00 28.00
278 Micropogonias Artificial saltwater (Sea Lakes Systems, Euclid, OH) 30 22 30.00 7.80 2.00 22.00

H-7
BLM
Data
Label
Genus
Reported chemistry Reported plus assumed chemistrya
Source water type Salinity,
g/kg pH
DOC,
mg C/L
Temp,
°C
Salinity,
g/kg pH
DOC,
mg C/L
Temp,
°C
280 Morone Natural saltwater (location not given) 10 7.1 22 10.00 7.10 2.00 22.00
281 Morone Artificial saltwater (Instant Ocean) 5 7.9 20 5.00 7.90 0.20 20.00
282 Morone Artificial saltwater (Rila® Marine mix) 5 8.5 26 5.00 8.50 2.00 26.00
283 Morone Artificial saltwater (Rila® Marine mix) 10 8.4 26 10.00 8.40 2.00 26.00
284 Morone Artificial saltwater (Rila® Marine mix) 15 7.8 26 15.00 7.80 2.00 26.00
286 Mulinia Natural saltwater (Narragansett Bay, Narragansett, RI) 31 7.755 20 31.00 7.76 1.45 20.00
287 Mulinia Natural saltwater (Narragansett Bay, Narragansett, RI) 29 8.03 20 29.00 8.03 1.45 20.00
288 Mulinia Natural saltwater (Narragansett Bay, Narragansett, RI) 30 8.035 20 30.00 8.04 1.45 20.00
289 Mulinia Natural saltwater (Narragansett Bay, Narragansett, RI) 32 8.035 20 32.00 8.04 1.45 20.00
290 Mulinia Natural saltwater (Narragansett Bay, Narragansett, RI) 30.5 8.04 20 30.50 8.04 1.45 20.00
291 Mulinia Natural saltwater (Narragansett Bay, Narragansett, RI) 31.5 8.045 20 31.50 8.05 1.45 20.00
293 Mya Natural saltwater (Narragansett, RI) 30 7.95 22 30.00 7.95 1.45 22.00
295 Mytilus Natural saltwater (Calleguas Creek 1, Ventura County, CA) 30 5.1 30.00 7.80 5.10 20.00
296 Mytilus Natural saltwater (Calleguas Creek 1, Ventura County, CA) 30 8.6 30.00 7.80 8.60 20.00
297 Mytilus Natural saltwater (Calleguas Creek 1, Ventura County, CA) 30 9.7 30.00 7.80 9.70 20.00
298 Mytilus Natural saltwater (Calleguas Creek 2, Ventura County, CA) 30 4.8 30.00 7.80 4.80 20.00
299 Mytilus Natural saltwater (Calleguas Creek 2, Ventura County, CA) 30 6.6 30.00 7.80 6.60 20.00
300 Mytilus Natural saltwater (Calleguas Creek 2, Ventura County, CA) 30 10 30.00 7.80 10.00 20.00
301 Mytilus Natural saltwater (Mugu Lagoon 3, Ventura County, CA) 30 1.5 30.00 7.80 1.50 20.00
302 Mytilus Natural saltwater (Mugu Lagoon 3, Ventura County, CA) 30 7.3 30.00 7.80 7.30 20.00
303 Mytilus Natural saltwater (Mugu Lagoon 3, Ventura County, CA) 30 11 30.00 7.80 11.00 20.00
304 Mytilus Natural saltwater (Mugu Lagoon 4, Ventura County, CA) 30 1.4 30.00 7.80 1.40 20.00
305 Mytilus Natural saltwater (Mugu Lagoon 4, Ventura County, CA) 30 6.2 30.00 7.80 6.20 20.00
306 Mytilus Natural saltwater (Mugu Lagoon 5, Ventura County, CA) 30 2 30.00 7.80 2.00 20.00
307 Mytilus Natural saltwater (Mugu Lagoon 5, Ventura County, CA) 30 4.7 30.00 7.80 4.70 20.00
308 Mytilus Natural saltwater (Mugu Lagoon 5, Ventura County, CA) 30 12 30.00 7.80 12.00 20.00
309 Mytilus Natural saltwater (Mugu Lagoon 6, Ventura County, CA) 30 1.7 30.00 7.80 1.70 20.00
310 Mytilus Natural saltwater (Mugu Lagoon 6, Ventura County, CA) 30 3.4 30.00 7.80 3.40 20.00
311 Mytilus Natural saltwater (Mugu Lagoon 6, Ventura County, CA) 30 9.9 30.00 7.80 9.90 20.00
312 Mytilus Natural saltwater (Granite Canyon, Ventura County, CA) 30 1 30.00 7.99 1.00 15.70
313 Mytilus Natural saltwater (Granite Canyon, Ventura County, CA) 30 1.2 30.00 7.99 1.20 15.70
314 Mytilus Natural saltwater (Granite Canyon, Ventura County, CA) 30 2.9 30.00 7.99 2.90 15.70
315 Mytilus Natural saltwater (Granite Canyon, Ventura County, CA) 30 3.2 30.00 7.99 3.20 15.70
316 Mytilus Artificial saltwater (Crystal Sea Marinemix) 30 5.9 30.00 7.80 5.90 20.00
317 Mytilus Artificial saltwater (HW Marinemix) 30 0.4 30.00 7.80 0.40 20.00
318 Mytilus Artificial saltwater (General-Purpose salt) 30 0.1 30.00 7.80 0.10 20.00
319 Mytilus Artificial saltwater (Kent Marine) 30.6 8.17 1.087 18 30.60 8.17 1.09 18.00
320 Mytilus Natural saltwater (Chesapeake Bay) 29.9 8.1 3.606 18 29.90 8.10 3.61 18.00
321 Mytilus Natural saltwater (San Diego Bay) 29.9 8.02 2.326 18 29.90 8.02 2.33 18.00

H-8
BLM
Data
Label
Genus
Reported chemistry Reported plus assumed chemistrya
Source water type Salinity,
g/kg pH
DOC,
mg C/L
Temp,
°C
Salinity,
g/kg pH
DOC,
mg C/L
Temp,
°C
322 Mytilus Natural saltwater (Tomales Bay) 30.2 7.8 3.374 18 30.20 7.80 3.37 18.00
323 Mytilus Natural saltwater (Puget Sound) 29.5 7.52 1.88 18 29.50 7.52 1.88 18.00
324 Mytilus Natural saltwater (Coal Harbour) 30.2 7.44 3.327 18 30.20 7.44 3.33 18.00
325 Mytilus Natural saltwater (Arthur Kill) 29.9 7.78 6.936 18 29.90 7.78 6.94 18.00
326 Mytilus Natural saltwater (Potomac River) 29.9 8.02 3.183 18 29.90 8.02 3.18 18.00
327 Mytilus Natural saltwater (Halifax Harbour) 29.9 7.65 1.619 18 29.90 7.65 1.62 18.00
328 Mytilus Natural saltwater (Albemarle Sound) 30.2 7.58 6.934 18 30.20 7.58 6.93 18.00
331 Mytilus Natural saltwater (Big Sur, Monterey County, CA) 33.79 8.1 17 33.79 8.10 2.00 17.00
333 Mytilus Natural saltwater (location not given) 25 6.9 - 7.5 20 25.00 7.20 2.00 20.00
334 Mytilus Artificial saltwater 27.5 8.05 24.9 27.50 8.05 2.00 24.90
335 Mytilus Artificial saltwater 28 8.125 24.45 28.00 8.13 2.00 24.45
336 Mytilus Artificial saltwater 29 8.03 24.4 29.00 8.03 2.00 24.40
337 Mytilus Natural saltwater (Narragansett Bay, Narragansett, RI) 30.5 8.025 20 30.50 8.03 1.45 20.00
338 Mytilus Natural saltwater (Narragansett Bay, Narragansett, RI) 31.5 8.5 20 31.50 8.50 1.45 20.00
339 Mytilus Natural saltwater (Narragansett Bay, Narragansett, RI) 31.5 8.075 20 31.50 8.08 1.45 20.00
340 Mytilus Natural saltwater (Narragansett Bay, Narragansett, RI) 31.5 8.05 20 31.50 8.05 1.45 20.00
341 Mytilus Natural saltwater (Granite Canyon, CA) 28 8.1 15.25 28.00 8.10 1.74 15.25
342 Mytilus Natural saltwater (Granite Canyon, CA) 28 8.05 15.45 28.00 8.05 1.74 15.45
343 Mytilus Natural saltwater (Granite Canyon, CA) 28 8.2 15.05 28.00 8.20 1.74 15.05
344 Mytilus Natural saltwater (Granite Canyon, CA) 28 8.2 15 28.00 8.20 1.74 15.00
345 Mytilus Natural saltwater (Granite Canyon, CA) 28 8.05 15.15 28.00 8.05 1.74 15.15
346 Mytilus Natural saltwater (Granite Canyon, CA) 28 8.15 14.9 28.00 8.15 1.74 14.90
347 Mytilus Natural saltwater (Granite Canyon, CA) 28 8.15 15.4 28.00 8.15 1.74 15.40
348 Mytilus Natural saltwater (Granite Canyon, CA) 28 8 15.7 28.00 8.00 1.74 15.70
349 Mytilus Natural saltwater (Granite Canyon, CA) 28 7.85 15.4 28.00 7.85 1.74 15.40
350 Mytilus Natural saltwater (Granite Canyon, CA) 28 8 15.45 28.00 8.00 1.74 15.45
351 Mytilus Natural saltwater (Granite Canyon, CA) 28 8.1 15.15 28.00 8.10 1.74 15.15
352 Mytilus Natural saltwater (Granite Canyon, CA) 28 8.2 15.05 28.00 8.20 1.74 15.05
353 Mytilus Natural saltwater (Granite Canyon, CA) 28 8.05 15 28.00 8.05 1.74 15.00
354 Mytilus Natural saltwater (Granite Canyon, CA) 28 8.05 15.2 28.00 8.05 1.74 15.20
355 Mytilus Natural saltwater (Granite Canyon, CA) 27.9 8.05 14.85 27.90 8.05 1.74 14.85
356 Mytilus Natural saltwater (Granite Canyon, CA) 27.5 7.85 15.6 27.50 7.85 1.74 15.60
357 Mytilus Natural saltwater (Granite Canyon, CA) 27.5 7.85 15.45 27.50 7.85 1.74 15.45
358 Mytilus Natural saltwater (Granite Canyon, CA) 28 7.85 14.95 28.00 7.85 1.74 14.95
359 Mytilus Natural saltwater (Granite Canyon, CA) 28 7.95 15.1 28.00 7.95 1.74 15.10
360 Mytilus Natural saltwater (Granite Canyon, CA) 28.75 7.9 14.85 28.75 7.90 1.74 14.85
361 Mytilus Natural saltwater (Granite Canyon, CA) 28 7.75 15.35 28.00 7.75 1.74 15.35
362 Mytilus Natural saltwater (Granite Canyon, CA) 28 7.95 15.3 28.00 7.95 1.74 15.30
363 Mytilus Natural saltwater (Granite Canyon, CA) 28 8.15 14.8 28.00 8.15 1.74 14.80

H-9
BLM
Data
Label
Genus
Reported chemistry Reported plus assumed chemistrya
Source water type Salinity,
g/kg pH
DOC,
mg C/L
Temp,
°C
Salinity,
g/kg pH
DOC,
mg C/L
Temp,
°C
364 Mytilus Natural saltwater (Granite Canyon, CA) 34 8.2 14.55 34.00 8.20 1.74 14.55
365 Mytilus Natural saltwater (Granite Canyon, CA) 34 8.25 14.55 34.00 8.25 1.74 14.55
366 Mytilus Natural diluted saltwater (Narragansett, RI) 20 7.85 16 20.00 7.85 1.45 16.00
367 Mytilus Natural diluted saltwater (Narragansett, RI) 20 7.85 16 20.00 7.85 1.45 16.00
368 Mytilus Natural diluted saltwater (Narragansett, RI) 20 7.85 16 20.00 7.85 1.45 16.00
369 Mytilus Natural saltwater (Granite Canyon Marine Lab., Carmel, CA) 30 7.82 0.5 30.00 7.82 0.50 15.70
370 Mytilus Natural saltwater (Granite Canyon Marine Lab., Carmel, CA) 30 7.82 0.9 30.00 7.82 0.90 15.70
371 Mytilus Natural saltwater (South San Francisco Bay, San Francisco, CA) 30 7.95 5.1 30.00 7.95 5.10 20.00
372 Mytilus Natural saltwater (South San Francisco Bay, San Francisco, CA) 30 7.95 5.2 30.00 7.95 5.20 20.00
373 Mytilus Natural saltwater (Granite Canyon and San Francisco Bay water) 30 7.91 2 30.00 7.91 2.00 15.70
374 Mytilus Natural saltwater (Granite Canyon and San Francisco Bay water) 30 7.91 2.2 30.00 7.91 2.20 15.70
375 Mytilus Natural saltwater (Granite Canyon and San Francisco Bay water) 30 7.98 3.5 30.00 7.98 3.50 15.70
376 Mytilus Natural saltwater (Granite Canyon and San Francisco Bay water) 30 7.98 3.8 30.00 7.98 3.80 15.70
380 Mytilus Natural saltwater (Granite Canyon, CA) 30 <1.5 30.00 7.99 1.50 15.70
381 Mytilus Natural saltwater (Granite Canyon, CA) 30 <1.5 30.00 7.99 1.50 15.70
382 Mytilus Natural saltwater (Granite Canyon, CA) 30 0.6 30.00 7.99 0.60 15.70
383 Mytilus Natural saltwater (Granite Canyon, CA) 30 0.6 30.00 7.99 0.60 15.70
384 Mytilus Natural saltwater (Granite Canyon, CA) 30 1 30.00 7.99 1.00 15.70
385 Mytilus Natural saltwater (Granite Canyon, CA) 30 1.2 30.00 7.99 1.20 15.70
386 Mytilus Natural saltwater (Granite Canyon, CA) 30 High 30.00 7.99 2.00 15.70
387 Mytilus Natural saltwater (Granite Canyon, CA) 30 0.3 30.00 7.99 0.30 15.70
388 Mytilus Natural saltwater (Granite Canyon, CA) 30 0.7 30.00 7.99 0.70 15.70
389 Mytilus Natural saltwater (Redwood Creek, San Francisco, CA) 30 2.6 30.00 7.95 2.60 20.00
390 Mytilus Natural saltwater (Redwood Creek, San Francisco, CA) 30 3.2 30.00 7.95 3.20 20.00
391 Mytilus Natural saltwater (Redwood Creek, San Francisco, CA) 30 2.3 30.00 7.95 2.30 20.00
392 Mytilus Natural saltwater (Redwood Creek, San Francisco, CA) 30 Low 30.00 7.95 1.00 20.00
393 Mytilus Natural saltwater (San Bruno, San Francisco, CA) 30 <1.5 30.00 7.95 1.50 20.00
394 Mytilus Natural saltwater (San Bruno, San Francisco, CA) 30 2.1 30.00 7.95 2.10 20.00
395 Mytilus Natural saltwater (San Bruno, San Francisco, CA) 30 2.2 30.00 7.95 2.20 20.00
396 Mytilus Natural saltwater (San Bruno, San Francisco, CA) 30 Low 30.00 7.95 1.00 20.00
397 Mytilus Natural saltwater (Central Bay-midpoint, San Francisco, CA) 30 2 30.00 7.95 2.00 20.00
398 Mytilus Natural saltwater (Central Bay-midpoint, San Francisco, CA) 30 3.2 30.00 7.95 3.20 20.00
399 Mytilus Natural saltwater (Central Bay-midpoint, San Francisco, CA) 30 2.6 30.00 7.95 2.60 20.00
400 Mytilus Natural saltwater (Central Bay-midpoint, San Francisco, CA) 30 3.5 30.00 7.95 3.50 20.00
401 Mytilus Natural saltwater (Central Bay-nearshore, San Francisco, CA) 30 4.6 30.00 7.95 4.60 20.00
402 Mytilus Natural saltwater (Central Bay-nearshore, San Francisco, CA) 30 3.3 30.00 7.95 3.30 20.00
403 Mytilus Natural saltwater (Central Bay-nearshore, San Francisco, CA) 30 2.4 30.00 7.95 2.40 20.00
404 Mytilus Natural saltwater (Central Bay-nearshore, San Francisco, CA) 30 Low 30.00 7.95 1.00 20.00
405 Mytilus Natural saltwater (Oyster Point, San Francisco, CA) 30 <1.5 30.00 7.95 1.50 20.00

H-10
BLM
Data
Label
Genus
Reported chemistry Reported plus assumed chemistrya
Source water type Salinity,
g/kg pH
DOC,
mg C/L
Temp,
°C
Salinity,
g/kg pH
DOC,
mg C/L
Temp,
°C
406 Mytilus Natural saltwater (Oyster Point, San Francisco, CA) 30 2.2 30.00 7.95 2.20 20.00
407 Mytilus Natural saltwater (Oyster Point, San Francisco, CA) 30 1.9 30.00 7.95 1.90 20.00
408 Mytilus Natural saltwater (Oyster Point, San Francisco, CA) 30 Low 30.00 7.95 1.00 20.00
409 Mytilus Natural saltwater (Yerba Beuna Island, San Francisco, CA) 30 <1.5 30.00 7.95 1.50 20.00
410 Mytilus Natural saltwater (Yerba Beuna Island, San Francisco, CA) 30 1.7 30.00 7.95 1.70 20.00
411 Mytilus Natural saltwater (Yerba Beuna Island, San Francisco, CA) 30 1.7 30.00 7.95 1.70 20.00
412 Mytilus Natural saltwater (Yerba Beuna Island, San Francisco, CA) 30 Low 30.00 7.95 1.00 20.00
413 Mytilus Natural saltwater (San Pablo Bay, San Francisco, CA) 30 2.1 30.00 7.95 2.10 20.00
414 Mytilus Natural saltwater (San Pablo Bay, San Francisco, CA) 30 4.9 30.00 7.95 4.90 20.00
415 Mytilus Natural saltwater (San Pablo Bay, San Francisco, CA) 30 2.1 30.00 7.95 2.10 20.00
416 Mytilus Natural saltwater (San Pablo Bay, San Francisco, CA) 30 1.8 30.00 7.95 1.80 20.00
417 Mytilus Natural saltwater (San Pablo Bay B15-B20, San Francisco, CA) 30 1.5 30.00 7.95 1.50 20.00
418 Mytilus Natural saltwater (San Pablo Bay B15-B20, San Francisco, CA) 30 8.1 30.00 7.95 8.10 20.00
419 Mytilus Natural saltwater (San Pablo Bay B15-B20, San Francisco, CA) 30 2.8 30.00 7.95 2.80 20.00
420 Mytilus Natural saltwater (San Pablo Bay B15-B20, San Francisco, CA) 30 2 30.00 7.95 2.00 20.00
421 Mytilus Natural saltwater (Petaluma River, San Francisco, CA) 30 3 30.00 7.95 3.00 20.00
422 Mytilus Natural saltwater (Petaluma River, San Francisco, CA) 30 9 30.00 7.95 9.00 20.00
423 Mytilus Natural saltwater (Petaluma River, San Francisco, CA) 30 4 30.00 7.95 4.00 20.00
424 Mytilus Natural saltwater (Petaluma River, San Francisco, CA) 30 2.3 30.00 7.95 2.30 20.00
425 Mytilus Natural saltwater (East San Pablo Bay-midpoint, San Francisco,
CA) 30 1.7 30.00 7.95 1.70 20.00
426 Mytilus Natural saltwater (East San Pablo Bay-midpoint, San Francisco,
CA) 30 4.8 30.00 7.95 4.80 20.00
427 Mytilus Natural saltwater (East San Pablo Bay-midpoint, San Francisco,
CA) 30 2.2 30.00 7.95 2.20 20.00
428 Mytilus Natural saltwater (East San Pablo Bay-midpoint, San Francisco,
CA) 30 2.6 30.00 7.95 2.60 20.00
429 Mytilus Natural saltwater (East San Pablo Bay-nearshore, San Francisco,
CA) 30 2.3 30.00 7.95 2.30 20.00
430 Mytilus Natural saltwater (East San Pablo Bay-nearshore, San Francisco,
CA) 30 4.5 30.00 7.95 4.50 20.00
431 Mytilus Natural saltwater (East San Pablo Bay-nearshore, San Francisco,
CA) 30 2.5 30.00 7.95 2.50 20.00
432 Mytilus Natural saltwater (East San Pablo Bay-nearshore, San Francisco,
CA) 30 2.2 30.00 7.95 2.20 20.00
433 Mytilus Natural saltwater (Pacheco Creek, San Francisco, CA) 30 1.7 30.00 7.95 1.70 20.00
434 Mytilus Natural saltwater (Pacheco Creek, San Francisco, CA) 30 9.6 30.00 7.95 9.60 20.00
435 Mytilus Natural saltwater (Pacheco Creek, San Francisco, CA) 30 2.9 30.00 7.95 2.90 20.00
436 Mytilus Natural saltwater (Grizzly Bay, San Francisco, CA) 30 2 30.00 7.95 2.00 20.00

H-11
BLM
Data
Label
Genus
Reported chemistry Reported plus assumed chemistrya
Source water type Salinity,
g/kg pH
DOC,
mg C/L
Temp,
°C
Salinity,
g/kg pH
DOC,
mg C/L
Temp,
°C
437 Mytilus Natural saltwater (Grizzly Bay, San Francisco, CA) 30 10 30.00 7.95 10.00 20.00
438 Mytilus Natural saltwater (Grizzly Bay, San Francisco, CA) 30 3.2 30.00 7.95 3.20 20.00
439 Mytilus Natural saltwater (Puget Sound SUZ001, Bangor, WA) 30 1.4 30.00 7.99 1.40 11.00
440 Mytilus Natural saltwater (Puget Sound HCB002, Bangor, WA) 30 1.1 30.00 7.99 1.10 11.00
441 Mytilus Natural saltwater (Galveston Bay- Horsepen Bayou, Clear Lake,
TX) 30 8.7 30.00 7.80 8.70 20.00
442 Mytilus Natural saltwater (West Galveston Bay, Clear Lake, TX) 30 3.3 30.00 7.80 3.30 20.00
443 Mytilus Natural saltwater (Narragansett Bay-USEPA Dock Low Tide,
Narragansett, RI) 30 1.5 30.00 7.92 1.50 17.00
444 Mytilus Natural saltwater (Narragansett Bay-USEPA Dock High Tide,
Narragansett, RI) 30 1.4 30.00 7.92 1.40 17.00
446 Mytilus Natural saltwater (Granite Canyon Marine Lab., Carmel, CA) 30 7.82 0.7 30.00 7.82 0.70 15.70
447 Mytilus Natural saltwater (Granite Canyon Marine Lab., Carmel, CA) 30 7.82 1 30.00 7.82 1.00 15.70
448 Mytilus Natural saltwater (South San Francisco Bay, San Francisco, CA) 30 7.95 4.9 30.00 7.95 4.90 20.00
449 Mytilus Natural saltwater (South San Francisco Bay, San Francisco, CA) 30 7.95 5.7 30.00 7.95 5.70 20.00
450 Mytilus Natural saltwater (Granite Canyon and San Francisco Bay water) 30 7.91 1.9 30.00 7.91 1.90 15.70
451 Mytilus Natural saltwater (Granite Canyon and San Francisco Bay water) 30 7.91 2.2 30.00 7.91 2.20 15.70
452 Mytilus Natural saltwater (Granite Canyon and San Francisco Bay water) 30 7.98 3.3 30.00 7.98 3.30 15.70
453 Mytilus Natural saltwater (Granite Canyon and San Francisco Bay water) 30 7.98 3.8 30.00 7.98 3.80 15.70
454 Mytilus Natural saltwater (San Diego Bay, CA) 34.3 7.89 1.3 15.5 34.30 7.89 1.30 15.50
455 Mytilus Natural saltwater (San Diego Bay, CA) 34.1 7.85 1.7 15.3 34.10 7.85 1.70 15.30
456 Mytilus Natural and Artificial saltwater 29.8 7.75 0.8 25 29.80 7.75 0.80 25.00
457 Mytilus Natural and Artificial saltwater 29.6 7.82 2.6 25 29.60 7.82 2.60 25.00
458 Mytilus Natural and Artificial saltwater 29.7 7.92 3.9 25 29.70 7.92 3.90 25.00
459 Mytilus Natural and Artificial saltwater 29.6 7.97 5.7 25 29.60 7.97 5.70 25.00
460 Mytilus Natural and Artificial saltwater 32 7.85 1.2 15 32.00 7.85 1.20 15.00
461 Mytilus Natural and Artificial saltwater 32 7.84 2.1 15 32.00 7.84 2.10 15.00
462 Mytilus Natural and Artificial saltwater 32 7.88 3.5 15 32.00 7.88 3.50 15.00
463 Mytilus Natural and Artificial saltwater 32 7.89 5 15 32.00 7.89 5.00 15.00
469 Neanthes Natural saltwater (Narragansett Bay, Narragansett, RI) 31 17 31.00 7.92 1.45 17.00
470 Neanthes Natural saltwater (Narragansett Bay, Narragansett, RI) 31 17 31.00 7.92 1.45 17.00
472 Neanthes Natural saltwater (Narragansett Bay, Narragansett, RI) 31 19 31.00 7.92 1.45 19.00
474 Neomysis Artificial saltwater (Marine Environment®) 2 17 2.00 7.80 2.00 17.00
475 Neomysis Artificial saltwater (Marine Environment®) 2 17 2.00 7.80 2.00 17.00
476 Neomysis Artificial saltwater (Marine Environment®) 2 17 2.00 7.80 2.00 17.00
478 Nitokra Natural brackish water (location not given) 7 8 20 7.00 8.00 2.00 20.00
481 Oncorhynchus Natural saltwater (Puget Sound at West Point, Seattle, WA) 28.6 8.1 13 28.60 8.10 1.46 13.00
483 Ophionereis Natural saltwater (location not given) 41.7 8.01 23 41.70 8.01 2.00 23.00
485 Opsanus Natural saltwater (Bear Cut, FL) 30 23 30.00 7.84 2.43 23.00

H-12
BLM
Data
Label
Genus
Reported chemistry Reported plus assumed chemistrya
Source water type Salinity,
g/kg pH
DOC,
mg C/L
Temp,
°C
Salinity,
g/kg pH
DOC,
mg C/L
Temp,
°C
487 Palaemon Natural saltwater (location not given) 17 8.1 15 17.00 8.10 2.00 15.00
489 Palaemonetes Natural saltwater (Santa Rosa Sound, Gulf Breeze, FL) 20 7.4 27 20.00 7.40 2.00 27.00
496 Paralichthys Natural saltwater (ERL, Narragansett, RI) 30 14 30.00 7.92 1.45 14.00
497 Paralichthys Natural saltwater (ERL, Narragansett, RI) 30 13 30.00 7.92 1.45 13.00
498 Paralichthys Natural saltwater (ERL, Narragansett, RI) 30 12 30.00 7.92 1.45 12.00
499 Paralichthys Natural diluted saltwater (Narragansett, RI) 22 7.4 20 22.00 7.40 1.45 20.00
500 Paralichthys Natural diluted saltwater (Narragansett, RI) 22 7.4 20 22.00 7.40 1.45 20.00
501 Paralichthys Natural diluted saltwater (Narragansett, RI) 22 7.6 20 22.00 7.60 1.45 20.00
503 Farfantepenaeus Natural saltwater (Santa Rosa Sound, FL) 25 7.95 25 25.00 7.95 2.00 25.00
505 Anaitides Natural saltwater (location not given) 10 30.00 7.80 2.00 10.00
507 Planaxis Natural saltwater (location not given) 36.91 7.8 27 36.91 7.80 2.00 27.00
509 Pseudodiaptomus 30 30.00 7.80 2.00 20.00
510 Pseudodiaptomus Artificial saltwater 30 20 30.00 7.80 2.00 20.00
511 Pseudodiaptomus Artificial saltwater (Kester) 30 15 30.00 7.80 2.00 15.00
513 Pseudopleuronectes Natural saltwater (ERL, Narragansett, RI) 30 5 30.00 7.92 1.45 5.00
514 Pseudopleuronectes Natural saltwater (ERL, Narragansett, RI) 28 5 28.00 7.92 1.45 5.00
515 Pseudopleuronectes Natural saltwater (ERL, Narragansett, RI) 30 8 30.00 7.92 1.45 8.00
516 Pseudopleuronectes Natural saltwater (ERL, Narragansett, RI) 30 5 30.00 7.92 1.45 5.00
517 Pseudopleuronectes Natural saltwater (ERL, Narragansett, RI) 30 4.5 30.00 7.92 1.45 4.50
518 Pseudopleuronectes Natural saltwater (ERL, Narragansett, RI) 30 5 30.00 7.92 1.45 5.00
526 Rangia Artificial saltwater (Instant Ocean) 5.5 24 5.50 7.43 0.20 24.00
527 Rangia Artificial saltwater (Instant Ocean) 22 24 22.00 7.43 0.20 24.00
529 Rivulus Artificial saltwater (Instant Ocean TM) 14 26.5 14.00 7.43 0.20 26.50
530 Rivulus Artificial saltwater (Instant Ocean TM) 14 26.5 14.00 7.43 0.20 26.50
532 Scorpaenichthys Natural saltwater (Puget Sound at West Point, Seattle, WA) 27 7.9 8.3 27.00 7.90 1.46 8.30
534 Sphaeroma Natural saltwater (location not given) 17 8.1 15 17.00 8.10 2.00 15.00
536 Spisula Natural saltwater (location not given) 25 7.2 20 25.00 7.20 2.00 20.00
538 Strongylocentrotus Natural saltwater (Puget Sound at West Point, Seattle, WA) 30 7.95 8.3 30.00 7.95 1.46 8.30
543 Strongylocentrotus Natural saltwater (Puget Sound at West Point, Seattle, WA) 30 7.95 8.3 30.00 7.95 1.46 8.30
547 Strongylocentrotus Natural saltwater (Granite Canyon, CA) 33.5 8.3 14.85 33.50 8.30 1.74 14.85
548 Strongylocentrotus Natural saltwater (Granite Canyon, CA) 33.5 8.3 14.95 33.50 8.30 1.74 14.95
549 Strongylocentrotus Natural saltwater (San Diego Bay, CA) 34.2 8.09 2.47 15.8 34.20 8.09 2.47 15.80
550 Strongylocentrotus Natural and Artificial saltwater 32 7.85 1.2 15 32.00 7.85 1.20 15.00
551 Strongylocentrotus Natural and Artificial saltwater 32 7.84 2.1 15 32.00 7.84 2.10 15.00
552 Strongylocentrotus Natural and Artificial saltwater 32 7.88 3.5 15 32.00 7.88 3.50 15.00
553 Strongylocentrotus Natural and Artificial saltwater 32 7.89 5 15 32.00 7.89 5.00 15.00
555 Terapon Natural saltwater (location not given) 7.9 28 30.00 7.90 2.00 28.00
557 Tigriopus Artificial saltwater (AQUIL) 35 8 16 35.00 8.00 2.00 16.00
558 Tigriopus Artificial saltwater (AQUIL) 35 8 16 35.00 8.00 2.00 16.00

H-13
BLM
Data
Label
Genus
Reported chemistry Reported plus assumed chemistrya
Source water type Salinity,
g/kg pH
DOC,
mg C/L
Temp,
°C
Salinity,
g/kg pH
DOC,
mg C/L
Temp,
°C
559 Tigriopus Artificial saltwater (AQUIL) 35 8 16 35.00 8.00 2.00 16.00
560 Tigriopus Artificial saltwater (AQUIL) 35 8 16 35.00 8.00 2.00 16.00
561 Tigriopus Artificial saltwater (AQUIL) 35 8 16 35.00 8.00 2.00 16.00
562 Tigriopus Artificial saltwater (AQUIL) 35 8 16 35.00 8.00 2.00 16.00
563 Tigriopus Artificial saltwater (AQUIL) 35 8 16 35.00 8.00 2.00 16.00
564 Tigriopus Artificial saltwater (AQUIL) 35 8 16 35.00 8.00 2.00 16.00
565 Tigriopus Artificial saltwater (AQUIL) 35 8 16 35.00 8.00 2.00 16.00
566 Tigriopus Artificial saltwater (AQUIL) 35 8 16 35.00 8.00 2.00 16.00
567 Tigriopus Artificial saltwater (AQUIL) 35 8 16 35.00 8.00 2.00 16.00
568 Tigriopus Artificial saltwater (AQUIL) 35 8 16 35.00 8.00 2.00 16.00
569 Tigriopus Artificial saltwater (AQUIL) 35 8 16 35.00 8.00 2.00 16.00
571 Tisbe Natural saltwater (Drobak, Oslofjord, Norway) 34 8 13 34.00 8.00 2.00 13.00
573 Trachinotus Natural saltwater (Grand Isle, LA) 10 22.5 10.00 7.81 2.00 22.50
574 Trachinotus Natural saltwater (Grand Isle, LA) 20 22.5 20.00 7.81 2.00 22.50
575 Trachinotus Natural saltwater (Grand Isle, LA) 30 7.81 22.5 30.00 7.81 2.00 22.50
577 Turbo Natural saltwater (location not given) 37.43 8.17 27 37.43 8.17 2.00 27.00
730 Mytilus Natural uncontaminated seawater (assumed collected from the
Sinop Coast of the Black Sea, Turkey) 17.5 7.95
1.92% -
TOC 15 17.50 7.95 2.00 15.00
731 Mytilus Natural uncontaminated seawater (assumed collected from the
Sinop Coast of the Black Sea, Turkey) 17.5 7.95
1.92% -
TOC 15 17.50 7.95 2.00 15.00
732 Mytilus Natural uncontaminated seawater (assumed collected from the
Sinop Coast of the Black Sea, Turkey) 17.5 7.95
1.92% -
TOC 15 17.50 7.95 2.00 15.00
733 Mytilus Natural uncontaminated seawater (assumed collected from the
Sinop Coast of the Black Sea, Turkey) 17.5 7.95 15 17.50 7.95 2.00 15.00
734 Acartia Artificial salt water 5 6.88 <0.1 20 5.00 6.88 0.10 20.00
735 Acartia Artificial salt water 15 7.21 <0.1 20 15.00 7.21 0.10 20.00
736 Acartia Artificial salt water 30 7.49 <0.1 20 30.00 7.49 0.10 20.00
737 Amphiascoides Artificial salt water, Instant Ocean Sea Salt, USA 30 23 30.00 7.43 0.20 23.00
738 Amphiascoides Artificial salt water, Instant Ocean Sea Salt, USA 30 23 30.00 7.43 0.20 23.00
739 Amphiascoides Artificial salt water, Instant Ocean Sea Salt, USA 30 23 30.00 7.43 0.20 23.00
740 Amphiascoides Artificial salt water, Instant Ocean Sea Salt, USA 30 23 30.00 7.43 0.20 23.00
741 Balanus Filtered natural sea water (assumed collected at Ionian Sea,
southern Italy) 37 20 37.00 7.80 2.00 20.00
742 Balanus Filtered natural sea water (assumed collected at Ionian Sea,
southern Italy) 37 20 37.00 7.80 2.00 20.00
743 Penaeus Filtered natural saltwater (collected from unpolluted site in
Neelangarai, India) 28 7.78 28 28.00 7.78 2.00 28.00
744 Mugil Natural filtered seawater (source ) 28 7.78 28 28.00 7.78 2.00 28.00
745 Brachionus Artificial salt water, Instant Ocean Sea Salt, USA 4 6.3 1.4 25 4.00 6.30 1.40 25.00

H-14
BLM
Data
Label
Genus
Reported chemistry Reported plus assumed chemistrya
Source water type Salinity,
g/kg pH
DOC,
mg C/L
Temp,
°C
Salinity,
g/kg pH
DOC,
mg C/L
Temp,
°C
746 Brachionus Artificial salt water, Instant Ocean Sea Salt, USA 14 6.9 1.4 25 14.00 6.90 1.40 25.00
747 Brachionus Artificial salt water, Instant Ocean Sea Salt, USA 26 7.8 1.4 26 26.00 7.80 1.40 26.00
748 Brachionus Artificial salt water, Instant Ocean Sea Salt, USA 14 6.6 1.4 25 14.00 6.60 1.40 25.00
749 Brachionus Artificial salt water, Instant Ocean Sea Salt, USA 14 6.7 5 25 14.00 6.70 5.00 25.00
750 Brachionus Artificial salt water, Instant Ocean Sea Salt, USA 14 6.9 10 25 14.00 6.90 10.00 25.00
751 Centropomus Natural filtered estuarine water from the Piraqueacu River, Brazil 32.2 7.58 24.6 32.20 7.58 2.00 24.60
752 Mytilus Natural estuarine water (Nieuwpoort, Belgium) + DI water +
artificial sea water 22.9 3 16 22.90 7.80 3.00 16.00
753 Mytilus Natural estuarine water (Nieuwpoort, Belgium) + DI water +
artificial sea water 24.7 1.24 16 24.70 7.80 1.24 16.00
754 Mytilus Natural estuarine water (Nieuwpoort, Belgium) + DI water +
artificial sea water 25.1 3.92 16 25.10 7.80 3.92 16.00
755 Mytilus Natural estuarine water (Nieuwpoort, Belgium) + DI water +
artificial sea water 29.8 0.56 16 29.80 7.80 0.56 16.00
756 Mytilus Natural estuarine water (Nieuwpoort, Belgium) + DI water +
artificial sea water 29.8 4.66 16 29.80 7.80 4.66 16.00
757 Mytilus Natural estuarine water (Nieuwpoort, Belgium) + DI water +
artificial sea water 29.9 2.8 16 29.90 7.80 2.80 16.00
758 Mytilus Natural estuarine water (Nieuwpoort, Belgium) + DI water +
artificial sea water 30 2.8 16 30.00 7.80 2.80 16.00
759 Mytilus Natural estuarine water (Nieuwpoort, Belgium) + DI water +
artificial sea water 34.9 1.46 16 34.90 7.80 1.46 16.00
760 Brachionus Recon saltwater + natural saltwater (Bouctouche) 30.1 8 4.83 25 30.1 8 4.83 25
761 Brachionus Recon saltwater + natural saltwater (Petit Rocher) 30.2 8 2.1 25 30.2 8 2.1 25
762 Brachionus Recon saltwater + natural saltwater (Major Kollock Creek) 29.9 8 7.57 25 29.9 8 7.57 25
763 Brachionus Recon saltwater + natural saltwater (Naufrage Harbour) 29.9 8 5.2 25 29.9 8 5.2 25
764 Brachionus Recon saltwater + natural saltwater (Rathtrevor Beach) 30.1 8 1.37 25 30.1 8 1.37 25
765 Brachionus Recon saltwater + natural saltwater (Hawke's Bay) 30 8 1.28 25 30 8 1.28 25
766 Brachionus Recon saltwater + natural saltwater (Blackberry Bay) 29.9 8 2.03 25 29.9 8 2.03 25
767 Brachionus Recon saltwater + natural saltwater (Chesterman Beach) 30.1 8 0.55 25 30.1 8 0.55 25
768 Brachionus Recon saltwater + natural saltwater (Jimbo) 30.1 8 1.13 25 30.1 8 1.13 25
769 Mytilus Artificial seawater (ASTM 2004) 36 7.9-8.1 16 36 8 2 16
770 Mytilus Artificial seawater (ASTM 2004) 36 7.9-8.1 16 36 8 2 16
771 Perna Natural seawater (Neelangarai, India) 28 7.78 28 28 7.78 2 28
772 Nitokra Natural seawater 7 4.7
(TOC) 22 7 7.8 4.7 22
773 Orchomenella Natural seawater (source not defined) 33 10 33 7.8 2 10
774 Penaeus Natural seawater (Neelangarai, India) 28 7.78 28 28 7.78 2 28
775 Limulus Artificial seawater (Instant Ocean) 20 6.7-9.0 18-29 20 7.85 0.2 23.5

H-15
BLM
Data
Label
Genus
Reported chemistry Reported plus assumed chemistrya
Source water type Salinity,
g/kg pH
DOC,
mg C/L
Temp,
°C
Salinity,
g/kg pH
DOC,
mg C/L
Temp,
°C
776 Limulus Artificial seawater (Instant Ocean) 20 6.7-9.0 18-29 20 7.85 0.2 23.5
777 Limulus Artificial seawater (Instant Ocean) 20 6.7-9.0 18-29 20 7.85 0.2 23.5
778 Arbacia Natural seawater (source not provided) 30 8.01-8.06 20 30 8.035 2 20
779 Cyprinodon Natural seawater (Gulf of Mexico) + DI water 2 20 2 7.8 2 20
780 Cyprinodon Natural seawater (Gulf of Mexico) + DI water 15 20 15 7.8 2 20
781 Cyprinodon Natural seawater (Gulf of Mexico) + DI water 2 20 2 7.8 2 20
782 Cyprinodon Natural seawater (Gulf of Mexico) + DI water 15 20 15 7.8 2 20
C1 Brachionus Artificial saltwater (Instant Ocean) 15 7.3-7.6 <1.0 23.9-
26.1 15 7.45 1 25
C2 Cyprinodon Natural saltwater (ERLN, Narragansett, RI) 28-32 23-27 30 7.92 1.45 25
a Given the relatively constant composition of marine waters, average values were reasonable estimates for missing parameters in a given toxicity test.

H-16
Appendix Table H-2. Summary Statistics of the Reported Water Chemistry for the
Acceptable Toxicity Tests.
Salinity
(g/kg) pH
DOC
(mg C/L)
Temperature
(°C)
Minimum 2.0 6.3 0.1 4.5
Maximum 41.7 9.0 12.0 30.0
Average 26.5 7.9 3.3 19.0
Appendix Table H-3. Average Chemistry
Location
Salinity
(g/kg) pH
DOC
(mg C/L)
Temperature
(°C)
Narragansett
7.92 1.45 17
Puget
7.99 1.46 11
Granite Canyon
7.99 1.74 15.7
Grand Isle
7.81
Bodega
7.6 0.893
San Francisco
7.95
Black Sea
2
Cambridge
3.63
Bear Cut
7.84 2.43
Instant Ocean1
7.43 0.2
Tropic Marin1
8.25 0.6
default 30 7.8 2 20 1 Based on Arnold et al. 2007.

I-1
Appendix I Discussion of BLM Water Quality Parameters in the
Estuarine/Marine Environment and Example Numeric
Criteria Values

I-2
The pH of marine environments is relatively stable, where pH typically remains between
7.5 and 8.4 (Sverdrup et al. 1942). However, regional factors can temporarily affect pH in these
systems. For example, the upwelling of deeper more acidic waters along the west coast of North
America can temporarily lower the pH of surface waters (Feely et al. 2008). In comparison, pH
is much more variable in estuaries, embayments, harbors, and other semi-enclosed coastal
systems. The influx of freshwater from rivers, groundwater, and surficial runoff can lower the
pH of these systems, based on the typically lower pH of freshwater (around 7) (Caldeira and
Wickett 2003). Photosynthesis, meanwhile, can increase pH levels and algal blooms have been
reported to increase pH levels above 9 in some estuaries, to the point where pH becomes lethal to
aquatic species (Hansen 2002).
The salinity of marine systems is also relatively stable, with an average salinity of 35 ppt
and range of 32 to 38 ppt across the world’s oceans (Kalle 1971). Salinity within coastal waters
can have greater variability, due primarily to the input of freshwater from rivers, surficial runoff,
groundwater input, and tidal and coastal currents. Salinity can also vary as a result of diurnal,
seasonal, and annual cycles and episodic occurrences (e.g, storm events). Salinity in semi-
enclosed systems, including estuaries, embayments, and harbors can have extreme variability
over space and time, and can have salinity ranging from saline to freshwater (<2 ppt). In the
Cheseapeake Bay, for example, average salinity ranges from freshwater (<0.5 ppt) in the upper
reaches of the Bay to full marine salinity adjacent to the Atlantic Ocean (VIMS 2016). Salinity
typically decreases in the Chesapeake Bay during the spring, with increased freshwater inputs
resulting from rain and snowmelt, and increases during the summer with increasing levels of
evaporation (Levinton 2001). Inputs (e.g., municipal discharges) and changes in water flow
patterns as a result of anthropogenic activity can also significantly affect the salinity of estuarine
and marine systems.
DOC in estuarine and marine systems in most cases reflects a diversity of inputs from
allochthonous and autochthonous sources that can originate from both terrestrial and aquatic
autotrophs (inclusive of unicellular algae and vascular plants) and heterotrophs (inclusive of
bacteria, fungi, and multicellular organisms) (Bauer and Bianchi 2011; Cloern 1996; Raymond
and Bauer 2001; Cauwet 2002; Aitkenhead-Peterson et al. 2003; Bertilsson and Jones 2003). The
highest DOC concentrations are generally found in estuarine and associated riverine systems,
with DOC concentrations generally decreasing with movement from the estuarine to marine

I-3
environment (Bauer and Bianchi 2011). DOC concentrations within estuarine and riverine
systems can vary greatly, with some of the highest known DOC concentrations occurring in
estuaries within the Gulf of Mexico, where DOC concentrations of greater than 1,000 µM
(equivalent to approximately 12 mg/L) have been reported (Bauer and Bianchi 2011; Guo et al.
1999; Engelhaupt and Bianchi 2001). Although variable both spatially and temporally,
representative DOC values reported for most other estuarine and riverine systems are lower,
examples of which include Galveston Bay (145-469 µM, equivalent to approximately 1.7-5.6
mg/L), Chesapeake Bay (118-215 µM, equivalent to approximately 1.4-2.6 mg/L), and
Potomac/Patuxent River (92-333 µM, equivalent to approximately 1.1-4.0 mgL) (Guo and
Santschi 1997; Sigleo 1996).
Riverine systems and adjacent wetlands frequently represent important sources of DOC
to estuarine and adjacent coastal ecosystems (Del Giorgio and Pace 2008). The magnitude of
temporal variability in DOC loading within these systems has been shown to be related to the
predominant source of DOC (Bianchi et al. 1998, Mantoura and Woodward 1983, Thurman
1985). For example, fringing wetlands have been demonstrated to provide a more consistent
source of DOC than phytoplankton blooms (Bianchi et al. 1998; Mantoura and Woodward 1983;
Thurman 1985). Anthropogenic inputs of DOC via municipal and industrial discharge can also
alter the DOC present in estuarine and near coastal environments, either directly through the
discharge of DOC or indirectly, such as via the discharge of nutrients which can then increase
primary productivity.
Removal of DOC via flocculation typically occurs with the increasing ionic strength of
higher salinity environments (Guo et al. 1999). In coastal and marine environments, DOC is
mostly produced by biological processes (primary and secondary production) in the upper ocean,
and is then mixed downward and diluted by physical processes (Hansell and Carlson 2001).
Seasonal increases in DOC concentrations can occur as a result of phytoplankton blooms,
particularly in areas with stratification that receive nutrient inputs during the winter (Hansell and
Carlson 2001). Deep ocean waters generally have the lowest DOC concentrations, reaching
levels of 2 µM (equivalent to approximately 0.02 mg/L) or less. DOC concentrations thus tend to
be reduced in upwelling areas where deep waters dilute the surface water concentrations, even
when primary production levels are relatively high (Hansell and Carlson 2001).

I-4
Marine water temperatures generally range from -2°C to 28°C, with some higher
temperatures occurring seasonally in estuarine systems. Temperature is, in general, a function of
solar input, with higher temperatures typically occurring at lower latitudes and during the
summer. Water temperatures in near coastal environments and semi-enclosed systems such as
estuaries, embayments, and harbors typically have some of the greatest variability. This
variability is due primarily to the input of freshwater from rivers, surficial runoff, groundwater
discharge, the shallower waters frequently present in these systems, and tidal and coastal
currents. Temperatures in coastal and open water marine environments often vary with different,
frequently stratified water layers that are characterized by differing temperature and salinity.
Upwelling and current patterns in these stratified systems can lead to local and regional alteration
in the temperature profile, such as observed with the California Current, where cooler deeper
waters are brought to the surface and significantly reduce the surface water temperature profile.
The following tables provide representative example saltwater BLM CMC and CCC
values determined with different temperature, pH, salinity, and DOC conditions.

I-5
Appendix Table I-1. Example BLM Numeric Criteria Values at 20°C and pH 7.8.
Salinity
(ppt)
DOC
(mg C/L)
FAV
(μg/L)
CMC
(μg/L)
CCC
(μg/L)
5
1 3.294 1.6 1.1
2 6.585 3.3 2.2
4 13.16 6.6 4.4
6 19.75 9.9 6.5
8 26.33 13 8.7
10 32.91 16 11
10
1 3.423 1.7 1.1
2 6.847 3.4 2.3
4 13.68 6.8 4.5
6 20.52 10 6.8
8 27.37 14 9.1
10 34.21 17 11
15
1 3.545 1.8 1.2
2 7.090 3.5 2.3
4 14.17 7.1 4.7
6 21.26 11 7.0
8 28.35 14 9.4
10 35.44 18 12
20
1 3.662 1.8 1.2
2 7.318 3.7 2.4
4 14.64 7.3 4.8
6 21.96 11 7.3
8 29.27 15 9.7
10 36.59 18 12
25
1 3.776 1.9 1.2
2 7.550 3.8 2.5
4 15.09 7.5 5.0
6 22.64 11 7.5
8 30.17 15 10
10 37.72 19 12
30
1 3.887 1.9 1.3
2 7.771 3.9 2.6
4 15.54 7.8 5.1
6 23.29 12 7.7
8 31.07 16 10
10 38.84 19 13

I-6
Appendix Table I-2. Example BLM Numeric Criteria Values at 20°C and pH 8.0.
Salinity
(ppt)
DOC
(mg C/L)
FAV
(μg/L)
CMC
(μg/L)
CCC
(μg/L)
5
1 3.324 1.7 1.1
2 6.647 3.3 2.2
4 13.29 6.6 4.4
6 19.93 10 6.6
8 26.58 13 8.8
10 33.20 17 11
10
1 3.446 1.7 1.1
2 6.886 3.4 2.3
4 13.77 6.9 4.6
6 20.66 10 6.8
8 27.54 14 9.1
10 34.41 17 11
15
1 3.563 1.8 1.2
2 7.121 3.6 2.4
4 14.24 7.1 4.7
6 21.36 11 7.1
8 28.48 14 9.4
10 35.60 18 12
20
1 3.678 1.8 1.2
2 7.352 3.7 2.4
4 14.70 7.3 4.9
6 22.04 11 7.3
8 29.38 15 9.7
10 36.73 18 12
25
1 3.790 1.9 1.3
2 7.574 3.8 2.5
4 15.14 7.6 5.0
6 22.70 11 7.5
8 30.26 15 10
10 37.84 19 13
30
1 3.900 1.9 1.3
2 7.794 3.9 2.6
4 15.58 7.8 5.2
6 23.36 12 7.7
8 31.16 16 10
10 38.95 19 13

I-7
Appendix Table I-3. Example BLM Numeric Criteria Values at 20°C and pH 8.2.
Salinity
(ppt)
DOC
(mg C/L)
FAV
(μg/L)
CMC
(μg/L)
CCC
(μg/L)
5
1 3.279 1.6 1.1
2 6.550 3.3 2.2
4 13.10 6.5 4.3
6 19.65 9.8 6.5
8 26.20 13 8.7
10 32.75 16 11
10
1 3.387 1.7 1.1
2 6.769 3.4 2.2
4 13.53 6.8 4.5
6 20.28 10 6.7
8 27.04 14 8.9
10 33.78 17 11
15
1 3.494 1.7 1.2
2 6.978 3.5 2.3
4 13.94 7.0 4.6
6 20.91 10 6.9
8 27.87 14 9.2
10 34.85 17 12
20
1 3.600 1.8 1.2
2 7.187 3.6 2.4
4 14.37 7.2 4.8
6 21.55 11 7.1
8 28.72 14 9.5
10 35.90 18 12
25
1 3.705 1.9 1.2
2 7.396 3.7 2.4
4 14.78 7.4 4.9
6 22.17 11 7.3
8 29.55 15 9.8
10 36.94 18 12
30
1 3.810 1.9 1.3
2 7.606 3.8 2.5
4 15.20 7.6 5.0
6 22.79 11 7.5
8 30.39 15 10
10 37.95 19 13