draft board memorandum on projected working … 3 of 27 1. introduction and background the board...
TRANSCRIPT

Page 1 of 27
Draft Board Memorandum on Projected Working Capital and
Financial Reporting Procedures

Page 2 of 27
Contents
1. Introduction and background 2. Executive summary 3. Basis of preparation 4. Key assumptions 5. Income and expenditure accounts 6. Balance sheets 7. Cash flows 8. Sensitivities 9. Financial reporting procedures 10. Conclusion 11. Factual Accuracy Annex 1: Monthly Cash Flows Annex 2: Continuity of Services Risk Rating for Base Case

Page 3 of 27
1. Introduction and background The Board Memorandum sets out the projections, key assumptions and sensitivities that support the Board’s statement that it has sufficient working capital to meet its obligations for the first twelve months of operation. This memorandum also sets out the projections up to 31 March 2016, together with the risks associated with their achievability. This is in accordance with guidance issued by Monitor. The data in the Memorandum is based on the LTFM Submitted to Monitor on 4th July 2014 The Trust’s Internal Auditors have been commissioned to provide a professional opinion on the Board’s statement that it has sufficient working capital to meet its obligations for the first twelve months of operation.

Page 4 of 27
2. Executive summary Summary of headroom Cash balances over the period from April 2014 to March 2016 are planned to remain largely stable. The average cash balance is forecast to be c.£23m. Combined with a number of short-term cash control measures, this will provide the Trust with sufficient headroom to manage the key financial risks over the next twelve months. Key assumptions The Trust's Operating Income and Expenditure (EBITDA) projections are based on assumptions on the impact of future inflation, the impact of the annual
efficiency requirement, future service volume and tariff changes, expected cost pressures and the impact of the Trust's proposed cost reduction plans. These
assumptions are considered in section 4.
Sensitivities The key risks to the Trust’s financial performance have been evaluated and an appropriate downside scenario developed. An initial assessment of the overall
impact of the downside scenario demonstrates that the Trust can still maintain a Continuity of Services Risk Rating of 3 as required to demonstrate the
robustness of the Trust’s financial plans.
Financial reporting procedures See report on Financial Reporting Procedures included in the Foundation Trust assessment stage 3 working capital and financial reporting procedures review. Conclusion The sensitivity analysis demonstrates that the Trust has sufficient headroom to support the Board’s statement that it has sufficient working capital to meet its obligations for the first twelve months of operation.

Page 5 of 27
3. Basis of preparation The board memorandum has been prepared using the IBP and LTFM submitted to the Monitor on 4th July 2014. The IBP and LTFM have been completed in accordance with Monitor guidance. The memorandum follows the monitor guidance (Appendix B10 of the Guide for Applicants). The trust has appropriate governance processes to ensure challenge and approval of the board memorandum. Once the independent accountants have completed their interim review and issued a report, the board memorandum will be updated to confirm factual accuracy of the report.

Page 6 of 27
4. Key assumptions – As per 5 year LTFM a) Inflation
NHS Tariff Deflation has been projected in accordance with Monitor Guidance Pay Inflation has been projected in line with the latest pay offer of 1.5% for public sector employees up to 2015/6. 1% of this is modelled as Agenda for
Change cost pressure. A higher figure of 2.0% has been assumed for later years. The increased cost of drugs has been inflated by 5% in line with the most recent Monitor tariff assumption. Other Non-Pay Expenditure Inflation has been estimated on the basis of the latest quarterly Treasury forecasts of Consumer Price Index (CPI – February
2014), with the exception of the PFI contract which is based on the Retail Price Index (RPI) Inflation on Other Income has also been assumed to be in line with CPI for non NHS Income sources and in line with the NHS Tariff Deflator for NHS
Income streams e.g. Provider to Provider Capital expenditure inflation is assumed to be in line with the CPI Revaluation of assets will take place every 3rd and 5th year, with the next revaluations due to take place in March 2015 and March 2018 each having a
cumulative impact of 1% per annum. Inflation Indices
2014-15 2015-16 2016-17 2017-18 2018-19
Estimated NHS Tariff Deflation -1.2% -1.6% 0.4% -0.6% -0.7%
Pay Inflation 0.5% 0.5% 1.5% 2.0% 2.0%
Drugs Inflation 5.0% 5.0% 5.0% 5.0% 5.0%
Consumer Price Index (CPI) 2.2% 2.2% 2.1% 2.2% 2.2%
Retail Price Index (RPI) 2.9% 2.9% 3.0% 3.4% 3.4%
Clinical Negligence (CNST) 1.1% 11.0% 11.0% 11.0% 11.0%
Capital Expenditure 2.2% 2.2% 2.2% 2.2% 2.2%
Revaluation rate 1.0% 1.0% 1.0% 1.0% 1.0%
b) Activity Growth & Quality, Innovation, Productivity & Prevention (QIPP) Assumptions
Initial assumptions on activity volume projections are based on those developed as part of the local South West London Commissioning Collaborative programme. These have been adapted to take account of

Page 7 of 27
The impact of the Trust’s expectations of growth for specialist commissioning activity. The trust perspective on the impact of local shift plans. The combined impact show that NHS funded activity is expected to grow in line with the percentages outlined below:-
Activity Growth Assumptions
2014-15 2015-16 2016-17 2017-18 2018-19
Elective 3.93% 3.70% 3.18% 2.76% 2.76%
Non Elective 3.66% 3.23% 2.68% 2.27% 2.15%
Outpatient (adjusted for QIPP) 3.08% -0.80% -1.32% 1.47% -2.13%
A&E 2.93% 1.80% 1.25% 0.70% 0.80%
Exclusions 4.03% 3.39% 2.91% 3.05% 2.56%
Other Tariff 3.83% 2.90% 2.40% 2.69% 1.97%
Block 0.00% 0.00% 0.00% 0.00% 0.00%
Demographic & Residual Growth (Compound):
Nb The above figures exclude the trust’s expectations in delivering out-patient activity in the community. c) Trust Service Development Plans
These relate to the major service changes planned for the next five years as outlined in chapter 5. The impact on the trust's financial performance will be in line with the business cases and other approved plans for their implementation. The service developments separately identified included in the current version of the LTFM are for:- South West London Pathology reconfiguration Private Patient Wing Development d) Tariff Changes
The price which the trust is paid for its services is determined by development of the national tariff under Payments by Results and by negotiated changes to local tariff agreements. Details of known changes are set out in figure 6.20 below. Increases in Non Elective activity are funded at a reduced marginal rate of 30% for all activity above historic 2012/13 activity thresholds, with future years subject to agreed threshold changes where there have been changes in the pattern of activity flows. The Trust’s assumptions on the impact of these arrangements are set out in the table below.

Page 8 of 27
The levels of MFF (Market Forces Factor) and CQUIN (Commissioning for Quality and Innovation) funding uplifts to the healthcare tariff are assumed to remain at current levels over the forecast period, details of which are set out below. Whilst MFF is a guaranteed uplift to the national tariff, CQUIN payments are dependent on achievement of targets. Therefore the trust has set a level of provision of 15% for the potential non achievement of these targets. Commissioner tariff Income levers – a level of provision is required to allow for the impact on the trust’s income position of potential tariff penalties for failure to meet SLA KPIs and other Commissioner challenges. The level of provision is set at £5m. Tariff Changes and Provisions
2014-15 2015-16 2016-17 2017-18 2018-19
PbR Tariff changes
Emergency threshold
- Price adjustment impact -1.90 -2.60 -2.23 -1.94 -1.87
- Threshold increase impact 10.2 2.96 1.30 1.11 0.97
Local Tariff changes (£m)
80% Out Patient Tariff rate in Community (£m) 0 -0.82 -0.75 0.00 -0.78
Local commissioner Challenges (£m) 5.0 5.0 5.0 5.0 5.0
Project Diamond Income (£m) 2.3 2.5 2.7 2.9 2.9
MFF levels 21.25% 21.25% 21.25% 21.25% 21.25%
CQUIN levels 2.50% 2.50% 2.50% 2.50% 2.50%
CQUIN provision level 15% 15% 15% 15% 15%
e) Other Income changes
In addition to NHS Healthcare Services, the trust provides healthcare to non NHS clients, including private patients, overseas patients and Road Traffic Accident cases. The trust also provides education & training services, conducts research and provides a number of Commercial services from which it generates additional income streams. The forecast levels of this income are a product of the assumptions on the related service volume and tariff changes. i) Non NHS Clinical Income The general expectations on growth are set out below:- Private Patient (PP) Income is expected to increase reflecting the demographic and PP market changes. Additional dedicated PP beds in Atkinson Morley Wing will enable higher growth over the next two years. However, once the Private Patient Unit is established, though a design, build and operate

Page 9 of 27
agreement with a private partner, the trust will no longer generate this income directly and will instead receive a share of the surpluses/income generated by the unit. Other Non Protected Revenue includes Road Traffic Accident income and Overseas Patients income, of which the overseas patients represent only small share. Road Traffic Accident income is expected to increase in line with Emergency activity. Overseas Patient Income is less significant and is expected to show only modest growth. ii) Other Income Other Income is classified across a range of headings within the LTFM: Education and Training SIFT reductions reflect the impact of the MPET funding review while other changes reflect the changes in student numbers which now form the basis of undergraduate education funding. MADEL reductions reflect the estimated impact of the changes to Junior Doctor Training requirements and changes in NMET funding remain uncertain. The changes are phased in and supported by transitional income. Research & Development: plans to increase the trust's R&D portfolio are still in development as the trust refines its R&D strategy. Whilst the trust expects to be able to significantly develop its R&D service portfolio, no increases have been assumed while more detailed plans are developed. Non Patient Services to other bodies, including diagnostics, pharmacy, radiation protection etc, are expected to remain at least at current levels, reflecting recent historical performance. Commercial Income: there are currently no expected changes in accommodation, catering and parking income. Other Income Assumptions
2014-15 2015-16 2016-17 2017-18 2018-19
Education & Training - SIFT (MPET Review) -1.51 -1.51 -1.51 -1.20 0.00
f) Marginal Costs The assumed level of additional cost incurred as a result of additional activity determines the relative financial impact of activity changes on the trust's income and expenditure forecasts. The trust models the recurrent impact of increases in activity over the forecast period on its future costs by analysing its cost into fixed and variable components and comparing these to the level of income generated to produce a marginal rate.

Page 10 of 27
POD (LTFM)Marginal
expenditure
rate %
Elective 67%
Non-Elective 79%
Outpatient 59%
Accident & Emergency 77%
Other 88%
Average 73% g) Cost Pressures
The trust will face a range of cost pressures over the next five years, a proportion of which can be assumed to be funded through the tariff. Pay The additional recurrent annual 1% increase in the incremental drift costs are based on recent historical experience. Costs for consultants are assumed to increase by £0.3m per annum in addition to other pay inflation assumptions due to the costs of awarding
consultants additional discretionary points. A further recurrent annual provision of 0.5% is assumed for the cost of meeting other inflationary pressures and new national quality standards. In
2014/15, there will be a peak in cost pressures relating to capacity and staffing compliance issues.
Non Pay A further recurrent provision of 0.5% is included each year to recognise the additional costs of quality requirements on service non pay costs over and
above the assumed levels of inflation of 2.2% outlined above. Department of Health (DoH) support for the ICT costs of Cerner are expected to be withdrawn in 2015/16 resulting in an increase in recurrent costs to the
trust of c£4m over 2 years.
Contingency The Trust is assuming that 1% will be required as contingency to meet base case risks. However, it is not expected to be used recurrently and therefore only 75% is expected to be needed to be replenished in 2015/16, with 50% required in 2016/17 and only 25% in subsequent years.

Page 11 of 27
Cost Pressure impact
2014-15 2015-16 2016-17 2017-18 2018-19
Pay
Incremental Drift (Pay Cost) (in tariff) 0.97% 1.00% 1.00% 1.00% 1.00%
Consultant Discretionary Points (£m) 0.00 0.30 0.30 0.30 0.30
Pensions 0.00 4.22 8.48 0.00 0.00
Quality Standards/Friends and Family Test 2.40
General Cost Pressures (Pay) 9.22 0.50% 0.50% 0.50% 0.50%
Non Pay
Cerner and RiO DoH recurrent support costs (£m) 1.90 2.06 0.00 0.00 0.02
General Cost Pressures (Non Pay) 6.43 0.50% 0.50% 0.50% 0.50%
Contingency 6.00 0.75% 0.50% 0.25% 0.25%
j) Non Recurrent I&E The financial projections will reflect elements of both income and expenditure which are non-recurring. Non recurrent Income The Trust assumes that it will receive £0.5m of charitable funding towards its capital investments each year. The level of funding is expected to increase
by a further £1m in 2015/16, £4m in 2016/17 and £2m in 2018/19 in respect of the Hospital Charity fundraising towards Trust developments. As part of our contracting arrangements for 2014/15 the Trust have agreed to offer a discount of £0.7m non recurrently to commissioners.
Non recurrent Expenditure DoH support for the costs of Cerner is expected to be withdrawn in 2015-16 resulting in one off costs of c£1m over the next 4 years. The key elements of these non-recurrent impacts are set out in the table below:
2014-15 2015-16 2016-17 2017-18 2018-19
Income
Donated Asset Income (£m) 0.5 1.5 4.5 0.5 2.5
Non Recurring Discount to Commissioners (£m) -0.7
Expenditure
Cerner and RiO DoH transition support costs (£m) -0.15 -0.45 0 -0.4 0

Page 12 of 27
Costs of Capital Assumptions Financing costs will reflect the assumed rates of PDC Dividend and Loan Interest and the level of planned capital investments and external finance
requirements set out in the section below. PDC Dividend rate is assumed to remain at 3.5% and the expected rate of interest on 25 year loans is based on the National Loan Funds fixed interest rate. Depreciation will continue to be determined in accordance with the trust’s accounting policies and reflect the planned impact of the level of investment
and disposals as described in the sections below. Current account / investment rates are in accordance with the latest Treasury Forecasts. Capital Investment & Financing Assumptions The trusts Capital Investment plans are governed by the trusts Capital Investment Framework. Finance is assumed to be funded from the cash generated through the allowance for depreciation, NBV of disposal assets, I&E surplus, new loans &
leases, less repayments of loans and leases +/- any other changes in liquidity required to maintain the trust’s Continuity of Risk Rating score. The level of external finance assumed in the trust plans is subject to the thresholds necessary to maintain the trust’s Continuity of Risk Rating score. Working Capital Management Working Capital is assumed to change in line with turnover and operating expenditure and actions to manage the working capital, as well as the current
impact of the capital investment and financing decisions. Cash will be managed to a month-end balance equivalent to 10 days’ operating expenses Non NHS Trade Receivable and Payable ratios are expected to remain with 60 days The Trust is reviewing the requirement for a Working Capital Facility in the context of the new Continuity of Service Risk Rating regime. Any facility would
need to be a wholly committed facility and the Trust will review the benefits of such a facility against the related costs.

Page 13 of 27
5. Income and expenditure accounts Income and Expenditure Outturn Forecast Forecast Forecast
2013/14 2014/15 2015/16 2016/17
£m £m £m £m
Income
NHS Clinical Income 576.4 584.9 608.6 633.9
Non NHS Clinical Income 9.3 11.6 15.0 8.1
Other Operating Income 79.0 92.1 93.3 101.1
Total Operating Income 664.7 688.6 716.9 743.1
Expenditure
Pay -405.6 -423.1 -434.5 -447.7
Non Pay -224.6 -227.6 -238.4 -244.0
Total Operating Expenses -630.2 -650.6 -672.9 -691.7
Operational Surplus 34.5 37.9 44.0 51.4
Profit / loss on asset disposals 0.0 0.0 6.5 0.0
Impairment losses 2.9 0.0 0.0 0.0
Depreciation -19.0 -21.6 -25.1 -27.1
Total interest receivable/ (payable) 0.1 0.1 0.1 0.1
Total interest payable on loans/leases -3.3 -3.9 -5.0 -5.8
PDC Dividend -7.6 -7.9 -8.3 -8.6
Net Surplus 7.6 4.6 12.2 10.0
-25.0
-20.0
-15.0
-10.0
-5.0
0.0
5.0
10.0
15.0
2013
/14
Nor
mal
ised
Sur
plus
: -0.
5
NH
S Se
rvic
eG
row
th: 8
.1
Serv
ice
Dev
elop
men
ts: 1
Serv
ice
Chan
ges:
2.7
Tari
ff C
hang
es&
Inco
me
Infla
tion
: -5.
6
Expe
ndit
ure
Infla
tion
: -8.
1
Age
nda
for
Chan
geCo
st P
ress
ures
: -3.
9
Cost
Pre
ssur
es: -
15.9
CIP:
29.
8
Cost
of C
apit
alCh
ange
s: -3
.5
2014
/15
Nor
mal
ised
Sur
plus
: 4.1
£ M
illio
ns
2014/15 I&E Bridge
-25.0
-20.0
-15.0
-10.0
-5.0
0.0
5.0
10.0
15.0
20.0
2014
/15
Nor
mal
ised
Sur
plus
: 4.1
NH
S Se
rvic
eG
row
th: 8
Serv
ice
Dev
elop
men
ts: 1
.3
Serv
ice
Chan
ges:
3.7
Tari
ff C
hang
es&
Inco
me
Infla
tion
: -7.
5
Expe
ndit
ure
Infla
tion
: -10
.1
Age
nda
for
Chan
geCo
st P
ress
ures
: -4.
1
Cost
Pre
ssur
es: -
14.7
CIP:
28.
4
Nor
mal
ised
ass
et s
ale
Cost
of C
apit
alCh
ange
s: 1
.5
2015
/16
Nor
mal
ised
Sur
plus
: 4.2
£ M
illio
ns
2015/16 I&E Bridge
Growth in forecast NHS clinical income reflects South West London Collaborative Commissioning assumptions together with local assumptions for market share growth; offset by commissioner QIPP plans and tariff deflation.
Growth in forecast Non NHS Clinical Income reflects the removal of the Private Patient Cap and increases in commercial income generating schemes.
Increases in expenditure across pay and non-pay reflect the cost of providing activity growth and anticipated cost pressures, offset by a robust Cost Improvement Programme.
Service development plans for South West London Pathology and the Private Patient Unit are included in the projected figures.
Increased costs of depreciation and interest / dividends reflect the increased planned investment in Trust assets.
KEY MESSAGE: The Trust has a track record of delivering I&E surpluses in prior years and has robust plans to deliver similar levels of surplus in 2014/15 and 2015/16 (nb 2015/16 supplemented by profit on disposal of assets).

Page 14 of 27
6. Balance sheet
Balance Sheet Outturn Forecast Forecast Forecast
31/03/2014 31/03/2015 31/03/2016 31/03/2017
£m £m £m £m
Assets, Non Current 300.2 335.7 386.9 409.9
Assets, Current
Inventories 7.1 6.4 6.5 6.5
Receivables 67.9 58.0 59.2 59.3
Cash & cash equivalents 22.4 20.6 26.0 24.6
Assets held for sale 0.0 0.0 0.0 0.0
Assets, Current, Total 97.5 85.0 91.7 90.4
Assets, Total 397.6 420.7 478.6 500.2
Liabilities, Current
Trade Payables -65.1 -52.9 -53.9 -53.9
Other -25.2 -33.5 -36.4 -37.4
Liabilities, Current, Total -90.3 -86.3 -90.3 -91.3
Net Current Assets/Liabilities 7.2 -1.3 1.5 -0.9
Borrowings -0.2 -16.3 -43.0 -56.8
Other -51.4 -57.0 -63.5 -60.3
Liabilities, Non-Current, Total -51.6 -73.3 -106.5 -117.1
Total Assets Employed 255.8 261.1 281.8 291.8
Taxpayers’ Equity
Public dividend capital 132.5 133.2 133.2 133.2
Retained Earnings (Accumulated Losses) 31.4 36.0 48.2 58.2
Donated assets reserve 0.0 0.0 0.0 0.0
Revaluation reserve 90.8 90.8 99.3 99.3
Other reserves 1.1 1.1 1.1 1.1
Total Taxpayers’ Equity 255.8 261.1 281.8 291.8
The increase in the Total Assets of the Trust reflects the planned increase in the levels of investment in the Trust’s infrastructure, financed by both loans and internally generated resources.
The forecast levels of cash and working capital reflect the use of internal resources to fund capital investments and its plans to maintain adequate liquidity levels.
The forecast level of borrowings increase to reflect loans drawn down by the Trust to help finance its Capital Programme.
KEY MESSAGE: The Trust is planning to maintain healthy cash and working capital (net current assets/liabilities) balances, even though it is planning to make significant investments in its infrastructure in support of its strategic aims.

Page 15 of 27
7. Cash flows
Cash Headroom
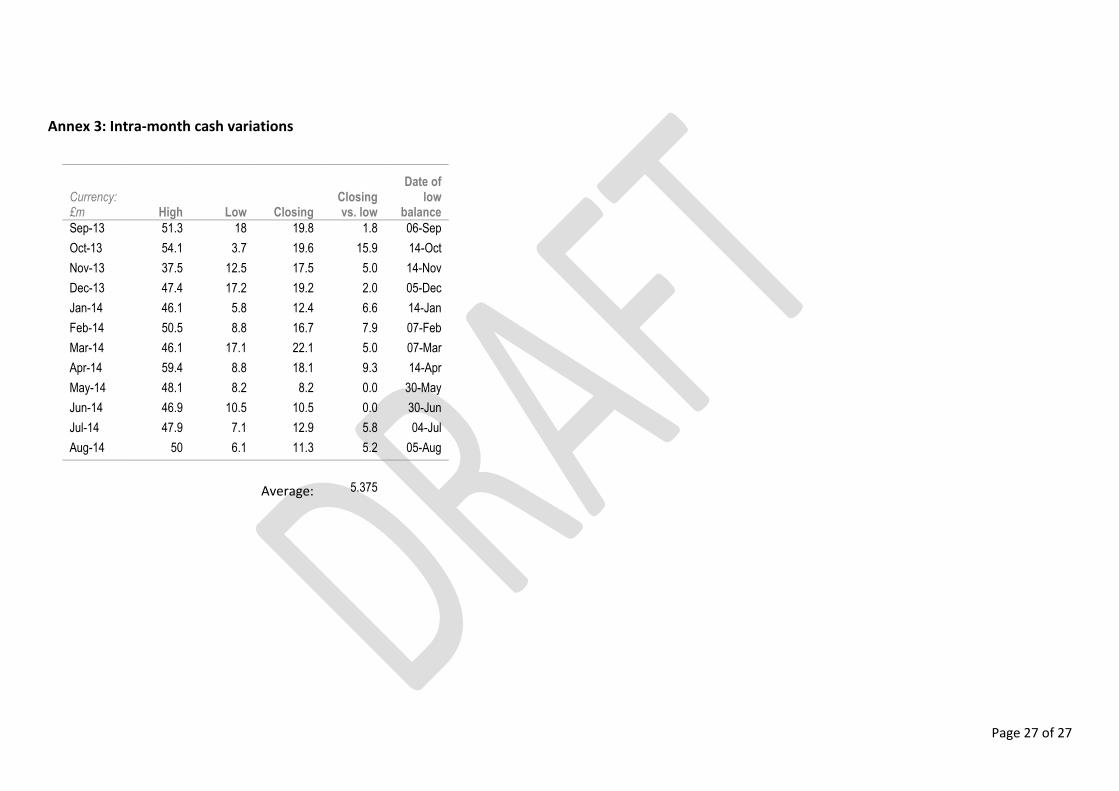
The Trust has planned cash balances in excess of £20m over the 12 months from 1st November2014, with an expected increase in 2015/16 due to the sale of the Maybury Street Car Park. The average balance over the period is expected to be £23m. The Trust has assessed the impact of intra-month cash variances of up £5m. After allowing for this the overall cash headroom could reduce to £18m. (see annex 3) Figure 7.1: working capital and monthly cash movements over the period November 2014 to October 2016 (£m)
-120.0
-100.0
-80.0
-60.0
-40.0
-20.0
0.0
20.0
40.0
60.0
80.0
100.0
Nov-14 Dec-14 Jan-15 Feb-15 Mar-15 Apr-15 May-15 Jun-15 Jul-15 Aug-15 Sep-15 Oct-15 Nov-15 Dec-15 Jan-16 Feb-16 Mar-16 Apr-16 May-16 Jun-16 Jul-16 Aug-16 Sep-16 Oct-16
Inventory Trade Debtors Other Debtors Trade Creditors Other Creditors Accruals & Deferred Income Net Working capital Bank and Cash
CA
SHH
EAD
RO
OM
N.B: Working Capital includes bank and cash

Page 16 of 27
Analysis of cash movements
Cashflow Actual Outturn Forecast Forecast Forecast
2012/13 2013/14 2014/15 2015/16 2016/17
£m £m £m £m £m
Operational Surplus 33.1 34.5 37.9 44.0 51.4
Non Cash adjustments -0.7 -1.9 -0.5 -1.5 -4.5
Movements in Working Capital -10.8 5.5 -1.6 0.1 0.0
Movements in Long Term Provisions 0.0 0.0 0.0 0.0 0.0
Net Cash Outflow from Operating Activities 21.5 38.1 35.8 42.7 46.9
Cash flow from investing activities
Capital Expenditure -14.2 -26.3 -42.0 -64.8 -43.2
Asset Sale Proceeds 0.6 0.0 0.0 16.5 0.0
Cashflow before Financing 7.9 11.8 -6.2 -5.7 3.7
Cashflow from financing activities
Dividends paid -6.8 -7.7 -7.9 -8.3 -8.6
Interest paid -3.2 -3.3 -3.9 -5.0 -5.8
Interest received 0.1 0.1 0.1 0.1 0.1
Drawdown on loans and leases 0.0 0.0 19.0 30.4 17.7
Repayment of loans and leases -3.8 -3.6 -3.7 -6.1 -8.7
Net Cashflow from financing -13.7 -13.5 4.4 11.1 -5.2
Net Cash Inflow/(Outflow) -5.8 -1.7 -1.8 5.4 -1.5
Cash Balance 24.1 22.4 20.6 26.0 24.6
The Asset Sale Proceeds of £16.5m in 2015/16 represent the sale of the Maybury St Car park.
The level of repayment of loans and leases increases in 2015/16 and 2016/17 due to the following:
o DH Capital Loans – The Trust has secured loans from the Department of Health of £14.7m in 2014/15, with further loans of £22.7m expected to be secured in 2015/16.
o Energy Conservation Management Scheme (ECMS) – the trust will renew its Energy Centre and energy infrastructure at a cost of approx. £12m (£4.3m in 2014/15, £7.7m in 2015/16) under a partnership with British Gas funded by a loan from the London Energy Efficiency Fund (LEEF).
The Trust has historically utilised cash generated through its operating activities to invest in its capital programme at a level that is at least equivalent to depreciation. The Trust intends to maintain this over the period.
The level of PDC dividend paid increases throughout the period as a result of increases in the Trust’s Asset base.
The Trust has had sufficient working capital for its previous and current requirements

Page 17 of 27
Figure 7 Cash Flow bridge over the period 2014/15 to 2015/17
22.4
37.4 -1.6 -42.0
-7.9
19.7 -3.9-3.7
20.6
42.5 0.1
16.5 -64.8
-8.3
30.4 -5.0-6.1
26.0
46.9 -43.2
-8.6
17.7 -5.8-8.7
24.6
0
20
40
60
80
100
120
FY1
4 C
ash
Bal
ance
EBIT
DA
incl
no
n c
ash
ad
just
men
ts
Mo
vem
ents
in W
ork
ing
Cap
ital
CA
PEX
sp
end
Div
iden
ds
pai
d
Dra
wd
ow
n o
f Lo
ans/
Leas
es
Inte
rest
pai
d o
n L
oan
s/Le
ases
Rep
aym
ent
of
on
Lo
ans/
Leas
es
FY1
5 C
ash
Bal
ance
EBIT
DA
incl
no
n c
ash
ad
just
men
ts
Mo
vem
ents
in W
ork
ing
Cap
ital
Pro
ceed
s o
n S
ale
of
Ass
ets
CA
PEX
sp
end
Div
iden
ds
pai
d
Dra
wd
ow
n o
f Lo
ans/
Leas
es
Inte
rest
pai
d o
n L
oan
s/Le
ases
Rep
aym
ent
of
on
Lo
ans/
Leas
es
FY1
6 C
ash
Bal
ance
EBIT
DA
incl
no
n c
ash
ad
just
men
ts
CA
PEX
sp
end
Div
iden
ds
pai
d
Dra
wd
ow
n o
f Lo
ans/
Leas
es
Inte
rest
pai
d o
n L
oan
s/Le
ases
Rep
aym
ent
of
on
Lo
ans/
Leas
es
FY1
7 C
ash
Bal
ance
£ M
illio
ns

Page 18 of 27
Facilities and covenants The Trust has not had any need for a facility to support its working capital position in the last five year and has no plans to establish a working capital facility. KEY MESSAGES: The Trust has had sufficient working capital for its previous and current requirements, and has not required temporary borrowing facilities within the last five years. The Trust has forecast month end cash balances in excess of £20m (equivalent to more than 10 days operating expenses) over the 12 months from 1 November 2014.

Page 19 of 27
8. Sensitivities
ST GEORGE'S MITIGATED ASSESSOR CASE [all figures nominal]
£m
14/15 15/16 16/17 17/18 14/15 15/16 16/17 17/18
Base case - normalised surplus 4.1 4.2 5.5 7.0 20.6 26.0 24.6 26.8
Assessor Sensitivities
Monitor generic assumptions - 0.6 (0.8) (1.4) - 0.6 (0.3) (1.7)
Modelling error Specific sensitivity - (0.1) (0.2) (0.4) - (0.1) (0.3) (0.7)
Tendering risk - community services Specific sensitivity - (0.3) (3.3) (2.5) - (0.3) (3.6) (6.1)
LHE/CCG pressure Monitor added Specific sensitivity - (3.6) (4.8) (5.9) - (3.6) (8.4) (14.3)
Non-NHS income Specific sensitivity - (1.1) (2.0) (4.3) - (1.1) (3.1) (7.4)
Downside Sensitivities
Current trading Specific sensitivity (2.0) - - - (2.0) (2.0) (2.0) (2.0)
Specialist pressure Specific sensitivity - - (2.8) (3.0) - - (2.8) (5.8)
Market share growth Specific sensitivity - (1.5) (2.7) (3.3) - (1.5) (4.2) (7.5)
CIP Specific sensitivity - (5.0) (8.2) (11.3) - (5.0) (13.2) (24.5)
Delayed car park sale Specific sensitivity - - - - - (16.5) -
Impact of PDC, depreciation and interest and working capital movement (only cash impact) - - (0.1) (0.1) - - 0.2 0.9
Case after all sensitivities applied 2.1 (6.7) (19.4) (25.2) 18.6 (3.4) (13.1) (42.4)
Mitigate assessor case
Change to assessor case - win health visiting tender at 75% current margin 0.9 0.9 - - 0.9 1.8
Nelson Tender 0.6 0.7 0.6 - 0.6 1.3 1.9
Mitigate downside case
£2m CIP overprogramming : 15/16 2.0 2.0 2.0 - 2.0 4.0 6.0
Contingency, utilise 100% 4.6 7.8 9.4 - 4.6 12.5 21.9
Reducing External Consultancy Spend by £1m - 0.5 1.0 - - 0.5 1.5
Workforce Remuneration Measures - MARS 0.3 0.5 0.8 - 0.3 0.8 1.6
Terminate SLA with Kingston for Services Delivered at QMH - 1.0 1.0 - - 1.0 2.0
Case after current Monitor mitigations 2.1 0.8 (6.0) (9.5) 18.6 4.1 7.7 (5.8)
IMPACT of Current Monitor MITIGATED DOWNSIDE (2.0) (3.5) (11.5) (16.5) (2.0) (22.0) (16.8) (32.6)
Trust Planned Mitigations
LHE/CCG pressure removal as per trust view - 3.6 4.8 5.9 - 3.6 8.4 14.3
Change to assessor case - 100% reduction in Non-NHS Income changes to 50% - - 1.0 2.1 - - 1.0 3.2
Remainder of Reducing External Consultancy Spend to £1m - - 1.1 2.3 - - 1.1 3.4
Establishment of an Elective Surgical Centre - - 2.6 2.7 - - 2.6 5.3
Medical Staff Discretionary Pay - Additional Management Roles - - 0.7 0.7 - - 0.7 1.5
Aligning Theatre Capacity Towards Profitable Services - - 0.8 0.8 - - 0.8 1.6
Delay capital investments in line with reduced funding - - - - - 12.5 - -
Case after trust planned list mitigations 2.1 4.4 5.0 5.2 18.6 20.2 22.4 23.5
IMPACT OF TRUST MITIGATED DOWNSIDE (2.0) 0.1 (0.5) (1.9) (2.0) (5.9) (2.1) (3.3)
All M
on
itor m
itigatio
ns
I&E Impact (£m) Cash Impact (£m)
All T
rust
pla
nn
ed
mitig
atio
ns
All s
en
sitiv
ities
Income & Expenditure wlucy76.orangehome
.co.uk
Cash wlucy76.orange
home.co.uk

Page 20 of 27
The downside case builds on Monitor’s assessor case, but reflects a more pessimistic view of the expected pressures and risks faced by the Trust.
Current Trading: Assumes £2m slippage against plans in 2014/15.
Specialist Pressure: Using income from Project Diamond as a proxy, Monitor has included this to reflect pressures faced by NHS England.
Market share growth: Monitor has removed growth relating to winning market share.
CIP: Assumes 10% slippage and 5% non-achievement of CIP programme.
Delayed car park sale: Assumes the sale of the Maybury Street car park would be delayed by a year. To mitigate the Downside case the Trust has included the following measures:
CIP plans would be brought forward from 2015/16 to mitigate in year slippage against plans.
Contingency reserves would be fully utilised.
External consultancy spend would be limited to £1m.
A voluntary redundancy programme would be implemented in 2015/16.
The current SLA we hold with Kingston Hospital for services delivered at Queen Mary’s Hospital Roehampton would be terminated.
An elective surgical centre would be developed to create efficiencies in service delivery and consequently increase throughput.
Medical staff pay would be reduced by taking out additional management roles from consultant job plans.
Theatre capacity usage would be optimised to allow for an increase in more profitable procedures.
Some of the capital programme would be delayed due to the reduced cash flow resulting from the delay in the Maybury Street car park sale.
Income & Expenditure wlucy76.orangehome.
co.uk
Cash wlucy76.orangehome.
co.uk
The Assessor case reflects Monitor’s central estimate of the expected pressures and risks to Trust income and costs.
Monitor generic assumptions: Standard inflation assumptions applied by Monitor. This improves the 2015/16 position by £0.6m.
Modelling error: Inflationary impact of grossing up income CIPs for 2014/15.
Tendering risk – community services: Monitor has removed the margin on School Nursing as there is a risk the Trust will not win this contract when it goes to tender in 2015/16.
LHE/CCG Pressure: Modelled increase in NETA threshold used as a proxy for pressures faced in the local health economy.
Non NHS Income: Monitor has removed 50% of the growth in Private Patient income margin in 2015/16. To mitigate the Assessor case the Trust has included additional margin resulting from winning the tender to provide services at the Nelson hospital. Significant progress has been made on this tendering process in recent months; however this increased income would have been submitted as part of our base case had information been available at the time.

Page 21 of 27
Sensitivity analysis The Trust has considered, as set out above, the impact of downside risks and mitigations on its financial position in terms of its income & expenditure and cash positions. The Trust expects to be able to maintain a surplus income and expenditure position and a positive cash balance over the financial period. In terms of the Trust’s Continuity of Services Risk Rating (CoSRR), a significant reduction in the Trust’s net operating I&E would be required to reduce the CoSRR score to below the Foundation Trust threshold level of 3. In 2015/16 the total financial pressure required to reduce the CoSRR score to 2 would be £8.7m. KEY MESSAGE: The Trust would need to face additional financial pressures in excess of £8.7m before the Trust CoSRR deteriorated to an unsatisfactory score. The Trust has adequate mitigation plans to address the impact of reasonable downside risks on its financial position. 9. Financial reporting procedures: See report on Financial Reporting Procedures included in the Foundation Trust assessment stage 3 working capital and financial reporting procedures review.

Page 22 of 27
10. Conclusion Working Capital
The Trust has sufficient working capital for its present and future requirements to enable the signing of the Board Memorandum. This statement is predicated on the basis that:
The Trust has a track record of delivering I&E surpluses in prior years and has robust plans to deliver similar levels of surplus in 2014/15 and 2015/16 (Section 5).
The Trust is planning to maintain healthy cash and working capital (net current assets/liabilities) balances, even though it is planning to make significant investments in its infrastructure in support of its strategic aims (Section 6).
The Trust has had sufficient working capital for its previous and current requirements, and has not required temporary borrowing facilities within the last five years (Section 7).
The Trust has forecast, over the 12 month period from 1 November 2014, month end cash balances in excess of £20m (equivalent to more than 10 days operating expenses) (Section 7).
The Trust would need to face additional financial pressures in excess of £8.7m, before the Trust CoSRR deteriorated to an unsatisfactory score (Section 8).
The Trust has adequate mitigation plans to address the impact of reasonable downside risks on its financial position (Section 8)

Page 23 of 27
Financial Reporting Procedures
The Trust has established procedures which provide a reasonable basis for it to reach proper judgement as to the financial position and prospects of the trust.

Page 24 of 27
11. Factual accuracy
“We have read the report on the Trust’s projected working capital requirements and financial reporting procedures report prepared by Ernst and Young dated September 2014 and confirm the following:
We are not aware of any factual inaccuracies within the draft report;
Opinions and representations, which have been attributed to persons referred to in the report, are properly attributed to those persons.”
Signed for and on behalf of the board:
Title:
Date:
Trust:

Page 25 of 27
Annex 1: Monthly Cash Flows
2014/15 Monthly Cash Flow
£m Apr-14 May-14 Jun-14 Jul-14 Aug-14 Sep-14 Oct-14 Nov-14 Dec-14 Jan-15 Feb-15 Mar-15
Opening Cash Position 22.4 18.1 16.8 16.7 19.0 18.4 16.7 20.2 21.5 20.1 21.8 22.6
EBITDA -0.1 1.5 2.6 4.6 2.0 4.5 5.7 3.6 0.9 4.3 2.6 5.8
Working Capital Movements 0.0 0.0 0.0 0.0 0.0 0.0 0.0 0.0 0.0 0.0 0.0 -1.6
Net cash inflow/(outflow) from operating activities -0.1 1.5 2.5 4.5 1.9 4.5 5.7 3.5 0.8 4.3 2.5 4.2
Net cash inflow/(outflow) from investing activities -3.9 -2.5 -2.4 -2.0 -2.5 -4.2 -5.0 -5.2 -4.9 -3.9 -2.6 -3.0
Net cash inflow/(outflow) from financing activities -0.4 -0.3 -0.3 -0.3 -0.1 -2.0 2.9 2.9 2.7 1.3 0.9 -3.1
Closing Cash Position 18.1 16.8 16.7 19.0 18.4 16.7 20.2 21.5 20.1 21.8 22.6 20.6
2015/16 Monthly Cash Flow
£m Apr-15 May-15 Jun-15 Jul-15 Aug-15 Sep-15 Oct-15 Nov-15 Dec-15 Jan-16 Feb-16 Mar-16
Opening Cash Position 20.6 20.3 19.3 22.3 25.5 26.1 22.1 23.2 40.1 36.7 35.4 35.2
EBITDA 1.3 2.2 4.3 5.2 2.8 4.7 5.3 4.7 1.1 3.5 4.6 4.2
Working Capital Movements 1.6 0.0 0.0 0.0 0.0 0.0 0.0 0.0 0.0 0.0 0.0 -1.7
Net cash inflow/(outflow) from operating activities 2.8 2.1 4.3 5.1 2.7 4.6 5.2 4.7 1.0 3.4 4.5 2.4
Net cash inflow/(outflow) from investing activities -6.7 -6.6 -4.8 -5.0 -5.2 -4.3 -5.0 11.4 -5.3 -5.5 -5.6 -5.7
Net cash inflow/(outflow) from financing activities 3.5 3.5 3.5 3.1 3.1 -4.4 0.9 0.9 0.9 0.9 0.9 -5.9
Closing Cash Position 20.3 19.3 22.3 25.5 26.1 22.1 23.2 40.1 36.7 35.4 35.2 26.0
2016/17 Monthly Cash Flow
£m Apr-16 May-16 Jun-16 Jul-16 Aug-16 Sep-16 Oct-16 Nov-16 Dec-16 Jan-17 Feb-17 Mar-17
Opening Cash Position 26.0 26.7 28.3 29.4 30.9 33.2 25.4 26.9 28.3 29.2 30.9 30.7
EBITDA 2.3 3.3 3.6 4.1 4.7 4.1 4.4 4.1 3.9 4.4 2.3 5.5
Working Capital Movements 0.0 0.0 0.0 0.0 0.0 0.0 0.0 0.0 0.0 0.0 0.0 0.0
Net cash inflow/(outflow) from operating activities 2.4 3.3 3.7 4.1 4.7 4.1 4.4 4.1 3.9 4.4 2.3 5.5
Net cash inflow/(outflow) from investing activities -2.5 -2.6 -3.7 -3.6 -3.6 -4.2 -3.9 -3.7 -4.1 -3.8 -3.5 -3.9
Net cash inflow/(outflow) from financing activities 0.8 0.9 1.0 1.1 1.1 -7.6 1.0 1.0 1.0 1.0 1.0 -7.7
Closing Cash Position 26.7 28.3 29.4 30.9 33.2 25.4 26.9 28.3 29.2 30.9 30.7 24.6

Page 26 of 27
Annex 2: Continuity of Services Risk Rating for Base Case
Continuity of Services Risk Rating Forecast Forecast Forecast Forecast Forecast Forecast
2013/14 2014/15 2015/16 2016/17 2017/18 2018/19
Metric Result Result Result Result Result Result
Liquid ratio 2.00 0.03 -4.10 -2.64 -3.80 -2.66
Capital servicing capacity 2.30 2.42 2.19 2.04 2.06 2.20
Metric Criteria Rating Rating Rating Rating Rating Rating
Liquid ratio 50% 4 4 3 3 3 3
Capital servicing capacity 50% 3 3 3 3 3 3
Weighted Average 3.5 3.5 3.0 3.0 3.0 3.0
Overriding Score 4 4 3 3 3 3
Page 27 of 27
Annex 3: Intra-month cash variations
Currency: £m High Low Closing
Closing vs. low
Date of low
balance
Sep-13 51.3 18 19.8 1.8 06-Sep
Oct-13 54.1 3.7 19.6 15.9 14-Oct
Nov-13 37.5 12.5 17.5 5.0 14-Nov
Dec-13 47.4 17.2 19.2 2.0 05-Dec
Jan-14 46.1 5.8 12.4 6.6 14-Jan
Feb-14 50.5 8.8 16.7 7.9 07-Feb
Mar-14 46.1 17.1 22.1 5.0 07-Mar
Apr-14 59.4 8.8 18.1 9.3 14-Apr
May-14 48.1 8.2 8.2 0.0 30-May
Jun-14 46.9 10.5 10.5 0.0 30-Jun
Jul-14 47.9 7.1 12.9 5.8 04-Jul
Aug-14 50 6.1 11.3 5.2 05-Aug
Average: 5.375