draft budget 2013 - european...
TRANSCRIPT
©European Commission
DB 2014
Launching the new and implementing the past
Ensuring a seamless transition to the new programmes
Janusz Lewandowski Commissioner for Financial Programming and Budget
COBU, 26 June 2013
1
Draft Budget 2014

©European Commission
DB 2014
Treaty calendar
• Commission Statement of Estimates before 1 July, Draft Budget not later than 1 September.
MFF 2014-2020 agreed between chief negotiators
• The three Presidents agreed on 6 May to start the MFF negotiations on the basis of the European Council conclusions of February 2013;
• DB 2014 takes account of the very advanced stage of MFF negotiations and is the indispensable starting point for the budget procedure
Amending Letter to adjust to the outcome.
Starting without an agreed MFF 2014-2020
2

©European Commission
DB 2014
Results from the very advanced stage of the MFF negotiation as reference point
• Commitments: technical breakdown by programme (27 March), adjusted for the frontloading of YEI (Art. 9f of the draft Council regulation on 2014-2020 MFF)
• Payments: ensure compatibility with a ceiling EUR 8,5 billion below 2013 making full use of the ceiling.
Any further development in the MFF Amending Letter.
DB 2014: MFF ceilings
3

©European Commission
DB 2014
• Putting in place the new programmes under the 2014-2020 Multi-annual Financial Framework (MFF) – focus on growth, employment and competitiveness.
• Fulfilling the EU's obligations – honouring the commitments of the past – a transitional DB.
• Restraint on administrative expenditure – an ongoing policy.
Priorities of Draft Budget 2014
4

©European Commission
DB 2014
• First year of the new programmes – focus on commitments.
• Commitments targeted on competitiveness for growth and jobs (+3,3%).
• More than 90% of requested payments will be used to address non-differentiated expenditure (40%) and RAL (52%) ; as needs for the new programmes (8%) are limited in the first year.
• The gap between commitment and payment appropriations is limited to EUR 6 billion – minimising the rate of growth of the RAL.
A responsible and realistic budget
5

©European Commission
DB 2014
• Non-differentiated appropriations – CAP, Administration, – commitments and payments are equal
• Outstanding commitments – completion of old programmes – no new commitments.
• New programmes – the concentration is on commitments in the first year
Payments, a transitional year
6
NDA: 54.7 €bln
40% of DB PA
RAL: 70.7 €bln
52% of DB PA
NEW:
10.7 €bln 8% of DB PA
Total DB PA: €136.1 billion - 5.8%
©European Commission
DB 2014
Where will EU money go in 2014?
7
(*) Excluding Croatia
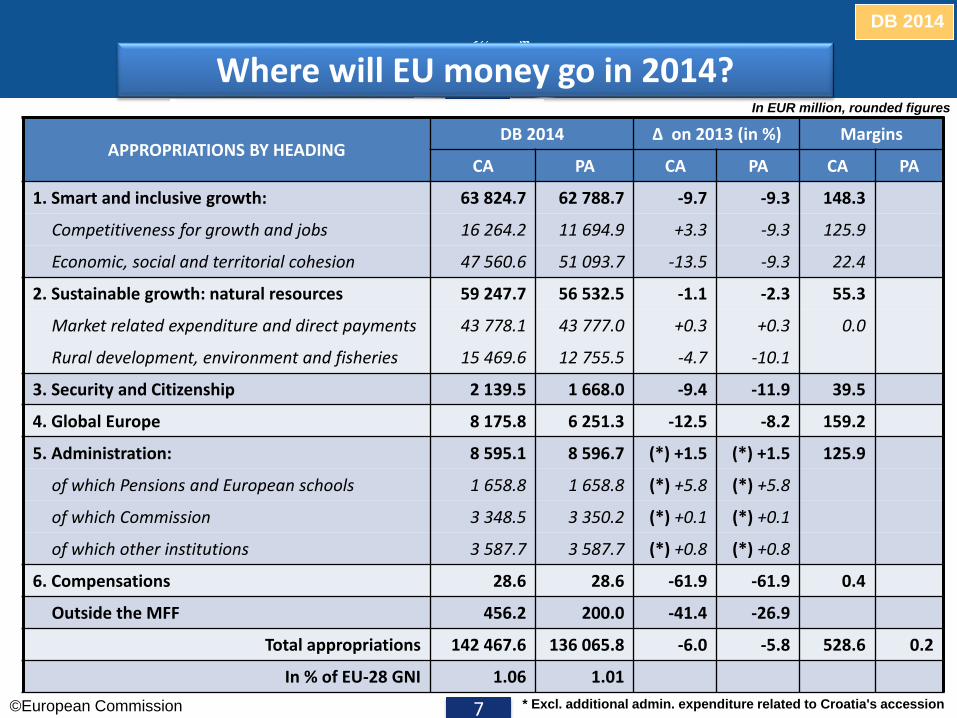
In EUR million, rounded figures
APPROPRIATIONS BY HEADING DB 2014 ∆ on 2013 (in %) Margins
CA PA CA PA CA PA
1. Smart and inclusive growth: 63 824.7 62 788.7 -9.7 -9.3 148.3
Competitiveness for growth and jobs 16 264.2 11 694.9 +3.3 -9.3 125.9
Economic, social and territorial cohesion 47 560.6 51 093.7 -13.5 -9.3 22.4
2. Sustainable growth: natural resources 59 247.7 56 532.5 -1.1 -2.3 55.3
Market related expenditure and direct payments 43 778.1 43 777.0 +0.3 +0.3 0.0
Rural development, environment and fisheries 15 469.6 12 755.5 -4.7 -10.1
3. Security and Citizenship 2 139.5 1 668.0 -9.4 -11.9 39.5
4. Global Europe 8 175.8 6 251.3 -12.5 -8.2 159.2
5. Administration: 8 595.1 8 596.7 (*) +1.5 (*) +1.5 125.9
of which Pensions and European schools 1 658.8 1 658.8 (*) +5.8 (*) +5.8
of which Commission 3 348.5 3 350.2 (*) +0.1 (*) +0.1
of which other institutions 3 587.7 3 587.7 (*) +0.8 (*) +0.8
6. Compensations 28.6 28.6 -61.9 -61.9 0.4
Outside the MFF 456.2 200.0 -41.4 -26.9
Total appropriations 142 467.6 136 065.8 -6.0 -5.8 528.6 0.2
In % of EU-28 GNI 1.06 1.01
* Excl. additional admin. expenditure related to Croatia's accession

©European Commission
DB 2014
Comparison of financial programming 2014-2020 with 2007-2013 for a selection of programmes
8
MFF Heading
Programme 2007-2013
2014-2020
Evolution in %
1a Connecting Europe Facility (CEF) 13.3 30.6 130.0%
1a Erasmus for all 9.5 13.0 36.5%
1a Horizon 2020 56.9 70.2 23.4%
1a Social Change and Innovation (PSCI) 0.9 0.9 5.8%
1a Competitiveness of Enterprises and SMEs 1.1 2.0 81.8%
2 Environment and Climate action (LIFE) 2.3 3.4 50.1%
3 Creative Europe 1.2 1.5 18.4%
4 European Neighbourhood Instrument (ENI) 14.0 15.4 10.3%
4 Development Cooperation Instrument (DCI) 18.1 19.6 8.5%
In EUR billion, at 2011 prices
©European Commission
DB 2014
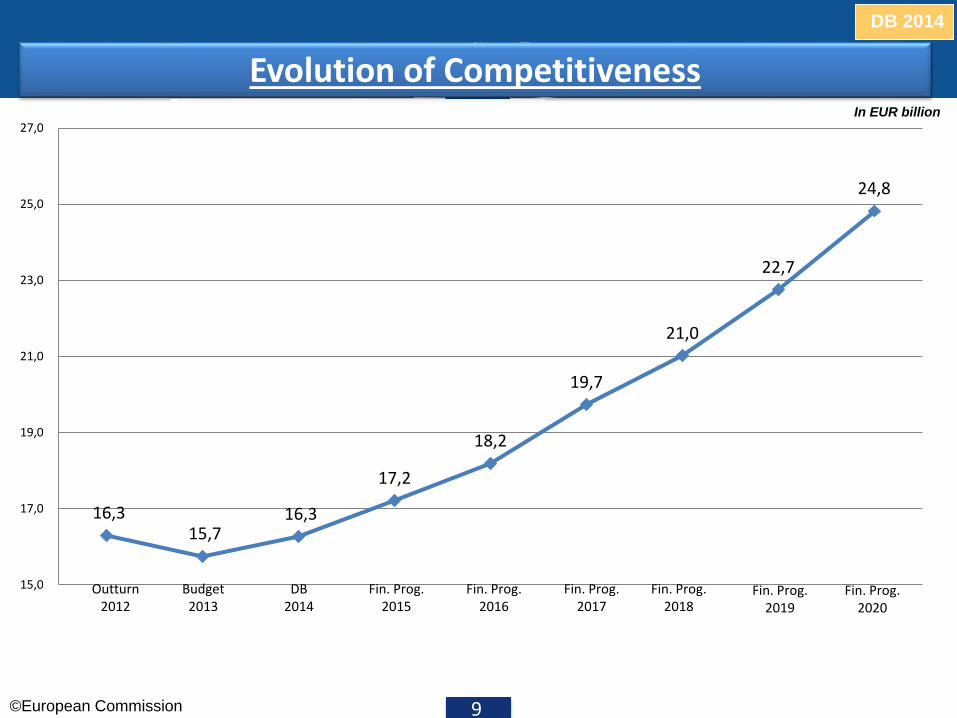
Evolution of Competitiveness
9
In EUR billion
16,3 15,7
16,3
17,2
18,2
19,7
21,0
22,7
24,8
15,0
17,0
19,0
21,0
23,0
25,0
27,0
Budget 2013
DB 2014
Fin. Prog. 2015
Fin. Prog. 2016
Fin. Prog. 2017
Fin. Prog. 2018
Fin. Prog. 2019
Fin. Prog. 2020
Outturn 2012

©European Commission
DB 2014
Evolution of Cohesion
10
In EUR billion
52,7
55,0
47,6
49,4
50,8
52,3
53,9
55,6
57,2
45,0
50,0
55,0
60,0
Budget 2013
DB 2014
Fin. Prog. 2015
Fin. Prog. 2016
Fin. Prog. 2017
Fin. Prog. 2018
Fin. Prog. 2019
Fin. Prog. 2020
Outturn 2012

©European Commission
DB 2014
Evolution of Smart and Inclusive Growth
11
In EUR billion
69,0
70,7
63,8
66,6
69,0
72,0
74,9
78,3
82,0
60,0
70,0
80,0
90,0
Budget 2013
DB 2014
Fin. Prog. 2015
Fin. Prog. 2016
Fin. Prog. 2017
Fin. Prog. 2018
Fin. Prog. 2019
Fin. Prog. 2020
Outturn 2012
©European Commission
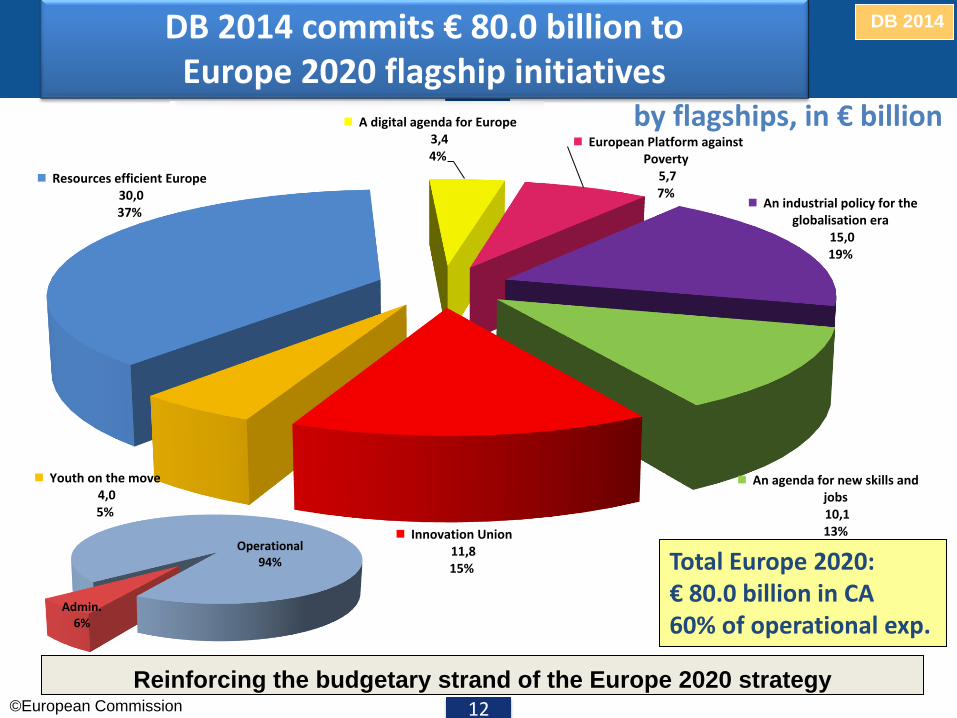
DB 2014 DB 2014 commits € 80.0 billion to Europe 2020 flagship initiatives
by flagships, in € billion
Total Europe 2020: € 80.0 billion in CA 60% of operational exp.
12
Admin. 6%
Operational 94%
Reinforcing the budgetary strand of the Europe 2020 strategy
Innovation Union 11,8 15%
Youth on the move 4,0 5%
Resources efficient Europe 30,0 37%
A digital agenda for Europe 3,4 4%
European Platform against Poverty
5,7 7%
An industrial policy for the globalisation era
15,0 19%
An agenda for new skills and jobs 10,1 13%

©European Commission
DB 2014
Programming 2014 2015 2016 2017 2018 2019 2020 Total
Youth Specific Initiative (YEI) Specific top-up allocation
Initial 428.6 428.6 428.6 428.6 428.6 428.6 428.6 3 000.0
Revised 1 700.0 1 300.0 0.0 0.0 0.0 0.0 0.0 3 000.0
Difference + 1 271.0 + 871.4 - 428.6 - 428.6 - 428.6 - 428.6 - 428.6 0.0
Frontloading (Article 9f MFFR)
+ 2 143.0 - 2 143.0 0.0
Youth Specific Initiative (YEI) European Social Fund (ESF) matching amount
Initial 428.6 428.6 428.6 428.6 428.6 428.6 428.6 3 000.0
Revised 1 700.0 1 300 0 0 0 0 0 3 000.0
Difference + 1 271.0 + 871.4 - 428.6 - 428.6 - 428.6 - 428.6 - 428.6 0.0
Total YEI 3 400.0 2 600.0 0.0 0.0 0.0 0.0 0.0 6 000.0
13
Tackling unemployment and the social consequences of the crisis
Youth Employment Initiative (YEI) – Initial and revised programming
In EUR million, at 2011 prices
©European Commission
DB 2014
SME INITIATIVES
14
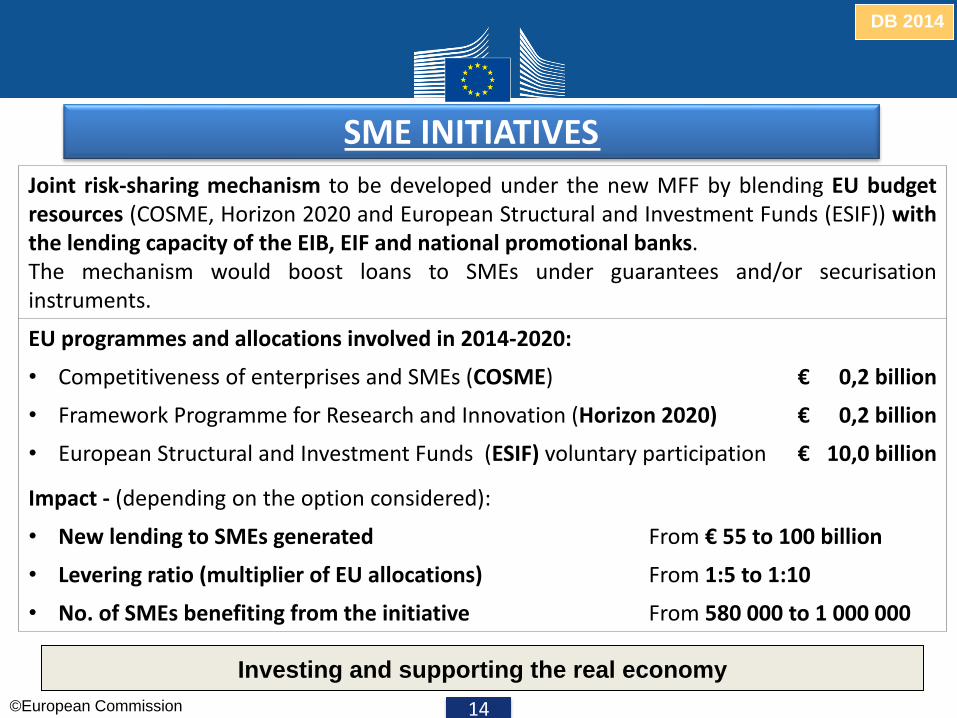
Joint risk-sharing mechanism to be developed under the new MFF by blending EU budget resources (COSME, Horizon 2020 and European Structural and Investment Funds (ESIF)) with the lending capacity of the EIB, EIF and national promotional banks. The mechanism would boost loans to SMEs under guarantees and/or securisation instruments.
EU programmes and allocations involved in 2014-2020:
• Competitiveness of enterprises and SMEs (COSME) € 0,2 billion
• Framework Programme for Research and Innovation (Horizon 2020) € 0,2 billion
• European Structural and Investment Funds (ESIF) voluntary participation € 10,0 billion
Impact - (depending on the option considered):
• New lending to SMEs generated From € 55 to 100 billion
• Levering ratio (multiplier of EU allocations) From 1:5 to 1:10
• No. of SMEs benefiting from the initiative From 580 000 to 1 000 000
Investing and supporting the real economy
©European Commission
DB 2014
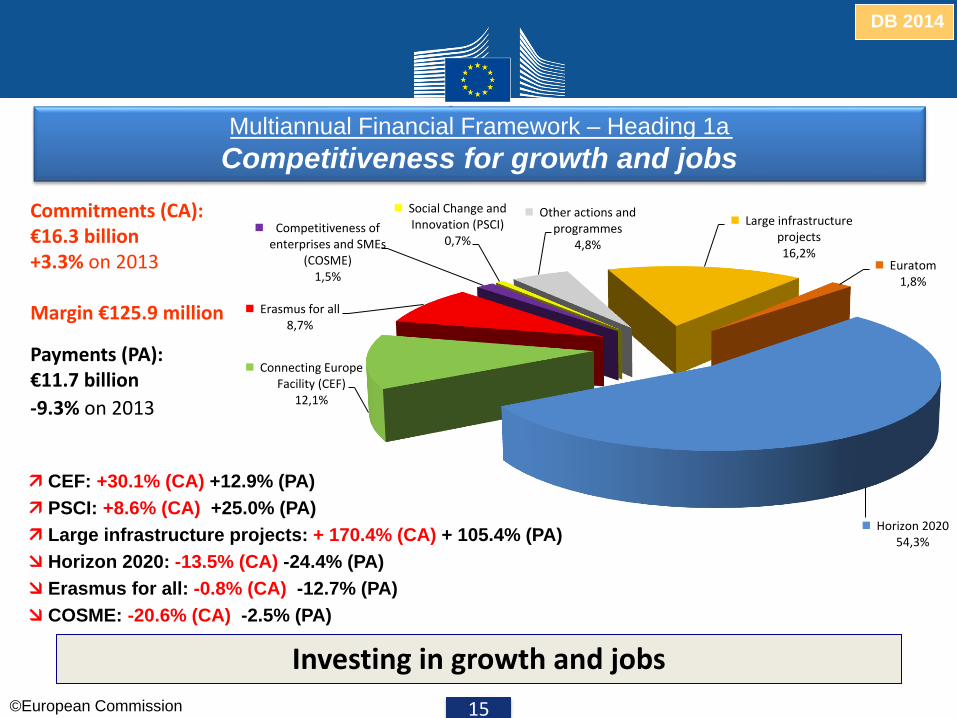
Multiannual Financial Framework – Heading 1a
Competitiveness for growth and jobs
Commitments (CA): €16.3 billion +3.3% on 2013 Margin €125.9 million
CEF: +30.1% (CA) +12.9% (PA)
PSCI: +8.6% (CA) +25.0% (PA)
Large infrastructure projects: + 170.4% (CA) + 105.4% (PA)
Horizon 2020: -13.5% (CA) -24.4% (PA)
Erasmus for all: -0.8% (CA) -12.7% (PA)
COSME: -20.6% (CA) -2.5% (PA)
Investing in growth and jobs
Payments (PA): €11.7 billion
-9.3% on 2013
15
Large infrastructure projects 16,2%
Euratom 1,8%
Horizon 2020 54,3%
Connecting Europe Facility (CEF)
12,1%
Erasmus for all 8,7%
Competitiveness of enterprises and SMEs
(COSME) 1,5%
Social Change and Innovation (PSCI)
0,7%
Other actions and programmes
4,8%

©European Commission
DB 2014
Multiannual Financial Framework – Heading 1a
Competitiveness for growth and jobs
Investing in growth and jobs 16
In EUR billion
10,0 10,2
8,8 9,6
10,3 10,9
11,6 12,4 13,5
1,7
1,4 1,4 1,6 1,8 2,1 2,3 2,6
2,9
1,5
1,5 2,0 2,2
2,7 3,2 3,6 4,0 4,3
-
2,0
4,0
6,0
8,0
10,0
12,0
14,0
Horizon 2020 Erasmus for all CEF
Budget 2013
DB 2014
Fin. Prog. 2015
Fin. Prog. 2016
Fin. Prog. 2017
Fin. Prog. 2018
Fin. Prog. 2019
Fin. Prog. 2020
Outturn 2012
Commitments (CA): €16.3 billion ; +3.3% on 2013 Margin €125.9 million
Payments (PA): €11.7 billion ; -9.3% on 2013

©European Commission
DB 2014
Multiannual Financial Framework – Heading 1b
Economic, social and territorial cohesion
New actions:
European Aid for the Most Deprived: €0,4 billion (CA)
Youth Employment initiative: €3,6 billion (CA)
Commitments: €47.6 billion -13.5% on 2013
Margin €22.4 million
Ensuring swift adoption of the operational programmes
Payments: €51.1 billion -9.3% on 2013
17
Regional convergence (Less developed regions)
49,1%
Transition regions 9,9%
Competitiveness (More developed regions)
15,5%
Outermost and sparsely populated regions
0,4%
Cohesion fund 18,8%
European territorial cooperation
1,4%
Youth Employment initiative, European Aid
to the Most Deprived and Technical assistance
4,9%
©European Commission
DB 2014
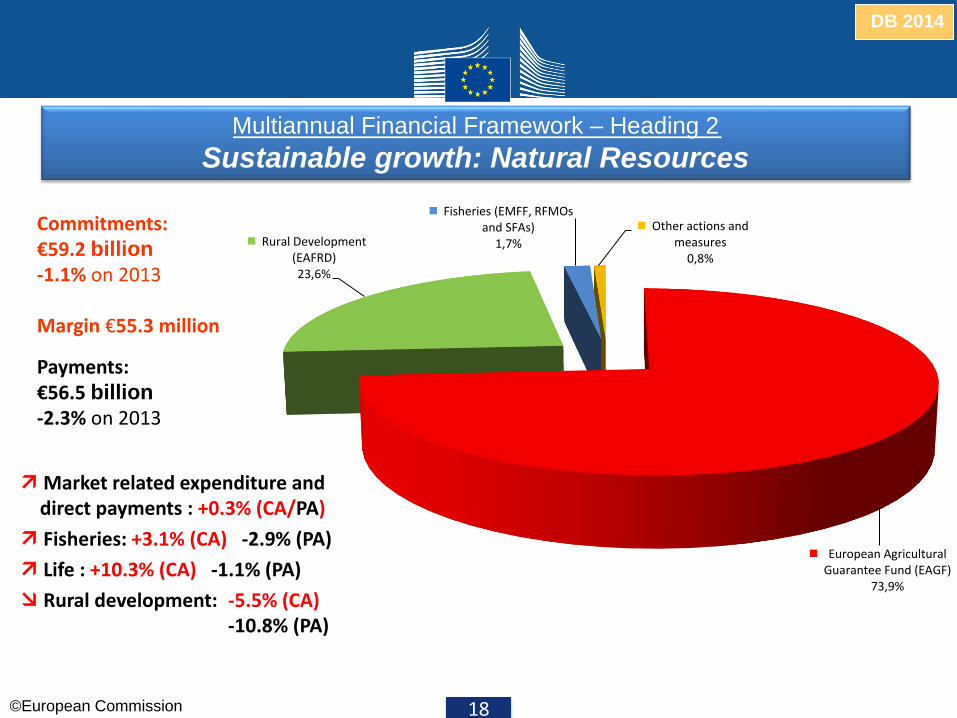
Multiannual Financial Framework – Heading 2
Sustainable growth: Natural Resources
Market related expenditure and direct payments : +0.3% (CA/PA)
Fisheries: +3.1% (CA) -2.9% (PA)
Life : +10.3% (CA) -1.1% (PA)
Rural development: -5.5% (CA) -10.8% (PA)
Commitments: €59.2 billion -1.1% on 2013 Margin €55.3 million
Payments: €56.5 billion -2.3% on 2013
18
European Agricultural Guarantee Fund (EAGF)
73,9%
Rural Development (EAFRD) 23,6%
Fisheries (EMFF, RFMOs and SFAs)
1,7%
Other actions and measures
0,8%

©European Commission
DB 2014
19
In EUR million
Evolution of LIFE in CA
0,0
100,0
200,0
300,0
400,0
500,0
600,0
353,5 366,9
404,6 435,1
462,8 493,7
523,5 555,7
581,1
Budget 2013
DB 2014
Fin. Prog. 2015
Fin. Prog. 2016
Fin. Prog. 2017
Fin. Prog. 2018
Fin. Prog. 2019
Fin. Prog. 2020
Outturn 2012
Multiannual Financial Framework – Heading 2
Sustainable growth: Natural Resources

©European Commission
DB 2014
Multiannual Financial Framework – Heading 3
Security and Citizenship
One single heading for programmes close to citizens
20
Civil protection:
+20.1% (CA) +62.9% (PA)
Health & Consumer protection: +4.6% (CA) -13.9% (PA)
Asylum & Migration Fund: -18.6% (CA) -53.5% (PA)
Internal Security Fund: -17.0% (CA) -23.6% (PA)
Creative Europe: -5.8% (CA) +5.0% (PA)
Commitments: €2.1 billion -9.4% on 2013
Margin €39.5 million
Payments: €1.7 billion -12.0% on 2013
Asylum and Migration Fund (AMF) 18,8% Internal Security Fund (ISF)
18,8%
Justice 2,2%
Rights and Citizenship 2,6%
Food and feed 11,8%
Creative Europe 8,3%
Europe for Citizens, Health for Growth and Consumer
protection 5,0%
Communication actions 3,7%
Other actions and programmes
6,0%
Decentralised agencies 22,7%

©European Commission
DB 2014
21
In EUR billion
Multiannual Financial Framework – Heading 3
Security and Citizenship
1,1 1,1
0,9 1,0 1,0
1,1 1,2
1,3 1,4 1,2 1,2 1,2 1,2 1,3 1,3 1,3 1,4 1,4
-
0,2
0,4
0,6
0,8
1,0
1,2
1,4
1,6
Security Citizenship
Budget 2013
DB 2014
Fin. Prog. 2015
Fin. Prog. 2016
Fin. Prog. 2017
Fin. Prog. 2018
Fin. Prog. 2019
Outturn 2012
Fin. Prog. 2020

©European Commission
DB 2014
22
In EUR million
Evolution of Creative Europe in CA
0,0
50,0
100,0
150,0
200,0
250,0
204,8 189,6
178,6 177,7 191,8
206,9
223,0
240,1 244,7
Budget 2013
DB 2014
Fin. Prog. 2015
Fin. Prog. 2016
Fin. Prog. 2017
Fin. Prog. 2018
Fin. Prog. 2019
Fin. Prog. 2020
Outturn 2012
Multiannual Financial Framework – Heading 3
Security and Citizenship

©European Commission
DB 2014
Multiannual Financial Framework – Heading 4
Global Europe
PI: +57.5% (CA) +82.2% (PA)
HUMA: +4.6% (CA) -4.4% (PA)
EIDHR: +1.3% (CA) -18.7% (PA)
IPA: -17.1% (CA) -5.7% (PA)
ENI: -14.5% (CA) -3.4% (PA)
DCI: -12.6% (CA) -10.7% (PA)
Commitments: €8.2 billion -12.5% on 2013
Margin €159.2 million
Payments: €6.3 billion -8.2% on 2013
Promoting European values and interests 23
Instrument for Pre-accession assistance (IPA)
19,2%
Instrument for Stability (IfS) 3,8%
European Neighbourhood Instrument (ENI)
25,8%
Common Foreign and Security Policy (CFSP)
3,8%
European Instrument for Democracy and Human
Rights (EIDHR) 2,2%
Partnership Instrument (PI)
1,4% Humanitarian aid 11,1%
Other actions and programmes
4,3%
Development Cooperation Instrument
(DCI) 28,2%

©European Commission
DB 2014
24
In EUR billion
1,9 1,9
1,6 1,6 1,7 1,7 1,7 1,8 1,8
2,4 2,5
2,1 2,0 2,1
2,2 2,2
2,4 2,4
2,7 2,6
2,3 2,5
2,6 2,8
3,0
3,2 3,3
1,0
1,5
2,0
2,5
3,0
3,5
Instrument for Pre-accession assistance (IPA) European Neighbourhood Instrument (ENI) Development Cooperation Instrument (DCI)
Budget 2013
DB 2014
Fin. Prog. 2015
Fin. Prog. 2016
Fin. Prog. 2017
Fin. Prog. 2018
Fin. Prog. 2019
Outturn 2012
Fin. Prog. 2020
Multiannual Financial Framework – Heading 4
Global Europe
©European Commission
DB 2014
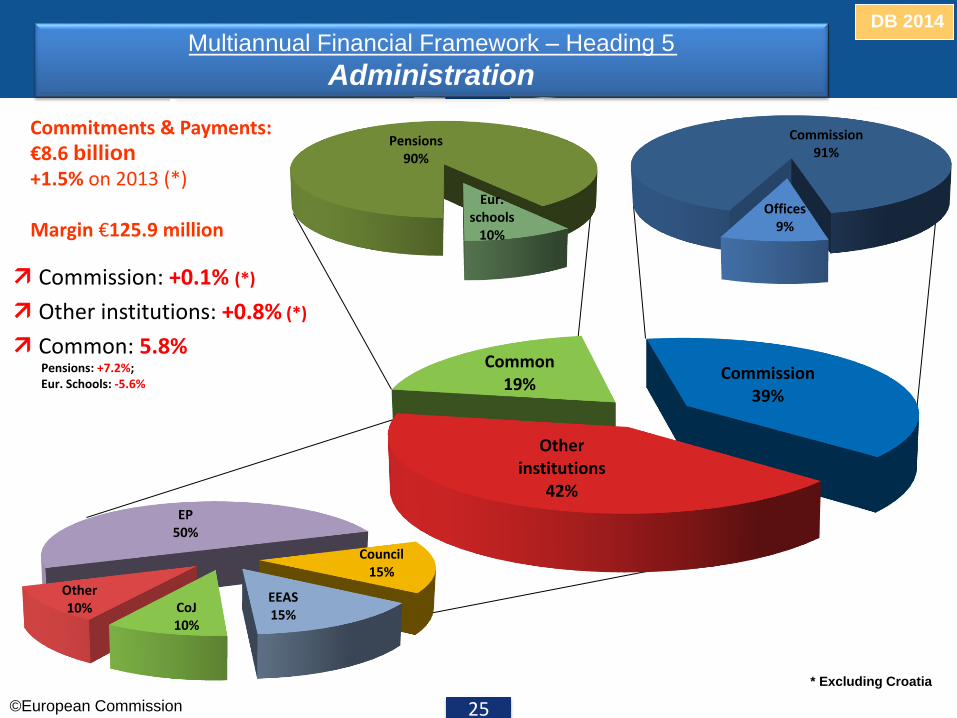
Multiannual Financial Framework – Heading 5
Administration
Commission: +0.1% (*)
Other institutions: +0.8% (*)
Common: 5.8% Pensions: +7.2%; Eur. Schools: -5.6%
* Excluding Croatia
25
Commission 39%
Other institutions
42%
Common 19%
Commission 91%
Offices 9%
Commitments & Payments: €8.6 billion +1.5% on 2013 (*) Margin €125.9 million
Pensions 90%
Eur. schools
10%
EP 50%
Council 15%
EEAS 15%
CoJ 10%
Other 10%

©European Commission
DB 2014
Multiannual Financial Framework – Heading 5
Administration
26
Commitments & Payments: €8.6 billion ; +1.5% on 2013 (*) ; Margin €125.9 million
1,5 1,6 1,7 1,8
1,9 2,1
2,2 2,4
2,6
3,5 3,3 3,3 3,4 3,5 3,6 3,7 3,8 3,9
3,8
3,5 3,6 3,7 3,8 3,9 4,0 4,1
4,3
-
0,5
1,0
1,5
2,0
2,5
3,0
3,5
4,0
4,5
Pensions and European Schools Commission Other institutions
Budget 2013
DB 2014
Fin. Prog. 2015
Fin. Prog. 2016
Fin. Prog. 2017
Fin. Prog. 2018
Fin. Prog. 2019
Outturn 2012
Fin. Prog. 2020
In EUR billion

©European Commission
DB 2014
Multiannual Financial Framework – Heading 5
Administration
Institution 2013 2014 2014 / 2013 (*)
Pensions and European schools 1 568.2 1 658.8 +5.8%
Pensions 1 389.8 1 490.3 +7.2%
European schools 178.4 168.5 -5.6%
Administrative expenditure of the institutions 6 849.9 6 936.3 +0.5%
Commission 3 322.7 3 348.5 +0.1%
Other institutions: 3 527.2 3 587.7 +0.8%
European Parliament 1 750.5 1 793.6 +1.7%
European Council and Council 535.5 536.8 -1.1%
Court of Justice of the European Union 354.9 355.4 -1.9%
Court of Auditors 142.8 138.2 -4.2%
European Economic and Social Committee 130.1 131.0 -0.2%
Committee of the Regions 87.4 89.3 +0.3%
European Ombudsman 9.7 10.1 +2.4%
European Data Protection Supervisor 7.7 8.4 +10.1%
European External Action Service 508.8 524.9 +3.2%
Total Heading 5 - Administration 8 418.1 8 595.1 +1.5 %
27
In EUR million
Limiting administrative expenditure to a minimum * Excluding additional admin. expenditure related to Croatia's accession

©European Commission
DB 2014
Institutions 2013
Budget (*)
2014 DB (excl.
Croatia)
Evolution 2014/2013
(excl. Croatia)
2014 Croatia request
2014 DB (incl.
Croatia)
Evolution 2014/2013
(incl. Croatia)
European Parliament 6 743 6 773 30 0.4% 6 773 30 0.4%
European Council and Council 3 153 3 111 -42 -1.3% 3 111 -42 -1.3%
Commission 24 942 24 686 -256 -1.0% (**) 215 24 901 -41 -0.1%
Court of Justice of the European Union (***) 2 002 1 991 -11 -0.5% 1 991 -11 -0.5%
Court of Auditors 891 882 -9 -1.0% 882 -9 -1.0%
European Economic and Social Committee 727 720 -7 -1.0% 720 -7 -1.0%
Committee of the Regions 537 532 -5 -0.9% 532 -5 -0.9%
European Ombudsman 67 67 0 0.0% 67 0 0.0%
European Data-protection Supervisor 45 45 0 0.0% 45 0 0.0%
European External Action Service 1 670 1 661 -9 -0.5% 1 661 -9 -0.5%
Total Institutions 40 777 40 468 -309 -0.8% 215 40 683 -94 -0.2%
Human resources by Institutions How Institutions have taken into account a 1 % staff reduction
28
(*) Budget 2013 includes draft amending budgets 1 to 5, i.e. including the additional posts requested for the Court of Justice (+ 7 posts) (**) Including 11 transformation into posts of enlargement related appropriations frontloaded in 2012 or granted in 2013 (***) Excluding the request related to an extension of the Court of Justice by 12 new Judges (9 law clerks, one for each Chamber of the General Court)
(Number of posts in the establishment plans of the Institutions)

©European Commission
DB 2014
Heading 2013
Budget 2014
DB ∆ on 2013
Support expenditure outside research and heading 5 429.5 431.6 0.5%
Support expenditure for operations and programmes 358.1 360.6 0.7%
Executive agencies (outside research agencies) 71.4 71.0 -0.6%
Support expenditure from direct and indirect research 780.7 789.2 1.1%
Officials and temporary staff 405.3 397.1 -2.0%
External personnel 90.3 90.6 0.3%
Other management expenditure 187.7 185.6 -1.2%
Other expenditure for major research infrastructure 17.0
Executive agencies for research 97.4 99.0 +1.6%
TOTAL ADMINISTRATIVE EXPENDITURE OUTSIDE HEADING 5 1 210.3 1 220.8 0.9%
29
Summary overview of administrative expenditure outside heading 5
Overall support expenditure restricted
In EUR million

©European Commission
DB 2014
The EU Budget will emphasise the results to be delivered
• Simplified and result-oriented budget nomenclature:
– Clear link between the objectives of the new legal bases and allocation of appropriations enabling political choices to be made;
– Reduction of the total number of operational budget chapters and lines.
• Programme Statements providing more focused and relevant performance information:
– More relevant and focused information for budget procedure linking budget lines to results to be achieved;
– Political priority of programmes: Contribution to Europe 2020 Strategy and mainstreaming of climate action.
30
New Programme Statements and revised nomenclature for 2014-2020