draft - ca state lands commission...
TRANSCRIPT

DRAFT v 2.52009 BIENNIAL REPORT ON THECALIFORNIA MARINE INVASIVE
SPECIES PROGRAM
PRODUCED FOR THE CALIFORNIA STATE LEGISLATURE
ByM. Falkner, N. Dobroski, C. Scianni, and D. Gehringer
California State Lands CommissionMarine Facilities Division
December 2008EXECUTIVE SUMMARYBackground - The Marine Invasive Species Act of 2003 revised and expanded the
Ballast Water Management for Control of Nonindigenous Species Act of 1999 to more
effectively address the nonindigenous species (NIS) threat. In 2006, the Coastal
Ecosystems Protection Act further expanded the State’s law, requiring the adoption of
performance standards for the discharge of ballast water. The law charged the
California State Lands Commission (Commission) with oversight of the state’s program
to prevent or minimize the introduction of NIS from commercial vessels. To advance
this goal, the Commission utilizes a comprehensive, multi-pronged approach that
includes: ballast water management tracking, compliance, and enforcement; sound
policy development in consultation with a wide array of experts and stakeholders;
applied research that advances the strategies for NIS prevention; and outreach and
education to coordinate information exchange among scientists, legislators, and
stakeholders. This report summarizes the activities and accomplishments in each of
these areas from July 2006 through June 2008.
Compliance - Upon departure from each port or place in California, vessels are required
to submit a Ballast Water Reporting Form which details their ballast management
practices. Since July 2006, over 22,000 reporting forms have been submitted to the
Commission. In order to verify that vessels have submitted reporting forms, received
forms are matched with arrival data from the State’s Marine Exchanges. Compliance
with the requirement to submit this form consistently exceeds 95%.
Compliance rates with ballast water management requirements in California remain
extremely high. During the period covered by this report, more than 135 million metric
tons of vessel-reported ballast water was carried into State waters, and 98% was
managed in compliance with California law. Over 85% of the vessels operating in
California achieve compliance with California’s requirements by retaining their ballast
water onboard. Of the nearly 19 million metric tons of ballast water discharged into
California between July 2006 and June 2008, 84.5% was appropriately managed
through legal ballast water exchange and was compliant with California law.
ii

The total volume of ballast water discharged into California has been increasing since
the last half of 2006; however, the volume of noncompliant ballast water has decreased
45% over the past two years. Furthermore, the vast majority of the noncompliant ballast
water discharged in State waters underwent some type of exchange, likely reducing the
risk of NIS introductions.
Commission Marine Safety personnel verify vessel-reported ballast water management
practices through onboard inspections of vessel logbooks and sampling of ballast water
to be discharged. Between July 2006 and June 2008, 3792 ballast water inspections
were conducted by Commission staff. Of those inspections, approximately two percent
of the vessels were in violation of the operational aspects of the law, which includes
improper ballast water management.
Performance Standards - In September 2006, the Legislature passed the Coastal
Ecosystems Protection Act of 2006, directing the Commission to adopt performance
standards for the discharge of ballast water by January 1, 2008, and prepare a report
assessing the availability of treatment technologies to meet those standards. The
Commission completed the rulemaking process and adopted the standards in October
2007; the technology assessment report was completed in January 2008. The effective
implementation of these standards requires Marine Invasive Species Program staff to
move forward on several new projects and rulemaking actions including: 1) ballast water
treatment technology testing guidelines, 2) regulations to inform the selection of
sampling points (i.e. location) and sampling facilities (i.e. equipment) on vessels, and 3)
procedures and protocols for use by Commission Marine Safety personnel to verify
vessel compliance with the performance standards.
Vessel Fouling - Commission staff has also been working to address the threat of NIS
introduction via vectors other than ballast water. In January 2008, Commission staff
began collecting data, using a Hull Husbandry Reporting Form, on the fouling-related
husbandry practices of the commercial vessel fleet visiting California waters. These
iii

data will be used in conjunction with information gathered through fouling-related
research currently funded by the Commission’s Marine Invasive Species Program
(MISP) to better understand how husbandry practices and voyage characteristics affect
the quantity and quality of fouling biota associated with vessels operating in California.
The Commission is mandated to adopt regulations governing the management of vessel
fouling by January 1, 2012. Both sets of information will guide and inform the
development of these regulations.
Research - The Commission continues to fund and facilitate numerous research
projects that address high priority management challenges including: a variety of inter-
related vessel fouling research projects; additional research examining tools to verify
ballast water exchange; the assessment of ballast water treatment technologies on
operational vessels; and the establishment of a ballast water testing platform in
California to facilitate the development of treatment systems and their evaluation.
Outreach & Education - Commission staff has also maintained an advisory role and/or is
an actively participating member of several organizations that address ship-born NIS
issues. Staff participates in activities with the California Agencies Aquatic Invasive
Species Team, part of the California Invasive Species Management Plan; West Coast
Ballast Outreach Project Advisory Committee; Oregon’s Ballast Water Management
Task Force; and the Pacific Ballast Water Working Group. Additionally, staff has
convened or received invitation to participate in several workshops and has given
presentations at numerous national and international meetings to build dialogues with
professionals across a wide range of disciplines.
Next Steps - In the coming years the Commission will be: (1) developing protocols and
regulations to effectively implement California’s performance standards for the
discharge of ballast water; (2) compiling and analyzing data related to vessel fouling to
guide and inform the development of regulations on fouling management for vessels
operating in California; (3) supporting research on ballast water treatment and hull
cleaning technology development; and (4) seeking legislative authority to amend the
iv

ballast water reporting requirements via regulations. The focus of the Commission will
continue to be on protection, prevention, outreach and education, and solution-based
actions. The Commission will concentrate available resources on working proactively
with the regulated industry to achieve a high rate of compliance with required
management practices, to minimize discharges of unmanaged water, and to reduce the
risks of biological invasions.
v

TABLE OF CONTENTS
EXECUTIVE SUMMARY.............................................................................................. iiABBREVIATIONS........................................................................................................ viiiI. PURPOSE................................................................................................................. 1II. INTRODUCTION...................................................................................................... 1 NONINDIGENOUS SPECIES AND VEHICLES OF INTRODUCTION- “SHIPPING VECTORS”..... 1
NIS IMPACTS............................................................................................................. 2
PREVENTION THROUGH VECTOR MANAGEMENT .......................................................... 4
III. REGULATORY OVERVIEW................................................................................... 8 INTERNATIONAL PROGRAMS........................................................................................ 9
FEDERAL REGULATIONS.............................................................................................. 11
STATE PROGRAMS...................................................................................................... 13
IV. COMMISSION’S MARINE INVASIVE SPECIES PROGRAM ................................ 16 LEGISLATION.............................................................................................................. 16
PERFORMANCE STANDARDS....................................................................................... 18
VESSEL FOULING....................................................................................................... 20
THE COMMISSION’S MISP.......................................................................................... 21
V. DATA ANALYSIS.................................................................................................... 25 TRENDS IN STATEWIDE VESSEL TRAFFIC..................................................................... 25
BALLAST WATER MANAGEMENT AND COMPLIANCE...................................................... 35
TRENDS IN VESSEL FOULING-RELATED PRACTICES AND PATTERNS............................. 54
FEE SUBMISSION....................................................................................................... 70
VI. RESEARCH............................................................................................................ 71 FUNDED AND COLLABORATIVE RESEARCH................................................................... 71
REVIEW OF CURRENT VESSEL VECTOR RESEARCH................................................... 84
VII. NEEDED RESEARCH........................................................................................... 87VIII. CONCLUSIONS AND LOOKING FORWARD...................................................... 88IX. REFERENCES ....................................................................................................... 93
vi
ABBREVIATIONS
AB Assembly Bill
ABRPI Aquatic Bioinvasions Research and Policy Institute
Act Marine Invasive Species Act (AB 433)
APL American Presidential Line
BEAM Ballast water Exchange Assurance Meter
BOE Board of Equalization
BWE Ballast Water Exchange
BWEv Ballast Water Exchange verification
CA California
CANOD California Aquatic Non-Native Organism Database
CCR California Code of Regulations
CDFG California Department of Fish and Game
CDOM chromophoric dissolved organic matter
CFR Code of Federal Regulations
CFU Colony-Forming Unit
COI Cytochrome Oxidase subunit I
Commission California State Lands Commission
CWA Clean Water Act
EA Environmental Assessment
EEZ Exclusive Economic Zone
EPA Environmental Protection Agency
ETV Environmental Technology Verification
FIFRA Federal Insecticide, Fungicide, and Rodenticide Act
HHRF Hull Husbandry Reporting Form
IMO International Maritime Organization
LA-LB Los Angeles-Long Beach port complex
LPOC Last Port-Of-Call
m meters
ml milliliter
vii

MARAD Maritime Administration
MISP Marine Invasive Species Program
MLML Moss Landing Marine Laboratories
MMT Million Metric Tons
MT Metric Tons
NEMESIS National Exotic Marine and Estuarine Species Information System
NIS Nonindigenous Species
nm Nautical Miles
NOAA National Oceanic and Atmospheric Administration
NOBOB No Ballast On Board
NPDES National Pollution Discharge Elimination System
OR Oregon
OSPR Office of Spill Prevention and Response
PCR Pacific Coast Region
PPT Parts Per Thousand
PRC Public Resources Code
QV Qualifying Voyage
ROV Remotely Operated Vehicles
SD Standard Deviation
SERC Smithsonian Environmental Research Center
SMURF Standard Monitoring Unit for the Recruitment of Fish
STEP Shipboard Technology Evaluation Program
TAG Technical Advisory Group
TBT Tributyltin
µm micrometer
U.S. United States
USCG United States Coast Guard
WA Washington
Water Board State Water Resources Control Board
WDFW Washington Department of Fish and Wildlife
WSA Wetted Surface Area
viii

I. PURPOSEThis report was prepared for the California State Legislature pursuant to Public
Resources Code (PRC) Section 71212. According to statute, the California State Lands
Commission (Commission) shall prepare, and update biennially, a report that includes
an analysis of ballast and vessel fouling management practices reported by the
industry, summarizes recent research addressing the release of nonindigenous species
(NIS) by vessels, evaluates the effectiveness of California’s Marine Invasive Species
Program (MISP), and puts forth recommendations to improve the effectiveness of the
program.
The activities from the first two and one half years of the program (January 2000 – June
2002) are detailed in the first biennial report to the Legislature (Falkner 2003). MISP
activities from January 2003 through December 2004 are covered in Falkner et al.
(2005), and Falkner et al. (2007) describes MISP progress between January 1, 2004
and June 30, 2006. This report summarizes MISP activities, research and analyses
between July 1, 2006 and June 30, 2008.
II. INTRODUCTION
Nonindigenous Species and Vehicles of Introduction – “Shipping Vectors”
Also know as “introduced,” “invasive,” “exotic,” “alien,” or “aquatic nuisance species,”
nonindigenous species in marine, estuarine and freshwater environments may be
transported to new regions through numerous human activities. Intentional and
unintentional introductions of fish and shellfish, aquaculture, illegal releases from the
aquarium and pet industries, floating marine debris, bait shipments, and accidental
release through research institutions are just a few of the mechanisms, or vectors, by
which organisms are introduced into U.S. waters (U.S. Commission on Ocean Policy
2004). In coastal environments, commercial shipping is the most important vector for
invasion, accounting for or contributing to 79.5% of introductions to North America
(Fofonoff et al. 2003).
1
Commercial ships transport organisms through two primary mechanisms - ballast water
and vessel fouling. Ballast water is necessary for many functions related to the trim,
stability, maneuverability, and propulsion of large seagoing vessels (National Research
Council 1996). Vessels may take on, discharge, or redistribute water during cargo
loading and unloading, as they encounter rough seas, or as they transit through shallow
coastal waterways. Typically, a vessel takes on ballast water after cargo is unloaded in
one port to compensate for the weight imbalance, and will later discharge water when
cargo is loaded in another. This transfer of ballast water from “source” to “destination”
ports results in the movement of many organisms from one region to the next. In this
fashion, it is estimated that more than 7000 species are moved around the world on a
daily basis (Carlton 1999). Moreover, each ballast water discharge event has the
potential to release over 21.2 million individual planktonic animals (Minton et al. 2005).
Fouling organisms are aquatic species attached to or associated with submerged hard
surfaces. These include organisms such as barnacles, algae, and mussels that
physically attach to vessel surfaces, and mobile organisms such as worms, juvenile
crabs, and amphipods (small shrimp-like animals) that associate with the attached
fouling community. When vessels move from port to port, fouling communities are
transported along with their “host” structure. Fouling organisms are introduced to new
environments when they spawn (reproduce) or drop off their transport vector (i.e.
vessels). Thus vessel fouling has been identified as one of the most important
mechanism for marine NIS introductions in several regions, including North America,
Hawaii and the North Sea (Ruiz et al. 2000a, Eldredge and Carlton 2002, Gollasch
2002).
NIS Impacts
The rate, and thus the risk, of species invasions has increased significantly during
recent decades. In North America, the rate of reported invasions in marine and
estuarine waters has increased exponentially over the last 200 years (Ruiz et al.
2000a). In the San Francisco Bay Estuary alone, a new species is believed to become
2

established every 14 weeks (Cohen and Carlton 1998). One of the primary factors
leading to this increase has been the vast expansion of global trade during the past 50
years, which in turn has lead to significantly more ballast water, fouled hulls, and
associated organisms moving around the world. The increased speed of global trade
has allowed many more potentially invasive organisms entrained in ballast tanks to
survive under decreased transit times (Ruiz and Carlton 2003). Organisms that arrive
“healthy” in recipient regions are more likely to thrive and reproduce in their new
habitats.
Once established, NIS can have severe ecological, economic, and human health
impacts in the receiving environment. One of the most infamous examples is the zebra
mussel (Dreissena polymorpha) which was introduced to the Great Lakes from the
Black Sea in the mid-1980s. Zebra mussels attach to hard surfaces in dense
populations (as many as 700,000 per square meter) that clog municipal water systems
and electric generating plants, resulting in costs of approximately a billion dollars a year
(Pimentel et al. 2005). In such high densities, zebra mussels filter vast amounts of tiny
floating plants and animals (plankton) from the water. Plankton support the foundations
of aquatic food webs, and disruptions to this base appear to reverberate throughout the
ecosystem. By dramatically reducing plankton concentrations and crowding out other
species, zebra mussels have altered ecological communities, causing localized
extirpation of native species (Martel et al. 2001) and declines in recreationally valuable
fish species (Cohen and Weinstein 1998). In 2007, a cousin of the zebra mussel, the
quagga mussel (Dreissena rostriformis bugensis), was discovered in the Colorado River
Aqueduct System that serves southern California, and in 2008 the zebra mussel was
discovered in San Justo Reservoir (California Department of Fish and Game 2008).
Impacts to California’s waterways and conveyance structures are only beginning to be
calculated.
In San Francisco Bay, the overbite clam (Corbula amurensis) spread throughout the
region’s waterways within two years of being detected in 1986. The clam accounts for
up to 95% of the living biomass in some shallow portions of the bay floor (Nichols et al.
3
1990). It has contributed to a persistent decline in the availability of plankton in the
Sacramento-San Joaquin River Delta (Jassby et al. 2002) which, in turn, may be a
cause of declines in local fish populations (Feyrer et al. 2003).
In addition to impacting ecosystems and native species, NIS may also pose a risk to
human health. The microorganisms that cause human cholera (Ruiz et al. 2000b) and
paralytic shellfish poisoning (Hallegraeff 1998) have been found in the water and
sediments in ballast tanks. The Chinese Mitten Crab (Eriocheir sinensis), first sighted in
San Francisco Bay in 1992 (Rudnick et al. 2000, Rudnick et al. 2005), is a secondary
host for the Asian lung fluke (Paragonimus westermanii), which is a known parasite of
humans. Though as of 2008 no infected crabs have been found in California, there is
significant risk of outbreak should the fluke, or an infected crab, arrive from overseas
(California Sea Grant 2003, G. Ruiz pers. comm. 2008).
Prevention through Vector Management
Attempts to eradicate NIS after they have become widely distributed are often
unsuccessful and costly (Carlton 2001). Between 2000 and 2006, over $7 million was
spent to eradicate the Mediterranean green seaweed (Caulerpa taxifolia) from two small
embayments (Agua Hedionda Lagoon and Huntington Harbour) in southern California
(Woodfield 2006). Control is likewise extremely expensive. By 2010, over $12 million
will have been spent in San Francisco Bay to control the Atlantic cordgrass (Spartina
alterniflora) (M. Spellman, pers. comm. 2008). Prevention of species introductions
through vector management is therefore considered the most desirable way to address
the NIS issue.
Ballast Water Management
The vast majority of commercial vessels use ballast exchange as the primary method of
ballast water management. Exchange has been the best compromise of efficacy,
environmental safety, and economic practicality. Most vessels are capable of
4
conducting exchange, and the management practice does not require any special
structural modification to most vessels in operation.
During exchange, the biologically rich water that is loaded while a vessel is in port, or
near the coast, is exchanged with the comparatively species-poor waters of the open
ocean. Coastal organisms adapted to the conditions of bays, estuaries and shallow
coasts are not expected to survive or be able to reproduce in the open ocean due to
differences in biology and oceanography between the two regions (Cohen 1998). Open
ocean organisms are likewise not expected to survive in coastal waters.
Ballast water exchange (BWE) is an interim ballast water management tool, however,
because of its variable efficiency and due to several operational limitations. Scientific
research indicates that ballast water exchange typically eliminates between 70% and
99% of the organisms originally taken into a tank while at or near port (MacIsaac et al.
2002, Wonham et al. 2001, USCG 2001, Zhang and Dickman 1999, Parsons 1998,
Cohen 1998), however the percentage of ballast water exchanged does not necessarily
correlate with a proportional decrease in organism abundance (Choi et al. 2005, Ruiz
and Reid 2007). A proper exchange can take many hours to complete, and in some
circumstances, may not be possible without compromising safety due to adverse sea
conditions or antiquated vessel design. Some vessels are regularly routed on short
voyages, or voyages that remain within 50 nautical miles (nm) of shore. In such cases,
the exchange process may create a delay or require a vessel to deviate from the most
direct route.
Because of the aforementioned limitations on exchange, regulatory agencies and the
commercial shipping industry have looked toward the development of effective ballast
water treatment technologies as a promising management option. For regulators, ballast
water treatment will provide NIS prevention including in situations where exchange may
be unsafe or impossible. Technologies that eliminate organisms more effectively than
exchange will provide a consistently higher level of protection to coastal ecosystems
from NIS. For the shipping industry, the use of effective ballast water treatment systems
5

will allow voyages to proceed along the shortest routes, in all operational scenarios,
thereby saving time and money, and avoiding the safety issues related to BWE.
Despite these incentives, until recently financial investment in the research and
development of ballast water treatment systems was limited and the advancement of
ballast water treatment technologies slow. Many barriers have hindered the
development of technologies including equipment design limitations, the cost of
technology development, and the lack of guidelines for testing and evaluating
performance. However, some shipping industry representatives, technology developers
and investors considered the absence of a specific set of ballast water performance
standards as a primary deterrent to progress. Performance standards would set
benchmark levels for organism discharge that a technology would be required to
achieve for it to be deemed acceptable for use in California. Developers requested
these targets so they could design technologies to meet these standards (MEPC 2003).
Without standards, investors were reluctant to devote financial resources towards
conceptual or prototype systems because they had no indication that their investments
might ultimately meet future regulations. For the same reason, vessel owners were
hesitant to allow installation and testing of prototype systems onboard operational
vessels. It was argued that the adoption of performance standards would address
these fears, and accelerate the advancement of ballast treatment technologies. Thus in
response to the slow progress of ballast water treatment technology development and
the need for effective ballast water treatment options, state, federal and international
regulatory agencies have adopted or are in the process of developing performance
standards for ballast water discharge (See Section IV for more details).
Vessel Fouling Management
Mariners have long been aware of fouling as a nuisance to vessel operations as it
relates to vessel performance and fuel efficiency. Fouling on the hull can create drag,
increasing fuel consumption and potentially causing engine strain. In pipes, fouling can
block inflowing seawater meant to cool machinery. To prevent such problems, common
6

industry fouling management strategies include cleaning of underwater vessel surfaces
and the use of antifouling coatings and systems.
The frequency with which most vessels clean their hull is usually based on the
maintenance rules of their classification society (i.e. organization that establishes and
applies technical standards for ship design, construction and survey). Vessel-specific
programs may include a five-year cycle of annual in-water surveys and special out-of-
water (dry dock) surveys. Most vessel owners commonly take advantage of required dry
dockings to clean vessel hulls of fouling organisms and apply antifouling coatings.
Because fouling continues to accumulate between required dry dockings, vessel owners
also conduct interim in-water cleanings of the vessel hull. Out-of-water cleanings during
dry dock allow for the containment of materials, including fouling organisms that are
removed from the vessel hull. In-water cleanings, however, may allow large quantities of
organisms and paint debris to enter the water column. In-water cleaning, therefore, has
increasingly come under scrutiny due to concerns about water quality and NIS
introductions.
The application of antifouling coatings, either biocide-containing or biocide-free, is
another strategy to combat fouling organisms. Biocidal antifouling coatings are applied
during dry dock and are used to deter the attachment of fouling organisms by leaching
toxic compounds, such as tributyltin (TBT), copper, and zinc. However, these
compounds are also detrimental to non-target organisms in the surrounding
environment, and thus many regions have adopted or are considering restrictions on
their use. TBT is a highly effective antifouling agent that has been restricted by many
nations in line with the 2001 International Maritime Organization (IMO) Convention on
the Control of Antifouling Systems on Ships (IMO 2001), which bans the use of all
organotin compounds in antifouling coatings as of September 17, 2008. Most non-TBT
coatings available utilize copper compounds as biocides, though they are generally less
effective and their longevity is shorter than TBT (Lewis, 2002). In addition, bans and
restrictions on copper-based paints are being considered in a number of places.
Biocide-free silicon-based coatings are available, but are more costly to apply and are
7

currently only practically effective for active, swift vessels (those that cruise over 15
knots) (Lewis, 2002; International Marine Coatings, 2006). As new coatings are
developed and vessels shift to different antifouling coatings with potentially lower
efficacies, there are concerns that the risk posed by fouling as a transport mechanism
for NIS may increase (Nerhing, 2001).
Despite the efforts of the maritime industry to minimize vessel fouling by employing hull
cleaning and antifouling coatings, recent studies indicate that fouling is still an important
mechanism by which nonindigenous organisms can be transported to new regions (see
Takata et al. 2006). Vessels that move at slow speeds, spend long periods in port, or
are repainted infrequently, tend to accumulate more fouling (Coutts, 1999). Though
much of the outer surface of vessel hulls are treated with antifouling paints, certain
locations, particularly those that are not exposed to shear forces, have been found to be
more prone to fouling, including dry docking support strips, waterlines, propellers,
rudders, sea chests, and worn or unpainted areas (Coutts et al., 2003; Minchin and
Gollasch, 2003; Coutts and Taylor, 2004; Ruiz et al., 2005). These “niche” areas have
the potential to harbor diverse assemblages of NIS. Although this vector has a high
level of NIS introduction risk associated with it, managers and policy makers have only
recently been focusing resources toward it (See Section IV for more details).
III. REGULATORY OVERVIEW
International, U.S. federal and state regulations governing the management of ballast
water share several similar components. All allow ballast water exchange as an
acceptable method of ballast water management, and many programs provide some
type of exemption should a vessel or its crew become endangered by the exchange
process. All accept approved alternative ballast water treatments in anticipation of the
development of effective technologies. All but the IMO require the completion and
submission of forms detailing ballast management and discharge practices. While
ballast water management has seen substantial progress over the past decade, until
recently little attention has been directed at managing NIS introductions via vessel
8
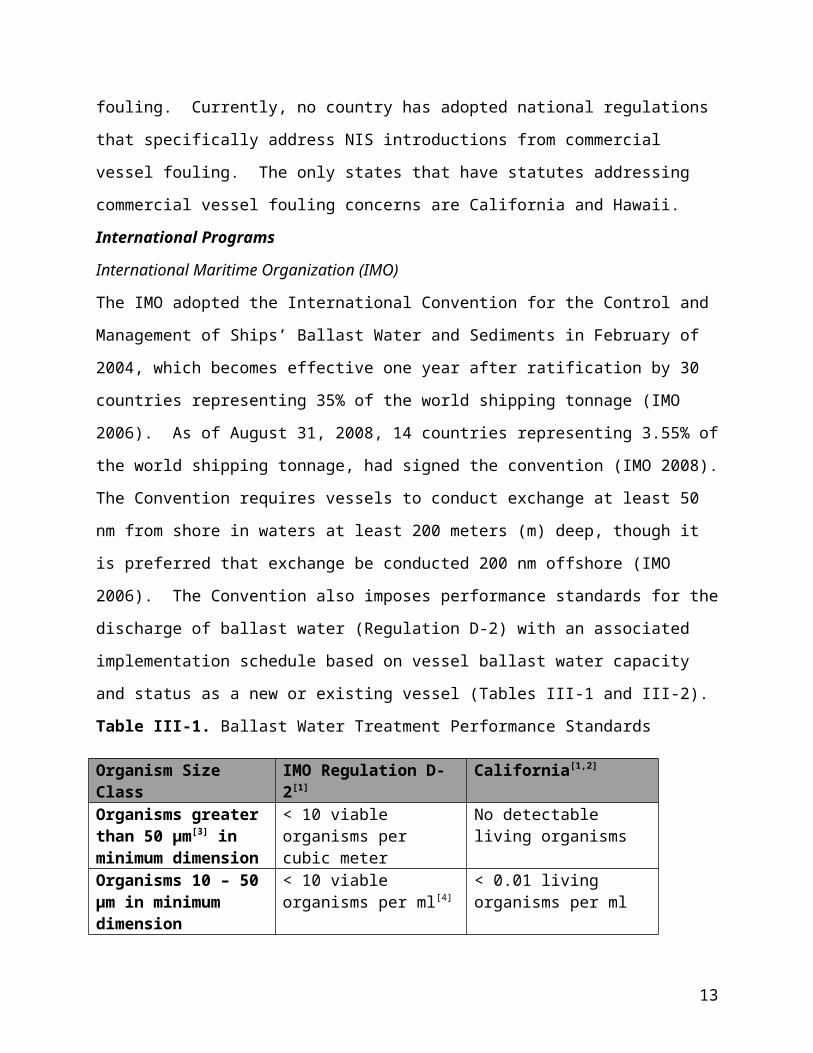
fouling. Currently, no country has adopted national regulations that specifically address
NIS introductions from commercial vessel fouling. The only states that have statutes
addressing commercial vessel fouling concerns are California and Hawaii.
International ProgramsInternational Maritime Organization (IMO)
The IMO adopted the International Convention for the Control and Management of
Ships’ Ballast Water and Sediments in February of 2004, which becomes effective one
year after ratification by 30 countries representing 35% of the world shipping tonnage
(IMO 2006). As of August 31, 2008, 14 countries representing 3.55% of the world
shipping tonnage, had signed the convention (IMO 2008). The Convention requires
vessels to conduct exchange at least 50 nm from shore in waters at least 200 meters
(m) deep, though it is preferred that exchange be conducted 200 nm offshore (IMO
2006). The Convention also imposes performance standards for the discharge of
ballast water (Regulation D-2) with an associated implementation schedule based on
vessel ballast water capacity and status as a new or existing vessel (Tables III-1 and III-
2).
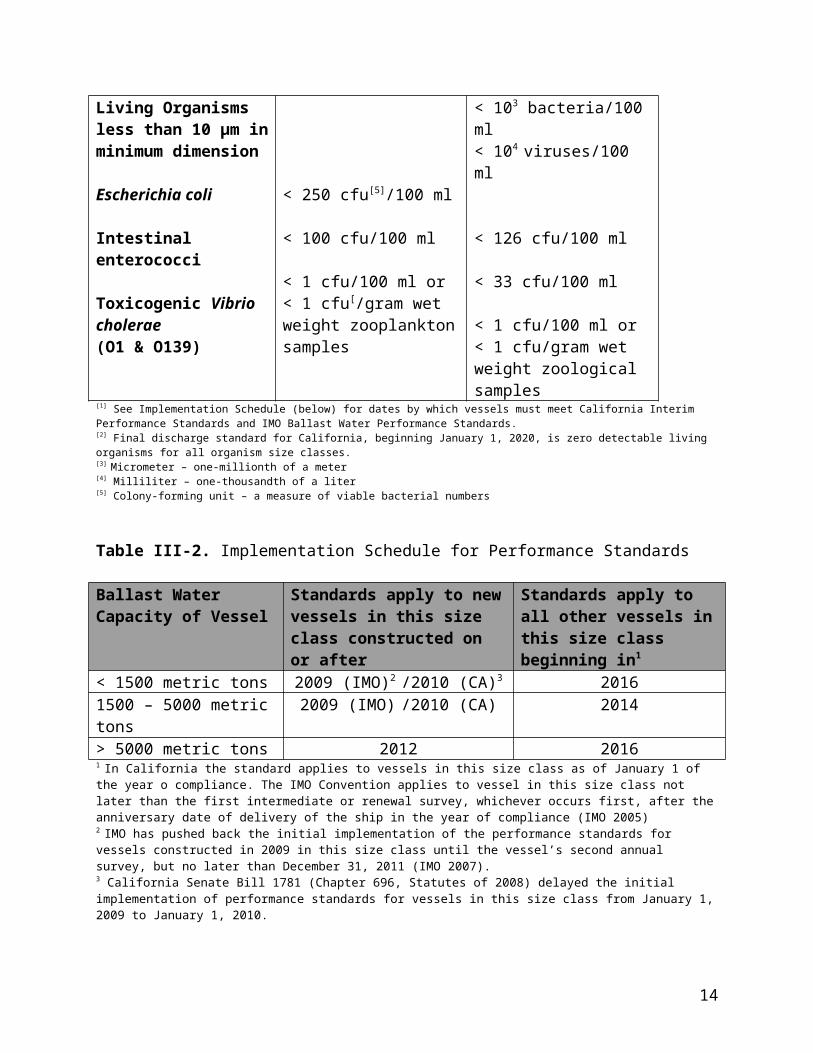
Table III-1. Ballast Water Treatment Performance Standards
Organism Size Class IMO Regulation D-2[1] California[1,2]
Organisms greater than 50 µm[3] in minimum dimension
< 10 viable organisms per cubic meter
No detectable living organisms
Organisms 10 – 50 µm in minimum dimension
< 10 viable organisms per ml[4]
< 0.01 living organisms per ml
Living Organisms less than 10 µm in minimum dimension
Escherichia coli
Intestinal enterococci
Toxicogenic Vibrio cholerae (O1 & O139)
< 250 cfu[5]/100 ml
< 100 cfu/100 ml
< 1 cfu/100 ml or < 1 cfu[/gram wet weight zooplankton samples
< 103 bacteria/100 ml< 104 viruses/100 ml
< 126 cfu/100 ml
< 33 cfu/100 ml
< 1 cfu/100 ml or < 1 cfu/gram wet weight zoological samples
[1] See Implementation Schedule (below) for dates by which vessels must meet California Interim Performance Standards and IMO Ballast Water Performance Standards.[2] Final discharge standard for California, beginning January 1, 2020, is zero detectable living organisms for all organism size classes.
9

[3] Micrometer – one-millionth of a meter[4] Milliliter – one-thousandth of a liter[5] Colony-forming unit – a measure of viable bacterial numbers
Table III-2. Implementation Schedule for Performance Standards
Ballast Water Capacity of Vessel
Standards apply to new vessels in this size class constructed on or after
Standards apply to all other vessels in this size class beginning in1
< 1500 metric tons 2009 (IMO)2 /2010 (CA)3 20161500 – 5000 metric tons 2009 (IMO) /2010 (CA) 2014> 5000 metric tons 2012 20161 In California the standard applies to vessels in this size class as of January 1 of the year o compliance. The IMO Convention applies to vessel in this size class not later than the first intermediate or renewal survey, whichever occurs first, after the anniversary date of delivery of the ship in the year of compliance (IMO 2005)2 IMO has pushed back the initial implementation of the performance standards for vessels constructed in 2009 in this size class until the vessel’s second annual survey, but no later than December 31, 2011 (IMO 2007).3 California Senate Bill 1781 (Chapter 696, Statutes of 2008) delayed the initial implementation of performance standards for vessels in this size class from January 1, 2009 to January 1, 2010.
Until the Convention is ratified, it cannot be enforced upon any ships (IMO 2007).
Because insufficient time remains to ratify the Convention and have it enter into force
before the first date of performance standards implementation in 2009, the IMO General
Assembly adopted Resolution A.1005(25), on November 29, 2007. The Resolution
delays the date by which vessels with keels laid in 2009, and with a ballast water
capacity of less than 5000 MT must comply with Regulation D-2, from 2009 until the
vessel’s second annual survey, but no later than December 31, 2011 (IMO 2007). For
now, the implementation dates for all other vessel size classes remain the same as
originally proposed (Table III-2).
The IMO has also adopted the International Convention on the Control of Harmful
Antifouling Systems on Ships in October 2001 (IMO 2001). The Convention has been
ratified by 33 member states representing 52.6% of world shipping tonnage and entered
into force on September 17, 2008. The Convention prevents the use of harmful
organotins (including TBT) in antifouling paints used on ships and establishes a
mechanism to prevent the potential future use of other harmful substances in antifouling
systems.
Australia and New Zealand
10

Australia requires ballast water exchange outside of the 12 nm Australian limit, in waters
greater than 200 m deep, and ballast water from “high risk” areas is prohibited
(Australian Quarantine and Inspection Service 2005). Australia is currently
implementing a new National System for the Prevention and Management of Marine
Pest Incursions. This National System will work to create domestic ballast water
regulations as well as some form of biofouling regulations or guidelines (Australia
Department of Agriculture, Fisheries, and Forestry 2006).
In New Zealand, vessels must conduct mid-ocean exchange in waters at least 200 nm
offshore and must obtain permission before discharging, even if ballast water has been
exchanged. No discharge is allowed if vessels contain water from the “high risk”
Australian ports of Tazmania and Port Philip Bay (New Zealand Ministry of Fisheries
2005).
North America - Canada and Mexico
Canada adopted mandatory ballast water management regulations in 2006. Vessels
arriving to Canadian ports with ballast originating from outside of Canadian waters must
conduct exchange more than 200 nm from shore in at least 2000 m of water.
Additionally, vessels transiting solely within 200 nm of land must conduct exchange at
least 50 nm from shore at a minimum depth of 500 m. Alternative ballast water
exchange zones may be established within 200 nm for vessels that are unable to
conduct mid-ocean exchange for safety reasons. These requirements do not apply to
vessels transiting exclusively within Canadian waters or the waters of the Great Lakes
(Transport Canada 2006).
Mexico currently has no legislation governing the management of ballast water or
vessel fouling.
Federal RegulationsThe authority to regulate ballast water discharges in the United States has recently
shifted to include the U.S. Environmental Protection Agency (EPA) in addition to the
11

U.S. Coast Guard (USCG). As of December 19, 2008, the EPA must regulate ballast
water, and other discharges incidental to normal vessel operations, under the Clean
Water Act (CWA). This requirement stems from the 2003 lawsuit filed by Northwest
Environmental Advocates et al. against the U.S. EPA in U.S. District Court, Northern
District of California (Nw. Envtl. Advocates v. U.S. EPA, No. C 03-05760 SI, 2006 U.S.
Dist. LEXIS 69476 (N.D. Cal. Sept. 18, 2006)), challenging a regulation originally
promulgated under the CWA. The regulation at issue, 40 C.F.R. Section 122.3(a),
exempted effluent discharges “incidental to the normal operations of a vessel” from
regulation under the National Pollution Discharge Elimination System (NPDES). The
plaintiffs sought to have the regulation declared ultra vires, or beyond the authority of
the EPA under the CWA. On March 31, 2005, the district court concluded that the EPA
had exceeded its authority under the CWA in exempting these discharges from
permitting requirements. The district court vacated Section 122.3(a), effective
September 30, 2008. EPA filed an appeal with the Ninth Circuit U.S. Court of Appeals.
On July 23, 2008, the appellate court affirmed the decision of the district court. On
August 27, 2008, EPA filed a motion with the U.S. District Court, Northern District of
California for an extension of the CWA exemption vacature until December 19, 2008.
The motion had the consent of the plaintiffs and was granted in September, 2008.
In June, 2008, EPA released for public comment the draft NPDES Vessel General
Permit for discharges incidental to the normal operation of vessels. In large part, the
draft NPDES Vessel General Permit defers the management of ballast water discharges
to existing USCG regulations found in 33 Code of Federal Regulations (CFR) Part 151.
The USCG regulations, developed under authority of the Nonindigenous Aquatic
Nuisance Prevention and Control Act of 1990, revised and reauthorized as the National
Invasive Species Act of 1996, require ballast water management (i.e. ballast water
exchange) for vessels entering U.S. waters from outside of the 200 nm Exclusive
Economic Zone (EEZ) of the U.S. Vessels that experience undue delay, however, are
exempted from the ballast water management requirements. The draft NPDES Vessel
General Permit includes provisions for ballast water management of vessels transiting
between Captain of the Port Zones along the Pacific Coast of the U.S. (i.e. Pacific
12
Nearshore Voyages). These vessels are required to conduct ballast water exchange 50
nm from shore in waters at least 200 m deep. There is no management requirement,
however, for vessels traveling “coastally” or wholly within the 200 nm EEZ bound for
U.S. ports on the Gulf or Atlantic coasts.
Vessels may use onboard treatment systems to meet the current ballast water
management requirements if that system is approved by the Commandant of the
USCG, however, as of October, 2008 no approval process has been implemented. The
draft NPDES Vessel General Permit does not include performance standards for the
discharge of ballast water, though standards may be included in the next iteration of the
permit (in 2013) based on the outcome of the anticipated USCG rulemaking on ballast
water treatment standards, and if treatment technologies are determined to be
commercially available and economically achievable to meet those standards.
The draft NPDES Vessel General Permit also limits other discharges incidental to the
normal operation of vessels, including discharges originating from antifouling hull
coatings, underwater ship husbandry, and seawater piping biofouling protection.
Antifouling hull coatings and chemicals used for seawater piping biofouling protection
must be either registered according to the Federal Insecticide, Fungicide, and
Rodenticide Act (FIFRA) or must not contain biocides or toxic materials, including TBT,
banned for use in the U.S. Under the draft permit, underwater ship husbandry must be
conducted in a manner that minimizes the discharge of fouling organisms and
antifouling hull coatings and the cleaning of copper-based antifouling coatings must not
produce a visible plume of paint.
State ProgramsGreat Lakes Region - In 2008, regulations were established requiring all ‘NOBOB’
vessels (vessels declaring No Ballast On Board) to conduct a salt-water flush of their
ballast tanks prior to entering the St. Lawrence Seaway. This regulation closed a
loophole in prior regulations and addresses the residual ballast water and sediments in
otherwise empty ballast tanks.
13

In January 2007, Michigan implemented a general permit program to cover maritime
operations and the discharge of ballast water into state waters. The general permit
requires ballast treatment systems for all ocean-going vessels intending to discharge in
Michigan waters. The state has approved four treatments for use under the general
permit including sodium hypochlorite, chlorine dioxide, ultraviolet light, and de-
oxygenation. Vessel operators may propose alternative ballast treatment options that
may be covered under an individual permit. There is broad support for this program
amongst other states of the Great Lakes region.
Effective July 1, 2008 Minnesota state law requires vessels operating in state water to
have both a ballast water record book and a ballast water management plan approved
by the Minnesota Pollution Control Agency (MPCA). Additionally, the MPCA is in the
process of finalizing a State Disposal System general permit for ballast water
discharges into Lake Superior and associated waterways. Under the permit, vessels
with be required to comply immediately with approved best management practices. No
later than January 1, 2012 for new vessels and January 1, 2016 for existing vessels, all
discharges must comply with the IMO D-2 performance standards.
Hawaii – In October 2007, the Department of Land and Natural Resources adopted new
rules to manage ballast discharge from vessels operating in Hawaiian waters. The
regulations require a vessel specific management plan, advance reporting to the state,
and mid-ocean (greater than 200 nm from any coast) BWE for any ballast originating
from outside state waters.
Washington - Washington implemented ballast water management requirements in
2000. Vessels arriving from outside of the U.S. EEZ are required to conduct exchange
at least 200 nm offshore. Coastally transiting vessels are required to conduct exchange
at least 50 nm offshore, with the exception that exchange is not required if the ballast
water is common to the state and has not been mixed with waters outside of the
Columbia River system (Washington Department of Fish and Wildlife 2003). In 2001,
14

the Washington Department of Fish and Wildlife (WDFW) established interim ballast
water discharge standards to provide a target for technology developers (WAC 220-77-
095). The standard requires the inactivation or removal of 95 percent of zooplankton
and 99 percent of phytoplankton and bacteria in ballast water. The Washington Ballast
Water Work Group is currently in the process of revising Washington’s performance
standards from a percent reduction-based standard to a concentration-based one
(number of organisms per unit volume). Additional revisions are also being made to the
treatment technology approval process. WDFW staff expects the new regulations to be
adopted in early 2009 (A. Pleus, pers. comm. 2008)
Oregon - Oregon began requiring ballast water management in 2002. Vessels arriving
from outside the EEZ are required to conduct exchange at least 200 nm offshore.
Oregon’s legislation also established the first regulations designed to reduce the risk of
intra-coastal transport of NIS. Vessels traveling within 200 nm of shore and entering
Oregon from areas north of 50 degrees N latitude or south of 40 degrees N latitude
must conduct exchange at least 50 nm from shore in at least 200 m of water (Simkanin
and Sytsma 2006). In 2007, Oregon’s Legislature adopted a number of
recommendations put forth by the Oregon Ballast Water Task Force. The Legislature
made funding available to Oregon’s Department of Environmental Quality (ODEQ) to
support ballast water data collection, compliance monitoring and enforcement efforts
and staff support for additional Task Force activities. The ODEQ recently completed a
legislative report (Hooff 2008) that identified several needs and actions, including
additional funding and staff to effectively implement existing program, legislative
authority for ODEQ to board and inspect regulated vessels. and authority to develop
rules defining ballast water treatment technology standards.
15

IV. CALIFORNIA’S MARINE INVASIVE SPECIES PROGRAM LegislationCalifornia’s initial NIS-related legislation, Assembly Bill (AB) 703 (Chapter 849, Statutes
of 1999), addressed the ballast water invasion threat at a time when national regulations
were not mandatory. The Ballast Water Management for Control of Nonindigenous
Species Act established a statewide multi-agency program to prevent and control NIS in
state waters. In addition to the Commission, the California Department of Fish and
Game (CDFG), the State Water Resources Control Board (Water Board) and the Board
of Equalization (BOE) were charged to direct research, monitor vessel arrivals and
species introductions, develop policy and regulations, and to cooperatively consult with
one another to address the NIS problem (Falkner 2003). AB 703 required that vessels
entering California from outside the EEZ manage ballast before discharging into state
waters. Vessels were required to exchange ballast water 200 nm offshore or treat
ballast water with an approved shipboard or shore-based treatment system. There was,
however, no management requirement for vessels transiting between ports wholly
within the EEZ, despite evidence that “intra-coastal” transfer may facilitate the spread of
NIS from one port to the next (Lavoie et al. 1999, Cohen and Carlton 1995). The
Legislature, sensitive to the uncertainties surrounding the development of an effective
ballast water management program for the State, included a sunset date of January 1,
2004 in AB 703.
In 2003 AB 433 (Chapter 491, Statutes of 2003) was passed, reauthorizing and
enhancing the 1999 legislation to include many of the recommendations of the
program’s first biennial report (Falkner 2003). The bill, referred to as the Marine
Invasive Species Act (Act), reauthorized, enhanced, and renamed the State’s ballast
water management program, creating the Marine Invasive Species Program (MISP).
The Act applies to all U.S. and foreign vessels over 300 gross registered tons that arrive
at a California port or place. The Act requires all vessels to have a ballast water
management plan and ballast tank logbook specific to the vessel. A ballast water
reporting form detailing the ballast water management practices must be submitted by
each vessel upon departure from each port call in California.
16
The Act also directed the Commission to adopt regulations for vessels transiting within
the Pacific Coast Region (PCR). The PCR is defined as coastal waters of the Pacific
Coast of North America east of 154 degrees W longitude and north of 25 degrees N
latitude, exclusive of the Gulf of California (Figure IV.1). The coastal regulations, which
were finalized in March 2006, require vessels arriving to CA ports after operating within
the PCR to conduct ballast water exchange 50 nm from shore in waters at least 200 m
deep prior to discharging into California waters (Figure IV.1).
AK
British Columbia (Canada)
WA
OR
CA
Mexico
Southern Limit of thePacific Coast Region
Northwestern Limit of thePacific Coast Region
Figure IV.1. Exclusive Economic Zones of Pacific North America (200 nm), and the Pacific Coast Region (PCR). The PCR extends from approximately Cooks Inlet, AK (154° west longitude) to ¾ down the Baja Peninsula (25° north latitude) and 200 nm offshore.
17
Performance StandardsThe Act further directed the Commission to recommend performance standards for the
discharge of ballast water to the State Legislature in consultation with the Water Board,
the USCG and a technical advisory panel (PRC Section 71204.9). The Commission
submitted the recommended standards and information on the rationale behind its
selection in a report to the State Legislature in January of 2006 (Falkner et al. 2006).
By the fall of that same year, the Legislature passed the Coastal Ecosystems Protection
Act of 2006, directing the Commission to adopt the recommended standards and
implementation schedule through the California rulemaking process by January 1, 2008.
The Commission completed that rulemaking process in October, 2007 (2 CCR § 2291
et seq.) (Table III-1 and III-2).
The law also required the Commission to prepare a report for the Legislature assessing
the efficacy, availability and environmental impacts, including the effect on water quality,
of currently available technologies for ballast water treatment systems. The final report,
approved by the Commission in December 2007, evaluated 28 ballast water treatment
systems for potential compliance with California’s performance standards and water
quality objectives (see Dobroski et al. 2007).
Of the 28 systems reviewed, only 20 had results of biological efficacy testing publicly
available. For those 20, the methods used to evaluate efficacy were variable, and the
results were frequently presented in metrics that were not comparable to California’s
standards. Thus, it was often impossible to compare the available data for a single
system against all of the organism size classes specified by California’s performance
standards. On a system-by-system basis and across all testing platforms and scales
(laboratory, dockside, shipboard), no single technology demonstrated the capability to
meet all of California’s performance standards.
Based on the conclusions drawn in the report, and in an effort to strengthen the Marine
Invasive Species Program’s management of NIS, staff recommended that the California
Legislature: 1) Change the implementation date for new vessels with ballast water
18

capacity less than 5000 metric tons from 2009 to 2010, and require the Commission to
prepare an update of the technology assessment report on or before January 1, 2009;
2) Authorize the Commission to amend the ballast water reporting requirements via
regulations; and 3) Support continued research promoting technology development.
In response to the recommendations in the technology assessment report (Dobroski et
al. 2007), the Legislature passed new legislation in 2008. Senate Bill 1781 amended
PRC Section 71205.3(a)(2) and delayed the initial implementation of the interim
performance standards from January 1, 2009 to January 1, 2010. The bill also requires
that an update of the technology assessment report be provided to the Legislature on or
before January 1, 2009 (in prep).
Additionally, Assembly Bill 169 was proposed to provide the Commission with authority
to modify the existing ballast water reporting form to capture additional information
regarding shipboard treatment technologies. Although this bill had broad bipartisan
support, and was passed by both California houses during the 2008 session, it along
with hundreds of other bills, was vetoed by the Governor due to the late passage of the
budget. The Commission intends to sponsor similar bill language during the 2009
legislative session.
The implementation of California’s performance standards require MISP staff to move
forward on several new projects and rulemaking actions. First and foremost has been
the development of ballast water treatment technology testing guidelines to provide
technology vendors with a standardized approach to evaluating treatment system
performance relative to California’s discharge standards and water quality objectives.
Verification testing according to the guidelines will not required by the Commission, nor
will the Commission be approving ballast water treatment systems for use in California
waters.
Staff developed these protocols to help ensure a uniform, cost-effective, scientifically-
rigorous, independent assessment of system performance and environmental safety.
19

These testing guidelines were developed in consultation with the Water Board, USCG,
the EPA’s Environmental Technology Verification program staff, and an expert panel of
scientists. The guidelines and an associated information sheet were completed and
distributed in October, 2008. Initial response from industry has been positive.
Commission staff is also in the process of developing regulations to inform the selection
of sampling points (i.e. location) and sampling facilities (i.e. equipment) on vessels to
facilitate the collection of ballast water samples to assess compliance with the
performance standards. PRC Section 71206 requires the Commission to “take samples
of ballast water and sediment from at least 25 percent of the arriving vessels…and
make other appropriate inquiries to assess the compliance of any vessel subject to this
division.” The new regulation will clarify the necessity of taking samples during or at the
point of ballast water discharge (per 2 CCR § 2291 et seq., “Performance Standards for
the Discharge of Ballast water for Vessels Operating in California Water”). Additionally,
the regulations will offer guidance on the selection of sampling facilities so as to reduce
or eliminate the possibility of artificially induced organism mortality associated with
passing through the sampling apparatus.
Finally, Commission staff is developing procedures and protocols for use by
Commission Marine Safety Inspectors to verify vessel compliance with the performance
standards. These enforcement protocols will be drafted in association with the same
panel of experts involved in the writing of the technology testing guidelines. The
protocols should be ready for preliminary field testing in mid-2009 in anticipation of the
initial implementation and enforcement of the performance standards on January 1,
2010.
Vessel FoulingThe Marine Invasive Species Act also directed the Commission to analyze and evaluate
the risk of NIS release from commercial vessel vectors other than ballast water
(essentially vessel fouling) in a report to the Legislature, developed in consultation with
a technical advisory group. The report (see Takata et al. 2006) was approved by the
20

Commission and submitted to the Legislature in April 2006. It summarized the analysis,
evaluation, and consultations conducted by the Commission in accordance with the Act,
and offered recommendations to reduce the discharge of NIS from vessel fouling.
In October 2007, the Governor signed AB 740 (Chapter 370, Statutes of 2007) which
incorporated the recommendations in Takata et al. (2006), and further amended the
Marine Invasive Species Act to include provisions requiring the removal of fouling
organisms from vessel hulls, piping, propellers, sea chests and other submerged
portions of vessels on a regular basis. AB 740 also required vessel owner/operators to
provide information to the Commission annually on vessel hull maintenance practices
including drydocking, in-water cleaning of the submerged surfaces of the vessel, and
the application of antifouling paint to the vessel. A draft Hull Husbandry Reporting Form
was developed in consultation with the maritime industry in late-2007 and implemented
January 1, 2008. The rulemaking package to formally adopt the final Hull Husbandry
Reporting Form via regulations is expected to receive final approval in late-2008.
The Commission’s Marine Invasive Species ProgramThe Marine Facilities Division of the California State Lands Commission administers the
Marine Invasive Species Program. To carry out the requirements of the law and to
ensure effective management, the MISP is separated into three key components: 1)
Data Management, 2) Field Operations, and 3) Program Administration (Figure IV.2).
All program components contribute to outreach activities in the form of technical
advisory groups, dispersal of educational materials, and public outreach at state,
national and international events.
21

Figure IV.2. Schematic model showing MISP components and associated functions
MISP data management staff track ballast water management, compliance and
enforcement of more than 900 vessel arrivals every month. This involves the
standardized, step-wise tracking of all vessel arrivals, reviewing ballast water
management reports to identify and clarify inconsistencies, and issuing delinquency
notices. In order to verify that vessels on qualifying voyages submit Ballast Water
Reporting Forms, received forms are matched with arrival data from the Northern and
Southern California Marine Exchanges. Late and missing form notifications are sent to
agents representing vessels that neglect to submit forms. Between July 2006 and June
2008, over 22,000 ballast water reporting forms were received, reviewed, entered into a
database, and reconciled with actual port arrival data. MISP data management staff
also track Hull Husbandry Reporting Form submission and compliance. Submitted
forms are reviewed for inconsistencies before being entered into the MISP database.
22
MISP field operations are based out of offices located in Northern and Southern
California. Commission Marine Safety personnel at these field offices implement an
extensive vessel monitoring program to ensure compliance with the law. Marine Safety
personnel serve as an important, direct conduit of information to vessel crews,
particularly in an industry where vessels frequently change ownership, routes, and crew
composition. All vessels are required to submit to compliance inspections, which
include sample collection of ballast water, examination of ballast water logbooks, engine
books, report forms, and any additional inquiries as needed. The Marine Invasive
Species Act specifies that at least 25% of arriving vessels are to be inspected, with
enforcement administered through the imposition of administrative civil and criminal
penalties.
During vessel visits, Marine Safety personnel verbally explain paperwork, reporting, and
ballast management obligations, and point out where a vessel may be falling short of
compliance. Staff also sample ballast tanks when discharge is intended. The samples
are analyzed for salinity (a measure of the salt concentration in water), which is
currently the best available method to indicate if ballast water has been exchanged.
Salinity levels are expected to indicate whether ballast water originated from coastal or
mid-ocean areas because coastal regions tend to have more freshwater runoff. Coastal
regions often exhibit lower salinities than open ocean water, which maintains an
approximate reading of 35 PPT (parts per thousand). When a violation is found, a
citation is given to the vessel crew and a hard copy is retained in Commission files. A
copy of the violation and enforcement letter is also sent to the vessel owner. The vessel
is then targeted for re-inspection upon its next visit to California waters. The
Commission finds that working with vessel owners in this way creates a positive working
relationship with the industry that results in higher compliance rates.
In addition to verifying compliance with the management requirements of the Act, the
Inspection Program plays a key role in MISP activities by providing vessel access for
research projects, and outreach and education for the maritime industry. Beginning in
23

2008, Commission Marine Safety personnel began assisting the Smithsonian
Environmental Research Center (SERC) on a project designed to compare key
chemical tracers found in ballast water measured from a hand-held device - the Ballast
Exchange Assurance Meter (BEAM) - with SERC’s lab-based fluorometer. Commission
Marine Safety personnel board vessels and collect water samples for this project (see
Research, Ballast Water Exchange Verification for more details). Ballast water from
approximately 40 vessels will be sampled from a variety of vessel types carrying ballast
water from foreign and domestic sources that has undergone legal exchange.
MISP administrative staff works closely with data management and field staff in order to
assess vessel compliance with the requirements of the Act, develop policy
recommendations to the Legislature, and coordinate research to reduce the spread of
NIS from vessel vectors. Administrative staff regularly consults with a wide array of
scientists, state and federal regulators, non-government organizations and the maritime
industry to evaluate current knowledge and guide policy recommendations. The
administrative component of the MISP also coordinates and funds targeted, applied
research that advances the development of strategies for NIS prevention from the
commercial ballast water and vessel fouling vectors. Other functions of the
administrative staff include the development and review of NIS-related environmental
documents.
One of the key components for the success of the MISP continues to be the close
communication, coordination, and outreach that occurs between the Commission, the
maritime industry, and other state agencies. In general, outreach activities are
designed to coordinate information exchange among scientists, legislators, the
regulated industry, non-government organizations and regulating agencies. Data
management staff regularly corresponds with vessel owners to verify compliance with
ballast water reporting requirements. Field operations staff interfaces with the industry
on a regular basis to verify and educate crewmembers on ballast water and vessel
fouling management and reporting requirements. Program administrative staff are
active members in several ballast water-related work groups including: the West Coast
24
Ballast Outreach Project; Oregon’s Ballast Water Management Task Force; the
Washington Ballast Water Work Group, the Aquatic Nuisance Species Task Force; and
the Pacific Ballast Water Working Group. Wherever possible, Staff works with the
scientific community, other West Coast state representatives, Federal agencies, and the
international maritime community to standardize vessel management programs. This
coordination and standardization has improved support and compliance by the maritime
industry, and has encouraged knowledgeable cross-disciplinary input as policies are
crafted.
In addition to the regulatory directives, the Act included mandates to address gaps
identified during the beginning years of the MISP that would improve the Commission’s
ability to prevent NIS introductions from commercial vessel vectors. The MISP has
formed several Technical Advisory Groups (TAGs) that discuss policy and regulatory
matters related to general NIS management and the implementation of legislative
mandates. TAGs include representatives from the maritime industry, ports, state and
federal agencies, environmental organizations, and research institutions, and serve
several critical outreach functions. They serve as a forum through which information
and ideas can be exchanged, and ensure that rulemaking decisions consider the best
available science as well as the concerns of affected stakeholders. TAG members also
relay information to their respective constituencies, keeping them abreast of
Commission actions and activities.
V. DATA ANALYSIS
Trends in Statewide Vessel Traffic
Ballast Water Reporting Requirements
Under the Marine Invasive Species Act, the master, owner, operator, agent, or person in
charge of a vessel is required to submit the Ballast Water Reporting Form upon
departure from each port or place of call in California. A qualifying voyage (QV) for the
purpose of reporting and Fee submittal includes all vessels greater than 300 gross
registered tons operating in California waters. The Commission is required to compile
25

the information obtained from submitted reports to assess shipping patterns and
compliance with the requirements of the Act. Utilizing a state database created under
AB 703, and modified pursuant to AB 433, the Commission can assess: (1) QV traffic
patterns (see Vessel Traffic Patterns, Section V); (2) rates of compliance with
mandatory reporting requirements (see Ballast Water Reporting Compliance, Section
V); (3) patterns of ballast water discharge and management according to vessel class
and geographic area (see Ballast Water Discharge Patterns, Section V); and (4) rates of
compliance with mandatory ballast water management (see Ballast Water Management
Compliance, Section V). This information is assessed for both coastal (within the PCR)
and foreign (arriving from outside of the PCR) vessel traffic to California ports.
The Commission relies on three primary sources of data for assessment of ballast water
management practices. These include: (1) ballast water information reported directly to
the Commission via the Ballast Water Reporting Form by vessels operating in California
waters; (2) transportation statistics collected from the two California Marine Exchanges,
individual ports, and shipping agents; and (3) verification inspections of vessels
operating in California waters conducted statewide by Commission Marine Safety
personnel.
Reporting and ballast water management requirements are assessed at two different
geographic scales: statewide and local port system. Through the original legislation (AB
703) and as modified by regulations, the Commission has identified 19 port zones,
including Humboldt Bay, Sacramento, Stockton, Carquinez, Richmond, San Francisco,
Oakland, Redwood, Moss Landing, Monterey, Morro Bay, Santa Barbara, Carpinteria,
Port Hueneme, El Segundo, Los Angeles-Long Beach (LA-LB), Avalon/Catalina, Camp
Pendleton, and San Diego (Figure V.1).
26

Humboldt Bay
RichmondCarquinez
Stockton
Redwood
Monterey
OaklandSan Francisco
Sacramento
Santa Barbara Port HuenemeEl Segundo
Los Angeles/Long Beach
Avalon/Catalina
San Diego
Moss Landing
Camp Pendleton
Carpinteria
Morro Bay
Figure V.1. California port zones
27
Ballast Water Reporting Compliance
In late 2000, the Commission initiated an electronic procedure to notify ship agents and
owners of missing Ballast Water Reporting Forms. This electronic notification process,
coupled with education and outreach to the shipping industry, has resulted in high
compliance with ballast water reporting requirements. For purposes of data analysis
and reporting, the six-month period from January through June will be indicated as “a”
and the period from July through December will be indicated as “b”. Between 2006b-
2008a, 99% of QVs to California ports or places were compliant with reporting
requirements, and 83% of QVs were both compliant and submitted on time (Figure V.2).
0
1000
2000
3000
4000
5000
6000
7000
2000
a
2000
b
2001
a
2001
b
2002
a
2002
b
2003
a
2003
b
2004
a
2004
b
2005
a
2005
b
2006
a
2006
b
2007
a
2007
b
2008
a
Year
Num
ber o
f For
ms
Rec
eive
d
DelinquentLateOn Time
Figure V.2. Ballast Water Reporting Form Compliance (a = January to June, b = July to December)
Vessel Traffic Patterns
Based upon the information provided by vessels on the ballast water reporting forms,
the Commission assesses patterns of vessel traffic and ballast water management.
28
Vessel traffic to California ports increased steadily through 2006 to a high of 5645 QV
arrivals per six month period in 2006b (Figure V.3). Since that time, arrivals have
leveled off; 5382 QVs arrived to California ports in 2008a.
0
1000
2000
3000
4000
5000
6000
2004a 2004b 2005a 2005b 2006a 2006b 2007a 2007b 2008a
Year
Num
ber o
f QVs
Figure V.3. Number of qualifying voyage (QV) arrivals to California ports
(a = January to June, b = July to December)
On a port by port basis, the pattern of QV arrivals has remained generally consistent
over the past two years (Figure V.4). The LA-LB Port Complex received 50% of all
arrivals to California ports between 2006b and 2008a. During this time, LA-LB has also
led the state in both foreign and coastal arrivals, although foreign arrivals account for
almost two-thirds (64%) of traffic to LA-LB (Figure V.4). The Port of Oakland receives
comparable numbers of coastal arrivals annually as LA-LB, but less than one-tenth as
many foreign arrivals (Figure V.4). Arrivals from foreign ports accounted for 15% of QV
arrivals to the Port of Oakland between 2006b and 2008a. The Port of San Diego saw a
29

20% increase (= 37 QVs) in foreign vessel arrivals between 2006b and 2008a, and now
receives more foreign arrivals per six month period than Oakland.
30

2006b
0
500
1000
1500
2000
Hum
bold
t
Sac
ram
ento
Sto
ckto
n
Car
quin
ez
Ric
hmon
d
San
Fra
ncis
co
Oak
land
Red
woo
d
Hue
nem
e
El S
egun
do
LA-L
B
Ava
lon/
Cat
alin
a
San
Die
go
Num
ber o
f QVs
ForeignCoastal
2007a
0
500
1000
1500
2000
Hum
bold
t
Sac
ram
ento
Sto
ckto
n
Car
quin
ez
Ric
hmon
d
San
Fra
ncis
co
Oak
land
Red
woo
d
Hue
nem
e
El S
egun
do
LA-L
B
Ava
lon/
Cat
alin
a
San
Die
go
ForeignCoastal
2007b
0
500
1000
1500
2000
Hum
bold
t
Sac
ram
ento
Sto
ckto
n
Car
quin
ez
Ric
hmon
d
San
Fra
ncis
co
Oak
land
Red
woo
d
Hue
nem
e
El S
egun
do
LA-L
B
Ava
lon/
Cat
alin
a
San
Die
go
Num
ber o
f QVs
ForeignCoastal
2008a
0
500
1000
1500
2000
Hum
bold
t
Sac
ram
ento
Sto
ckto
n
Car
quin
ez
Ric
hmon
d
San
Fra
ncis
co
Oak
land
Red
woo
d
Hue
nem
e
El S
egun
do
LA-L
B
Ava
lon/
Cat
alin
a
San
Die
go
ForeignCoastal
Figure V.4. Distribution of Qualifying Voyage (QV) Arrivals by Port. Coastal voyages originate from PCR ports, foreign voyages originate from non-PCR ports. Three QV arrivals are not presented for 2007a, two coastal QV arrivals in Monterey and one coastal QV arrival in Morro Bay (there were no other QV arrivals for these ports between 2006b and 2008a).
31

The distribution of vessel types calling on California ports has held steady since the last
biennial report (see Falkner et al. 2007). Statewide, container vessels continue to
dominate vessel calls (43% of arrivals between 2006b and 2008a), followed by tank
vessels (19%), and auto carriers (10%) (Figure V.5). Bulk carriers, passenger vessels
and unmanned barges each account for roughly 7% of vessel traffic to California ports
between 2006b and 2008a.
0%
20%
40%
60%
80%
100%
California
Perc
ent o
f Tot
al Q
Vs
Auto
Bulk
Container
General
Other
Passenger
Tank
UnmannedBarge
Figure V.5. Percent of QV arrivals by Vessel Type (2006b – 2008a)
The Ports of LA-LB and Oakland combined receive 99% of all container vessel traffic to
California ports. LA-LB also receives the majority of passenger (55%) and bulk (53%)
vessel arrivals to California (Figure V.6A). Forty-five percent of all tank vessels, on
average, arrive to LA-LB with the remaining largely split between the Ports of Carquinez
(20%), Richmond (19%) and El Segundo (11%) (Figure V.6B). Auto carriers primarily
arrive to LA-LB (35% on average), San Diego (23%), Hueneme (20%), and Carquinez
(19%).
.
32

A
0
500
1000
1500
2000
2500
3000
Oakland LA-LBArrival Port
Avg
# o
f QVs
Per
Six
Mon
ths
AutoBulkContainerGeneralOtherPassengerTankUnmanned Barge
B
0
100
200
300
400
500
Hum
bold
t
Sac
ram
ento
Sto
ckto
n
Car
quin
ez
Ric
hmon
d
San
Fra
ncis
co
Red
woo
d
Hue
nem
e
El S
egun
do
Ava
lon/
Cat
alin
a
San
Die
go
Arrival Port
Avg
# o
f QVs
Per
Six
Mon
ths
AutoBulkContainerGeneralOtherPassengerTankUnmanned Barge
Figure V.6. Average number of arrivals per six month period by vessel type and port (2006b –2008a) for Oakland and LA-LB (A) and the remaining California ports (B). Note that the scales are not the same.
33

Since July 2006, almost 50% of all arrivals to California originated from within the
Pacific Coast Region (Figure V.7, see Figure IV.1 for map of PCR). Thirty-six percent of
vessel calls to California ports came from other California ports, 5% originated in
Washington State, 3% in coastal (i.e. within the PCR) Mexican ports, 3% in Oregon, 3%
in coastal Canadian ports, and less than 1% from Alaska. The majority of foreign (non-
PCR) arrivals to California came from Asian ports (China, Japan, Korea, and all other
Asian countries (“Other Asia”) account for 23% of all QVs) followed by approximately
6% from foreign (non-PCR) Mexican ports (Figure V.7).
0%
5%
10%
15%
20%
25%
30%
35%
Cal
iforn
ia
Chi
na
Japa
n
Mex
ico
(fore
ign)
Was
hing
ton
Kor
ea
Cen
tral A
mer
ica
Oth
er A
sia
Mex
ico
(coa
stal
)
Ore
gon
Can
ada
(coa
stal
)
Haw
aii
S. A
mer
ica
Oth
er
Last Port of Call
Perc
ent o
f Tot
al Q
Vs
Figure V.7. Last Port of Call for Qualifying Voyages (QVs) to California Ports (2006b – 2008a)
A closer examination of last port of call data reveals patterns for each vessel type
visiting California ports (Figure V.8). Unmanned barges that arrive to California operate
almost exclusively along the U.S. West Coast. Tankers and auto carriers also arrive to
34

California ports predominantly after a visit to another U.S. West Coast port. Bulk carriers
and container vessels frequently arrive to California from Asia ports. As may be
expected, passenger vessels visit California ports after travel in Mexico. These vessel
traffic patterns provide valuable information about potential source locations for NIS
both in ballast water and attached to the hull and other submerged vessel surfaces.
0%
20%
40%
60%
80%
100%
Auto Bulk
Contai
ner
Genera
lOthe
r
Passe
nger
Tank
Unman
ned B
arge
Type of Vessel
Perc
ent o
f QVs
Asia
Canada
Central America
Hawaii
Mexico-foreign
Mexico-PCR
S. America
US AK Coast
US West Coast
Other
Figure V.8. Last Region of Call for Qualifying Voyages (QV) by Vessel Type (2006b –
2008a)
Ballast Water Management and Compliance
Ballast Water Discharge Patterns
The risk for NIS introductions through ballast water is based on many factors, including
(but not limited to) the source, age, and volume of ballast water discharged,
environmental similarities between the source and recipient port waters, and time of
year (i.e. season). Therefore, an examination of geographic and volumetric patterns of
35

ballast water retention and discharge provides valuable background that may be used to
frame relative trends and risk of species introductions in the State.
Vessels that do not discharge any ballast water within the state pose no risk for NIS
introductions through the vector, and retention is currently the most protective
“management” strategy available. Since reporting requirements were implemented in
2000, the percent of vessels discharging ballast water has steadily decreased to a low
of 14% in 2007 and 15% in 2008a (Figure V.9).
0%
20%
40%
60%
80%
100%
2000 2001 2002 2003 2004 2005 2006 2007 2008a
Perc
ent o
f Tot
al Q
Vs
RetainDischarge
Figure V.9. Reported ballast water management (a = January to June)
While the percent of vessels discharging ballast in California water continues to
decrease (Figure V.9), the volume of ballast water discharged over that same time
period appears to be on the rise. More ballast water was discharged into California
waters during the first six months of 2008 (5.23 million metric tons, MMT) than in any
similar time period since the inception of the Marine Invasive Species Program (Figure
V.10).
36

0
1
2
3
4
5
6
2000
a
2000
b
2001
a
2001
b
2002
a
2002
b
2003
a
2003
b
2004
a
2004
b
2005
a
2005
b
2006
a
2006
b
2007
a
2007
b
2008
a
Year
Volu
me
Bal
last
Wat
er D
isch
arge
d (M
MT)
Figure V.10. Total volume ballast water discharge (million metric tons; MMT)(a = January to June, b = July to December)
This increase in the total volume of ballast water discharged in the State has been
driven, in large part, by tank vessels (Figure V.11). Tank vessels carry more ballast
water, on average, than any other ship type. The average ballast water capacity of a
tank vessel operating in California waters is 30,100 metric tons (MT) of ballast water. By
comparison, container vessels have the capacity to carry, on average, only 13,995 MT
of ballast water - less than half the capacity of tank vessels. The total volume of ballast
water discharged by tank vessels per six month period increased 16% between 2006b
(2,075,285 MT) and 2008a (2,404,468 MT). Between 2006b and 2008a, tank vessels
made up only 19% of the total number of vessel arrivals to California ports, but they
were responsible for 43% of the total volume of discharged ballast (Figure V.11).
Unmanned barges were the other vessel type, in addition to tankers, that have added to
the recent increase in the total volume of discharged ballast in the state. The volume of
37

ballast discharged from unmanned barges per six month period rose from 324,798 MT
in 2006b to 399,845 MT in 2008a – a 23% increase (Figure V.11).
Like tank vessels, bulk vessels also contribute disproportionately to the total volume of
ballast discharged in the state. Between 2006b and 2008a, bulk vessels accounted for
only 7% of the total number of arrivals, but discharged 31% of the total volume of ballast
into California waters. Unlike tank vessels, however, the volume of bulk vessel
discharges per six month period decreased almost 16% during the last two years from
1,698,454 MT in 2006b to 1,465,701 MT in 2008a (Figure V.11).
Following the trend seen in the last biennial report (Falkner et al. 2007), the volume of
ballast water discharged from container vessels has continued to decrease – from
726,026 MT in 2006b to 547,213 MT in 2008a. Between 2006b and 2008a container
vessels discharged only 12.5% of the total volume of ballast water even though they
made up 43% of the total number of arrivals.
0
0.5
1
1.5
2
2.5
Auto Bulk
Contai
ner
Genera
lOthe
r
Passe
nger
Tank
BargeVo
lum
e of
Dis
char
ged
Bal
last
Wat
er (M
MT)
2004a2004b2005a2005b2006a2006b2007a2007b2008a
Figure V.11. Volume of ballast water (million metric tons; MMT) discharged per six month period as a function of vessel type. (a = January to June, b = July to December)
38

A close examination of the number of vessels discharging by arrival port highlights the
regional nature of vessel discharge patterns (Table V.1). The majority of vessels
discharging in LA-LB are of foreign origin, while the majority of vessels discharging in
the San Francisco Bay ports of Oakland, Carquinez, Richmond, San Francisco, and
Redwood City are of coastal origin. Furthermore, 100% of vessels discharging in
Humboldt are of coastal origin.
Table V.1. Number of Qualifying Voyages that discharged ballast by port, year, and origin of voyage (2006b-2008a; a = January to June, b = July to December)
Discharge Port2006b 2007a 2007b 2008a
Coastal Foreign Coastal Foreign Coastal Foreign Coastal Foreign
Humboldt 2 0 6 0 5 0 6 0
Sacramento 2 4 6 6 1 3 5 5
Stockton 1 7 6 12 2 9 7 14
Carquinez 99 23 66 13 76 19 104 35
Richmond 90 9 65 7 84 8 82 14
San Francisco 23 6 24 7 26 7 10 2
Oakland 76 10 75 22 69 17 54 14
Redwood 6 4 6 3 4 5 2 7
Hueneme 1 2 0 0 2 0 0 1
El Segundo 20 5 15 7 23 4 28 5
LA-LB 166 268 156 232 175 203 190 206
San Diego 15 20 16 18 26 26 17 21
TOTAL 501 358 441 327 493 301 505 324
While the number of vessels discharging at each port (Table V.1) is an indicator of
potential risk of introduction, the volume of ballast water released at these ports is
perhaps a better gauge of invasion pressure (Table V.2). The Ports of Richmond and
Carquinez received fewer QVs, on average, than Oakland (see Figure V.4), but these
39
ports received, on average, 3 and 5 times more ballast water, respectively, than
Oakland per six month period (Table V.2). The average volume of ballast water
discharged from coastal voyages per six-month period was roughly equal for LA-LB and
Carquinez, even though LA-LB had over twice as many coastal vessels discharging, on
average, than Carquinez. This pattern can be explained by the high volume of tank
vessel traffic to Carquinez.
Overall, 60% of the volume of ballast water discharged in California between 2006b and
2008a came from vessels whose last port of call was within PCR (Table V.2). The
combination of the quantity of arriving coastal vessels and large volumes of ballast
water discharged by such transits (Tables V.1 and V.2) demonstrates the high potential
for intraregional transport of introduced species across several recipient ports. In
examining these statistics, it is important to note that several factors influence invasion
risk in addition to the volume of ballast water released, including the age of the ballast
water discharged (species often survive better when held for a short period of time), the
degree of repeated inoculation (frequency with which ballast is discharged in a given
area), and similarity between donor and recipient regions (biological, chemical, and
physical characteristics at each port) (Carlton 1996, Ruiz and Carlton 2003). The
coastal regulations implemented in early 2006 require vessels to manage their ballast
water when moving between ports in the PCR. The regulations are proving to be an
effective tool to help reduce the risk of new species introductions into ports or places
that receive mostly coastal ballast water such as San Francisco Bay and Humboldt.
40
Table V.2. Discharge volume (metric tons = MT) by port, half year, and source of voyage. (2006b-2008a; a = January to June, b = July to December)
Discharge
port
2006b 2007a 2007b 2008a
Percent
foreign
discharges
Percent
coastal
discharges
Total
volume
discharged
(MT)
Percent
foreign
discharges
Percent
coastal
discharges
Total
volume
discharged
(MT)
Percent
foreign
discharges
Percent
coastal
discharges
Total
volume
discharged
(MT)
Percent
foreign
discharges
Percent
coastal
discharges
Total
volume
discharged
(MT)
Humboldt 0% 100% 1,690 0% 100% 24,821 0% 100% 19,485 0% 100% 15,386
Sacramento 92% 8% 19,600 59% 41% 71,158 91% 9% 18,331 57% 43% 80,116
Stockton 90% 10% 79,575 78% 22% 169,095 61% 39% 121,485 81% 19% 182,911
Carquinez 19% 81% 1,037,646 15% 85% 773,189 22% 78% 900,932 29% 71% 1,387,587
Richmond 20% 80% 905,819 8% 92% 648,848 7% 93% 717,476 12% 88% 884,156
San Francisco 10% 90% 194,360 24% 76% 174,171 19% 81% 292,746 11% 89% 102,467
Oakland 20% 80% 225,062 39% 61% 275,799 41% 59% 267,618 41% 59% 210,501
Redwood 43% 57% 72,433 24% 76% 70,261 55% 45% 81,037 54% 46% 119,193
Hueneme 90% 10% 2,607 0% 0% 0 0% 100% 1,496 100% 0% 65
El Segundo 4% 96% 131,215 16% 84% 134,571 14% 86% 279,597 8% 92% 233,918
LA-LB 67% 33% 2,296,233 57% 43% 2,075,217 59% 41% 1,683,378 65% 35% 1,986,692
San Diego 60% 40% 43,034 51% 49% 29,704 52% 48% 46,509 61% 39% 28,357
TOTAL 5,009,274 4,446,833 4,430,088 5,231,349
41

42

Ballast Water Management Compliance
California PRC Section 71204.3 requires that the master, operator, or person in charge
of a vessel arriving to a California port or place from a port or place outside of the
Pacific Coast Region shall manage ballast water in at least one of the five following
ways:
Exchange ballast water in areas at least 200 nm from any shore and in waters at
least 2000 m deep (mid-ocean waters) before discharging in California waters
Retain all ballast water on board the vessel.
Discharge ballast water at the same location where it was taken on, provided that
the ballast water has not been mixed with water taken on in an area other than
mid-ocean waters.
Use an alternative, environmentally sound, Commission or USCG-approved
method of treatment.
Discharge the ballast water to an approved reception facility (currently there are
no such facilities in California).
The master, operator, or person in charge of a vessel arriving to a California port or
place from another port or place within the Pacific Coast Region (PCR), shall manage
ballast water in at least one of the following ways:
Exchange the vessel’s ballast water in near-coastal waters (more than 50 nm
from land and at least 200 m deep) before entering the waters of the State, if that
ballast water has been taken on in a port or place within the PCR.
Retain all ballast water on board the vessel.
Use an alternative, environmentally sound, Commission or USCG-approved
method of treatment
Discharge the ballast water to an approved reception facility (currently there are
no such facilities in California).
Of the more than 135 MMT of vessel-reported ballast water carried into State waters
between July 2006 and June 2008, 98% or 133 MMT was managed in compliance with
43

California law. The majority of vessels operating in California achieve compliance with
California’s requirements by retaining their ballast water onboard. Between July 1, 2006
and June 30, 2008, over 85% of the QVs arriving to the State, an average of 4768 +
202 (standard deviation; SD) arrivals each six-month period, did not discharge ballast
water (Figure V.9), and were therefore compliant with California law.
Of the nearly 19 MMT of ballast water discharged into California between July 2006 and
June 2008, 84.5% was appropriately managed through legal ballast water exchange
and was compliant with California law (Figure V.12). When examined over smaller
temporal scales, an interesting trend emerges. Although the total volume of ballast
water discharged into California has been increasing since the last half of 2006, the
volume of noncompliant ballast water has been decreasing (Figure V.12). As a
percentage of the total amount of discharged ballast water, the volume of noncompliant
ballast water has decreased forty-five percent over the past two years.
44

0
1
2
3
4
5
2006b 2007a 2007b 2008a
Volu
me
BW
Dis
char
ged
(MM
T)Compliant Noncompliant
Figure V.12. Volume (million metric tons, MMT) of compliant and noncompliant ballast water (BW) discharged by six-month period. This includes only compliance of discharging vessels and does not include data for vessels that comply by retaining ballast water (a = January to June, b = July to December).
Nearly 3 MMT of noncompliant ballast water has been discharged in to California waters
between July 2006 and June 2008. This noncompliant ballast water generally fell into
one of three categories:
Ballast water exchange was attempted, but the location of exchange was not in
mid-ocean or in near-coastal waters as required by PRC Section 71204.3 or by 2
CCR § 2280 et seq.
Ballast water was not exchanged.
Vessel reported exchanging ballast water, but the location of exchange was
unknown or unspecified.
45

While ballast water exchange at legal distances offshore is clearly most protective,
some attempt at ballast water exchange is, in most cases, more beneficial than no
exchange at all. Most vessels in violation of management requirements attempted to
exchange before discharging in California, but did so in a location not acceptable by
California law. This category was relatively stable and accounted for 72% of
noncompliant ballast water by volume in 2006b (146 qualifying voyages), 69% in 2007a
(101 QVs), 69% in 2007b (99 QVs) and 69% in 2008a (108 QVs) (Figure V.13). Of the
noncompliant ballast water exchanged in the wrong location between 2006b and 2008a,
5.1% (0.102 MMT from 60 QVs) was exchanged within five percent of the required
offshore distance (e.g. within 10 nm of the 200 nm boundary for mid-ocean waters or
within 2.5 nm of the 50 nm boundary for near coastal waters). This subgroup serves as
an example of vessels that are attempting to comply with California law but in this case
failed to extend fully to the required distance offshore.
0
0.2
0.4
0.6
0.8
2006b 2007a 2007b 2008a
Volu
me
of N
onco
mpl
iant
BW
(MM
T)
Exchanged in Wrong Location
Did Not Exchange
Exchange Location Unknown
Figure V.13. Volume (million metric tons; MMT) of noncompliant ballast water (BW) discharged by violation type (a = January to June, b = July to December).
46

The largest proportions of noncompliant ballast water can be attributed to two vessel
types: bulk and tank vessels. These two vessel types were responsible for 87.1% of all
noncompliant ballast water discharged into California between July 2006 and June
2008. The relative contribution of both bulk and tank vessels were not consistent over
this time span. During 2006b, bulk and tank vessels accounted for 55.6% and 33.3% of
the total noncompliant ballast water, respectively. However, over the next year and a
half, the proportion attributable to bulk vessels decreased to 28.7% (2008a) while the
tank vessel contribution to total noncompliant ballast water increased to 56.9% (2008a)
(Figure V.14).
0%
20%
40%
60%
80%
100%
2006b 2007a 2007b 2008a
Perc
ent o
f Tot
al N
onco
mpl
iant
B
W D
isch
arge
d
Auto
Bulk
Container
General
Other
Passenger
Tank
Figure V.14. Proportions of noncompliant ballast water (BW) by vessel type(a = January to June, b = July to December)
The data presented in Figure V.14 suggest that illegal ballast water discharges from
tank vessels have been increasing over the past two years; however, this is not the
case. Instead, it is the decrease in illegal ballast water discharges from bulk vessels
that is driving the proportional increase in illegal tank vessel discharges (Figure V.15).
Aside from 2007a, the volume of noncompliant ballast water discharged from tank
47

vessels has been consistent while the volume of illegal ballast water attributed to bulk
vessels has been rapidly decreasing, from 0.56 MMT in 2006b to 0.16 MMT in 2008a.
This 71.4% reduction in noncompliant ballast water discharges attributable to bulk
vessels has occurred when overall bulk vessel discharges have dropped by 12.4%
(from 1.7 MMT (2006b) to 1.5MMT (2008a)) (Figure V.11). This implies that although
bulk vessel operators are retaining more of their ballast water onboard, they are also
reducing the proportion of discharged water that is out of compliance. As a result, bulk
vessels as a whole are likely to pose a reduced risk of introducing NIS via ballast water
than two years ago.
0
0.1
0.2
0.3
0.4
0.5
0.6
2006b 2007a 2007b 2008a
Volu
me
(MM
T) o
f Non
com
plia
nt B
W BulkTank
Figure V.15. Volume (million metric tons; MMT) of noncompliant ballast water discharges attributable to Bulk and Tank vessels. (a = January to June, b = July to December)
Over the past four and a half years, container vessels have accounted for the greatest
proportion of QVs to California, 45% between January 2004 and June 2006 (Falkner et
al. 2007) and 44% between July 2006 and June 2008 (Fig V.5). While the percentage
of qualifying arrivals attributed to container vessels has been steady during this 4.5 year
48

span, the total volume and proportion of noncompliant ballast water discharged from
container vessels has been decreasing, from 31.7% of all noncompliant ballast water
discharges in 2004a (Falkner et al. 2007) to 6.6% in 2008a (Figure V.14). This
decrease in the discharge of illegal ballast water is likely reducing the risk of NIS
introduction via ballast water from container vessels, the most common vessel type
operating in California waters.
In addition to discharge volumes and vessel types, the source of the discharged water
can also relay important information for assessing the risk of NIS introductions
particularly as may relate to chemical and physical similarities between source and
receiving waters. The largest proportion of noncompliant ballast water discharged in
California from July 2006 through June 2008 originated within the United States West
Coast Exclusive Economic Zone (200 nm or closer to California, Oregon or
Washington). This proportion was consistent throughout this two-year span, ranging
from 39.5% to 42.4% of the total volume of noncompliant ballast water per six-month
period (Figures V.16 – V.19). The majority of this noncompliant ballast water from the
US West Coast was discharged by tank and bulk vessels, which together accounted for
88.9% by volume between July 2006 and June 2008.
49

Mexico40.3% (54)
Other0.4% (5)
Unknown0.9% (6) Alaska
3.0% (12)
Asia2.2% (14)
Canada0.0% (2)
Caribbean1.3% (4)
Central America4.0% (11)
Europe0.2% (2)
Hawaii0.1% (2)
Pacific0.3% (4)
Russia3.6% (10)
United States West Coast
42.4% (84)
South America1.2% (4)
Figure V.16. Source of noncompliant ballast water (July-December 2006). Numerals in parentheses denote number of vessels.
Mexico33.5% (44)
Pacific0.7% (7)
Russia11.9% (12)
South America0.5% (1)
United States West Coast
39.6% (56)Other
0.6% (4)Unknown1.4% (7) Alaska
5.1% (10)
Canada0.7% (2)
Asia2.2% (11)
Caribbean0.2% (2)
Central America3.1% (13)
Hawaii0.5% (5)
Figure V.17. Source of noncompliant ballast water (January-June 2007). Numerals in parentheses denote number of vessels.
50

Unknown3.4% (12)
Other1.9% (3)
Alaska2.0% (6)
Asia8.8% (9)
Canada0.1% (1)
Caribbean2.1% (2)
Central America4.5% (11)
Pacific0.1% (2)
Russia0.5% (4)
South America3.6% (5)
United States West Coast
39.8% (70)
Mexico33.2% (55)
Figure V.18. Source of noncompliant ballast water (July-December 2007). Numerals in parentheses denote number of vessels.
United States West Coast
41.1% (60)
Unknown6.0% (10)
Other0.5% (4)
Alaska5.0% (20)
Asia12.8% (27)
Russia3.1% (11)
Pacific3.5% (4)
Mexico23.3% (29)
Hawaii0.6% (4)
Central America4.0% (4)
Figure V.19. Source of noncompliant ballast water (January-June 2008). Numerals in parentheses denote number of vessels
51

The second largest proportion of noncompliant ballast water discharged in California
originated in Mexican waters. However, the relative contribution of this noncompliant
ballast water has steadily decreased over the past two years from 40.3% of the total in
2006b (406,419 MT, Figure V.16) to 23.3% in 2008a (128,500 MT, Figure V.19). This
overall decrease has been driven by the decrease in the volume of noncompliant bulk
vessel discharge, down from 369,532 MT (90.9% of all noncompliant discharges
originating in Mexican waters) in 2006b (38 vessels) to 12,309 MT (9.6%) in 2008a (3
vessels). During this time however, the volume of noncompliant ballast water from
Mexican waters discharged by tankers has increased from 20,447 MT (5.0% of all
noncompliant discharges originating in Mexican waters) in 2006b (4 vessels) to 96,742
MT (75.3%) in 2008a (12 vessels).
The contribution of noncompliant ballast water originating in Asia to the total volume of
illegal ballast water has been increasing over the past two years, from 2.7% in 2006b
(Figure V.16) to 12.8% in 2008a (Figure V.19). This increase has been driven almost
entirely by bulk vessel discharges, which accounted for 2,624 MT (12.2% of all
noncompliant discharges originating in Asian waters) in 2006b (2 vessels) but increased
to 53,491 MT (75.5%) in 2008a (12 vessels).
Prior to the implementation of California’s coastal regulations requiring ballast water
management of vessels transiting within the PCR (2 CCR § 2280 et seq., implemented
March 22, 2006), vessels arriving from the west coast of Canada were required to
exchange their ballast water at a distance greater than 200 nm from shore. During this
time, noncompliant ballast water discharged from vessels arriving from Canada
accounted for 2.6% (11 vessels) of the total volume of noncompliant ballast water in
2004 and 4.2 % (14 vessels) in 2005 (Falkner et al. 2007). However, during the first six
months of 2006 (i.e. when coastal regulation was implemented), noncompliant ballast
water arriving from Canada accounted for only 0.7% (1 vessel) of the total volume of
noncompliant discharges. From July 2006 through June 2008, noncompliant ballast
water originating in Canada continued to contribute less than 1% of the total volume of
noncompliant discharges into California. Over this period, vessels arriving from Canada
52

have accounted for less than 0.1% (2 vessels) in 2006b, 0.7% (2 vessels) in 2007a,
0.1% (1 vessel) in 2007b, and did not discharge any noncompliant ballast water into
California during 2008a. This decrease in noncompliant discharge from vessels arriving
from Canada may be attributable to the fact that vessels now only have to exchange
their ballast water 50 nm from shore, rather than 200 nm, in order to be compliant with
California law.
The ability to determine the origin of noncompliant ballast water and identify the types of
vessels that frequently discharge this illegal water is important in assessing the risk of
NIS introduction into California. It is important to remember that the overall volume of
noncompliant ballast water being discharged into California waters since July of 2006
has decreased 45% from 1,009,232 MT (2006b) to 552,062 MT (2008a). During this
two-year span only 2% of the over 135 MMT of ballast water carried into California has
been discharged without properly complying with the State’s management
requirements. Furthermore, the vast majority of the noncompliant ballast water
discharged in State waters underwent some type of exchange, likely reducing the risk of
NIS introductions.
Although the volume of noncompliant ballast water being discharged into California has
decreased dramatically over the past two years, the number of vessel arrivals in
violation of ballast water management requirements has remained small and has
experienced a more modest decrease over this time, from 198 vessels (3.51% of all
QVs) in 2006b to 149 vessels (2.77% of all QVs) in 2008a. Superficially, the large
decrease (45%) in the volume of illegal ballast water discharged does not parallel the
smaller decrease (25%) in the number of arriving vessels out of compliance with ballast
water management requirements. However, this can be explained, at least partially, by
the fact that bulk vessel arrivals in violation of ballast water management requirements
have decreased by 53.6% from 2006b (69 vessels) to 2008a (32 vessels). This drastic
decrease in noncompliant bulk vessels, which have high ballast water volume
capacities, has contributed to the overall decrease in the volume of improperly managed
ballast water being discharged into California.
53

Compliance Through Field Inspections
Under PRC Section 71206, the Commission assesses compliance of any vessel subject
to the Act through a vessel inspection program. The Commission has two field offices,
one in Southern California and the other in Northern California. Marine Safety personnel
boarded and inspected 17% (3792) of qualifying voyages between July 1, 2006 and
June 30, 2008.
During the inspection process, Marine Safety personnel interview vessel crew and
review paperwork, including but not limited to ballast water reporting forms, ballast
water logbooks and engine logbooks. Staff also examine the latitude and longitude of
ballast water exchange locations and take a salinity sample at the top, middle and
bottom of a subset of tanks intended for discharge in California. Finally, Staff provide
educational materials relevant to California’s Program.
The majority of vessels inspected are found to comply with the Act. Most noted
violations are associated with administrative components of the law (e.g. incomplete
ballast water management plan, inaccurate ballast report forms, incomplete ballast tank
logs) versus operational violations (e.g. discharging unexchanged ballast water) (Table
V.3). All inspected vessels found in violation of California law are cited. A copy of the
citation is given to the vessel crew and a copy is retained by the Commission. In
addition, a copy of the violation and an enforcement letter is sent to the vessel owner.
The vessel is then targeted for re-inspection upon its next visit to California waters. Civil
or criminal penalties may be assessed on non-compliant vessels.
54
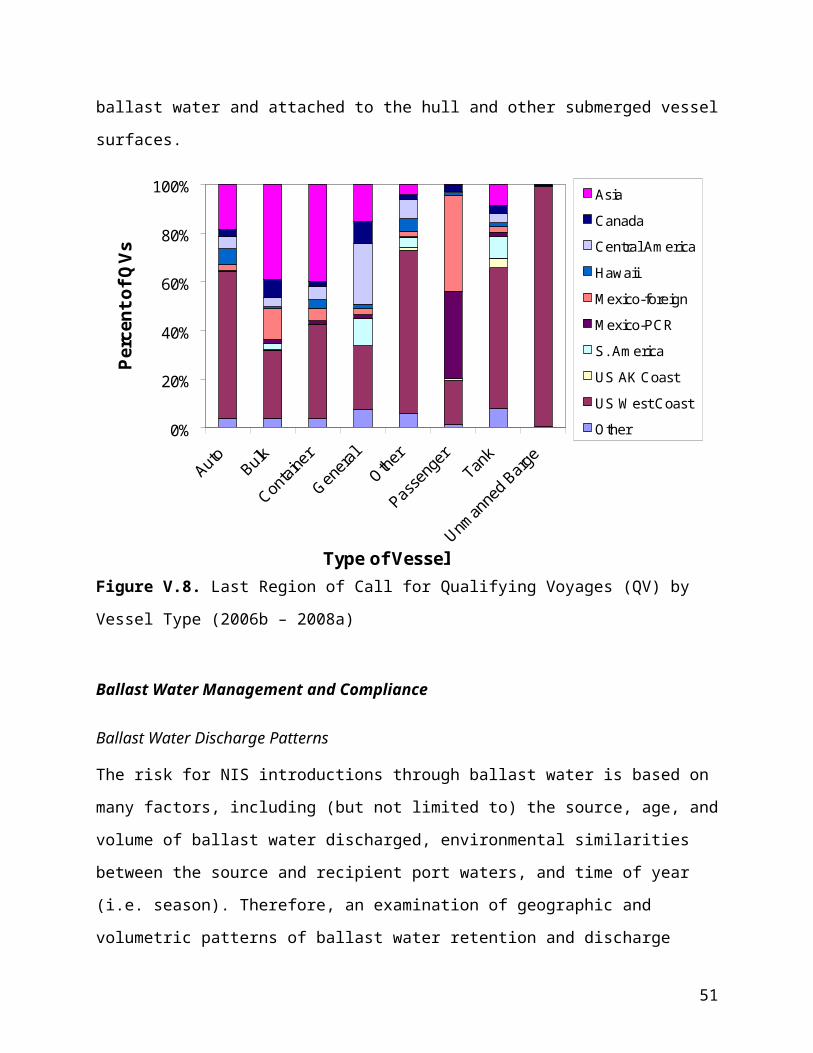
Table V.3. Vessel inspections and violation information
2006b 2007a 2007b 2008a
No. Qualifying Voyages 5645 5463 5541 5382
No. Inspections Conducted 818 897 969 1108
Total No. Violations Cited 148 114 82 66
No. Administrative 123 86 59 53
No. Operational 25 28 23 13
Trends in Vessel Fouling-Related Practices and PatternsUnlike the ballast water vector where over 85% of the qualifying voyages into California
do not discharge and therefore pose ‘zero’ risk, through the fouling vector all vessels
pose some level of risk because all vessels have submerged hard surfaces open to
fouling accumulation. In an effort to evaluate the risk of NIS introduction through the
vessel fouling vector, the Commission produced and presented a report assessing
“Commercial Vessel Fouling in California” (see Takata et al. 2006) to the State
Legislature in April of 2006. This report indicated that there was a lack of baseline
information regarding the fouling vector and associated risks, especially across the
types of vessels regularly operating in California waters. In response to the
recommendations made in that report, the State Legislature passed Assembly Bill 740
(Chapter 370, Statutes of 2007) in October 2007 which amended PRC Section 71205,
among others, and requires the master, owner, operator, agent, or person in charge of a
vessel arriving to a California port or place to submit, on an annual basis starting
January 2008, fouling-related information via a reporting form to be developed by the
Commission.
The Hull Husbandry Reporting Form (HHRF) was developed in consultation with a
technical advisory group consisting of representatives from the shipping industry
(including dry dock, in-water cleaning and antifouling coating representatives), scientific
community and local, state, federal, and international agencies, and was distributed to
55
the commercial fleet operating in California via shipping agents in January of 2008. The
HHRF is divided into two sections: one dealing with husbandry practices relating to
submerged vessel surfaces, and the other relates to voyage characteristics which are
likely to influence fouling accumulation and complexity.
PRC Section 71205(e) requires annual submission of the HHRF. Currently, 47% of the
1472 individual vessels that have called to a California port or place as of August 20,
2008 have submitted the HHRF as required. While a compliance rate of nearly 50% is
not as high as expected, this is the first year of a new submission requirement.
Commission Staff will be contacting vessel operators and reminding them of the
reporting requirements and their delinquency before the year is complete. The
information collected and entered to date into the State’s database does not yet
represent a complete dataset, therefore only a preliminary look at the fouling-related
practices of the commercial fleet operating in California will be presented in this report.
As such, all fouling-related data will be presented as percentages rather than raw
values.
The majority of the vessels for which fouling-related data has been collected and
evaluated include container vessels (36% of the 400 total forms evaluated), tank
vessels (25%), auto carriers (19%), and bulk vessels (9%, Figure V.20).
56

Bulk8.9%
Tank24.5%
Passenger4.1%
Other1.0%
General2.6%
Auto19.4%
Unmanned Barge3.6%
Container36.0%
Figure V.20. Proportion of vessel types evaluated for fouling-related trends. 400 total vessels evaluated.
Husbandry Practices of the Commercial Fleet in California
One of the most common ways of reducing the amount of fouling organisms from the
submerged surfaces of a vessel is to physically remove them. This usually occurs
during a vessel’s out of water dry dock, which most classification societies require at
least every five years. Thus far, the fleet operating in California has followed this
pattern, as over 86% have been delivered as new or dry docked within the past three
years and 99% within the past five years (Figure V.21). Newly built vessels (which
represent 27.5% of the total number of vessels evaluated) and recently dry docked
vessels, because of insufficient time for heavy colonization and succession, generally
have underwater surfaces with low levels of fouling biota and therefore may pose a
lower risk for NIS introduction.
57

38.8%
30.4%
17.1%
7.1%5.6%
0.5% 0.5%0
10
20
30
40
<11 -
<2
2 - <
33 -
<44 -
<55 -
<6 >6
Years Since Delivery or Last Out of Water Dry Dock
Per
cent
of
Tota
l Ves
sels
Figure V.21. The percentage of total vessels either delivered as new or cleaned during dry dock within each of the past six years.
While nearly all of the vessels evaluated have been newly delivered or dry docked
within the past five years, evaluating the average (+ Standard Deviation. SD) time since
each type of vessel has been out of water (either during ship building or dry docking)
will allow for an assessment of risk according to vessel type. Three vessel types
(general cargo carriers, unmanned barges, and auto carriers) averaged less than 1.5
years since their underwater surfaces were last completely clean of fouling organisms
and none of the vessel types evaluated averaged more than 2.3 years since the last out
of water cleaning (Figure V.22).
58

0
0.5
1
1.5
2
2.5
3
3.5
Auto Bulk Container General Other Passenger Tank UnmannedBarge
Yea
rs S
ince
Del
iver
y or
Las
t O
ut o
f Wat
er D
ry D
ock
Figure V.22. Average (+ standard deviation) number of years since vessels (grouped by type) have been delivered as new or cleaned during dry dock. Dotted line represents overall average.
Physical removal of fouling organisms from submerged vessel surfaces can also take
place while the vessel is in the water. In-water cleaning is an option many vessel
owners and operators utilize to remove fouling organisms during the time between dry
dock cleanings (i.e. inter-dry dock period) if fouling levels become elevated. In-water
cleaning can include cleaning of many underwater areas on a vessel or it can simply
include the cleaning of the propeller (i.e. propeller polishing), which is typically done as
a first step when an increase in fuel consumption is detected. Overall, 33% of vessels
have conducted some sort of in-water cleaning since delivery or dry dock and of these,
two-thirds have performed propeller polishing only. The vessels that have had multiple
submerged areas cleaned in-water (white bars depicted in Figure V.23) include
passenger, tank, container, bulk and other vessels - the five vessel types with the
longest average amount of time since delivery or last dry dock (Figure V.22). Therefore,
all eight vessel types appear to be actively involved in keeping fouling biota at relatively
low levels through physical removal, either during out of water dry dock or through in-
water cleaning in the interim period between dry docking.
59
0%
20%
40%
60%
80%
100%
Auto Bulk Container General Other Passenger Tank UnmannedBarge
Per
cent
age
of V
esse
ls W
ithin
Eac
h V
esse
l Typ
e
No IW Cleaning Propeller Only IW Cleaning
Figure V.23. Percentage of vessel types conducting in-water (IW) cleaning and propeller polishing.
The majority of the vessels undergoing in-water cleaning are doing so within the United
States (46.7% of total; Figure V.24), a trend not seen for out of water dry docking (7.8%
conducted within the United States). Of those vessels undergoing in-water cleaning
within the United States, over 85% have been cleaned in California, nearly all within the
Los Angeles and Long Beach harbors.
60

USA46.7%
Asia31.1%
Other22.2%
Figure V.24. Proportions of vessels undergoing in-water cleaning by region.
In-water cleaning is typically conducted by divers or a remotely operated vehicle (ROV)
and includes physical scrubbing or brushing of the vessel’s submerged surfaces with a
variety of bristle types designed for specific surfaces or coating types. Many different
submerged areas are susceptible to fouling and may be cleaned during this in-water
process. The most common areas cleaned are the sides and bottom of the hull, the
propeller, sea chests, and the rudder (Figure V.25).
61

0%
20%
40%
60%
80%
100%
HullSides
HullBottom
Propeller SeaChests
SCGrating
BilgeKeels
Rudder DDSS Thruster
Submerged Surfaces Cleaned
Per
cent
of I
W C
lean
ed V
esse
ls
Cleaned Not Cleaned
Figure V.25. Proportion of in-water (IW) cleaned vessels indicating cleaning of submerged vessel areas. SC represents Sea Chest. DDSS represents dry dock support strips, areas on the hull where the vessel rests during a dry docking event and therefore are not coated with antifouling treatments.
Aside from physical removal of fouling organisms from vessels, the shipping industry
also utilizes preventative measures to keep levels of fouling to a minimum between
required dry docking. One of these preventative measures is the use of antifouling
coatings. Except in the rare case of dry docking for emergency repair, antifouling
coatings are typically applied during each dry dock or during the shipbuilding process.
Therefore, the ages of these antifouling coatings applied to the commercial fleet in
California mirror the amount of time since these vessels were last out of water. 84.1% of
vessels were coated with antifouling treatments within the past three years, and 98.7%
within the past five years.
Many submerged areas other than the hull are susceptible to fouling, including sea
chests, rudders and thrusters, among others. These ‘niche’ areas are frequently
62

located out of the direct effects of high flow as the vessels are traveling and may
provide a special niche for organisms to escape from external pressures. To combat
the accumulation of fouling organisms on submerged surfaces, antifouling coatings are
typically applied to the hull and many of these niche areas. The following locations
have been coated with antifouling treatments on over 75% of the vessels reporting: hull
sides (96%), hull bottom (97%), sea chests (86%), sea chest gratings (83%), rudder
(78%), and the bilge keels (75%) (Figure V.26).
0%
20%
40%
60%
80%
100%
Hull si
des
Hull B
ottom
Sea C
hests
SC Grat
ing
Propell
er
Propell
erSha
ft
DDSS
Thruste
rs
Rudde
r
Bilge K
eels
Location of Antifoulant Application
Per
cent
of V
esse
ls A
pply
ing
AF
Figure V.26. Percentage of vessels applying antifouling (AF) coatings to submerged vessel surfaces.
Antifouling coatings generally fall into one of two categories - those containing biocides
and those that are biocide-free. Biocide-based coatings usually contain toxic metals
and are most frequently copper-based (over 90% of all biocide-based coatings).
Biocide-free coatings generally contain silicon and rely on a fouling-release mechanism.
Organisms are not expected to adhere tightly to these surfaces and therefore ‘release’
or fall off as the vessel is in transit. These fouling-release coatings are designed to be
63
used with vessels that travel at speeds of 15 knots and above. By far, the most
commonly used antifouling coatings are biocide-based, as 85.3% of vessels have used
at least one biocide-containing coating (Figure V.27). In comparison, biocide-free
coatings have been used on only 10.7% of vessels. According to the data collected
through the HHRF, only three vessel types have applied biocide-free coatings: container
(22% of all container vessels used this type of coating), passenger (28%), and tank
vessels (8%). Some vessels (5.6%) have applied a combination of both biocide and
biocide-free coatings, generally covering the sides of the hull (where high flow velocities
are more likely) with biocide-free treatments and using biocide-containing coatings
along the bottom of the hull and other niche areas (where flow velocities are likely to be
reduced) (Figure V.27).
9.4%5.6%
10.7%
85.3%
0%
10%
20%
30%
40%
50%
60%
70%
80%
90%
Biocide-Based Biocide-Free Combination Unknown
Treatment Type
Per
cent
of V
esse
ls
Figure V.27. Proportion of vessels applying antifouling treatments. Combination refers to application of both biocide-based and biocide-free coatings to different areas on the same vessel.
64

Fouling-Related Voyage Characteristics of the Commercial Fleet in California
Certain voyage characteristics and patterns are believed to influence the extent and
complexity of vessel fouling. One of these characteristics is the amount of time that a
vessel spends in a given port, as vessels that remain in port for extended periods of
time may have more of an opportunity to accumulate fouling organisms. As a whole,
vessels averaged 1.7 + 1.6 (SD) days in port within the four months prior to submission
of the HHRF (Figure V.28). However, when evaluated according to vessel type, the
overall average is misleading. Three vessel classes average less than a day in port:
auto carriers (0.87 + 0.71 days), container vessels (0.87 + 0.38 days), and passenger
vessels (0.46 + 0.09 days). All other vessel types average over two days in port, and
three vessel types have average port residency times greater than 3.3 days: unmanned
barges (3.37 + 1.16 days), bulk vessels (3.93 + 2.08 days), and other vessels (3.50 +
2.12 days).
0
1
2
3
4
5
6
7
Auto Bulk Container General Other Passenger Tank UnmannedBarge
Ave
rage
Por
t Res
iden
cy T
imes
(Day
s)
Figure V.28. Average (+ standard deviation) port residency times of each vessel class. Data was reported for four month period prior to submittal of the Hull Husbandry Reporting Form. Dotted line represents overall average.
65

Although auto carriers, containerships, and passenger vessels average less than a day
in port, and all eight vessel types each average less than 4 days in port, there may be
infrequent occurrences when vessels remain in port for extended periods of time.
30.6% of all vessels have reported at least one instance of remaining in a single port for
more than 10 days since their last out of water or in-water cleaning. With the exception
of three vessel types (auto carriers, passenger vessels, and container vessels), more
than 50% of the vessels within each vessel class have remained in at least one port for
longer than 10 days (Figure V.29).
0
20
40
60
80
100
Auto Bulk Container General Other Passenger Tank UnmannedBarge
Per
cent
of V
esse
ls
0 - <5 days 5 - <10 days 10+days
Figure V.29. Proportions of each vessel type reporting port stays of a given duration.
The speed at which vessels travel is another characteristic that is believed to influence
fouling accumulation. Slower vessels are thought to be more susceptible to
accumulating fouling organisms because the force and stress placed on these
organisms when traveling at elevated speeds is reduced. Overall, the average (+ SD)
66

traveling speed of the commercial fleet operating in California is 17.1 + 4.0 knots (Figure
V.30). However, only three vessel types travel at speeds greater than 15 knots, on
average: container vessels (21.0 + 1.7 knots), auto carriers (17.4 + 2.4) and passenger
vessels (17.3 + 3.2 knots). The slowest traveling vessel type operating in California are
the unmanned barges, with an average traveling speed of 8.1 + 2.0 knots. Recall that
22% of all container vessels, 28% of all passenger vessels, and 8% of all tank vessels
have applied biocide-free antifouling coatings, which are designed for vessels traveling
at 15 knots and above. This is appropriate for container and passenger vessels, as
they average over 17 knots but may not be appropriate for tank vessels, which average
14.2 + 0.9 knots.
0
5
10
15
20
25
Auto Bulk Container General Other Passenger Tank UnmannedBarge
Ave
rage
Tra
velin
g S
peed
(Kno
ts)
Figure V.30. Average (+ standard deviation) traveling speed (knots) for each of the vessel types operating in California. Dotted line represents the average speed of the California fleet as a whole.
67

The geographic locations where vessels travel may also influence fouling accumulation.
The salinity extremes experienced when traveling from freshwater ports to the open
ocean and back are thought to impact the viability of fouling organisms and reduce the
risk of NIS introductions. Overall, 67.4% of all vessels operating in California waters
have visited a freshwater port (or the freshwater Panama Canal) since their last
cleaning (Figure V.31). When evaluated by vessel type, at least half of the vessels
within each vessel class have reported visiting a freshwater port during this time.
88.2%
57.1%
90.0%
50.0%
81.3%
60.8%
85.7%
63.9%
0%
20%
40%
60%
80%
100%
Auto Bulk Container General Other Passenger Tank UnmannedBarge
Per
cent
of V
esse
ls V
isiti
ng F
W P
orts
Figure V.31. Proportion of vessels within each vessel class that have called to a freshwater (FW) port (including the Panama Canal) since delivery or their last cleaning. Dotted line represents the overall percentage (67.4%) of vessels operating in California that have visited a FW port.
The hull husbandry practices employed by the fleet of commercial vessels operating in
California suggests that vessels are complying with California law and are attempting to
limit the amount of fouling organisms that can accumulate. The data presented suggest
68

that the fleet is relatively young, as over one quarter of the vessels evaluated thus far
have been newly built and delivered within the past five years and therefore have
recently had underwater surfaces cleared of fouling organisms. The remainder of the
vessels, those older than five years (72.5% of all vessels evaluated), appear to be
physically removing fouling organisms regularly. Overall, over 85% of all vessels have
been out of water (either newly built or dry docked) within the past three years (99%
within the past five years). The physical removal of organisms while the vessels remain
in water does not appear to be a major tool used fleet-wide as less than 10% of all
vessels conduct in-water cleaning of the hull and other submerged surfaces. However,
the five vessel types that conduct the majority of the in-water cleaning (bulk, container,
other, passenger, and tank vessels) have had the longest amount of time elapse since
delivery or out-of-water cleaning (i.e. there is a positive relationship between time since
delivery/dry dock and the occurrence of in-water cleaning). The application of
antifouling treatments as a preventative measure is being conducted on a regular basis,
typically during either the shipbuilding process or the last out-of-water dry dock.
Because of this, the age of these coatings mirrors the amount of time since the vessel
was last out of water, with the application of 84.1% of all coatings occurring within the
past three years.
Unlike the ballast water vector, all vessels pose some level of risk through the fouling
vector. However, because fouling organisms are external, they are exposed to many
more varying environmental conditions than sheltered ballast water organisms. These
environmental conditions and voyage patterns are likely to influence the amount,
complexity, and viability of fouling biota on the submerged surfaces of the commercial
fleet. The voyage characteristics evaluated in this section suggest a gradient of risk
associated with the different vessel types, with auto, container, and passenger vessels
posing the lowest amount of risk and barges, bulk, and tank vessels posing the greatest
amount of risk.
The lower risk vessel classes (auto, container, and passenger vessels) all share short
average port residency times (less than 1 day), elevated traveling speeds (greater than
69

17 knots), and freshwater port calls (greater than 55% of the vessels within each class).
These vessels also tended to avoid extended port durations, as over 70% of the vessels
within each of these groups have not remained in a single port for more than 4 days. All
of these characteristics are believed to limit the amount of viable fouling organisms that
can accumulate on vessels and therefore are likely to limit the amount of risk associated
with these vessels.
The higher risk vessel types (unmanned barge, bulk, and tank vessels) all share voyage
characteristics which are believed to increase the risk of NIS introduction. These vessel
types have longer average port residency times (greater than three days) and generally
travel at slower speeds (14.2 knots and below), especially unmanned barges (8.1
knots). These vessel types also tend to experience extended port stays as over 50% of
the vessels in each of these classes report at least one stay of ten days or more since
the vessel had been delivered or dry docked. Not all of the voyage characteristics
associated with these vessel classes indicate higher risk; at least 60% of the vessels
within each of these classes have visited a freshwater port (or the Panama Canal) since
delivery or last dry dock.
The information presented in this section along with the rest of the data that will be
collected via the HHRF over the next few years will provide the Commission with
valuable insight into the fouling-related practices of the fleet as a whole. These data will
be used in conjunction with the information learned through fouling-related research
currently funded through the MISP (see Section VII) to get a better idea of how the
husbandry practices and voyage characteristics described in this section affect the
quantity and quality of fouling biota associating with vessels operating in California.
Utilizing both sets of information will guide and inform the development of regulations on
the management of fouling for vessels operating in California, as the Commission is
mandated to adopt by January 1, 2012.
70

Fee Submission Under PRC Section 71215, the Board of Equalization (BOE) collects a fee from the
owner or operator of each vessel that arrives at a California port or place from a port of
place outside of California. The Fees collected are deposited in the Marine Invasive
Species Control Fund to support the State’s Marine Invasive Species Program.
BOE receives daily reports from the Los Angeles/Long Beach Marine Exchange and
San Francisco Marine Exchange listing all arrivals to California ports. An electronic
record of this information is maintained for reference and use by the BOE staff. The
reports are reviewed to determine which arrivals are qualifying voyages and subject to
the Fee. Vessel accounts are billed based on arrival information. Additional analysis is
necessary to assign the correct account numbers to these arrivals.
There are currently 3,131 ballast accounts representing 8,561 vessels registered with
the BOE. On average, 65 new Vessel Accounts are added per month. In addition, an
average of 150 account maintenance items (address changes, adding vessels to
existing accounts, etc.) are processed per month. Approximately six Vessel Accounts
are closed out each month, and an average of 500 Vessel billings are mailed per month.
Compliance rate for fee submission exceeds 98%.
Table V.4. Summary of Marine Invasive Species Fee Program.
71

VI. RESEARCHFunded and Collaborative Research
PRC Section 71201 declares that the purpose of the Marine Invasive Species Program
is, “to move the state expeditiously toward elimination of the discharge of nonindigenous
species into the waters of the state.” The MISP advances this goal through a
comprehensive multi-pronged approach to vessel vector management including funding
and coordination of targeted, applied research that advances the development of
strategies to prevent the introduction of NIS from ballast water and vessel fouling.
Specifically, PRC Section 71213 mandates the Commission to
“ . . .. identify and conduct any other research determined necessary to
carry out the requirements of this division. The research may relate to the
transport and release of nonindigenous species by vessels, the methods
of sampling and monitoring of the nonindigenous species transported or
released by vessels, the rate or risk of release or establishment of
nonindigenous species in the waters of the state and resulting impacts,
and the means by which to reduce or eliminate a release or
establishment . . ..”
In an effort to advance the goals of the MISP, the Commission has funded specific
research addressing many of the NIS-related issues for which information has been
limited or lacking, including research related to emerging technologies which may
strengthen the Commission’s ability to reduce or prevent the occurrence of NIS
introductions into California waters. This section summarizes the research that the
Commission has funded and collaborated on during the previous two years.
Vessel Fouling Research
The Commission has been actively evaluating the risk of NIS introductions into
California through both the ballast water (see Section V. Data Analysis – Ballast Water
Management and Compliance) and vessel fouling (see Section V. Data Analysis – Trends in Vessel Fouling-Related Practices and Patterns) vectors over the past two
72

years. As part of the evaluation of vessel fouling (i.e. the fouling of aquatic organisms to
the underwater areas of vessels), the MISP has funded research aimed at evaluating
and understanding this vector more completely. This research is being conducted by
the Aquatic Bioinvasions Research and Policy Institute (ABRPI), a joint collaboration
between SERC and Portland State University. This research includes a variety of inter-
related projects, some of which have been completed and some of which are currently
being investigated. A brief discussion of each of these studies is presented below.
Recently Completed Fouling-Related Research
The Implications of Maritime Vessel Traffic, Wetted Surface Area and Port Connectivity
for Hull-Mediated Marine Bioinvasions on the U.S. West Coast (Davidson et al. 2006a)
The ABPRI has conducted an analysis of shipping patterns of vessels arriving to U.S.
West Coast ports in California (CA), Oregon (OR), and Washington (WA) over a two-
year period (July 2003 through June 2005). Included in this study was an evaluation of
the total amount of underwater vessel surface area, referred to as wetted surface area
(WSA), arriving to the U.S. West Coast. The WSA serves as an estimate of the total
potential colonizable area on a vessel, and therefore is analogous to ballast water
discharge volume as a risk factor analysis tool. Overall, 29,282 vessels arrived to U.S.
West Coast ports during the study period, representing 265.6 million square meters of
WSA.
A number of interesting patterns have emerged from this analysis. Overall, roughly two-
thirds of arrivals had a last port-of-call (LPOC) that was from ‘overseas’ (defined in this
study as outside of CA, OR or WA), largely driven by container vessels, which made up
nearly 48% of all WSA arrival to the U.S. West Coast. Bulk vessel WSA arrival was
also dominated by overseas transits, with 4.6 times more overseas than coastal
voyages. Tank vessel WSA arrived from both coastal and overseas ports at roughly the
same rate. The only vessel type whose WSA arrivals were predominantly coastal were
barges (coastal arrivals were 7.8 times more frequent than overseas).
73

Protocol for Sampling Commercial Vessel Biofouling Using a Remotely Operated
Vehicle (ROV) (Davidson et al. 2006b)
Little data exist from surveys of hulls and other underwater areas on vessels,
particularly from the contemporary commercial fleet. One of the contributing factors to
this lack of data is the difficulty associated with surveying the underwater surfaces of
vessels. This study describes a protocol for sampling the underwater surfaces of
vessels using a remotely operated vehicle (ROV), and focuses on six specific
underwater areas that are considered fouling hotspots: rudder, stern tube and propeller,
stern-end vertical (belly-line), horizontal hull transects along the dry dock support strips,
bow thruster, and the bow and bulbous bow.
Comparing Methodologies for Assessing Vessel Biofouling: Dry Dock, Diver and ROV
Sampling (Davidson et al. 2007a)
Assessments of commercial vessel fouling have traditionally been conducted either in-
water by diver sampling or out-of-water by dry dock sampling. More recently, archival
video footage from underwater vessel inspections has been utilized as a vessel fouling
evaluation tool. This current study compares each of these three methods with ROV
surveys (see description above: Davidson et al. 2006b), across ten different criteria to
assess the merits and constraints of each of these four methods. Overall, underwater
sampling by divers is the most effective method for assessing commercial vessel fouling
because it provides data representative of the commercial fleet and because it provides
researchers with the ability to combine photographic sampling with biological sample
collection.
Commercial Vessel Biofouling Extent and Composition: Containerships Sampled by
Diver and ROV Survey (Davidson et al. 2007b)
The ABRPI conducted underwater surveys of 22 vessels, all container vessels, using
either divers or ROV. In addition to determining fouling extent through underwater
surveys, this study also includes an evaluation of vessel characteristics such as
duration since last dry docking and recent operational history (e.g., voyage routes) and
74
how they correlate with fouling extent and composition, as well as a comparison to other
surveys of vessel fouling conducted worldwide.
Overall, this report suggests that both voyage range and duration since last dry dock
may be more important in fouling accumulation than ship type. However, it is clear that
a greater intensity of hull sampling, across a variety of different vessel types, is required
to obtain a better view of the extent and composition of fouling on the contemporary
commercial fleet. Doing so will facilitate thorough assessments of all of the factors
influencing fouling accumulation and survivorship and subsequent risk of NIS
introduction.
Current Fouling-Related Research
The Commission is currently funding three fouling-related studies through the ABRPI to
build upon the results of the research described above. The first study involves a
critical appraisal and re-analysis of data from the hull fouling literature. It is broadly
agreed that there is both a lack of information related to the vessel fouling vector and a
lack of review and synthesis of the data that is available. This work involves a re-
analysis of existing data to provide a solid foundation of fouling related knowledge and
will enable much needed assessments of the spatial and temporal variability of fouling
transfers. One of the goals of this project is to determine how well findings from modern
studies of vessel fouling in different regions of the world can be applied to California in
order to influence possible management options in the future.
The ABRPI is also building upon the results of their analysis of fouling extent on
container vessels (see Davidson et al. 2007b) by performing a similar study on a
different class of vessels operating in California - barges. Barges were selected for this
study because they lie on the opposite end of the spectrum, in terms of potential fouling-
related practices, when compared to container vessels. Barges tend to travel at much
slower speeds, typically spend longer durations of time in port, and operate more
regionally than container vessels. All of these characteristics of barges make them an
appropriate next step in the goal to steadily increase the numbers of vessel hulls of all
75
types in order to provide essential data on the transfer of fouling organisms across the
contemporary commercial fleet operating within California waters. This study also
includes an assessment of fouling organism survivorship, which is being assessed by
sampling the same locations on the same barges after random interim periods and also
includes dockside viability tests involving biological samples removed from the hull. The
results of this study will complement the data generated from previous work on
container vessels (Davidson et al. 2007b) and will allow for assessments of fouling
extent and composition within and between vessel types.
The third currently funded study is an evaluation of fouling organism viability, an
important factor in bridging the gap between the vessel fouling vector and potential
introduction into a recipient region. There is a considerable amount of information
known about ballast water organism survival but data relating to survival of fouling
organisms are lacking. In contrast to ballast water organisms, which are effectively
sheltered from environmental conditions occurring along a voyage route, fouling
organisms are constantly exposed to a myriad of different environmental conditions
(e.g., salinity, temperature, and flow characteristics) and, therefore, are more
susceptible to the potentially lethal effects associated with these types of variables.
This study focuses on the effects of salinity on fouling organism viability and is designed
to test salinities that mimic ship movements within the Panama Canal and into
California’s marine, brackish and freshwater ports. The test organisms will be collected
on settling plates from the area surrounding the Panama Canal, to serve as NIS posing
an incursion threat to California. This study will also likely include an evaluation of
temperature and flow tolerance as well. These experimental trials will provide valuable
insight into the influence of natural levels of environmental variability encountered in
California’s port systems on potential inoculation by fouling species. The results may
also shed light on how certain vessel traffic patterns (e.g., passage through Panama
Canal and freshwater port calls) may influence the risk of NIS introduction into
California.
76

Ballast Water Exchange Verification
Salinity measurements are currently the only available assessment tool for rapid
verification of BWE. Unfortunately, it is extremely limited in value (Murphy et al. 2007).
Ballast water taken up at one of many high salinity ports would register salinity readings
comparable to those of the open ocean. Thus salinity measurement may not indicate
whether an exchange had been conducted and will not always indicate whether
compliance with California law is being met.
The Commission entered into an agreement with the SERC to test the application of
ballast water exchange verification (BWEv) methodologies in 2005. The goal of the
project was to identify chemical components of sea water that have unique
concentration ranges between open-ocean and coastal waters. Based upon this
information, SERC developed a new method to identify whether ballast water has been
properly exchanged. The results of this study suggest that several chemical
components in ballast water (e.g. barium, manganese, phosphorous, and chromophoric
dissolved organic matter (CDOM)) may be useful for this purpose.
The Commission recently entered into a new contract with SERC to evaluate the
efficacy of using these chemical components as indicators of ballast water exchange for
vessels arriving to California and the West Coast of the United States. Ballast water
samples will be collected by Commission Marine Safety personnel during routine ballast
water inspections and later analyzed by SERC. Staff will also measure the
concentrations of CDOM aboard the vessel using a hand-held instrument (Ballast water
Exchange Assurance Meter (BEAM)) developed by Dakota Technology. SERC will
compare the accuracy of the BEAMs by comparing the concentrations of CDOM
measured in the field to those measured in the laboratory using the samples collected
by Commission Inspectors. Additionally, SERC will analyze samples for concentrations
of selected metals likely found in ships’ ballast water that may be of concern from a
water quality perspective (e.g. zinc, nickel, copper). This study will help the
Commission determine the appropriate next steps for BWEv of vessel discharging in
California ports. The project should be completed in 2009.
77
Alternative Treatment Technology Pilot Projects
In addition to the mandate in PRC Section 71213 to conduct research necessary to
carry out the requirements of the division, Section 71210 of the PRC specifically
addresses the management of ballast water using alternative treatment technologies
and requires the Commission to:
“…sponsor pilot programs for the purpose of evaluating alternatives for
treating and otherwise managing ballast water. The goal of this effort shall be
the reduction or elimination of the discharge of nonindigenous species into
the coastal waters of the state…Priority shall be given to projects to test and
evaluate treatment technologies that can be used to prevent the introduction
and spread of nonindigenous aquatic species into coastal waters of the state
by ship-mediated vectors.”
To fulfill this mandate, Commission staff has worked with the maritime industry and technology vendors over the last several years to help identify vessels and test platforms for the purpose of treatment system development and evaluation. It is a challenge to find companies willing to commit to costly vessel retrofits in support of shipboard experimental testing of ballast water treatment systems. Identifying appropriate shipboard platforms for treatment system evaluations requires a unique combination of owner willingness, available funding, and engineering compatibilities.
The Commission has funded the following projects in recent years in order to gather much needed information about the design, development, installation and evaluation of ballast water treatment technologies.
Matson - Ecochlor
In 2005, a portion of MISP funds was allocated to support the shipboard installation and
evaluation of an experimental ballast water treatment technology onboard the Integrated
Tug/Barge Moku Pahu, operated by Matson Navigation Inc. The funds were provided to
78

assist in the installation and evaluation of a chlorine dioxide treatment system designed
by Ecochlor Inc. Initial studies have shown this technology to effectively treat
zooplankton, phytoplankton, and some microorganisms (Oviatt et al. 2002). The
Commission finalized a funding contract and project timeline with Matson Navigation
Inc. which required system evaluation according to the USCG’s Shipboard Technology
Evaluation Program (STEP). During the summer of 2006, Matson Navigation Inc.
submitted an application to the STEP for the Moku Pahu.
USCG’s delay in processing the STEP application has deferred the biological analysis
of treatment system performance on the Moku Pahu. During 2006 and 2007, the
Ecochlor system on the Moku Pahu was adjusted and modified to optimize
performance, and sampling ports were installed to facilitate ballast water sampling at
inlet and discharge. In 2008, the USCG released the draft Environmental Assessment
(EA) - necessary to evaluate the applicant for enrollment into STEP - for the Moku
Pahu. Matson and Ecochlor are currently working with USCG to address the comments
received in response to the draft EA. A team of researchers are scheduled to begin
evaluation of the biological efficacy of system performance upon acceptance of the
vessel into STEP. While awaiting word of STEP acceptance, Commission staff
continues to follow the project closely and receives quarterly progress reports from
Matson.
APL - NEI
The Commission has also allocated funds for a ballast water treatment technology
installation and evaluation onboard an American Presidential Line (APL) vessel. This
technology, developed by NEI Treatment Systems, treats ballast water through de-
oxygenation using a low-sulfur inert gas to displace the oxygen, thereby creating a
hypoxic (low oxygen concentration) environment that significantly decreases the
survival of NIS. This system also claims an added benefit of reducing corrosion within
ballast water tanks under certain operating conditions (Tamburri et al. 2005). The
project was initially approved for funding from the Commission in 2006; however, the
project was delayed while additional funds and agreements were obtained from other
79

sources. All funding is now in place, and Commission staff and APL finalized the
contract in October, 2008. Work began in the fall of 2008.
Glosten – T/S Golden Bear
In 2008, the Commission approved funding to support the development of a ballast
water treatment technology testing and evaluation facility onboard the California
Maritime Academy’s Training Ship Golden Bear. The Commission funding will augment
federal funds from the National Oceanic and Atmospheric Administration (NOAA) Sea
Grant Ballast Water Management Demonstration Program and the Maritime
Administration (MARAD). The project will establish the first ballast water treatment
technology testing and evaluation facility in California, and the only dock-side shipboard
facility on the West Coast. This work will provide valuable real-time information about
shipboard operation of ballast water treatment systems. This information is critical for
the continued development of effective means to control NIS introductions through
ballast water discharges. The project is expected to commence in late 2008.
CDFG Marine Invasive Species Program
Pursuant to the Marine Invasive Species Act of 2003, the California Department of Fish
and Game (CDFG) continues to monitor the location and geographic ranges of
introduced species populations in the State’s coastal and estuarine waters to
supplement the existing baseline inventory of resident nonindigenous species. The
baseline inventory development began under mandate by the Ballast Water
Management for Control of Nonindigenous Species Act of 1999. The ongoing
monitoring is intended as a means of detecting new introductions. The 2003 statute
(the Marine Invasive Species Act) expanded the ongoing monitoring program to include
intertidal and nearshore subtidal habitats along the open coast. The overall program is
intended to assess the effectiveness of ballast water controls implemented under
current laws and regulations. These findings will be made available in CDFG’s Report
to the Legislature due January 1, 2009.
80

CDFG’s Office of Spill Prevention and Response (OSPR) continues to collaborate with
other agencies and organizations conducting similar surveys for NIS in coastal waters,
and to share data generated by these studies so that financial and personnel resources
are maximized. As in previous years, OSPR has continued to retain Moss Landing
Marine Laboratories (MLML) as the primary contractor to conduct the on-going
monitoring effort.
Activities for the current reporting period are summarized below. Readers wishing
further details may view the CDFG Report to the Legislature, which shall be available
concurrently with this report through the following website:
www.dfg.ca.gov/ospr/about/science/misp.html.
Species Inventories and Ongoing Monitoring
First Outer Coast Survey, 2004
During the previous reporting period, MLML had completed most of the work for the
initial Outer Coast Study and their preliminary results were included in the
Commission’s 2007 Biennial Report to the Legislature (Falkner et al. 2007). CDFG
received MLML’s final report in December 2006. Due to ongoing taxonomic revisions,
the introduction status of many species have been subsequently reclassified. Of the 26
species previously designated as introduced, 20 species have been reassigned to other
categories, thereby reducing the total number of 2004 introduced species to six. Thus,
except for Diablo Canyon and Arroyo Hondo, no introduced species were detected at
stations north of Point Dume during 2004.
San Francisco Bay and Delta Survey, 2005
One additional survey of the San Francisco Bay and Delta was in progress during the
previous reporting period. Samples collected from subtidal fouling, subtidal infauna,
rocky intertidal and sandy intertidal habitats were analyzed in early 2007 and a draft
report was completed in November 2007. The samples yielded an overall total of 513
resolved species. Many of the species historically found in the San Francisco Bay (e.g.,
pelagic organisms and mobile species such as the mitten crab, Eriocheir sinensis) were
81

not found because sampling was limited to intertidal and subtidal habitats and sampling
methods were habitat-specific. Furthermore, 44 species that were not previously
included in the California Aquatic Non-Native Organism Database (CANOD) database
were found, but subsequent literature and data reviews confirmed that none of these
species were new to San Francisco Bay. In general, the number of introduced species
was much greater in the central and south bays than in San Pablo and Suisun Bays.
Lower salinities, scarcity of natural rocky intertidal habitats and the small number of
sampling sites may account for overall lower species diversity in the latter two bays.
Second Bay and Estuary Survey, 2006
Bay and Estuary sites were re-sampled by MLML during 2006 and the report was
completed in February 2008. A total of 775 species were identified to species level
(Table VII.1), and another 402 were taxonomically unresolved. No new introduced
species were discovered during this survey.
Overall species diversity in freshwater ports was about one order of magnitude less
than that of marine bays and harbors, consequently the number of introduced species
differed between freshwater and marine sites in about the same proportions. However,
comparison of numbers of species between sites is difficult, due to a lower level of
sampling effort in freshwater ports. Among the marine ports, overall species diversity
varied widely, although Southern California sites tended to have higher proportions of
introduced species.
Table VII.1. Number of species found during the 2006 Bay and Estuary Survey by introduction status.
Introduction Status Number of SpeciesNative 567Introduced 82Cryptogenic* 126Unresolved 402
*Cryptogenic = species of unknown origin
82

Second Outer Coast Survey, 2007
Outer Coast sites were resampled by MLML during 2007. The same 22 coastal
headland sites were targeted, but subtidal sampling was omitted for three of the
northernmost sites due to logistical constraints. Sample analysis was completed in
early 2008, and MLML submitted a final report in September 2008. Overall, fewer kinds
of organisms were found in 2007 than in the previous survey, even after taxonomic and
introduction status revisions had been accounted (Table VII.2). Introduced species
comprised approximately 0% to 1.2% of the total resolved species collected from each
site. Cryptogenic species ranged from 11 to 56 species per site, representing 9.7% to
15.1% of total taxa, while native species ranged from 40 to 201 per site, representing
46.6% to 59.9% of total taxa collected.
Of the six introduced species found during 2004, three species of algae and one
polychaete species were observed again in 2007. Five other introduced species were
also found, but none are new to California waters.
The California coastline is divided into two distinct physiographic zones, separated by
Point Conception. The two zones differ biogeographically, which may also account for
the dissimilarities in the distribution pattern of nonindigenous species. In the northern
zone, one introduced species was found at Shelter Cove (Monocorophium insidiosum,
an amphipod) and at Diablo Canyon (Sargassum muticum, a brown seaweed,).
Although no introduced species were found at Point Conception, one or more were
found at all other sites within the southern zone. Sargassum muticum, and
Caulacanthus ustulatus (a red seaweed), have persisted within the Southern California
Bight since the previous survey. All other introduced species occurrences showed no
temporal or spatial trends.
Given the three-year interval between surveys and the quantitative approach of the
surveys thus far, the increase in the number of introduced species does not in any way
refute the efficacy of California’s Ballast Water Management Program. First, it must be
stressed that none of the additional species detected in 2007 are new arrivals in
83
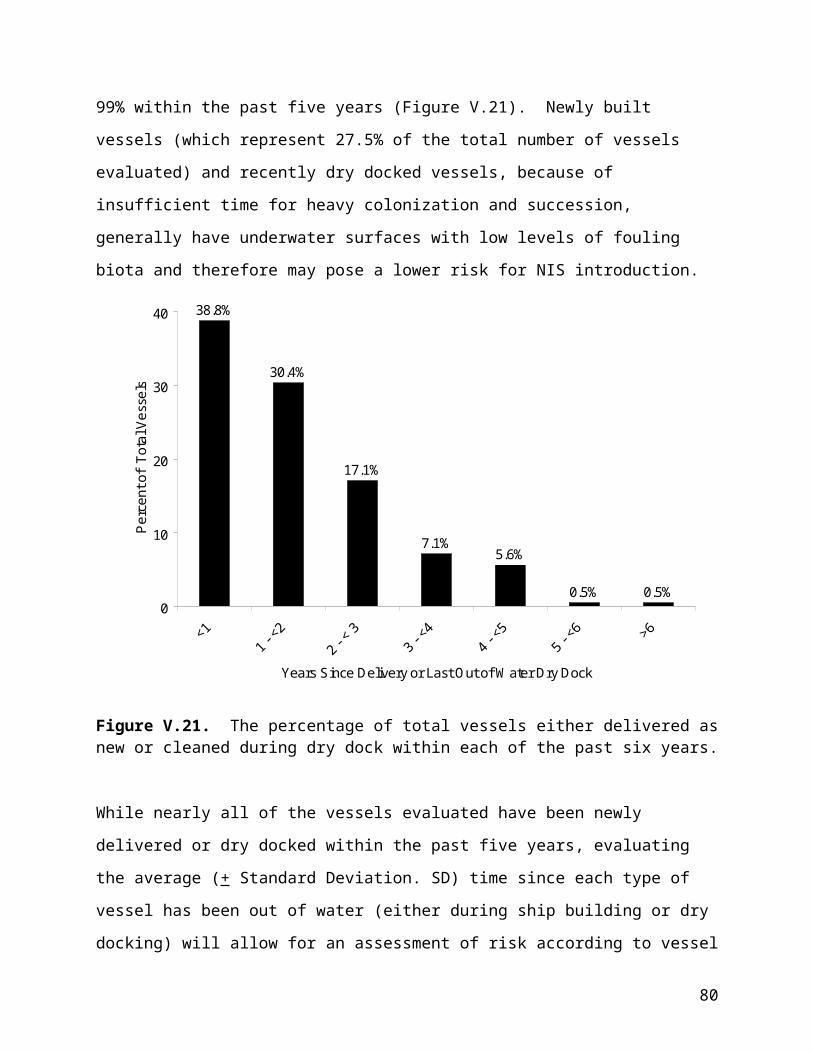
California waters. The species may have been present but may have been missed due
to chance alone because marine organisms tend to be distributed in patches.
Secondly, many introduced species are polyvectic (i.e. having many possible vectors of
introduction). Despite efforts to curb introduced species transport by the commercial
sector, fouling from both commercial and recreational watercraft remains the primary
source of introduced species to California’s coastal waters.
Table VII.2. Number of species found during Outer Coast Surveys by introduction status, 2004 and 2007.
Introduction Status/Year
Number of Species2004 2007
Native 1,069 802Introduced 6 9Cryptogenic* 147 144Unresolved 618 474Unresolved Complex 8 5
*Cryptogenic = species of unknown origin
Survey Report Updates
Due to the constantly changing state of taxonomy and introduction designations, the
reader is advised that the numbers reported herein and post-survey reports submitted
by MLML may be superseded at any time. Consequently, those wishing the most
current version of list of introduced species from survey reports and other documents
should consult CANOD. A description of CANOD is provided below.
California Aquatic Non-native Organism Database (CANOD)
PRC Section 71211 (a) (1) requires the CDFG to collect data necessary to establish
and maintain an inventory of the location and geographic range of nonindigenous
species populations in the coastal and estuarine waters of the state. Furthermore,
Subsection (a) (2) requires that said existing data and accompanying analysis shall be
made available to the public through the Internet on or before January 1, 2007, and
provide an update for said inventory no later than July 1, 2008. To this end, CDFG, in
collaboration with MLML, created the California Aquatic Non-native Organism Database
(CANOD), a relational database of all organisms collected during California Marine
84
Invasive Species Program surveys to date, as well as all data generated from
collaborations with other agencies and organizations. In addition, literature-based
information about introduced species have been incorporated into CANOD. The recent
enhancement of CANOD by SERC Staff was previously discussed under the Special
Studies Section (Probable Vectors of Introduction). Updates to CANOD are ongoing, as
necessary to accommodate new records as well as taxonomic or introduction status
revisions. CANOD may be accessed through the following website:
www.dfg.ca.gov/ospr/about/science/misp.html.
Future Activities
The Marine Invasive Species Act of 2003 had previously extended the sunset date of
the CDFG monitoring program to January 1, 2010. Meanwhile, the Coastal Ecosystem
Protection Act of 2006 deleted the repeal of the monitoring program. In addition, the
new legislation set a triennial cycle for future Reports to the Legislature regarding the
CDFG monitoring program after January 1, 2009.
Plans for future sampling include:
a third round of sampling for Bay and Estuaries sites, including San Francisco
Bay, planned for 2009-2010
a third visit to Outer Coast sites, planned for 2011-2012
Review of current vessel vector researchNonindigenous Species
A large amount of NIS-related research has been published over the past few years,
including a number of studies evaluating ballast tank sediments and vessel fouling as
sources for NIS introductions. Drake et al. (2007) compiled ballast tank sediment data
from various studies and determined that a high concentration of microbes is found in
ballast tank sediments. While ballast water introduces more microbes than ballast tank
sediments due to the large volume discharged, the authors state that ballast tank
sediments should be addressed by best management practices.
85
Ballast tank sediments have also played a role in harboring active and resting stages of
invertebrates (Bailey et al. 2007). This study contends that sediments can play an
influential role in the success of invasions by providing habitat for invertebrates with
tolerant resting stages, bypassing the harsh conditions associated with ballast tanks.
Dormant invertebrates collected for this study were viable when placed into nutrient-rich
conditions.
Another area of NIS-related research has focused on the transport of macroalgae via
ballast water and ballast tank sediments. Flagella et al. (2007) recently discussed their
finding of various life stages (such as spores and propagules) of 13 species of
macroalgae in ballast water that were viable and culturable, suggesting that ballast
water may be an important vector for transporting not only microalgae but also
microscopic life stages of macroalgal species.
Vessel fouling has become another area that has received much attention in recent
years. In a quantification and identification effort, Drake and Lodge (2007) identified
944 fouling individuals on a single vessel, more than an order of magnitude greater than
previous efforts. While the authors acknowledge that this vessel may exceed “average”
fouling, they emphasize that vessels which are heavily fouled pose the greatest threat
for NIS introductions. Anti-fouling treatments applied to submerged surfaces of a vessel
are intended to prevent and minimize fouling. However, recent research suggests that
copper-based antifoulants may increase larval recruitment of NIS compared to control
or TBT- treated conditions and may inadvertently increase the risk of introducing NIS to
new environments (Dafforn et al., 2008). The authors suggest that this observation may
be due to resistance of heavy metal exposure in certain species, a theory that is
supported by previous studies.
In addition to the fouling of vessel hulls, vessel sea chests can also harbor a variety of
NIS (Coutts and Dodgshun, 2007). The authors of this study surveyed the sea chests
of 42 vessels and found that 42% of the identified organisms were mobile. These mobile
86

NIS species may be more of a risk for successful introductions because of their ability to
rapidly disperse while the vessel is in port.
Recent vessel fouling research has also indicated that in-water cleaning methods may
increase NIS introduction risk. The brushes used during in-water cleaning have the
potential to disperse viable fragments of certain species (e.g. macroalgae, bryozoans)
into bays and harbors (Hopkins and Forrest, 2008). The authors showed that live
barnacles and hydroids were dislodged during in-water cleaning. Furthermore, cleaning
without reapplication of antifouling paint may increase the susceptibility to increased
levels of fouling as six-times more individuals were found on surfaces that were
manually cleaned, compared to surfaces that were not (Floerl et al. 2005).
Silicone-based anti-fouling paints, which are designed to reduce the ability for fouling
organisms to adhere to a vessel’s surface, are not generally considered to be toxic.
However, these silicone-based paints have the potential to cause adverse water quality
conditions in ports. A recent study (Nendza, 2007) states that the silicone oils in
antifouling paints (known as polydimethylsiloxanes, or PDMS), which may leach out
from the coatings, are highly persistent and have low solubility in water. These oils may
clog surface sediments and cause anoxic (i.e. no oxygen) conditions.
Another important direction for invasive species research has been the effect of climate
change. In a recent review, Rahel and Olden (2008) discuss how climate change may
influence the geographical range of established NIS through factors such as altered thermal regimes, reduced ice cover in lakes, and increased salinity. For example, freshwater and estuarine ecosystems may become more saline in a warming climate because of reduced precipitation, thereby allowing brackish water species, such as the Chinese mitten crab (Eriocheir sinensis), to survive in
these environments or to expand their established population into nearby ecosystems
that were historically freshwater. The authors also discuss how climate change may
affect how we identify invasive species, as native species may also expand their
distribution to populate new environments and cause adverse effects on other native
87

species. The authors also reference the need for managers to have an integrated
monitoring system for invasive aquatic species.
Management and Policy
Since the number of discovered NIS in the Great Lakes has increased since 1993,
(when regulations were first implemented in the Great Lakes), regulatory agencies and
researchers have wondered if ballast water exchange requirements have been
adequate in the prevention of NIS introduction. Using a theoretical model, Costello et al.
(2007) found that too few data exist to make a defensible conclusion about the efficacy
of BWE. The authors also attribute the continuing discovery of new NIS in the Great
Lakes to lag time between the time of introduction and detection. In a correspondence
in Letters to the Editor, Drake et al. (2008) clarified issues discussed by Ricciardi and
MacIsaac (2008) and summarized the main finding of Costello et al. (2007), stating
“there is insufficient data to precisely estimate the effectiveness of the BWE policy.
However, empirical evidence suggests that this policy has not been 100% effective in
preventing all ship-vectored transfers of NIS to the Great Lakes.”
VII. NEEDED RESEARCHIn addition to the research that has been funded by the Commission and research
ongoing through independent parties, Commission staff believes the following research
is necessary in order to advance the Marine Invasive Species Program and prevent the
introduction of species from commercial vessel vectors into California waters.
Support research to develop methods to verify compliance with performance standards. The field of treatment performance assessment, like that of treatment technology
development, is emerging. Scientists are striving to find rapid, innovative techniques
that can be used by both scientists and regulatory agencies to assess vessel discharge
compliance with the relevant performance standards. Most notable for California, the
performance standards for organisms less than 10 micrometers in size (bacteria and
viruses) have not been adopted by any other regulatory entity in the world.
88
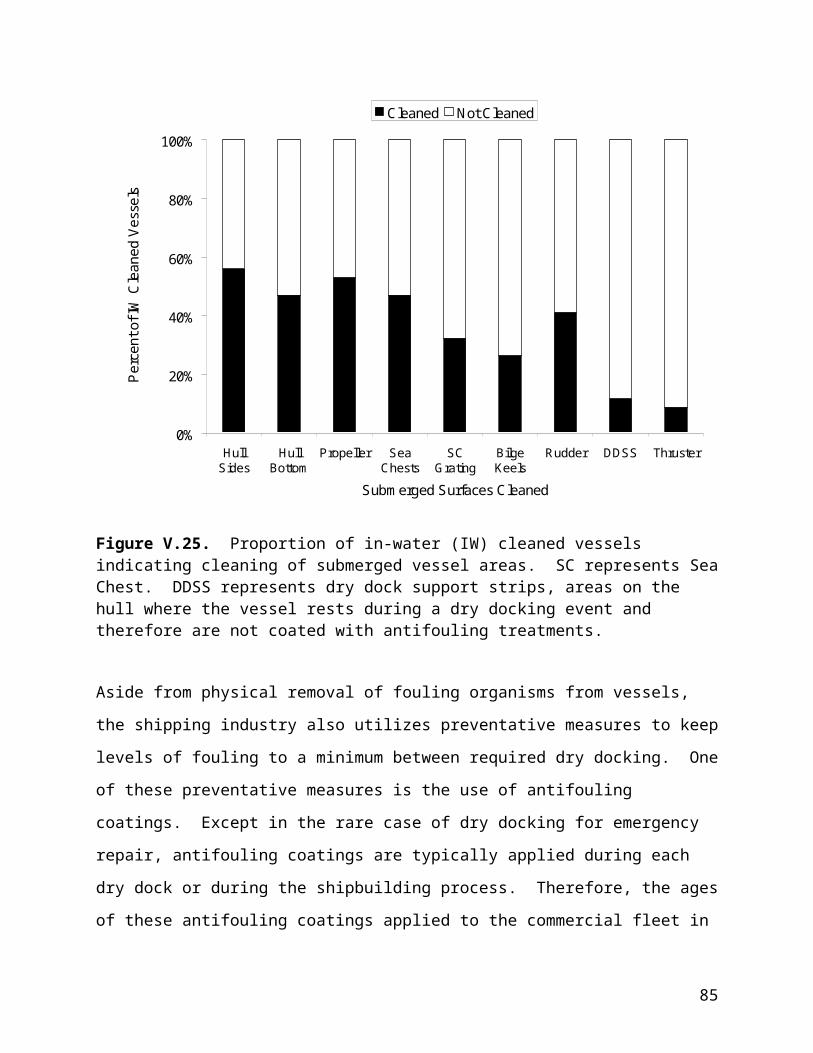
Consequently, there is little ongoing effort to develop assessment techniques for these
size classes of organisms. Currently, there are no available techniques to both quantify
and assess the viability of all bacteria and viruses in a sample of ballast water. The
Commission should continue to support research addressing the development of new
techniques and technologies to assess vessel compliance with California’s performance
standards.
Support research promoting in-water cleaning technology development. Vessel
owners and operators strive to maintain clean hulls in order to minimize fuel costs,
maximize vessel speed, meet classification society requirements, and to help ensure
the structural integrity of their vessels. While complete cleaning and re-coating of
vessel hulls with antifouling paint may provide better long-term antifouling protection
than in-water cleaning, the dry dock facilities necessary to apply those paints are limited
and expensive. Most owners and operators therefore conduct in-water cleaning
between required dry dockings. In-water cleaning is one of several ways through which
fouling NIS can be transferred from a vessel to a recipient port, and the activity poses
some NIS introduction risk. A technology that can collect and contain in-water cleaning
debris would be a desirable tool to prevent NIS release during in-water cleaning, while
also providing commercial operators an avenue to clean hulls without placing a vessel
in dry dock. The Commission should support the development of new technologies to
address this issue.
VIII. CONCLUSIONS AND LOOKING FORWARDThrough a variety of forward-looking and innovative management strategies, the
Commission has continued to improve California’s Marine Invasive Species Program
over the past two years. Staff has not only worked to address gaps in compliance
monitoring and enforcement actions, but Commission legislative reports completed
since 2006 (Falkner et al. 2007, Dobroski et al. 2007) have been instrumental in the
development of regulations to stem the transport of NIS in California. Specifically, the
reports have lead to the development of regulations that: 1) implement performance
standards for ballast water discharges, 2) reset the Fee amount collected that supports
89

the various program components, 3) adopt the Hull Husbandry Reporting Form, and 4)
contribute to legislation delaying the initial implementation of the performance standards
from 2009 to 2010. Furthermore, MISP continues to play a role in collaboration with
other agencies and organizations to better address ship-born NIS issues.
The focus of the Commission’s Program continues to be on protection, prevention,
outreach and education, and solution-based actions. The Commission will concentrate
available resources on working proactively with the regulated industry to achieve a high
rate of compliance with required management practices, to minimize discharges of
unmanaged water, and to reduce the risks of biological invasions.
Looking ForwardThe legislatively-mandated reports and projects completed by the Commission since
2006 have strengthened the knowledge and ability of the Commission to prevent NIS
introductions, led to new legislation, and have increased agency responsibilities. They
have also identified challenges that will need to be addressed over the next two years in
order for the Commission to fulfill new legislative directives and to continue to “move the
state expeditiously toward the elimination of the discharge of nonindigenous species
into the waters of the State”. To address these challenges, Commission staff is
currently engaged in the following activities:
Protocols and regulations to implement California’s performance standards The effective implementation of California’s performance standards requires
Commission staff to move forward on several new projects and rulemaking actions. First
and foremost has been the development of ballast water treatment technology testing
guidelines to provide technology vendors with a standardized approach to evaluating
treatment system performance relative to California’s discharge standards and water
quality objectives. The guidelines were completed and distributed in October, 2008. The
testing guidelines draw heavily on the EPA’s draft Environmental Technology
Verification (ETV) protocols for ballast water performance verification. EPA is currently
in the process of revising the draft ETV protocols and expects to release the next
90

version in late-2009 or 2010. As the ETV protocols are updated, Commission staff will
revise the testing guidelines in order to eliminate variability between the proposed
federal technology evaluation program and California’s recommended guidelines.
Commission staff must make several amendments to the performance standards
regulations (2 CCR § 2291 et seq.) during the next year to ensure effective
implementation. The passage of SB 1781 (Chapter 696, Statutes of 2008) delayed the
initial implementation of those standards from 2009 to 2010. The regulations must now
be amended to maintain consistency with the statute.
Commission staff is also in the process of developing regulations to guide the selection
of sampling points (i.e. location) and sampling facilities (i.e. equipment) on vessels to
facilitate the collection of ballast water samples to assess compliance with the
performance standards. Additionally, the regulations will offer guidance on the selection
of sampling facilities so as to reduce or eliminate the possibility of artificially induced
organism mortality associated with passing through the sampling apparatus.
Finally, Commission staff is developing procedures and protocols for use by
Commission Marine Safety personnel to verify vessel compliance with the performance
standards. These enforcement protocols will be drafted in association with the same
panel of experts involved in the writing of the technology testing guidelines.
Continue to work in consultation with the Water Board to identify applicable water quality requirements for ballast water treatment technologies and provide technology developers with guidance documents to ensure system compliance with applicable California laws. As specified in the California Coastal Ecosystems Protection Act of 2006, ballast water
treatment systems must be reviewed for environmental impacts, including effects on
water quality. As the state agency with the authority and expertise to evaluate and
enforce water quality requirements under the Clean Water Act, the State Water
Resources Control Board plays an integral role in this regard. The Water Board and the
91

Commission staff will continue to work to identify the California water quality
requirements that are applicable to ballast water treatment systems. Commission staff is
also working with Water Board staff to stay informed about the proposed provisions in
the State’s 401 certification of the NPDES Vessel General Permit and any changes to
the California Ocean Plan or relevant monitoring programs associated with vessel
discharges. This information will be incorporated into a guidance document and passed
on to treatment developers so that they may ensure that their systems will be in
compliance with California’s water quality requirements.
Compiling and analyzing data related to vessel hull husbandry Unlike the ballast water vector, all vessels pose some level of risk through the fouling
vector. However, because fouling organisms are external, they are exposed to many
more varying environmental conditions than sheltered ballast water organisms. These
environmental conditions and voyage patterns are likely to influence the amount,
complexity, and viability of fouling biota on the submerged surfaces of the commercial
fleet. In January 2008, Commission staff began collecting data, using a Hull Husbandry
Reporting Form (HHRF), on the fouling-related husbandry practices of the commercial
vessel fleet visiting California waters. The data collected via the HHRF over the next
few years will provide the Commission with valuable insight into the fouling-related
practices of the fleet as a whole. These data will be used in conjunction with the
information learned through fouling-related research currently funded through the
Commission to get a better idea of how husbandry practices and voyage characteristics
affect the quantity and quality of fouling biota associating with vessels operating in
California. Both sets of information will guide and inform the development of regulations
on the management of fouling for vessels operating in California which the Commission
is mandated to adopt by January 1, 2012.
Improving ComplianceAs a result of extensive outreach by Commission staff, the utilization of technical
advisory groups, the implementation of a monthly electronic notification system and the
potential for civil and criminal penalty action, compliance with ballast water reporting
92

form submission continues to exceed 95 percent. Conversely, compliance with the
reporting requirements for hull husbandry practices needs significant improvement. This
is the first year of this new reporting requirement and as such, misunderstanding exists
about when vessels should report. Commission staff believes that these
misunderstandings have been corrected via the rulemaking process and the associated
public commenting period. Staff will continue in its outreach efforts in order to ensure
that the HHRF compliance rate increases to levels comparable to that of the ballast
management reporting.
In addition to outreach efforts to increase reporting compliance, Commission staff
continues to address compliance with ballast water management requirements. The
total volume of ballast water discharged into California has been increasing over the last
2 years, though the volume of noncompliant ballast water has decreased approximately
forty-five percent during this time. Furthermore, only two percent of all ballast water
carried into the waters of the State did not meet the management requirements as
prescribed in the law. The vast majority of these noncompliant ballast water discharges
underwent some type of exchange, reducing the risk of NIS introductions. As vessel
owners/operators transition from ballast water exchange to effective treatment
technologies in response to the implementation of performance standards, the risk of
NIS introductions posed by ballast water will decrease. During this transition period and
beyond, the Commission will continue to address noncompliant vessels through
outreach and education and the pursuit of enforcement action as necessary.
93

IX. REFERENCES
Australia Department of Agriculture, Fisheries, and Forestry. 2006. http://www.daffa.gov.au/fisheries/invasive/national-system. Accessed on October
26 , 2006.
Australian Quarantine and Inspection Service. “Australian Ballast Water Management Requirement”. Marine Awareness Kit. Accessed 24 March, 2005. Website: http://www.affa.gov.au/corporate_docs/publications/html/quarantine/ballast_water/Australian_BW_Requirements.pdf.
Bailey, S.A., I.C. Duggan, K. Nandakumar, and H.J. MacIsaac. 2007. Sediments in ships: Biota as biological contaminants. Aquatic Ecosystem Health and Management. 10 (93-100).
California Department of Fish and Game (CDFG). 2008. Quagga and Zebra Mussels. Website: http://www.dfg.ca.gov/invasives/quaggamussel/. Accessed: September 11, 2008.
California Sea Grant. 2003. Annual Report. Report No. R-051. La Jolla, CA. 52 pp.
Carlton, J.T. 1996. Pattern, process, and prediction in marine invasion ecology. Biological Conservation, 78(1-2): 97-106.
Carlton, J.T. 1999. The scale and ecological consequences of biological invasions in the world’s oceans. In Invasive Species and Biodiversity Management. O. Sandulund, P. Schei, and A. Viken, eds. Kulwer Academic Publishers. Dordrecht, Netherlands. 195-212 pp.
Carlton, J.T. 2001. Introduced Species in U.S. coastal waters: Environmental impacts and Management Priorities. Pew Oceans Commission. Arlington, VA. 28 pp.
Choi, K-H, W. Kimmerer, G. Smith, G.M. Ruiz, and K. Lion. 2005. Post-exchange zooplankton in ballast water of ships entering the San Francisco Estuary. Journal of Plankton Research, 27: 707-714.
Cohen, A.N. 1998. Ships’ Ballast Water and the Introduction of Exotic Organisms into the San Francisco Estuary. Current status of the problem and options for management. San Francisco Estuary Institute, Richmond, CA. 81 pp.
Cohen, A.N. and A. Weinstein. 1998. The potential distribution and abundance of zebra mussels in California. San Francisco Estuary Institute.
Cohen, A.N. and J.T. Carlton. 1995. Biological study. Non-indigenous Aquatic Species in a United States estuary: A case study of the biological invasions of the San Francisco Bay and Delta. U.S. Fish and Wildlife Service, Washington DC, and
94

National Sea Grant College Program, Connecticut Sea Grant. NTIS No. PB96-166525.
Cohen, A.N. and J.T. Carlton. 1998. Accelerating invasion rate in a highly invaded estuary. Science. 279: 555-558.
Costello, C., J.M. Drake, and D.M. Lodge. 2007. Evaluating an invasive species policy: ballast water exchange in the Great Lakes. Ecological Applications 17: 655-662.
Coutts, A.D.M. and T.J. Dodgshun, 2007. The nature and extent of organisms in vessel sea-chests: A protected mechanism for marine bioinvasions. Marine Pollution Bulletin 54: 875-886.
Coutts, A.D.M. 1999. Hull fouling as a modern vector for marine biological invasions: investigation of merchant vessels visiting northern Tasmania. Thesis at Australian Maritime College.
Coutts, D.M., K.M. Moore, and C. Hewitt. 2003. Ships’ sea-chests: An overlooked transfer mechanism for non-indigenous marine species? Marine Pollution Bulletin. 46: 1504-1515.
Coutts, D.M. and M.D. Taylor. 2004. A preliminary investigation of biosecurity risks associated with biofouling on merchant vessels in New Zealand. New Zealand Journal of Marine and Freshwater Research. 38: 215-229.
Davidson, I., G. Ruiz, and M. Sytsma. 2006a. The Implications of Maritime Vessel Traffic, Wetted Surface Area and Port Connectivity For Hull-Mediated Marine Bioinvasions on the U.S. West Coast. Aquatic Bioinvasion Research and Policy Institute. Draft report for California State Lands Commission.
Davidson, I., G. Ruiz, and M. Sytsma. 2006b. Protocol for Sampling Commercial Vessel Biofouling Using a Remotely Operated Vehicle (ROV). Aquatic Bioinvasion Research and Policy Institute. Draft report for California State Lands Commission.
Davidson, I., G. Ruiz, and M. Sytsma. 2007a. Comparing Methodologies for Assessing Vessel Biofouling: Dry Dock, Diver and ROV Sampling. Aquatic Bioinvasion Research and Policy Institute. Final Report for California State Lands Commission.
Davidson, I., G. Ruiz, C. Brown, and M. Sytsma. 2007b. Commercial Vessel Biofouling Extent and Composition: Containerships Sampled by Diver and ROV Survey. Aquatic Bioinvasion Research and Policy Institute. Draft Final Report for California State Lands Commission.
95

Dobroski, N., L. Takata, C. Scianni and M. Falkner. 2007. Assessment of the Efficacy, Availability and Environmental Impacts of Ballast Water Treatment Systems for Use in California Waters. Produced for the California State Legislature. 107 pp.
Drake, J.M., M.A. Dobin, and F.C. Dobbs. 2007. Potential microbial bioinvasions via ships’ ballast water, sediment, and biofilm. Marine Pollution Bulletin. 55: 333-341.
Drake, J.M. and D.M. Lodge. 2007. Hull fouling is a risk factor for intercontinental species exchange in aquatic ecosystems. Aquatic Invasions. 2: 121-131.
Drake, J.M., D.M. Lodge, and C. Costello. 2008. Response to Letter to the Editor. Ecological Applications 18: 1323-1324.
Eldredge, L.G. and J.T. Carlton. 2002. Hawaii marine bioinvasions: A preliminary assessment. Pacific Science. 56: 211-212.
Falkner, M., L. Takata, S. Gilmore and N. Dobroski. 2007. Biennial Report on the California Marine Invasive Species Program. Produced for the California State Legislature. 79 pp.
Falkner, M., L. Takata, and S. Gilmore. 2005. Report on the California Marine Invasive Species Program. Produced for the California State Legislature. 44pp.
Falkner, M., L. Takata, and S. Gilmore. 2006. California State Lands Commission Report on Performance Standards for Ballast Water Discharges in California. Produced for the California State Legislature.
Falkner, M.B. 2003. Report on the California Ballast Water Management Program. California State Lands Commission, Marine Facilities Division. 82 pp.
Feyrer, F., H.B. Matern, and P.B. Moyle. 2003. Dietary shifts in a stressed fish assemblage: Consequences of a bivalve invasion in the San Francisco estuary. Environmental Biology of Fishes. 67: 277-288.
Flagella, M.M., M. Verlaque, A. Soria, M.C. Buia. 2007. Macroalgal survival in ballast water tanks. Marine Pollution Bulletin 54: 1395-1401.
Fofonoff, P.W., G.M. Ruiz, B. Steves, and J. Carlton. 2003. In ships or on ships? Mechanisms of transfer and invasion for nonnative species to the coasts of North America. Pp. 152-181. In Invasive species, vectors and management strategies. G.M. Ruiz and J.T. Carlton eds. Island Press, Washington D.C.
Gollasch, S. 2002. The importance of ship hull fouling as a vector of species introductions into the North Sea. Biofouling. 18: 105-121.
96

Hallegraeff G.M. 1998. Transport of toxic dinoflagellates via ships’ ballast water: bioeconomic risk assessment and efficacy of possible ballast water management strategies. Marine Ecology Progress Series 168: 297-309.
Hartman, W.D. 1975. Phylum Porifera. Pp32-64. In Lights Manual: Intertidal Invertebrates of the Central California Coast, Third Edition. R.I. Smith and J.T. Carlton eds. University of California Press, Berkeley CA
Hopkins, G.A. and B.M. Forrest. 2008. Management options for vessel hull fouling: an overview of risks posed by in-water cleaning. International Council for the Exploration of the Sea. 65: 811-815.
International Marine Coatings. 2006. TBT free antifoulings and foul release systems. Accessed October 15, 2005. http://www.international- marine.com/newbuilding/brochures/AF_Range_Brochure.pdf.
International Maritime Organization (IMO) 2001. International Convention on the Control of Harmful Antifouling Systems on Ships, 2001. Adopted on 18 October 2001. AFS/CONF/26.
International Maritime Organization. Summary of conventions. Accessed 9/30/06. Website: http://www.imo.org.
International Maritime Organization (IMO). 2007. Resolution A.1005(25). Application of the International Convention for the Control and Management of Ships' Ballast Water and Sediments, 2004. Adopted on 29 November 2007. A 25/Res.1005. 4 December 2007.
International Maritime Organization (IMO). 2008. Summary of Conventions as of 30 June 2008. Accessed: August 15, 2008. Website: http://www.imo.org.
Jassby, A.D., J.E. Cloern, and B.E. Cole. 2002. Annual primary production: patterns and mechanisms of change in a nutrient-rich tidal ecosystem. Limnology and Oceanography. 47: 698-712.
Lavoie, D.M., L.D. Smith, and G.M. Ruiz. 1999. The potential for intracoastal transfer of non-indigenous species in the ballast water of ships. Estuarine, Coastal and Shelf Science. 48: 551-564.
Lewis, J. 2002. Hull fouling as a vector for the translocation of marine organisms phase 3: The significance of the prospective ban on tributyltin antifouling paints on the introduction and translocation of marine pests in Australia. Report No. 2 for the Departments of Agriculture, Fisheries and Forestry- Australia.
97

MacIsaac, H.J., T.C. Robbins, and M.A. Lewis. 2002. Modeling ships’ ballast water as invasion threats to the Great Lakes. Canadian Journal of Fisheries and Aquatic Science, 59: 1245-1256.
Marine Environment Protection Committee (MEPC). 2003. Comments on draft Regulation E-2. Concentrations of organisms delivered in ships' ballast water in the absence of any treatment: Establishing a baseline for consideration of treatment efficacy. Submitted by the International Council for the Exploration of the Sea (ICES). MEPC 49/2/21. 23 May 2003.
Martel, A.L., D.A. Pathy, J.B. Madill, C.B. Renaud, S.L. Dean, and S.J. Kerr. 2001. Decline and regional extirpation of freshwater mussels (Unionidae) in a small river system invaded by Dreissena polymorpha: The Rideau River, 1993-2000. Canadian Journal of Zoology. 79: 2181-2191.
Minchin, D., and S. Gollasch. 2003. Fouling and ships’ hulls: How changing circumstances and spawning events may result in the spread of exotic species. Biofouling. 19: 111-122.
Minton, M.S., E. Verling, A.W. Miller, and G. M. Ruiz. 2005. Reducing propagule supply and coastal invasions via ships: effects of emerging strategies. Frontiers in Ecology and the Environment. 3(6): 304- 308.
Murphy, K., J. Boehme, C. Brown, M. Noble, G. Smith, D. Sparks, and G. Ruiz. 2007. Ballast Water Exchange Verification: Testing Application of Chemical Tracers on the U.S. Pacific Coast. Final Report submitted to CSLC.
National Research Council. 1996. Stemming the Tide: Controlling Introductions of Nonindigenous species by ship’s ballast water. National Academy Press, Washington D.C. 141 pp.
Nehring, S. 2001. After the TBT era: alternative anti-fouling paints and their ecological risks. Senckenbergiana Maritime. 31: 341-351.
Nendza, M. 2007. Hazard assessment of silicone oils (polydimethylsiloxanes, PDMS) used in antifouling/foul-release-products in the marine environment. Marine Pollution Bulletin. 54: 1190-1196.
New Zealand Ministry of Fisheries. A guide to New Zealand ballast water controls. Accessed 24 March 2005. Website: http://www.fish.govt.nz/sustainability/biosecurity/ballastwater.html
Nichols, F.H., J.K. Thompson, and L.E. Schemel. 1990. Remarkable invasion of San Francisco Bay (California, USA) by the Asian clam Pomtamocorbula amurensis. II. Displacement of a former community. Marine Ecology Progress Series. 66: 95-101.
98

Northwest Environmental Advocates v. U.S. EPA, No. C 03-05760 SI, 2006 U.S. Dist. LEXIS 69476 (N.D. Cal. Sept. 18, 2006)
Oviatt, C., P. Hargraves, R. Kelly, M. Kirs, L. Maranda, B. Moran, D. Outram, D. Smith, B. Sullivan, and K. Whitman. Toxicity of Chlorine Dioxide to Ballast Water Flora and Fauna in Bench Scale Assays. Graduate School of Oceanography. University of Rhode Island. November 2002.
Parsons, M.G. 1998. Flow-through ballast water exchange. Society of Naval Architects and Marine Engineers, Transactions. 106: 485-493.
Pleus, A. (Personal communication, August 26, 2008)
Pimentel, D., R. Zuniga, and D. Morrison. 2005. Update on the environmental and economic costs associated with alien-invasive species in the United States. Ecological Economics. 52: 273-288.
Rahel, F.J. and J.D. Olden. 2008. Assessing the effects of climate change on aquatic invasive species. Conservation Biology. 22: 521-533.
Ricciardi, A. and H.J. MacIsaac. 2008. Letter to the editor. Ecological Applications. 18: 1321-1323.
Rudnick, D., T. Veldhuizen, R. Tullis, C. Culver, K. Hieb, and B. Tsukimura. 2005. A life history model for the San Francisco Estuary population of the Chinese mitten crab, Eriocheir sinensis (Decapoda: Grapsoidea). Biological Invasions, 7: 333-350.
Rudnick, D.A., K.M. Halat, and V.H. Resh. 2000. Distribution, Ecology and Potential Impacts of the Chinese Mitten Crab (Eriocheir sinensis) in San Francisco Bay. University of California Water Resources Center. Riverside, CA. Contribution No. 206. 74 pp.
Ruiz, G.M. and D.F. Reid. 2007. Current State of Understanding about the Effectiveness
of Ballast Water Exchange (BWE) in Reducing Aquatic Nonindigenous Species (ANS) Introductions to the Great Lakes Basin and Chesapeake Bay, USA: Synthesis and Analysis of Existing Information. NOAA Technical Memorandum GLERL-142
Ruiz, G.M. (Personal communication, 8/14/08)
99

Ruiz, G.M. and J.T. Carlton. 2003. Invasion vectors: A conceptual framework for management. In Invasive species, vectors and management strategies. Pp. 459-498. G.M. Ruiz and J.T. Carlton eds. Island Press, Washington D.C.
Ruiz, G.M., C. Brown, G. Smith, B. Morrison, D. Ockrassa, and K. Nekinaken. March 2005. Analysis of Biofouling Organisms Associated with the Hulls of Containerships Arriving to the Port of Oakland: A Pilot Study. In Biological Study of Container Vessel at the Port of Oakland. Smithsonian Environmental Research Center. Chapter 4 (141-156).
Ruiz, G.M., P.W. Fofonoff, J.T. Carlton, M.J. Wonham, and A.H. Hines. 2000a. Invasion of coastal marine communities in North America: Apparent patterns, processes, and biases. Annual Review of Ecology and Systematics. 31: 481-531.
Ruiz, G.M., T.K. Rawlings, F.C. Dobbs, L.A. Drake, T. Mullady, S. Schoenfeld, A. Hug, and R.R. Colwell. 2000b. Global spread of microorganisms by ships. Nature. 408: 49-50.
Simkanin, C. and M. Sytsma. 2006. Oregon Ballast Water Task Force Report on Ballast Water Management in Oregon. Portland State University. 51 pp.
Spellman, M. (Personal communication, 8/14/08)
Takata., L., Falkner, M., Gilmore, S. 2006. California State Lands Commission Report on commercial vessel fouling in California: Analysis, evaluation, and recommendations to reduce nonindigenous species release from the non-ballast water vector. 76 pgs.
Tamburri M., G. M. Ruiz, and P. D. McNulty. 2005. Shipboard Prototype Evaluations of Venturi Oxygen Stripping During Continuous Routine Vessel Operations.
Phase IV: Prototype Ballast Water Treatment Technology Field Tests in Conjunction with STEP. University of Maryland Center for
Environmental Science. Draft Proposal for the California State Lands Commission.
Transport Canada. 2006. Canada shipping act - ballast water control and management regulations. Accessed 18 October 2006. Website: http://www.tc.gc.ca/acts-regulations/GENERAL/C/csa/regulations/400/csa448/csa448.html
United States Coast Guard. 2001. Report to Congress on the voluntary national guidelines for ballast water management. Appendix B: Status and trends of ballast water management in the United States. Biennial Report for the National Ballast Information Clearinghouse. 45 pp.
United States Commission on Ocean Policy. 2004. An Ocean Blueprint for the 21st Century. Final Report. Washington, DC. 520 pp.
100

Washington Department of Fish and Wildlife. 2003. Washington state ballast water program. Accessed 18 October 2006. Website: http://www.wdfw.wa.gov/fish/nuisance/ballast.htm.
Wonham, M.J., W.C. Walton, G.M. Ruiz, A.M. Frese, and B.S. Galil. 2001. Going to the source: role of the invasion pathway in determining potential invaders. Marine Ecology Progress Series, 215: 1-12.
Woodfield, R. 2006. Invasive seaweed threatens California’s coastline – an update. Ballast Exchange: Newsletter of the West Coast Ballast Outreach Project. 6: 10-11.
Zhang, F. and M. Dickman. 1999. Mid-Ocean exchange of container vessel ballast water. 1: Seasonal factors affecting the transport of harmful diatoms and dinoflagellates. Marine Ecology Progress Series. 176: 243-251.
101