draft central bank of trinidad and tobago nnual … · e. conomic . d. evelopments in . 2018. and ....
TRANSCRIPT

1
Central Bank of trinidad and toBago
annual eConomiC Survey 2017
8
DRAFT

CHARTS ON SELECTED ECONOMIC INDICATORS
CHART 1 REAL GDP GROWTH, 2012 - 2018
CHART 3 LABOUR FORCE AND UNEMPLOYMENT
2012- 2017
CHART 5 FISCAL BALANCES IN PER CENT OF GDP
2014/15-2018/19
CHART 2 CRUDE OIL AND NATURAL GAS PRICES
2014-2018
CHART 4 PER CENT CHANGES IN RETAIL PRICE INDEX,
2014-2018
CHART 6 PUBLIC SECTOR DEBT
SEPTEMBER 2014- SEPTEMBER 2018

CHARTS ON SELECTED ECONOMIC INDICATORS
CHART 7 AGGREGATE MUTUAL FUND VALUES VS.
COMMERCIAL BANKS' DEPOSITS 2014-2018
CHART 9 BASIC PRIME LENDING RATE, REPO RATE AND
3 MTH TREASURY BILL RATE 2014-2018
CHART 11 COMMERCIAL BANKS' EXCESS RESERVES 2018
CHART 8 TRINIDAD AND TOBAGO STOCK PRICE INDICES
2013-2018
CHART 10 CREDIT TO THE PRIVATE SECTOR
2013-2018
CHART 12 AUTHORIZED DEALERS PURCHASES AND SALES OF
FOREIGN CURRENCY, 2014-2018

CHARTS ON SELECTED ECONOMIC INDICATORS
CHART 13 GROSS OFFICIAL RESERVES AND IMPORT COVER, 2013-2018
CHART 14 MONETARY POLICY ACTIONS, 2018
March 2017: $1.5 billion 1-year special deposit matured
and was not rolled over.
August 2018: The secondary reserve requirement was
discontinued.
Jan 2017: 'Repo' rate maintained at 4.75 per cent.
Mar 2017: 'Repo' rate maintained at 4.75 per cent.
May 2017: 'Repo' rate maintained at 4.75 per cent.
Jul 2017: 'Repo' rate maintained at 4.75 per cent.
Sep 2017: 'Repo' rate maintained at 4.75 per cent.
Nov 2017: 'Repo' rate maintained at 4.75 per cent.
Dec 2017: 'Repo' rate maintained at 4.75 per cent.
Jan 2018: 'Repo' rate maintained at 4.75 per cent.
Mar 2018: 'Repo' rate maintained at 4.75 per cent.
Jun 2018: 'Repo' rate increased to 5.00 per cent.
Sep 2018: 'Repo' rate maintained at 5.00 per cent.
Dec 2018: 'Repo' rate maintained at 5.00 per cent.

1
CHAPTER ONE – OVERVIEW OF ECONOMIC DEVELOPMENTS IN 2018 AND PROSPECTS FOR
2019
OVERVIEW OF ECONOMIC DEVELOPMENTS IN 2018
Global economic growth slowed in 2018…
The global economy performed worse than expected in 2018, because of slower growth in
international trade and investments, intensified trade tensions between the United States (US)
and China, prolonged Brexit uncertainty and tightened financial conditions. Meanwhile, energy
prices strengthened in the second half of 2018, partly owing to fears of global supply shortfalls
ahead of the imposition of US sanctions on Iranian output announced to come into effect in
November 2018.
Among the Advanced Economies (AEs), real GDP growth decelerated with the exception of the
US. A slowdown in business investment dampened economic growth in the UK, while slowing
net exports and softer external demand contributed to the decline in real output in the Euro
area. Further, temporary disruptions caused by bad weather and natural disasters led to the
economic slowdown in Japan in 2018. Amidst strong economic gains in the US, the Federal
Reserve increased its target range for its benchmark rate (the Federal funds rate) on four
occasions by December 2018. The gradual reversal from unconventional monetary policy in the
US, coupled with pressures on the external account, posed challenges for the Emerging Market
and Developing Economies (EMDEs) in 2018. Rising inflationary pressures as a result of
exchange rate pass through from depreciated currencies led to restrictive monetary policy in
some EMDEs. Growth in these economies moderated in 2018 due to the weaker than expected
recovery in commodity export markets and in domestic demand.
Economic performance was mixed in the Latin American and Caribbean (LAC) region. Growth
was stymied by lower private investment arising from uncertainty as the North America Free
Trade Agreement (NAFTA) was being renegotiated, the currency crisis in Argentina, the
May/June trucker’s strike in Brazil and worsening sociopolitical conditions in Venezuela. In the
Caribbean real output expanded in Jamaica, Guyana and the Eastern Caribbean Currency
Union (ECCU) but fell off in Barbados. In October 2018, the International Monetary Fund (IMF)
approved a US$290.0 million Extended Fund Facility (EFF) in support of the Barbados
Economic Recovery and Transformation (BERT) Plan. The BERT is aimed at restoring growth
and fiscal sustainability.
But the domestic economy improved on the strength of the energy sector…
According to initial projections from the Central Statistical Office (CSO), real GDP grew by 1.9
per cent in 2018 after declining by 1.9 per cent in 2017. The energy sector grew by 2.4 per cent
while the non-energy sector remained flat. The Central Bank’s Quarterly Index of Economic
Activity (QIEA) shows that energy output was boosted by higher natural gas production (6.5 per
cent) owing to new output from the Juniper gas project. Crude oil production, however, declined
by 11.6 per cent given continued challenges in maintaining crude output from mature acreage.
On the whole, refinery throughput fell by 9.3 per cent, with a sharp decline being observed

2
following the closure of the Petrotrin refinery in November 2018. Moreover, the output of
petrochemicals slipped given stoppages for maintenance at various plants across the industry.
Outside of energy, several of the non-energy sectors including construction and distribution
remained weak over the period.
Inflation remained generally low while unemployment conditions deteriorated…
Headline inflation averaged 1.0 per cent in 2018, down from 1.9 per cent in 2017. Core inflation
measured 1.0 per cent while food inflation was marginally higher at 1.1 per cent. Food prices
were relatively well contained in 2018, aided by lower international food prices. According to
latest available data from the CSO, the unemployment rate increased to 4.8 per cent in 2017
from 4.0 per cent in 2016. In the absence of official unemployment statistics for 2018,
retrenchment notices, a supplementary indicator of job separation, suggest an increase in job
losses in 2018, particularly in the petroleum and gas and transport, storage and communication
services sub-sectors.
Central Government’s fiscal position strengthened…
Higher energy and non-energy receipts and lower expenditure resulted in a decline in the fiscal
deficit in 2018. In FY2017/18, Central Government’s total revenue increased by roughly $6.0
billion, while expenditure fell by $2.1 billion. This resulted in the fiscal accounts recording an
overall deficit of $5.4 billion (3.4 per cent of GDP) in FY2017/18 compared with a deficit of $13.5
billion (9.1 per cent of GDP) one year earlier.
As monetary policy tightened…
The Repo rate ended the year at 5.00 per cent in 2018 after the Central Bank increased it by 25
basis points in June 2018. In light of low inflation and a still recovering economy the Bank
decided to hold the Repo rate steady at its monetary policy meetings in September and
December 2018. Additionally, in August 2018 the Bank removed the Secondary Reserve
Requirement, which was set at 2.0 per cent of commercial banks’ prescribed liabilities. This
was in keeping with the Bank’s aim to move away from direct tools of monetary policy towards
more market-based measures. Though net domestic fiscal injections increased markedly in
2018, active liquidity management by the Bank ensured that excess liquidity remained well
contained. The Central Bank continued to support the foreign exchange market by conducting
periodic foreign currency interventions. While commercial bank interest rates declined slightly,
private sector credit expanded throughout the year supported mainly by growth in consumer and
real estate lending. Meanwhile, growing at an average rate of 2.6 per cent, lending to
businesses was subdued during the year.

3
OUTLOOK
Globally, macroeconomic vulnerabilities may intensify…
Global economic growth is anticipated to lose further momentum in 2019. The IMF in its April
2019 World Economic Outlook (WEO) projects growth for 2019 at 3.3 per cent, down from the
estimated 3.6 per cent in 2018. Meanwhile, the LAC region is projected to grow by 1.4 per cent
in 2019, somewhat above the 1.0 per cent growth rate of 2018.
While domestically, the strength of the natural gas industry continues to lead the growth
recovery…
The domestic economy is expected to receive a boost in 2019 from the startup of the Angelin
platform during the first quarter. This is projected to drive growth in natural gas-based industries
such as LNG and petrochemicals. Moreover, the non-energy sector could rebound on account
of spillovers from the energy sector. Positive non-energy sector performance could ameliorate
labour market conditions as job losses may be contained. Additionally, while domestic
inflationary pressures are expected to remain low in 2019, the forecasted harsh dry season
could lead to a rise in the cost of local food produce.
Downside risks remain for the energy sector over the medium term…
Crude supply restrictions are expected to add upward momentum to crude prices in 2019. A 1.2
million b/d cut to global output by the OPEC/non-OPEC consortium over the first half of the
year, coupled with US sanctions on the purchase of Iranian and Venezuelan crude have already
translated into higher prices1. Meanwhile, improvements in the non-energy sector may depend,
inter alia, on stimulus from the government primarily through the implementation of the public
sector investment programme.
1 On January 28 2019, the US imposed sanctions on Venezuela’s oil industry. These sanctions aim to freeze the sale of some 0.5
million barrels of oil per day to US oil companies, while US refiners are no longer allowed to pay for shipments of oil directly to the state-owned Petróleos de Venezuela (PDVSA). Payments are instead held in escrow accounts in the US. The US is one of Venezuela’s primary oil markets.

4
TABLE 1
TRINIDAD AND TOBAGO SELECTED ECONOMIC INDICATORS
2013 2014 2015 2016 2017 2018
Real GDP Growth (%) (2000 = 100)
1 2.0 -1.0 1.8 -6.5 -1.9 1.9
Energy Sector 3.7 -3.8 -0.9 -9.8 1.1 2.4 Non-energy Sector 1.9 1.3 2.1 -3.5 -3.5 0.0 Agriculture, forestry and fishing -2.0 -9.9 25.1 -15.3 21.5 -15.6 Trade and repairs 0.5 0.3 3.6 -7.2 -11.3 -1.2 Construction 7.7 1.3 -2.7 -4.2 -4.1 -3.3 Financial and Insurance Activities 2.1 0.2 3.4 2.4 0.9 1.1
Inflation Rate (%)2
(period average) 5.2 5.7 4.7 3.1 1.9 1.0 (end of period) 5.6 8.5 1.5 3.1 1.3 1.1 Unemployment Rate (%)
3 3.7 3.3 3.4 4.0 4.8 n.a.
PER CENT OF GDP
Overall Central Government Operations Surplus(+)/Deficit(-), (end of fiscal year)
-2.9
-2.5
-1.7
-5.4
-9.1
-3.4
Public Sector Debt, (end of fiscal year)4 38.4 40.4 53.8 59.3 62.7 61.0
Central Government External Debt, (end of fiscal year) Balance of Payments Current Account Balance Surplus(+)/Deficit(-)
5.3
19.9
7.2
14.5
8.4
7.4
14.4
-3.9
15.7
4.9
15.8
4.6*
MEMORANDUM ITEMS:
Central Government External Debt in US$M (end of fiscal year) 1,481.8 2,072.1 2,171.8 3,149.3 3,471.2 3,629.3
Debt Service Ratio (fiscal year; %)5 1.0 1.0 1.2 1.8 2.1 2.0
W.T.I. (US$/barrel, annual average) 97.9 93.1 48.7 43.2 50.9 64.8 Net Official Reserves (US$Mn)
6 10,175.9 11,497.1 9,933.0 9,465.8 8,369.8 7,575.0
Sources: Central Bank of Trinidad and Tobago, Central Statistical Office and Ministry of Finance
1 Real GDP growth rates are sourced from the Central Statistical Office. 2 Changes in the Index of Retail Prices (RPI), January 2015 = 100. 3 This represents the average of the four quarters. 4 Includes the external and internal debt of the Central Government, as well as contingent liabilities but excludes Treasury Bills, OMO
Bills and Notes, Treasury Bonds and Liquidity Bonds. 5 This is defined as the ratio of external Central Government debt service to exports of goods and non-factor services. 6 International reserves have been revised to include Trinidad and Tobago’s reserve position in the IMF. International reserves are
defined as external assets that are readily available to and controlled by monetary authorities for direct financing of payments imbalances, for indirectly regulating the magnitudes of such imbalances through intervention in exchange markets and for other purposes. Typically, they include securities, gold, IMF special drawing rights (SDRs), a country’s holding of foreign currency and deposits, reserve position in the IMF, and other claims (Balance of Payments Manual 6th Edition Paragraph 6.64).
January to September 2018.

5
CHAPTER TWO – DOMESTIC ECONOMIC ACTIVITY
The Central Statistical Office (CSO) estimated that the domestic economy recorded
positive growth in 20182. According to CSO’s projections published in the 2018 Review of the
Economy, real Gross Domestic Product (GDP) increased by 1.9 per cent in 2018 on account of
an expansion in the energy sector (2.4 per cent) and a flat performance in the non-energy
sector (0.0 per cent) (Table 1). The improvement followed two successive years of negative
economic growth: real GDP declined by 1.9 per cent in 2017 and by 6.5 per cent in 2016.
Indicators of economic activity monitored by the Central Bank3 (See Box 1) also suggest
an uptick in the energy sector during 2018. Exploration and production activity in the
upstream subsector was boosted by higher natural gas output, which was largely facilitated by
the Juniper platform. However, crude oil production, rig days and depth drilled continued to
decline. The performance of the midstream sub-sector was mixed. Liquefied Natural Gas
(LNG) production was strong (13.5 per cent), reflective of a recovery from the maintenance
programme at Atlantic LNG Train 4 one year earlier. In contrast, the production of natural gas
liquids (NGL’s) fell by 11.3 per cent as yields are being affected by the extraction of increasingly
dry natural gas. Meanwhile, refinery throughput declined, partly due to the closure of Petrotrin’s
refinery operations. The downstream petrochemical sub-sector also declined as lower ammonia
(3.8 per cent) output outstripped the increase in the output of urea. Fertilizer output was
adversely affected by the increased downtime at two ammonia plants—CNC and Tringen II.
Methanol output dipped because of maintenance activity at the M5000 facility in October 2018.
Non-energy sector indicators monitored by the Central Bank suggest a flat performance
for 2018. Economic activity in the construction sector remained muted as reflected by industry
data, which show that during the year local sales of cement declined by 2.7 per cent. The
performance of the finance, insurance, real estate and other business services sector was held
back by less buoyant activity in the commercial bank sub-industry. Meanwhile, lower domestic
demand affected activity in the manufacturing sector. Manufacturers continued to operate with
considerable spare capacity, producing at 66.4 per cent of their capability over 2018, which was
the lowest level since 2014 (Table 2). The food, drink and tobacco sub-sector saw a particularly
sharp falloff in capacity usage in 2018. Within the transport, storage and communications
sector, preliminary data show increased activity at the ports and in the local passenger road
transport sub-industry, but slowdowns in the airline transport and telecommunications sub-
industries.
2 The CSO currently publishes GDP statistics in accordance with the International Standard Industrial Classification of All
Economic Activities, Revision 4 (ISIC Rev 4). Under ISIC Rev 4, the largest industries, measured as a per cent of GDP, are Trade and Repairs (20.5 per cent), Manufacturing (15.9 per cent) and Mining and Quarrying (15.5 per cent). Prior to 2017, GDP statistics were compiled in accordance with the Trinidad and Tobago System of National Accounts (TTSNA) industry classification.
3 This refers to the Quarterly Index of Real Economic Activity (QIEA).

6
TABLE 2 MANUFACTURING SECTOR CAPACITY UTILISATION RATE
2011 2012 2013 2014 2015 2016 2017 2018
Manufacturing 68.4 65.0 66.2 70.8 69.0 69.3 69.0 66.4
Food, Drink & Tobacco 72.2 70.6 72.2 79.1 77.3 74.0 73.5 69.0
Chemicals and Non-Metallic Minerals 65.3 57.0 63.2 67.3 65.7 59.6 60.5 59.8
Assembly Type and Related Industries 60.0 55.5 54.8 49.6 43.9 63.2 62.8 61.5
Source: Central Bank of Trinidad and Tobago

7
BOX 1: QUARTERLY INDEX OF REAL ECONOMIC ACTIVITY (QIEA)
INTRODUCTION
The Quarterly Index of Real Economic Activity is a base-weighted Laspeyres quantity index, defined as a
weighted arithmetic average of quantity relatives with weights reflective of the base year (2010) value
added. The Index is based on indicators of production or economic activity and, in the absence of official
quarterly data from the Central Statistical Office (CSO)4, is used to estimate shorter term changes in
economic activity, which is essential in the conduct of monetary policy.
The Index originated as the Quarterly Index of Gross Domestic Product (QGDP Index), and was
introduced in 1987 by the Central Bank of Trinidad and Tobago (the Bank). In February 2017, the QGDP
Index was renamed the Quarterly Index of Real Economic Activity (QIEA Index).
REASON FOR CHANGE IN NAME OF INDEX
The purpose of the name change was to ensure greater precision in the use of the index and will more
clearly identify the Index as an indicator of quarterly movements in economic activity, rather than an
estimate of quarterly real GDP growth. Furthermore, the new name was intended to eliminate the
uncertainty that has at times arisen within the general public regarding whether the Index constitutes an
official measure of quarterly GDP growth. Official measurement of GDP falls under the purview of the
CSO.
METHODOLOGY
The QIEA Index is disaggregated into several sectors: energy, agriculture, manufacturing, construction,
distribution, water and electricity, transport, finance, government, hotels and guest houses, personal
services and education. The sectors are further broken down into sub-sectors. For each sub-sector,
suitable indicators of economic activity are selected and Laspeyres indices are computed for all
indicators. The sectoral sub-indices are then weighed to derive the sectoral indices which are further
weighted5 (based on the contribution to GDP in 2010) to produce the overall Index.
DIFFERENCE OF QIEA FROM CSO’S GDP MEASURE
The primary difference between the Bank’s Index of Economic Activity and GDP compiled by the CSO is
as follows: while the Bank produces an Index based on indicators of economic activity, the CSO produces
detailed data on both nominal and real GDP measures on an annual basis using the value added method
(gross output minus intermediate consumption). Another difference is that the Index of Economic Activity
does not cover all sub-industries measured by the CSO. For example, within the Finance Insurance, Real
Estate and All Other Business Services sector (under the former Trinidad System of National Accounts
classification), the Bank does not measure Other Business Services in its methodology. Differences also
surround the CSO’s rebasing of its GDP to a 2012 base year and change in classification structure from
the Trinidad and Tobago System of National Accounts (TTSNA) to the International Standard Industrial
Classification, Revision 4 (ISIC Rev.4) in 2017. The Bank is also working towards rebasing the QIEA and
aligning its classification to the ISIC Rev.4 classification. Table 1 outlines the sub-sectors and their
corresponding indicators used in the compilation of the QIEA Index.
4 The CSO is the official source of National Accounts Statistics. These statistics are compiled on an annual basis and published in
the Review of the Economy. The CSO is working towards the production of quarterly GDP statistics. 5 Weights measure the sectors’ contribution to GDP. Weights will not sum to 1000 since the overall weight includes the weight for
Financial Intermediation Services Indirectly Measured (FISIM).

8
TABLE 1 SECTORS AND INDICATORS
SECTORS WEIGHTS
PER 1000 INDICATORS
Energy 414.6 Output of crude oil, natural gas production and utilization, LNG output, refinery throughput, output of Natural Gas Liquids, Rig Months and petrochemicals.
Construction 69.3 Local sales of cement, mined aggregates, sales of readymix concrete, hardware and construction materials, numbers employed in construction.
Water and Electricity 13.3 Water production and electricity generation.
Distribution 183.5 Deflated Retail Sales Index.
Finance Banks, NFIs and Central Bank
109.1 65.5
Deflated values of loans, deposits, investments, and fundraising instruments for both commercial banks and NFIs, and Central Bank employment.
Real Estate 9.4 Number of real estate mortgage loans from commercial banks.
Insurance 15.5 Deflated gross premiums of insurance companies.
Other 11.7 Number of account holders for the mutual funds industry, volume of shares traded on the stock exchange and numbers employed at DIC.
Transport Post Office
60.3 13.2
Volume of mails and parcels handled by TTPOST.
Airlines 14.1 Passenger arrivals and departures for all airlines.
Port 3.4 Number of containers handled by the Port of Port-of-Spain and Port of Point Lisas.
Telecommunications 22.4 Call minutes (mobile, fixed and international markets) for all service providers, internet subscriptions and pay television subscriptions.
Taxis, car rentals and Trucks 19.4 Number of trucks, hired cars and rental cars insured - quarterly insurance survey.
Government 76.8 Numbers employed.
Education 27.8 Student enrollment statistics.
Manufacturing 67.9 Output of surveyed manufacturing firms.
Agriculture 4.1 Agriculture output from NAMDEVCO and CSO.
Personal Services 11.8 Numbers employed.
Hotels & Guest Houses 4.3 Number of rooms sold.

9
CHAPTER THREE – LABOUR MARKET
UNEMPLOYMENT
Latest official labour market statistics from the Central Statistical Office (CSO) indicate
that unemployment rose in 2017. The unemployment rate increased to 4.8 per cent in 2017
from 4.0 per cent in 2016 (Table 3). The number of persons with jobs fell by 9.9 thousand
persons in 2017, with 5.3 thousand of these persons continuing to actively seek employment
(“unemployed” persons). However, 4.6 thousand persons left the labour force, contributing to a
labour force participation rate6 of 59.2 per cent in 2017 compared with 59.7 per cent in 2016.
Both male and female labour force participation has been declining since 2014 but the falloff
has been greater for males.
Most of the job losses during 2017 occurred in the construction sector (including water
and electricity service companies), where there were 12.0 thousand fewer persons
employed. Job losses also occurred in the energy (3.9 thousand jobs), community, social and
personal services (2.7 thousand jobs), and transport, storage and communications (1.9
thousand jobs) sectors (Table 4). On the other hand, employment grew in the wholesale and
retail trade (6.8 thousand jobs) and agriculture (2.5 thousand jobs) sectors.
Data released by the Ministry of Labour and Small Enterprise Development showed that
during 2018, the number of retrenched workers7 rose by over 40.0 per cent to 1,623
persons. Most of these retrenchments occurred in the transport, storage and communication
(626); finance, insurance, real estate and business services (295); energy (including production,
refining, and service contractors) (258); and manufacturing (171) industries. Added to this were
job cuts by Petrotrin of approximately 5,000 workers (3,500 permanent workers and 1,500
temporary workers).
6 The CSO defines the labour force participation rate as the proportion of the non-institutional population that is economically active
(i.e., the proportion of the working age population (15 years and older) that is either employed or actively seeking employment). 7 Retrenchment refers to the termination of employment of a worker at the initiative of an employer for the reason of redundancy
according to the Retrenchment and Severance Benefits Act (No. 32 of 1985). The act states that, “where an employer proposes to terminate the services of five or more workers for the reason of redundancy he shall give formal notice of termination in writing to each involved worker, to the recognised majority union and to the Minister of Labour”. As such, if fewer than five employees are terminated, employers are not obligated to report to the Ministry. This indicator for job separation is therefore limited insofar as it only includes registered retrenchment notices, and does not capture other forms of job separation, especially the non-renewal of contracts of temporary or short-term workers. Furthermore, reports of job losses at establishments cannot be equated with an equal rise in the unemployment rate. Data on the labour market are not collected from firms and other establishments but from households via the conduct of the Continuous Sample Survey of Population (CSSP). Moreover, persons who have been retrenched or who have lost their jobs otherwise (expired contract, retired, etc.) and have not sought re-employment during the reference period are not classified as unemployed.

10
TABLE 3
LABOUR FORCE STATISTICS: 2012-2017
/Thousands/1
2012 2013 2014 2015 2016 2017
Non-Institutional Population
- 15 years and over 1,044.1 1,059.6 1,063.4 1,065.1 1,068.5 1,071.2
Labour Force 646.0 650.2 658.6 645.3 638.3 633.7
Persons with jobs 614.0 626.3 636.9 623.3 613.1 603.1
Persons without jobs 32.0 23.9 21.8 22.0 25.3 30.6
Participation Rate (%) 61.9 61.4 62.3 60.6 59.7 59.2
Male 72.2 71.6 72.2 71.2 69.5 68.9
Female 51.7 51.2 50.2 50.0 50.1 49.5
Unemployment Rate (%) 5.0 3.7 3.3 3.4 4.0 4.8
Male 4.1 3.0 2.8 2.9 3.9 4.3
Female 6.2 4.6 4.0 4.2 4.0 5.7
Source: Central Statistical Office 1 Numbers may not sum due to rounding.
TABLE 4 THE SECTORAL DISTRIBUTION OF EMPLOYMENT
1
2016 2017
(000 s) % (000 s) %
Agriculture 19.8 3.2 22.3 3.7
Petroleum & Gas 18.4 3.0 14.5 2.4
Manufacturing (including Mining & Quarrying) 48.3 7.9 48.9 8.1
Construction (including Electricity & Water) 100.7 16.4 88.6 14.7
Transport, Storage & Communications 44.5 7.3 42.6 7.1
Other Services 381.5 62.2 386.1 64.0
Of which: Wholesale & Retail 112.2 18.3 119.0 19.7
Community, Social & Personal Services 209.5 34.2 206.8 34.3
Finance, Insurance & Real Estate 58.2 9.5 58.3 9.7
Not classified 1.6 0.3 2.0 0.3
Total Employment 613.2 100.0 603.1 100.0
Source: Central Statistical Office
1 Numbers may not sum due to rounding.

11
LABOUR PRODUCTIVITY8
During 2018, labour productivity improved, reflecting higher production levels and fewer
hours worked in both the energy and non-energy sectors. On the whole, the Index of
Productivity increased by 7.4 per cent over the year. With the energy sector excluded, the
increase in productivity was higher—13.7 per cent—as the decline in oil and natural gas refining
(9.6 per cent) pulled down the overall Productivity Index. The overall Index of Domestic
Production increased by 4.0 per cent, while the Index of Hours Worked fell by 3.1 per cent. In
the non-energy sector, the largest increase in productivity was recorded in the drink and
tobacco industry (26.3 per cent) mainly due to higher alcoholic beverage production over the
period. Productivity increases also occurred in the food processing (16.4 per cent);
miscellaneous manufacturing, which include the production of leather, ceramic products,
jewellery, and other products (7.6 per cent); and chemicals (4.1 per cent) industries.
WAGES
In an environment of low inflation, wage growth remained moderate during 2018. On the
basis of Collective Agreements registered at the Industrial Court, the median wage increase
measured 3.0 per cent, unchanged from 2017 (Table 5). Wage growth slowed in the
distribution, petroleum, construction and food processing industries but accelerated in the
finance and chemicals sectors. Wage increases for 2018 ranged between 2.0 and 7.0 per cent
compared with 0.0 to 7.0 per cent in 2017. Wage growth was lowest in the transportation,
chemicals, petroleum, manufacturing and food processing industries where pay increases
averaged 2.0 per cent in 2018.
Meanwhile, the Index of Average Weekly Earnings (AWE) rose by 5.9 per cent during
2018, compared with an increase of 1.0 per cent in 2017. The most substantial increase
occurred in the energy industry in oil refining, which jumped by 17.5 per cent during 2018.
However, in the non-energy sector, earnings rose by 0.7 per cent over the period as declining
wages in the clothing, electricity, and food processing industries weighed down wage growth in
the assembly, printing, wood, and miscellaneous manufacturing sub-sectors.
8 Labour productivity is calculated for the manufacturing, energy, electricity, and water sectors and is measured by the Index of
Productivity which is calculated as the ratio of the Index of Domestic Production to the Index of Hours Worked.

12
INDUSTRIAL RELATIONS
In 2018, public and private companies continued to streamline their business operations
leading to workforce reductions in some instances. As a result, there were episodes of
industrial action by workers and their representative trade unions. Most notably, during 2018,
the Government announced plans to close the state-owned oil refinery, Petrotrin, and
restructure its Exploration and Production (E&P) section. This triggered protest action by the
Oilfield Workers Trade Union (OWTU) and several other trade unions and civil society
organisations. Additionally, the Telecommunications Services of Trinidad and Tobago (TSTT)
made several positions redundant (for example, payroll clerk, accounts clerk, billing attendant,
customer service representative, labourer, and others) to facilitate the company’s “digital
transformation” strategy. In response to the company’s decision, the workers representative
union, the Communications Workers Union (CWU), attempted to prevent impending
retrenchments at TSTT by filing an injunction with the Industrial Court. However, in November
2018, TSTT issued letters of redundancy to over 500 workers.

13
TABLE 5 WAGE INCREASES FOR 2018
SECTOR NO. OF
AGREEMENTS
ANALYSED
DURATION OF
AGREEMENTS
RANGE OF
YEARLY
INCREASES FOR
2018
AVERAGE
WAGE
INCREASE
FOR 2018
MEDIAN WAGE
INCREASE FOR
AGREEMENTS
ANALYSED
Finance, Insurance, Real Estate and Business Services
7 2016-2019 3.00-7.00 3.71
3.0
Distribution 6 2015-2020 3.00-4.00 3.50
Printing, Publishing and Paper Converters 1 2017-2019 2.50 2.50
Transportation, Communication and Storage
2 2015-2019 2.00-3.00 2.50
Chemicals and Non-Metallic Minerals 2 2016-2018 2.00-3.00 2.50
Petroleum and Other Mining Industries 1 2016-2019 2.00 2.00
Manufacturing 4 2016-2020 2.00-5.00 3.75
Personal Services 1 2015-2018 3.00 3.00
Construction 2 2015-2020 3.00-4.00 3.50
Food Processors and Drinks 2 2016-2019 2.00-3.00 2.50
Source: Industrial Court of Trinidad and Tobago

14
CHAPTER FOUR – PRICES
INFLATION
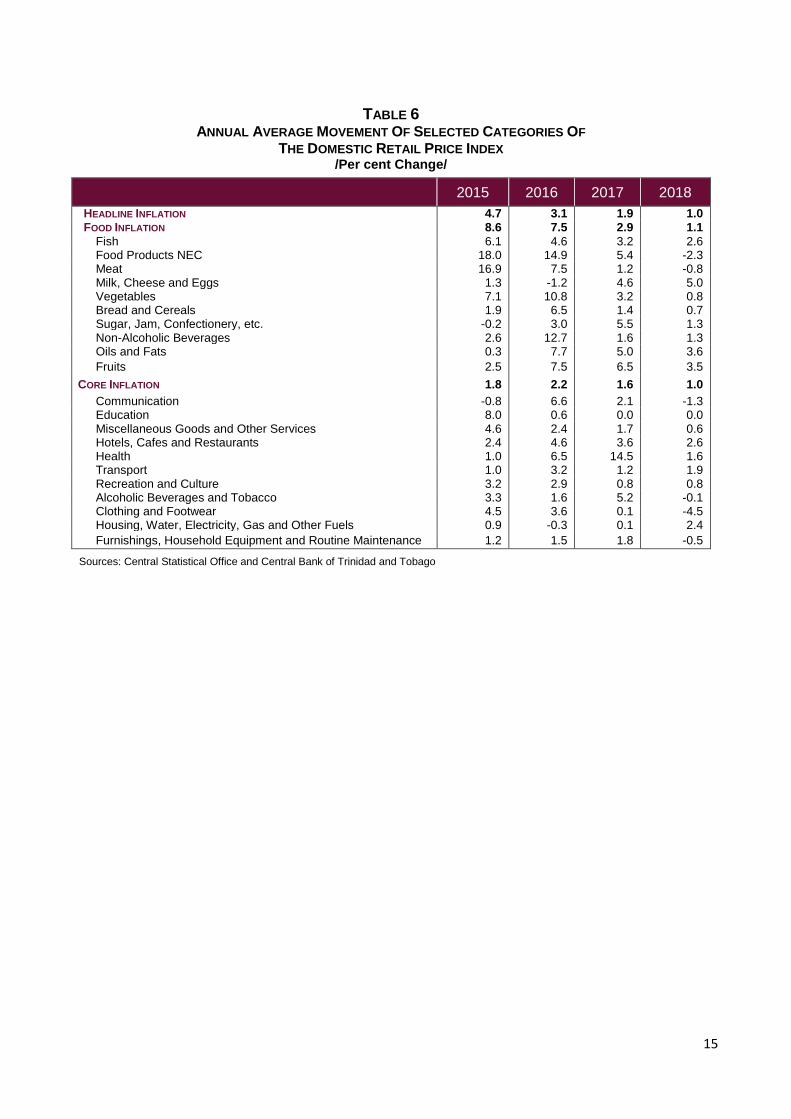
Inflation remained low and stable throughout 2018, influenced by monetary policy, low
demand and falling international food prices. Headline inflation averaged 1.0 per cent in
2018 compared to 1.9 per cent a year earlier and displayed little variability during the year,
moving from 0.9 per cent in January to 1.1 per cent by the end of 2018.
Core inflation averaged 1.0 per cent in 2018. Core inflation moved from 0.5 per cent in
January 2018 to 1.3 per cent in December 2018, largely impacted by relatively stronger price
movements in the transportation and housing sub-indices. The transportation sub-index rose in
the fourth quarter of 2018, influenced by higher fuel prices announced in the National Budget on
October 1, 2018. Meanwhile, an increase in the cost of home ownership underpinned the
upward momentum in the housing sub-index. Conversely, these increases were moderated by
declines in the clothing and footwear sub-category.
Food inflation was relatively well contained in 2018, averaging 1.1 per cent. This
compares with food inflation of 2.9 per cent in 2017. The downward momentum quickened
during the second half of the year with strong declines in vegetable prices in August (-3.8 per
cent); prices of Food Products N.E.C.9 in September (-9.7 per cent); and meat prices in
December (-6.1 per cent). Food prices were also tempered by falling international food prices.
In 2018 the UN Food and Agriculture Organisation food price index edged down by 2.5 per cent.
PRODUCERS’ PRICES
Producer price inflation declined in 2018, supporting the low inflationary conditions at
the retail level. The Producer Prices Index (PPI) declined 0.3 per cent in 2018 following
increases of 1.9 per cent in 2017 and 1.2 per cent in 2016. The decline in the PPI was driven
mainly by a 5.5 per cent decline in the chemicals and non-metallic products sub-index, which
saw notable declines in the price of cement (-15.1 per cent) and Readymix concrete (-10.1 per
cent). Elsewhere in the index, the printing, publishing and paper converters sub-index
registered a 2.3 per cent increase as paper converters prices increased 5.2 per cent. All other
sub-indices registered marginal price increases with the exception of textiles garments and
footwear, which remained unchanged from 2017 levels.
BUILDING MATERIALS PRICES
Building material prices garnered strength in 2018. The Index of Retail Prices of Building
Materials (BMI) registered growth of 4.5 per cent during the year. This follows declines of 0.4
per cent in 2017 and 0.3 per cent in 2016. All sub-indices of the BMI registered an increase
from 2017 levels, with the largest surge seen in the electrical installation and fixtures sub-index
(6.4 per cent), followed by the wall and roof sub-index (6.3 per cent). The increases in the BMI
coincided with the faster price increases seen in the housing sub-index of the retail prices index
(RPI), suggesting that there was some pass-through to consumers.
9 Not Elsewhere Classified.
15
TABLE 6 ANNUAL AVERAGE MOVEMENT OF SELECTED CATEGORIES OF
THE DOMESTIC RETAIL PRICE INDEX /Per cent Change/
2015 2016 2017 2018
HEADLINE INFLATION 4.7 3.1 1.9 1.0 FOOD INFLATION 8.6 7.5 2.9 1.1
Fish 6.1 4.6 3.2 2.6 Food Products NEC 18.0 14.9 5.4 -2.3 Meat 16.9 7.5 1.2 -0.8 Milk, Cheese and Eggs 1.3 -1.2 4.6 5.0 Vegetables 7.1 10.8 3.2 0.8 Bread and Cereals 1.9 6.5 1.4 0.7 Sugar, Jam, Confectionery, etc. -0.2 3.0 5.5 1.3 Non-Alcoholic Beverages 2.6 12.7 1.6 1.3 Oils and Fats 0.3 7.7 5.0 3.6
Fruits 2.5 7.5 6.5 3.5
CORE INFLATION 1.8 2.2 1.6 1.0
Communication -0.8 6.6 2.1 -1.3 Education 8.0 0.6 0.0 0.0 Miscellaneous Goods and Other Services 4.6 2.4 1.7 0.6 Hotels, Cafes and Restaurants 2.4 4.6 3.6 2.6 Health 1.0 6.5 14.5 1.6 Transport 1.0 3.2 1.2 1.9 Recreation and Culture 3.2 2.9 0.8 0.8 Alcoholic Beverages and Tobacco 3.3 1.6 5.2 -0.1 Clothing and Footwear 4.5 3.6 0.1 -4.5 Housing, Water, Electricity, Gas and Other Fuels 0.9 -0.3 0.1 2.4
Furnishings, Household Equipment and Routine Maintenance 1.2 1.5 1.8 -0.5
Sources: Central Statistical Office and Central Bank of Trinidad and Tobago

16
CHAPTER FIVE – PUBLIC FINANCE AND DEBT
FISCAL OPERATIONS
The Central Government’s fiscal consolidation efforts resulted in a lower deficit in fiscal
year (FY) 2017/18. Provisional data from the Ministry of Finance (MoF) show that the fiscal
accounts recorded an overall deficit of $5.4 billion (3.4 per cent of GDP) in FY2017/18
compared to $13.5 billion (9.1 per cent of GDP) in the previous year (Table 7). The lower deficit
was reflective of an increase in revenue—which was partly due to the proceeds from the
National Investment Fund (NIF)10—and a decline in expenditure, and was financed by domestic
and external borrowings. Higher non-energy revenues resulted in the non-energy fiscal deficit
narrowing to $16.0 billion (10.2 per cent of GDP) at the end of FY2017/18, from $21.3 billion
(14.3 per cent of GDP) in FY2016/17.
Central Government total revenue amounted to $42.2 billion in FY2017/18, roughly $6.0
billion higher than the previous fiscal year. The simultaneous increase in energy and non-
energy receipts accounted for the rise in revenue. Energy revenue increased by 17.7 per cent to
$10.7 billion because of higher natural gas output and crude oil prices11. Non-energy receipts
rose by 19.1 per cent to $30.7 billion, largely owing to higher revenue from taxes on goods and
services and non-tax revenue. However, these increases were offset by lower collections on
international trade and capital revenue. Capital revenue declined by 36.0 per cent due to the
reclassification of the proceeds from the NIF bond under non-tax revenue12.
Central Government total expenditure amounted to $47.6 billion in FY2017/18, compared
with $49.7 billion in FY2016/17. The fall in aggregate expenditure largely reflected
streamlining of expenditure in most categories, but in particular wages and salaries and
transfers and subsidies. The decline in expenditure on wages and salaries was primarily as a
result of lower payments of arrears for revised salaries and cost of living allowances (COLA) to
public officers. Meanwhile, the decline in transfers and subsidies was as a result of a fall-off in
transfers to household, led by cuts in the petroleum subsidy. Similarly, the smaller outlays on
the capital programme were largely due to administrative delays in the implementation of
projects, variations in the scope of work for some projects and delays in the processing of
claims for payment.
Central Government has taken steps to improve revenue collection and streamline
expenditure given still weak energy commodity prices. In FY2017/18, steps towards fiscal
10
The National Investment Fund Holding Company Limited (NIFHCL) is a special purpose investment company created by the Government of the Republic of Trinidad and Tobago (GORTT) to monetize assets from CLICO and CLICO Investment Bank (CIB) in liquidation as well as an appropriate shareholding of Trinidad Generation Unlimited (TGU).
11 Natural gas production averaged 3,589.8 million cubic square feet per day (mmscf/d) in FY2017/18 compared with 3,312.2
mmscf/d in FY2016/17. Meanwhile, crude oil West Texas Intermediate (WTI) prices averaged US$63.97 per barrel in FY2017/18
compared with US$49.35 per barrel in FY2015/16.
12 Subsequent to the non-materialisation of revenue from the projected sale of CLICO assets by March 2018, assets from CLICO and Trinidad Generation Unlimited were transferred to Property Income to be remitted under the NIF for public offering. This transfer of assets and change in the revenue earning mechanism required an amendment to the reporting profile of projected earnings.

17
adjustments have been apparent. These included efforts to strengthen tax administration13, the
introduction of standardized royalty rates on natural gas production14 and the gradual removal of
the fuel subsidy.
TABLE 7 SUMMARY OF CENTRAL GOVERNMENT FINANCES, 2014/2015 - 2018/2019
/TT$ Millions/
2014/2015 2015/2016 2016/2017
r 2017/2018
p 2018/2019
b
Current Revenue 52,244.6 41,158.9 34,870.1 41,411.0 44,715.1
Current Expenditure 52,322.9 48,546.4 46,263.5 44,197.3 46,576.3
Current Surplus (+)/ Deficit (-) -78.3 -7,387.6 -11,393.4 -2,786.3 -1,861.2
Capital Receipts 4,989.2 3,813.7 1,310.5 838.6 3,009.1
Capital Expenditure and Net Lending1 7,620.8 4,398.3 3,448.5 3,403.9 5,200.0
Overall Surplus(+)/ Deficit (-) -2,709.9 -7,972.1 -13,531.4 -5,351.6 -4,052.1
Financing 2,709.9 7,972.1 13,531.4 5,351.6 4,052.1
External (Net) -199.2 8,954.0 3,266.7 660.5 225.7
Domestic (Net) 2,909.1 -981.9 10,264.7 4,691.1 3,826.4
PER CENT OF GDP
Current Surplus (+)/ Deficit (-) 0.0 -5.0 -7.6 -1.8 -1.1 Overall Surplus(+)/ Deficit (-) -1.7 -5.4 -9.1 -3.4 -2.5
Sources: Ministry of Finance and Central Bank of Trinidad and Tobago
1 Includes an adjustment for Repayment of Past Lending for FY 2015. r Revised. p Provisional.
b Budgeted.
13
An assessment of the system of tax administration of the Republic of Trinidad and Tobago was undertaken during the period
September 20–October 3, 2017 using the IMF’s Tax Administration Diagnostic Assessment Tool (TADAT). TADAT provides an
assessment baseline of tax administration performance that can be used to determine reform priorities, and, with subsequent
repeat assessments, highlight reform achievements.
14 On December 1, 2017, royalty rates for both crude oil and natural gas were standardised at 12.5 per cent. Previously, crude oil royalty rates ranged between 10.0 per cent and 15.0 per cent while natural gas was taxed at $0.015 per mmscf. The royalty will be calculated on the fair market values of oil and gas.

18
TABLE 8 SUMMARY OF CENTRAL GOVERNMENT FISCAL OPERATIONS, 2014/2015 - 2018/2019
/TT$ Millions/
2014/2015 2015/2016 2016/2017r 2017/2018
p 2018/2019
b
REVENUE 57,233.8 44,972.6 36,180.6 42,249.6 47,724.2
Current 52,244.6 41,158.9 34,870.1 41,411.0 44,715.1 Energy* 18,660.9 6,644.4 7,759.5 10,694.6 13,641.0 Non-Energy* 33,583.7 34,514.5 27,110.6 30,716.3 31,074.0
Capital 4,989.2 3,813.7 1,310.5 838.6 3,009.1
EXPENDITURE 59,943.7 52,944.7 49,712.0 47,601.2 51,776.3
Current 52,322.9 48,546.4 46,263.5 44,197.3 46,576.3 Wages and Salaries 10,077.1 9,601.9 9,937.8 9,097.1 9,328.3 Goods and Services 8,105.4 7,326.1 5,827.2 6,088.1 7,000.1 Interest Payments 3,438.4 3,762.4 4,468.4 3,813.3 3,687.2 Transfers and Subsidies
1 30,702.0 27,856.1 26,030.1 25,198.8 26,560.7
Capital Expenditure and Net Lending2 7,620.8 4,398.3 3,448.5 3,403.9 5,200.0
OVERALL NON-ENERGY BALANCE3 -21,370.8 -14,616.5 -21,290.9 -16,046.3 -17,693.2
OVERALL BALANCE -2,709.9 -7,972.1 -13,531.4 -5,351.7 -4,052.1
TOTAL FINANCING (NET) 2,709.9 7,972.1 13,531.4 5,351.6 4,052.1
Net Foreign Financing -199.2 8,954.0 3,266.7 660.5 225.7
Net Domestic Financing 2,909.1 -981.9 10,264.7 4,691.1 3,826.4 Of Which: Transfers to Heritage and
Stabilisation Fund 0.0 -2,498.4 -1,712.2 0.0 0.0
(PER CENT OF GDP)
REVENUE 34.9 30.2 24.2 27.0 30.0
Current 31.8 27.7 23.3 26.4 28.1 Energy 11.4 4.5 5.1 6.8 8.6 Non-Energy 20.5 23.2 18.0 19.6 19.5
Capital 3.0 2.6 0.9 0.5 1.9
EXPENDITURE 36.5 35.6 33.3 30.4 32.6
Current 31.9 32.6 31.0 28.2 29.3 Wages and Salaries 6.1 6.5 6.7 5.8 5.9 Goods and Services 4.9 4.9 3.9 3.9 4.4 Interest Payments 2.1 2.5 3.0 2.4 2.3 Transfers and Subsidies 18.7 18.7 17.4 16.1 16.7
Capital Expenditure and Net Lending 4.6 3.0 2.3 2.2 3.3
OVERALL NON-ENERGY BALANCE -13.0 -9.8 -14.3 -10.2 -10.8
OVERALL BALANCE -1.7 -5.4 -9.1 -3.4 -2.5
TOTAL FINANCING (NET) 1.7 5.4 9.1 3.4 2.5
Net Foreign Financing -0.1 6.0 2.2 0.4 0.1 Net Domestic Financing 1.8 -0.7 6.9 3.0 2.4
Of which: Transfers to Heritage and Stabilisation Fund 0.0 -1.7 -1.1 0.0 0.0
MEMO:
Primary Fiscal Balance (TT$Mn)4 728.5 -4,209.7 -9,063.0 -1,538.4 -364.9
Cyclically Adjusted Balance (TT$Mn)5 -3,025.9 -6,368.4 -11,281.7 -2,826.3 n.a.
Structural Fiscal Balance (TT$Mn)6 -2,960.1 -878.8 -186.2 598.5 n.a.
Sources: Ministry of Finance and Central Bank of Trinidad and Tobago
1 Adjusted for transfers to the Infrastructure Development Fund, Government Assisted Tertiary Education Fund and CARICOM Petroleum Fund.
2 Includes an adjustment for Repayment of Past Lending for FY2014/2015. 3 The non-energy balance is computed as the sum of non-energy revenue and capital revenue less total expenditure.
4 The primary balance is a measure of the fiscal balance net of interest payments which are a result of past borrowings. It can be used to gauge the government’s ability to meet its non-interest expenditures out of its revenue receipts.
5 The cyclically adjusted balance provides an estimate of the fiscal position net of cyclical effects by adjusting revenue and expenditure for business cycle effects (See Box 2).
6 The structural fiscal balance is an estimate of the fiscal position after excluding the effects of the business cycle and fluctuations in commodity prices, as well as one-off factors that temporarily affect revenue and expenditure (See Box 2).
* The energy and non-energy breakdowns are based on the Central Bank's computations. Energy revenues comprise oil revenues plus revenues from Petrochemical companies. Data for FY2018/2019 is an estimate.
r Revised. p Provisional. b Budgeted.
19
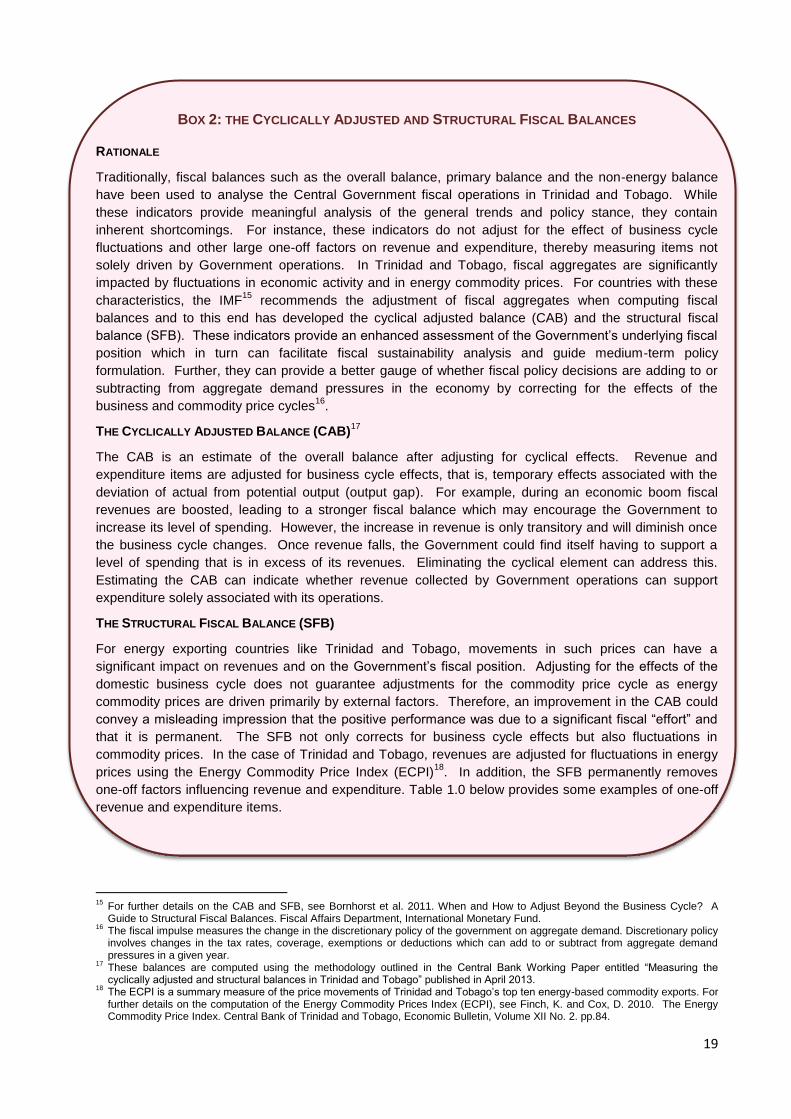
BOX 2: THE CYCLICALLY ADJUSTED AND STRUCTURAL FISCAL BALANCES
RATIONALE
Traditionally, fiscal balances such as the overall balance, primary balance and the non-energy balance
have been used to analyse the Central Government fiscal operations in Trinidad and Tobago. While
these indicators provide meaningful analysis of the general trends and policy stance, they contain
inherent shortcomings. For instance, these indicators do not adjust for the effect of business cycle
fluctuations and other large one-off factors on revenue and expenditure, thereby measuring items not
solely driven by Government operations. In Trinidad and Tobago, fiscal aggregates are significantly
impacted by fluctuations in economic activity and in energy commodity prices. For countries with these
characteristics, the IMF15
recommends the adjustment of fiscal aggregates when computing fiscal
balances and to this end has developed the cyclical adjusted balance (CAB) and the structural fiscal
balance (SFB). These indicators provide an enhanced assessment of the Government’s underlying fiscal
position which in turn can facilitate fiscal sustainability analysis and guide medium-term policy
formulation. Further, they can provide a better gauge of whether fiscal policy decisions are adding to or
subtracting from aggregate demand pressures in the economy by correcting for the effects of the
business and commodity price cycles16
.
THE CYCLICALLY ADJUSTED BALANCE (CAB)17
The CAB is an estimate of the overall balance after adjusting for cyclical effects. Revenue and
expenditure items are adjusted for business cycle effects, that is, temporary effects associated with the
deviation of actual from potential output (output gap). For example, during an economic boom fiscal
revenues are boosted, leading to a stronger fiscal balance which may encourage the Government to
increase its level of spending. However, the increase in revenue is only transitory and will diminish once
the business cycle changes. Once revenue falls, the Government could find itself having to support a
level of spending that is in excess of its revenues. Eliminating the cyclical element can address this.
Estimating the CAB can indicate whether revenue collected by Government operations can support
expenditure solely associated with its operations.
THE STRUCTURAL FISCAL BALANCE (SFB)
For energy exporting countries like Trinidad and Tobago, movements in such prices can have a
significant impact on revenues and on the Government’s fiscal position. Adjusting for the effects of the
domestic business cycle does not guarantee adjustments for the commodity price cycle as energy
commodity prices are driven primarily by external factors. Therefore, an improvement in the CAB could
convey a misleading impression that the positive performance was due to a significant fiscal “effort” and
that it is permanent. The SFB not only corrects for business cycle effects but also fluctuations in
commodity prices. In the case of Trinidad and Tobago, revenues are adjusted for fluctuations in energy
prices using the Energy Commodity Price Index (ECPI)18
. In addition, the SFB permanently removes
one-off factors influencing revenue and expenditure. Table 1.0 below provides some examples of one-off
revenue and expenditure items.
15
For further details on the CAB and SFB, see Bornhorst et al. 2011. When and How to Adjust Beyond the Business Cycle? A Guide to Structural Fiscal Balances. Fiscal Affairs Department, International Monetary Fund.
16 The fiscal impulse measures the change in the discretionary policy of the government on aggregate demand. Discretionary policy involves changes in the tax rates, coverage, exemptions or deductions which can add to or subtract from aggregate demand pressures in a given year.
17 These balances are computed using the methodology outlined in the Central Bank Working Paper entitled “Measuring the cyclically adjusted and structural balances in Trinidad and Tobago” published in April 2013.
18 The ECPI is a summary measure of the price movements of Trinidad and Tobago’s top ten energy-based commodity exports. For further details on the computation of the Energy Commodity Prices Index (ECPI), see Finch, K. and Cox, D. 2010. The Energy Commodity Price Index. Central Bank of Trinidad and Tobago, Economic Bulletin, Volume XII No. 2. pp.84.

20
TABLE 1
ONE-OFF REVENUE AND EXPENDITURE ITEMS
ONE-OFF REVENUE ONE-OFF EXPENDITURE
Tax amnesty 2008/2009 Tax amnesty 2010/2011 Tax Amnesty 2014/2015 BPTT payment of outstanding arrears National Gas Co. prepayment of dividends First Citizens IPO Sale of CLICO assets Refunds from termination of OPV contract Phoenix Gas Processors IPO TTNGL Limited IPO TGU repayment of past lending Sale of Assets (ETECK) Proceeds from issuance of NIF bonds
Interest payments on bailout-related debt (CLICO & HCU) Capital transfers to TGU Payment of salary arrears Payment of arrears to contractors Loans extended to other Governments
Source: Author’s Construction

21
TABLE 9
ENERGY-BASED GOVERNMENT REVENUES, 2012/2013 - 2017/2018
/Per cent of Government Revenue/
2012/ 2013
2013/ 2014
2014/ 2015
2015/ 2016
2016/ 2017
r
2017/ 2018
p
ENERGY SECTOR 50.4 48.2 32.6 14.8 21.4 25.3
Petroleum Profit Tax (PPT) 20.4 20.5 9.4 2.0 1.7 2.6
Supplemental Petroleum Tax (SPT) 7.6 8.5 9.0 0.3 1.4 2.4
Corporation tax 12.5 11.3 8.7 6.3 9.6 11.3
Royalties 4.5 4.1 1.9 1.2 2.6 4.8
Unemployment Levy 2.2 2.1 1.0 0.3 0.3 0.3
Withholding Tax 1.3 1.2 1.4 1.7 1.4 1.2
Exercise Duty 0.2 0.2 0.2 0.3 0.3 0.2
Oil Impost1 0.2 0.2 0.2 0.3 0.4 0.2
Signature Bonus 0.0 0.0 0.0 0.0 0.0 0.0
Production Sharing Contracts 1.5 0.0 0.8 2.2 3.6 2.4
Surplus Income - Sale of Pet. Products 0.0 0.0 0.0 0.2 0.2 0.1
(Per Cent of GDP)
ENERGY SECTOR 15.5 16.0 11.4 4.5 5.2 6.8
Petroleum Profit Tax (PPT) 6.2 6.8 3.3 0.6 0.4 0.7
Supplemental Petroleum Tax (SPT) 2.3 2.8 3.1 0.1 0.3 0.6
Corporation tax 3.8 3.7 3.0 1.9 2.3 3.0
Royalties 1.4 1.4 0.7 0.3 0.6 1.3
Unemployment Levy 0.7 0.7 0.4 0.1 0.1 0.1
Withholding Tax 0.4 0.4 0.5 0.5 0.3 0.3
Exercise Duty 0.1 0.1 0.1 0.1 0.1 0.1
Oil Impost1 0.1 0.1 0.1 0.1 0.1 0.0
Signature Bonus 0.0 0.0 0.0 0.0 0.0 0.0
Production Sharing Contracts 0.5 0.0 0.3 0.7 0.9 0.6
Surplus Income - Sale of Pet. Products 0.0 0.0 0.0 0.1 0.0 0.0
Sources: Ministry of Finance and Central Bank of Trinidad and Tobago
1 Oil Impost refers to a tax on petroleum producing companies to cover the administration expenses of the Ministry of Energy and Energy Affairs.
r Revised. p Provisional.

22
TABLE 10 CENTRAL GOVERNMENT RECURRENT EXPENDITURE
1: A FUNCTIONAL CLASSIFICATION 2012/2013-2018/2019
/TT$ Millions/
2012/ 2013
2014/ 2015
2015/ 2016
r
2016/ 2017
r
2017/ 2018
re
2018/ 2019
b
ECONOMIC SERVICES 6,187.6 6,407.2 3,939.4 3,329.1 2,769.7 3,518.0
Energy 4,569.0 4,712.9 1,006.0 466.6 88.2 520.4 Agriculture, Land and Marine Resources 569.7 626.9 794.3 727.5 709.6 707.0 Transport 1,048.9 1,067.4 2,139.1 2,135.0 1,971.9 2,290.6
SOCIAL SERVICES 16,844.9 18,110.5 17,406.5 17,075.1 17,190.2 17,381.4
Education2 6,620.5 7,249.7 5,903.0 5,008.3 5,160.2 5,330.3
Health 4,088.4 4,321.0 4,564.1 5,053.4 5,049.3 4,740.5
Housing 2,101.8 1,917.3 1,011.7 1,307.5 1,397.2 1,375.4 Small and Micro-Enterprise Development 154.6 165.4 502.1 356.3 345.1 360.0 Social Services
3 3,879.6 4,457.1 5,425.6 5,349.6 5,238.4 5,575.2
PUBLIC SERVICES 2,588.4 2,515.7 3,938.8 3,620.1 3,381.1 3,550.0
National Security 2,588.4 2,515.7 3,938.8 3,620.1 3,381.1 3,550.0
OTHER4 23,167.2 25,539.0 28,362.0 28,912.0 29,284.9 28,731.1
TOTAL RECURRENT EXPENDITURE5 48,788.1 52,572.4 53,646.7 52,936.3 52,625.9 53,180.5
Sources: Ministry of Finance and Central Bank of Trinidad and Tobago
1 Classified according to recurrent expenditure allocated to the respective Ministries. 2 Includes Ministry of Education, Ministry of Tertiary Education and Skills Training, Ministry of Science and Technology. 3 Includes Ministry of Community Development, Culture and the Arts, and Ministry of Social Development and Family Services 4 Includes Office of the President, Auditor General, Judiciary, Industrial Court, Parliament, Service Commissions, Statutory
Authorities, Elections and Boundaries Commission, Tax Appeal Board, Registration, Recognition and Certification Board, Public Service Appeal Board, Office of the Prime Minister, Tobago House of Assembly, Central Administrative Services, Tobago and all other Ministries. Other excludes Charges on Account of the Public Debt.
5 Represents Recurrent Expenditure from the Consolidated Fund only. r Revised. re Revised Estimates. b Budgeted.
PUBLIC SECTOR DEBT
Total public sector debt outstanding at the end of September 2018 amounted to $119.1
billion, 1.8 per cent lower compared to September 2017 (Table 11). Net public sector debt,
which excludes debt issued for sterilisation purposes, increased to $95.5 billion. During the
fiscal year, the Central Government borrowed both domestically and externally for budgetary
support and to refinance existing obligations.
Central Government reduced its domestic borrowing in FY 2017/18. Domestic debt
excluding sterilised liabilities19 increased to $42.3 billion in September 2018 from $40.8 billion in
September 2017. Under the Development Loans Act, Central Government borrowed $6.3
billion in FY2017/18 compared with $8.3 billion in FY2016/17 (Table 12). These borrowings
were done through private placements and included bonds underwritten by First Citizens Bank
totalling $4.6 billion, ANSA Merchant Bank, $1.2 billion and Republic Bank Limited amounting to
$500.0 million. Principal repayments for bonds and loans amounted to $4.4 billion, while $471.4
19
Central Government Domestic Debt less Treasury Bonds, Treasury Notes and Treasury Bills issued for Open Market Operations (OMOs).

23
million was allocated for the repayment of CLICO zero coupon bonds and $18.7 million for HCU
zero coupon bonds.
External Debt increased to US3,629.3 million at the end of September 2018, from
US$3,471.2 million in September 2017 (Appendix Table A.17A). Central Government
accessed the Corporación Andina de Fomento (CAF) for US$300.0 million during the period, of
which US$180.0 million was disbursed during FY2017/18. Additionally, the Inter-American
Development Bank (IDB) disbursed US$59.2 million, of which US$55.0 million was geared
towards the Multiphase Wastewater Rehabilitation Programme, while the Export Import (EXIM)
Bank of China disbursed US$21.5 million for the acquisition of a multi-purpose patrol vessel.
Total external debt service payments amounted to US$225.6 million of which US$102.6 million
was geared towards principal repayments. More than half of the principal repayment ($54.1
million) was used to repay the multilateral creditor, IDB.
Contingent liabilities fell by $780.8 million to $28.5 billion, as repayments of past lending
by state enterprises outstripped new borrowings. New borrowings for the 12 months to
September 2018 by State-owned Enterprises included a National Insurance Property
Development Company (NIPDEC) $405.0 million loan facility to fund the Programme of Works
of the Programme for Upgrading Road Efficiency (PURE) and loans contracted by Petrotrin
totalling US$230.0 million issued for working capital and trade financing purposes. Meanwhile,
the Urban Development Corporation of Trinidad and Tobago (UDECOTT) and Caribbean
Airlines Limited (CAL) refinanced maturing obligations over the period - $496.0 million and
US$25.0 million respectively (Table 12).

24
TABLE 11
TOTAL PUBLIC DEBT OUTSTANDING, SEPTEMBER 2014- SEPTEMBER 2018 /TT$ Millions/
FISCAL YEARS
SEP-14 SEP-15 SEP-16 SEP-17 SEP-18P
TOTAL GROSS PUBLIC DEBT 97,180.3 127,031.2 119,709.7 121,258.4 119,125.7
TOTAL NET PUBLIC DEBT1 71,081.0 88,396.2 88,308.7 93,646.9 95,508.0
CENTRAL GOVERNMENT DOMESTIC 55,743.5 70,384.0 67,086.7 68,448.9 65,945.3
General Development Bonds 9,386.5 12,099.0 16,694.8 21,293.3 23,313.8
CLICO and HCU Bonds 19,127.9 18,595.7 17,987.7 17,463.3 16,961.7
BOLTS and Leases 319.1 243.7 186.4 159.3 130.6
Debt Management Bills 800.0 800.0 800.0 1,905.0 1,905.0
Open Market Operations
Treasury Bills 15,108.0 25,038.2 19,788.9 18,599.2 18,273.4
Treasury Notes 5,892.0 9,197.5 9,052.8 6,453.0 2,785.0
Treasury Bonds 2,559.3 2,559.3 2,559.3 2,559.3 2,559.3
Liquidity Absorption Bonds 2,540.0 1,840.0 0.0 0.0 0.0
Other Debt Liabilities2 10.7 10.6 16.8 16.5 16.5
CENTRAL GOVERNMENT EXTERNAL 12,654.6 13,759.6 21,362.3 23,522.7 24,674.3
CONTINGENT LIABILITIES 28,782.2 42,887.6 31,260.7 29,286.8 28,506.1
State Owned Enterprises 18,431.7 31,247.5 19,872.4 18,537.4 18,395.8 Statutory Authorities 10,350.5 11,640.1 11,388.3 10,749.4 10,110.3
(PER CENT OF GDP)
Total Gross Public debt 55.3 77.4 80.4 81.2 76.1
Total Net Public Debt 40.4 53.8 59.3 62.7 61.0
Central Government Domestic Debt1 16.9 20.5 24.0 27.3 27.0
Central Government External Debt 7.2 8.4 14.4 15.7 15.8
Contingent Liabilities 16.4 26.1 21.0 19.6 18.2
Sources: Ministry of Finance and Central Bank of Trinidad and Tobago
1 Excludes debt issued for sterilisation purposes (Open Market Operations). 2 Comprises the outstanding balances of public sector emolument bonds, tax-free saving bonds & Central Bank fixed interest rate
bonds. p Provisional.

25
TABLE 12 PUBLIC SECTOR BORROWINGS UNDERTAKEN IN FY2017/18
/TT$ Millions/
DATE BORROWER AMOUNT ($MN)
TYPE OF
FINANCING PURPOSE OF FINANCING BORROWING ACT UTILIZED
26-Oct-17 CAL US 25.0 Domestic Debt Refinancing Guarantee of Loans Companies Act
27-Oct-17 Central Government CNY 145.4 External Purchase of Chinese Long
Range Military Vessel External Loans Act
27-Oct-17 Central Government TT1,000 Domestic Budget Support Development Loans Act
27-Oct-17 PETROTRIN US 25.0 Domestic Working Capital and Trade
Financing Guarantee of Loans Companies Act
20-Nov-17 TT Eximbank US 20.0 External To fund loan portfolio growth
related to trade finances Guarantee of Loans Companies Act
28-Nov-17 Central Government TT1,000 Domestic Budget Support Development Loans Act 13-Dec-17 Central Government US 100 Domestic Budget Support Development Loans Act 4-Jan-18 Central Government TT 1,200.0 Domestic Debt Refinancing Development Loans Act
23-Mar-18 PETROTRIN US 50.0 Domestic Working Capital Guarantee of Loans Companies Act 26-Mar-18 Central Government TT 1,200.0 Domestic Debt Refinancing Development Loans Act 23-Apr-18 Central Government US 300.0* External Budget Support External Loans Act
8-May-18 WASA TT 508.7 Domestic Settle outstanding
obligations Guarantee of Loans Statutory Act
15-May-18 NIPDEC TT 405.0 Domestic P.U.R.E. Guarantee of Loans Companies Act 21-May-18 T&TEC TT 1,612.6 Domestic Debt Refinancing Guarantee of Loans Statutory Act 13-Jun-18 Central Government TT 500.0 Domestic Budget Support Development Loans Act 2-Jun-18 UDECOTT TT 199.6 Domestic Arima Hospital Guarantee of Loans Companies Act 22-Jun-18 Central Government TT 250.0 Domestic Debt Refinancing Development Loans Act 21-Aug-18 UDECOTT TT 35.7 Domestic Debt Refinancing Guarantee of Loans Companies Act 18-Oct-18 UDECOTT US 99.0 Domestic Arima Hospital Guarantee of Loans Companies Act 20-Jun-18 Central Government EUR 81.4 External Point Fortin Hospital External Loans Act
29-Jun-18 UDECOTT TT 47.3 Domestic Refurbishment of President's
House Guarantee of Loans Companies Act
10-Jul-18 PETROTRIN US 50.0 Domestic Working Capital Guarantee of Loans Companies Act 23-Jul-18 UDECOTT TT 87.8 Domestic Retrofit of Cabildo Chambers Guarantee of Loans Companies Act 8-Aug-18 PETROTRIN US 50.0 Domestic Working Capital Guarantee of Loans Companies Act
23-Aug-18 ETECK TT 87.7 Domestic Completion of Tamana In-
Teck Park Guarantee of Loans Companies Act
18-Sep-18 UDECOTT TT 496.0 Domestic Debt Refinancing Guarantee of Loans Companies Act
28-Aug-18 PSAEL TT 29.3 Domestic Payment of a Judgement
Debt Guarantee of Loans Companies Act
28-Sep-18 PETROTRIN US 55.0 Domestic Working Capital Guarantee of Loans Companies Act 28-Sep-18 Central Government TT 250.0 Domestic Budget Support Development Loans Act 28-Sep-18 Central Government TT 200.0 Domestic Budget Support Development Loans Act
IMPACT OF FY2017/18 BORROWINGS ON BORROWING LIMITS
BORROWING ACT BORROWING
LIMIT
(TT$MN)
OUTSTANDING DEBT FY2017 (TT$MN)
OUTSTANDING DEBT
FY2018
(TT$MN)
REMAINING
HEADROOM
AS AT SEP-18
(TT$MN)
Development Loans Act 45,000.0 35,487.1 37,507.6 7,492.4 External Loans Act 30,000.0 16,646.3 16,609.2 13,390.8 Guarantee of Loans (Companies) Act 45,000.0 18,537.5 18,395.8 26,604.2 Guarantee of Loans (Statutory Authorities) Act No Limit 10,749.4 10,110.3 Unlimited IADB Act No Limit 4,550.9 4,580.5 Unlimited IBRD Act No Limit 14.4 0.0 Unlimited CDB Act No Limit 288.5 243.5 Unlimited CAF Act No Limit 2,022.6 3,241.1 - Treasury Bills Act 30,000.0 20,504.2 20,178.4 9,821.6 Treasury Notes Act 15,000.0 6,453.0 2,785.0 12,215.0 Treasury Bonds Act No Limit 2,559.2 2,559.3 Unlimited Purchase of Certain Rights and Validation Act (CLICO)
10,700.0 2,979.2 2,494.7 -
Purchase of Certain Rights and Validation Act (HCU) 400.0 290.2 273.2 -
Sources: Ministry of Finance and Central Bank of Trinidad and Tobago. * Of this amount, only US$180.0 million was disbursed in FY2018.

26
CHAPTER SIX – MONETARY AND FINANCIAL DEVELOPMENTS
MONETARY POLICY
The Monetary Policy Committee (MPC) of the Central Bank raised its policy rate, the
Repo rate, by 25 basis points in June 2018 to 5.00 per cent and kept it at that level for the
rest of the year. The increase in June was the first since December 2015. In raising the Repo
in June, the MPC identified the main reasons as the strong upward trajectory of external interest
rates, particularly in the US, and the still-nascent nature of the rebounds in the energy sector
and private sector credit in early 2018. In keeping the rate steady for the rest of 2018, the MPC
considered that inflation had been low and under control, the signs of economic strengthening
had yet to become robust and that in the US markets were expecting the Fed to slow its pace of
interest rate increases. During the year, the Central Bank managed liquidity to meet the liquidity
needs of market participants while maintaining an environment consistent with low inflation.
Liquidity levels in the domestic banking system increased slightly during 2018 as
commercial banks’ holdings of excess reserves averaged $3.3 billion monthly compared
with $3.1 billion in 2017. In managing liquidity during the year, the Central Bank had to
contend with a sizeable rise in Net domestic fiscal injections—the main driver of liquidity—which
amounted to $11,119.0 million, approximately double the size of the injection in 2017. Over the
year, the Bank withdrew a net of $951.1 million via its open market operations (OMOs) but on
various occasions, allowed net maturities of OMO securities to facilitate transactions by the
public and private sector. Most notably, in July and August 2018 the Bank allowed $5.3 billion
in OMO maturities to return to the system to facilitate the issuance and settlement of the NIF
shares. Further, in August the Bank abolished the Secondary Reserve Requirement, which
released $1,570.6 million into the financial system. Subsequently, however, much of the
addition to liquidity during the period was reversed by net OMO withdrawals of $5.1 billion over
September to December 2018. Meanwhile, although not a liquidity absorption tool, Central
Bank sales of foreign exchange to authorised dealers indirectly removed $10,035.0 million from
the system in 2018, 17.4 per cent less than in 2017. Despite the increase in average liquidity in
2018, borrowing on the interbank market rose to average $114.5 million daily compared with
$74.7 million daily in 2017, mainly owing to the special circumstances of a minority of
institutions. The repurchase facility was accessed on two trading days in 2018 for a sum of
$1,883.4 million.
The TT-US short term differential remained negative over the course of 2018. More
intense liquidity management by the Central Bank in 2018 saw the yield on the 91-day Treasury
bill rate rise by 9 basis points to 1.30 per cent, and that on the 365-day Treasury bill rate
increase by 3 basis points to reach 2.75 per cent by the end of 2018. However, an improving
US economy and tightening Fed policy saw yields on similar tenors in the US rising much faster
than they did locally leading to a further reduction of the TT-US differentials. The TT-US 91-day
Treasury rate differential thus moved from 18 basis points below parity at the end of 2017 to 115
basis points below parity by the end of 2018.
A competitive domestic financial environment led to declining commercial banking
interest rates and rising deposit rates in 2018 and a narrowing of the interest rate spread.

27
The banking environment therefore improved for both borrowers and depositors, but more so for
borrowers as lending rates fell much more steeply than deposit rates rose. Lenders would also
have benefited from marketing promotions and lending innovations of some banks during the
year. In 2018 the commercial banks’ weighted average lending rate decreased by 19 basis
points while the weighted average deposit rate gained just 3 basis points. The commercial
banking spread thus fell 22 basis points over 2018 to reach 7.36 per cent in December. Interest
rates on outstanding mortgage loans fell particularly sharply: the weighted average interest rate
on outstanding mortgage loans fell 16 basis points during the year. On the whole, the interbank
rate averaged 0.50 per cent in 2018, which is similar to 2017. Commercial banks generally
continue to avail of adequate levels of liquidity which obviates any need for regular and sizeable
recourse to the interbank market and explains the stickiness of the interbank rate. Influenced by
the increase in the Repo rate in June, the median prime lending rate increased by 25 basis
points to 9.25 per cent in September 2018, where it remained until the end of the year.
Private sector credit granted to the consolidated financial system continued to grow.
Overall, credit to the consolidated system expanded at an average rate of 5.7 per cent over
2018 compared to 3.1 per cent over 2017 and 4.8 per cent in 2016. Notably, lending by non-
banks turned positive in February 2018 after declining since September 2017.
During the year, lending to businesses was subdued. On a year-on-year basis, lending to
businesses remained weak, growing at an average rate of 3.2 per cent between January and
September before turning negative in October (-1.3 per cent). However, business lending
reverted to growth in the last two months of 2018. A sectoral breakdown of business lending to
December 2018 revealed that growth in lending to other services expanded by 18.9 per cent,
boosted in particular by personal services and transport, storage and communication sub-
categories, while lending to the finance, insurance and real estate sector also increased, by 8.1
per cent. Meanwhile loans to the manufacturing sector declined (10.9 per cent) on account of
lower lending to firms involved in manufacturing of chemical and non-metallic minerals.
Consumer credit extended by banks and non-banks rose in 2018 but much of the new
credit was for debt consolidation and refinancing. Lending for debt consolidation and
refinancing grew by 18.4 per cent and 11.4 per cent, respectively; the buoyancy in these
categories suggests that some consumers might increasingly be seeking relief from debt stress
because of personal financial challenges. Credit card lending grew in December 2018 by 7.6
per cent while lending for the purchase of motor vehicles moderated (0.6 per cent) due to a
decline in lending for the purchase of new vehicles. On the whole, credit to consumers grew by
6.0 per cent in December 2018, which represented some improvement from growth of 5.1 per
cent in December 2017.
Real estate mortgage lending continued its upward trajectory throughout 2018. Real
estate lending grew by 6.6 per cent in December 2018, compared with 8.0 per cent growth at
the end 2017. Of this growth, real estate mortgage loans by banks expanded by 6.7 per cent,
while lending by non-banks (which accounts for less than 1.0 per cent of overall real estate
mortgage loans) contracted by 17.2 per cent. Meanwhile, data to December 2018 show that
commercial real estate mortgage lending expanded by 10.3 per cent while growth in residential
real estate mortgage lending slowed to 4.8 per cent from 6.9 per cent in December 2017.

28
Private residential real estate mortgages grew more slowly in December 2018 compared to
December 2017. Lending for both new and existing houses slowed while borrowing for
renovations declined. Lending for the purchase of land was the only consumer residential
mortgage category to accelerate between December 2017 and December 2018. Considering
the non-performing loan portfolio, real estate non-performing loans continues to account for the
larger share of total non-performing loans.
Both foreign currency loans and deposits fluctuated throughout 2018. Foreign currency
loans contracted by 9.4 per cent in December 2018 from growth of 4.2 per cent in December
2017. Foreign currency loans to businesses, which accounts for approximately 95.0 per cent of
total private sector foreign currency loans, declined by 18.7 per cent at the end of December
2018, compared to growth of 2.8 per cent in December 2017. Conversely, foreign currency
deposits expanded by 3.8 per cent in December 2018, after declines of 1.9 per cent at the end
of 2017. Foreign currency deposits by both consumers and businesses were weak early in
2018. However, deposits by businesses reversed trend in September 2018, and recorded
growth of 8.8 per cent by the end of the year. Foreign currency deposits by consumers declined
consistently throughout 2018 and fell by 1.2 per cent in December 2018.
FOREIGN EXCHANGE MARKET
Though improved energy sector performance increased foreign exchange inflows, the
market for foreign exchange remained tight throughout 2018. Both authorised dealers’
purchases from the public (13.7 per cent) and their sales to the public (9.3 per cent) increased.
Purchases of foreign exchange from the public by authorised dealers reached US$4,101.4
million. Approximately 66.6 per cent of purchases originated from the energy sector, which
remains the main source of supply to the market. Sales of foreign exchange to the public by
authorised dealers amounted to US$5,677.1 million in 2018. The Retail and Distribution sector
absorbed the largest share of all sales (31.8 per cent). Credit Cards (26.9 per cent),
Manufacturing (10.9 per cent), and Automobile Companies (6.5 per cent) made up the bulk of
the remainder of foreign exchange sales. Central Bank’s support to the market amounted to
US$1,501.0 million. The weighted average TTD/USD selling rate depreciated slightly from
TT$6.7817 per US Dollar in December 2017 to TT$6.7861 per US Dollar in December 2018.

29
CHAPTER SEVEN – CAPITAL MARKETS
STOCK MARKET
The domestic stock market improved in 2018 (Chart 1). The major Composite Price Index
(CPI) expanded by 2.9 per cent, resulting in total stock market capitalization ending December
2018 2.3 per cent higher at $126.7 billion. The CPI was buoyed by the Cross Listed Index
(CLI), which advanced by 12.2 per cent, reflecting robust performances by most of the
regionally listed firms. Conversely, the All T&T Index (ATI), which represents only locally
domiciled firms, declined by 1.4 per cent over 2018. The market performance in 2018 followed
a similar trend as in 2017 when the CPI improved by 4.7 per cent, boosted by a 38.6 per cent
jump in the CLI, while the ATI was eroded by 5.8 per cent.
Despite the positive movement in the CPI, most of the sub-indices on the local stock
exchange displayed negative movements over 2018 (Chart 2 and 3). The sub-indices
which registered positive growth were Banking (9.9 per cent) and Energy (9.8 per cent). The
Banking sub-index was supported by a 36.0 per cent jump in the share price of the cross listed
National Commercial Bank Financial Group Limited (NCBFG). NCBFG’s performance was
related to a stronger financial position. The Energy sub-index was supported by the strong
financial performance of TTNGL which witnessed an increase in revenue from higher Mont
Belvieu product prices, an increase in after tax profit, and higher earnings per share. The sub-
indices to register declines were: Trade (-1.3 per cent), Non-Bank Finance (-2.5 per cent),
Manufacturing I (-5.1 per cent), Property (-6.1 per cent), Conglomerates (-8.6 per cent), and
Manufacturing II (-24.5 per cent). Two local firms experienced substantial declines. Trinidad
Cement Limited (-27.2 per cent) experienced a fall in revenue and profit as a result of scheduled
maintenance and upgrades, in addition, to the settlement of a retroactive wage payment
commitment. Meanwhile, Prestige Holdings Limited plunged by 31.5 per cent, citing difficult
economic conditions and higher operating costs.
A notable development was the initial public offering (IPO) of Cinema One Limited (CINE1) in
November 2018. CINE1 was the first company to be listed on the Small and Medium Enterprise
(SME) market of the stock exchange. The IPO successfully sold just over 1.4 million shares at
TT$10 per share, representing a 17.8 per cent ownership in the company.
While the volume of securities traded on the domestic exchange during 2018 was lower,
the value traded was higher. A total of 72.3 million shares were exchanged at a value of
roughly $1,148.4 million during 2018. Conversely, in 2017, 84.5 million shares were exchanged
at a value of $1,024.7 million. In 2018, the Bank and Non-Bank Finance sub-sectors accounted
for 52.4 per cent of the volume (37.8 million shares), and 49.0 per cent of the value ($562.4
million) traded.

30
CHART 1 TRINIDAD AND TOBAGO STOCK INDICES
Source: Trinidad and Tobago Stock Exchange
CHART 2 TRINIDAD AND TOBAGO STOCK MARKET SUB-INDICES 2018
Source: Trinidad and Tobago Stock Exchange
CHART 3 TRINIDAD AND TOBAGO INDIVIDUAL STOCK INDICES 2018
Source: Trinidad and Tobago Stock Exchange
40.0
50.0
60.0
70.0
80.0
90.0
100.0
110.0
120.0
800
1,000
1,200
1,400
1,600
1,800
2,000
2,200
In
dex V
alu
e
In
dex V
alu
e
Composite Price Index (Left Axis) All T&T Index (Left Axis) Cross Listed (Right Axis)
9.9 9.8 -1.3 -2.5 -5.1 -6.1 -8.6 -24.5
-25.0
-20.0
-15.0
-10.0
-5.0
0.0
5.0
10.0
Ban
kin
g
En
ergy
Trad
in
g
Non
-B
an
k
Man
ufactu
rin
g I
Prop
erty
Con
glo
merates
Man
ufactu
rin
g II
Per C
en
t
-40%
-30%
-20%
-10%
0%
10%
20%
30%
40%
NCBFG SFC
AGL
NGL
SBTT
GHL
FIRST
JMMBGL
RFH
L
AHL
BER
RML
MASSY
LJWB
GKC
AMBL
WCO
PLD FCI
AMCL
NFM
GML
NEL
UCL
OCM
TCL
PHL
ATI CLI

31
PRIMARY DEBT MARKET Provisional data suggest that activity on the primary debt market increased during 2018
(Chart 4 and Table 13). The market observed 23 primary issues at a value of approximately
$14.8 billion in 2018, compared to 18 primary issues at a value of roughly $12.8 billion in 2017.
The Central Government continued to be a major borrower issuing eight bonds at $4.7 billion for
repayment of existing bonds, budgetary support, and financing closing costs related to Petrotrin.
Similarly, five state enterprises influenced market activity by issuing seven bonds at $4.8 billion
in 2018. The government was also able to monetise $4.0 billion in debt owed by Colonial Life
Company (Trinidad) Limited (CLICO) and CLICO Investment Bank (CIB), by auctioning three
bonds through the National Investment Fund Holding Company Limited (NIFHCL). Participation
by the private sector was subdued compared to the public sector. Over the year, three bonds
financed $891.2 million for two local firms, and one CARICOM firm. In comparison, during 2017
the Central Government borrowed just over $9.8 billion via nine bonds; state enterprises
financed roughly $2.3 billion via five issues; and the private sector raised just under $285.0
million through two bonds.
CHART 4
ANNUAL PRIMARY DEBT SECURITY ACTIVITY (2010 – 2018P,1,2)
Source: Central Bank of Trinidad and Tobago p Provisional.
1 Includes debt securities issued in domestic market by local and CARICOM institutions.
2 Excludes bonds issued by local institutions on international market.
0.0
1.0
2.0
3.0
4.0
5.0
6.0
-
2,000
4,000
6,000
8,000
10,000
12,000
14,000
2010 2011 2012 2013 2014 2015 2016 2017 2018
Per C
en
t
TT
$ M
illio
ns
Central Gov't State Public-Private Private Repo Rate (Right Axis)

32
TABLE 13
PRIMARY DEBT SECURITY ACTIVITY - JANUARY - DECEMBER 2018P
PERIOD
ISSUED BORROWER
FACE VALUE
(TT$ M)
PERIOD
TO
MATURITY
COUPON RATE PER
ANNUM PLACEME
NT TYPE
Jan-18
Home Mortgage Bank (HMB)
Series 1 99.0 5.0 years Floating rate 3.50% Private
Series 2 101.0 5.0 years Floating rate 4.72% Private
First Citizens Bank 612.2
(US$90.4 Mn) 4.0 years Fixed rate 4.25% Private
Mar-18
Central Government of Trinidad and Tobago
Tranche 1 800.0 7.0 years Fixed rate 4.15% Public
Tranche 2 400.0 15.0 years Fixed rate 5.15% Public
Apr-18 First Citizens Bank 860.8 4.0 years Fixed rate 4.50% Private
May-18
Portland (Barbados) Limited
Tranche 1 87.7
(US$13.0 Mn) 2.0 years Fixed rate 7.50% Private
Tranche 2 13.5
(US$2.0 Mn) 1.0 years Fixed rate 7.50% Private
HADCO
Tranche 1 260.0 10.0 years Fixed rate 6.25%, then
reset; Amortized Private
National Insurance Property Development Company Limited(NIPDEC)
405.0 14.0 years Fixed rate 4.65%;
Amortized Private
Trinidad and Tobago Electricity Commission (T&TEC)
Series 1 812.6 8.0 years Fixed rate 4.34% Private
Series 2 800.0 14.0 years Fixed rate 5.39% Private
Jun-18 Central Government of Trinidad and Tobago 500.0 3.0 years Floating rate 2.65% Private Central Government of Trinidad and Tobago 250.0 12.0 years Fixed rate 4.60% Private
Jul-18
FirstCaribbean International Bank (Trinidad & Tobago) Limited
Series 1 325.0 3.0 years Floating rate 3.35%,
reset annually based on OMO + 70bps
Private
Series 2 175.0 6.0 years Fixed rate 5.75% Private
Aug-18
National Investment Fund Holding Company Limited (NIFHCL)
Bond 1 1,200.0 5.0 years Fixed rate 4.50% Public Bond 2 1,600.0 12.0 years Fixed rate 5.70% Public Bond 3 1,200.0 20.0 years Fixed rate 6.60% Public
Sep-18
Urban Development Corporation of Trinidad and Tobago
496.0 10.0 years Fixed rate 5.375% Private
Central Government of Trinidad and Tobago 200.0 11.0 years Fixed rate 4.75% Private
Central Government of Trinidad and Tobago 250.0 11.0 years Fixed rate 4.75% Private
Oct-18 Urban Development Corporation of Trinidad and Tobago
380.81 (US$56.4 Mn)
10.0 years Fixed rate 5.30% Private
Nov-18
Central Government of Trinidad and Tobago 640.0 15.0 years Fixed rate 5.45% Private
HADCO
Tranche 2 30.0 9.5 years Fixed rate 6.25%, then
reset Private
Home Mortgage Bank (HMB)
Series 1 134.0 7.0 years Fixed rate 4.75% Private
Series 2 43.5 7.0 years Fixed rate 4.65% Private
Central Government of Trinidad and Tobago 500.0 3.0 years Fixed rate 3.40% Private
Central Government of Trinidad and Tobago 1,200.0 1.0 year Fixed rate 3.05% Private
Dec-18 Trinidad & Tobago Mortgage Finance Co. Ltd. (TTMF)
400.0 5.0 years Fixed rate 4.70% Private
Source: Central Bank of Trinidad and Tobago p Provisional.

33
CENTRAL GOVERNMENT SECONDARY BOND MARKET, YIELD CURVE20, AND BOND INDEX
Trading activity on the secondary government bond market continued to weaken during
2018 (Chart 5). During the year, 57 trades occurred at a face value of roughly $318.1 million,
compared to 114 trades at $986.1 million in 2017. The fall in trading activity could be as a result
of all Central Government bonds being issued as private placements over the year.
The repo rate increase in June 2018, and the subsequent increase in Treasury rates
during the fourth quarter of 2018, resulted in the Central Government yield curve shifting
upward over 2018 (Chart 6). Over the year, the short-term 3-month rate increased by 9 basis
points to 1.30 per cent and the 1-year rate inched up by 3 basis points to 2.75 per cent. On the
longer end, the 10-year rate jumped by 8 basis points to 4.42 per cent, while the 15-year rate
gained 4 basis points to 5.10 per cent. In terms of the Central Government Bond Index, the
Price Index increased marginally by 0.2 per cent, while the Total Return Index improved by 6.6
per cent (Chart 7).
20
The TT Treasury Yield curve was launched in September 2014 by the Central Bank. The curve is based on data from Reserves and Domestic Market Management, contributor market reads, and the Stock Exchange Secondary Government bond market. The curve is intended for use as a benchmark for government securities.

34
CHART 5 ANNUAL SECONDARY GOVERNMENT DEBT SECURITY ACTIVITY
Source: Trinidad and Tobago Stock Exchange
CHART 6 TRINIDAD AND TOBAGO GOVERNMENT YIELD CURVE
Source: Central Bank of Trinidad and Tobago
CHART 7
TRINIDAD AND TOBAGO CENTRAL GOVERNMENT BOND INDICES
Source: Central Bank of Trinidad and Tobago
0
20
40
60
80
100
120
140
160
180
200
0
200
400
600
800
1,000
1,200
1,400
1,600
1,800
2009 2010 2011 2012 2013 2014 2015 2016 2017 2018
Nu
mb
er
TT
$ M
illio
ns
Face Value Traded Total Number of Trades (R.H.S.)
-2.0
0.0
2.0
4.0
6.0
8.0
10.0
12.0
14.0
16.0
18.0
0.00
1.00
2.00
3.00
4.00
5.00
6.00
7.00
Basis P
oin
ts
Per C
en
t
Basis Point Spread (Right Axis)
December 2018
December 2017
0.0
2.0
4.0
6.0
8.0
10.0
12.0
14.0
-6.0
-4.0
-2.0
0.0
2.0
4.0
6.0
8.0
2010 2011 2012 2013 2014 2015 2016 2017 2018
Per C
en
t
Price Index (LHS) Total Return Index (RHS)
Per C
en
t

35
MUTUAL FUNDS INDUSTRY
Aggregate funds under management increased by 2.5 per cent to just over $44.3 billion
during 2018 (Chart 8)21,22. The growth of the industry was driven by an 11.3 per cent increase
in Equity funds to $6,532.0 million, and a 14.1 per cent increase in Money Market funds to
$9,548.8 million. On the other hand, Income funds and funds classified as ‘Other’23 fell by 2.6
per cent to $27,873.8 million and 4.8 per cent to $349.9 million, respectively. In terms of
currency profile, TT dollar funds expanded by 4.1 per cent to $35,603.5 million, while foreign
currency funds declined by 3.4 per cent to a TT dollar equivalent of $8,674.1 million.
The improvement in aggregate funds under management appears to be largely driven by
a substantial jump in net sales over 2018. Overall, the industry witnessed $18,274.1 million
in sales and $16,566.3 million in redemptions, resulting in net sales of $1,707.8 million. In
comparison, during 2017 the industry observed just $109.4 million in net sales. During 2018 the
industry sales position was driven by net sales in Money Market funds ($963.3 million), Equity
funds ($421.7 million) and Income funds ($336.4 million). Conversely, funds classified as
‘Other’ experienced $13.6 million in net redemptions. In terms of currency profile, the increase
in net sales was primarily due to TT dollar funds comprised $959.6 million in TT dollar funds,
which registered $1,713.2 million in net sales, compared to foreign currency funds which
recorded a TT dollar equivalent of $5.4 million in net redemptions.
CHART 8
MUTUAL FUNDS – AGGREGATE FUND VALUE
Source: Central Bank of Trinidad and Tobago
21
Aggregate funds under management refer to mutual fund information collected by the Central Bank of Trinidad and Tobago,
including funds managed by the Trinidad and Tobago Unit Trust Corporation, Royal Bank Trinidad and Tobago, Republic Bank
Limited and First Citizens Bank Limited. 22
In September 2018, a re-classification of the fund types was conducted to more accurately represent industry characteristics. 23
Funds classified as ‘Other’ represent high yield funds and retirement funds.
0
5,000
10,000
15,000
20,000
25,000
30,000
35,000
40,000
45,000
Dec-15 Mar-16 Jun-16 Sep-16 Dec-16 Mar-17 Jun-17 Sep-17 Dec-17 Mar-18 Jun-18 Sep-18 Dec-18
TT
$ M
illio
ns
Other Money Market Equity Funds Income Funds

36
CHAPTER EIGHT – INTERNATIONAL TRADE AND PAYMENTS (Data in this section are in US dollars unless otherwise indicated)
BALANCE OF PAYMENTS
Trinidad and Tobago’s external accounts recorded a deficit of $904.5 million (5.1 per cent
of GDP) during the first nine months of 201824. Despite the increase in energy export
earnings, the current account surplus narrowed during the period January to September 2018
compared to the similar period in 2017 (Table 14A). Meanwhile, the financial account recorded
a net outflow, primarily reflective of transactions in portfolio and direct investment. At the end of
September 2018, gross official reserves amounted to $7,465.3 million or 8.1 months of
prospective imports of goods and services.
The estimated surplus on the current account reflected buoyant activity within the
energy sector, which underpinned the net goods trading position of $2,604.6 million.
Total exports rose by 12.9 per cent year-on-year to $7,878.1 million, indicative of gains across
energy commodities. During the first nine months of 2018, energy exports earnings25 were
estimated to have climbed by 23.2 per cent year-on-year, and were boosted by growth in
exports of crude oil and refined products, LNG, natural gas liquids and petrochemicals. On the
non-energy side, reductions in the categories of beverages and tobacco and food and live
animals contributed to the decline in non-energy exports. At the same time, total imports rose
by an estimated 17.2 per cent, led by higher crude oil shipments for refining. Moreover, the
gains in machinery and transport equipment, chemicals, manufactured goods, as well as food
and live animals supported imports over the reference period.
Meanwhile, the deficit on the services account narrowed to $1,201.0 million in the first
nine months of 2018, owing to the improvement in other business services. Over the
period, other business services recorded a smaller deficit as domestic residents reduced their
imports of technical and trade-related business services, in particular engineering services.
However, in line with the slowdown in global economic activity, the travel account recorded a
smaller surplus as visitors to Trinidad and Tobago reduced their expenditure by 3.9 per cent
while locals lowered their overseas travel spending by 0.3 per cent. The primary income
account recorded a deficit in contrast to a surplus registered in the previous year, reflective of
higher dividend payments and reinvested earnings by foreign-owned energy companies. The
secondary income account registered a larger surplus mainly on account of lower private out-
bound transfers.
Financial flows recorded a net outflow of $589.0 million over the first nine months of
2018, largely reflecting movement in direct and portfolio investment. More specifically,
24
The IMF’s Caribbean Regional Technical Assistance Centre conducted four External Sector Statistics Technical Assistance
Missions over the period 2015-2018. This resulted in the migration of these statistics to the latest international statistical
standard, as well as significant improvements to the data, including the introduction of new data sources, expansion of the survey
frame, stronger consistency checks and revision of trade data. A fifth mission in 2019, mainly focusing on the current account, is
expected to bring further improvements.
25 In the first nine months of 2018, crude oil prices as reflected in the West Texas Intermediate (WTI) market increased to $66.8 per barrel from $44.9 per barrel over the similar period of 2017, while natural gas prices as measured by the Henry Hub benchmark averaged $2.9 per million British Thermal Units (mmbtu), marginally down from an average price of $3.0 per mmbtu.

37
direct investment recorded a net outflow of $443.1 million. Direct investment abroad registered
growth due to an increase in inter-company lending and higher reinvested earnings. Direct
investment liabilities (direct investment in Trinidad and Tobago by foreign investors) recorded a
decline on account of repayments on inter-company borrowing and to a lesser extent equity
transactions. These transactions primarily occurred within the energy sector. Movement in
portfolio investment resulted in a net outflow of $562.5 million which was primarily characterized
by an increase in portfolio assets. This was largely driven by investments in long-term debt
securities by the Heritage and Stabilisation Fund (HSF) and short-term debt securities by
commercial banks. In contrast, portfolio liabilities recorded a decrease as residents made
payments on debt securities owed to non-residents. Over the review period, other investment
liabilities recorded an increase that was mainly characterized by higher accounts payable,
loans, trade credits and currency and deposits. Meanwhile, drawdowns on currency and
deposits held abroad primarily contributed to the decline in other investment assets.
Trinidad and Tobago’s gross official reserves amounted to $7,575.0 million at the end of
2018; $794.8 million lower than the level recorded at the end of 2017 and reflecting an
overall deficit on the external accounts. This represents 8.0 months of prospective imports
of goods and services, compared to the import cover of 9.7 months at the end of 201726.
26
Gross official reserves amounted to $8,369.8 million at the end of 2017.

38
TABLE 14A TRINIDAD AND TOBAGO: SUMMARY BALANCE OF PAYMENTS
/US$ Million/
2012r 2013r 2014r 2015r 2016r 2017 Jan-Sep
2017r Jan-Sep
2018p
Current Account 3,324.3 5,410.3 4,005.2 1,855.6 -858.3 1,089.2 977.5 817.8
Goods and Services 5,581.8 6,949.0 5,745.6 2,133.4 -614.7 870.1 841.4 1,403.7 Goods, net* 7,092.7 8,317.1 7,045.2 3,884.5 1,196.6 2,959.7 2,477.2 2,604.6 Exports** 16,324.7 17,593.1 14,964.5 11,413.9 8,285.4 9,411.4 6,977.0 7,878.1 Energy 13,189.9 14,036.3 12,491.5 8,767.3 6,430.8 7,634.5 5,613.2 6,915.5 Non-energy 3,134.8 3,556.7 2,473.0 2,646.7 1,854.5 1,777.0 1,363.8 962.6 Imports** 9,231.9 9,276.0 7,919.3 7,529.5 7,088.7 6,451.7 4,499.8 5,273.4 Fuels*** 2,957.7 3,627.8 2,068.3 1,456.4 1,542.3 1,617.7 1,102.1 1,556.5 Other 6,274.3 5,648.2 5,851.0 6,073.1 5,546.4 4,834.0 3,397.7 3,716.9 Services, net -1,510.9 -1,368.1 -1,299.6 -1,751.1 -1,811.3 -2,089.7 -1,635.8 -1,201.0 Primary income, net -2,296.1 -1,566.8 -1,723.0 -239.6 -300.1 170.5 100.2 -635.9 Secondary income, net 38.6 28.1 -17.4 -38.1 56.4 48.6 35.8 50.1
Capital Account 0.0 0.0 0.0 0.0 0.2 1.2 1.0 1.2
Financial Account 4,108.6 12.1 -67.4 485.4 -1,283.4 543.2 -14.8 589.0
Direct investment 2,093.8 1,192.5 -679.1 -48.5 106.2 550.9 -137.2 443.1 Net acquisition of financial assets 189.4 62.5 -17.7 128.3 82.6 94.1 63.6 116.0 Net incurrence of liabilities -1,904.3 -1,130.0 661.4 176.8 -23.6 -456.9 200.7 -327.1 Portfolio investment 1,587.9 185.5 654.1 799.3 -1,402.8 373.1 139.1 562.5 Net acquisition of financial assets 1,130.8 616.9 746.4 671.7 -97.1 224.1 100.5 518.6 Net incurrence of liabilities -457.1 431.5 92.3 -127.6 1,305.7 -148.9 -38.7 -43.9 Financial derivatives -2.6 4.2 -3.2 -1.0 0.0 4.7 1.2 5.3 Net acquisition of financial assets -2.3 3.9 -1.8 -1.9 0.0 4.4 1.8 5.7 Net incurrence of liabilities 0.2 -0.2 1.3 -0.9 0.0 -0.3 0.5 0.4 Other investment**** 429.5 -1,370.0 -39.2 -264.4 13.3 -385.5 -18.0 -422.1 Net acquisition of financial assets -271.9 -1,426.9 254.6 -706.8 -93.8 163.0 574.4 -80.4 Net incurrence of liabilities -701.4 -56.9 293.8 -442.5 -107.1 548.5 592.4 341.7 Net errors and omissions 172.1 -4,593.0 -2,751.4 -2,934.4 -892.5 -1,643.2 -1,952.4 -1,134.5
Overall Balance -612.2 805.2 1,321.3 -1,564.2 -467.2 -1,096.0 -959.2 -904.5
Current Account 12.8 19.9 14.5 7.4 -3.9 4.9 5.8 4.6 Goods, net 27.4 30.5 25.5 15.4 5.5 13.3 14.8 14.8 Exports 63.1 64.6 54.3 45.3 38.0 42.1 41.6 44.8 Imports 35.7 34.1 28.7 29.9 32.5 28.9 26.9 30.0 Services, net -5.8 -5.0 -4.7 -6.9 -8.3 -9.4 -9.8 -6.8 Primary income, net -8.9 -5.8 -6.2 -1.0 -1.4 0.8 0.6 -3.6 Overall balance -2.4 3.0 4.8 -6.2 -2.1 -4.9 -5.7 -5.1
MEMORANDUM ITEMS
Gross Official Reserves^ 9,370.7 10,175.9 11,497.1 9,933.0 9,465.8 8,369.8 8,506.6 7,465.3 Import Cover (months)^ 10.6 12.2 12.9 11.2 10.5 9.7 9.8 8.1
Source: Central Bank of Trinidad and Tobago
Note: This table is an analytical presentation of the Balance of Payments and is presented in accordance with the IMF’s Balance of Payments and International Investment Position Manual, Sixth Edition (BPM6). Refer to Box 3 of the Economic Bulletin, March 2017 for a Technical Note on the Transition to BPM6.
The following financial account movements are represented with a negative sign: • A decrease in assets (inflow) • A decrease in liabilities (outflow) • A net inflow in net balances
The following financial account movements are represented with a positive sign: • An increase in assets (outflow) • An increase in liabilities (inflow) • A net outflow in net balances
* Energy goods data for 2011-2018 comprise estimates by the Central Bank of Trinidad and Tobago. ** Exports and imports are reported on a FOB (Free on Board) basis. *** Includes petroleum, petroleum products and related materials. Energy exports include exports of petroleum, petroleum products and related
materials and the exports of petrochemicals. **** Other investment comprise currency and deposits, loans, trade credit and advances, other accounts receivable/payable and special drawing
rights (liabilities). ^ End of Period. r Revised. p Provisional.

39
INTERNATIONAL INVESTMENT POSITION
The net international investment position was estimated at $4,105.1 million at the end of
September 2018. This reflects a decline of $627.9 million from the position recorded at the end
of 2017. In particular it represents a decline in the stock of international financial assets of
$617.8 million coupled with an increase in international financial liabilities of $10.0 million (Table
14B).
The reduction in the stock of assets was primarily influenced by a decrease in reserve
assets over the review period. This change in reserve assets primarily stemmed from a
reduction in the value of debt securities. Moreover, other investment assets also registered a
decline mainly on account of drawdowns on currency and deposits held abroad.
Notwithstanding the overall decline, direct and portfolio investment assets registered increases
during the review period. Movement in international investment liabilities occurred in the context
of higher accounts payable, trade credits, loans and currency and deposits owed to non-
residents (other investment liabilities). Partially offsetting the overall increase in investment
liabilities, were declines in direct and portfolio investment liabilities.
TABLE 14B TRINIDAD AND TOBAGO: INTERNATIONAL INVESTMENT POSITION (AT END OF PERIOD)
/US$ Million/
2012r 2013r 2014r 2015r 2016r 2017p Sep
2018p
Net International Investment Position
3,617.4 4,853.3 6,720.3 6,129.5 5,018.9 4,733.0 4,105.1
Assets 22,697.4 23,794.7 26,057.0 24,882.6 24,423.4 24,130.6 23,512.7
Direct investment 555.2 616.2 599.5 785.0 752.3 788.3 846.8
Portfolio investment 6,290.6 7,877.4 8,661.9 9,564.7 9,382.6 10,007.1 10,306.0
Financial derivatives 0.0 3.9 2.1 0.2 0.2 4.4 10.2
Other investment* 6,480.9 5,121.2 5,296.3 4,599.7 4,822.5 4,961.0 4,884.4
Reserve assets 9,370.7 10,175.9 11,497.1 9,933.0 9,465.8 8,369.8 7,465.3
0.0 0.0 0.0 0.0 0.0 0.0 0.0
Liabilities 19,080.0 18,941.4 19,336.7 18,753.1 19,404.6 19,397.6 19,407.6
Direct investment 10,984.3 10,412.8 10,367.8 10,048.6 9,545.2 9,082.9 8,814.5
Portfolio investment 2,673.8 3,086.5 3,194.2 3,084.5 4,291.6 4,132.4 4,091.5
Financial derivatives 0.0 0.0 0.0 0.6 1.9 1.6 1.6
Other investment* 5,421.9 5,442.1 5,774.7 5,619.5 5,565.8 6,180.6 6,499.9
Source: Central Bank of Trinidad and Tobago
r Revised. p Provisional. * Other investment comprise currency and deposits, loans, trade credit and advances, other accounts receivable/payable and special
drawing rights (liabilities).

40
EFFECTIVE EXCHANGE RATES
Trinidad and Tobago's international price competitiveness, as measured by the trade
weighted real effective exchange rate (TWREER)27, improved by 2.4 per cent (year-
on=year) in 2018. Movement in the TWREER was primarily influenced by lower domestic
inflation relative to that of Trinidad and Tobago’s major trading partners. The trade weighted
nominal effective exchange rate (TWNEER), fell by 0.3 per cent while the Effective Inflation
Rate (EIR), which measures domestic inflation rates relative to those of the country’s major
trading partners, declined by 2.1 per cent. More specifically, the slight depreciation in Trinidad
and Tobago’s currency in real effective terms was influenced by the steady reduction in
domestic price increases relative to price increases in Trinidad and Tobago’s major trading
partners. In 2018, the domestic economy’s inflation rate averaged 1.0 per cent, which was
lower than the weighted average inflation rate of the country’s major trading partners (3.2 per
cent). Overall, the combination of the depreciation in the TWNEER and lower domestic inflation
rate would have contributed to Trinidad and Tobago’s exports being more competitive on the
international market (Chart 9).
CHART 9 TRADE WEIGHTED REAL AND NOMINAL EFFECTIVE EXCHANGE RATES
(2000=100)
Source: Central Bank of Trinidad and Tobago
Together with movements in exchange rates and price levels, institutional factors also
play a role in determining a country’s degree of competitiveness. The World Economic
Forum publishes the Global Competitiveness Report annually, and in its 2018 Report countries’
competitiveness levels are now being ranked by the Global Competitiveness Index 4.0 (Table
15), which has been adjusted to integrate the Fourth Industrial Revolution28 into the definition of
competitiveness. The new Index is based on twelve pillars, which are broadly categorized into
four themes: Enabling Environment, Markets, Human Capital and Innovation Ecosystem. In the
27
The TWREER reflects the weighted average of a country’s currency relative to a basket of other major currencies, also known as the trade weighted-nominal effective exchange rate (TWNEER), and adjusted for the effects of inflation.
28 Following the Third Industrial Revolution which introduced the concept of digitization, the Fourth Industrial Revolution is transforming societies’ everyday engagement of technology. According to the World Economic Forum, it is characterized by a fusion of technologies that is blurring the lines between the physical, digital, and biological spheres.
95
105
115
125
135
145
155
165
175
185
In
dex V
alu
e
TWREER TWNEER

41
latest Global Competitiveness Report 2018, Trinidad and Tobago’s ranking declined, moving to
78 (out of 140 countries), from 76 (out of 135 countries) in the 2017 Report. Despite the
downward movement in ranking, Trinidad and Tobago’s overall score relative to other countries
improved by 0.1 to 57.9 (out of 100). Thus, keeping in line with the TWREER, there was a
marginal improvement in the country’s level of competitiveness.
TABLE 15 GLOBAL COMPETITIVENESS INDEX 2018
Index Component Score* Rank**
ENABLING ENVIRONMENT COMPONENT 62.2 71
1. Institutions 49.7 92
2. Infrastructure 58.0 97
3. ICT adoption 53.3 72
4. Macroeconomic Stability 87.8 54
HUMAN CAPITAL COMPONENT 66.3 86
5. Health 73.5 90
6. Skills 62.6 68
MARKETS COMPONENT 54.8 83
7. Product market 52.4 98
8. Labour market 60.2 59
9. Financial system 66.8 42
10. Market size 40.0 105
INNOVATION ECOSYSTEM COMPONENT 45.2 85
11. Business dynamism 56.8 78
12. Innovation capability 33.5 81
OVERALL RANK AND SCORE: 2018 (OUT OF 140) 57.9 78
Overall Rank and Score: 2017-2018 (out of 135)*** 57.8 76 Overall Rank and Score: 2016-2017 (out of 138) 3.9 94 Overall Rank and Score: 2015-2016 (out of 140) 3.9 89 Overall Rank and Score: 2014-2015 (out of 144) 4.0 89 Source: World Economic Forum, Global Competitiveness Report, 2018
Note: In 2018 a new Global Competitiveness Index (GCI) 4.0 methodology was introduced. The new methodology organizes the factors that define a country’s productivity into twelve pillars. While maintaining the objective of the previous methodology, the new index reevaluated the determinants of productivity and its measurement, introducing 64 new indicators and retaining 34 of the 98 indicators from the prior model. * Scores are on a 0 to 100 scale, where 100 represents the optimal situation or 'frontier'. ** Trinidad and Tobago compared to all 140 countries in the Report.
*** Rank and score for 2017 were recalculated by the World Economic Forum using the GCI 4.0 methodology.

42
CHAPTER NINE – INTERNATIONAL AND REGIONAL ECONOMIC DEVELOPMENTS
INTERNATIONAL ECONOMIC DEVELOPMENTS
Global economic growth lost momentum in 2018 reflecting the slower pace of
international trade and investments, intensified US-China trade tensions, prolonged
Brexit uncertainty and tightened financial conditions. World output was weaker than
expected, slowing to 3.6 per cent in 2018 compared to 3.8 per cent one year earlier, according
to the IMF’s April2019 World Economic Outlook (WEO). A main contributor to the drag on
economic growth in 2018 was the US imposition of trade tariffs against a few of its trading
partners, particularly China, and resulting retaliatory actions. Meanwhile, monetary policy
normalization continued in Advanced Economies (AEs) while central banks in Emerging Market
and Developing Economies (EMDE), such as Turkey and Argentina, tightened policy rates to
confront currency and inflation pressures. Oil price volatility heightened in the second half of
2018, with sharp falls toward the end of the year, mainly due to oversupply which emanated
from shale oil production in the US and increased supply by the Organization of the Petroleum
Exporting Countries (OPEC) and Russia. EMDEs also experienced sporadic episodes of capital
outflows, reflecting increased risk aversion by investors and renewed attention to external
vulnerabilities.
Real GDP growth was mixed among the AEs in 2018 while inflation rates hovered around
the central banks 2.0 per cent target rate (Table 16). Despite increases in consumer
spending, a slowdown in business investment in the UK dampened economic growth as a result
of the unpredictability surrounding Brexit negotiations. Although the reduced pace of economic
growth led to downward trend in the inflation rates throughout 2018, inflation remained above
the Bank of England’s 2.0 per cent inflation target. Meanwhile, slowing net exports, reflecting
the appreciation of the euro, and softer external demand were responsible for the notable
decline in economic performance in the Euro Area. Consequently, inflation in the Euro Area
remained below but close to 2.0 per cent for most of 2018. The Japanese economy also
experienced slow economic growth in the latter half of 2018 stemming from bad weather and
natural disasters. In addition, the Bank of Japan kept interest rates unchanged in 2018, despite
having below target inflation rates. Conversely, bolstered by fiscal stimulus (in the form of tax
cuts and higher public spending) and increased domestic consumption, US economic activity
remained resilient throughout 2018. The US Federal Reserve (the Fed) achieved its target
increase of 2.0 per cent in the core personal consumption price index (PCEPI) in March, May,
June, July, September and December 2018. Job gains remained strong in the US, with an
improvement in the unemployment rate to 3.9 per cent at the end of 2018 compared to 4.1 per
cent at the beginning of the year. Unemployment rates also improved in the other major AEs
despite the deceleration of economic growth during 2018.
The gradual tightening of interest rates in the US posed challenges to the EMDEs. The
Fed remained committed to monetary policy normalisation in 2018 through four rate hikes
(totalling 100 basis points) of the federal funds rate to reach 2.5 per cent in December 2018.
Simultaneously, the Fed continued to allow maturing treasuries and mortgage backed securities
to roll off its balance sheet, reducing its total asset size to US$4.1 trillion at the end of December

43
2018 compared to US$4.4 trillion at the end of December 2017. However, going forward the
Fed is likely to carry a balance sheet that is larger than the historical trend. This coupled with
the increased US long-term yields, which reflected rising inflation expectations and the
anticipated interest rate hikes by the Fed, contributed to bouts of global stock market volatility,
higher borrowing costs, and capital outflows in EMDEs during 2018.
TABLE 16 ADVANCED ECONOMIES - REAL GDP GROWTH
/Per Cent/
2012r 2013
r 2014
r 2015
r 2016
r 2017
r 2018
e 2019
f 2020
f
United States 2.2 1.8 2.5 2.9 1.6 2.2 2.9 2.3 1.9
United Kingdom 1.4 2.0 2.9 2.3 1.8 1.8 1.4 1.2 1.4
Euro Area -0.9 -0.2 1.4 2.1 1.2 2.4 1.8 1.3 1.5
Japan 1.5 2.0 0.4 1.2 0.6 1.9 0.8 1.1 0.5
Sources: International Monetary Fund World Economic Outlook Database (April 2019)
r Revised. e Estimate. f Forecast.
Despite the pickup of economic growth in some of the major EMDEs, aggregate output
slowed, highlighting the disparity in country-specific factors. Based on the IMF estimates,
economic growth for the EMDEs moderated to 4.5 per cent, 0.3 per cent lower than 2017.
Strong domestic demand contributed to the expansion of India’s economic activity while trade
tensions and tightened regulation of the property sector restrained China’s economic activity to
its lowest level of real GDP growth since the global financial crisis (Table 17). Meanwhile,
Russia’s economic growth was supported by private consumption and exports, however, policy
uncertainty, end of year oil price declines and renewed currency pressures contributed to a
lackluster performance. Although Brazil’s economic outturn improved for 2018, it was weaker
than expected due to the production disruptions from the May/June trucker’s strike. The
expansion of economic activity in Russia and Brazil supported lower unemployment rates in
these countries. Concurrently, inflation rates in Brazil and India were within their inflation target
ranges during 2018, but remained below their respective targets for Russia and China29.
29
Central Bank inflation target rate or ranges: Brazil (3.0-6.0 per cent), Russia (4.0 per cent), India (2.0-6.0 per cent) and China (3.0 per cent).

44
TABLE 17 EMERGING ECONOMIES - REAL GDP GROWTH
/Per Cent/
2012
r 2013
r 2014
r 2015
r 2016
r 2017
r 2018
e 2019
f 2020
f
China 7.9 7.8 7.3 6.9 6.7 6.8 6.6 6.3 6.1
India* 5.5 6.4 7.4 8.0 8.2 7.2 7.1 7.3 7.5
Russia 3.7 1.8 0.7 -2.5 0.3 1.6 2.3 1.6 1.7
Brazil 1.9 3.0 0.5 -3.5 -3.3 1.1 1.1 2.1 2.5
Source: International Monetary Fund World Economic Outlook Database (April 2019)
* Data are presented on a fiscal year basis. f Forecast. e Estimate.
REGIONAL ECONOMIC DEVELOPMENTS
Economic performance in the Latin American and Caribbean (LAC) region remained
subdued. Economic recovery was undermined by lower private investment relating to
uncertainty surrounding the renegotiations of the North America Free Trade Agreement
(NAFTA), a currency crisis in Argentina, the May/June trucker’s strike in Brazil and the
worsening sociopolitical conditions in Venezuela. Real GDP growth in the LAC region
decelerated to 1.0 per cent in 2018 from 1.2 per cent one year earlier (IMF April 2019 WEO).
Economic activity in the LAC region was supported by lowered monetary policy rates in Chile,
Colombia and Peru during 2018. However, the Bank of Mexico increased its benchmark
interest rate to its highest in a decade to restore investor confidence. Despite the depreciation
of some currencies in the region in 2018, inflation rose only modestly, particularly in Chile,
Colombia and Peru, reflecting the slow exchange rate pass through to consumer prices.
Economic performance varied in the Caribbean during 2018 (Table 18). Jamaica’s
economic growth improved in 2018, with historically low unemployment rates, low inflation,
decelerating public debt and increases in international reserves. Meanwhile, Guyana’s
economic growth was mainly driven by the agricultural and services sectors. Following the 2017
hurricanes, economic activity strengthened in most member countries of the Eastern Caribbean
Currency Union (ECCU) as the tourism industry improved in 2018. Real GDP growth in
Barbados contracted as moderate gains in tourism were outweighed by the fall-off in
manufacturing and other services. The IMF is providing assistance to Barbados through a 48-
month Extended Fund Facility (EFF), with access of SDR 208.0 million (US$290.0 million). An
initial tranche of approximately US$49.0 million was provided on October 1, 2018. The
Government of Barbados has also developed an Economic Recovery and Transformation
(BERT) Plan. The main focus of BERT is fiscal consolidation through a review of tax policies,
reforms of state-owned enterprises; other elements of the plan include debt restructuring,
structural reform and institutional independence of the Central Bank. Caribbean countries also
faced other macroeconomic challenges regarding negative external current account balances
(Table 19), high unemployment, high levels of sovereign indebtedness and fiscal deficits.

45
Monetary policy remained unchanged in the ECCU and was loosened in Jamaica and
Barbados. The Eastern Caribbean Central Bank kept the minimum savings rate and deposit
rate steady at 2.0 per cent and 6.5 per cent respectively in 2018. Over the course of 2018, the
Bank of Jamaica (BoJ) lowered its benchmark interest rate – the overnight deposit rate – five
times to 1.75 per cent in December 2018 from 3.25 per cent in December 2017 to keep inflation
from breaching the lower bound of its inflation target30. In an effort to strengthen the BoJ
operational autonomy, proposals for legislative reform to the BoJ Act were submitted to the
Parliament in October 2018. Meanwhile, improvements in Barbados public accounts allowed
the Central Bank of Barbados to honour its commitment of reducing its securities reserve ratio
for commercial banks. The ratio was lowered from 20.0 per cent to 17.5 per cent in November
2018.
TABLE 18 REAL GDP GROWTH - SELECTED LAC
/Per Cent/
Country 2012r 2013
r 2014
r 2015
r 2016
r 2017
r 2018
e 2019
f 2020
f
Argentina -1.0 2.4 -2.5 2.7 -2.1 2.7 -2.5 -1.2 2.2
The Bahamas 3.1 -0.4 -0.1 1.0 -1.7 1.4 2.3 2.1 1.6
Barbados -0.1 -1.4 -0.2 2.2 2.3 -0.2 -0.5 -0.1 0.6
Belize 2.9 0.9 3.7 3.4 -0.6 1.4 3.0 2.5 2.1
Chile 5.3 4.0 1.8 2.3 1.7 1.3 4.0 3.4 3.2
Colombia 3.9 4.6 4.7 3.0 2.1 1.4 2.7 3.5 3.6
Eastern Caribbean Currency Union 0.4 1.7 3.1 2.8 2.6 2.6 2.8 3.8 n.a.
Guyana 5.0 5.0 3.9 3.1 3.4 2.1 3.4 3.8 29.6
Haiti 2.9 4.2 2.8 1.2 1.5 1.2 1.5 1.5 1.5
Jamaica -0.5 0.2 0.6 0.9 1.5 0.7 1.4 1.7 1.9
Mexico 3.6 1.4 2.8 3.3 2.9 2.1 2.0 216 1.9
Suriname 2.7 2.9 0.3 -3.4 -5.6 1.7 2.0 2.2 2.5
Sources: International Monetary Fund World Economic Outlook Database (April 2019) and Regional Economic Outlook, Western Hemisphere (October 2018) e Estimate.
f Forecast. r Revised.
30
The Bank of Jamaica reduced its key policy rate in January, February, May, June and December 2018.
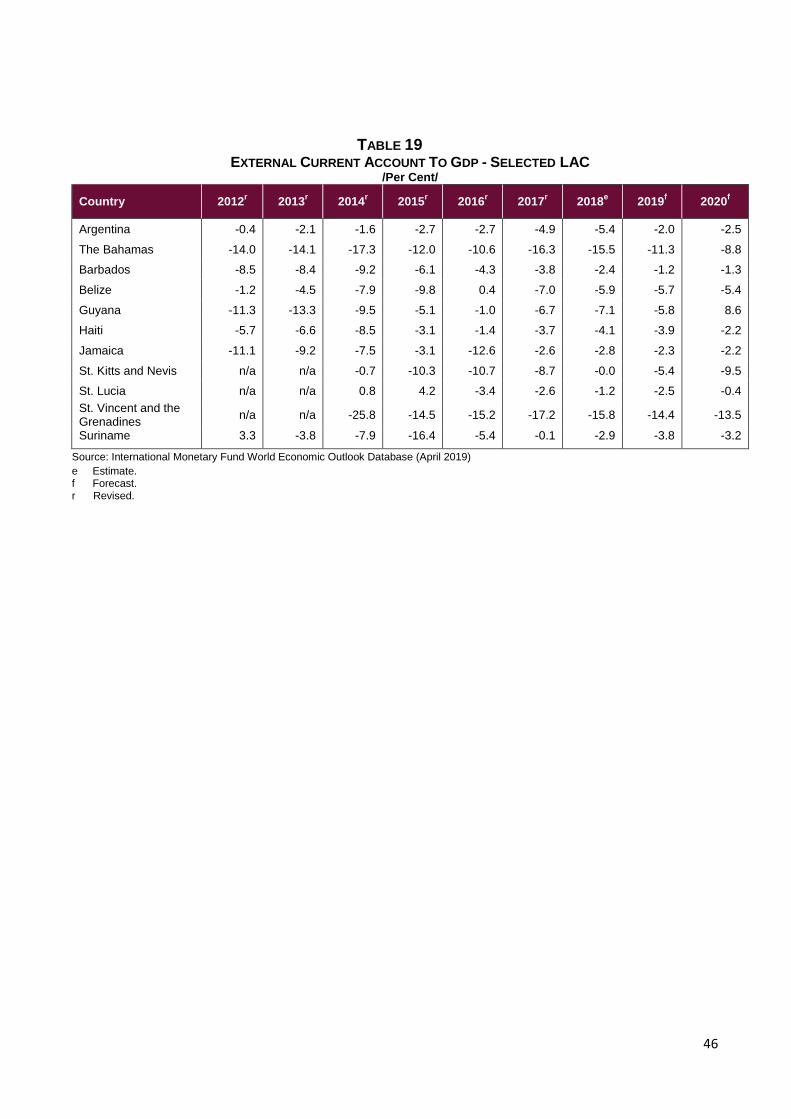
46
TABLE 19 EXTERNAL CURRENT ACCOUNT TO GDP - SELECTED LAC
/Per Cent/
Country 2012r 2013
r 2014
r 2015
r 2016
r 2017
r 2018
e 2019
f 2020
f
Argentina -0.4 -2.1 -1.6 -2.7 -2.7 -4.9 -5.4 -2.0 -2.5
The Bahamas -14.0 -14.1 -17.3 -12.0 -10.6 -16.3 -15.5 -11.3 -8.8
Barbados -8.5 -8.4 -9.2 -6.1 -4.3 -3.8 -2.4 -1.2 -1.3
Belize -1.2 -4.5 -7.9 -9.8 0.4 -7.0 -5.9 -5.7 -5.4
Guyana -11.3 -13.3 -9.5 -5.1 -1.0 -6.7 -7.1 -5.8 8.6
Haiti -5.7 -6.6 -8.5 -3.1 -1.4 -3.7 -4.1 -3.9 -2.2
Jamaica -11.1 -9.2 -7.5 -3.1 -12.6 -2.6 -2.8 -2.3 -2.2
St. Kitts and Nevis n/a n/a -0.7 -10.3 -10.7 -8.7 -0.0 -5.4 -9.5
St. Lucia n/a n/a 0.8 4.2 -3.4 -2.6 -1.2 -2.5 -0.4
St. Vincent and the Grenadines
n/a n/a -25.8 -14.5 -15.2 -17.2 -15.8 -14.4 -13.5
Suriname 3.3 -3.8 -7.9 -16.4 -5.4 -0.1 -2.9 -3.8 -3.2
Source: International Monetary Fund World Economic Outlook Database (April 2019)
e Estimate. f Forecast. r Revised.

47
CHAPTER TEN – INTERNATIONAL COMMODITY MARKETS
Energy commodity prices incurred sizable increases in 2018 evidenced by an 18.6 per
cent increase in the Energy Commodity Price Index (ECPI)31. The surge was led by strong
crude oil and natural gas prices, though all other commodities in the index increased.
Crude oil prices grew 27.3 per cent in 2018. West Texas Intermediate (WTI) prices averaged
US$64.8 per barrel in 2018 compared to US$50.9 per barrel in 2017. Prices trended upward
throughout most of 2018 with WTI prices peaking at US$70.8 per barrel in October while
international benchmark Brent crude oil prices exceeded US$80.0 per barrel in the same month.
Strength in prices during the year stemmed from fears of crude shortages from November,
when US sanctions on Iranian production were set to take effect. However prices dipped
thereafter, as Iran’s largest crude customers were afforded waivers on the imposed sanctions,
which allowed them to continue to purchase the country’s crude oil.
Natural gas markets were characterized by strong demand in 2018. Prices also benefitted
from the knock on effects of strong crude oil prices. The average US Henry Hub price
increased 6.4 per cent year-on-year to US$3.2 per mmbtu in 2018. Prices were particularly
strong in the second half of the year as a warmer-than-usual autumn in the US increased the
demand for power for air-conditioning. Prices peaked in the final quarter of 2018 with the onset
of winter conditions, which drove natural gas demand for heating.
31
The Energy Commodity Price Index (ECPI) is a summary measure of the price movements of Trinidad and Tobago’s top ten energy-based commodity exports. Developed in a collaborative effort between the Energy Chamber and the Central Bank, the series is based on export values in 2007 and complements other available price indicators, including individual commodities and sectoral export price indices prepared by the Central Statistical Office. For further details on the computation of the Energy Commodity Prices Index (ECPI), see Finch, K. and Cox, D. 2010. The Energy Commodity Price Index. Central Bank of Trinidad and Tobago, Economic Bulletin, Volume XII No. 2. pp.84.

CENTRAL BANK OF TRINIDAD & TOBAGO
ANNUAL ECONOMIC SURVEY 2018
A.1 Real GDP Growth by Sector of Origin
A.2 Gross Domestic Product at Current Market Prices by Sector of Origin
A.3 Sectoral Composition of G.D.P. at Current Market Prices
A.4 Major Agricultural Commodities
A.5 Production and Utilisation of Crude Oil and Related Products and Petrochemicals
A.6 Production of Iron and Steel Products and Cement
A.7 Prices of Selected Export Commodities
A.8 Index of Domestic Production (1995=100)
A.9 Annual Changes in the Indices of Production and Hours Worked (All Employees)
A.10 Annual Changes in the Indices of Average Weekly Earnings and Employment (All Employees)
A.11 Annual Changes in the Indices of Real Earnings and Output per Man Hour Worked (All Employees)
A.12 Index of Retail Prices for Major Expenditure Categories
A.13 Index of Producers’ Prices
A.14 Central Goverment Fiscal Operations
A.15 Central Government Revenue
A.16 Central Government Expenditure
A.17 (A) Central Government External Debt
A.17 (B) Central Government Internal Debt
A.18 (A) Commercial Banks: Selected Data
A.18 (B) Summary Accounts of the Monetary System
A.19 Liquidity Position of Commercial Banks
A.20 Commercial Banks: Distribution of Loans and Advances by Sector
A.21 Commercial Banks: Percentage Distribution of Loans and Advances by Sector
A.22 Commercial Banks - Interest Rates
A.23 Money Supply
A.24 Finance Companies and Merchant Banks: Summary of Assets and Liabilities
A.25 Finance Companies and Merchant Banks: Distribution of Loans and Advances by Sector
A.26 Finance Companies and Merchant Banks: Percentage Distribution of Loans and Advances by Sector
A.27 Trust and Mortgage Finance Companies: Summary of Assets and Liabilities
A.28 Development Banks: Summary of Assets and Liabilities
r - Revised
n.a. - Not Available
p - Provisional
55
56
57
58
59
60
61
62
63
64
65
66
67
68
69
70
71
71
72
73
74
75
76
77
78
79
80
81
82
83
TABLES A.1 - A.36
re - Revised Estimates
c - Confidential

CENTRAL BANK OF TRINIDAD & TOBAGO
ANNUAL ECONOMIC SURVEY 2018
TABLES A.1 - A.41 (continued)
A.29 Thrift Institutions: Summary of Assets and Liabilities
A.30 Non-Bank Financial Institutions Interest Rates
A.31 Money and Capital Market Activity
A.32 Selected Interest Rates
A.33 (A) Balance of Payments, Standard Presentation
A.33 (B) Direct Investment: Net Incurrence of Liabilities (By Sector)
A.33 (C) Direct Investment: Net Incurrence of Liabilities (By Country)
A.34 Weighted Average TT Dollar Exchange Rates for Selected Currencies
A.35 Trinidad and Tobago - International Reserves
A.36 Summary Accounts of the Central Bank
84
85
86
87
88
89
90
91
92
93
94
95
96
97

CENTRAL BANK OF TRINIDAD & TOBAGO
ANNUAL ECONOMIC SURVEY 2018
TABLE A.1
REAL GDP GROWTH1
BY SECTOR OF ORIGIN, 2014-2018/PER CENT/
SECTOR 2014 2015 2016 2017 2018p
Agriculture, Forestry and Fishing -9.9 25.1 -15.3 21.5 -15.6
Mining and Quarrying -0.9 -3.2 -13.2 0.9 -1.8
Manufacturing -3.3 0.9 -3.4 -2.6 7.3
Electricity, Gas, Steam and Air Conditioning Supply -3.6 1.8 -8.1 8.7 0.6
Water Supply; Sewerage, Waste Management and Remediation Activities
-5.5 1.5 1.7 1.5 3.1
Construction 1.3 -2.7 -4.2 -4.1 -3.3
Wholesale and Retail Trade; Repair of Motor Vehicles and Motorcycles
0.3 3.6 -7.2 -11.3 -1.2
Transportation and Storage 4.5 -4.5 -16.9 6.4 1.1
Accommodation and Food Service Activities 0.7 -1.2 -2.0 -1.3 -0.7
Information and Communication 1.0 2.4 -2.3 -1.6 1.1
Financial and Insurance Activities 0.2 3.4 2.4 0.9 1.1
Real Estate Activities 0.3 0.5 0.5 0.4 0.5
Professional, Scientific and Technical Activities 2.7 -14.3 -2.4 5.6 2.1
Administrative and Support Service Activities -12.4 36.5 -2.4 5.2 1.8
Public Administration and Defence; Compulsory Social Security 3.7 1.4 2.1 0.6 -0.6
Education 2.4 2.1 2.7 2.5 2.5
Human Health and Social Work Activities 0.4 0.3 0.3 0.2 0.2
Arts, Entertainment and Recreation 0.4 0.3 0.3 0.2 0.2
Other Service Activities 1.1 0.0 0.7 -1.4 -0.1
Activities of Households as Employers; Undifferentiated Goods- and Services-Producing Activities of Households for Own Use
1.3 1.2 1.2 1.1 1.1
FISIM2 -0.6 3.2 1.3 -1.5 2.9
GDP At Basic Prices -0.7 0.9 -6.0 -1.8 0.8
Taxes Less Subsidies on Products -8.8 29.2 -19.4 -2.4 30.7
GDP At Purchasers Prices/Market Prices -1.0 1.8 -6.5 -1.9 1.9
SOURCE: Central Statistical Office
1 In 2017, the CSO changed the base year to 2012 and the industry breakdown now conforms to the International Standard Indus-trial Classification of All Economic Activities, Revision 4 (ISIC. Rev 4).
2 Financial Intermediation Services Indirectly Measured.

CENTRAL BANK OF TRINIDAD & TOBAGO
ANNUAL ECONOMIC SURVEY 2018
TABLE A.2
GROSS DOMESTIC PRODUCT AT CURRENT MARKET PRICES1
BY SECTOR OF ORIGIN, 2014-2018
SECTOR 2014 2015 2016 2017 2018p
Agriculture, Forestry and Fishing 608 705 707 689 738
Mining and Quarrying 37,873 21,984 14,037 19,010 24,491
Manufacturing 28,237 24,228 24,865 23,643 25,210
Electricity, Gas, Steam and Air Conditioning Supply 6,156 3,740 1,501 2,632 3,297
Water Supply; Sewerage, Waste Management and Remediation Activities
2,099 2,297 2,211 2,453 2,437
Construction 9,724 9,748 9,282 8,907 8,856
Wholesale and Retail Trade; Repair of Motor Vehicles and Motorcycles
38,515 37,374 34,412 32,656 32,448
Transportation and Storage 5,075 5,259 5,485 5,858 6,012
Accommodation and Food Service Activities 2,500 2,507 2,485 2,536 2,640
Information and Communication 4,429 4,053 3,941 3,814 4,114
Financial and Insurance Activities 9,912 10,048 10,263 12,922 11,906
Real Estate Activities 3,048 3,084 3,130 3,184 3,224
Professional, Scientific and Technical Activities 3,040 3,070 3,021 3,221 3,323
Administrative and Support Service Activities 3,898 5,987 5,895 6,270 6,448
Public Administration and Defence; Compulsory Social Security 12,609 14,228 14,326 14,489 13,952
Education 3,691 4,999 4,111 3,965 4,178
Human Health and Social Work Activities 695 777 741 742 743
Arts, Entertainment and Recreation 494 497 435 244 273
Other Service Activities 745 815 822 873 905
Activities of Households as Employers; Undifferentiated Goods- and Services-Producing Activities of Households for Own Use
240 273 301 337 374
FISIM2 -3,359 -3,344 -3,430 -3,998 -4,165
GDP At Basic Prices 170,230 152,330 138,541 144,447 151,404
Taxes Less Subsidies on Products 5,879 7,880 6,486 6,400 7,100
GDP At Purchasers Prices/Market Prices 176,109 160,210 145,027 150,847 158,505
SOURCE: Central Statistical Office
1 In 2017, the CSO changed the base year to 2012 and the industry breakdown now conforms to the International Standard Indus-trial Classification of All Economic Activities, Revision 4 (ISIC. Rev 4).
2 Financial Intermediation Services Indirectly Measured.

CENTRAL BANK OF TRINIDAD & TOBAGO
ANNUAL ECONOMIC SURVEY 2018
TABLE A.3
SECTORAL COMPOSITION OF G.D.P.1AT CURRENT MARKET PRICES, 2014-2018
/PER CENT/
SECTOR 2014 2015 2016 2017 2018p
Agriculture, Forestry and Fishing 0.3 0.4 0.5 0.5 0.5
Mining and Quarrying 21.5 13.7 9.7 12.6 15.5
Manufacturing 16.0 15.1 17.1 15.7 15.9
Electricity, Gas, Steam and Air Conditioning Supply 3.5 2.3 1.0 1.7 2.1
Water Supply; Sewerage, Waste Management and Remediation Activities
1.2 1.4 1.5 1.6 1.5
Construction 5.5 6.1 6.4 5.9 5.6
Wholesale and Retail Trade; Repair of Motor Vehicles and Motorcycles
21.9 23.3 23.7 21.6 20.5
Transportation and Storage 2.9 3.3 3.8 3.9 3.8
Accommodation and Food Service Activities 1.4 1.6 1.7 1.7 1.7
Information and Communication 2.5 2.5 2.7 2.5 2.6
Financial and Insurance Activities 5.6 6.3 7.1 8.6 7.5
Real Estate Activities 1.7 1.9 2.2 2.1 2.0
Professional, Scientific and Technical Activities 1.7 1.9 2.1 2.1 2.1
Administrative and Support Service Activities 2.2 3.7 4.1 4.2 4.1
Public Administration and Defence; Compulsory Social Security 7.2 8.9 9.9 9.6 8.8
Education 2.1 3.1 2.8 2.6 2.6
Human Health and Social Work Activities 0.4 0.5 0.5 0.5 0.5
Arts, Entertainment and Recreation 0.3 0.3 0.3 0.2 0.2
Other Service Activities 0.4 0.5 0.6 0.6 0.6
Activities of Households as Employers; Undifferentiated Goods- and Services-Producing Activities of Households for Own Use
0.1 0.2 0.2 0.2 0.2
SOURCE: Central Statistical Office
1 In 2017, the CSO changed the base year to 2012 and the industry breakdown now conforms to the International Standard Indus-trial Classification of All Economic Activities, Revision 4 (ISIC. Rev 4).

CENTRAL BANK OF TRINIDAD & TOBAGO
ANNUAL ECONOMIC SURVEY 2018
TABLE A.4
MAJOR AGRICULTURAL COMMODITIES, 2013-2017
PRODUCTS 2013 2014 2015 2016 2017
VEGETABLES (000 kgs)Tomato 1,501 1,416 2,698 2,223 2,645Cabbage 336 344 594 434 435Cucumber 1,217 1,185 1,173 1,102 804Dasheen 3,427 4,060 1,917 2,396 3,224Rice 2,859 2,914 2,721 1,823 1,619Pigeon Peas 770 2,057 1,687 858 2,043Pumpkin 2,751 2,130 3,279 3,032 1,884Melongene 1,113 1,165 906 1,713 913
MEAT SUPPLY (000 kgs)
Beef and Veal Production 308 326 287 285 226Imports n.a n.a n.a n.a n.a
Pork Production 2,666 2,619 1,778 1,910 2,178Imports n.a n.a n.a n.a n.a
Mutton Production 197 74 77 60 70Imports n.a n.a n.a n.a n.a
Broilers (000 birds): Production 26,392 33,750 32,161 31,708 33,227Table Eggs (000 doz): Production 5,361 5,583 4,800 5,384 7,438Milk (000 litres): Production 4,127 3,942 3,731 2,324 2,428
COCOA (000 kgs)
Production 294 328 169* n.a n.aExports n.a n.a n.a n.a n.aLocal Sales n.a n.a n.a n.a n.a
COFFEE (000 kgs)
Production 1 2 0 n.a n.aExports n.a n.a n.a n.a n.aLocal Sales n.a n.a n.a n.a n.a
CITRUS (000 kgs)
Production n.a. n.a n.a n.a n.aExports n.a. n.a n.a n.a n.a
SOURCE: Central Statistical Office
* Data for the period January to March 2015.

CENTRAL BANK OF TRINIDAD & TOBAGO
ANNUAL ECONOMIC SURVEY 2018
TABLE A.5PRODUCTION AND UTILISATION OF CRUDE OIL ANDRELATED PRODUCTS AND PETROCHEMICALS, 2014-2018
COMMODITY GROUP 2014 2015 2016 2017 2018
CRUDE OILExploration (meters)
Depth Drilled 110,590 147,076 108,886 121,396 110,182Production (000 barrels)
Crude Oil and Condensates 29,661 28,710 26,164 26,216 21,420Of which: Condensates 5,357 5,051 4,171 4,604 3,338
Daily Average (b/d) 81,255 78,697 71,504 71,853 63,533Imports (000 barrels)
Crude Oil Imports 20,694 28,622 37,014 32,240 22,886Of which: u.p.a. 211 125 0 0 0
Refining (000 barrels) Refinery Throughput 38,212 45,766 54,257 47,720 36,000Refinery Output 36,780 44,213 52,717 46,763 35,631Capacity Utilisation (%)1 62 75 88 78 59
Exports (000 barrels) Crude Oil Exports 11,900 11,319 10,292 9,972 8,047Petroleum Products 29,084 34,204 44,207 36,958 29,039
Natural Gas (Mn cubic feet/day) Production 4,071 3,833 3,327 3,366 3,585Utilisation2 3,789 3,578 3,104 3,172 3,378
Of which: Petrochemicals 1,098 1,114 1,022 1,048 1,061 Electricity Generation 301 295 271 252 242 LNG 2,178 1,967 1,650 1,722 1,921
Natural Gas Liquids (000 barrels) Production 11,992 10,993 9,214 9,806 8,695Exports 11,022 10,182 7,996 8,541 7,668Local Sales 763 937 1,085 1,152 1,037*Stock Change 206 -126 133 113 330*
Fertilisers (000 tonnes) Production 5,169 5,453 5,522 5,595 5,431Exports 4,769 4,946 5,228 5,141 4,924Local Sales 5 5 6 5 5Stock Change 395 501 289 449 501
Methanol (000 tonnes) Production 5,481 5,516 4,655 4,975 5,081Exports 5,525 5,479 4,637 4,962 5,010Local Sales 6 6 7 7 6**Stock Change -50 31 11 7 -88**
SOURCES: Ministry of Energy and Energy Industries and the Central Bank of Trinidad and Tobago
1 Refinery capacity is estimated at 168,000 barrels per day.2 Utilisation refers to gas sales and does not include natural gas used in own consumption.* For the period January to September 2018.** For the period January to October 2018.

CENTRAL BANK OF TRINIDAD & TOBAGO
ANNUAL ECONOMIC SURVEY 2018
TABLE A.6PRODUCTION OF IRON AND STEEL PRODUCTS AND CEMENT, 2014-2018
PRODUCTS 2014 2015 2016 2017 2018
STEEL PRODUCTS (000 TONNES)
(i) Direct Reduced Iron
Production 1,633.0 901.1 0.0 0.0 0.0
Exports 1,064.8 656.4 0.0 0.0 0.0
Local Sales 0.0 0.0 0.0 0.0 0.0
Own Consumption 519.0 260.5 0.0 0.0 0.0
(ii) Billets
Production 483.3 266.5 0.0 0.0 0.0
Exports 151.2 120.0 0.0 0.0 0.0
Local Sales 45.2 22.7 0.0 0.0 0.0
Own Consumption 312.4 124.9 0.0 0.0 0.0
(iii) Wire Rods
Production 300.0 129.5 0.0 0.0 0.0
Exports 289.2 130.1 0.0 0.0 0.0
Local Sales 25.8 11.5 0.0 0.0 0.0
Own Consumption 1.3 4.2 0.0 0.0 0.0
CEMENT (000 TONNES)
Production 836.5 840.1 721.2 670.0 662.6
Local Sales 666.0 656.0 526.2 497.3 483.8
Exports 170.1 185.9 192.7 219.2 270.9
SOURCE: Central Bank of Trinidad and Tobago

CENTRAL BANK OF TRINIDAD & TOBAGO
ANNUAL ECONOMIC SURVEY 2018
TABLE A.7
PRICES OF SELECTED EXPORT COMMODITIES, 2014-2018
SECTOR 2014 2015 2016 2017 2018
Crude Oil (WTI1; US$/bbl2) 93.1 48.7 43.2 50.9 64.8
Crude Oil (Brent; US$/bbl2) 99.6 52.9 44.6 54.9 72.9
Natural Gas (Henry Hub; US$/mmbtu3) 4.4 2.6 2.5 3.0 3.2
Ammonia (FOB Caribbean; US$/tonne) 505.6 413.1 235.1 236.6 268.3
Urea (FOB Caribbean; US$/tonne) 360.3 282.2 206.8 214.9 245.4
Methanol (FOB Rotterdam; US$/tonne) 513.5 381.9 272.1 399.1 474.2
Billets (FOB Latin America; US$/tonne) 492.6 351.5 323.7 430.9 501.6
Wire Rods (FOB Latin America; US$/tonne) 583.6 416.0 373.0 485.9 580.7
SOURCE: Bloomberg; Green Markets; Fertiliser Week; European Chemical News; Monthly Methanol Newsletter (TECNON); Metal Bulletin; Platts
All prices are monthly averages of published quotations and not necessarily realised prices. 1 West Texas Intermediate.2 US dollars per barrel.3 US dollars per million British thermal units.

CENTRAL BANK OF TRINIDAD & TOBAGO
ANNUAL ECONOMIC SURVEY 2018
TABLE A.8
INDEX OF DOMESTIC PRODUCTION (1995=100), 2014-2018
PRODUCTS WEIGHT 2014r 2015r 2016r 2017r 2018p
Food Processing 58 732.1 833.5 1,072.6 1,230.1 1,444.5
Drink and Tobacco 63 1,083.9 1,091.2 1,031.0 929.6 1,148.1
Textiles, Garments and Footwear 6 1,682.2 1,473.9 1,294.3 1,320.7 1,333.8
Printing, Publishing and Paper Converters 27 334.2 305.8 302.1 276.2 229.7
Wood and Related Products 7 933.6 907.6 839.0 735.0 685.0
Chemicals and Non-Metallic Minerals 43 325.2 305.6 291.8 307.6 320.0
Assembly-Type and Related Industries 61 1,319.2 840.3 259.8 244.8 232.2
Miscellaneous Manufacturing Industries 10 199.1 193.5 186.9 178.8 175.3
Electricity 40 122.9 115.7 90.3 80.2 71.4
Water 6 162.1 167.1 151.6 118.8 109.6
All Industry Index
(Excluding Petrochem, Oil and Natural Gas,Explor., Product. and Refining) 320 746.5 664.5 574.5 576.3 651.4
Explor., and Product. of Oil, Natural Gas, etc. 445 136.3 130.4 116.7 117.2 112.6
Petrochemicals 182 211.9 225.0 219.8 223.6 219.7
Oil and Natural Gas Refining 53 601.3 812.5 939.2 883.3 728.3
All Industry Index
(Including Petrochem, Oil and Natural Gas, 1,000 370.1 354.8 325.7 324.2 337.3Explor., Product. and Refining)
SOURCE: Central Statistical Office

CENTRAL BANK OF TRINIDAD & TOBAGO
ANNUAL ECONOMIC SURVEY 2018
TABLE A.9ANNUAL CHANGES IN THE INDICES OF PRODUCTION AND
HOURS WORKED (ALL EMPLOYEES), 2016-20181
/ PER CENT /
INDUSTRY
DOMESTIC PRODUCTION(1995=100)
INDEX OF HOURS WORKED(1995=100)
2016r 2017r 2018p 2016r 2017r 2018p
Food Processing 28.7 14.7 17.4 -4.8 -3.8 0.6
Drink and Tobacco -5.5 -9.8 23.5 -9.0 -2.8 -2.3
Textiles, Garments and Footwear -12.2 2.0 1.0 -1.4 -1.2 -0.5
Printing, Publishing and Paper Converters -1.2 -8.6 -16.8 -1.0 -0.7 1.4
Wood and Related Products -7.5 -12.4 -6.8 -10.2 0.0 4.4
Chemicals and Non-Metallic Minerals -4.5 5.4 4.1 -6.4 0.6 -0.1
Assembly-Type and Related Industries -69.1 -5.8 -5.1 -21.5 -1.9 -2.0
Miscellaneous Manufacturing Industries -3.4 -4.3 -2.0 -7.8 -7.7 -8.9
Electricity -21.9 -11.2 -10.9 -16.8 -2.9 -9.0
Water -9.2 -21.6 -7.8 -0.7 0.0 0.1
All Industry Index
(Excluding Petrochem, Oil and Natural Gas,Explor., Product. and Refining) -13.5 0.3 13.0 -7.1 -2.0 -0.6
Explor., and Product. of Oil, Natural Gas, etc. -10.4 0.4 -3.9 -10.7 -10.8 -5.3
Petrochemicals -2.3 1.7 -1.7 -6.3 -6.2 -2.8
Oil and Natural Gas Refining 15.6 -6.0 -17.5 2.0 0.1 -9.7
All Industry Index
(Including Petrochem, Oil and Natural Gas, -8.2 -0.5 4.0 -5.0 -1.8 -3.1Explor., Product. and Refining)
SOURCE: Central Statistical Office
1 Percentage changes over the corresponding period.

CENTRAL BANK OF TRINIDAD & TOBAGO
ANNUAL ECONOMIC SURVEY 2018
TABLE A.10ANNUAL CHANGES IN THE INDICES OF AVERAGE
WEEKLY EARNINGS AND EMPLOYMENT(ALL EMPLOYEES), 2016-20181
/ PER CENT /
INDUSTRY
AVERAGE WEEKLY EARNINGS(1995=100)
EMPLOYMENT(1995=100)
2016 2017 2018p 2016 2017 2018p
Food Processing 0.0 2.6 -1.3 -0.7 0.0 0.5
Drink and Tobacco 0.7 -7.5 3.7 -2.7 1.8 -0.2
Textiles, Garments and Footwear 10.9 -4.1 -4.1 -1.6 -1.8 -1.4
Printing, Publishing and Paper Converters 4.3 3.5 5.3 -2.3 -2.4 -2.2
Wood and Related Products -5.4 -1.4 3.2 -3.8 1.6 5.6
Chemicals and Non-Metallic Minerals -1.8 -2.1 1.3 -4.7 -0.2 -0.1
Assembly-Type and Related Industries -29.2 9.3 13.1 -33.0 -3.2 0.1
Miscellaneous Manufacturing Industries 2.4 2.0 4.8 -1.9 -3.8 -7.2
Electricity 25.7 9.2 -5.7 -17.7 -9.3 -1.5
Water 1.0 -3.5 0.6 27.6 24.8 2.9
All Industry Index
(Including Petrochem, Oil and Natural Gas, 0.7 1.4 0.7 -3.9 2.8 0.2Explor., Product. and Refining, etc)
Explor., and Product. of Oil, Natural Gas, etc. -3.1 1.2 -8.5 -3.9 -26.2 2.8
Petrochemicals -5.9 9.9 7.0 -4.8 -3.6 -0.8
Oil and Natural Gas Refining -5.6 -0.7 17.5 -5.9 -0.2 -7.9
All Industry Index
(Including Petrochem, Oil and Natural Gas, -1.8 1.0 5.9 -4.3 0.0 -1.3
Explor., Product. and Refining)
SOURCE: Central Statistical Office
1 Percentage changes over the corresponding period.

CENTRAL BANK OF TRINIDAD & TOBAGO
ANNUAL ECONOMIC SURVEY 2018
TABLE A.11
ANNUAL CHANGES IN THE INDICES OF REAL EARNINGS AND OUTPUT PER MAN HOUR WORKED (ALL EMPLOYEES), 2016-20181
/ PER CENT /
INDUSTRY
REAL EARNINGS(1995=100)
INDEX OF OUTPUTPER MAN HOUR WORKED
(1995=100)
2016 2017 2018p 2016r 2017r 2018p
Food Processing -3.0 0.7 -2.3 35.6 19.3 16.4
Drink and Tobacco -2.2 -9.2 2.6 3.6 -7.3 26.3
Textiles, Garments and Footwear 4.2 -5.7 -5.0 -10.9 3.2 1.5
Printing, Publishing and Paper Converters 1.2 1.6 4.2 -0.2 -7.9 -17.9
Wood and Related Products -8.2 -3.3 2.2 2.7 -12.2 -10.7
Chemical and Non-Metallic Minerals -4.7 -3.9 0.2 2.1 4.9 4.1
Assembly-Type and Related Industries -31.4 7.3 11.9 -60.8 -4.2 -3.3
Miscellaneous Manufacturing Industries -0.6 0.1 3.7 4.7 3.7 7.6
Electricity 21.9 7.1 -6.6 -6.3 -6.7 -3.2
Water -1.9 -5.4 -0.4 -8.6 -21.7 -7.8
All Industry Index
(Excluding Petrochem, Oil and Natural Gas,
Explor., Product. and Refining) -2.3 -0.5 -0.3 -6.9 2.4 13.6
Explor., and Product. of Oil, Natural Gas, etc. -6.0 -0.7 -9.5 -0.1 13.0 1.2
Petrochemicals -8.7 7.7 5.9 4.3 8.4 1.1
Oil and Natural Gas Refining -8.4 -2.5 16.3 13.8 -6.4 -9.6
All Industry Index
(Including Petrochem, Oil and Natural Gas, -4.7 -0.8 4.8 -3.3 1.4 7.4Explor., Product. and Refining)
SOURCE: Central Statistical Office
1 Percentage changes over the corresponding period.

CENTRAL BANK OF TRINIDAD & TOBAGO
ANNUAL ECONOMIC SURVEY 2018
TABLE A.12
INDEX OF RETAIL PRICES FOR MAJOR EXPENDITURE CATEGORIES, 2014-2018/ JANUARY 2015=100 /
SECTIONS WEIGHTS 2014 2015 2016 2017 20182018
I II III IV
Inflation Rate (%)1
All Sections 1,000 5.7 4.7 3.1 1.9 1.0 0.9 1.0 1.2 1.0
Food 173 10.0 8.6 7.5 2.9 1.1 2.4 2.0 0.2 -0.1
Core2 827 2.0 1.8 2.2 1.6 1.0 0.5 0.8 1.4 1.3
Retail Price Index
All Sections 1,000 96.8 101.3 104.3 106.4 107.4 107.0 107.1 107.4 108.2
Food 173 94.2 102.3 109.7 113.1 114.4 115.4 113.3 113.2 115.6
Core 827 99.2 101.1 103.1 104.9 106.0 105.3 105.8 106.2 106.6
Per cent Contribution To Change In Index
Food 173 49.3 47.4 42.3 28.3 20.3 28.3 14.9 24.1 46.3
Core 827 50.7 52.6 57.7 71.7 79.7 71.7 85.1 75.9 53.7
SOURCE: Central Statistical Office
1 Annual figures represent the percentage change over the average for the previous year; quarterly figures represent the percentage change from the corresponding quarter of the previous year.
2 The component of measured inflation that has no medium to long term-run impact on real output in Trinidad and Tobago. This measure excludes food prices.

CENTRAL BANK OF TRINIDAD & TOBAGO
ANNUAL ECONOMIC SURVEY 2018
TABLE A.13INDEX OF PRODUCERS’ PRICES, 2014-2018
/ OCT. 1978=100 /
SECTIONS WEIGHTS 2014 2015 2016 2017 2018
Food Processing 191 710.2 713.0 716.5 721.2 725.1
0.2 0.4 0.5 0.7 0.5
Drink and Tobacco 121 1,323.5 1,422.2 1,467.6 1,567.3 1,575.3
6.9 7.5 3.2 6.8 0.5
Textiles, Garments and Footwear 101 303.5 303.5 303.5 303.5 303.5
0.0 0.0 0.0 0.0 0.0
Printing, Publishing and Paper Converters 93 392.3 391.5 390.3 390.8 400.0
0.1 -0.2 -0.3 0.1 2.3
Wood and Related Products 89 348.1 348.1 348.1 348.3 348.3
0.0 0.0 0.0 0.0 0.0
Chemicals and Non-Metallic Minerals 148 614.3 624.4 630.1 617.4 583.3
0.8 1.6 0.9 -2.0 -5.5
Assembly-Type and Related Industries 257 345.6 345.1 345.0 346.1 348.2
-0.1 -0.1 0.0 0.3 0.6
All Industry 1,000 573.6 587.5 594.3 605.7 603.8
2.0 2.4 1.2 1.9 -0.3
SOURCE: Central Statistical Office

CENTRAL BANK OF TRINIDAD & TOBAGO
ANNUAL ECONOMIC SURVEY 2018
TABLE A.14CENTRAL GOVERNMENT FISCAL OPERATIONS, 2014-20181
/ TT$ Millions /
EXPENDITURE 2014 2015 2016 2017r 2018p
Current Revenue 57,062.2 52,244.6 41,158.9 34,870.1 41,411.0Current Expenditure2 54,385.7 52,322.9 48,546.4 46,263.5 44,197.3Current Account Surplus(+)/Deficit(-) 2,676.5 -78.3 -7,387.6 -11,393.4 -2,786.3Capital Revenue 1,316.5 4,989.2 3,813.7 1,310.5 838.6Capital Expenditure and Net lending3 8,434.8 7,620.8 4,398.3 3,448.5 3,403.9
Overall Surplus(+)/Deficit(-) -4,442.2 -2,709.9 -7,972.1 -13,531.4 -5,351.6
Total Financing (net) 4,442.2 2,709.9 7,972.1 13,531.4 5,351.6
External Financing (Net) 3,312.4 -199.2 8,954.0 3,266.7 660.5
Net External Borrowing 3,312.4 -199.2 6,455.6 1,554.5 660.5Disbursements 3,835.0 344.4 6,982.7 2,099.8 1,356.4Repayments 522.6 543.6 527.1 545.3 695.9
Divestment Proceeds 0.0 0.0 0.0 0.0 0.0Transfers from HSF (Withdrawals) 0.0 0.0 2,498.4 1,712.2 0.0
Domestic Financing (Net) 1,129.8 2,909.1 -981.9 10,264.7 4,691.1
Debt Management Treasury Bills (Net) 0.0 0.0 0.0 0.0 0.0Bonds(Net) 175.9 1,074.7 4,016.0 3,165.6 1,784.4
Disbursements 1,783.4 3,757.2 6,623.2 8,191.8 6,267.6Repayments 1,607.5 2,682.5 2,607.2 5,026.2 4,483.2
Divestment Proceeds 0.0 0.0 0.0 0.0 0.0Uncashed Balances (Net)4 953.9 1,834.4 -4,997.9 7,099.1 2,906.7
Memo Items:
Primary Balance5 -1,319.6 728.5 -4,209.7 -9,063.0 -1,538.3
Surplus(+)/Deficit(-) as a Percentageof GDP (current market prices)
Current Account Surplus(+)/Deficit(-) 1.5 0.0 -5.0 -7.6 -1.8Overall Surplus(+)/Deficit(-) -2.5 -1.7 -5.4 -9.1 -3.4Primary Surplus(+)/Deficit(-) -0.8 0.4 -2.8 -6.1 -1.0
SOURCES: Ministry of Finance: Review of Fiscal Measures, various years. Review of the Economy, 2017 and the Central Bank of Trinidad and Tobago 1 Refers to accounts of Consolidated Fund, Unemployment Fund, Road Improvement Fund and the Infrastructure Develop-
ment Fund. Data is in fiscal years (October 1st - September 30th).2 Includes an adjustment for transfers to the Heritage and Stabilisation Fund and funds expended from the Infrastructure De-
velopment Fund.3 Includes an adjustment for Repayment of Past Lending in the years prior to 2016.4 Includes errors and ommissions, advances from the Central Bank and drawdowns from the treasury deposit accounts. Nega-
tive numbers represent an increase in deposits at the Central Bank.5 The primary balance, also known as the non-interest balance, is equal to the overall balance exclusive of interest payments.

CENTRAL BANK OF TRINIDAD & TOBAGO
ANNUAL ECONOMIC SURVEY 2018
TABLE A.15
CENTRAL GOVERNMENT REVENUE, 2014-20181
/ TT$ Millions /
EXPENDITURE 2014 2015 2016 2017r 2018p
A. Oil Sector 21,528.2 13,696.4 3,805.5 4,268.9 5,939.2Corporation2 16,969.5 10,974.3 2,144.2 2,477.2 3,124.2Withholding Tax 706.1 800.1 742.5 513.0 495.7Royalties 2,399.2 1,100.7 520.2 938.9 2,023.7Oil Impost 119.7 132.5 136.2 139.5 75.5Unemployment Levy 1,240.2 600.9 130.5 98.6 121.9Excise Duties 93.5 87.9 131.9 101.7 98.2
B. Non Oil Sector 35,534.0 38,548.2 37,353.4 30,601.2 35,471.7Taxes on Income 17,836.4 18,060.6 15,759.0 15,209.0 17,418.9
Companies 10,150.5 9,481.2 7,003.1 6,919.2 8,819.9Individuals 6,619.9 7,445.3 7,186.5 6,303.3 6,596.1Unemployment Levy 0.0 0.0 0.0 0.0 0.0Health Surcharge 209.6 264.0 225.8 218.0 183.6Other3 856.4 870.0 1,343.6 1,768.5 1,819.3
Taxes on Property 3.5 3.3 3.2 3.0 3.8Lands and Buildings Taxes 3.5 3.3 3.2 3.0 3.8
Taxes on Goods and Services 7,575.9 8,815.8 8,912.6 6,830.1 8,776.6Purchase Tax 0.2 0.1 0.1 1.0 0.1Excise Duties 582.2 606.8 579.5 613.8 654.5Motor Vehicles 569.4 575.5 569.0 415.2 333.0Value Added Tax 5,744.8 7,223.3 7,004.7 5,050.4 6,948.2Other 679.3 410.2 759.3 749.7 1,199.4
Taxes on International Trade 2,861.5 3,014.2 3,016.3 2,684.8 2,546.9Import Duties 2,861.0 3,013.7 3,016.0 2,683.8 2,546.6Other 0.4 0.5 0.0 1.0 0.3
Non-Tax Revenue 7,256.5 8,251.6 9,661.8 5,874.3 6,725.5National Lottery 262.9 169.7 177.8 335.9 213.6Interest 18.7 40.0 41.4 34.0 17.8Central Bank 404.2 190.5 809.0 714.0 4,048.6Other 6,570.7 7,851.4 8,633.6 4,790.4 2,445.5
TOTAL CURRENT REVENUE 57,062.2 52,244.6 41,158.9 34,870.1 41,411.0
Capital Revenue 1,316.5 4,989.2 3,813.7 1,310.5 838.6
TOTAL REVENUE 58,378.4 57,233.8 44,972.6 36,180.6 42,249.6
SOURCES: Ministry of Finance: Review of Fiscal Measures and Estimates of Revenue, various issues and the Central Bank of Trinidad and Tobago
1 Refers to accounts of Consolidated Fund, Unemployment Fund, Road Improvement Fund and the Infrastructure Develop-ment Fund. Data is in fiscal years (October 1st - September 30th).
2 Includes receipts from Supplemental Petroleum Tax (SPT), Petroleum Profit Tax (PPT), signature bonuses, surplus sale of petroleum products and for the award of Production Sharing Contracts (PSC).
3 Includes witholding tax from the non-oil sector, insurance surrender tax, business levy, income tax surcharge and Green Fund rceipts.

CENTRAL BANK OF TRINIDAD & TOBAGO
ANNUAL ECONOMIC SURVEY 2018
TABLE A.16
CENTRAL GOVERNMENT EXPENDITURE, 2014-20181
/ TT$ Millions /
EXPENDITURE 2014 2015 2016 2017r 2018p
Current Expenditure 54,385.7 52,322.9 48,546.4 46,263.5 44,197.3Wages and Salaries 8,590.8 10,077.1 9,601.9 9,937.8 9,097.1Goods and Services 8,008.8 8,105.4 7,326.1 5,827.2 6,088.1Interest 3,122.6 3,438.4 3,762.4 4,468.4 3,813.3
External 460.7 522.9 562.6 894.4 991.2Domestic 2,661.9 2,915.6 3,199.8 3,574.0 2,822.1
Transfers and Subsidies 34,663.5 30,701.9 27,856.1 26,030.1 25,198.8Of which: Statutory Boards and State Enterprises 10,290.5 9,903.6 9,356.5 8,769.0 8,502.1Households 14,094.9 12,668.9 10,169.8 9,026.3 8,741.6
Capital Expenditure and Net-Lending2 8,434.8 7,620.8 4,398.3 3,448.5 3,403.9
TOTAL EXPENDITURE 62,820.5 59,943.7 52,944.7 49,712.0 47,601.2
(in % of GDP at current market prices)
Memo Items (% of Expenditure):
Current Expenditure 86.6 87.3 91.7 93.1 92.8Capital Expenditure and Net-Lending 13.4 12.7 8.3 6.9 7.2
SOURCES: Ministry of Finance: Review of Fiscal Measures, various issues and the Central Bank of Trinidad and Tobago
1 Refers to accounts of Consolidated Fund, Unemployment Fund, Road Improvement Fund and the Infrastructure Devel-opment Fund. Data is in foscal years (October 1st - September 30th).
2 See footnote 3 on Table A.14.

CENTRAL BANK OF TRINIDAD & TOBAGO
ANNUAL ECONOMIC SURVEY 2018
TABLE A.17 (B)
CENTRAL GOVERNMENT INTERNAL DEBT, 2014-20181
/ TT$ Millions /
SECTOR 2014 2015 2016 2017r 2018p
BONDS & NOTESIssue 1,787.6 3,776.7 4,732.0 8,251.1 6,275.0Redemption 1,753.2 2,230.2 1,940.4 3,674.3 4,424.4Outstanding 26,456.1 28,132.8 30,888.6 35,487.1 37,507.6
CLICO AND HCU ZERO-COUPON BONDSIssue 0.7 336.6 11.8 3.9 1.7Redemption2 646.6 533.0 619.8 528.2 503.2Outstanding 4,598.3 4,401.9 3,793.9 3,269.5 2,767.9
BOLTS AND LEASESIssue 0.0 0.0 0.0 0.0 0.0Redemption 68.4 75.3 57.3 27.0 28.7Outstanding 319.1 243.8 186.3 159.3 130.6
OTHER3
Issue 0.0 0.0 0.0 0.0 0.0Redemption 0.0 0.0 0.0 0.4 0.0Outstanding 10.7 10.7 16.9 16.5 16.5
DEBT MANAGEMENT BILLSIssue 2,550.0 2,550.0 2,550.0 4,235.0 3,470.0Redemption 2,550.0 2,550.0 2,550.0 3,130.0 3,470.0Outstanding 800.0 800.0 800.0 1,905.0 1,905.0
Total Internal Debt Outstanding 29,644.2 31,749.0 35,685.7 40,837.4 42,327.6Internal Debt Outstanding/GDP (%) 16.9 19.3 24.0 27.3 27.0Internal Debt Service/Revenues (%) 8.1 12.0 14.5 20.2 15.7
SOURCES: Ministry of Finance and the Central Bank of Trinidad and Tobago
1 Data is in Fiscal Years (October - September) and excludes all securities issued for sterilisation purposes (OMO Bills, Treasury notes, Treasury Bonds and other liquidity absorption bonds).
2 Includes the exchange of bonds for shares in the CLICO Investment Fund (CIF).3 Comprises tax-free saving bonds, central bank fixed interest rate bonds and public sector emolument bonds.
TABLE A.17 (A)
CENTRAL GOVERNMENT EXTERNAL DEBT, 2014-20181
/ US$ Millions /
SECTOR 2014 2015 2016 2017 2018p
CENTRAL GOVERNMENT Receipts 672.1 185.0 1,053.8 402.0 260.7Amortisation 81.7 85.3 76.5 80.5 102.6Interest 94.2 83.4 100.1 134.5 123.0Balance Outstanding (end of period) 2,072.1 2,171.8 3,149.3 3,471.2 3,629.3Balance Outstanding/GDP (%) 7.2 8.4 14.4 15.7 15.8External Debt Service/Exports (%) 1.0 1.2 1.9 2.1 2.0
SOURCE: Central Bank of Trinidad and Tobago
1 Data are in Fiscal Years (October - September).

CENTRAL BANK OF TRINIDAD & TOBAGO
ANNUAL ECONOMIC SURVEY 2018
TABLE A.18 (A)COMMERCIAL BANKS: SELECTED DATA, 2014-2018
/ TT$ Millions /
END OF PERIOD
2014 2015 2016 2017 2018
A. OUTSTANDING 1. Aggregate Deposits (adj.) 101,195.0 100,470.5 104,655.9 102,636.6 105,901.1
Demand Deposits (adj.)1 40,824.1 36,604.2 37,537.2 35,908.7 37,035.6Time Deposits (adj.)2 9,509.7 9,729.6 10,622.2 10,163.5 10,231.1Savings Deposits (adj.)3 29,899.5 31,886.9 32,630.2 32,578.3 34,218.0Foreign Currency Deposits (adj.)4 20,961.8 22,249.7 23,866.3 23,986.1 24,416.5
2. Gross Bank Credit5 55,924.6 61,089.6 62,489.3 64,974.0 67,159.9Of which: Business Purposes 22,399.3 23,498.4 24,168.2 25,151.0 26,220.1Corporate 21,108.5 22,012.9 22,547.1 23,497.3 24,390.7Non-Corporate 1,290.7 1,485.6 1,621.0 1,653.7 1,829.4
3. Investments 36,698.5 32,792.9 36,020.2 33,337.5 34,450.7Government Securities 17,363.9 14,830.9 19,819.2 17,706.9 18,446.6Other Investments6 19,334.6 17,962.0 16,201.0 15,630.6 16,004.1Of which: Interest-bearing Special Deposit Facility7 6,000.0 2,500.0 1,500.0 0.0 0.0
B. ANNUAL CHANGE
1. Aggregate Deposits (adj.) 8,591.6 -724.5 4,185.4 -2,019.3 3,264.5Demand Deposits (adj.) 6,750.5 -4,219.9 933.0 -1,628.5 1,126.9Time Deposits (adj.) 36.5 220.0 892.6 -458.7 67.5Savings Deposits (adj.) 2,461.7 1,987.4 743.3 -51.9 1,639.7Foreign Currency Deposits (adj.) -657.1 1,287.9 1,616.6 119.8 430.4
2. Gross Bank Credit 5,892.6 5,165.0 1,399.7 2,484.7 2,186.0Of which: Business Purposes 1,270.4 1,099.2 669.8 982.8 1,069.1Corporate 1,310.5 904.3 534.3 950.2 893.4Non-Corporate -40.2 194.8 135.5 32.6 175.7
3. Investments 2,321.0 -3,905.6 3,227.3 -2,682.7 1,113.2Government Securities 2,688.0 -2,532.9 4,988.3 -2,112.4 739.7Other Investments -367.0 -1,372.7 -1,761.0 -570.3 373.5Of which: Interest-Bearing Special Deposit Facility 10.0 -3,500.0 -1,000.0 -1,500.0 0.0
SOURCE: Central Bank of Trinidad and Tobago
1 Total demand deposits minus non-residents’ and Central Government’s demand deposits, cash items in process of col-lection on other banks, and branch clearings, plus cashiers and branch clearings.
2 Total time deposits minus Central Government’s deposits and deposits of non-residents. 3 Total savings deposits minus Central Government’s deposits and deposits of non-residents. 4 Total demand, savings and time deposits in foreign currency minus those of non-residents. 5 Total loans excluding loans to non-residents and central government. 6 Interest-bearing deposits at the Central Bank, other local and foreign securities, and equity in subsidiaries and affiliates.7 Deposits were placed by the commercial banks between 2005 and 2012 including TT $1 billion in December 2005,
TT $500 million placed in June 2006, TT $2.0 billion placed in November 2009, TT $1.0 billion placed in November 2010 and TT $1.5 billion placed in March 2012. Two special deposit facilities for TT $2.0 billion and TT $1.5 billion and one for TT $1.0 billion were allowed to mature in 2015 and 2016, respectively.

CENTRAL BANK OF TRINIDAD & TOBAGO
ANNUAL ECONOMIC SURVEY 2018
TABLE A.18 (B)SUMMARY ACCOUNTS OF THE MONETARY SYSTEM, 2014-2018
/ TT$ Millions /
END OF PERIOD
2014 2015 2016 2017 2018
Net Foreign Assets 84,264 77,927 78,948 71,792 66,647Monetary Authorities 69,784 60,603 60,467 53,004 47,816Commercial Banks 14,480 17,324 18,480 18,787 18,832
Net Domestic Assets 18,800 28,657 31,290 38,267r 43,971Net Claims on Public Sector -11,648 -6,784 -1,381 2,098 4,888
Central Government (net) -8,813 -8,087 -2,000 937 2,786Treasury Bills 9,567 8,089 11,617 9,294 11,298Other Government Securities 10,234 8,892 11,512 8,611 7,347Other Credit (net) -28,164 -24,596 -24,495 -16,566 -14,516
Local Government (net) -1,091 -1,060 -1,084 -1,308 -617Statutory Bodies (net) -3,970 -1,456 -1,951 -1,401 -2,363Public Enterprises (net) 2,226 3,820 3,654 3,870 5,083
Official Capital and Surplus -6,736 -7,170 -11,471 -9,184 -7,823Credit to Other Financial Institutions (net) -10,206 -9,843 -10,154 -10,219 -10,880Credit to Private Sector 48,311 51,246 53,331 56,047 58,326Interbank Float 450 547 568 923r 597Other Assets (net) -1,371 661 397 -1,398r -1,137
Liabilities to Private Sector (M3) 103,064 106,584 110,238 110,059r 110,618Money and Quasi-Money 84,301 86,722 90,654 90,074 92,094
Money 35,808 35,336 36,727 37,280 37,870Currency in Circulation 6,895 7,650 7,847 8,104 7,941Demand Deposits 28,913 27,687 28,881 29,176 29,929
Quasi-Money 48,493 51,385 53,927 52,795 54,223Time Deposits 8,941 8,550 9,079 8,817 7,743Savings Deposits 39,552 42,835 44,847 43,977 46,480
Securitised Instruments 9 15 813 788 312Private Capital and Surplus 18,753 19,847 18,771 19,197r 18,212
Changes as a per cent of beginning-of-period M3
Net Foreign Assets 7.5 -6.1 1.0 -6.5 -4.7Net Domestic Assets 1.7 9.6 2.5 6.3 5.2Net Claims on Public Sector -1.4 4.7 5.1 3.2 2.5
Of which: Central Government -4.2 0.7 5.7 2.7 1.7Credit to Private Sector 3.5 2.8 2.0 2.5 2.1Other Assets (net) 0.3 2.0 -0.2 -1.6 0.2
Liabilities to private sector (M3) 9.2 3.4 3.4 -0.2 0.5
Memorandum items:Net Domestic Assets 18,800 28,657 31,290 38,267r 43,971Net Claims on Public Sector -11,648 -6,784 -1,381 2,098r 4,888Central Government -8,813 -8,087 -2,000 937r 2,786Credit to the Private Sector 48,311 51,246 53,331 56,047 58,326(12-month increase in per cent) M3 Velocity 1.7r 1.5r 1.3 1.4r 1.4
SOURCE: Central Bank of Trinidad and Tobago

CENTRAL BANK OF TRINIDAD & TOBAGO
ANNUAL ECONOMIC SURVEY 2018
TABLE A.19LIQUIDITY POSITION OF COMMERCIAL BANKS, 2017-2018
/ TT$ Millions /
2017 2018
I II III IV I II III IV
Legal Reserves Position Required Reserves1 15,044.7 15,112.4 14,898.0 14,913.0 15,044.4 14,991.2 13,400.6 13,751.9
Cash Reserves 18,583.3 18,472.5 18,035.2 17,973.6 17,883.2 17,590.8 16,741.8 17,006.1
Excess (+) or Shortage (-) 3,538.6 3,360.1 3,137.2 3,060.6 2,838.8 2,599.6 3,341.3 3,254.3Average Excess(+) or Shortage( -)2 3,543.4 3,172.5 2,701.1 2,833.0 2,889.8 2,365.4 4,832.0 3,041.2
Liquid Assets
Total Deposits at Central Bank 18,583.3 18,472.5 18,035.2 17,973.6 17,883.2 17,590.8 16,741.8 17,006.1
Local Cash in Hand 981.7 1,108.4 1,074.0 1,305.8 1,053.3 993.3 1,025.5 1,440.2
Treasury Bills 139.0 799.1 939.1 565.6 806.4 509.0 490.0 302.9
Total Liquid Assets 19,704.0 20,379.9 20,048.3 19,845.0 19,742.9 19,093.1 18,257.3 18,749.3
Total Deposit Liabilities (adj.) 79,182.4 79,538.8 78,410.5 78,489.4 79,180.9 78,901.2 78,827.0 80,893.4
As at Percentage of Total Deposit Liabilities (Adj.)
Legal Reserves Position
Required Reserves 19.0 19.0 19.0 19.0 19.0 19.0 17.0 17.0
Actual Reserves 23.5 23.2 23.0 22.9 22.6 22.3 21.2 21.0
Cash Reserves 23.5 23.2 23.0 22.9 22.6 22.3 21.2 21.0
Excess (+) or Shortage (-) 4.5 4.2 4.0 3.9 3.6 3.3 4.2 4.0
Average Excess(+) or Shortage(-) 4.5 4.0 3.4 3.6 3.6 3.0 6.1 3.8
Liquid Assets Total Deposits at Central Bank 23.5 23.2 23.0 22.9 22.6 22.3 21.2 21.0
Local Cash in Hand 1.2 1.4 1.4 1.7 1.3 1.3 1.3 1.8
Treasury Bills 0.2 1.0 1.2 0.7 1.0 0.6 0.6 0.4
TOTAL LIQUID ASSETS 24.9 25.6 25.6 25.3 24.9 24.2 23.2 23.2
SOURCE: Central Bank of Trinidad and Tobago
1 Required reserves comprise the statutory cash reserves requirement which was reduced from 14 per cent in 2003 to 11 per cent effective Septem-ber 15, 2004. In February 2008, the rate was increased to 13 per cent, with further increases in July 2008, to 15 per cent and then in October 2008, to 17 per cent. Additionally, a secondary reserve requirement of 2 per cent was introduced on a temporary basis, effective October 04, 2006. The secondary reserve requirement on commercial banks' prescribed liabilities was discontinued with effect from August 02, 2018.
2 Represents the excess/shortage as an average through the quarter.
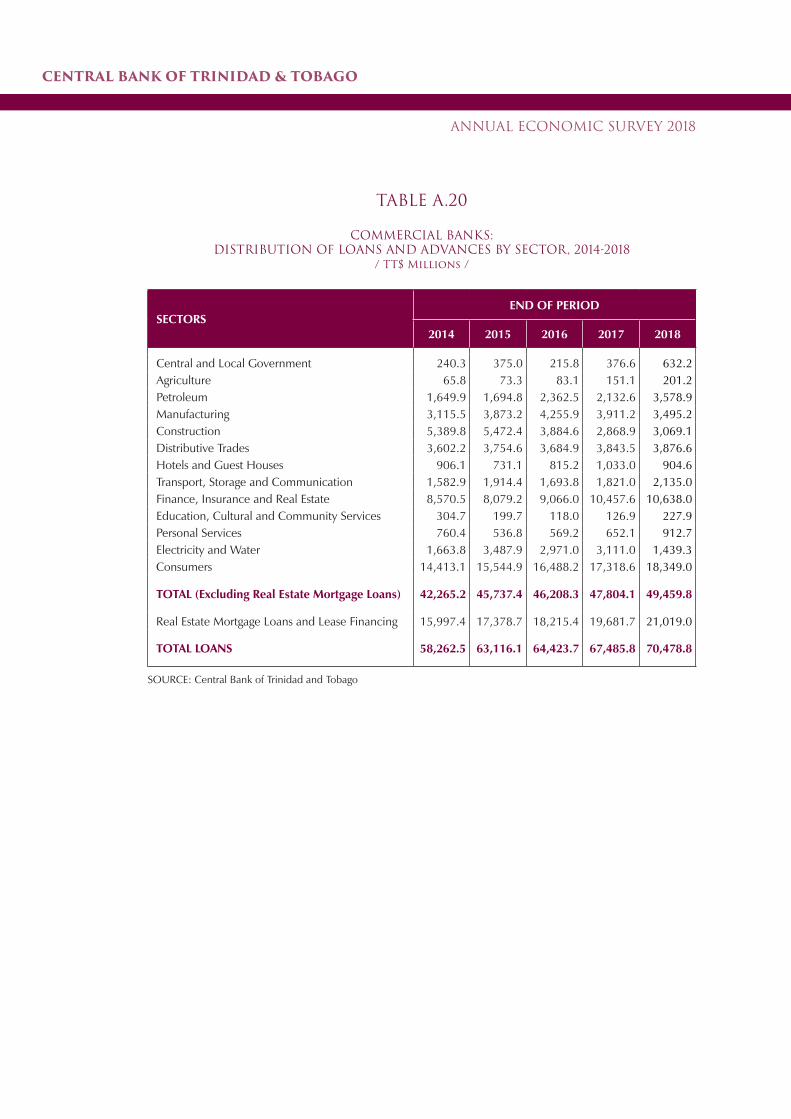
CENTRAL BANK OF TRINIDAD & TOBAGO
ANNUAL ECONOMIC SURVEY 2018
TABLE A.20
COMMERCIAL BANKS:DISTRIBUTION OF LOANS AND ADVANCES BY SECTOR, 2014-2018
/ TT$ Millions /
SECTORSEND OF PERIOD
2014 2015 2016 2017 2018
Central and Local Government 240.3 375.0 215.8 376.6 632.2Agriculture 65.8 73.3 83.1 151.1 201.2Petroleum 1,649.9 1,694.8 2,362.5 2,132.6 3,578.9Manufacturing 3,115.5 3,873.2 4,255.9 3,911.2 3,495.2Construction 5,389.8 5,472.4 3,884.6 2,868.9 3,069.1Distributive Trades 3,602.2 3,754.6 3,684.9 3,843.5 3,876.6Hotels and Guest Houses 906.1 731.1 815.2 1,033.0 904.6Transport, Storage and Communication 1,582.9 1,914.4 1,693.8 1,821.0 2,135.0Finance, Insurance and Real Estate 8,570.5 8,079.2 9,066.0 10,457.6 10,638.0Education, Cultural and Community Services 304.7 199.7 118.0 126.9 227.9Personal Services 760.4 536.8 569.2 652.1 912.7Electricity and Water 1,663.8 3,487.9 2,971.0 3,111.0 1,439.3Consumers 14,413.1 15,544.9 16,488.2 17,318.6 18,349.0
TOTAL (Excluding Real Estate Mortgage Loans) 42,265.2 45,737.4 46,208.3 47,804.1 49,459.8
Real Estate Mortgage Loans and Lease Financing 15,997.4 17,378.7 18,215.4 19,681.7 21,019.0
TOTAL LOANS 58,262.5 63,116.1 64,423.7 67,485.8 70,478.8
SOURCE: Central Bank of Trinidad and Tobago

CENTRAL BANK OF TRINIDAD & TOBAGO
ANNUAL ECONOMIC SURVEY 2018
TABLE A.21
COMMERCIAL BANKS: PERCENTAGE DISTRIBUTION OF LOANS AND ADVANCES BY SECTOR, 2014-20181
/ PER CENT /
SECTORSEND OF PERIOD
2014 2015 2016 2017 2018
Central Government 0.4 0.6 0.3 0.6 0.9Agriculture 0.1 0.1 0.1 0.2 0.3Petroleum 2.8 2.7 3.7 3.2 5.1Manufacturing 5.3 6.1 6.6 5.8 5.0Construction 9.3 8.7 6.0 4.3 4.4Distributive Trades 6.2 5.9 5.7 5.7 5.5Hotels and Guest Houses 1.6 1.2 1.3 1.5 1.3Transport, Storage and Communication 2.7 3.0 2.6 2.7 3.0Finance, Insurance and Real Estate 14.7 12.8 14.1 15.5 15.1Education, Cultural and Community Services 0.5 0.3 0.2 0.2 0.3Personal Services 1.3 0.9 0.9 1.0 1.3Electricity and Water 2.9 5.5 4.6 4.6 2.0Consumers 24.7 24.6 25.6 25.7 26.0
TOTAL (Excluding Real Estate Mortgage Loans) 72.5 72.5 71.7 70.8 70.2
Real Estate Mortgage Loans and Lease Financing 27.5 27.5 28.3 29.2 29.8
TOTAL LOANS 100.0 100.0 100.0 100.0 100.0
SOURCE: Table A.20
1 Figures may not sum to 100 due to rounding.

CENTRAL BANK OF TRINIDAD & TOBAGO
ANNUAL ECONOMIC SURVEY 2018
TABLE A.22COMMERCIAL BANKS - INTEREST RATES, 2016-20181
/ PER CENT /
SECTIONS 2016 2017 20182018
I II III IV
A. LOAN RATES (MARKET)
(i) Installment Range 0.73-19.50 0.73-19.50 0.73-19.50 0.73-19.50 0.73-19.50 0.73-19.50 0.73-19.50
Median 7.50 7.50 7.50 7.50 7.50 7.50 7.50
(ii) Demand Range 0.20-15.50 0.20-15.50 0.20-15.50 0.20-15.50 0.20-15.50 0.20-15.50 0.20-15.50
Median 7.50 7.50 7.50 7.50 7.50 7.50 7.50
(iii) Overdraft Range 4.00-27.75 4.00-27.75 4.00-27.75 4.00-27.75 4.00-27.75 4.00-27.75 4.00-27.75
Median 7.50 7.50 7.50 7.50 7.50 7.50 7.50
(iv) Basic Prime Rate Range 8.75-9.50 8.75-9.50 8.75-9.75 8.75-9.50 8.75-9.50 8.75-9.75 8.75-9.75
Median 9.00 9.00 9.25 9.00 9.00 9.13 9.25
(v) Real Estate Mortgage Range 3.00-16.43 3.00-16.43 3.00-16.43 3.00-16.43 3.00-16.43 3.00-16.43 3.00-16.43
Median 7.50 7.50 7.50 7.50 7.50 7.50 7.50
B. DEPOSIT RATES (Announced)
(i) Ordinary Savings Range 0.03-1.00 0.03-1.00 0.03-1.00 0.03-1.00 0.03-1.00 0.03-1.00 0.03-1.00
Median 0.20 0.20 0.20 0.20 0.20 0.20 0.20
(ii) Special Savings Range 0.03-2.00 0.03-2.00 0.03-2.00 0.03-2.00 0.03-2.00 0.03-2.00 0.03-2.00
Median 0.20 0.20 0.20 0.20 0.20 0.20 0.20
(iii) 3-Months Time Range 0.05-3.95 0.05-3.95 0.05-3.95 0.05-3.95 0.05-3.95 0.05-3.95 0.05-3.95
Median 0.38 0.38 0.38 0.38 0.38 0.38 0.38
(iv) 3-6 Months Time Range 0.05-3.00 0.05-3.00 0.05-3.00 0.05-3.00 0.05-3.00 0.05-3.00 0.05-3.00
Median 0.45 0.45 0.45 0.45 0.45 0.45 0.45
(iv) 6-Months Time Range 0.05-0.75 0.05-0.75 0.05-0.75 0.05-0.75 0.05-0.75 0.05-0.75 0.05-0.75
Median 0.50 0.50 0.50 0.50 0.50 0.50 0.50
(v) 1-Year Time Range 0.05-3.00 0.05-3.00 0.05-3.00 0.05-3.00 0.05-3.00 0.05-3.00 0.05-3.00
Median 0.78 0.78 0.78 0.78 0.78 0.78 0.78
SOURCE: Central Bank of Trinidad and Tobago
1 Annual data represent the rates for the twelve (12) months of the year and quarterly data represent the rates for the three (3) months of the quarter.

CENTRAL BANK OF TRINIDAD & TOBAGO
ANNUAL ECONOMIC SURVEY 2018
TABLE A.23MONEY SUPPLY, 2014-2018
/ TT$ Millions /
SECTORSEND OF PERIOD
2014 2015 2016 2017 2018
A. Narrow Money Supply (M-1A) 47,719.2 44,254.0 45,383.8 44,012.7 44,976.8
Currency in Active Circulation 6,895.1 7,649.8 7,846.6 8,104.1 7,941.2
Demand Deposits (adj.) 40,824.1 36,604.2 37,537.2 35,908.7 37,035.6
B. Factors Affecting Changes in Money Supply
1. Net Bank Credit to Central Government -41,426.8 -41,801.6 -31,113.8 -27,879.9 -26,287.5
(a) Central Bank -58,583.6 -56,726.4 -50,680.5 -45,444.5 -44,276.0
(b) Commercial Banks 17,156.8 14,924.7 19,566.7 17,564.5 17,988.5
2. Bank Credit 59,161.9 64,112.0 65,950.0 68,158.9 71,180.2
(a) Public Sectorl 10,013.9 11,633.8 11,760.6 11,213.7 10,892.6
(b) Private Sector2 49,148.0 52,478.2 54,189.4 56,945.1 60,287.6
3. External Assets (net) 92,020.9 85,203.3 87,670.2 83,927.8 82,920.6
4. Quasi-Money3 -39,409.2 -41,616.6 -43,252.4 -42,741.8 -44,449.0
5. Foreign Currency Deposits (Adj.) -20,961.8 -22,249.7 -23,866.3 -23,986.1 -24,416.5
6. NFIs Foreign Currency Deposit (Adj.) -719.7 -593.6 -988.2 -398.5 -906.0
7. Other Items (Net) -1,665.9 606.6 -10,004.0 -13,466.0 -13,970.8
C. Broad Money Supply (M-2) 87,128.3 85,870.5 88,636.2 86,754.6 89,425.8
D. Broad Money Supply (M-2*)4 108,090.1 108,120.3 112,502.5 110,740.7 113,842.4
Memorandum Items:5
Money Supply M-3 89,087.8 87,533.9 90,531.8 88,337.0 90,886.5
Money Supply M-3* 110,769.3 110,367.2 115,386.3 112,721.5 116,209.0
SOURCE: Central Bank of Trinidad and Tobago
1 Includes Central Bank’s and commercial banks’ loans and holdings of public sector securities.2 Includes commercial banks’ loans and holdings of private sector securities.3 Excludes foreign currency deposits of residents which are shown separately below.4 Includes foreign currency deposits of residents.5 In addition to M-2, M-3 includes the time deposits of non-bank financial institutions (NFIs), while in addition to M-2*, M-3*
includes foreign currency deposits of residents at NFIs.

CENTRAL BANK OF TRINIDAD & TOBAGO
ANNUAL ECONOMIC SURVEY 2018
TABLE A.24FINANCE COMPANIES AND MERCHANT BANKS: SUMMARY OF ASSETS AND LIABILITIES, 2014-2018
/ TT$ Thousands /
END OF PERIOD EXTERNAL ASSETS (NET)
CASH AND DEPOSITS AT
CENTRAL BANK
BALANCES DUE FROM BANKS
(NET)
DOMESTIC CREDIT
INVESTMENTS LOANS (GROSS) TOTAL
(1) (2) (3) (4) (5) (6)
2014 218,859 264,872 -69,952 1,902,531 3,236,512 5,139,043
2015 76,683 188,729 184,067 1,713,337 3,730,753 5,444,090
2016 80,678 276,354 390,714 1,814,241 3,766,180 5,580,421
2017 83,722 225,706 506,360 2,087,386 3,404,797 5,492,183
2018 119,506 219,656 728,218 2,337,738 3,688,482 6,026,220
2017
I 107,734 286,090 504,888 1,846,817 3,778,949 5,625,766
II 133,693 276,435 288,034 1,832,593 3,556,294 5,388,887
III 116,281 238,421 348,341 1,845,950 3,572,189 5,418,139
IV 83,722 225,706 506,360 2,087,386 3,404,797 5,492,183
2018
I 70,365 223,144 547,724 2,222,632 3,412,840 5,635,472
II 65,235 235,781 425,881 2,310,859 3,486,544 5,797,403
III 95,018 258,965 636,782 2,400,521 3,600,524 6,001,045
IV 119,506 219,656 728,218 2,337,738 3,688,482 6,026,220
END OF PERIOD TOTAL ASSETS/LIABILITIES DEPOSITS BORROWINGS1 PROVISIONS CAPITAL AND
RESERVESOTHER ITEMS
(NET)
(7) (8) (9) (10) (11) (12)
2014 5,465,199 2,036,845 1,014,793 82,190 2,343,654 69,939
2015 5,811,335 1,954,822 1,172,798 82,236 2,510,545 173,308
2016 6,236,147 2,066,349 1,263,158 92,021 2,734,604 172,178
2017 6,207,311 2,062,452 1,182,483 100,659 2,987,187 -22,194
2018 6,943,833 2,731,783 1,036,372 149,767 3,328,274 -134,374
2017
I 6,427,805 2,226,190 1,271,963 96,672 2,703,585 226,210
II 5,921,511 2,002,342 1,169,969 104,681 2,744,237 5,104
III 6,011,065 2,018,575 1,170,745 110,116 2,802,716 19,174
IV 6,207,311 2,062,452 1,182,483 100,659 2,987,187 -22,194
2018
I 6,319,088 2,175,526 1,183,749 157,614 2,947,878 14,555
II 6,356,838 2,282,676 1,176,767 167,463 2,970,834 -70,821
III 6,819,734 2,656,469 1,027,358 172,075 3,048,539 99,005
IV 6,943,833 2,731,783 1,036,372 149,767 3,328,274 -134,374
SOURCE: Central Bank of Trinidad and Tobago
1 Borrowings from all sources other than commercial banks. Borrowings from commercial banks are reflected in Column 3.

CENTRAL BANK OF TRINIDAD & TOBAGO
ANNUAL ECONOMIC SURVEY 2018
TABLE A.25FINANCE COMPANIES AND MERCHANT BANKS:
DISTRIBUTION OF LOANS AND ADVANCES BY SECTOR, 2014-2018/ TT$ Millions /
SECTORSEND OF PERIOD
2014 2015 2016 2017 2018
Public Sector 356.0 583.6 25.3 101.1 200.3
Private Sector 2,261.8 2,710.5 2,812.6 2,933.1 3,046.9
Agriculture 27.6 38.5 29.5 28.3 33.9
Petroleum 30.8 33.2 9.9 6.9 6.6
Manufacturing 80.0 236.5 83.6 92.9 77.0
Construction 306.2 213.4 165.7 231.9 135.7
Distributive Trades 59.9 65.8 96.6 95.5 105.5
Hotels and Guest Houses 99.0 58.2 50.7 34.9 56.0
Transport, Storage and Communication 178.5 156.6 169.0 121.7 118.4
Finance, Insurance, Real Estate and Services 222.3 386.4 513.6 532.4 626.3
Education, Cultural and Community Services 0.7 1.0 0.6 0.8 0.4
Personal Services 36.7 104.0 116.4 142.1 157.5
Consumers 1,220.1 1,416.8 1,577.1 1,645.9 1,729.5
TOTAL (Excluding Real Estate Mortgage Loans and Leases) 2,617.8 3,294.1 2,837.9 3,034.2 3,247.3
Real Estate Mortgage Loans 10.3 54.3 68.0 59.3 56.0
Leases 273.7 272.0 277.4 258.1 222.9
TOTAL LOANS 2,901.8 3,620.4 3,183.3 3,351.5 3,526.2
SOURCE: Central Bank of Trinidad and Tobago

CENTRAL BANK OF TRINIDAD & TOBAGO
ANNUAL ECONOMIC SURVEY 2018
TABLE A.26FINANCE COMPANIES AND MERCHANT BANKS:
PERCENTAGE DISTRIBUTION OF LOANS AND ADVANCES BY SECTOR, 2014-2018/ PER CENT /
SECTORSEND OF PERIOD
2014 2015 2016 2017 2018
Public Sector 12.3 16.1 0.8 3.0 5.7
Private Sector 77.9 74.9 88.4 87.5 86.4
Agriculture 1.0 1.1 0.9 0.8 1.0
Petroleum 1.1 0.9 0.3 0.2 0.2
Manufacturing 2.8 6.5 2.6 2.8 2.2
Construction 10.6 5.9 5.2 6.9 3.8
Distributive Trades 2.1 1.8 3.0 2.8 3.0
Hotels and Guest Houses 3.4 1.6 1.6 1.0 1.6
Transport, Storage and Communication 6.2 4.3 5.3 3.6 3.4
Finance, Insurance, Real Estate and Business Services 7.7 10.7 16.1 15.9 17.8
Education, Cultural and Community Services 0.0 0.0 0.0 0.0 0.0
Personal Services 1.3 2.9 3.7 4.2 4.5
Consumers 42.0 39.1 49.5 49.1 49.0
TOTAL (Excluding Real EstateMortgage Loans and Leases) 90.2 91.0 89.1 90.5 92.1
Real Estate Mortgage Loans 0.4 1.5 2.1 1.8 1.6
Leases 9.4 7.5 8.7 7.7 6.3
TOTAL LOANS 100.0 100.0 100.0 100.0 100.0
SOURCE: Table A.25

CENTRAL BANK OF TRINIDAD & TOBAGO
ANNUAL ECONOMIC SURVEY 2018
TABLE A.27
TRUST AND MORTGAGE FINANCE COMPANIES: SUMMARY OF ASSETS AND LIABILITIES, 2014-2018
/ TT$ Thousands /
END OF PERIODCASH AND
DEPOSITS AT CENTRAL BANK
BALANCES DUE FROM BANKS
(NET)
DOMESTIC CREDIT TOTAL ASSETS/
LIABILITIESINVESTMENTS LOANS (GROSS) TOTAL
(1) (2) (3) (4) (5) (6)
2014 73,317 1,362,981 897,765 742,791 2,934,882 3,008,1992015 47,189 551,123 806,536 703,288 1,979,636 2,026,8252016 255,733 657,197 1,139,612 422,433 2,204,502 2,460,2352017 161,894 558,807 636,423 239,338 1,422,836 1,584,7302018 14,485 588,444 459,127 201,710 1,237,244 1,251,729
2017I 356,786 574,438 1,085,827 409,893 2,056,119 2,412,905II 222,316 516,857 1,207,483 387,472 2,097,277 2,319,593III 265,231 562,805 596,598 252,044 1,397,174 1,662,405IV 161,894 558,807 636,423 239,338 1,422,836 1,584,730
2018I 163,690 648,449 647,123 227,105 1,509,741 1,673,431II 187,780 520,802 454,240 214,629 1,176,136 1,363,916III 14,770 822,085 448,743 195,515 1,453,477 1,468,247IV 14,485 588,444 459,127 201,710 1,237,244 1,251,729
END OF PERIOD DEPOSITS BORROWINGS PROVISIONS CAPITAL AND RESERVES OTHER ITEMS (NET)
(7) (8) (9) (10) (11)
2014 726,587 8,152 82,224 1,880,985 378,9052015 752,036 3,800 93,589 1,576,856 -318,1432016 1,191,457 -68 14,740 1,325,305 -56,4602017 314,533 -68 11,732 1,470,817 -200,5532018 110,976 -68 12,037 1,288,915 -148,093
2017I 1,168,747 -67 14,039 1,297,419 -53,195II 992,600 -67 14,535 1,332,571 -5,510III 385,025 -68 14,274 1,384,905 -107,457IV 314,533 -68 11,732 1,470,817 -200,553
2018I 355,628 -68 12,936 1,457,671 -139,798II 276,555 -68 13,535 1,280,294 -192,865III 107,789 -68 12,866 1,276,073 84,453IV 110,976 -68 12,037 1,288,915 -148,093
SOURCE: Central Bank of Trinidad and Tobago

CENTRAL BANK OF TRINIDAD & TOBAGO
ANNUAL ECONOMIC SURVEY 2018
TABLE A.28
DEVELOPMENT BANKS: SUMMARY OF ASSETS AND LIABILITIES, 2014-2018/ TT$ Thousands /
END OF PERIOD
EXTERNAL ASSETS (NET)
NET DOMESTIC ASSETSTOTAL ASSETS/
LIABILITIES
CAPITAL AND
RESERVES
OTHER ITEMS (NET)
DEPOSITS IN LOCAL
BANKS
PUBLIC SECTOR CREDIT
PRIVATE SECTOR CREDIT
TOTAL
(1) (2) (3) (4) (5) (6) (7) (8)
2013 0 -694,624 -1,295,408 3,899,548 1,909,516 1,909,516 1,316,873 592,6432014 0 -624,889 -893,298 3,788,102 2,269,915 2,269,915 1,351,880 918,035
2015 0 -530,729 -1,127,282 3,902,469 2,244,458 2,244,458 1,479,274 765,184
2016 0 -452,576 -1,452,997 4,175,081 2,269,508 2,269,508 1,576,492 693,016
2017 0 -37,464 -617,652 4,338,312 3,683,196 3,683,196 1,608,305 2,074,891
2017
I 0 -441,355 -1,421,197 4,234,443 2,371,891 2,371,891 1,607,292 764,599
II 0 -473,343 -1,398,570 4,248,230 2,376,317 2,376,317 1,570,003 806,314
III 0 -470,766 -627,913 4,327,907 3,229,228 3,229,228 1,586,759 1,642,470
IV 0 -37,464 -617,652 4,338,312 3,683,196 3,683,196 1,608,305 2,074,891
2018
I 0 -348,620 -582,853 4,246,103 3,314,629 3,314,629 1,637,866 1,676,763
II 0 -352,549 -572,314 4,364,971 3,440,108 3,440,108 1,626,728 1,813,380
III 0 -306,363 -537,514 3,895,389 3,051,512 3,051,512 1,645,197 1,406,315
IV 0 -699,915 -399,200 4,024,546 2,925,432 2,925,432 1,692,917 1,232,515
SOURCE: Central Bank of Trinidad and Tobago

CENTRAL BANK OF TRINIDAD & TOBAGO
ANNUAL ECONOMIC SURVEY 2018
TABLE A.29
THRIFT INSTITUTIONS: SUMMARY OF ASSETS AND LIABILITIES, 2014-2018/ TT$ Thousands /
END OF PERIOD
EXTERNAL ASSETS (NET)
NET DOMESTIC ASSETSTOTAL ASSETS/
LIABILITIES
DEPOSITS
SHARESOTHER ITEMS(NET)
NET DEPOSITS IN LOCAL BANKS
PUBLIC SECTOR CREDIT
PRIVATE SECTOR CREDIT
TOTAL TIME SAVINGS TOTAL
(1) (2) (3) (4) (5) (6) (7) (8) (9) (10) (11)
2014 0 11,175 5,809 68,457 85,441 85,441 11,422 7,268 18,690 13,389 53,362
2015 0 14,858 7,367 76,040 98,265 98,265 18,995 7,594 26,589 15,987 55,689
2016 0 7,554 9,934 85,684 103,172 103,172 19,894 8,005 27,899 18,422 56,851
2017 0 4,602 9,575 94,369 108,546 108,546 21,207 8,307 29,514 20,712 58,320
2018 0 1,610 9,745 106,897 118,252 118,252 25,840 9,398 35,238 21,946 61,068
2017
I 0 6,775 9,941 87,490 104,206 104,206 19,834 8,681 28,515 18,499 57,192
II 0 6,892 9,788 90,622 107,302 107,302 20,904 8,792 29,696 19,419 58,187
III 0 4,268 9,826 94,769 108,863 108,863 21,198 8,663 29,861 19,824 59,178
IV 0 4,602 9,575 94,369 108,546 108,546 21,207 8,307 29,514 20,712 58,320
2018
I 0 9,172 9,562 93,443 112,177 112,177 23,506 9,128 32,634 21,309 58,234
II 0 9,993 9,850 97,538 117,381 117,381 24,600 10,919 35,519 21,064 60,798
III 0 4,330 9,944 102,363 116,637 116,637 25,440 9,299 34,739 21,247 60,651
IV 0 1,610 9,745 106,897 118,252 118,252 25,840 9,398 35,238 21,946 61,068
SOURCE: Central Bank of Trinidad and Tobago

CENTRAL BANK OF TRINIDAD & TOBAGO
ANNUAL ECONOMIC SURVEY 2018
TABLE A.30
NON-BANK FINANCIAL INSTITUTIONS INTEREST RATES, 2016-20181
/ PER CENT /
INTEREST RATES 2016 2017 20182018
I II III IV
1. Thrift Institutions
(a) Savings Deposits Range 0.50-0.50 0.50-0.50 0.50-0.50 0.50-0.50 0.50-0.50 0.50-0.50 0.50-0.50Median 0.50 0.50 0.50 0.50 0.50 0.50 0.50
(b) Time Deposits (i) l - 3 years
Range 0.50-3.75 0.50-3.75 0.50-3.75 0.50-3.75 0.50-3.75 0.50-3.75 0.50-3.75Median 2.13 2.13 2.13 2.13 2.13 2.13 2.13
(c) Mortgage Loans (Residential)Range 7.00-9.00 7.00-9.00 7.00-9.00 7.00-9.00 7.00-9.00 7.00-9.00 7.00-9.00Median 8.00 8.00 8.00 8.00 8.00 8.00 8.00
2. Trust and Mortgage Finance Companies
(a) Time Deposits(i) 1 - 3 years
Range 3.00-6.00 3.00-6.00 3.00-6.00 3.00-6.00 3.00-6.00 3.00-6.00 3.00-6.00Median 3.25 3.25 3.25 3.25 3.25 3.25 3.25
(ii) Over 3 years Range 3.00-4.00 3.00-4.00 3.00-4.00 3.00-4.00 3.00-4.00 3.00-4.00 3.00-4.00Median 3.50 3.50 3.50 3.50 3.50 3.50 3.50
(b) Mortgage Loans (i) Residential
Range 6.00-16.00 12.00-16.0012.00-16.0012.00-16.0012.00-16.0012.00-16.0012.00-16.00Median 14.00 14.00 14.00 14.00 14.00 14.00 14.00
3. Finance Companies and Merchant Banks(a) Time Deposits
(i) 1 - 3 years Range 3.25-8.50 3.25-8.50 3.25-8.50 3.25-8.50 3.25-8.50 3.25-8.50 3.25-8.50Median 3.25 3.25 3.25 3.25 3.25 3.25 3.25
(b) Installment Loans Range 6.00-25.41 6.00-25.41 6.00-25.41 6.00-25.41 6.00-25.41 6.00-25.41 6.00-25.41Median 11.00 11.00 11.00 11.00 11.00 11.00 11.00
SOURCE: Central Bank of Trinidad and Tobago
1 Annual and quarterly data represent the rates for the twelve (12) months of the year and the three (3) months of the quarter, respectively.

CENTRAL BANK OF TRINIDAD & TOBAGO
ANNUAL ECONOMIC SURVEY 2018
TABLE A.31MONEY AND CAPITAL MARKET ACTIVITY, 2014-20181
END OF PERIOD
NEW ISSUES ($MN) SECONDARY MARKET TURNOVER2
GOVERNMENTSECURITIES
TREASURYBILLS OTHER4
GOVERNMENT SECURITIES3 TREASURY BILLS PUBLIC COMPANY SHARES
FACEVALUE($MN)
NO. OFTRANS-
ACTIONS
FACEVALUE($MN)
NO. OFTRANS-
ACTIONS
MARKET VALUE ($MN)
NO. OFTRANS-
ACTIONS
VOLUME OF SHARES
TRADED ($MN)
2014 3,787.6 0.0 3,180.0 909.0 150 177.2 24 1,115.7 11,643 91
I 0.0 0.0 0.0 108.3 23 121.0 8 327.9 3,134 36
II 1,335.8 0.0 0.0 44.5 2 0.1 6 265.1 3,032 14
III 1,451.8 0.0 1,700.0 302.0 48 20.1 2 234.3 2,867 18
IV 1,000.0 0.0 1,480.0 454.1 77 36.1 8 288.4 2,610 24
2015 3,674.1 0.0 116.1 71.6 31 575.8 39 1,152.9 11,009 78
I 500.0 0.0 0.0 23.9 8 79.7 5 214.7 2,925 17
II 475.3 0.0 0.0 20.0 3 65.2 11 244.1 2,420 20
III 1,198.8 0.0 0.0 5.9 12 192.5 11 199.7 2,101 14
IV 1,500.0 0.0 116.1 21.8 8 238.4 12 494.5 3,563 27
2016 4,162.9 0.0 1,206.1 1,722.3 155 650.8 61 951.8 10,519 92
I 0.0 0.0 0.0 275.9 23 212.2 19 234.4 2,873 28
II 3,162.9 0.0 1,206.1 740.5 74 127.8 11 292.1 2,838 30
III 0.0 0.0 0.0 502.9 40 237.9 16 197.5 2,531 14
IV 1,000.0 0.0 0.0 203.1 18 72.9 15 227.8 2,277 20
2017 9,875.6 1,105.0 0.0 986.1 114 778.5 79 1,024.7 11,221 85
I 2,500.0 0.0 0.0 358.5 46 226.1 29 184.2 2,855 20
II 2,200.0 1,105.0 0.0 97.7 17 126.6 15 273.4 2,684 23
III 2,500.0 0.0 0.0 43.6 11 21.0 8 283.1 2,758 19
IV 2,675.6 0.0 0.0 486.3 40 404.7 27 284.0 2,924 24
2018 4,740.0 0.0 0.0 318.1 57 148.9 17 1,148.4 11,721 72
I 1,200.0 0.0 0.0 123.3 12 22.9 3 230.0 2,979 16
II 750.0 0.0 0.0 0.7 3 25.2 1 271.2 2,740 17
III 450.0 0.0 0.0 182.8 30 68.9 6 302.9 2,769 18
IV 2,340.0 0.0 0.0 11.2 12 31.9 7 344.3 3,233 21
SOURCES: Central Bank of Trinidad and Tobago and the Trinidad and Tobago Stock Exchange
1 Totals may not add due to rounding.2 Data refer to the double transactions of buying and selling.3 Trading in Government securities and treasury bills was conducted under the aegis of the Investment Division, Central Bank of Trinidad and
Tobago. From 1993 trading in Government securities has been conducted by the Stock Exchange of Trinidad and Tobago.4 Data include new issues by state corporations and other private organisations.

CENTRAL BANK OF TRINIDAD & TOBAGO
ANNUAL ECONOMIC SURVEY 2018
TABLE A.32
SELECTED INTEREST RATES, 2016-20181
/ PER CENT PER ANNUM /
2016 2017 20182018
I II III IV
A. Central Bank
(i) Bank Rate 6.75 6.75 7.00 6.75 7.00 7.00 7.00
(ii) Special Deposits Rate 0.00 0.00 0.00 0.00 0.00 0.00 0.00(iii) Repo Rate2 4.75 4.75 5.00 4.75 5.00 5.00 5.00(iv) Reverse Repo Rate2 4.25 4.25 4.50 4.25 4.50 4.50 4.50(v) Mortgage Market Reference Rate (MMRR)3 3.00 3.00 3.00 3.00 3.00 3.00 3.00
B. Government
(i) Treasury Bills 1.20 1.21 1.30 1.20 1.20 1.30 1.30
C. Commercial Banks - Local Currency
(i) Weighted Average Rate on Loans 8.05 8.23 8.10 8.15 8.13 8.11 8.01
(ii) Weighted Average Rate on Deposits 0.59 0.61 0.64 0.64 0.64 0.64 0.65
(iii) Interest Spread (i - ii) 7.46 7.63 7.46 7.51 7.50 7.47 7.36
D. Non-Bank Financial Institutions4 - Local Currency
(i) Weighted Average Rate on Loans 8.98 9.66 9.76 9.84 10.00 9.61 9.60
(ii) Weighted Average Rate on Deposits 2.42 2.52 2.66 2.58 2.59 2.71 2.77
(iii) Interest Spread (i - ii) 6.56 7.14 7.10 7.26 7.41 6.90 6.83
SOURCE: Central Bank of Trinidad and Tobago
1 Annual data refer to the average of the quarterly averages for the respective years, except for the Bank Rate, Repo Rate, the Reverse Repo Rate and the Treasury Bill Rate which reflect the end of quarter/year position.
2 In May 2002, the Central Bank introduced a system of announced overnight repurchase or ‘repo’ rates for short-term government paper. The repo rate is the Bank’s key policy interest rate and applies to collaterised overnight financing provided to commercial banks. The reverse repo rate is paid on occasions that the Central Bank offers to take overnight funds from commercial banks and is set as the repo rate less 50 basis points.
3 The Mortgage Market Reference Rate (MMRR) was introduced by the Central Bank on 01 December 2011, and represents a reference mort-gage rate against which residential mortgages can be priced and re-priced.
4 Includes Finance Houses and Trust and Mortgage Finance Companies and represents rates for licensed institutions only.

CENTRAL BANK OF TRINIDAD & TOBAGO
ANNUAL ECONOMIC SURVEY 2018
TABLE A.33 (a)BALANCE OF PAYMENTS, STANDARD PRESENTATION 2013-20181,2
/ US$ Millions /
2014r 2015r 2016r 2017 Jan-Sep 2017r
Jan-Sep 2018p
Current Account 4,005.2 1,855.6 -858.3 1,089.2 977.5 817.8Goods and Services 5,745.6 2,133.4 -614.7 870.1 841.4 1,403.7
Goods, net* 7,045.2 3,884.5 1,196.6 2,959.7 2,477.2 2,604.6 Exports** 14,964.5 11,413.9 8,285.4 9,411.4 6,977.0 7,878.1
Petroleum Crude and Refined 3,848.6 2,538.1 2,560.4 2,693.4 1,962.6 2,574.3 Gas 4,532.7 2,692.4 1,709.3 2,215.0 1,631.4 2,084.9 Petrochemicals 4,110.2 3,536.9 2,161.1 2,726.1 2,019.2 2,256.3 Other 2,473.0 2,646.6 1,854.5 1,776.9 1,363.8 962.6
Imports** 7,919.3 7,529.5 7,088.7 6,451.7 4,499.8 5,273.4 Fuel*** 2,068.3 1,456.4 1,542.3 1,617.7 1,102.1 1,556.5 Capital 2,321.8 2,637.9 2,518.3 1,841.1 1,215.5 1,413.5 Other 3,529.2 3,435.1 3,028.1 2,992.9 2,182.2 2,303.4
Services, net -1,299.6 -1,751.1 -1,811.3 -2,089.7 -1,635.8 -1,201.0Transport -187.5 -343.9 -295.8 -275.1 -175.9 -327.6Travel 322.9 324.1 276.1 356.7 278.3 264.9Telecommunications, Computer, and Information Services
-38.2 -51.3 -32.8 -31.5 -23.6 -19.5
Insurance and Pension Services -123.9 -206.7 -213.5 -165.7 -97.6 -150.6Other Services**** -1,273.0 -1,473.3 -1,545.3 -1,974.1 -1,617.0 -968.3
Primary Income, net -1,723.0 -239.6 -300.1 170.5 100.2 -635.9Secondary Income, net -17.4 -38.1 56.4 48.6 35.8 50.1
Capital Account 0.0 0.0 0.2 1.2 1.0 1.2Financial Account -67.4 485.4 -1,283.4 543.2 -14.8 589.0
Direct Investment -679.1 -48.5 106.2 550.9 -137.2 443.1Net Acquisition of Financial Assets -17.7 128.3 82.6 94.1 63.6 116.0Net Incurrence of Liabilities 661.4 176.8 -23.6 -456.9 200.7 -327.1
Portfolio Investment 654.1 799.3 -1,402.8 373.1 139.1 562.5Net Acquisition of Financial Assets 746.4 671.7 -97.1 224.1 100.5 518.6Net Incurrence of Liabilities 92.3 -127.6 1,305.7 -148.9 -38.7 -43.9
Financial Derivatives -3.2 -1.0 0.0 4.7 1.2 5.3Net Acquisition of Financial Assets -1.8 -1.9 0.0 4.4 1.8 5.7Net Incurrence of Liabilities 1.3 -0.9 0.0 -0.3 0.5 0.4
Other Investment^ -39.2 -264.4 13.3 -385.5 -18.0 -422.1Net Acquisition of Financial Assets 254.6 -706.8 -93.8 163.0 574.4 -80.4Net Incurrence of Liabilities 293.8 -442.5 -107.1 548.5 592.4 341.7
Net Errors and Omissions -2,751.4 -2,934.4 -892.5 -1,643.2 -1,952.4 -1,134.5Overall Balance 1,321.3 -1,564.2 -467.2 -1,096.0 -959.2 -904.5Memorandum Items Current Account/GDP (per cent) 14.5 7.4 -3.9 4.9 5.8 4.6Gross Official Reserves (US$Mn) ^^ 11,497.1 9,933.0 9,465.8 8,369.8 8,506.6 7,465.3Import Cover (months)^^ 12.9 11.2 10.5 9.7 9.8 8.1Debt Service Ratio 1.0 1.3 1.9 2.0 2.2 2.2Net International Investment Position (US$Mn)^^ 6,720.3 6,129.5 5,018.9 4,733.0 4,084.7 4,105.1
SOURCE: Central Bank of Trinidad and Tobago1 Totals may not sum due to rounding.2 This table is an analytical presentation of the Balance of Payments and is presented in accordance with the IMF’s Balance of Payments
and International Investment Position Manual, Sixth Edition (BPM6). Refer to Box 3 of the Economic Bulletin, March 2017 for a Techni-cal Note on the Transition to BPM6.
The following financial account movements are represented with a negative sign:• A decrease in assets (inflow)• A decrease in liabilities (outflow)• A net inflow in net balances
The following financial account movements are represented with a positive sign:• An increase in assets (outflow)• An increase in liabilities (inflow)• A net outflow in net balances
* Energy goods data for 2011-2018 comprise estimates by the Central Bank of Trinidad and Tobago. ** Exports and imports are reported on a FOB (Free on Board) basis. *** Includes petroleum, petroleum products and related materials. Energy exports include exports of petroleum, petroleum products and
related materials and the exports of petrochemicals.**** Other Services consists of manufacturing services on physical inputs owned by others, maintenance and repair services n.i.e., construc-
tion, financial services, charges for the use of intellectual property n.i.e., other business services and government goods and services n.i.e.
^ Other investment comprise currency and deposits, loans, trade credit and advances, other accounts receivable/payable and special drawing rights (liabilities).
^^ End of Period.

CENTRAL BANK OF TRINIDAD & TOBAGO
ANNUAL ECONOMIC SURVEY 2018
TABLE A.33 (B)
DIRECT INVESTMENT: NET INCURRENCE OF LIABILITIES (BY SECTOR)/ US$ Millions /
2014r 2015r 2016r 2017 Jan-Sep 2017r
Jan-Sep 2018p
Petroleum Industries 299.8 67.5 -431.9 -566.7 96.8 -361.1
Mining 0.0 0.0 0.0 0.0 0.0 0.0
Exploration and Production -709.8 164.6 -63.5 -498.4 27.9 -405.7
Refineries -164.6 -73.4 138.7 -46.5 4.2 12.1
Petrochemicals 1,183.1 -62.2 -534.0 -30.4 58.6 0.5
Service Contractors -19.2 32.4 23.3 12.5 8.9 32.0
Marketing and Distribution 10.4 6.1 3.6 -3.8 -2.7 0.1
Food, Drink and Tobacco 13.7 13.0 47.6 23.6 12.4 -7.4
Chemicals and Non-Metallic Minerals -10.7 25.8 4.0 40.2 61.5 -1.8
Assembly Type and Related Industries 324.4 1.3 65.2 32.5 23.2 36.2
Distribution 21.2 34.6 88.2 -4.8 -8.6 5.5
All Other Sectors1 12.9 34.7 203.3 18.3 15.3 1.5
TOTAL 661.4 176.8 -23.6 -456.9 200.7 -327.1
SOURCE: Central Bank of Trinidad and TobagoNote: A decrease in liabilities (outflow) is represented with a negative sign. An increase in liabilities (inflow) is represented with a positive sign. 1 "All Other Sectors" include Textiles, Garments, Footwear, Headwear, Printing, Publishing and Paper Converters, Wood
and Related Products, Miscellaneous Manufacturing, Electricity and Water, Construction, Hotels and Guest Houses, Trans-portation, Communication and Storage, Finance, Insurance, Real Estate and Business Services, Educational and Cultural Community Services, Personal Services and Other sectors.
TABLE A.33 (C)
DIRECT INVESTMENT: NET INCURRENCE OF LIABILITIES (BY COUNTRY)/ US$ Millions /
2014r 2015r 2016r 2017 Jan-Sep 2017r
Jan-Sep 2018p
U.S.A. -446.5 378.7 408.4 -57.6 347.0 -262.7
U.K. -500.8 -75.2 -35.5 -414.6 -282.5 -103.5
Canada -33.8 43.2 -387.1 -102.2 -78.4 -24.9
Barbados - - -162.3 -46.4 59.3 151.0
Netherlands - - 6.7 1.0 2.0 -1.3
St. Lucia - - 40.1 9.3 21.0 26.0
Other* 1,642.5 -169.8 106.2 153.6 132.4 -111.8
TOTAL 661.4 176.8 -23.6 -456.9 200.7 -327.1
SOURCE: Central Bank of Trinidad and Tobago
* Data for the period 2013-2015 include Barbados, Netherlands and St. Lucia.

CENTRAL BANK OF TRINIDAD & TOBAGO
ANNUAL ECONOMIC SURVEY 2018
TABLE A.34
WEIGHTED AVERAGE TT DOLLAR EXCHANGE RATESFOR SELECTED CURRENCIES 2014-20181
PERIOD
UNITED STATES DOLLAR
CANADIAN DOLLAR
UK POUND STERLING JAPANESE YEN EURO
BUYING SELLING BUYING SELLING BUYING SELLING BUYING SELLING BUYING SELLING
(1) (2) (3) (4) (5) (6) (7) (8) (9) (10)
2014 6.3613 6.4086 5.6779 5.9750 10.2525 10.7882 0.0602 0.0607 8.2714 8.6831
2015 6.3298 6.3776 4.8932 5.1793 9.5120 10.0569 0.0522 0.0546 6.9171 7.3032
2016 6.6152 6.6715 4.9425 5.2478 8.8462 9.4051 0.0632 0.0642 7.2682 7.6602
2017 6.7283 6.7795 5.1182 5.4517 8.6071 9.1537 0.0599 0.0628 7.5373 8.0093
2018 6.7321 6.7813 5.1438 5.4918 8.9231 9.5572 0.0609 0.0642 7.9261 8.4500
2018
January 6.7309 6.7832 5.3251 5.7046 9.2447 9.8993 0.0606 0.0638 8.1962 8.7154February 6.7248 6.7771 5.2943 5.6587 9.3250 10.0031 0.0623 0.0655 8.2635 8.8216March 6.7370 6.7820 5.1614 5.4999 9.3309 9.9782 0.0632 0.0668 8.2251 8.8247
I 6.7312 6.7810 5.2596 5.6206 9.2980 9.9571 0.0620 0.0653 8.2260 8.7844
April 6.7304 6.7787 5.2233 5.5755 9.3812 10.0546 0.0625 0.0657 8.2202 8.8158May 6.7275 6.7785 5.1781 5.5401 9.0483 9.6615 0.0612 0.0646 7.9464 8.4926June 6.7418 6.7832 5.0906 5.4312 8.8844 9.5933 0.0612 0.0643 7.8592 8.3555
II 6.7330 6.7801 5.1655 5.5174 9.1073 9.7709 0.0616 0.0649 8.0100 8.5569
July 6.7308 6.7806 5.0745 5.4126 8.8049 9.4082 0.0603 0.0636 7.8400 8.3319August 6.7294 6.7813 5.1082 5.4598 8.5906 9.2354 0.0604 0.0637 7.7585 8.2332
September 6.7240 6.7819 5.1061 5.4792 8.7347 9.3134 0.0601 0.0637 7.8000 8.3044III 6.7282 6.7812 5.0956 5.4490 8.7108 9.3206 0.0603 0.0637 7.8001 8.2900
October 6.7290 6.7818 5.1295 5.4620 8.6944 9.2933 0.0595 0.0630 7.7487 8.2231
November 6.7312 6.7813 5.0438 5.3833 8.6016 9.2000 0.0593 0.0628 7.6667 8.1568
December 6.7492 6.7861 4.9883 5.2938 8.4625 9.0852 0.0599 0.0631 7.6110 8.1595
IV 6.7358 6.7829 5.0583 5.3850 8.5935 9.1994 0.0596 0.0630 7.6798 8.1818
SOURCE: Central Bank of Trinidad and Tobago
1 Monthly rates are an average of daily rates.

CENTRAL BANK OF TRINIDAD & TOBAGO
ANNUAL ECONOMIC SURVEY 2018
TABLE A.35
TRINIDAD AND TOBAGO - INTERNATIONAL RESERVES, 2014-2018/ US$ Millions /
END OF PERIOD
CENTRAL BANK
CENTRAL GOVERNMENT
NET OFFICIAL RESERVES
(5+6)FOREIGNASSETS1
Of whichFOREIGN
LIABILITIES
NET INTERNATIONAL
RESERVES(1+4)
IMF RESERVETRANCHEPOSITION
SDR HOLDINGS
(1) (2) (3) (4) (5) (6) (7)
2014 11,496.9 180.6 403.9 0.0 11,496.9 0.2 11,497.12015 9,932.4 145.0 387.7 0.0 9,932.4 0.6 9,933.02016 9,462.9 131.6 325.6 0.0 9,462.9 2.9 9,465.82017 8,366.2 97.1 344.9 0.0 8,366.2 3.6 8,369.82018 7,571.4 117.1 336.5 0.0 7,571.4 3.6 7,575.0
2017I 9,102.6 116.1 332.7 0.0 9,102.6 2.8 9,105.4II 8,733.1 119.3 344.0 0.0 8,733.1 2.8 8,735.9III 8,503.0 117.6 342.3 0.0 8,503.0 3.6 8,506.6IV 8,366.2 97.1 344.9 0.0 8,366.2 3.6 8,369.8
2018I 7,984.3 99.2 352.0 0.0 7,984.3 3.6 7,987.9II 7,812.7 96.0 340.5 0.0 7,812.7 3.6 7,816.3III 7,461.7 95.2 337.7 0.0 7,461.7 3.6 7,465.3IV 7,571.4 117.1 336.5 0.0 7,571.4 3.6 7,575.0
END OF PERIOD
COMMERCIAL BANKSGROSS FOREIGN
ASSETS(1+6+8)
TOTAL FOREIGN LIABILITIES
(4+9)
NET FOREIGNRESERVES
(11-12)FOREIGNASSETS
FOREIGN LIABILITIES
NET FOREIGNPOSITION
(8-9)
(8) (9) (10) (11) (12) (13)
2014 3,066.7 790.6 2,276.1 14,563.8 790.6 13,773.22015 3,508.9 811.5 2,697.4 13,441.8 811.5 12,630.42016 3,343.8 605.5 2,738.2 12,809.6 605.5 12,204.02017 3,332.5 559.2 2,773.3 11,702.3 559.2 11,143.12018 3,420.4 647.2 2,773.2 10,995.4 647.2 10,348.3
2017I 3,401.4 567.6 2,833.8 12,506.8 567.6 11,939.2II 3,345.7 539.2 2,806.6 12,081.7 539.2 11,542.5III 3,523.8 582.8 2,941.0 12,030.4 582.8 11,447.6IV 3,332.5 559.2 2,773.3 11,702.3 559.2 11,143.1
2018I 3,424.2 613.2 2,810.9 11,412.0 613.2 10,798.8II 3,513.5 595.2 2,918.3 11,329.8 595.2 10,734.6III 3,306.1 572.6 2,733.5 10,771.4 572.6 10,198.8IV 3,420.4 647.2 2,773.2 10,995.4 647.2 10,348.3
SOURCE: Central Bank of Trinidad and Tobago
1 International reserves have been revised to include Trinidad and Tobago’s reserve position in the IMF. International reserves are defined as external assets that are readily available to and controlled by monetary authorities for direct financing of payments imbalances, for indirectly regulating the magnitudes of such imbalances through intervention in exchange markets and for other purposes. Typically, they include securities, gold, IMF special drawing rights (SDRs), a country’s holding of foreign currency and deposits, reserve position in the IMF, and other claims (Balance of Payments Manual 6th Edition Paragraph 6.64).

CENTRAL BANK OF TRINIDAD & TOBAGO
ANNUAL ECONOMIC SURVEY 2018
TABLE A.36
SUMMARY ACCOUNTS OF THE CENTRAL BANK, 2014-2018/ TT$ Millions /
ITEM 2014 2015 2016 2017 2018
Net Foreign Assets 69,783.8 60,602.5 60,467.2 53,004.5 47,815.6
Net International Reserves 73,103.3 63,761.9 63,836.6 56,578.6 51,338.2
Assets 73,103.3 63,761.9 63,836.6 56,578.6 51,338.2
Liabilities 0.0 0.0 0.0 0.0 0.0
Other Foreign Assets -3,319.5 -3,159.3 -3,369.4 -3,574.2 -3,522.7
Other External Assets 6.0 10.3 24.8 39.1 56.7
Medium and Long-Term Foreign Liabilities -231.6 -303.4 -425.4 -554.0 -575.3
SDR Allocation -3,094.0 -2,866.2 -2,968.7 -3,059.3 -3,004.0
Net Domestic Assets -34,213.6 -29,103.9 -31,704.9 -26,170.6 -22,279.7
Net Credit to the Public Sector -26,007.4 -23,053.2 -21,604.3 -16,664.5r -15,247.5
Central Government (net) -25,970.2 -23,011.6 -21,566.4 -16,627.2r -15,202.9
Treasury Bills 0.0 43.1 167.1 0.0 0.0
Other Government Securities 2,437.8 2,107.9 3,142.7 198.1 198.1
Loans to Government 40,004.3 46,677.6 36,458.6 46,976.7 51,970.3
Use of Reserves (-addition) -68,412.3 -71,840.1 -61,334.8 -63,802.0r -67,371.2
Rest of Public Sector -37.2 -41.6 -37.9 -37.4 -44.7
of which: Public Enterprises 0.0 0.0 0.0 0.0 0.0
Net Claims on Financial Institutions 0.0 0.0 0.0 0.0 0.0
Other Items (net) -8,206.3 -6,050.7 -10,100.6 -9,506.0r -7,032.1
Reserve Money 35,570.2 31,498.6 28,762.3 26,833.9 25,535.9
Currency in Circulation 8,350.9 9,092.4 9,365.5 9,420.9 9,386.9
Deposits of Commercial Banks 26,832.0 22,023.1 18,772.7 17,092.3 15,965.7
Deposits of Non-Bank Financial Institutions 387.3 383.1 624.0 320.6 183.3
Changes as a Per Cent of Beginning-of-Period Reserve Money
Net Foreign Assets 22.8 -25.8 -0.4 -25.9 -19.3
Net Domestic Assets -17.8 14.4 -8.3 19.2 14.5
Of which: Central Government -20.9 8.3 4.6 17.2 5.3
Reserve Money 5.0 -11.4 -8.7 -6.7 -4.8
Memorandum Item:
Government Blocked Account 34,947.9 32,217.5 31,343.6 24,303.7 24,958.6
SOURCE: Central Bank of Trinidad and Tobago

CALENDAR OF KEY ECONOMIC EVENTS
JANUARY - DECEMBER, 2018
JANUARY
1 The Government of the Republic of Trinidad and Tobago announced an across-the-board
12.5 per cent royalty tax on the production of crude oil, condensate, and natural gas as
part of the country’s 2017/18 National Budget. This action came into effect on January 1,
2018 and affected mainly BP Trinidad and Tobago. The tax did not impact Royal Dutch
Shell PLC, EOG Resources Inc. or BHP Billiton as these companies operate under
production-sharing contracts in which the GOTT takes a share of the oil and gas in return
for settling the taxes owed by the companies.
MARCH
1 The Mortgage Market Reference Rate was maintained at 3.00 per cent.
8 Live Music District (LMD), an initiative announced by the Minister of Finance in the
2017/18 Budget was launched in the pilot district of Port-of-Spain. It is being implemented
by the Trinidad and Tobago Creative Industries Company Limited through its agency
MusicTT, and is expected to increase exposure of the many talented local artists in
Trinidad and Tobago, and to generate revenue and employment from economic activity
within Port-of-Spain.
12 The Central Bank of Trinidad and Tobago through the Office of the Financial Ombudsman
launched a National Financial Education Committee in order to increase the level of
financial literacy in the country. The Committee signed a Memorandum of Understanding
and is expected to meet quarterly to discuss projects to achieve its objective of increased
financial literacy. It includes the Association of Trinidad and Tobago Insurance
Companies, the Bankers’ Association of Trinidad and Tobago, The Tobago House of
Assembly, the Stock Exchange of Trinidad and Tobago, the Securities Exchange
Commission among others.
29 The Central Bank of Trinidad and Tobago maintained the Repo rate at 4.75 per cent.
APRIL
6 The National Gas Company (NGC) finalised a commercial agreement with the Global
Petroleum Group (GPG) operating in Grenada. The relationship between the two
companies is the result of the Energy Sector Development Framework Agreement signed
between the Government of the Republic of Trinidad & Tobago and the Government of
Grenada. The NGC will seek to assist GPG in developing Grenada’s natural gas-based
energy sector and at the same time secure new sources of gas supply for NGC.
23 Finance Minister Colm Imbert signed a Policy-Based Loan Agreement in the sum of
US$300.0 million with the Corporación Andina De Fomento (CAF) Development Bank.
The loan will be used for the implementation of the programme to support Government’s
Medium-term Fiscal Consolidation Strategy—Phase II, to boost potential growth and

reduce the economy’s vulnerability to external fluctuations and volatility of external terms
of trade.
27 International credit rating agency Standard & Poor’s downgraded Trinidad and Tobago’s
outlook from stable to negative, but affirmed the country’s BBB+/A-2 long and short foreign
and local currency sovereign credit ratings, as well as the “A” transfer and convertibility
assessment on the country.
MAY
3 Republic Financial Holdings Limited announced that a total of 42,475,362 of its shares
worth $4.4 billion were transferred from Clico Investment Bank Limited (in compulsory
liquidation) (CIB-ICL) to the Government of Trinidad and Tobago and several of its state
enterprises.
4 The Export and Import Bank of Trinidad and Tobago (Eximbank) Forex Facility was
launched. The facility will fund the operations and import requirements of local
manufacturers and exporters. To qualify, at least 30.0 per cent of a business production
must be for export and companies must agree to repatriate a suitable amount of their
foreign exchange earnings.
13 The NGC signed a Technical Services Agreement (TSA) with Mozambique’s state-owned
petroleum company, Empresa Nacional de HidroCarbonetos, eight months after a
Memorandum of Understanding had been signed in September 2017. The agreement is
expected to provide NGC with a new revenue stream through monetization of the
company’s intellectual expertise and experience.
15 Shell Trinidad announced “first gas” from its Starfish Infill Drilling programme in the East
Coast Marine Area (ECMA), three years after a previous unsuccessful startup. Gas from
this field will supply both the liquefied natural gas (LNG) and petrochemical markets in
Trinidad as part of a larger ECMA strategy to deliver seven commercial gas wells in 2018
and up to 250.0 million standard cubic feet of gas per day (mmscf/d) to the local market.
JUNE
1 The Mortgage Market Reference Rate was maintained at 3.00 per cent.
4 An Act to repeal and replace the Insurance Act, Chap. 84:01; to reform the law relating to
insurance companies; to regulate insurance businesses and privately administered
pension fund plans and for other related purposes, was assented on this date. (Act No.4 of
2018)
8 An Act to amend the Property Tax Act, Chap. 76:04 was assented to on this date. This Act
may be cited as the Property (Amendment) Act, 2018. (Act No.6 of 2018)
18 A Memorandum of Understanding was signed between Beijing Construction Engineering
Group (BCEG) and the Evolving Tecknologies and Enterprise Development Company
Limited (eTeck) for the development of the Phoenix Park Industrial Estate which is
expected to cost US$104.0 million. The park will be established on 133 acres of land and
feature high-tech industries in the fields of ICT, biomedical engineering and new materials
technology. Financing of the project will be done via a concessional loan from China.

29 The Central Bank of Trinidad and Tobago increased the Repo rate by 25 basis points to
5.00 per cent.
JULY
3 All one cent coins issued by the Central Bank of Trinidad and Tobago ceased to be legal
tender for cash payments. (Legal Notice No. 35 of 2018)
5 Trinidad and Tobago Housing Development Corporation (HDC) entered into its second
public-private partnership (PPP) to provide housing for families on its database. This
contract with Mootilal Ramhit and Sons Contracting Ltd is expected to yield 201 two-and-
three bedroom single-family, townhouse and duplex units in Chin Chin, Cunupia.
16 Republic Bank of Trinidad and Tobago increased its Prime Lending Rate to 9.75 per cent
up from 9.5 per cent effective this date.
18 BHP Billiton announced the discovery of new gas in its Victoria-1 well off the East coast of
Trinidad. Victoria-1 is one of three wells planned as part of the company’s phase 2 drilling
campaign in TT. Drilling started in June 2018, and includes TTDAA 5 (Victoria-1 and
Concepcion-1) with co-venturer, Shell and TTDAA 14 (Bongos-1) with co-venturer,
bpTT. Victoria is the second gas discovery for BHP in as many years, following Le Clerc
in 2016, and has been estimated to hold four to five trillion cubic feet of gas.
AUGUST
2 BP Trinidad and Tobago announced the arrival of its Angelin platform in T&T. The Angelin
facility will be located 60 kilometres off the south east coast of Trinidad in water-depth of
approximately 65 metres. The development will include four wells and will have a
production capacity of approximately 600.0 mmscf/d. Gas from Angelin will flow to the
Serrette platform via a new 21 kilometre pipeline. First gas is expected in the first quarter
of 2019.
13 RBC Royal Bank of Canada increased its Prime Lending Rate from 9.0 per cent per
annum to 9.25 per cent per annum.
20 Shell TT announced the discovery of gas from its first well in its Dolphin Extension
Campaign. Dolphin, located in the East Coast Marine Area is one of the oldest producing
fields in TT. This new development, aimed at extending the life of the field, will have three
production wells when completed.
29 The National Gas Company of Trinidad and Tobago signed a Gas Sales Agreement with
DeNovo Energy Limited for the sale of natural gas to NGC from DeNovo’s Iguana field in
Block 1(a) (offshore Trinidad’s west coast). The agreement was signed in anticipation of
DeNovo’s delivery of natural gas later this year from the Iguana field, which is the first
natural gas development in the Gulf of Paria. DeNovo is the first local upstream company
to operate an offshore gas field.
SEPTEMBER
4 National Investment Fund (NIF) Bonds were listed and traded on the Trinidad and Tobago
Stock Exchange’s Corporate Bond Market. The NIFHCL is a company created by the

Government of the Republic of Trinidad and Tobago (GORTT) to hold assets. These
assets were received by the GORTT as proceeds from the shareholding of certain assets
of Colonial Life Company Limited (CLICO) and CLICO Investment Bank, as well as an
appropriate shareholding of Trinidad Generation Unlimited owned by GORTT. The NIF
bonds pay 4.5 per cent per year over five years, 5.7 per cent per year over 12 years and
6.6 per cent per year over 20 years. The offering opened on July 12, 2018 and closed on
August 12, 2018 and was oversubscribed by $3.3 billion or 82.0 per cent. Interest for all
denominations will be paid semi-annually on February 9, and August 9 for the duration of
each bond period. The total value of the entire NIF offer is $4.0 billion.
18 The Mortgage Market Reference Rate was maintained at 3.00 per cent.
19 Trinidad and Tobago and Guyana signed a Memorandum of Understanding that will see
the two parties collaborate on energy industry development. The two countries are
expected to co-operate on energy exploration and production; exchange knowledge and
information regarding regulatory issues, resource management and technology; promote
technical training and capacity building; develop health, safety and environment and local
content policies; jointly develop projects and more.
28 The Central Bank of Trinidad and Tobago maintained the Repo rate at 5.00 per cent.
OCTOBER
26 The Appropriation (Financial Year 2019) Act, 2018 (Act No.16 of 2018) was assented to
on this date. This Act serves to authorise Central Government expenditure from the
Consolidated Fund for the service of Trinidad and Tobago for the financial year ending on
September 30, 2019.
NOVEMBER
30 State-owned petroleum company, Petrotrin, shut down operations on this date. Prime
Minister Dr. Keith Rowley stated that the company was overburdened with debt as its net
debt position at the end of 2015 amounted to $11.4 billion. All 3500 permanent employees
of the Petrotrin were laid off. Petrotrin will remain as an entity to deal with legacy matters
and all the new companies will be under the umbrella of one company known as Trinidad
Petroleum Holdings Ltd. Three new companies were created as part of the company’s
restructuring, including Guaracara Refining Company (all refinery assets to be transferred
to this entity), Heritage Petroleum Company Ltd (to handle exploration and production)
and Paria Fuel Trading (trading and marketing).
DECEMBER
13 The Government of the Republic of Trinidad and Tobago increased its shareholding in the
Corporación Andina de Fomento (CAF) by US$190.0 million (13,381 shares) when it
signed the Agreement for the Common Capital Shares at the 164th Board of Directors
Meeting of CAF in Uruguay. To date Trinidad and Tobago has invested US$519.0 million
in CAF.
14 An agreement was signed between the Government of Trinidad and Tobago and British
Petroleum Trinidad and Tobago (BpTT) to extend the South East Galeota Exploration &
Production license, as well as to begin the offshore investments of the Cassia

Compression Project and the Matapal Gas Project. The energy company will invest some
US$1.8 billion in these new projects. This agreement concluded the first phase of Trinidad
and Tobago’s negotiations with BpTT for future gas production and projects in Trinidad
and Tobago.
28 The Central Bank of Trinidad and Tobago maintained the Repo rate at 5.00 per cent.