draft do not cite, quote, or copy - rti international
TRANSCRIPT

PROCESS MODEL DOCUMENTATION: CALCULATION OF THE COST AND LIFE-CYCLE INVENTORY FOR WASTE DISPOSAL IN
TRADITIONAL, BIOREACTOR, AND ASH LANDFILLS
by
Barbara Sich and Morton Barlaz North Carolina State University
Raleigh, North Carolina 27695-7908
July 2000
DRAFT
DO NOT CITE, QUOTE, OR COPY
Process Model Documentation
iii
TABLE OF CONTENTS
Page 1. Introduction ...........................................................................................................................................................1
1.1 Facility Construction .....................................................................................................................................1 2. Cost of Waste Disposal in Traditional, Bioreactor, and Ash Landfills .................................................................5
2.1 Initial Construction Costs ..............................................................................................................................6 2.1.1 Land Acquisition Costs..........................................................................................................................6 2.1.2 Site Fencing ...........................................................................................................................................9 2.1.3 Site Buildings and Structures...............................................................................................................11 2.1.4 Platform Scales ....................................................................................................................................11 2.1.5 Site Utilities Installation ......................................................................................................................12 2.1.6 Site Access Roads................................................................................................................................12 2.1.7 Monitoring Wells.................................................................................................................................14 2.1.8 Initial Landscaping (Buffer Zone) .......................................................................................................14 2.1.9 Leachate Pump and Storage.................................................................................................................15 2.1.10 Site Suitability Study, Planning, and Licensing...................................................................................16 2.1.11 Total Initial Construction Cost Function .............................................................................................17
2.2 Cell Construction Costs ...............................................................................................................................17 2.2.1 Site Clearing and Excavation...............................................................................................................17 2.2.2 Site Berm Construction........................................................................................................................19 2.2.3 Liner Systems ......................................................................................................................................21 2.2.4 Leachate Collection Materials for Traditional and Ash Landfills .......................................................24 2.2.5 Leachate Collection and Recirculation Materials for Bioreactor Landfills .........................................26 2.2.6 Cell Preoperational Costs ....................................................................................................................27 2.2.7 Total Cell Construction Cost Function ................................................................................................28
2.3 Operating Costs ...........................................................................................................................................29 2.3.1 Daily Operations..................................................................................................................................29 2.3.2 Daily Cover Material ...........................................................................................................................30 2.3.3 Total Operating Cost Function ............................................................................................................33
2.4 Closure Costs...............................................................................................................................................33 2.4.1 Gas Extraction .....................................................................................................................................33 2.4.2 Final Cover ..........................................................................................................................................36 2.4.3 Cost of Replacing Final Cover ............................................................................................................39 2.4.4 Perpetual Care......................................................................................................................................40 2.4.5 Total Closure Cost Function................................................................................................................40
2.5 Landfill Gas Revenue ..................................................................................................................................41 2.5.1 Quantity of Landfill Gas Produced......................................................................................................41 2.5.2 Gas Treatment......................................................................................................................................42 2.5.3 Revenue Generated..............................................................................................................................44
2.6 Total Landfill Cost Function .......................................................................................................................45 2.7 Default Values .............................................................................................................................................46
3.0 Life-Cycle Inventory of Landfill Operations...................................................................................................63 3.1 Daily Cover Materials..................................................................................................................................63
3.1.1 On-Site Soil .........................................................................................................................................65 3.1.2 Off-Site Soil.........................................................................................................................................65 3.1.3 Revenue-Generating Cover .................................................................................................................66 3.1.4 No Daily Cover....................................................................................................................................66

Process Model Documentation
iv
TABLE OF CONTENTS, continued
Page 3.1.5 Alternate Daily Cover (HDPE)............................................................................................................67 3.1.6 Life-Cycle Inventory of Cover Material ..............................................................................................67
3.2 Equipment Use ............................................................................................................................................68 3.2.1 Emissions Due to Equipment Use .......................................................................................................69
3.3 Fuel Consumed During Material Transport.................................................................................................71 3.3.1 Transport Emissions ............................................................................................................................74 3.3.2 Fuel Precombustion Emissions............................................................................................................75
3.4 Total Emissions ...........................................................................................................................................76 3.5 Default Values .............................................................................................................................................77
4. Life-Cycle Inventory of Landfill Closure............................................................................................................81 4.1 Materials Consumption................................................................................................................................81
4.1.1 Final Cover ..........................................................................................................................................81 4.1.2 Gas Collection System.........................................................................................................................83 4.1.3 Gas Monitoring System .......................................................................................................................83 4.1.4 Emissions Due to Consumption of Resources .....................................................................................83
4.2 Equipment Use ............................................................................................................................................84 4.2.1 Emissions Due to Equipment Use .......................................................................................................85
4.3 Fuel Consumed During Material Transport.................................................................................................86 4.3.1 Transport Emissions ............................................................................................................................89 4.3.2 Fuel Precombustion Emissions............................................................................................................90
4.4 Total Emissions ...........................................................................................................................................91 4.5 Default Values .............................................................................................................................................92
5. Life-Cycle Inventory of Landfill Post-Closure....................................................................................................95 5.1 Materials Consumption................................................................................................................................95
5.1.1 Emissions Due to Material Consumption ............................................................................................95 5.2 Equipment and Fuel Use..............................................................................................................................96
5.2.1 Emissions Due to Fuel Use..................................................................................................................97 5.3 Total Emissions ...........................................................................................................................................99 5.4 Default Values ...........................................................................................................................................101
6. Life-Cycle Inventory of Landfill Gas ................................................................................................................103 6.1 Landfill Gas Composition..........................................................................................................................103 6.2 Landfill Gas Production.............................................................................................................................104
6.2.1 Landfill Gas Yield and Allocation.....................................................................................................105 6.3 Landfill Gas Collection..............................................................................................................................106 6.4 Landfill Gas Treatment..............................................................................................................................109
6.4.1 Treatment of Collected Landfill Gas .................................................................................................109 6.4.2 Emissions Due to Landfill Gas Treatment.........................................................................................112
6.4.2.1 Equipment emissions .....................................................................................................................112 6.4.2.2 Components of landfill gas remaining after treatment...................................................................115
6.4.3 Treatment of Uncollected Landfill Gas .............................................................................................118 6.5 Offsets Due to Landfill Gas Treatment......................................................................................................122 6.6 Total Landfill Gas Emissions ....................................................................................................................124 6.7 Gas Allocation ...........................................................................................................................................126 6.8 Default Values ...........................................................................................................................................128
7.0 Life-Cycle Inventory of Landfill Leachate....................................................................................................133

Process Model Documentation
v
TABLE OF CONTENTS, continued
Page 7.1 Leachate Generation ..................................................................................................................................133 7.2 Leachate Collection and Management.......................................................................................................134
7.2.1 Overview ...........................................................................................................................................134 7.2.2 Leachate Production and Collection by Period..................................................................................136 7.2.3 Management Alternatives for Leachate Collection Period 3 .............................................................138
7.2.3.1 Leachate contained within the landfill...........................................................................................139 7.2.3.2 Leachate released to the environment............................................................................................140
7.3 Leachate Collection ...................................................................................................................................144 7.3.1 Leachate Collection Efficiency..........................................................................................................144 7.3.2 Time Horizon.....................................................................................................................................145
7.4 Leachate Quality........................................................................................................................................147 7.4.1 BOD and COD...................................................................................................................................155 7.4.2 TSS, NH3, and PO4 ............................................................................................................................156 7.4.3 Trace Organic Constituents ...............................................................................................................156 7.4.4 Heavy Metals .....................................................................................................................................157
7.5 Transport of Leachate to the POTW..........................................................................................................158 7.5.1 Emissions Due to Leachate Transport ...............................................................................................160
7.6 Leachate Treatment ...................................................................................................................................160 7.6.1 BOD Generation ................................................................................................................................161
7.6.1.1 Emissions due to BOD removal.....................................................................................................165 7.6.2 COD Removal and Resulting Emissions ...........................................................................................166 7.6.3 Removal of TSS, NH3, and PO4 ........................................................................................................167 7.6.4 Heavy Metals .....................................................................................................................................169 7.6.5 Trace Organics...................................................................................................................................170 7.6.6 Fugitive Leachate...............................................................................................................................170
7.7 Materials Consumed in Bioreactor Landfills.............................................................................................171 7.7.1 Emissions Due to Material Consumption ..........................................................................................174
7.8 Total Leachate Emissions ..........................................................................................................................175 7.9 Leachate Allocation ...................................................................................................................................177 7.10 Default Values ...........................................................................................................................................178
References .................................................................................................................................................................183 Appendix A: Depth of Liner and Leachate Collection Systems ...........................................................................A–1 Appendix B: Discount Factors.............................................................................................................................. B–1 Appendix C: Site Soil Utilization ......................................................................................................................... C–1 Appendix D: Combustion Emission Factors .........................................................................................................D–1 Appendix E: Alphabetic Parameters Used in Calculations................................................................................... E–1

Process Model Documentation
vii
LIST OF TABLES
Page Table 1: Landfill LCI: Landfill Gas is Recovered for Energy .................................................................................2 Table 2: Landfill LCI: Landfill Gas is Burned in a Flare ........................................................................................3 Table 3: Significance of Landfill Construction to Total MSW System LCI ...........................................................4 Table 4. Equipment Rental Cost for Traditional and Bioreactor Landfills............................................................51 Table 5. Equipment Cost per Ton Per Day (TPD) for Traditional and Bioreactor Landfills.................................51 Table 6. Equipment Rental Cost for an Ash Landfill ............................................................................................52 Table 7. Equipment Cost per TPD for an Ash Landfill .........................................................................................52 Table 8: Default Values for Percent of Daily Cover Used in Traditional and Bioreactor Landfills......................64 Table 9: Default Values for Percent of Daily Cover Used in Ash Landfills..........................................................64 Table 10: Breakdown of Fuel Usage at Landfills With Daily Cover.......................................................................68 Table 11: Breakdown of Fuel Usage at Landfills Without Daily Cover..................................................................69 Table 12: Operations Equipment and AP-42 Categories .........................................................................................70 Table 13: Transport of Materials to Site During Landfill Waste Placement ...........................................................72 Table 14: Breakdown of Equipment Use for Landfill Closure ................................................................................85 Table 15: Transport of Soil to Site During Landfill Closure ...................................................................................86 Table 16: Transport of Other Materials to Site During Landfill Closure ................................................................86 Table 17: Speciated Trace Constituents in Landfill Gas........................................................................................103 Table 18: Methane Yields Measured Under Laboratory Conditionsa....................................................................105 Table 19: Default Values for Landfill Gas Collection...........................................................................................107 Table 20: Percent of Landfill Gas Treatment Methods Used ................................................................................109 Table 21: Landfill Gas Destruction Efficiencies (%).............................................................................................111 Table 22: Landfill Gas Emission Factors...............................................................................................................111 Table 23: Treatment Efficiencies of Soil Cover ....................................................................................................119 Table 24: Percent of Leachate Sent to POTW .......................................................................................................135 Table 25: Years Within Leachate Production Period.............................................................................................138 Table 26: Leachate Constituents Considered in the Study.....................................................................................147 Table 27: TSS, BOD, COD, NH3, and PO4 Yields ..............................................................................................149 Table 28: Default Percent Contribution of Each Waste Component to NH3 and PO4 Concentrations ................151 Table 29: Percent Contribution of Each Waste Component to Total Metal Concentration...................................152 Table 30: Percent Contribution of Each Waste Component to Total Metal Concentration...................................154 Table 31: Default Parameters for Modeling the BOD Concentration in Landfill Leachate
for Traditional and Bioreactor Landfills ................................................................................................155 Table 32: Default Parameters for Modeling the COD Concentration in Landfill Leachate
for Traditional and Bioreactor Landfills ................................................................................................155 Table 33: TSS, NH3, and PO4 Concentrations in Landfill Leachate for Traditional
and Bioreactor Landfills ........................................................................................................................156 Table 34: NH3 and PO4 Concentrations in Landfill Leachate for Ash Landfills..................................................156 Table 35: Trace Organic Concentrations in Landfill Leachate for Traditional and Bioreactor Landfills..............157 Table 36: Metal Concentrations in Leachate for Traditional and Bioreactor Landfills .........................................157 Table 37: Metal Concentrations in Ash Leachate ..................................................................................................158 Table 38: POTW Treatment Efficiencies...............................................................................................................161 Table 39: Slope of Segments in BOD Concentration Profile ................................................................................162 Table 40: Y-Intercept of Segments in BOD Concentration Profile .......................................................................163

Process Model Documentation
viii
Table 41: Time Horizon on BOD Concentration Profile .......................................................................................163 Table 42: BOD Concentration ...............................................................................................................................163

Process Model Documentation
ix
LIST OF FIGURES
Page Figure 1. Landfill Cost Curve ...................................................................................................................................5 Figure 2. MSW Landfill Geometry for Land Requirement Calculation ...................................................................7 Figure 3. MSW Landfill Geometry for Fencing Calculation ..................................................................................10 Figure 4. Site Roads Layout for MSW Landfill......................................................................................................13 Figure 5. MSW Landfill Geometry for Earthen Berm Calculation.........................................................................20 Figure 6. MSW Landfill Liner Options...................................................................................................................23 Figure 7. Leachate Collection System for MSW Landfill.......................................................................................25 Figure 8. Gas Extraction System for MSW Landfill...............................................................................................34 Figure 9. Final Cover Cross Section .......................................................................................................................36 Figure 10: Amount of Gas Not Collected Due to Absence of a Gas Collection System
and Collection System Efficiency..........................................................................................................110 Figure 11: Amount of Gas Not Collected Due to Discontinuation of the Gas Collection System
and Collection System Efficiency..........................................................................................................110 Figure 12: Leachate as a Percent of Precipitation ...................................................................................................133 Figure 13: BOD Concentration in Landfill Leachate Over Time (per ton of waste) ..............................................148

1. Introduction
The objective of this document is to present a model to calculate the cost and life-cycle inventory (LCI) for the burial of one ton of municipal solid waste (MSW) or combustion ash in a landfill. The model is designed to calculate the cost and LCI for one ton of waste in consideration of user input and default values for each of three types of landfills: a traditional landfill (synonymous with a conventional landfill), a bioreactor landfill, and an ash landfill. While the term "model" is used throughout this document, there are actually three models, one for each type of landfill. The formats of each of the three models are similar, and areas of divergence are addressed throughout this document.
The spreadsheet model for landfills is one element of a decision support tool (DST) for integrated solid waste management planning, which includes models for waste generation, collection and transfer, separation (material recovery facilities), and treatment (composting, combustion, or refuse-derived fuel production), as well as disposal in a landfill. The integrated model is used to calculate the combination of waste management options that would best meet user-identified objectives such as cost minimization, specified recycling fractions, or minimization of an environmental emission or energy consumption.
The equations for calculation of cost are presented in section 2 of this document, followed by the equations for the LCI in remaining sections 3 through 7. Within these sections, equations that appear in the landfill spreadsheet are numbered. Intermediate calculations that are not included in the spreadsheet are not numbered. Definitions of model parameters precede each series of related equations and include units of measure in parentheses. Although actual values of parameters are not part of the definitions, default values appear at the end of each section. This document also includes five appendices. Appendices A through D offer additional information on depth of liner and leachate collection systems (A), discount factors (B), soil utilization (C), and emission factors (D). Appendix E is an alphabetical listing of all parameters presented in this document.
1.1 Facility Construction
There is one issue regarding the landfill LCI that must be addressed up front. The LCI for the construction phase of the landfill was not included in the landfill LCI. Originally, this system boundary was adopted for all process models. Much later, questions arose as to whether this was the appropriate boundary for the landfill. The EREF Landfill LCI model was used to evaluate the significance of the construction phase of a landfill to the overall landfill LCI. This evaluation was conducted for landfills with and without energy recovery, and the results are presented in Tables 1 and 2, respectively. When landfill gas is recovered, the effect of construction is generally small. However, when landfill gas is not recovered for energy, the effect of construction on the landfill LCI is more significant for some LCI parameters. To further evaluate the significance of construction, the results for the landfill LCI (for a landfill that does not recover energy) were compared to the total LCI for a solid waste system that includes 25% recycling and burial of the residual waste in a landfill. As presented in Table 3, the landfill construction LCI is very small relative to the overall system LCI. The landfill construction LCI becomes slightly more significant when the contribution of remanufacturing to the total LCI is removed. However, in no case does landfill construction represent even 10% of the overall LCI without remanufacturing.

1. Introduction
2
Table 1: Landfill LCI: Landfill Gas is Recovered for Energya
Component
Unit
Total
Construction
Operation
Closure
Post-Closure
Landfill Gas
Leachate
% of Construction to Total
Air Emissions
CO2 fossil lb -203.7 2.830 7.468 3.417 0.342 -218.380 0.6 -1.39
CO2 biomass lb 503.7 0 0.000 0 0 501.940 1.8 0.00
Methane lb 16.3 1.81E-03 0.004 1.73E-03 1.73E-04 16.253 1.24E-03 0.01CO lb 2.3 1.82E-02 0.047 3.35E-02 3.44E-03 2.234 2.33E-04 0.78NOx lb 0.3 5.09E-02 0.106 9.05E-02 8.97E-03 0.034 1.74E-03 17.42SOx lb -1.2 9.32E-03 1.51E-02 1.30E-02 1.29E-03 -1.222 2.47E-03 -0.79Total particulate lb -0.8 8.09E-03 1.15E-02 8.04E-03 8.05E-04 -0.843 2.02E-03 -1.00Hydrogen chloride lb -1.72E-02 5.32E-05 3.65E-05 4.72E-05 4.69E-06 -1.74E-02 7.33E-05 -0.31Hydrogen sulfide lb 2.20E-03 7.09E-06 1.63E-05 7.15E-06 7.16E-07 2.17E-03 4.51E-07 0.32Water Emissions BOD lb 4.45E-02 3.47E-04 8.34E-04 3.64E-04 3.65E-05 -8.28E-04 4.37E-02 0.78COD lb 0.166 2.81E-03 7.05E-03 2.99E-03 3.00E-04 -6.98E-03 0.1599158 1.69TSS lb 3.83E-03 1.55E-03 3.83E-03 1.65E-03 1.65E-04 -3.77E-03 4.07E-04 40.38
NH3 lb 2.13E-02 5.00E-05 1.23E-04 5.26E-05 5.27E-06 -1.97E-04 2.12E-02 0.23
PO4 lb 5.28E-04 8.55E-07 1.26E-09 8.32E-07 8.23E-08 -8.81E-11 5.26E-04 0.16
Water Metals Arsenic lb 3.96E-07 0 0 0 0 0 3.96E-07 0Barium lb 9.28E-06 0 0 0 0 0 9.28E-06 0Cadmium lb 3.42E-08 0 0 0 0 0 3.42E-08 0Chromium lb 7.16E-07 8.14E-10 7.87E-09 3.28E-10 3.25E-11 -3.50E-09 7.11E-07 0.11Lead lb 7.79E-08 0 0 0 0 0 7.79E-08 0Mercury lb 1.37E-09 0 0 0 0 0 1.37E-09 0Selenium lb 3.42E-08 0 0 0 0 0 3.42E-08 0Silver lb 1.71E-07 0 0 0 0 0 1.71E-07 0

1. Introduction
3
aResults are for the behavior of one ton of MSW for 100 years.

1. Introduction
4
Table 2: Landfill LCI: Landfill Gas is Burned in a Flarea
Component
Unit
Total
Construction
Operation
Closure
Post-Closure
Landfill Gas
Leachate
% of Construction to Total
Air Emissions
CO2 fossil lb 14.65 2.83 7.47 3.42 0.34 0.00 0.59 19.32
CO2 biomass lb 503.72 0.00 0.00 0.00 0.00 501.96 1.76 0.00
Methane lb 16.886 1.81E-03 3.71E-03 1.73E-03 1.73E-04 16.877 1.24E-03 0.01CO lb 3.164 1.82E-02 0.047 3.35E-02 3.44E-03 3.062 2.33E-04 0.58NOx lb 0.421 5.09E-02 0.106 9.05E-02 8.97E-03 0.163 1.74E-03 12.09SOx lb 6.53E-02 9.32E-03 1.51E-02 1.30E-02 1.29E-03 2.42E-02 2.47E-03 14.27Total particulate lb 3.05E-02 8.09E-03 1.15E-02 8.04E-03 8.05E-04 0 2.02E-03 26.52Hydrogen chloride lb 2.26E-02 5.32E-05 3.65E-05 4.72E-05 4.69E-06 2.24E-02 7.33E-05 0.24Hydrogen sulfide lb 2.22E-03 7.09E-06 1.63E-05 7.15E-06 7.16E-07 2.19E-03 4.51E-07 0.32Water Emissions BOD lb 4.53E-02 3.47E-04 8.34E-04 3.64E-04 3.65E-05 0 4.37E-02 0.77COD lb 0.173074 2.81E-03 7.05E-03 2.99E-03 3.00E-04 0 0.159916 1.63TSS lb 7.60E-03 1.55E-03 3.83E-03 1.65E-03 1.65E-04 0 4.07E-04 20.36
NH3 lb 2.15E-02 5.00E-05 1.23E-04 5.26E-05 5.27E-06 0 2.12E-02 0.23
PO4 lb 5.28E-04 8.55E-07 1.26E-09 8.32E-07 8.23E-08 0 5.26E-04 0.16
Water Metals Arsenic lb 3.96E-07 0 0 0 0 0 3.96E-07 0Barium lb 9.28E-06 0 0 0 0 0 9.28E-06 0Cadmium lb 3.42E-08 0 0 0 0 0 3.42E-08 0Chromium lb 7.20E-07 8.14E-10 7.87E-09 3.28E-10 3.25E-11 0 7.11E-07 0.11Lead lb 7.79E-08 0 0 0 0 0 7.79E-08 0Mercury lb 1.37E-09 0 0 0 0 0 1.37E-09 0Selenium lb 3.42E-08 0 0 0 0 0 3.42E-08 0Silver lb 1.71E-07 0 0 0 0 0 1.71E-07 0

1. Introduction
5
aResults are for the behavior of one ton of MSW for 100 years.

1. Introduction
6
Table 3: Significance of Landfill Construction to Total MSW System LCIa
LCI Parameter (lb/year)
U.S. EPA Region 5 Landfill
Construction
Landfill Construction
as a Percentage of Total System LCI
Landfill Construction
as a Percentage of Total System LCI
(Without Remanufacturing)
Energy consumption (MBTU/year) 9767.42 0.130% 3.330% Total particulate matter 2856.47 0.197% 8.842% Nitrogen oxides 19900.82 0.329% 4.028% Sulfur oxides 3591.58 0.044% 1.823% Carbon monoxide 7112.40 0.042% 6.742% Carbon dioxide biomass 0.00 0.000% 0.000% Carbon dioxide fossil 1026106.66 1.664% 3.028%
Hydrocarbons (non CH4) 3847.40 0.866% 2.980%
Methane (CH4) 648.47 0.001% 0.001%
BOD 120.92 0.010% 0.458% COD 972.35 0.020% 1.291% Ammonia (water) 17.37 0.079% 0.407% Arsenic 0.00 0.000% 0.000% Mercury 0.00 0.000% 0.000% Phosphate 0.37 0.029% 0.407% Selenium 0.00 0.000% 0.000% Chromium 0.00 0.001% 0.005%

5
2. Cost of Waste Disposal in Traditional, Bioreactor, and Ash Landfills
Landfill costs fall into one of four categories: (1) initial construction, (2) cell construction (also applicable to each subsequent individual cell), (3) operations, and (4) closure as modeled in sections 2.1–2.4, respectively. The revenue generated from landfill gas is considered in section 2.5. Initial construction costs consist of those activities that would be completed prior to operation of the facility, which would not be repeated for each individual cell. These costs are amortized over the facility life. Cell construction costs include all engineering design and construction completed for each individual cell of the facility and are amortized over the life of the cell. Operation costs include all costs incurred annually to run the facility. Closure costs include all one-time activities conducted after all cells in the facility are completed, as well as post-closure monitoring and other long-term activities related to site maintenance after closure. The post-closure costs are amortized over the life of the facility so that these costs are reflected in the cost of waste disposal. Landfill gas can be used directly or to generate electricity or steam. The associated revenues can be sold to offset some of the costs associated with building, operating, and maintaining a landfill.
To develop the cost function for a landfill, its size is needed. However, this size is specified by the DST solution. Thus, to use the landfill process model, the landfill size is based on user input values for the facility life and the daily waste flow. As input by the user, these parameters are used only to provide a rough "order-of-magnitude" size estimate for the landfill for estimation of the cost function. The actual mass of waste to be buried and the life of the facility will depend upon the model solution. To capture the economies of scale associated with building a large landfill, it is assumed that a facility will be built only if it receives a reasonable waste flow. For example, a landfill would not be built for a mass flow of 25 tons/day. Since the mass flow is a model solution, the user should evaluate whether building a landfill with the mass flow specified in the model solution is actually feasible. A plot of inlet mass flow versus cost ($/ton) is included in the landfill process model for each landfill type. A sample plot is shown in Figure 1.
Figure 1. Landfill Cost Curve (The triangle [▲] represents the calculated cost based on current defaults.)
Landfill C ost
$0.00
$5.00
$10.00
$15.00
$20.00
$25.00
$30.00
$35.00
$40.00
$45.00
$50.00
0 500 1000 1500 2000 2500
ton / day
$ / t
on
C U R R EN T C O ST

2. Cost of Waste Disposal in Traditional, Bioreactor, and Ash Landfills
6
This curve was developed by holding the user input parameters constant and varying the expected mass flow. If the amount of mass that flows to a landfill is on the flat part of this curve, then the landfill is sufficiently large to realize some economy of scale during construction. If the model solution falls on the steeply sloped section of the curve, then it is likely that construction of a landfill for this model scenario is not economically efficient. In this case, the user may want to evaluate other alternatives such as construction of a transfer station to ship waste to a regional landfill. If the user wishes simply to input the landfill tipping fee, this may be done through the DST. However, the default data used to estimate the landfill cost are also used in part for estimation of the landfill LCI. Based on the current default settings, a landfill with an expected life of 20 years and a waste acceptance rate of 1,350 ton/day will have a cost of 23.83 $/ton.
Landfills represent a unique problem relative to other solid waste unit operations. All other unit operations have a useful life, and it is assumed that these unit operations can be replaced at the same cost and adjusted for inflation. The same assumption with respect to replacement cost is made for landfills.
2.1 Initial Construction Costs
2.1.1 Land Acquisition Costs
This section documents the development of a cost function for required land area. A model of a typical landfill is used to estimate land costs. The required acreage is dependent on the following factors:
• buffer zone requirements between the landfill and the site boundary;
• capacity of the landfill;
• geometry of the site, including waste depth and surface area; and
• land required for support facilities (scales, offices, gas, and leachate control). (These are assumed to be located within the buffer zone, so no additional land requirements are calculated.)
If a landfill site is not yet chosen, then the user will not have information to specify a complex geometry. Thus, a model is developed for a rectangular waste disposal volume with sloped sides. Figure 2 is a schematic showing important features of the generic landfill for the purpose of estimating land requirement.
The following user input parameters and calculated parameters are required to develop the land acquisition cost function.
♦ User Input Parameters:
• c1, unit cost of land ($/acre)
• De, depth of excavation (ft)
• Dmsw, average density of waste after burial (lb/yd3)
• Ha, height of waste above grade (ft)
• Lb, buffer zone distance (ft)
• Mwl, expected mass flow (ton/day)

2. Cost of Waste Disposal in Traditional, Bioreactor, and Ash Landfills
7
• Ny, expected useful life of landfill (years)
• Pcvr1, percent of total landfill volume occupied by cover (%)
• Rda, slope of the grade of the disposal volume above site grade as rise over run
• Rdb, slope of the grade of the disposal volume below site grade as rise over run
• RLW, length-to-width ratio
♦ Calculated Parameters:
• As, area of land required for landfill and buffer zone (acres)
• CL, cost function for land ($)
• Dlls, depth of liner and leachate collection system (ft)
• Hb, height of waste below grade (ft)
• Ldv, length of disposal volume (ft)
• Va, available volume for the disposal site (yd3)
• Vw, required landfill capacity for waste (yd3)
• Wdv, width of disposal volume (ft)
Figure 2. MSW Landfill Geometry for Land Requirement Calculation

2. Cost of Waste Disposal in Traditional, Bioreactor, and Ash Landfills
8
The cost function for land is a function of the unit land cost and the area of the site. The disposal volume depth below site grade is the excavation depth, adjusted for 1) the thickness of the liner, 2) the thickness of the leachate collection system, and 3) the thickness of the protective soil placed over the liner system. These parameters are combined to give a single liner thickness as developed in Appendix A (Depth of Liner and Leachate Collection Systems). The resulting equation for the below-grade depth of the permitted capacity is
H D Db e lls= − (1)
The required waste capacity is determined from the waste mass, waste density, and expected useful facility life:
( )( )
msw
yyearday 365
tonlb
wlw D
N2000MV
××= (2)
The available volume must accommodate both the volume of waste and the cover soil:
⎟⎟⎠
⎞⎜⎜⎝
⎛ +×=
100P100
VV 1cvrwa (3)
Values for the length and width of the disposal volume must be indirectly determined from the available disposal volume, the depth and height of the disposal volume, the length-to-width ratio, and the slopes of the sides above and below grade. Because of the sloping sides, the actual length and width vary as a function of height, as follows.
Above-site grade:
( )
( )
L z LR
z
W z WR
z
dvda
dvda
= −
= −
2
2
Below-site grade:
( )
( )
L z LR
z
W z WR
z
dvdb
dvdb
= −
= −
2
2
The available volume can then be calculated by integrating the disposal volume cross-sectional area over the height and depth of the volume:
( ) ( )
V LR
z WR
z dz LR
z WR
z dz
V L W H HR
L W HR
L W H HR
L W HR
a dvda
H
dvda
dvdb
H
dvdb
a dv dv aa
dadv dv
a
dadv dv b
b
dbdv dv
b
db
a b
= −⎛
⎝⎜
⎞
⎠⎟ −⎛
⎝⎜
⎞
⎠⎟ + −
⎛
⎝⎜
⎞
⎠⎟ −⎛
⎝⎜
⎞
⎠⎟
= − + + + − + +
∫ ∫2 2 2 2
43
43
0 02 3
2
2 3
2

2. Cost of Waste Disposal in Traditional, Bioreactor, and Ash Landfills
9
The length and width are related by the length-to-width ratio, as follows:
LWdvdv RWL ×=
Substituting in the expression for Va and solving for Wdv using the quadratic formula:
( ) ( )
( ) ( ) ( )
( )baLW
2db
3b
2da
3a
abaLW
2
db
2b
da
2a2
LWdb
2b
da
2a
LW
dv
3
3
2db
3b
2da
3a
db
2b
da
2a
LWdvbaLW2dva
HHR2
RH
RH
34V27HHR4
RH
RH1R
RH
RH1R
W
ft27yd
RH
RH
34
RH
RH1RWHHRWV
+
⎟⎟⎠
⎞⎜⎜⎝
⎛⎟⎟⎠
⎞⎜⎜⎝
⎛+−×++⎟
⎟⎠
⎞⎜⎜⎝
⎛+++⎟
⎟⎠
⎞⎜⎜⎝
⎛++
=
⎟⎟⎠
⎞⎜⎜⎝
⎛×⎥⎥⎦
⎤
⎢⎢⎣
⎡⎟⎟⎠
⎞⎜⎜⎝
⎛++⎟
⎟⎠
⎞⎜⎜⎝
⎛++−+=
(4)
( ) ( ) ( )
( )ba
2db
3b
2da
3a
abaLW
2
db
2b
da
2a2
LWdb
2b
da
2a
LW
dv HH2
RH
RH
34V27HHR4
RH
RH1R
RH
RH1R
L+
⎟⎟⎠
⎞⎜⎜⎝
⎛⎟⎟⎠
⎞⎜⎜⎝
⎛+−×++⎟
⎟⎠
⎞⎜⎜⎝
⎛+++⎟
⎟⎠
⎞⎜⎜⎝
⎛++
= (5)
The site area is the product of the total length (including the buffer zone length at each end) and the total width (also including the buffer zone length at each end):
( ) ( ) ( )2ft 43563acre
bdvbdvs L2WL2LA ×+×+= (6)
The cost function for land acquisition is then simply the site area multiplied by the cost per acre:
C c AL s= ×1 (7)
2.1.2 Site Fencing
This section documents the development of a cost function for enclosing the site with industrial-grade security fencing.
The entire site boundary is fenced to prevent unauthorized access during construction and operation, as required by 40 CFR 258.25. The access gate is addressed in the construction of the gatehouse (section 2.1.3). Figure 3 is a schematic showing the layout dimensions of the site fence.
The required parameters follow.
♦ User Input Parameters:
• c5, unit cost of industrial fencing, material and installation ($/linear ft)
• RLW, length-to-width ratio
♦ Calculated Parameters:
• As, area of land required for landfill and buffer zone (acres)
• CF, cost function of site fencing ($)

2. Cost of Waste Disposal in Traditional, Bioreactor, and Ash Landfills
10
• Ls, total site length (ft)
• Ps, site perimeter (ft)
• Ws, total site width (ft)
The site fencing cost is a function of the unit cost and the total site perimeter. The total site perimeter is derived from the calculated total site area and the length-to-width ratio for the waste disposal volume (since an equal length buffer zone distance is applied around the disposal volume, the length-to-width ratio for the site is the same as that of the disposal volume):
( )
( )( ) ( ) LWacre
ft 43563ss
LW
acreft 43563
ss
LW2sssacre
ft 43563s
LWss
sss
RAL ,R
AW
RWWLA
RWLWL2P
22
2
××=×
=
×=×=×
×=+×=
( ) ⎟
⎟⎠
⎞⎜⎜⎝
⎛+×××=
LW
sLWacre
ft 43563ss R
ARA2P 2
( ) R
11RA2PLW
LWacreft 43563
ss2
⎟⎟⎠
⎞⎜⎜⎝
⎛+××××= (8)
The calculation for parameter As is provided in equation 6 (section 2.1.1).
Making all substitutions into the cost function gives the final equation:
C c PF s= ×5 (9)
Figure 3. MSW Landfill Geometry for Fencing Calculation
BUFFER ZONE
DISPOSAL VOLUME W
FENCING
Ls
s

2. Cost of Waste Disposal in Traditional, Bioreactor, and Ash Landfills
11
2.1.3 Site Buildings and Structures
This section documents the development of a cost function for construction of structures required to support the operation of the landfill and for a flare required for landfill gas treatment. The types of buildings and the cost per sq ft are used to calculate the costs. Gatehouse costs are considered to include the access gate. The cost of an enclosed flare includes the capital and maintenance cost of the flare and blower. The required parameters follow.
♦ User Input Parameters:
• c9, cost of construction of a maintenance and equipment storage building ($/ft2)
• c10, cost of a gatehouse/personnel support building and flare ($)
• c11, cost of a public drop-off station ($)
• Mwl, expected mass flow (ton/day)
♦ Calculated Parameters:
• Am, floor area of equipment storage building (ft2)
• CSTR, cost function of site buildings and structures ($)
In evaluating an appropriate size of the equipment storage structure, an approximate number of pieces of heavy equipment per unit capacity of the site was estimated at about one piece of heavy equipment per 50 tons per day. A parking space of 25 ft by 40 ft was assumed, so the area of the building is determined as follows:
A Mm wl=⎛
⎝⎜⎜
⎞
⎠⎟⎟ ×
100050
ft
2
tonday
The cost function for site buildings and structures is derived as
( ) 1110m9STR ccAcC ++×= (10)
Note that the cost of minor items such as signs, sidewalks, and parking areas were not considered explicitly. However, the factors may be considered by adjusting the cost of c9, c10, and c11.
2.1.4 Platform Scales
This section documents the development of a cost function for platform weigh scales required for the operation of the landfill. The default value assumes there is no scale at an ash landfill.
The cost of the scales is a function of the number and unit costs, which will vary depending upon the sophistication of the device. The required parameters follow.
♦ User Input Parameters:
• c12, installed cost of industrial truck scale, capacity 50 tons ($)
• Ns, the number of scales required

2. Cost of Waste Disposal in Traditional, Bioreactor, and Ash Landfills
12
♦ Calculated Parameters:
• CS, cost of site scales ($)
The cost function for site scales is
12sS cNC ×= (11)
2.1.5 Site Utilities Installation
This section documents the development of a cost function for installation of site utilities (including electric service, potable water, sewer, and gas) required for operation of support buildings and equipment.
The wiring and plumbing of individual structures are covered in the cost function for buildings and structures. This cost function addresses the required interconnection of the site structures to the utility (i.e., connection to the electric grid, public sewer and water mains, gas lines, etc.). Due to the possibility of a remote location of a landfill site, access to public water and sewer lines may be unavailable, so the cost function allows for the installation of a well and septic system as an alternative. The required parameters follow.
♦ User Input Parameters:
• c13, unit cost of electrical connection to utility grid ($)
• c14, unit cost of sanitary sewer connections and piping ($/linear ft)
• c15, unit cost of septic system ($)
• c16, unit cost of potable water connection ($)
• c17, unit cost of potable water well installation and connection ($)
• c18, unit cost of gas connection ($)
• Ls, total site length (ft)
• z1, logical input, = +1 if septic system is used instead of public sewer, 0 otherwise
• z2, logical input, = +1 if on-site well water is used instead of public water, 0 otherwise
• z3, logical input, = +1 if gas is used on site, 0 otherwise
♦ Calculated Parameters:
• CU, cost of site utilities installation ($)
In making the calculation for site utilities, the user will specify a selected option for water supply and wastewater disposal, as well as determine if gas will be used on site. A logical parameter is used in the following cost function equation to determine if certain costs are applicable based on the user input.
( )( ) ( ) ( )( ) ( ) ( )3182172161151s1413U zczcz1czcz1LccC ×+×+−×+×+−××+= (12)
2.1.6 Site Access Roads
This section documents the development of a cost function for the construction of on-site permanent roadways and

2. Cost of Waste Disposal in Traditional, Bioreactor, and Ash Landfills
13
the upgrade of access roads required for heavy-truck access to the landfill site.
Permanent roads are required for the entrance to the facility, a site service road is required to access gas and leachate control equipment, and an all-weather access road is required around the disposal volume. It is assumed that a permanent road is built around the perimeter of the landfill. Grading of less permanent roads to permit access to the operating face is accounted for in annual operating costs. Upgrade of public roads may be required depending upon the site location. Costs of road construction include grading and bed preparation and asphalt installation and surfacing. Figure 4 is a diagram showing the layout of site roads. The required parameters follow.
♦ User Input Parameters:
• c22, unit cost of road construction suitable for heavy-vehicle traffic ($/linear ft)
• c23, unit cost of road construction for upgrade of existing roads ($/linear ft)
• Lor, distance of required off-site roads to be upgraded (mi)
• Lsr, distance of required roads for site entrance and for access to on-site facilities (ft)
♦ Calculated Parameters:
• CR, cost function of site access roads ($)
• Ldv, length of disposal volume (ft)
• Wdv, width of disposal volume (ft)
This cost function is simply the length of a road multiplied by the cost of construction:
( )( )( )( ) ( )( )mift 5280
or23bdvdvsr22R LcL2WL2LcC ××+++×+×= (13)
The calculations for parameters Wdv and Ldv are provided in equations 4 and 5, respectively (section 2.1.1).
Figure 4. Site Roads Layout for MSW Landfill
DISPOSAL VOLUME
Lsr
FACILITIES ACCESS ROAD
ALL WEATHER ACCESS ROAD
SITE ENTRANCE ROAD
LdvWdv
Lb

2. Cost of Waste Disposal in Traditional, Bioreactor, and Ash Landfills
14
2.1.7 Monitoring Wells
This section documents the development of a cost function for installation of wells to monitor groundwater.
Regulations (40 CFR 258.51) require groundwater monitoring by a sufficient number of wells to achieve the capability for monitoring background water quality and the "relevant point of compliance" water quality. This determination is site specific. The distance between wells around the site perimeter is the parameter used to calculate the number of installed wells. The required parameters follow.
♦ User Input Parameters:
• c24, unit cost of well drilling and installation ($/linear ft of well depth)
• Lw, distance between monitoring wells around perimeter of disposal volume (ft)
• Lwd, depth of typical well (ft) (For well clusters, increase the depth proportionately.)
♦ Calculated Parameters:
• CMW, cost of monitoring wells ($)
• Ldv, length of disposal volume (ft)
• NMW, number of monitoring wells
• Wdv, width of disposal volume (ft)
The cost of wells for groundwater monitoring is a function of the calculated number of wells and the unit cost. The number of wells is determined by the perimeter of the disposal volume and the distance between wells and by using the CEILING function that returns the next highest integer (format CEILING(N,1)):
( )
⎟⎟⎠
⎞⎜⎜⎝
⎛ +×= 1,
LWL2
CEILINGNw
dvdvMW (14)
The calculations for parameters Wdv and Ldv are provided in equations 4 and 5, respectively (section 2.1.1).
The cost function is then derived:
wdMW24MW LNcC ××= (15)
2.1.8 Initial Landscaping (Buffer Zone)
This section documents the development of a cost function for landscaping the buffer zone.
Landscaping a portion of the buffer zone and areas around the site entrance and administration building are modeled to occur prior to initial operations (this may be conservative if some part of the buffer zone is landscaped during the final closure). Only the fraction of the buffer zone required to be cleared is assumed to require landscaping. Low-level landscaping, expected to consist only of preparing and seeding bare soil with grass, is applied to the buffer zone, while more extensive landscaping may be applied to the buildings and site entrance. These costs are input as fixed costs, while the buffer zone landscaping is input as a per acre cost. The required parameters follow.

2. Cost of Waste Disposal in Traditional, Bioreactor, and Ash Landfills
15
♦ User Input Parameters:
• c25, unit cost of low-level landscaping ($/acre)
• c26, cost of high-level landscaping around buildings and site entrance ($)
• f3, fraction of buffer zone to be cleared and landscaped prior to operating landfill
♦ Calculated Parameters:
• As, area of land required for landfill and buffer zone (acres)
• CIL, cost function of initial landscaping ($)
• Ldv, length of disposal volume (ft)
• Wdv, width of disposal volume (ft)
The cost function can be derived as
( )( )( )( )2ft 43563acre
dvdvs32526IL WLAfccC ××−××+= (16)
The calculations for parameters Wdv, Ldv, and As are provided in equations 4, 5, and 6, respectively (section 2.1.1).
2.1.9 Leachate Pump and Storage
This section documents the development of a cost function for installing leachate pumps and the associated storage system for the entire landfill.
Federal regulations (40 CFR 258.40) require that MSW landfills be designed to maintain contaminant levels in the uppermost aquifer within specified limits. In approved states on a site-specific basis, a state director may approve landfill designs that have neither liners nor leachate collection systems or may approve leachate collection systems that are not designed as stringently as specified in the federal regulations. Otherwise, the federal regulations specify a minimum liner and leachate collection system design.
The requirements for the leachate collection system in the regulations specify that the system must be able to maintain a maximum depth of less than 30 cm of leachate over the liner. This is assumed to be accomplished by providing slotted polyvinyl chloride (PVC) piping runs in a sand layer above the liner. The liner is also sloped to maximize leachate flow to the collection piping. Once collected in the piping, the leachate is assumed to be directed to a holding tank or pond for eventual transport off site to a treatment facility. Other options are available for on-site treatment, ranging from leachate spraying, evaporation in a lagoon, leachate recycling, or dedicated wastewater treatment facilities. All systems have in common the basic collection system and a pump to remove the leachate and to transfer it to either a storage tank or lagoon. At most sites, on-site wastewater processing is considered to be too expensive and is not considered a viable treatment option. If leachate recycle is used, facilities for storage of excess leachate would still be required. A storage tank is typically used, and since the difference in cost between a storage tank and a lagoon is not significant, a storage tank is assumed. Because it is assumed that the leachate collection piping is installed in stages with the liner, this section documents only the pump and storage portion of the system.
The required parameters follow.
♦ User Input Parameters:

2. Cost of Waste Disposal in Traditional, Bioreactor, and Ash Landfills
16
• c34, cost to procure and install leachate pump and associated piping and electrical ($)
• c35, cost of leachate storage tank ($)
♦ Calculated Parameters:
• CLC, cost function of leachate pumping and storage system ($)
The cost function is simply
C c cLC = +34 35 (17)
2.1.10 Site Suitability Study, Planning, and Licensing
This section documents the development of a cost function for all preoperational suitability studies, planning and licensing activities, and any other initial costs for the facility. As described below, this cost represents funds expended prior to detailed engineering design of the facility and a particular site. Costs for similar studies applicable only to individual cells are handled in a separate function because of differences in amortization periods.
Typically, several sites are investigated and preliminary engineering studies are conducted. Public hearings may be conducted, and administrative costs are incurred in the site characterization and selection process. Once a site is selected, more detailed studies may be required to determine the suitability of a particular site for a MSW landfill. Once the decision is made to locate the facility at a particular site, detailed engineering is completed (this is covered in the engineering costs function), and administrative and technical resources are expended for reviews and licensing. Licensing fees may also be applicable.
Many of the costs associated with selection of a site are driven less by the landfill design features and more by the specific state and local requirements and the local political environment. However, these costs may represent a significant portion of the total development costs of a facility, and therefore it is appropriate to provide a means of accounting for them. A lump-sum parameter is used to include costs for identifying acceptable sites, suitability studies, public forums and hearings, licensing costs, and any other costs incurred before site selection. The required parameters follow.
♦ User Input Parameter:
• c41, total cost of site preoperational studies and activities ($)
♦ Calculated Parameter:
• CPL, cost function of preoperational studies and activities ($)
The cost function is straightforward:
C cPL = 41 (18)

2. Cost of Waste Disposal in Traditional, Bioreactor, and Ash Landfills
17
2.1.11 Total Initial Construction Cost Function
The total initial construction cost is the sum of each of the individual site development costs as presented in the previous sections. All costs are considered to require an engineering design, so a multiplier is applied to the initial construction cost to account for engineering costs. The total cost is amortized over the operating period of the facility and normalized to the annual volume of waste received. Appendix B (Discount Factors) provides a summary of the capital recovery factors used in the analysis. The required parameters follow.
♦ User Input Parameters:
• f5, engineering design multiplier for capital investment
• i, effective annual interest rate
• Ny, expected useful life of landfill (years)
♦ Calculated Parameters:
• CIC, cost function for initial construction ($/yd3)
• fcr1, capital recovery factor for initial construction
• Vw, required landfill capacity for waste (yd3)
The capital recovery factor is the amortization factor over the facility life:
( )( ) 1i1
i1ify
y
N
N
1cr−+
+×= (19)
The cost of initial construction per unit volume of waste buried is developed as
( ) ( )
yW
PLLCILMWRUSSTRF1cr5IC
NV
C+C+C+C+C+C+C+C+C×f×f+1=C (20)
The calculation for parameter Vw is provided in equation 2 (section 2.1.1).
2.2 Cell Construction Costs
Section 2.2 documents costs applicable to the development and preparation of each individual cell of the landfill.
2.2.1 Site Clearing and Excavation
This section documents the development of a cost function for site clearing and excavation. It is assumed that 100% of the landfill site is cleared and excavated prior to opening the landfill and that only a portion of the buffer zone requires clearing for access to the site. The required parameters follow.
♦ User Input Parameters:
• c2, unit cost of clearing land ($/acre)
• c3, unit cost of standard excavation ($/yd3)

2. Cost of Waste Disposal in Traditional, Bioreactor, and Ash Landfills
18
• c4, unit cost of difficult excavation (i.e., muck, rock, etc.) ($/yd3)
• c8, cost of on-site earth hauling ($/yd3-mi)
• c49, cost of off-site hauling of soil ($/yd3-mi)
• De, depth of excavation (ft)
• f1, fraction of below-grade volume required to be excavated
• f2, fraction of excavated volume considered difficult to excavate
• f3, fraction of buffer zone to be cleared and landscaped prior to operating landfill
• Lsd, distance to area for excess soil disposal (mi)
• Nr, number of distinct regions of the landfill developed over the life of the facility
• Rdb, slope of the grade of the disposal volume below site grade as rise over run
♦ Calculated Parameters:
• As, area of land required for landfill and buffer zone (acres)
• Cc, total cost of site clearing ($)
• CCE, cost function of site clearing and excavation ($)
• Ce, total cost of site excavation ($)
• Dlls, depth of the liner and leachate collection system (ft)
• Ldv, length of disposal volume (ft)
• Ve, excavated volume (yd3)
• Vsh, volume of soil to be hauled off site (yd3)
• Wdv, width of disposal volume (ft)
The site clearing cost is a function of the unit cost, the total landfill area, the cell-one area, and a fraction of the buffer zone:
⎥⎥⎥⎥⎥
⎦
⎤
⎢⎢⎢⎢⎢
⎣
⎡
⎟⎟
⎠
⎞
⎜⎜
⎝
⎛⎟⎟⎠
⎞⎜⎜⎝
⎛×⎟⎟⎠
⎞⎜⎜⎝
⎛⎟⎟⎠
⎞⎜⎜⎝
⎛××−+
⎟⎟⎠
⎞⎜⎜⎝
⎛⎟⎟⎠
⎞⎜⎜⎝
⎛××
×= 32dvdvsr
2dvdv
2c fft43563
acreWLA N
ft43563acreWL
cC
The calculations for parameters Wdv, Ldv, and As are provided in equations 4, 5, and 6, respectively (section 2.1.1).
2. Cost of Waste Disposal in Traditional, Bioreactor, and Ash Landfills
19
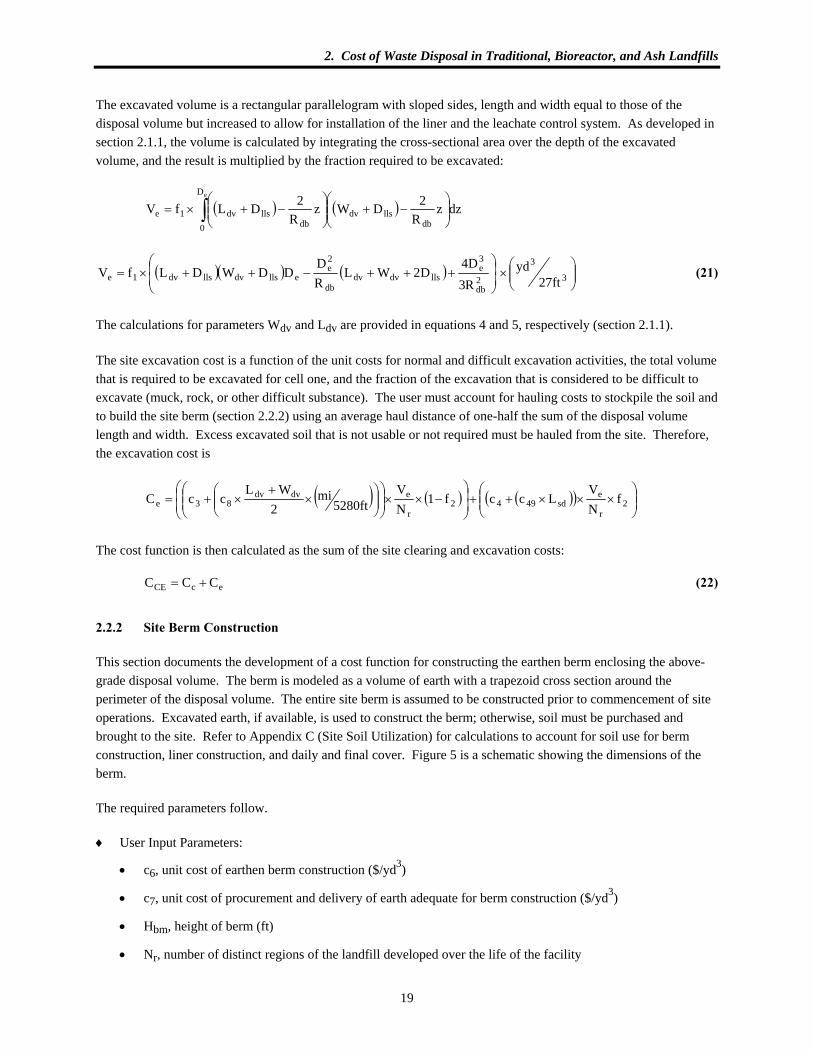
The excavated volume is a rectangular parallelogram with sloped sides, length and width equal to those of the disposal volume but increased to allow for installation of the liner and the leachate control system. As developed in section 2.1.1, the volume is calculated by integrating the cross-sectional area over the depth of the excavated volume, and the result is multiplied by the fraction required to be excavated:
( ) ( ) dzzR
2DWzR
2DLfVdb
llsdv
D
0 dbllsdv1e
e
⎟⎟⎠
⎞⎜⎜⎝
⎛−+⎟⎟
⎠
⎞⎜⎜⎝
⎛−+×= ∫
( )( ) ( ) ⎟⎟⎠
⎞⎜⎜⎝
⎛×⎟
⎟⎠
⎞⎜⎜⎝
⎛+++−++×= 3
3
2db
3e
llsdvdvdb
2e
ellsdvllsdv1e ft27yd
R3D4
D2WLRD
DDWDLfV (21)
The calculations for parameters Wdv and Ldv are provided in equations 4 and 5, respectively (section 2.1.1).
The site excavation cost is a function of the unit costs for normal and difficult excavation activities, the total volume that is required to be excavated for cell one, and the fraction of the excavation that is considered to be difficult to excavate (muck, rock, or other difficult substance). The user must account for hauling costs to stockpile the soil and to build the site berm (section 2.2.2) using an average haul distance of one-half the sum of the disposal volume length and width. Excess excavated soil that is not usable or not required must be hauled from the site. Therefore, the excavation cost is
( ) ( ) ( )( ) ⎟⎟⎠
⎞⎜⎜⎝
⎛×××++⎟
⎟⎠
⎞⎜⎜⎝
⎛−××⎟⎟
⎠
⎞⎜⎜⎝
⎛⎟⎟⎠
⎞⎜⎜⎝
⎛×
+×+= 2
r
esd4942
r
edvdv83e f
NV
Lccf1NV
ft5280mi
2WL
ccC
The cost function is then calculated as the sum of the site clearing and excavation costs:
C C CCE c e= + (22)
2.2.2 Site Berm Construction
This section documents the development of a cost function for constructing the earthen berm enclosing the above-grade disposal volume. The berm is modeled as a volume of earth with a trapezoid cross section around the perimeter of the disposal volume. The entire site berm is assumed to be constructed prior to commencement of site operations. Excavated earth, if available, is used to construct the berm; otherwise, soil must be purchased and brought to the site. Refer to Appendix C (Site Soil Utilization) for calculations to account for soil use for berm construction, liner construction, and daily and final cover. Figure 5 is a schematic showing the dimensions of the berm.
The required parameters follow.
♦ User Input Parameters:
• c6, unit cost of earthen berm construction ($/yd3)
• c7, unit cost of procurement and delivery of earth adequate for berm construction ($/yd3)
• Hbm, height of berm (ft)
• Nr, number of distinct regions of the landfill developed over the life of the facility

2. Cost of Waste Disposal in Traditional, Bioreactor, and Ash Landfills
20
• Rb, slope of the grade of the berm as rise over run
• Wbu, width of the top of the berm (ft)
♦ Calculated Parameters:
• Ab, area of berm cross section (ft2)
• CB, cost function of earthen berm ($)
• Ldv, length of disposal volume (ft)
• Pdv, disposal volume perimeter (ft)
• Vbm, volume of the berm (yd3)
• Vsbp, volume of soil required to be purchased for berm construction (yd3)
• Wbl, width of the bottom of the berm (ft)
• Wdv, width of disposal volume (ft)
Figure 5. MSW Landfill Geometry for Earthen Berm Calculation

2. Cost of Waste Disposal in Traditional, Bioreactor, and Ash Landfills
21
The earthen berm construction cost has two components: the labor that is a function of the unit cost and the volume of the berm and the soil cost if excavated soil is not adequate and purchased soil is required. The soil utilization is developed in Appendix C.
The soil requirements for the berm construction are approximately equal to the product of the disposal volume perimeter and the trapezoidal cross section area of the berm:
A H W W
W W HR
b bmbu bl
bl bubm
b
= ×+
= +×
22
A H W W HR
H W HR
H W HR
b bm bu bubm
b
bm bubm
b
bm bubm
b
= × + +×⎛
⎝⎜
⎞
⎠⎟
⎛
⎝⎜⎜
⎞
⎠⎟⎟
= × +×⎛
⎝⎜
⎞
⎠⎟
= × +⎛
⎝⎜
⎞
⎠⎟
12
12
2
2 2
( )dvdvdv WL2P +×=
( )3
3
ft 27yd
bdvbm APV ××=
( ) ( ) R
HWHWL2V 3
3
ft 27yd
b
bmbubmdvdvbm ×⎟⎟
⎠
⎞⎜⎜⎝
⎛+××+×= (23)
The calculations for parameters Wdv and Ldv are provided in equations 4 and 5, respectively (section 2.1.1).
Now, the cost function for berm construction can be developed as the sum of construction costs and soil volume purchased as calculated in Appendix C:
( ) ( )
Cc V c V
NBbm sbp
r=
× + ×6 7 (24)
2.2.3 Liner Systems
This section documents the development of a cost function for installation of a liner.
Federal regulations (40 CFR 258.40) require that MSW landfills be designed to maintain contaminant levels in the uppermost aquifer within specified limits. In approved states on a site-specific basis, a state director may approve landfill designs that have neither liners nor leachate control systems or may approve leachate collection systems that are not designed as stringently as specified in the federal regulations. Otherwise, the federal regulations specify a minimum liner and leachate control system design.
There are a number of liner designs that are adequate either to comply with or exceed the federal regulations. The minimum liner design meeting regulations consists of a 2-ft layer of compacted soil that has a permeability of

2. Cost of Waste Disposal in Traditional, Bioreactor, and Ash Landfills
22
1 × 10⁻⁷ cm/sec and a flexible membrane installed in direct and uniform contact with the compacted soil that has a minimum thickness of 30 mils or 60 mils if high-density polyethylene (HDPE) is used. For cost-estimating purposes, this will be referred to as the primary liner. The construction of the primary liner will consist of a user-specified thickness of compacted soil and a flexible membrane. The user will input the unit cost of the membrane and the desired thickness. A secondary liner may be specified, which would also consist of a compacted soil liner and a flexible membrane. If a secondary liner is specified, then a leachate detection system would typically be installed between the liners with a 1-ft layer of sand for drainage. Figure 6 shows the possible options for liner construction. The user may specify the liner design by altering the default values for the thickness and cost of each layer of the liner. While it is recognized that there are other alternatives for liners, including the use of geotextiles in combination with bentonite, they have not been included here.
The construction of the liner is assumed to take place in stages as the landfill is operated; this helps to reduce development costs by deferring expenditures.
The required parameters follow.
♦ User Input Parameters:
• c27, unit cost of procurement and installation of flexible membrane liner ($/ft2)
• c29, unit cost of procurement and delivery of soil suitable for liner construction ($/yd3)
• c30, unit cost of procurement and delivery of soil additive to decrease permeability ($/yd3)
• c31, unit cost of procurement, delivery, and installation of drainage material for leachate detection and cover (sand) ($/yd3)
• c32, unit cost of installation of compacted soil liner, including soil preparation ($/yd3)
• Dspl, depth of compacted soil in the primary liner (ft)
• Dssl, depth of compacted soil in the secondary liner (ft)
• f4, fraction of soil additive to mix with native or purchased soil to achieve required permeability
• Hbm, height of berm (ft)
• Nr, number of distinct regions of the landfill developed over the life of the facility
• Rb, slope of the grade of the berm as rise over run
• Rdb, slope of the grade of the disposal volume below site grade as rise over run
• z4, logical input, = +1 if a liner is used, 0 otherwise
• z6, logical input, = +1 if a double composite liner is used, 0 otherwise (single composite)
♦ Calculated Parameters:
• Al, area over which liner is installed (ft2/cell)
• CLS, cost function of liner system ($)
• Hb, height of waste below grade (ft)
• Ldv, length of disposal volume (ft)

2. Cost of Waste Disposal in Traditional, Bioreactor, and Ash Landfills
23
• Vsa, volume of soil additive required (yd3)
• Vl, volume of soil for liner construction (yd3/cell)
• Vslp, volume of soil required to be purchased for liner construction (yd3)
• Wdv, width of disposal volume (ft)
The sides of the landfill are sloped and the liner system would be continued to the top of the berm. Therefore, the area over which the liner will be installed is
( ) ( )
r
dvdv2b
b
bm2db
db
bdvdv
l N
WL1RR
H1R
RH
WL2
A
×+⎟⎟
⎠
⎞
⎜⎜
⎝
⎛
⎥⎥⎦
⎤
⎢⎢⎣
⎡⎟⎟⎠
⎞⎜⎜⎝
⎛+++×+×
= (25)
The calculations for parameters Hb, Wdv, and Ldv are provided in equations 1, 4, and 5, respectively (section 2.1.1).
The total soil requirements for the liner system are determined from the liner area, the liner design, and soil additive requirements. This parameter is then used in Appendix C to calculate purchased soil requirements for the liner system. A factor of 0.9 is used to account for soil compaction. The soil requirements for the liner are determined as follows:
( ) ( ) ( )( ) ( )3
3
ft 27ydssl64spl44l
l 9.0DzzDzf1A
V ×××+××−×
= (26)
Figure 6. MSW Landfill Liner Options

2. Cost of Waste Disposal in Traditional, Bioreactor, and Ash Landfills
24
The volume of the soil additive is similarly calculated as
( ) ( )( ) ( )3
3
ft 27yd
ssl64spl44
4lsa DzzDz
f1f
AV ×⎟⎟⎠
⎞⎜⎜⎝
⎛××+××⎟⎟
⎠
⎞⎜⎜⎝
⎛−
×= (27)
The cost of the liner is then the sum of costs for installation of the compacted soil, cost of purchased soil and soil additive (if required to achieve permeability limits, including blending costs), the cost of procurement and installation of flexible membranes, and the cost of procurement and installation of a leachate detection layer:
( )( ) ( ) ( )
( )( ) z1zft 27
ydAc
NVc
VcVVcC
643
3
127
r
slp29sa30sa132LS
⎟⎟⎠
⎞⎜⎜⎝
⎛+××××
+×
++++×=
(28)
2.2.4 Leachate Collection Materials for Traditional and Ash Landfills
This section documents the development of a cost function for installation of leachate collection piping for traditional and ash landfills. Traditional, bioreactor, and ash landfills have the common collection configuration shown in Figure 7. However, since bioreactor landfills have the added cost of leachate recirculation materials, the cost function for bioreactor landfills is developed separately in section 2.2.5.
The required parameters follow.
♦ User Input Parameters:
• c33, unit cost of purchase, delivery, and installation of leachate collection layer (gravel) ($/yd3)
• c36, cost to procure and install PVC piping ($/ft)
• Dslc, depth of leachate collection system (ft)
• Hbm, height of berm (ft)
• L4, distance between leachate collection pipes (ft)
• Nr, number of distinct regions of the landfill developed over the life of the facility
• Rb, slope of the grade of the berm as rise over run
• z4, logical input, = +1 if a liner is used, 0 otherwise
♦ Calculated Parameters:
• CLCP, cost function of leachate collection piping ($)
• Hb, height of waste below grade (ft)
• Ldv, length of disposal volume (ft)
• Lplc, length of PVC piping installed for leachate collection (ft)
• Vsglc, volume of sand or gravel in leachate collection trenches (yd3)

2. Cost of Waste Disposal in Traditional, Bioreactor, and Ash Landfills
25
• Wdv, width of disposal volume (ft)
The linear ft of PVC piping must be calculated as a function of the disposal volume geometry and the distance between collection pipes, using the CEILING function which returns the next highest integer (format
( )1,NCEILING ):
dv4
dvdvplc L1,
LL
CEILINGWL +⎟⎟⎠
⎞⎜⎜⎝
⎛×= (29)
The volume of required sand or gravel is taken as the depth of the layer over the surface area of the permitted capacity below the top of the berm:
⎟⎠⎞
⎜⎝⎛×⎟⎟
⎠
⎞⎜⎜⎝
⎛+++×⎟⎟
⎠
⎞⎜⎜⎝
⎛+++×= 3ft27
3yd1RR
HHW1R
RH
HLDV 2b
b
bmbdv
2b
b
bmbdvslcsglc (30)
The calculations for parameters Wdv and Ldv are provided in equations 4 and 5, respectively (section 2.1.1).
The cost function assumes that the leachate collection piping is constructed in stages with the liner, so only a fraction of the total system is constructed prior to initial operations. The cost function for traditional and ash landfills is developed as
( ) ( )
Nc×V+L×c
×z=Cr
33sglcplc364LCP (31)

2. Cost of Waste Disposal in Traditional, Bioreactor, and Ash Landfills
26
Figure 7. Leachate Collection System for MSW Landfill

2. Cost of Waste Disposal in Traditional, Bioreactor, and Ash Landfills
27
No allowance is made for the cost of collection piping in a leachate detection layer. This could be addressed by proportionately increasing an input parameter such as the distance between collection pipes.
2.2.5 Leachate Collection and Recirculation Materials for Bioreactor Landfills
This section documents the development of a cost function for installation of the leachate collection and recirculation systems in bioreactor landfills. Leachate recirculation piping is a combination of horizontal trenches and vertical injection wells. Horizontal trenches are placed in each layer of refuse. The number of horizontal trenches is calculated with a user-enterable distance of influence (lgth4). The number of vertical injection wells is a function of the user-defined area of influence (Ainfl).
The required parameters for this cost function follow. These parameters do not specifically include the cost of some items associated with leachate pumping such as valves, pumps, and pressure gauges. To address this, the user could artificially increase the length of vertical injection wells (lgth8).
♦ User Input Parameters:
• c33, unit cost of purchase, delivery, and installation of leachate collection layer (gravel) ($/yd3)
• c36, cost to procure and install PVC piping ($/ft)
• c54, unit cost of concrete ($/yd3)
• Dsl, depth of protective soil over the liner and leachate collection system (ft)
• Dslc, depth of leachate collection system (ft)
• L4, distance between leachate collection pipes (ft)
• Lgth3, average length of horizontal trench for leachate recirculation (ft)
• lgth8, length of PVC pipe in each vertical injection well (ft)
• Nr, number of distinct regions of the landfill developed over the life of the facility
• z4, logical input, = +1 if a liner is used, 0 otherwise
♦ Calculated Parameters:
• CLCP, cost function of leachate collection piping ($)
• Ha, height of waste above grade (ft)
• Hb, height of waste below grade (ft)
• Ldv, length of disposal volume (ft)
• Lplc, length of PVC piping installed for leachate collection (ft)
• Nht, number of horizontal trenches
• Nvl, number of vertical lifts
• Nwell, number of vertical injection wells
• Vc, volume of concrete in vertical injection wells (yd3)

2. Cost of Waste Disposal in Traditional, Bioreactor, and Ash Landfills
28
• Vcrt3, volume of concrete per vertical injection well (ft3/well)
• Vsglc, volume of sand or gravel in leachate collection trenches (yd3)
• Wdv, width of disposal volume (ft)
The vertical injection wells are assumed to be constructed from perforated concrete and PVC and are filled with gravel. The horizontal trenches contain a perforated PVC pipe and are filled with sand. The sand and gravel costs are not calculated because they were found to be less than one tenth of one percent of the landfill capital cost. It should also be noted that shredded tires are an alternative high-permeable material, which has been used at some bioreactor landfills. The linear ft of PVC piping in the collection system is a function of the disposal volume geometry and the distance between collection pipes. The linear ft is calculated using the CEILING function that returns the next highest integer (format CEILING(N,1)). The linear ft of PVC piping in the leachate recirculation system is a function of the average length of a horizontal trench, the number of horizontal trenches per layer, the number of layers, and the length of vertical injection wells (refer to section 7). The following function combines the cost of PVC in the collection system and the recirculation system.
( ) ( )( )8thlgNNNLgthL1,LL
CEILINGWL wellhtvl3dv4
dvdvplc ×+××+
⎟⎟⎠
⎞⎜⎜⎝
⎛⎟⎟⎠
⎞⎜⎜⎝
⎛+⎟⎟⎠
⎞⎜⎜⎝
⎛×= (32)
The volume of required sand or gravel for the collection system is taken as the depth of the layer over the surface area of the permitted capacity below the top of the berm.
( ) ( ) ⎟⎟⎠
⎞⎜⎜⎝
⎛×++×++×= 3ft27
3ydabdvabdvslcsglc HHWHHLDV (33)
The calculations for parameters Wdv and Ldv are provided in equations 4 and 5, respectively (section 2.1.1).
The volume of concrete required for each vertical injection well is calculated as
⎟⎟⎠
⎞⎜⎜⎝
⎛××= 3
3
well3crtc ft27ydNVV (34)
The cost function assumes that the leachate collection piping is constructed in stages with the liner, so only a fraction of the total system is constructed prior to initial operations. The cost function for leachate collection and recirculation in the bioreactor landfill is
( ) ( ) ( )
Nc×V+c×V+L×c
×z=Cr
54c33sglcplc364LCP (35)
2.2.6 Cell Preoperational Costs
This section documents the development of a cost function for all preoperational costs for an individual cell. This one time, fixed cost represents funds expended for detailed engineering design of the facility, hydrogeology studies, and any other cell-one studies or analyses. The required parameters follow.

2. Cost of Waste Disposal in Traditional, Bioreactor, and Ash Landfills
29
♦ User Input Parameter:
• c50, total cost of cell-one preoperational studies and activities ($)
♦ Calculated Parameter:
• CCO, cost function of cell-one preoperational studies and activities ($)
The cost function is straightforward:
C cCO = 50 (36)
2.2.7 Total Cell Construction Cost Function
The total cell construction cost is the sum of all individual costs for clearing and excavation (CCE), berm construction (CCB), liner installation (CLS), leachate collection piping (CLCP), and preoperational activities (CCO), amortized over the operating period of the cell and normalized to the annual volume of waste received. A perimeter road is included as described in section 2.1.6. Although a stormwater pond was not explicitly included, the cost is likely negligible given the extent of soil excavation activity associated with site excavation. Appendix B provides a summary of the capital recovery factors used in the analysis. The required parameters follow.
♦ User Input Parameters:
• f5, engineering design multiplier for capital investment
• i, effective annual interest rate
• Nr, the number of distinct regions of the landfill developed over the life of the facility
• Ny, expected useful life of landfill (years)
♦ Calculated Parameters:
• CCC, cost function for cell one construction ($-year/cell-yd3)
• fcr2, capital recovery factor for staged construction
• Vw, required landfill capacity for waste (yd3)
The capital recovery factor is the amortization factor for the life of that portion of the facility initially lined:
( )( ) 1i1
i1ifrN
yN
rNyN
2cr−+
+×= (37)
The cost of initial construction per unit volume of waste buried is developed as
( ) ( )
yW
COLCPLSBCE2cr5CC
NV
CCCCCff1C
++++××+= (38)
The calculation for parameter Vw is provided in equation 2 (section 2.1.1).

2. Cost of Waste Disposal in Traditional, Bioreactor, and Ash Landfills
30
2.3 Operating Costs
2.3.1 Daily Operations
This section documents the development of a cost function for daily landfill operations.
The individual components of the cost of daily operations include the following: equipment procurement and maintenance, personnel, utilities, and leachate treatment. Equipment costs are input as a cost per unit volume of waste handled. Personnel costs are calculated based on the expected rate of waste disposal. The annual labor cost is based on the assumption that eight personnel (scale attendant, two equipment operators, traffic controller, recycle coordinator, manger, and mechanic) are needed to process the expected 1,350 ton/day MSW. These personnel are also expected to handle gas management, the options for which are described in section 6.4. As some gas management programs may be relatively more intense, the user can adjust input parameters C43 and C44 if appropriate. Bioreactor landfills are expected to have an additional employee whose duty it is to oversee leachate recirculation. Recirculation activities can include operating a water truck to reapply leachate or supervising the pumping of leachate from a lagoon to the recirculation system. Utilities are calculated as a fraction of the personnel costs. Leachate treatment is determined as a function of the area of the site at the operating face and the expected leachate production rate.
The required parameters follow.
♦ User Input Parameters:
• c43, minimum annual labor costs ($/year)
• c44, incremental labor costs for each increase in landfill tonnage above Mwm ($
yr
tonday
)
• c45, cost of equipment procurement and maintenance per mass of waste handled ($
yr
tonday
)
• c47, leachate treatment and disposal cost including transport to publicly owned treatment works (POTW) ($/gal)
• dlcht, density of leachate (lb/gal)
• f7, labor fringe rate
• f9, utilities costs fraction (of personnel costs)
• Mwl, expected mass flow (ton/day)
• Mwm, maximum daily tonnage handled by labor costs of c43 (ton/day)
• Rlgo, rate of leachate generated (active cell)(gal/acre-day)
♦ Calculated Parameters:
• CDO, cost function of daily operations ($/year)
• Ceq, annual cost of equipment ($/year)
• Cl, annual cost of labor ($/year)

2. Cost of Waste Disposal in Traditional, Bioreactor, and Ash Landfills
31
• Clt, annual cost of leachate treatment ($/year)
• Cu, annual cost of utilities ($/year)
• LCHTPOTW, total leachate sent to POTW (lb/ton waste)
• Ldv, length of disposal volume (ft)
• Wdv, width of disposal volume (ft)
The annual labor costs can be determined from the expected daily tonnage. A step function is applied: a minimum cost is applied up to a daily tonnage specified; then for each daily tonnage increment, an increment in labor costs is assumed. The final cost is adjusted for overhead costs. Overhead costs for labor are calculated as a fraction of labor wages. Overhead costs include overtime, office supplies, insurance, social security, vacation, sick leave, and other services. The user can define overhead to include a different set of values and can modify the overhead rate accordingly.
( ) ( )( ) ( )( )( )37wmwl44437wmwll cf1,MMccf1,MMIFC ×+−++>= (39)
The annual equipment costs are also determined based on the daily tonnage:
C c Meq wl= ×45 (40)
Leachate disposal costs depend upon the volume of leachate produced. The total leachate sent to the POTW (LCHTPOTW lb/ton waste) is calculated in section 7 of the LCI model. To calculate the cost of leachate disposal, this number is converted to gal per ton waste and multiplied by the unit cost of leachate treatment and disposal:
⎟⎠⎞⎜
⎝⎛×⎟
⎠⎞⎜
⎝⎛×××= year
days 365 D1 M LCHT cC
lchtwlPOTW47lt (41)
The annual utility costs are a fraction of labor costs:
C f Cu l= ×9 (42)
Total operating costs are the sum of the individual costs, which gives the cost function for daily operations:
ulteqlDO CCCCC +++= (43)
2.3.2 Daily Cover Material
This section documents the development of a cost function for cover material.
The cost function developed here includes the cost to purchase and deliver soil, HDPE, or revenue-generating cover to the working face. An example of revenue-generating cover is contaminated soil. Soil excavated on site that is suitable for cover would be used in its entirety prior to the purchase of off-site soil. The volume of cover soil required to be purchased is derived in Appendix C. To maintain the simplicity of this model, it is assumed that the required purchased cover soil is spread over the operating life of the facility. Revenue-generating cover is treated as having a negative cost.

2. Cost of Waste Disposal in Traditional, Bioreactor, and Ash Landfills
32
There is a trend towards minimizing the use of any type of daily cover. This can be addressed in the input parameter Pcvr. This allows the user to specify the fraction of the total disposal volume occupied by daily cover. In addition, while HDPE is specified above, the user may actually specify whether this is a one-use or multi-use HDPE sheet by proper adjustment of the input parameters. The controlling input parameter AHDPE, the area of HDPE used per acre, can be used to adjust for single-use and multi-use tarps. For a thin single-use tarp, the value 43,560 ft2/acre should be multiplied by the user’s estimate of the number of daily lifts in the landfill to obtain AHDPE. For a multi-use tarp, the value 43,560 ft2/acre should be multiplied by the user’s estimate of the number of daily lifts and divided by the number of uses expected for each tarp. Based on this calculation, AHDPE will be higher for a daily-use tarp; whereas, c52 will be higher and AHDPE lower for a multi-use tarp. Of course, if a material other than HDPE is used, then its cost may be considered by using parameter C52.
Labor requirements to place daily cover are addressed in the cost function for daily operations. The labor to place a protective soil cover over the liner is considered part of the daily operations cost function.
The required parameters follow.
♦ User Input Parameters:
• AHDPE, area of HDPE per acre (ft2/acre)
• c42, unit cost of procurement and delivery of soil suitable for daily cover ($/yd3)
• c51, unit cost of procurement of on-site daily cover soil ($/yd3)
• c52, unit cost of procurement and installation of HDPE ($/ft2)
• c53, revenue-generating cover ($/yd3)
• Mwl, expected mass flow (ton/day)
• Ny, expected useful life of landfill (years)
• PHDPE1, percent of daily cover that is HDPE (%)
• Pcvr1, percent of total landfill volume occupied by cover (%)
• Prevgen, percent of daily cover that is revenue-generating cover (%)
♦ Calculated Parameters:
• ACM3, area of HDPE cover (ft2/acre)
• CCM, the total cost of daily cover ($/year)
• CCM1, cost of off-site soil for daily cover ($/year)
• CCM2, cost of on-site soil for daily cover ($/year)
• CCM3, cost of HDPE for daily cover ($/year)
• CCM4, revenue from revenue-generating cover ($/year)
• Ldv, length of disposal volume (ft)

2. Cost of Waste Disposal in Traditional, Bioreactor, and Ash Landfills
33
• Poffsite, percent of daily cover that is off-site soil (%)
• Ponsite, percent of daily cover soil volume that can be obtained on site as calculated in the soil budget (%)
• Vc1, volume of soil required for daily cover (yd3)
• VCM1, volume of off-site soil used for daily cover (yd3)
• VCM2, volume of on-site soil used for daily cover (yd3)
• VCM4, volume of revenue-generating cover (yd3)
• Wdv, width of disposal volume (ft)
The area of HDPE daily cover is a function of the surface area and the percent of daily cover that is HDPE.
The volume of off-site soil for daily cover is a function of the percent of daily cover that is off-site soil and the total volume of soil required.
A P A L WCM
HDPEHDPE dv dv3
1
1001
43560= × × × ×
(44)
1coffsite
1CM V100
P V ×= (45)
The volume of on-site soil for daily cover is a function of the percent of daily cover that is on-site soil and the total volume of soil required.
1c
onsite2CM V
100P
V ×= (46)
The volume of revenue-generating cover is a function of the total volume of waste generated, the percent of the waste stream that is daily cover, and the percent of daily cover comprised of revenue-generating cover.
100
PD
1100P
V V revgen
eff
cvr1a4CM ×××= (47)
The cost of off-site soil used for daily cover is calculated as
y
421CMCM1 N
c VC ×= (48)
The cost of on-site soil used for daily cover is calculated as
y
51CM2CM2 N
c VC ×= (49)
This default value for c51 is zero because the soil for on-site daily cover is obtained from excavation during landfill construction.
The cost of HDPE used for daily cover is calculated as

2. Cost of Waste Disposal in Traditional, Bioreactor, and Ash Landfills
34
y
523CMCM3 N
c VC ×= (50)
The revenue obtained from using revenue-generating cover is calculated as a negative cost:
y
534CMCM4 N
c VC ×= (51)
The total cost of the daily cover is the sum of the cost of HDPE, on-site soil, and off-site soil, minus the money obtained from revenue-generating cover. Note that CCM4 is a negative number.
CM4CM3CM2CM1CM C C C C C +++= (52)
2.3.3 Total Operating Cost Function
The total operating cost is the sum of daily operations and cover material cost. No amortization of annual costs is required for the annual, recurring costs. The required parameters follow.
♦ User Input Parameters:
• f6, engineering design multiplier for landfill operations
• Ny, expected useful life of landfill (years)
♦ Calculated Parameters:
• CO, cost function for operations ($/yd3)
• Vw, required landfill capacity for waste (yd3)
The cost of operations per unit volume of waste buried is developed as
( )6
yW
CMDOO f1
NV
CCC +×+
= (53)
The calculation for parameter Vw is provided in equation 2 (section 2.1.1).
2.4 Closure Costs
2.4.1 Gas Extraction
This section documents the development of a cost function for installation of a gas extraction system. It is recognized that gas extraction systems are installed incrementally during the operating period of a landfill. For purposes of this estimate, the extraction system is installed at closure. However, as explained in section 6 on landfill gas, significant gas recovery can occur prior to site closure based on user-specified inputs.
Federal regulations (40 CFR 258.23) require that MSW landfills be designed to maintain methane gas concentrations within prescribed limits to prevent potential explosions. No specific design requirements are

2. Cost of Waste Disposal in Traditional, Bioreactor, and Ash Landfills
35
established as is the case for the leachate collection system. Typically, new landfill designs provide for an active methane extraction system using extraction wells or trenches or both. The extracted methane is piped to a vent and either burned under controlled conditions (flared) or used as an energy source. Landfill gas treatment and energy recovery is discussed in the description of life cycle inventory parameters. The gas recovery system based on the default parameters is typical and is expected to represent a landfill in compliance with the New Source Performance Standards of the Clean Air Act.
Vertical gas extraction wells consisting of a perforated PVC or HDPE pipe installed in a gravel bed are assumed to be used. Figure 8 shows a schematic of the gas extraction system. The default values for HDPE in the gas collection system and for PVC in the gas collection and monitoring system are based on data obtained from an Environmental Industry Associations (EIA) survey [Environmental Research and Education Foundation, 1997]. The survey revealed that PVC and HDPE use varied greatly among the sites. The default value chosen for HDPE in a gas collection system is 1.6E-2 lb/ton MSW with values in the survey ranging from 1.3E-6 lb/ton to 3.9E-2 lb/ton. For comparison, one can make assumptions about the amount of piping and waste per landfill area. For example, one can assume that ten 8-in.-diameter, 76-ft-tall gas collection wells and 1,850 ft of 12-in. gas header pipe are needed for a 10-acre area. The surface area of an 8-in.- and 12-in.-diameter pipe is 11.12 in.2 and 25.05 in.2, respectively. The density of HDPE is 59.6 lb HDPE/ft3. If one uses the current default parameters, there are 1.37E6 tons waste per acre. The amount of HDPE per acre is calculated below. Note that the surface area of an 8-in.-diameter (4-in.-radius) well with a wall thickness of 0.47 in. is
( ) ( )2.in15.11
247.0424SA
=
⎥⎦⎤
⎢⎣⎡ −−π=
acreHDPElb1068.22
ftHDPElb6.59
in. 144ftin.25.05
acre10ft1850
in144ftin.15.11
wellft76
acre10wells10 3
32
22
2.
22 ×=×
⎥⎥⎦
⎤
⎢⎢⎣
⎡⎟⎟⎠
⎞⎜⎜⎝
⎛××+⎟
⎟⎠
⎞⎜⎜⎝
⎛×××
MSWton HDPE lb
103.3MSW tons10x85.6
acreacreHDPE lb
2268 24
−×=××
Figure 8. Gas Extraction System for MSW Landfill
Gas Vent
Perforated PVC in gravel bed
GAS VENT (TYPICAL)
vent to atmosphere

2. Cost of Waste Disposal in Traditional, Bioreactor, and Ash Landfills
36
This calculated value is based on a site that uses HDPE only, and as expected it is at the upper range of survey values.
The required parameters follow.
♦ User Input Parameters:
• c36, cost to procure and install PVC piping ($/ft)
• DHDPE, density of HDPE used for daily cover (lb/ft3)
• Dmsw, average density of waste after burial (lb/yd3)
• DPVC, density of PVC (lb/ft3)
• GCHDPE, amount of HDPE in gas collection system (lb/ton waste)
• GCPVC, amount of PVC in gas collection system (lb/ton waste)
• GMPVC, amount of PVC in gas monitoring system (lb/ton waste)
♦ Calculated Parameters:
• CGE, cost of gas collection system ($)
• LHDPE, total HDPE in gas collection system (ft)
• LPVC2, total PVC in gas collection system (ft)
• Vw, required landfill capacity for waste (yd3)
The length of HDPE pipe used to collect landfill gas is calculated as
( ) ⎟⎠⎞⎜
⎝⎛××××= 2ft 0014.0
1lb 2000
ton 1HDPE
mswwHDPEHDPE D1DVGC L (54)
The length of PVC pipe used to collect landfill gas is calculated as
( ) ( ) ⎟⎠⎞⎜
⎝⎛××××+= 2ft 0014.0
1lb 2000
ton 1PVC
mswwPVCPVC2PVC D1DVGM GC L (55)
The calculation for parameter Vw is provided in equation 2 in section 2.2.1. The cost of the gas collection system is
( ) 362PVCHDPEGE cLL C ×+= (56)
In using equation 56, the cost for installation of gas collection wells is not explicitly included. However, this cost, when expressed per ton of waste, is not significant as illustrated by the following calculation in which it is assumed that one gas collection well is used per acre of landfill footprint.
ton$014.0
acreMSWton
1037.1
gauges,valvesforallowance5.2oninstallatiforft$100well
ft76well1
6=
×
×××

2. Cost of Waste Disposal in Traditional, Bioreactor, and Ash Landfills
37
2.4.2 Final Cover
This section documents the development of a cost function for installation of the final cover for the entire landfill.
The final cover can include layers of soil, geotextile, sand, HDPE, and clay as specified by the user. A layer of topsoil can also be spread, fertilized, and planted. This cost function includes the final cover material costs plus landscaping and seeding. Setting the default value for layer thickness to zero can eliminate final cover layers. Figure 9 is a representation of the final cover profile.
Top Soil and Vegetation Support Cover (3 ft)
Geotextile (120 mils)
Sand Drainage Layer (1 ft)
HDPE Liner (40 mils)
Clay Liner (2 ft)
Sand Drainage Layer (1 ft)
Waste
Figure 9. Final Cover Cross Section (default values are given in parentheses)
The required parameters follow.
♦ User Input Parameters:
• c7, unit cost of procurement and delivery of soil adequate for berm construction ($/yd3)
• c25, unit cost of low-level landscaping ($/acre)
• c29, unit cost of procurement and delivery of soil suitable for liner construction ($/yd3)
• c30, unit cost of procurement and delivery of soil additive to decrease permeability ($/yd3)
• c31, unit cost of procurement, delivery, and installation of drainage material for leachate detection and cover (sand) ($/yd3)
• c32, unit cost of installation of compacted soil liner, including soil preparation ($/yd3)

2. Cost of Waste Disposal in Traditional, Bioreactor, and Ash Landfills
38
• c52, unit cost of procurement and installation of HDPE ($/ft2)
• c55, cost of procurement of geotextile ($/ft2)
• c57, cost of installing geotextile for final cover ($/ft2)
• Dspl, depth of compacted soil in the primary liner (ft)
• f4, fraction of soil additive to mix with native or purchased soil to achieve required permeability
• Ha, height of waste above grade (ft)
• Hbm, height of berm (ft)
• tgtx, thickness of geotextile (mils)
• tHDPE2, thickness of HDPE (mils)
• tsand1, thickness of the first sand layer in final cover (ft)
• tsand2, thickness of second sand layer in final cover (ft)
• tsoil, depth of top soil and vegetation support soil (ft)
• z4, logical input, = +1 if any liner is used, 0 otherwise
♦ Calculated Parameters:
• Atl, area of top of final cover (ft2)
• CCL, cost of clay for final cover ($)
• CFC, final cover cost ($)
• CGTX, cost of geotextile liner ($)
• CHDPE, cost of HDPE liner ($)
• CLD, cost of low-level landscaping ($)
• CMC, cost of mixing and compaction clay for final cover ($)
• CSA, cost of procurement and delivery of soil additive ($)
• CSL, cost of soil suitable for vegetative support soil and topsoil ($)
• CSND1, cost of first layer of sand ($)
• CSND2, cost of second layer of sand ($)
• Ldv, length of disposal volume (ft)
• scvr1, volume of soil for topsoil and vegetative support cover (yd3)
• Vsfcp, volume of soil purchased for final cover (yd3)
• Vsnd, volume of sand in the first layer (yd3)
• Vsnd2, volume of sand in the second layer (yd3)
• Vstlp, volume of soil required to be purchased for cover construction (yd3)

2. Cost of Waste Disposal in Traditional, Bioreactor, and Ash Landfills
39
• Vtsa, volume of soil additive to decrease permeability of liner and final cover (yd3)
• Wdv, width of disposal volume (ft)
The liner covers the area of the top of the permitted capacity:
( ) ( )
r
dvdv2b
b
bm2db
db
bdvdv
tl N
WL1RR
H1R
RH
WL2
A
×+⎟⎟
⎠
⎞
⎜⎜
⎝
⎛
⎥⎥⎦
⎤
⎢⎢⎣
⎡⎟⎟⎠
⎞⎜⎜⎝
⎛+++×+×
= (57)
The calculations for parameters Wdv and Ldv are presented in equations 4 and 5, respectively (section 2.1.1).
The soil requirements for the cover liner can be determined from the liner area and the liner depth, and accounting for the soil additive required. This parameter is then used in Appendix C to calculate the purchased soil requirements for the liner system. A factor of 0.9 is used to account for soil and clay compaction.
The volume of soil required for the topsoil and vegetative support layer is determined in equations 58–61.
The volume of the soil additive is calculated as
( )scvr t Asoil tl
yd1
3
27= × × ⎛⎝⎜
⎞⎠⎟ ft
3 (58)
( ) ( )3
3
ft 27yd
spl44
4tltsa Dz
f1f
AV ×××⎟⎟⎠
⎞⎜⎜⎝
⎛−
×= (59)
The volume of sand for the first drainage layer is a function of the area of the top liner and the thickness of the sand layer:
( )3
3
ft 27yd
sand1tlsnd t A V ××= (60)
The volume of sand for the second drainage layer is similarly calculated:
( )3
3
ft 27yd
sand2tl2snd t A V ××= (61)
The cost of each layer of final cover is the volume or area of the layer multiplied by the unit cost. The cost of procurement and delivery of soil suitable for vegetative support soil and topsoil is
7stlpSL cVC ×= (62)
The cost of procurement and delivery of a soil additive to decrease permeability is
30tsaSA cVC ×= (63)
The cost of procurement and delivery of clay suitable for final cover construction is
29sfcpCL cVC ×= (64)

2. Cost of Waste Disposal in Traditional, Bioreactor, and Ash Landfills
40
The cost of mixing and compacting clay for final cover is a function of the volume of soil for the topsoil and vegetative support cover and the volume of soil additive to decrease permeability:
32tsaMC cV1scvrC ××= (65)
The cost of procurement and delivery of the first layer of sand is a function of the sand volume and the unit cost:
311snd1SND cVC ×= (66)
The cost of procurement and delivery of the second layer of sand is similarly calculated:
312snd2SND cVC ×= (67)
If a HDPE liner is used in the final cover, the cost is a function of the area of the top of the liner and the unit cost of HDPE:
( ) 0 Ac ,0tIFC tl,522HDPEHDPE ×>= (68)
If a geotextile is used in the final cover, the cost is a function of the area of the top of the liner and the cost of procurement and installation of geotextile liner.
( )( ) 0 Acc ,0tIFC tl,5755gtxGTX ×+>= (69)
The cost of low-level landscaping is a function of the area of the liner and the unit cost of landscaping:
⎟⎠⎞⎜
⎝⎛××= 225tlLD ft 43560acrecAC (70)
The final cover cost function is the sum of costs of the soil, clay, sand, HDPE, and geotextile layers:
( ) CCCCCCCCCC LDGTXHDPE2SND1SNDMCCLSASLFC ++++++++= (71)
2.4.3 Cost of Replacing Final Cover
A certain percentage of the final cover is assumed to be replaced during the post-closure period. This section documents the material cost of replacing a percentage of the final cover.
The required parameters follow.
♦ User Input Parameter:
• Pcvr2, percent of final cover to be replaced over the entire post-closure period (%)
♦ Calculated Parameters:
• CFC, final cover cost ($)
• CRC, cost of replacing final cover ($/ton waste)
The cost function for replacing the final cover is

2. Cost of Waste Disposal in Traditional, Bioreactor, and Ash Landfills
41
100P
CC 2cvrFCRC ×= (72)
This cost is amortized over the operating period of the facility and normalized to the annual volume of waste received in section 2.4.5.
2.4.4 Perpetual Care
This section documents the development of a cost function for long-term monitoring and repairs. Long-term care involves routine environmental monitoring, maintenance of the leachate and gas collection systems, and contingency funding for repairs due to settling and erosion. Other costs are point estimated as annual costs.
The required parameters follow.
♦ User Input Parameters:
• c46, annual cost of well monitoring ($/well-year)
• c48, annual perpetual care cost ($/year)
• i, effective annual interest rate
• Npc, number of years of perpetual care (years)
♦ Calculated Parameters:
• CPC, cost function of perpetual care ($/year)
• fcr3, capital recovery factor for perpetual care costs
• Nmw, number of monitoring wells
The amortization function for perpetual care costs that converts annual repetitive costs to a present value is given below. The resulting cost can then be added to fixed closure costs and amortized over the operating life of the facility.
( )( ) pc
pc
N
N
3cri1i
1i1f+×
−+= (73)
The cost function for perpetual care can then be derived as the sum of well monitoring and other contingency costs:
( )( )46mw483crPC cNcfC ×+×= (74)
2.4.5 Total Closure Cost Function
The total closure cost is the sum of the individual costs. This total is amortized over the operating period of the facility and normalized to the annual volume of waste received. Appendix B provides a summary of the capital recovery factors used in the analysis. The required parameters follow.
♦ User Input Parameters:

2. Cost of Waste Disposal in Traditional, Bioreactor, and Ash Landfills
42
• f5, engineering design multiplier for capital investment
• i, effective annual interest rate
• Ny, expected useful life of landfill (years)
♦ Calculated Parameters:
• CC, cost function for initial construction ($/yd3)
• fcr4, capital recovery factor for closure costs
• Vw, required landfill capacity for waste (yd3)
The capital recovery factor is the amortization factor over the facility life:
( ) 1i1
ifyN4cr−+
= (75)
The cost of closure per unit volume of waste buried is developed as
( ) ( )( ) ( )( )
yW
RCPC6160FCGE54crC
NV
CCccCCf1fC
+++++×+×= (76)
The calculation for parameter Vw is provided in equation 2 (section 2.1.1).
2.5 Landfill Gas Revenue
To calculate the revenue derived from landfill gas, the volume produced and recovered must first be determined. The landfill gas model is discussed in detail in section 6, and only the critical concepts are presented here.
2.5.1 Quantity of Landfill Gas Produced
Cumulative gas production is a function of the first order decay rate constant, first order rise phase constant, lag time, year of gas treatment, and total landfill gas potential. The landfill gas potential (Lo) is discussed in section 6.
The following parameters determine the quantity of landfill gas produced.
♦ User Input Parameters:
• k, first order decay rate constant (year-1)
• lag, time between placement and start of gas generation (year)
• Lo, total landfill gas yield potential (ft3/ton waste)
• s, first order rise phase constant (year-1)
• t, year of gas treatment (year)

2. Cost of Waste Disposal in Traditional, Bioreactor, and Ash Landfills
43
♦ Calculated Parameters:
• gas_totalt, cumulative landfill gas production at time t (ft3/ton waste)
• gast, landfill gas produced during year t (ft3/ton waste)
The calculation for cumulative gas production is
( ) ( ) ( ) ( )( ) ( ) ( ) ( )( )( )
sLslagtsk1expklagtk1expsk1
total_gas ot
×+−×+×−×+−××−×+×−= (77)
Therefore, the yearly gas production is calculated as
( ) ( )1ttt total_gastotal_gasgas −−= (78)
2.5.2 Gas Treatment
This section documents the development of a cost function for landfill gas treatment. Three landfill gas collection periods are defined in the model. The user defines these periods and allows for different gas collection and treatment plans over time. The operational costs for this system are discussed in section 2.3.1.
In each of the landfill gas collection periods, the user has five options for landfill gas treatment: vent, flare, turbine, direct use, and internal combustion engine. The cost of a vent or flare is included in the cost of the landfill gas collection system. It is assumed that the proximity of an existing boiler is a requirement for selection of direct use as a gas treatment. Therefore, the capital cost of the boiler is not considered in the cost for landfill gas treatment. If the user selects either a turbine or an internal combustion engine to treat landfill gas, the capital cost of the equipment includes associated gas treatment costs. The following parameters are used to determine the gas treatment option.
♦ User Input Parameters:
• c58, capital cost of turbine ($)
• c59, capital cost of internal combustion engine ($)
• gas1ice, use of ICE during first landfill gas treatment period (%)
• gas2ice, use of ICE during second landfill gas treatment period (%)
• gas3ice, use of ICE during third landfill gas treatment period (%)
• gas1trbn, use of turbine during first landfill gas treatment period (%)
• gas2trbn, use of turbine during second landfill gas treatment period (%)
• gas3trbn, use of turbine during third landfill gas treatment period (%)
♦ Calculated Parameters:
• c60, cost if turbine is used in gas treatment ($)
• c61, cost if internal combustion engine is used in gas treatment ($)
• z12, logical input, = +1 if the turbine used for primary landfill gas treatment, 0 otherwise

2. Cost of Waste Disposal in Traditional, Bioreactor, and Ash Landfills
44
• z13, logical input, = +1 if the turbine used for secondary landfill gas treatment, 0 otherwise
• z14, logical input, = +1 if the turbine used for the third landfill gas treatment, 0 otherwise
• z15, logical input, = +1 if the internal combustion engine used for the primary landfill gas treatment, 0 otherwise
• z16, logical input, = +1 if the internal combustion engine used for the secondary landfill gas treatment, 0 otherwise
• z17, logical input, = +1 if the internal combustion engine used for the third landfill gas treatment, 0 other wise
If the user selects a turbine as the means of treatment in the first treatment period, then a value of 1 is returned. If the user does not select a turbine as the means of treatment, then a value of 0 is returned.
)0,1,01gas(IFz trbn12 >= (79)
If the user selects a turbine as the means of treatment in the second treatment period, then a value of 1 is returned. If the user does not select a turbine as the means of treatment, then a value of 0 is returned.
)0,1,02gas(IFz trbn13 >= (80)
If the user selects a turbine as the means of treatment in the third treatment period, then a value of 1 is returned. If the user does not select a turbine as the means of treatment, then a value of 0 is returned.
)0,1,03gas(IFz trbn14 >= (81)
If the user has selected a turbine as a treatment method, then the cost of treatment is the capital cost of the turbine; otherwise, the cost is zero.
( )0 ,c ,0zzzIFc 5814131260 >++= (82)
If the user selects an internal combustion engine as the means of treatment in the first treatment period, then a value of 1 is returned. If the user does not select a turbine as the means of treatment, then a value of 0 is returned.
)0,1,01gas(IFz ice15 >= (83)
If the user selects an internal combustion engine as the means of treatment in the second treatment period, then a value of 1 is returned. If the user does not select a turbine as the means of treatment, then a value of 0 is returned.
)0,1,02gas(IFz ice16 >= (84)
If the user selects an internal combustion engine as the means of treatment in the third treatment period, then a value of 1 is returned. If the user does not select a turbine as the means of treatment, then a value of 0 is returned.
)0,1,03gas(IFz ice17 >= (85)
If the user has selected an internal combustion engine as a treatment method, then the cost of treatment is the capital cost of the internal combustion engine; otherwise, the cost is zero.

2. Cost of Waste Disposal in Traditional, Bioreactor, and Ash Landfills
45
( )0 ,c ,0zzzIFc 5917161561 >++= (86)
2.5.3 Revenue Generated
The calculation is illustrated for the first gas treatment period and then repeated for periods 2 and 3. The required parameters follow.
♦ User Input Parameters:
• effdu2, efficiency of boiler (%)
• effice2, efficiency of internal combustion engine (%)
• efftrbn2, efficiency of turbine (%)
• gas1du, use of boiler in first landfill gas treatment period (%)
• gas1ice, use of ICE during first landfill gas treatment period (%)
• gas1trbn, use of turbine during first landfill gas treatment period (%)
• gasCH4, percent of methane in landfill gas (%)
• t0, time to implementation of first gas collection system (years)
• t3, time to discontinuation of third gas collection system (years)
• ng_comb ng_r_e, energy obtained from combusting natural gas (Btu/ft3)
• Ny, expected useful life of landfill (years)
• r1, revenue from electric buyback ($/kWh)
• r2, revenue from thermal energy ($/MBtu)
♦ Calculated Parameters:
• fcr5, converts future value to present value
• fcr6, annualizes present value
• gas(t),landfill gas produced during year t under the first landfill gas treatment (ft3/ton waste)
• rev_annual, total revenue from landfill gas annualized over the lifetime of the landfill ($/ton waste)
• rev_annual1, total revenue from landfill gas, for the first treatment period, annualized over the lifetime of the landfill ($/ton waste)
• rev_annual2, total revenue from landfill gas, for the second treatment period, annualized over the lifetime of the landfill ($/ton waste)
• rev_annual3, total revenue from landfill gas, for the third treatment period, annualized over the lifetime of the landfill ($/ton waste)
• rev(t), future value of revenue from landfill gas ($/ton waste)
• rev_pv(t), present value of revenue from landfill gas ($/ton waste)
• rev_total, sum of the yearly revenue from landfill gas production ($/ton waste)

2. Cost of Waste Disposal in Traditional, Bioreactor, and Ash Landfills
46
• r_total, total revenue from landfill gas production due to first, second, and third treatment periods ($/ton waste)
The yearly revenue generated is
( )
( )
( )
( ) ⎟⎟⎠
⎞⎜⎜⎝
⎛×××××××
+⎟⎟⎠
⎞⎜⎜⎝
⎛×××××××
+⎟⎟⎠
⎞⎜⎜⎝
⎛×××××××
=
1comb2iceice4CH
t
2comb2dudu4CH
t
1comb2trbntrbn4CH
t
t
rWh1000
kWh1kJ60.3
WhBtu
kJ055.1e_r_ngng100
eff100
1gas100
gasgas
rWh1000
kWh1kJ60.3
WhBtu
kJ055.1e_r_ngng100
eff100
1gas100
gasgas
rWh1000
kWh1kJ60.3
WhBtu
kJ055.1e_r_ngng100
eff100
1gas100
gasgas
rev
(87)
The yearly future revenues are then converted to the present value:
( )t5 i1
1fcr+
= (88)
( ) ( )t5t revfcrpv_rev ×= (89)
The total revenue is the sum of the yearly revenue:
∑=
=
=0
3
tt
ttt1prv_revtotal_rev (90)
where t0 is the start of the landfill gas treatment period and t3 is the end of the landfill gas treatment period.
This total is then annualized over the lifetime of the landfill by using the A/P factor:
( )( ) 1i1
i11f Ny
Ny
6cr−+
+×= (91)
total_revfannual_rev 6cr ×= (92)
Equations 87–92 are repeated for the second and third landfill gas treatment periods. The total landfill gas revenue is then the sum of the revenue from the first, second, and third landfill gas treatment periods.
3annual_rev2annual_rev1annual_revtotal_r ++= (93)
2.6 Total Landfill Cost Function
The total cost of burial of MSW per unit volume is simply the sum of the four developed costs: initial construction, cell construction, operations, and closure:
COCCIC CCCC1TOTALCOST +++= (94)

2. Cost of Waste Disposal in Traditional, Bioreactor, and Ash Landfills
47
This is the per unit volume cost. If this is multiplied by the average density of waste (Dmsw), then the total cost of burial per unit mass is
( )
msw
1TOTALCOSTtonlb 2000
DC
2TOTALCOST×
= (95)
Once the revenue generated from the landfill gas is accounted for, the total cost is
total_r2TOTALCOST3TOTALCOST −= (96)
2.7 Default Values
The default values shown here are adjusted to 1998 dollars in the DST. This is done by multiplying each default value by an index factor. The index factor is the current year cost index divided by the base year cost index. Three values are given for each parameter to represent traditional, bioreactor, and ash landfills respectively. References are in brackets.
2.7.1 AHDPE, area of HDPE per acre (43,560 ft2/acre, 43,560 ft2/acre, 0 ft2/acre)
A generic 1-acre cell is chosen as the reference unit. It is assumed that one tarp, with a surface area of 1 acre, is used as daily cover for the entire cell. This includes a number of re-uses because the waste is incrementally placed over the life of the cell. In actuality, the tarp may be used only once or several times. The surface area of HDPE daily cover used per acre can be varied to account for this as described in section 2.3.2. [Environmental Research and Education Foundation, 1997]
2.7.2 c1, unit cost of land ($1,500/acre, $1,500/acre, $1,500/acre)
The default value is chosen based on judgment.
2.7.3 c2, unit cost of clearing land ($2,425/acre, $2,425/acre, $2,425/acre)
A range of $1,200—$4,850 is given based on the size and number of trees. Medium size trees are assumed, and the stumps must be grubbed and removed, with no burning permitted. [R. S. Means Company, Inc., 1993; 0211040250]
2.7.4 c3, unit cost of standard excavation ($2.00/yd3, $2.00/yd3, $2.00/yd3)
This default value is based on experience with landfill construction. [Richardson, interview]
2.7.5 c4, unit cost of difficult excavation (i.e., muck, clay, etc.) ($3.00/yd3, $3.00/yd3, $3.00/yd3)
This default value is based on experience with landfill construction. [Richardson, interview]
2.7.6 c5, unit cost of industrial fencing, material, and installation ($11.95/linear ft, $11.95/linear ft, $11.95/linear ft)
This default value assumes 6-ft-high, 9-gauge galvanized steel fencing with a triple strand of barbed wire. [R. S. Means Company, Inc., 1993; 0283080200]

2. Cost of Waste Disposal in Traditional, Bioreactor, and Ash Landfills
48
2.7.7 c6, unit cost of earthen berm construction ($2.50/yd3, $2.50/yd3, $2.50/yd3)
This default value is based on experience with landfill construction. [Richardson, interview]
2.7.8 c7, unit cost of procurement and delivery of soil adequate for berm construction ($2.67/yd3, $2.67/yd3, $2.67/yd3)
Common borrow with a 10-mi haul distance is $7.50 per compacted cubic yd. A compaction factor of 1.11 is applicable to common earth, so this decreases the cost to $6.82. The 10-mi haul accounts for $5.60 of the cost, so the net material cost is $1.22/yd3. Using a 1-mi haul distance, at a cost of $2.89 for short hauls, reduced by 50% since large trucks would be used for the quantities of earth required, results in a final cost of $2.67/yd3. [Kerr's Cost Data for Landscape Construction, 1994; 0221025100]
2.7.9 c8, cost of on-site earth hauling ($1.83/yd3-mi, $1.83/yd3-mi, $1.83/yd3-mi)
This default value assumes on-site hauling from the excavation point to a single stockpile; although for a large site, multiple stockpiles would likely be provided and earth for berm construction would be moved into location directly. Costs of $1.11 to $1.37 are given for 1,000-ft to 3,000-ft hauls, which yields a cost function of $0.98 + $0.00013(#feet). This yields a value of $1.67 per mi or $1.83 per yd3 after adjustment to 1998 dollars. [Dodge Heavy Construction Cost Data, 1987]
2.7.10 c9, cost of construction of a maintenance and equipment storage building ($21.80/ft2, $21.80/ft2, $21.80/ft2)
This default value is taken for the cost of construction of a warehouse and storage building, using lower quartile values. [R. S. Means Company, Inc., 1993; 1719700010]
2.7.11 c10, cost of a gatehouse/personnel support building and flare ($335,750, $335,750, $25,740)
This cost of the gatehouse assumes a 6-ft-high, 20-ft-wide double gate. The gatehouse is evaluated as equivalent to a booth used for parking lots (for the scale operator) and a large (50 ft × 12 ft) temporary office trailer for the personnel area. [R. S. Means Company, Inc., 1993; 0283085075; 1115011150; and 0159040500]
The default capital cost for the flare and blower is $150,000 and $160,000, respectively. Since ash landfills are not expected to produce gas, no flare is needed. Thus, the default value only contains the cost of the gatehouse. [Kerr's Cost Data for Landscape Construction, 1994]
2.7.12 c11, cost of a public drop-off station ($0, $0, $0)
No such structure is assumed for the default value.
2.7.13 c12, installed cost of industrial truck scale, capacity 50 tons ($70,000, $70,000, $70,000)
This default value is based on experience with landfill construction. [Richardson, interview]
2.7.14 c13, unit cost of electrical connection to utility grid ($10,000, $10,000, $10,000)
This default value is based on engineering judgment.

2. Cost of Waste Disposal in Traditional, Bioreactor, and Ash Landfills
49
2.7.15 c14, unit cost of sanitary sewer connections and piping ($10.20/linear ft, $10.20/linear ft, $10.20/linear ft)
This default value assumes 6-in. PVC piping. [R. S. Means Company, Inc., 1993; 0266862900]
2.7.16 c15, unit cost of septic system ($41,000, $41,000, $41,000)
This default value assumes a 40,000-gal septic tank, 1,000 ft of piping in an excavated trench, and excavation costs for the tank. It is assumed that twice the volume of the tank must be excavated to bury the tank properly. (0.00495 yd3/gal) [R. S. Means Company, Inc., 1993; 0274040500; 0271682120; 0222540450; and 0222426010]
2.7.17 c16, unit cost of potable water connection ($10,000, $10,000, $10,000)
This default value is based on engineering judgment.
2.7.18 c17, unit cost of potable water well installation and connection ($50,000, $50,000, $50,000)
This default value assumes a 40-ft depth, 300-gpm maximum capacity pump, and treatment system. [R. S. Means Company, Inc., 1993; 0267040500; 0267043100; and 1531506400]
2.7.19 c18, unit cost of gas connection ($10,000, $10,000, $10,000)
This default value is based on engineering judgment.
2.7.20 c22, unit cost of road construction suitable for heavy-vehicle traffic ($35.28/linear ft, $35.28/linear ft, $35.28/linear ft)
This default value assumes a 4-in.-thick binder and wearing course. For a 25-ft-wide road (two lanes), there are 2.78 yd2 of pavement per linear ft at $12.70/yd2. [R. S. Means Company, Inc., 1993; 0251040200; and 0251040460]
2.7.21 c23, unit cost of road construction for upgrade of existing roads ($35.28/linear ft, $35.28/linear ft, $35.28/linear ft)
This default value assumes the same cost for road upgrade as for new roads.
2.7.22 c24, unit cost of well drilling and installation ($22/linear ft of well depth, $22/linear ft of well depth, $22/linear ft of well depth)
This default value is for observation wells. [R. S. Means Company, Inc., 1993; 0267040800]
2.7.23 c25, unit cost of low-level landscaping ($1,450/acre, $1,450/acre, $1,450/acre)
This default value assumes seeding for grass only. [R. S. Means Company, Inc., 1993; 0293040010]
2.7.24 c26, cost of high-level landscaping around buildings and site entrance ($5,000, $5,000, $5,000)
This default value is based on engineering judgment.

2. Cost of Waste Disposal in Traditional, Bioreactor, and Ash Landfills
50
2.7.25 c27, unit cost of procurement and installation of flexible membrane liner ($1.50/ft2, $1.50/ft2, $1.50/ft2)
This default value assumes a 60-mil HDPE liner. [Kerr's Cost Data for Landscape Construction, 1994]
2.7.26 c29, unit cost of procurement and delivery of soil suitable for liner construction ($7.00/yd3, $7.00/yd3, $7.00/yd3)
This default value assumes purchase of clay with suitable permeability characteristics if not available on site. A 1-mi haul distance is assumed. [Richardson, interview]
2.7.27 c30, unit cost of procurement and delivery of soil additive to decrease permeability ($115/yd3, $115/yd3, $115/yd3)
This default value is calculated based on landfill construction experience [Richardson, interview]. A cost of $2.50 per % bentonite clay per ton is equivalent to $115 per yd3 of bentonite:
( ) ( ) ( ) ( ) 3ydlb
lb 2000ton
yd115$921100ton%
50.2$3 =×××−
2.7.28 c31, unit cost of procurement, delivery, and installation of drainage material for leachate detection and cover (sand) ($8.05/yd3, $8.05/yd3, $8.05/yd3)
This default value assumes a 1-mi haul distance. [R. S. Means Company, Inc., 1993; 0222120500]
2.7.29 c32, unit cost of installation of compacted soil liner, including soil preparation ($5.00/yd3, $5.00/yd3, $5.00/yd3)
This default value is based on experience with landfill construction. [Richardson, interview]
2.7.30 c33, unit cost of purchase, delivery, and installation of leachate collection layer (gravel) ($8.30/yd3, $8.30/yd3, $8.30/yd3)
This default value for gravel assumes a 1-mi haul distance. [R. S. Means Company, Inc., 1993; 0222120100]
2.7.31 c34, cost to procure and install leachate pump and associated piping and electrical ($10,000, $10,000, $10,000)
This default value assumes a 15-hp, 2-in. suction pump, with additional costs associated with level control and sump construction based on judgment. [R. S. Means Company, Inc., 1993; 1524302140]
2.7.32 c35, cost of leachate storage tank ($120,000, $120,000, $120,000)
This default value is based on experience with landfill construction for installation of a 250,000-gal storage tank and foundation. [Richardson, interview]
2.7.33 c36, cost to procure and install PVC piping ($10.20/ft, $10.20/ft, $10.20/ft)
This default value assumes 6-in. piping. [R. S. Means Company, Inc., 1993; 0266862900]

2. Cost of Waste Disposal in Traditional, Bioreactor, and Ash Landfills
51
2.7.34 c41, total cost of site preoperational studies and activities ($250,000, $250,000, $250,000)
This default value is based on judgment.
2.7.35 c42, unit cost of procurement and delivery of soil suitable for daily cover ($2.67/yd3, $2.67/yd3, $2.67/yd3)
See section 2.7.8.
2.7.36 c43, minimum annual labor costs ($260,000/year, $280,000/year, $93,600/year)
The minimum annual labor cost is based on experience with landfill construction and does not account for overhead costs, which are accounted for separately. [Richardson, interview]
For a traditional landfill, the default value assumes that seven personnel (scale attendant, two equipment operators, traffic controller, recycle coordinator, manager, and mechanic) are needed to process the expected 1,350 ton/day MSW:
hr$15year
weeks52dayhr 8 week
days6 day
people7 c43 ××××=
For a bioreactor landfill, the default value assumes that eight personnel (scale attendant, two equipment operators, traffic controller, recycle coordinator, manager, mechanic, and recirculation supervisor) are needed to process the expected 1,350 tons/day MSW:
hr$15year
weeks52dayhr 8 week
days6 day
people8 c43 ××××=
For an ash landfill, the default value assumes that 2.5 personnel are needed to process the expected 1,350 tons/day:
hr$15year
weeks52dayhr 8 week
days6 day
people2.5 c43 ××××=
2.7.37 c44, incremental labor costs for each increase in landfill tonnage above Mwm
(300day
tonyear
$
, 300day
tonyear
$
, 100day
tonyear
$
)
This default value is based on experience with landfill construction and does not account for overhead costs that are accounted for separately. [Richardson, interview]
2.7.38 c45, cost of equipment procurement and maintenance per mass of waste handled
($1,800day
tonyear
$
, $1,800day
tonyear
$
, $1,460day
tonyear
$
)
To develop this default value for traditional and bioreactor landfills, some typical equipment requirements for various sizes of landfill operations were obtained [Tchobanoglous et al., 1993], and monthly rental cost

2. Cost of Waste Disposal in Traditional, Bioreactor, and Ash Landfills
52
data were obtained for the closest match to the equipment listed [R. S. Means Company, Inc., 1993]. Table 4 shows the applicable rental costs.
Table 4. Equipment Rental Cost for Traditional and Bioreactor Landfills
Equipment Requirement Monthly Rental Cost Item #a
Tractor-crawler (200 hp) $9,300 0164084260
Tractor-crawler (410 hp) $13,100 0164084360
Tractor-crawler (700 hp) $30,200 0164084380
Scraper (12–17 cubic yd) $2,075 0164083500
Water truck (standard 3-ton dump) $1,125 0164085500
Compactor (2 drum) $990 0164081200 aR. S. Means Company, Inc., 1993
The size data from Tchobanoglous et al. [1993] along with the above rental data were used to develop the following equipment costs presented in Table 5.
Table 5. Equipment Cost per Ton Per Day (TPD) for Traditional and Bioreactor Landfills
Capacity (TPD)
Equipment Requirements No. Monthly Cost Total Annual Cost
Cost/ TPD
25 Tractor crawler (small) 1 $9,300 $111,600 $4,464
100 Tractor crawler (medium)
Scraper
Water truck
1
1
1
$13,100
$2,075
$1,125
$195,600
$1,956
225 Tractor crawler (medium)
Scraper
Water truck
2
1
1
$26,200
$2,075
$1,125
$352,800
$1,568
300 Tractor crawler (large and medium)
Scraper
Compactor
Water truck
2
1
1
1
$43,300
$2,075
$990
$1,125
$569,880
$1,899
The average of the three largest operations is about $1,800 per year per TPD.

2. Cost of Waste Disposal in Traditional, Bioreactor, and Ash Landfills
53
Ash landfills do not use daily cover, so the equipment requirements are less than those for traditional and bioreactor landfills. Table 6 shows the applicable rental costs.
Table 6. Equipment Rental Cost for an Ash Landfill
Equipment Requirement Monthly Rental Cost Item #a
Tractor-crawler (200 hp) $9,300 0164084260
Tractor-crawler (410 hp) $13,100 0164084360
Tractor-crawler (700 hp) $30,200 0164084380
Water truck (standard 3-ton dump) $1,125 0164085500
Compactor (2 drum) $990 0164081200 aR. S. Means Company, Inc., 1993
The size data from Tchobanoglous et al. (1993) along with the above rental data were used to develop the following equipment costs presented in Table 7.
Table 7. Equipment Cost per TPD for an Ash Landfill
Capacity (TPD)
Equipment Requirements No. Monthly Cost Total Annual Cost
Cost/ TPD
25 Tractor crawler (small) 1 $9,300 $111,600 $4,464
100 Tractor crawler (medium)
Water truck
1
1
$13,100
$1,125
$170,700
$1,707
225 Tractor crawler (medium)
Water truck
2
1
$26,200
$1,125
$327,900
$1,458
300 Tractor crawler (large and medium)
Compactor
Water truck
2
1
1
$43,300
$2,075
$1,125
$558,000
$1,860
The average of the three largest operations is about $1,460 per year per TPD.
2.7.39 c46, annual cost of well monitoring ($2,000/well-year, $2,000/well-year, $2,000/well-year)
This default value is based on typical values. [Richardson, interview]

2. Cost of Waste Disposal in Traditional, Bioreactor, and Ash Landfills
54
2.7.40 c47, leachate treatment and disposal cost including transport to publicly owned treatment works (POTW) ($0.35/gal, $0.35/gal, $0.35/gal)
This assumes a 15-mi hauling distance and a charge of $0.10 per ton per mi, and treatment costs that are negligible compared with hauling costs [Kerr's Cost Data for Landscape Construction, 1994]:
( ) ( ) ( ) gal per 35.0$43.62mi15miton
10.0$gal 48.7
ftft
lblb 2000
ton 33 =××××
−
2.7.41 c48, annual perpetual care cost ($222,000/year, $222,000/year, $30,000/year)
This default value is based upon annual inspections and possible repairs and maintenance of gas collection equipment [Kerr's Cost Data for Landscape Construction, 1994], as well as the maintenance of the flare and blower [Environmental Research and Education Foundation, 1998]. The flare is rebuilt every 10 years during a period of 80 years. (The third landfill gas collection system is assumed to be discontinued 80 years after waste placement. This default value is fully described in section 6.) Each flare rebuild costs approximately $20,000. Maintenance for the blower includes blower replacement every 5 years during a period of 80 years. Each replacement costs $10,000. Since ash landfills are not expected to produce gas, no flare is needed. Thus, the default value only contains the maintenance cost of the gas collection equipment. The default value for the ash landfill should only include annual inspections since there is no gas collection.
2.7.42 c49, cost of off-site hauling of soil ($0.50/yd3-mi, $0.50/yd3-mi, $0.50/yd3-mi)
This default value assumes a 10- to 20-mi haul distance applicable. [Kerr's Cost Data for Landscape Construction, 1994]
2.7.43 c50, total cost of cell-one preoperational studies and activities ($250,000, $250,000, $250,000)
This default value is based on experience with landfill construction. [Richardson, interview]
2.7.44 c51, unit cost of procurement of on-site daily cover soil ($0.00/yd3, $0.00/yd3, $0.00/yd3)
This number is zero because the soil for on-site daily cover is obtained from excavation during landfill construction.
2.7.45 c52, unit cost of procurement and installation of HDPE ($1.50/ft2, $1.50/ft2, $1.50/ft2)
The default value assumes a 60-mil smooth HDPE liner. [Kerr's Cost Data for Landscape Construction, 1994]
2.7.46 c53, revenue-generating cover (-$5.00/yd3, -$5.00/yd3, -$5.00/yd3)
The default value is based on engineering judgement. The money obtained from using revenue-generating cover must be ≤ 0.
2.7.47 c54, unit cost of concrete (0, $47/yd3, 0)
This is the unit cost for ready mix, regular weight, 2,000-psi concrete. [R. S. Means Company, Inc., 1995]

2. Cost of Waste Disposal in Traditional, Bioreactor, and Ash Landfills
55
2.7.48 c55, cost of procurement of geotextile ($0.11/ft2, $0.11/ft2, $0.11/ft2)
Nonwoven polyester 10-oz. Geotextile (oz/sq yd); 140-mil thickness. [Felker, personal communication, 1997]
2.7.49 c56, cost of procurement and installation of HDPE for final cover ($1.50/ft2, $1.50/ft2, $1.50/ ft2)
The default value assumes a 60-mil smooth HDPE liner. [Felker, personal communication, 1997]
2.7.50 c57, cost of installing geotextile for final cover ($0.06/ft2, $0.06/ft2, $0.06/ft2)
The default value assumes an overlap of seams. [Felker, personal communication, 1997]
2.7.51 c58, capital cost of turbine ($4,000,000, $4,000,000, $0)
Typical range $4,000,000 to $5,000,000. The capital cost includes the cost of major equipment, as well as the costs associated with the auxiliary equipment, construction, emissions controls, interconnections, gas compression and treatment, engineering, and “soft costs.” Soft costs typically include up-front owner’s costs (development staff, legal, permitting, insurance, and property tax), escalation during construction, interest during construction, and owner’s contingency. [U.S. EPA, 1996]
2.7.52 c59, capital cost of internal combustion engine ($1,200,000, $1,200,000, $0)
The capital cost includes the cost of major equipment, as well as the costs associated with the auxiliary equipment, construction, emissions controls, interconnections, gas compression and treatment, engineering, and “soft costs.” Soft costs typically include up-front owner’s costs (development staff, legal, permitting, insurance, and property tax), escalation during construction, interest during construction, and owner’s contingency. [U.S. EPA, 1996]
2.7.53 De, depth of excavation (40 ft, 40 ft, 40 ft)
This site-specific value is the maximum depth of the landfill below site grade. Note that the total landfill height (height of waste above grade plus excavation depth) is 80 ft, which is a typical value
2.7.54 DHDPE, density of HDPE used for daily cover (59.6 lb/ft3, 59.6 lb/ft3, 59.5 lb/ft3)
This is the density of HDPE liner. [Environmental Research and Education Foundation, 1997]
2.7.55 dlcht, density of leachate (8.34 lb/gal, 8.34 lb/gal, 8.34 lb/gal)
This is the density of leachate sent to the POTW. [Environmental Research and Education Foundation, 1997]
2.7.56 Dmsw, average density of waste after burial (1,500 lb/yd3, 1,500 lb/yd3, 3,500 lb/yd3)
This default value is based on experience with landfill construction. [Richardson, interview]
2.7.57 DPVC, density of PVC ( 84.3 lb/ft3, 84.3 lb/ft3, 84.3 lb/ft3)

2. Cost of Waste Disposal in Traditional, Bioreactor, and Ash Landfills
56
This is the density of PVC pipe. [Environmental Research and Education Foundation, 1997]
2.7.58 Dsl, depth of protective soil over the liner and leachate collection system (3.0 ft, 3.0 ft, 3.0 ft)
The default value is chosen based on engineering judgment as an acceptable nominal depth to protect the liner and leachate collection piping from damage due to facility operations.
2.7.59 Dslc, depth of leachate collection system (1.0 ft, 1.0 ft, 1.0 ft)
The default value is chosen based on engineering judgment as an acceptable nominal depth to provide a channel for leachate flow to the collection piping.
2.7.60 Dspl, depth of compacted soil in the primary liner (2.0 ft, 2.0 ft, 2.0 ft)
The default value is chosen as the minimum requirement specified in federal regulations. [RCRA Subtitle D, 40 CFR Part 258, 1991]
2.7.61 Dssl, depth of compacted soil in the secondary liner (2.0 ft, 2.0 ft, 2.0 ft)
The default value is chosen based on engineering judgment. Secondary liners are installed based on site-specific or local regulation requirements or both.
2.7.62 effdu2, efficiency of boiler (80%, 80%, 80%)
The efficiency of the boiler is assumed to be 80%. [Environmental Research and Education Foundation, 1997]
2.7.63 effice2, efficiency of internal combustion engine (33%, 33%, 33%)
The efficiency of the internal combustion engine is assumed to be 33%. [Environmental Research and Education Foundation, 1997]
2.7.64 efftrbn2, efficiency of turbine (33%, 33%, 33%)
The efficiency of the turbine is assumed to be 33%. [Environmental Research and Education Foundation, 1997]
2.7.65 f1, fraction of below-grade volume required to be excavated (1.0, 1.0, 1.0)
Unless the site is a natural depression, excavation of 100% of the below-grade volume would be required. The default value is chosen to maximize excavation costs in the model.
2.7.66 f2, fraction of excavated volume considered difficult to excavate (0.1, 0.1, 0.1)
The soil is not suitable for berms, daily cover, liner, or final cover. The default value is chosen based on engineering judgment that ease of excavation would be one criteria of an acceptable landfill site.
2.7.67 f3, fraction of buffer zone to be cleared and landscaped prior to operating landfill (0.05, 0.05, 0.05)

2. Cost of Waste Disposal in Traditional, Bioreactor, and Ash Landfills
57
The default value is chosen to allow for access to the site. Landscaping requirements are site specific.
2.7.68 f4, fraction of soil additive to mix with native or purchased soil to achieve required permeability (0.04, 0.04, 0.04)
This default value is based on experience with landfill construction. [Richardson, interview]
2.7.69 f5, engineering design multiplier for capital investment (0.1, 0.1, 0.1)
This default value is based on experience with landfill construction. [Richardson, interview]
2.7.70 f6, engineering design multiplier for landfill operations (0.1, 0.1, 0.1)
This default value is based on experience with landfill construction. [Richardson, interview]
2.7.71 f7, labor fringe rate (0.46, 0.46, 0.46)
Overhead costs for labor are calculated as a fraction of labor wages. Overhead costs include overtime, office supplies, insurance, social security, vacation, sick leave, and other services.
2.7.72 f9, utilities costs fraction (of personnel costs) (0.01, 0.01, 0.01)
The default value is based on judgment.
2.7.73 f10, fraction of excavation suitable for liner construction, daily cover, berms, and final cover (0.9, 0.9, 0.9)
The default value is based on engineering judgement.
2.7.74 gas1du, use of boiler in first landfill gas treatment period (0%, 0%, 0%)
No gas is collected and routed to a boiler in the first treatment period.
2.7.75 gas1ice, use of ICE during first landfill gas treatment period (0%, 0%, 0%)
No gas is collected and routed to a boiler in the first treatment period.
2.7.76 gas1trbn, use of turbine during first landfill gas treatment period (0%, 0%, 0%)
No gas is collected and routed to a boiler in the first treatment period.
2.7.77 gasCH4, percent of methane in landfill gas (55%, 55%, 0%)
It is assumed that landfill gas as generated consists of approximately 55% methane but that there is no methane produced from ash. [Environmental Research and Education Foundation, 1997]
2.7.78 GCHDPE, amount of HDPE in gas collection system (0.016 lb/ton waste, 0.016 lb/ton waste, 0.016 lb/ ton waste)
2. Cost of Waste Disposal in Traditional, Bioreactor, and Ash Landfills
58
The amount of HDPE used for the gas collection system corresponds to a specific quantity of waste, which is the amount of waste contributing to the gas collection system. This information was obtained from individual sites. Refer to section 2.4.1 and Environmental Research and Education Foundation [1997].
2.7.79 GCPVC, amount of PVC in gas collection system (0.0081 lb/ton waste, 0.0081 lb/ton waste, 0.0081 lb/ton waste)
The amount of PVC used for the gas collection system corresponds to a specific quantity of waste that is the amount of waste contributing to the gas collection system. This information was obtained from individual sites. Refer to section 2.4.1 and Environmental Research and Education Foundation [1997].
2.7.80 GMPVC, amount of PVC in gas monitoring system (7.3E-5 lb/ton waste, 7.3E-5 lb/ton waste, 7.3E-5 lb/ton waste)
The amount of PVC used for the gas monitoring system corresponds to a specific quantity of waste that is the amount of waste contributing to the gas collection system. This information was obtained from individual sites. This amount of waste was assumed to be proportional to the surface of the cell covered by the collection system. Each quantity of PVC is normalized to the amount of waste contributing to the gas collection system in the specific cell for which it is used. The amount of PVC used was calculated based on computing the volume of PVC used (from pipe length, diameter, and wall thickness) and multiplying by the density of PVC (84.3 lb/ft3). The values ranged from 6.9E-6 lb/ton MSW to 2.0E-4 lb/ton MSW. [Environmental Research and Education Foundation, 1997]
2.7.81 Ha, height of waste above grade (40 ft, 40 ft, 40 ft)
This default value is based on engineering judgment and is site specific.
2.7.82 Hbm, height of berm (10 ft, 10 ft, 10 ft)
This default value is based on engineering judgment.
2.7.83 i, effective annual interest rate (0.05)
The default value is chosen consistent with other process models.
2.7.84 k, first order decay rate constant (0.03 year-1, 0.15 year-1, 0 year-1)
The default value is 0.03 year-1 for traditional landfills. [Environmental Research and Education Foundation, 1997].
The default value for bioreactor landfills is based on engineering judgement. The default value for ash landfills is based on the assumption that gas production will be close to zero.
2.7.85 lag, time between placement and start of gas generation (1 year, 0 year, 1 year)
It is assumed to represent an average lag time between waste placement and when the waste starts to decompose to methane. This stage varies depending on moisture content and temperature of the surroundings. [Environmental Research and Education Foundation, 1997]

2. Cost of Waste Disposal in Traditional, Bioreactor, and Ash Landfills
59
2.7.86 Lb, buffer zone distance (300 ft, 300 ft, 300 ft)
This default value is chosen based on federal regulations [R. S. Means Company, Inc., 1993].
2.7.87 Lgth3, average length of horizontal trench for leachate recirculation (0 ft, 548 ft, 0 ft)
This number is site specific. It is assumed that the length of the trench equals the length of the disposal volume.
2.7.88 lgth8, length of PVC pipe in each vertical injection well (0 ft, 65 ft, 0 ft)
This is the length of the vertical well in a leachate recycle landfill. The default value is a function of the height above grade, depth of excavation, depth of the leachate collection system, and a buffer length.
( ) 10DDH8thlg llsea −−+=
2.7.89 Llcp, distance between leachate collection pipes (100 ft, 100 ft, 100 ft)
This default value is based on experience with landfill construction. [Richardson, interview]
2.7.90 Lo, total landfill gas yield potential (ft3/ton waste)
The user has the option of selecting the landfill gas yield potential predicted by SWANA or the landfill gas yield potential based on a laboratory analysis done at North Carolina State University. A complete discussion of gas production is presented in section 6.
2.7.91 Lor, distance of required off-site roads to be upgraded (1 mi, 1 mi, 1 mi)
The default value is chosen based on engineering judgment. Ease of access to the site is expected to be one criteria of an acceptable landfill site.
2.7.92 Ls, total site length (5,280 ft, 5,280 ft, 5,280 ft)
The default value is chosen based on engineering judgment. Ease of access to the public works is expected to be one criteria of an acceptable landfill site.
2.7.93 Lsd, distance to area for excess soil disposal (1 mi, 1 mi, 1 mi)
The default value is chosen based on engineering judgment. Ease of access to the site is expected to be one criteria of an acceptable landfill site.
2.7.94 Lsr, distance of required roads for site entrance and for access to on-site facilities (600 ft, 600 ft, 600 ft)
This default value is double the buffer-zone length.
2.7.95 Lw, distance between monitoring wells around perimeter of disposal volume (500 ft, 500 ft, 500 ft)
This default value is based on experience with landfill construction. [Richardson, interview]

2. Cost of Waste Disposal in Traditional, Bioreactor, and Ash Landfills
60
2.7.96 Lwd, depth of typical well (50 ft, 50 ft, 50 ft)
This default value is chosen based on water-table characteristics of the Central Piedmont of North Carolina. For well clusters, the average depth of a well can be multiplied by the number of the wells.
2.7.97 Mwl, expected mass flow (1,350 ton/day, 1,350 ton/day, 338 ton/day)
The default value for a traditional and bioreactor landfill is based upon a population of about 450,000 persons and a per capita waste generation rate of 6 lb/day. The default value for an ash landfill, based on engineering judgement, is 338 ton/day. These mass generation rates are used only to calculate the size of the landfill and do not influence the composition of the mass flowing to the landfill and the density of the waste stream.
2.7.98 Mwm, maximum daily tonnage handled by base labor costs of c43 (400 ton/day)
This default value is based on experience with landfill construction. [Richardson, interview]
2.7.99 Npc, number of years of perpetual care (30 years, 30 years, 30 years)
Four different semi-annual inspections are included: general inspection, gas collection system inspection, leachate collection system inspection, and groundwater control system inspection for a total of eight visits per year for 30 years. Post-closure activities also include lawn mowing once a year.
2.7.100 Nr, the number of distinct regions of the landfill developed over the life of the facility (4, 4, 4)
This default value is chosen based on engineering judgment to obtain a 5-year cell-one operating period.
2.7.101 Ns, the number of scales required (1, 1, 0)
This default value is chosen based on engineering judgment.
2.7.102 Ny, expected useful life of landfill (20 years, 20 years, 20 years)
This is the number of years the typical landfill cell will remain open before final cover is applied. This value is used to determine the size of the landfill.
2.7.103 Pcvr1, percent of total landfill volume occupied by cover (10%, 10%, 0%)
The default value is based on industry information and engineering judgment. It is assumed that off-site soil, on-site soil, and revenue-generating cover, if used exclusively as the only type of daily cover, will represent 10% by volume of airspace in a given landfill cell.
2.7.104 Pcvr2, percent of final cover to be replaced over the entire post-closure period (10%, 10%, 5%)
It is assumed that 10% of the final cover will have to be replaced over the 30-year post-closure monitoring period. [Environmental Research and Education Foundation, 1997]
2.7.105 PHDPE1, percent of daily cover that is HDPE (15%, 15%, 0%)

2. Cost of Waste Disposal in Traditional, Bioreactor, and Ash Landfills
61
This value is based on standard engineering practice. [Environmental Research and Education Foundation, 1997]
2.7.106 Prevgen, percent of daily cover that is revenue-generating cover (15%, 15%, 15%)
This default value is based on standard engineering practice. [Environmental Research and Education Foundation, 1997]
2.7.107 r1, revenue from electric buyback ($0.03/kWh, $0.03/kWh, $0.03/kWh)
This default value is based on current rates. [U.S. EPA, 1996]
2.7.108 r2, revenue from thermal energy ($1.23/MBtu, $1.23/MBtu, $1.23/MBtu)
This default value is based on current rates. [U.S. EPA, 1996]
2.7.109 Rb, slope of the grade of the berm as rise over run (0.33, 0.33, 0.33)
The default value is chosen based on engineering judgment for slope stability.
2.7.110 Rda, slope of the grade of the disposal volume above site grade as rise over run (0.33, 0.33, 0.33)
The default value is chosen based on engineering judgment for slope stability.
2.7.111 Rdb, slope of the grade of the disposal volume below site grade as rise over run (0.33, 0.33, 0.33)
The default value is chosen based on engineering judgment for slope stability.
2.7.112 RLW, length-to-width ratio (1.0, 1.0, 1.0)
The default value is chosen based on engineering judgment to minimize land requirements.
2.7.113 s, first order rise phase constant (1 year-1, 1.5 year-1, 0 year-1)
The default value for the traditional landfill was based on studies described in Environmental Research and Education Foundation [1997]. The default values for the bioreactor and ash landfills are based on engineering judgement.
2.7.114 t, year of gas treatment (year)
This is the year of landfill gas treatment.
2.7.115 tHDPE2, thickness of HDPE (60 mils, 60 mils, 60 mils)
This is based on a typical final cover profile. [Environmental Research and Education Foundation, 1997]
2.7.116 t0, time to implementation of first gas collection system (2 years, 2 years, 2 years)

2. Cost of Waste Disposal in Traditional, Bioreactor, and Ash Landfills
62
The first landfill gas treatment period starts at year 2 and ends at year 5. The second landfill gas treatment period starts at year 5 and ends at year 40. The third landfill gas treatment period starts at year 40 and ends at year 80. [Environmental Research and Education Foundation, 1997]
2.7.117 t3, time to discontinuation of third gas collection system (80 years, 80 years, 80 years)
The first landfill gas treatment period starts at year 2 and ends at year 5. The second landfill gas treatment period starts at year 5 and ends at year 40. The third landfill gas treatment period starts at year 40 and ends at year 80. [Environmental Research and Education Foundation, 1997]
2.7.118 tsand1, thickness of the first sand layer in final cover (1 ft, 1ft, 1ft)
This is based on a typical final cover profile. [Environmental Research and Education Foundation, 1997]
2.7.119 tsand2, thickness of second sand layer in final cover (1 ft, 1 ft, 1 ft)
This is based on a typical final cover profile. [Environmental Research and Education Foundation, 1997]
2.7.120 tsoil, depth of top soil and vegetation support soil (3.0 ft, 3.0 ft, 3.0 ft)
This is based on a typical final cover profile. [Environmental Research and Education Foundation, 1997]
2.7.121 Wbu, width of the top of the berm (12.0 ft, 12.0 ft, 12.0 ft)
The default value is chosen as a nominal value to permit vehicle access along the top of the berm.
2.7.122 z1, logical input, = +1 if septic system is used instead of public sewer, 0 otherwise (0, 0, 0)
The default value is chosen based on engineering judgment. Ease of access to the public works is expected to be one criteria of an acceptable landfill site.
2.7.123 z2, logical input, = +1 if on-site well water is used instead of public water, 0 otherwise (0, 0, 0)
The default value is chosen based on engineering judgment. Ease of access to the public works is expected to be one criteria of an acceptable landfill site.
2.7.124 z3, logical input, = +1 if gas is used on site, 0 otherwise (0, 0, 0)
The default value is chosen based on engineering judgment. The specific public works to be used is site specific.
2.7.125 z4, logical input, = +1 if a liner is used, 0 otherwise (+1, +1, +1)
The default value is chosen consistent with the requirements of a subtitle D landfill.
2.7.126 z6, logical input, = +1 if a double composite liner is used, 0 otherwise (single composite) (0, 0, 0)
The default value is chosen based on engineering judgment. Secondary liners are installed based on site-specific and/or local regulations. A primary liner consists of compacted soil and a flexible membrane. A

2. Cost of Waste Disposal in Traditional, Bioreactor, and Ash Landfills
63
secondary liner also consists of a compacted soil liner and a flexible membrane. If a secondary liner is specified, then a leachate detection system would be installed between the liners with a foot of sand layer for drainage.
2.7.127 z9, logical input, = +1 if sand is used for leachate collection piping channels, 0 otherwise (for gravel) (+1, +1, +1)
The default value is chosen based on engineering judgment.

63
3.0 Life-Cycle Inventory of Landfill Operations
The operations phase of the landfill life cycle involves solid waste being weighed at the gate of the landfill, transported by truck to the working face and emptied. It is then spread into a thin layer and compacted. Daily cover is placed over the waste to minimize litter, odor, and pests and to improve waste control. The daily cover can be composed of one or a combination of the following: soil, HDPE tarp, revenue-generating cover, or no daily cover. The user selects both the total fraction of the landfill volume occupied by daily cover (Pcvr1) and the fraction of each type used (Psoil, PHDPE1, Prevgen, Pncvr).
In addition to daily cover material, fuel is required to operate equipment that places the waste and daily cover. Various combinations of equipment such as bulldozers, scrapers, graders, backhoes, and trucks are used to compact the waste, obtain and place the cover, and to perform other operational duties. The choice of equipment depends on the configuration of the site (nature of the soil, slopes, etc.), the climate (frosted soils, damp soils, etc.), and the size of the site and perhaps other factors. The user can adjust the percent use for each equipment type. Furthermore, heavy trucks and dump trucks consume fuel while transporting cover material and fuel to the site.
3.1 Daily Cover Materials
This section models the consumption of daily cover materials. The required parameters follow.
♦ User Input Parameters:
• Dmsw, average density of waste after burial (lb/yd3)
• Mwl, expected mass flow (ton/day)
• Ny, expected useful life of the landfill (years)
• Pcvr1, percent of total landfill volume occupied by cover (%)
• PHDPE1, percent of daily cover that is HDPE (%)
• Prevgen, percent of daily cover that is revenue-generating cover (%)
♦ Calculated Parameters:
• Deff, effective landfill density (lb/yd3)
• Doverall, overall effective landfill density (lb/yd3)
• Ldv, length of the disposal volume (ft)
• mswacre, waste buried per landfill surface area (tons/acre)
• Poff, percent of site that uses off-site soil as daily cover (%)
• Pon, percent of daily cover that is on-site soil (%)
• Vmsw, average landfill airspace volume per landfill surface area (yd3/acre)
• Wdv, width of the disposal volume (ft)

3. Life-Cycle Inventory of Landfill Operations
64
As mentioned above, there are different types of daily cover that could be applied to a landfill at the end of the working day. Table 8 represents the default values for the mix of daily cover used at a traditional or bioreactor landfill during landfill operation.
Table 8: Default Values for Percent of Daily Cover Used in Traditional and Bioreactor Landfills
Daily Cover Type % of Total Use
Soil (on-site and off-site) 70
HDPE tarp 15
Revenue-generating cover 15
No daily cover 0
Total: 100
In traditional and bioreactor landfills, the default value for the volume of landfill airspace occupied by daily cover (Pcvr1) is 10%. This percentage consists of the fractions given in Table 8. As presented in Table 9, the default value for an ash landfill is no daily cover.
Table 9: Default Values for Percent of Daily Cover Used in Ash Landfills
Daily Cover Type % of Total Use
Soil (on-site and off-site) 0
HDPE tarp 0
Revenue-generating cover 0
No daily cover 100
Total: 100
When daily cover is used, the amount of waste per cubic yd of landfill volume decreases. For example, if daily cover consisting of off-site soil comprises 10% of the landfill volume, the amount of waste per cubic yd decreases from 1,500 lb to 1,350 lb. However, this is assuming that the entire site uses off-site soil. Actually, the site may be a mix of daily cover types. Based on the default values represented in Table 8, soil and revenue-generating cover represent 85% of the total daily cover on the site. The remaining 15% is covered with a HDPE tarp. This model assumes that the HDPE tarp does not consume any airspace. Therefore, 85% of the landfill will have an effective waste density of 1,350 lb/yd3, and 15% will have an effective waste density equal to the pure waste density of 1,500 lb/yd3. The following equation calculates the effective landfill density for 85% of the site:
msw1cvr
eff D100P1D ×⎟
⎠⎞
⎜⎝⎛ −= (97)
The overall effective density for the entire landfill is calculated with the following equation:

3. Life-Cycle Inventory of Landfill Operations
65
⎟⎟⎠
⎞⎜⎜⎝
⎛×+⎟
⎟⎠
⎞⎜⎜⎝
⎛×
++= msw
1HDPEeff
revgenonoffoverall D
100P
D100
PPPD (98)
The variables Pon and Poff are calculated in equations 101 and 102, respectively. The total volume of waste per landfill surface area is calculated as
( )⎟⎠⎞⎜
⎝⎛××
⎟⎠⎞⎜
⎝⎛××××
=
2ft 43560acre
yeardays 365
tonlb 2000
dvdv
mswywl
mswLW
D1NM
V (99)
The calculations for Wdv and Ldv are provided in equations 4 and 5, respectively (section 2.1.1). The overall effective waste density can be multiplied by the landfill volume per surface area to yield the tons of waste placed per landfill surface area.
⎟⎠⎞⎜
⎝⎛××= lb2000
tonVDmsw mswoverallacre (100)
3.1.1 On-Site Soil
Daily cover soil can be comprised of soil obtained on site or soil hauled in from off site. On-site soil obtained from landfill excavation is used for the main liner, topsoil and vegetative support cover, berms, and daily cover. Refer to Appendix C for the equations used for the landfill-site soil balance. The LCI for the production of on-site daily cover are modeled as part of the landfill site operations (i.e., heavy-equipment use). Therefore, the upstream burdens of the extraction and transport of on-site soil will be accounted for in the waste placement fuel consumption modeling.
3.1.2 Off-Site Soil
This section documents equations used to calculate the amount of off-site soil per ton of waste. The required parameters follow.
♦ User Input Parameters:
• Dsoil, density of the off-site soil (lb/ft3)
• Pcvr1, percent of total landfill volume occupied by cover (%)
• Psoil, percent of daily cover that is soil (%)
♦ Calculated Parameters:
• DCsoil, off-site soil used per ton of waste (lb/ton of waste)
• Deff, effective landfill density (lb/yd3)
• Poff, percent of site that uses off-site soil as daily cover (%)
• Pon, percent of daily cover that is on-site soil (%)

3. Life-Cycle Inventory of Landfill Operations
66
• Ponsite, percent of daily cover soil volume that can be obtained on site as calculated in the soil budget (%) (Appendix C)
If the required volume of daily cover soil required exceeds the volume of on-site soil available, then off-site soil is used. The user specifies the percentage of daily cover that is soil (Psoil). If the model determines there is enough soil from excavation for main liner construction, topsoil, berms, and daily cover, then the percentage of on-site soil (Ponsite) is 100%. If the soil required exceeds the available volume, then the model calculates the percentage of the daily cover that could come from on site:
⎟⎟⎠
⎞⎜⎜⎝
⎛ ×100
pp soilonsite
The following equation calculates the percentage of on-site daily cover.
⎟⎠⎞
⎜⎝⎛ ×
==100
PP,P,100PIFP soilonsitesoilonsiteon (101)
The percentage of off-site soil is the percent of daily cover that is soil minus the percent of daily cover that is on-site soil.
onsoiloff PPP −= (102)
The amount of off-site soil per ton of waste is a function of the density of the soil, the percent volume occupied by daily cover, the percent of daily cover that is off-site soil, and the effective waste density.
( )tonlb 2000
ydft 27
100P
D1
100P
DDC 33off
eff
1cvrsoilsoil ×⎟⎟
⎠
⎞⎜⎜⎝
⎛××××= (103)
3.1.3 Revenue-Generating Cover
Revenue-generating cover is a waste material that generators pay to discard and that can be used as daily cover. The transport of this material to the site may be accounted for in the collection process model or outside the system boundary depending on the waste source. Therefore, no additional environmental burdens associated with production of revenue-generating cover are considered for in this study. The fuel used to place revenue-generating daily cover is modeled as being part of the landfill site operations (i.e., heavy-equipment use).
3.1.4 No Daily Cover
Although required by regulation, some sites may not use daily cover because of special circumstances. Sites that do not use daily cover were modeled as having different operating practices than sites that do use daily cover, resulting in different amounts of fuel and equipment use. The default for an ash landfill is no daily cover. Therefore, fuel consumption at an ash landfill for site operations has been reduced. Reduced fuel consumption is also attributed to the relative ease of ash compaction as compared to MSW.

3. Life-Cycle Inventory of Landfill Operations
67
3.1.5 Alternate Daily Cover (HDPE)
This section documents equations used to calculate the amount of HDPE per ton of waste. The required parameters follow.
♦ User Input Parameters
• AHDPE, area of HDPE per acre (ft2/acre)
• DHDPE, density of HDPE used for daily cover (lb/ft3)
• THDPE, thickness of the HDPE used for daily cover (mils)
♦ Calculated Parameters
• DCHDPE, total HDPE used as daily cover (lb/ton waste)
• mswacre, waste buried per landfill surface area (tons/acre)
Alternate daily cover can consist of various types of material (tarps, foam, chemical spray, etc.) For the purposes of this study, only HDPE tarps will be considered. The default parameter AHDPE is based on the assumption that a 15-mil HDPE tarp is re-used over the entire life of a 1-acre landfill cell or an operating unit. Therefore, one 15-mil HDPE tarp would effectively act as daily cover for the entire amount of waste placed in a given cell. In practice, if a thin tarp (~3 mil) is used, then the tarp may be used only once. Therefore, the surface area of the HDPE daily cover use per acre (AHDPE) can be varied to account for this. Refer to section 2.3.2.
The amount of HDPE used as daily cover per ton of waste can be calculated as
mil1
ft000083.0msw
DATDC
acre
HDPEHDPEHDPEHDPE ×
××= (104)
3.1.6 Life-Cycle Inventory of Cover Material
The emissions due to obtaining off-site soil and to producing HDPE are calculated in this section. In these equations, emissions are calculated for the LCI CO2-fossil. In the model, emissions are calculated for each of the LCI parameters. The emissions are a function of the amount of daily cover (lb/ton waste), percent of daily cover type used, and the emission factor (lb emission/lb cover type). Emission factors are presented in Appendix D. The required parameters follow.
♦ User Input Parameters:
• CMB_HDPE CMB_A_CO2, emission factor for fossil CO2 due to HDPE production (lb CO2-F/lb HDPE) (Appendix D)
• CMB_SOIL CMB_A_CO2, emission factor for fossil CO2 due to off-site soil production (lb CO2-F/lb soil) (Appendix D)
• PHDPE1, percent of daily cover that is HDPE (%)

3. Life-Cycle Inventory of Landfill Operations
68
♦ Calculated Parameters:
• DCHDPE, total HDPE used as daily cover (lb/ton waste)
• DCsoil, off-site soil used per ton of waste (lb/ton waste)
• O_HDPE O_A_CO2, fossil CO2 emitted during production of HDPE (lb/ton waste)
• O_SOIL O_A_CO2, fossil CO2 emissions for obtaining off-site soil (lb/ton waste)
• Poff, percent of site that uses off-site soil as daily cover (%)
For the case where 100% of the daily cover is off-site soil, emissions are a function of the amount of daily cover used (lb/ton of waste) and the emission factor. Since daily cover is a combination of cover types, the emissions need to be adjusted by the percent of off-site soil used as daily cover. Therefore, fossil CO2 emissions due to off-site soil production are calculated as
CMB_A_CO2 SOIL_CMB
100P
DCO_A_CO2 SOIL_O offsoil ××=
(105)
A similar calculation is required for fossil CO2 emissions due to HDPE production.
CMB_A_CO2 HDPE_CMB
100P
DCO_A_CO2 HDPE_O 1HDPEHDPE ×=
(106)
No additional calculations are required to calculate emissions from on-site soil because this is modeled as part of heavy-equipment use in landfill operations. Emissions due to obtaining revenue-generating cover may be accounted for in the collection process model as discussed above.
3.2 Equipment Use
This section models equipment emissions caused by placing waste and landfill daily cover. The values for total fuel consumption and the percent of total fuel use for each equipment type were obtained from an industry survey of actual landfills conducted for the Environmental Research and Education Foundation [Environmental Research and Education Foundation, 1997]. The breakdown of equipment fuel usage for landfill operations is given in Table 10 and Table 11. The value for total fuel consumption is 0.28 gal/ton waste (fuel1) at sites with daily cover. The value of fuel consumption at sites that do not use daily cover is 0.19 gal/ton waste (fuel2).
Table 10: Breakdown of Fuel Usage at Landfills With Daily Cover
Daily Cover Equipment % Total Fuel Use
Scraper 4.1
Bulldozer 20.1
Backhoe 2.7
Compactor 48.1
continued

3. Life-Cycle Inventory of Landfill Operations
69
Table 10: Continued
Daily Cover Equipment % Total Fuel Use
Grader 3.1
Wheel Loader 0.5
Loader 0.4
Water Truck 2.4
Water Pull 2.2
Haul Truck 0.2
Dump Truck 10.1
Pick-up 2.9
Misc. 3
Total: 99.6
Table 11: Breakdown of Fuel Usage at Landfills Without Daily Cover
Non-Daily Cover Equipment % Total Fuel Use
Bulldozer 8
Compactor 68
Wheel Loader 16
Loader 8
Total: 100
3.2.1 Emissions Due to Equipment Use
This section develops equations to calculate emissions from equipment used for landfill operations. The required parameters follow.
♦ User Input Parameters:
• CMB_SCRPR CMB_A_CO2, emission factor for fossil CO2 from a scraper (lb CO2-F/gal fuel) (Appendix D)
• CMB_WL CMB_A_CO2, emission factor for fossil CO2 from a wheel loader (lb CO2-F/gal fuel) (Appendix D)
• fuel1, fuel used at a site with daily cover (gal/ton waste)
• fuel2, fuel used at a site with no daily cover (gal/ton waste)
• Pncvr, percentage of the site that receives no daily cover (%)

3. Life-Cycle Inventory of Landfill Operations
70
• scrprcvr, percentage of fuel used by the scraper (%)
• wlcvr, percentage of the fuel used by a wheel loader at a site with no daily cover (%)
• wlncvr, percentage of the fuel used by a wheel loader at a site with no daily cover (%)
♦ Calculated Parameters:
• O_SCRPR O_A_CO2, fossil CO2 emissions for using a scraper on a site with daily cover (lb/ton waste)
• O_WL O_A_CO2, fossil CO2 emissions from a wheel loader (lb/ton waste)
The emission factors associated with diesel fuel combustion in heavy-equipment are based on information from the U.S. EPA’s AP-42 database for mobile sources (http://www.epa.gov/ttnchie1/ap42.html). The U.S. EPA database presents emission factors per category of equipment. Table 12 shows a breakdown of operations equipment and the associated AP-42 category.
Table 12: Operations Equipment and AP-42 Categories
Equipment AP-42 Category
Scraper Scraper
Bulldozer Bulldozer
Backhoe Wheel tractor
Compactor Grader
Wheel loader Wheel loader
Loader Wheel loader
Water truck Truck
Water pull Truck
Haul truck Truck
Dump truck Truck
Pick-up Truck
Miscellaneous Miscellaneous
Emissions for equipment (scraper, grader, water truck, water pull, haul truck, dump truck, pick-up, and other miscellaneous equipment) used only at sites with daily cover are modeled using an IF statement. If there is no daily cover, then the equipment will not be used and the emissions are zero. If there is daily cover, then emissions are a function of total fuel usage (gal/ton waste), percent equipment use (%), and the emission factor (lb emission/gal fuel). To illustrate, fossil CO2 emissions from a scraper are calculated in the following equation:
⎟⎟⎠
⎞⎜⎜⎝
⎛⎟⎟⎠
⎞⎜⎜⎝
⎛××== CMB_A_CO2 SCRPR_CMB
100scrpr
fuel,0,100PIFO_A_CO2 SCRPR_O cvr1ncvr (107)

3. Life-Cycle Inventory of Landfill Operations
71
Emissions for a backhoe, grader, water truck, water pull, haul truck, dump truck, pick-up, and miscellaneous equipment are calculated in a similar manner.
Emissions for equipment (wheel loader, bulldozer, compactor, and loader) used at sites with or without daily cover are also modeled using an IF statement. If there is no daily cover, then emissions are a function of fuel use at sites with no cover, percent equipment use, and the emission factor. If there is daily cover, emissions are a function of fuel consumption at sites with daily cover, percent equipment use, and the emission factor. To illustrate, fossil CO2 emissions from a wheel loader are calculated in the following equation:
⎟⎟⎟⎟⎟
⎠
⎞
⎜⎜⎜⎜⎜
⎝
⎛
⎟⎠⎞
⎜⎝⎛ ××
⎟⎠⎞
⎜⎝⎛ ××=
=
1cvr
2ncvr
ncvr
fuelCMB_A_CO2 WL_CMB100wl
,fuelCMB_A_CO2 WL_CMB100
wl,100PIF
O_A_CO2 WL_O
(108)
Emissions for a bulldozer, compactor, and loader are calculated in a similar manner.
3.3 Fuel Consumed During Material Transport
The amount of fuel needed to transport materials to the site is modeled in this section of landfill operations. The required parameters follow.
♦ User Input Parameters:
• actual1, weight of an actual payload (contents) of a heavy-duty truck (lb)
• actual2, weight of an actual payload (contents) of a dump truck (lb)
• Dfuel, density of diesel fuel (lb/gal)
• er1, return of heavy-duty truck (empty return: YES[1] or NO[0], or any fraction between these two numbers)
• er2, return of dump truck (empty return: YES[1] or NO[0], or any fraction between these two numbers)
• fuel1, fuel used at a site with daily cover (gal/ton waste)
• fuel2, fuel used at a site with no daily cover (gal/ton waste)
• HD1, one-way distance fuel is transported to the landfill (mi)
• HD2, one-way distance off-site soil for daily cover is transported to the landfill (mi)
• HD3, one-way distance HDPE is transported to the landfill (mi)
• max1, weight of the maximum payload (contents) of the heavy-duty truck (lb)
• max2, weight of the maximum payload (contents) of the dump truck (lb)
• sc1, specific consumption for a heavy-duty truck (mpg)
• sc2, specific consumption for a dump truck (mpg)

3. Life-Cycle Inventory of Landfill Operations
72
♦ Calculated Parameters:
• DCHDPE, total HDPE used as daily cover (lb/ton waste)
• DCsoil, off-site soil used per ton of waste (lb/ton waste)
• fuel3, fuel consumed by heavy trucks while transporting fuel for use at sites with daily cover (gal/ton waste)
• fuel4, fuel consumed by dump trucks while transporting off-site soil (gal/ton waste)
• fuel5, fuel consumed by heavy trucks while transporting fuel and HDPE (gal/ton waste)
• fuel6, fuel consumed by heavy trucks while transporting fuel for use in sites with no daily cover (gal/ton waste)
• HD4, weighted distance needed to transport fuel and HDPE to the site (mi)
Fuel is consumed by heavy trucks or dump trucks when daily cover material and fuel for operating equipment is transported to the site. Fuel is consumed when:
• dump trucks transport off-site soil
• heavy trucks transport HDPE
• heavy trucks transport fuel to be used by equipment at sites with daily cover
• heavy trucks transport fuel to be used by equipment at sites with no daily cover
On-site soil for daily cover does not require additional transportation and revenue-generating cover is brought in with the waste collection vehicles. The material, default transport distance, and truck type are shown in Table 13. The distances shown represent the one-way transportation distance to the landfill site and are user enterable.
Table 13: Transport of Materials to Site During Landfill Waste Placement
Material Distance Transported (miles) Type of Truck Used
Off-site soil 10 (HD2) Dump truck
Fuel 50 (HD1) Heavy-duty truck
HDPE 250 (HD3) Heavy-duty truck
Based on the assumption that two-thirds of a truck's fuel consumption is independent of a truck's load, the fuel consumption for the transportation of a given amount of material is
Load ActualWeightReturn Empty
32
Load MaximumLoad Actual
31
32
nConsumptio SpecificDistanceFuel ×⎟⎟
⎠
⎞⎜⎜⎝
⎛+⎥⎦
⎤⎢⎣⎡+×=
(109)
where
Distance = miles based on the weighted average distances (mi)

3. Life-Cycle Inventory of Landfill Operations
73
Specific Consumption = fuel economy of the truck (mi/gal)
Actual Load = actual payload of the truck (lb)
Maximum Load = maximum payload of the truck (lb)
Empty Return = return of the truck (empty return: YES [1] or NO [0], or any fraction between these two numbers)
Weight = weight of the material (lb/ton waste)
Heavy trucks transport the fuel used by operating equipment (scraper, bulldozer, etc.) that apply HDPE, off-site soil, on-site soil, and revenue-generating cover. Heavy trucks also transport HDPE. To simplify the model and minimize the use of equation 109, a weighted haul distance was calculated for fuel and HDPE.
3
HDPEfuel1
HDPE1
HDPEfuel1
fuel14 HD
DCDfuelDCHD
DCDfuelDfuel
HD ×⎟⎟⎠
⎞⎜⎜⎝
⎛+×
+×⎟⎟⎠
⎞⎜⎜⎝
⎛+×
×= (110)
This weighted haul distance was then used in equation 111 to calculate the fuel used by a heavy truck while transporting fuel (fuel1) and HDPE.
1
HDPEfuel11
1
1
1
45 actual
DCDfueler32
maxactual
31
32
scHDfuel +×
×⎥⎥⎦
⎤
⎢⎢⎣
⎡+⎟⎟
⎠
⎞⎜⎜⎝
⎛+×= (111)
The value for DCHDPE represents the case where 100% of the daily cover is HDPE. Thus, fuel5 also represents the case where 100% of the daily cover is HDPE. However, fuel (fuel1) is still required to operate equipment if off-site soil, on-site soil, or revenue-generating cover is used. Thus, the fuel required to transport just fuel1 is calculated as
1
fuel11
1
1
1
13 actual
Dfueler32
maxactual
31
32
scHDfuel ×
×⎥⎥⎦
⎤
⎢⎢⎣
⎡+⎟⎟
⎠
⎞⎜⎜⎝
⎛+×= (112)
The value for DCsoil represents the case where 100% of the daily cover is soil. Thus, fuel4 also represents the case where the entire site uses on-site soil, off-site soil, revenue-generating cover, or a combination thereof. The fuel consumed by dump trucks while transporting off-site soil is calculated as
2
soil2
2
2
2
24 actual
DCer32
maxactual
31
32
scHDfuel ×
⎥⎥⎦
⎤
⎢⎢⎣
⎡+⎟⎟
⎠
⎞⎜⎜⎝
⎛+×= (113)
This represents the case where 100% of the daily cover is off-site soil. The fuel consumed by heavy trucks transporting fuel to sites with no daily cover can be calculated as
1
fuel21
1
1
1
16 actual
Dfueler32
maxactual
31
32
scHDfuel ×
×⎥⎥⎦
⎤
⎢⎢⎣
⎡+⎟⎟
⎠
⎞⎜⎜⎝
⎛+×= (114)
The emissions associated with material transport are calculated in section 3.3.1.

3. Life-Cycle Inventory of Landfill Operations
74
3.3.1 Transport Emissions
This section develops equations describing emissions due to transporting materials (soil, fuel, and HDPE) to the site. The required parameters follow.
♦ User Input Parameters:
• CMB_HVY CMB_A_CO2, emission factor for fossil CO2 from heavy trucks (lb CO2-F/gal fuel) (Appendix D)
• CMB_LT CMB_A_CO2, emission factor for fossil CO2 from dump trucks (lb CO2-F/gal fuel) (Appendix D)
• PHDPE1, percent of daily cover that is HDPE (%)
• Pncvr, percentage of the site that receives no daily cover (%)
• Poff, percent of site that uses off-site soil as daily cover (%)
• Prevgen, percent of daily cover that is revenue-generating cover (%)
• Psoil, percent of daily cover that is soil (%)
♦ Calculated Parameters
• fuel3, fuel consumed by heavy trucks while transporting fuel for use at sites with daily cover (gal/ton waste)
• fuel4, fuel consumed by dump trucks while transporting off-site soil (gal/ton waste)
• fuel5, fuel consumed by heavy trucks while transporting HDPE and fuel (gal/ton waste)
• fuel6, fuel consumed by heavy trucks while transporting fuel for use in sites with no daily cover (gal/ton waste)
• O_DT O_A_CO2, fossil CO2 emitted while transporting off-site soil in a dump truck (lb/ton waste)
• O_HVY1 O_A_CO2, fossil CO2 emitted while transporting fuel to operate equipment at a site with offsite soil daily cover (lb/ton waste)
• O_HVY2 O_A_CO2, fossil CO2 emitted while transporting fuel to operate equipment at a site with on-site soil as daily cover (lb/ton waste)
• O_HVY3 O_A_CO2, fossil CO2 emitted while transporting fuel to operate equipment at a site with revenue generating cover (lb/ton waste)
• O_HVY4 O_A_CO2, fossil CO2 emitted while transporting fuel to operate equipment at a site with HDPE as daily cover (lb/ton waste)
• O_HVY5 O_A_CO2, fossil CO2 emitted while transporting fuel to operate equipment at sites with no daily cover (lb/ton waste)
The following is a sample calculation for fossil CO2 emissions made by a heavy truck while transporting fuel and HDPE. Emissions are a function of the total fuel use (gal/ton waste), the percent of HDPE used for daily cover (%), and the emission factor for CO2 and a heavy truck (lb CO2/gal fuel). Since fuel5 (gal/ton waste) represents the case where HDPE is 100% of the daily cover, the fuel must be adjusted by the percent use of HDPE.

3. Life-Cycle Inventory of Landfill Operations
75
( )
100P
CMB_A_CO2 HVY_CMBfuelO_A_CO2 4HVY_O 1HDPE5 ××=
(115)
The fossil CO2 emissions made from a dump truck while transporting off-site soil are calculated in the following equation. Since fuel4 represents the case where 100% of the daily cover is off-site soil, emissions must be reduced by the percent daily cover that is off-site soil.
( )100P
CMB_A_CO2 LT_CMBfuelO_A_CO2 DT_O off4 ××= (116)
The following equation calculates the fossil CO2 emissions made by heavy trucks transporting fuel for use at sites where 100% of the daily cover is comprised of soil or revenue-generating cover. If only a fraction of the site is covered with off-site soil, the emissions are
( )100P
CMB_A_CO2 HVY_CMBfuelO_A_CO2 1HVY_O off3 ××= (117)
If only a fraction of the site is covered with on-site soil, the emissions are
( )100P
CMB_A_CO2 HVY_CMBfuelO_A_CO2 2HVY_O on3 ××= (118)
If only a fraction of the site is covered with revenue-generating cover, the emissions are
( )100
PCMB_A_CO2 HVY_CMBfuelO_A_CO2 3HVY_O revgen
3 ××= (119)
The following equation calculates the CO2 emissions made by heavy trucks while transporting fuel to operate equipment at sites with no daily cover. Since the user may specify that only a fraction of the site does not have daily cover, emissions are calculated as
( )100P
CMB_A_CO2 HVY_CMBfuelO_A_CO2 5HVY_O ncvr6 ××= (120)
3.3.2 Fuel Precombustion Emissions
This section develops equations for modeling fuel precombustion.
♦ User Input Parameters:
• d_pc_em T_F_PC_A_CO2, fossil CO2 emission factor for diesel precombustion (lb CO2-F/gal fuel) (Appendix D)
• fuel1, fuel used at a site with daily cover (gal/ton waste)
• fuel2, fuel used at a site with no daily cover (gal/ton waste)
• Pncvr, percentage of the site that receives no daily cover (%)

3. Life-Cycle Inventory of Landfill Operations
76
♦ Calculated Parameters
• fuel3, fuel consumed by heavy trucks while transporting fuel for use at sites with daily cover (gal/ton waste)
• fuel4, fuel consumed by dump trucks while transporting off-site soil (gal/ton waste)
• fuel5, fuel consumed by heavy trucks while transporting fuel and HDPE (gal/ton waste)
• fuel6, fuel consumed by heavy trucks while transporting fuel for use in sites with no daily cover (gal/ton waste)
• fuel7, total fuel consumed during landfill operations (gal/ton waste)
• O_PC O_A_CO2, fossil CO2 precombustion emissions (lb/ton waste)
The total fuel use for all landfill operations is calculated using an IF statement. If the percent of no cover equals 100, then the total fuel used is fuel2+ fuel6. If the percent of no cover does not equal zero, the total fuel used is fuel1+fuel3+fuel4+fuel5.
( ) ( )( )543162ncvr7 fuelfuelfuelfuel ,fuelfuel,100PIFfuel ++++== (121)
The precombustion emissions are calculated by multiplying this total fuel usage and the emission factor. To illustrate, the CO2 emissions due to diesel fuel precombustion activities are
O2T_F_PC_A_C d_pc_em fuel O_A_CO2 PC_O 7 ×= (122)
3.4 Total Emissions
The total emissions associated with all landfill activities for each inventory flow parameter are calculated by summing emissions from material production, equipment use, material transport, and fuel precombustion. The required calculated parameters follow.
♦ Calculated Parameters:
• O_BCKH O_A_CO2, fossil CO2 emissions from a backhoe (lb/ton waste)
• O_BLLDZR O_A_CO2, fossil CO2 emissions from a bulldozer (lb/ton waste)
• O_CMPCTR O_A_CO2, fossil CO2 emissions from a compactor (lb/ton waste)
• O_DT O_A_CO2, fossil CO2 emitted while transporting off-site soil in a dump truck (lb/ton waste)
• O_GRDR O_A_CO2, fossil CO2 emissions from a grader (lb/ton waste)
• O_HDPE O_A_CO2, fossil CO2 emitted during production of HDPE (lb/ton waste)
• O_HVY1 O_A_CO2, fossil CO2 emitted while transporting fuel to operate equipment at a site with offsite soil daily cover (lb/ton waste)
• O_HVY2 O_A_CO2, fossil CO2 emitted while transporting fuel to operate equipment at a site with on-site soil as daily cover (lb/ton waste)

3. Life-Cycle Inventory of Landfill Operations
77
• O_HVY3 O_A_CO2, fossil CO2 emitted while transporting fuel to operate equipment at a site with revenue generating cover (lb/ton waste)
• O_HVY4 O_A_CO2, fossil CO2 emitted while transporting fuel to operate equipment at a site with HDPE as daily cover (lb/ton waste)
• O_HVY5 O_A_CO2, fossil CO2 emitted while transporting fuel to operate equipment at sites with no daily cover (lb/ton waste)
• O_MSC O_A_CO2, fossil CO2 emissions from miscellaneous equipment (lb/ton waste)
• O_PC O_A_CO2, fossil CO2 precombustion emissions (lb/ton waste)
• O_SCRPR O_A_CO2, fossil CO2 emissions for using a scraper on a site with daily cover (lb/ton waste)
• O_SOIL O_A_CO2, fossil CO2 emissions for obtaining off-site soil (lb/ton waste)
• O_TOTAL O_A_CO2, total CO2 emissions for operations phase (lb/ton waste)
• O_WL O_A_CO2, fossil CO2 emissions from a wheel loader (lb/ton waste)
For example, the total fossil CO2 emissions associated with landfill operations are
⎟⎟⎟⎟⎟⎟⎟⎟⎟⎟⎟⎟⎟⎟⎟⎟⎟⎟⎟⎟⎟⎟⎟⎟
⎠
⎞
⎜⎜⎜⎜⎜⎜⎜⎜⎜⎜⎜⎜⎜⎜⎜⎜⎜⎜⎜⎜⎜⎜⎜⎜
⎝
⎛
++++
++
++
++
++
++
+
=
O_A_CO2 O_PC O_A_CO2 O_HVY5
O_A_CO2 O_HVY4O_A_CO2 O_HVY3O_A_CO2 O_HVY2
O_A_CO2 O_DT O_A_CO2 O_HVY1
O_A_CO2 O_MSCO_A_CO2 O_WL
O_A_CO2 O_GRDR O_A_CO2 O_CMPCTR
O_A_CO2 O_BCKHO_A_CO2 O_BLLDZR
O_A_CO2 O_SCRPR O_A_CO2 O_HDPE
O_A_CO2 O_SOIL
O_A_CO2 TOTAL_O
(123)
3.5 Default Values
Three values are given for each parameter to represent traditional, bioreactor, and ash landfills, respectively.
3.5.1 actual1, weight of the actual payload (contents) of a heavy-duty truck (66,150 lb; 66,150 lb; 66,150 lb)
3.5.2 actual2, weight of the actual payload (contents) of a dump truck (66,150 lb; 66,150 lb; 66,150 lb)
3.5.3 AHDPE, area of HDPE per acre (43,560 ft2/acre; 43,560 ft2/acre; 43,560 ft2/acre)
3. Life-Cycle Inventory of Landfill Operations
78
3.5.4 CMB_HDPE CMB_A_CO2, emission factor for fossil CO2 due to HDPE production (lb CO2-F/lb HDPE) (Appendix D)
3.5.5 CMB_HVY CMB_A_CO2, emission factor for fossil CO2 from heavy trucks (lb CO2-F/gal fuel) (Appendix D)
3.5.6 CMB_LT CMB_A_CO2, emission factor for fossil CO2 from dump trucks (lb CO2-F/gal fuel) (Appendix D)
3.5.7 CMB_SCRPR CMB_A_CO2, emission factor for fossil CO2 from a scraper (lb CO2-F/gal fuel) (Appendix D)
3.5.8 CMB_SOIL CMB_A_CO2, emission factor for fossil CO2 due to obtaining off-site soil (lb CO2-F/gal fuel) (Appendix D)
3.5.9 CMB_WL CMB_A_CO2, emission factor for fossil CO2 from a wheel loader (lb CO2-F/gal fuel) (Appendix D)
3.5.10 Dfuel, density of diesel fuel (7.04 lb/gal, 7.04 lb/gal, 7.04 lb/gal)
3.5.11 DHDPE, density of HDPE used for daily cover (59.6 lb/ft3, 59.6 lb/ft3, 59.6 lb/ft3)
3.5.12 Dmsw, average density of waste after burial (1,500 lb/yd3; 1,500 lb/yd3; 2,500 lb/yd3)
3.5.13 Dsoil, density of the off-site soil (115 lb/ft3, 115 lb/ft3, 115 lb/ft3)
3.5.14 er1, return of heavy-duty truck (empty return: YES[1] or NO[0], or any fraction between these two numbers) (1,1,1)
3.5.15 er2, return of dump truck (empty return: YES[1] or NO[0], or any fraction between these two numbers) (1,1,1)
3.5.16 fuel1, fuel used at a site with daily cover (0.28 gal/ton waste, 0.28 gal/ton waste, 0.28 gal/ton waste)
3.5.17 fuel2, fuel used at a site with no daily cover (0.19 gal/ton waste, 0.19 gal/ton waste, 0.19 gal/ton waste)
3.5.18 HD1, one-way distance fuel is transported to the landfill (50 mi, 50 mi, 50 mi)
3.5.19 HD2, one-way distance off-site soil for daily cover is transported to the landfill (10 mi, 10 mi, 10 mi)
3.5.20 HD3, one-way distance HDPE is transported to the landfill (250 mi, 250 mi, 250 mi)
3.5.21 max1, weight of the maximum payload of the heavy-duty truck (66,150 lb; 66,150 lb; 66,150 lb)
3.5.22 max2, weight of the maximum payload of the dump truck (39,690 lb; 39,690 lb; 39,690 lb)
3.5.23 Mwl, expected mass flow (1,350 ton/day; 1,350 ton/day; 1,350 ton/day)

3. Life-Cycle Inventory of Landfill Operations
79
3.5.24 Ny, expected useful life of landfill (20 years, 20 years, 20 years)
3.5.25 Pcvr1, percent of total landfill volume occupied by cover (10%, 10%, 0%)
3.5.26 PHDPE1, percent of daily cover that is HDPE (15%, 15%, 0%)
3.5.27 Pncvr, percentage of the site that receives no daily cover (0%, 0%, 100%)
3.5.28 Poff, percent of site that uses off-site soil as daily cover (%) (10%, 10%, 10%)
3.5.29 Prevgen, percent of daily cover that is revenue-generating cover (15%, 15%, 0%)
3.5.30 Psoil, percent of daily cover that is soil (70%, 70%, 0%)
3.5.31 sc1, specific consumption for a heavy-duty truck (6.4 mpg, 6.4 mpg, 6.4 mpg)
Specific consumption is the fuel economy of the truck (based on truck operating at maximum capacity).
3.5.32 sc2, specific consumption for a dump truck (6.4 mpg, 6.4 mpg, 6.4 mpg)
Specific consumption is the fuel economy of the truck (based on truck operating at maximum capacity).
3.5.33 scrprcvr, percentage of fuel used by the scraper (4%, 4%, 4%)
3.5.34 THDPE, thickness of the HDPE used for daily cover (15 mils, 15 mils, 0 mils)
3.5.35 wlcvr, percentage of the fuel used by a wheel loader at a site with no daily cover (0.5%, 0.5%, 0.5%)
3.5.36 wlncvr, percentage of the fuel used by a wheel loader at a site with no daily cover (16%, 16%, 16%)

81
4. Life-Cycle Inventory of Landfill Closure
Once refuse has reached the final design grade, a final cover is applied. In this LCI model, the user has the flexibility of selecting a final cover consisting of one or several layers of geotextile, HDPE, sand, soil, and clay. As the decomposition of the waste generates methane and carbon dioxide, a gas collection and monitoring system consisting of HDPE and PVC pipe controls landfill gas migration. Although the gas system is discussed under closure, it is recognized that the system is often installed over time during landfill operation. In addition to final cover materials, fuel is required to operate equipment for placement of the final cover. The user can adjust the percent use of scrapers, bulldozers, backhoes, wheel loaders, drum rollers, water trucks, pick-ups, and tractors to apply final cover. Furthermore, heavy trucks and dump trucks consume fuel while transporting material and fuel to the site.
Contrary to other solid waste unit operations, which generally have instantaneous emissions, landfill emissions occur over time. The life-cycle emissions for landfill operations were assumed to occur at year 0 during waste placement. However, the life-cycle emissions for landfill closure do not occur at the same time as waste placement. It could be some years after waste placement before a final cover is applied to the site. It is assumed that the average ton of waste is placed halfway through the life of the cell. Therefore, closure emissions occur at half of the landfill operating life. This issue is discussed in detail in section 4.4.
4.1 Materials Consumption
4.1.1 Final Cover
This section models the consumption of final cover materials. To begin, the user specifies the cross section of the final cover, including the material and thickness of each layer. The potential layers available to the user and their default thickness are presented in Figure 9 in section 2.4.2. The user may specify an alternate cover design by changing the default values for material thickness. The mass of material consumed (lb/ton waste) for the production of the landfill final cover is then calculated as follows:
1. The thickness of each material (tsoil, tclay, tsand1, tsand2, tHDPE2, and tgtx) is converted to a volume based on the area of the final cover (Atl). The area of the top of the final cover is calculated in equation 57, section 2.4.2.
2. The material volume is then multiplied by its density to obtain the weight of final cover material used.
3. The weight of the material is divided by the total volume of waste placed (Vw) to give the pounds of material used per volume of waste. The total waste volume is calculated in equation 2, section 2.1.1.
4. The pounds of material per volume of waste are divided by the waste density to yield the pounds of material per pound of waste. A conversion factor is then used to obtain the pounds of material per ton waste.
The required parameters follow.
♦ User Input Parameters:
• dgtx, density of geotextile (lb/ft3)

4. Life-Cycle Inventory of Landfill Closure
82
• DHDPE, density of HDPE used for daily cover (lb/ft3)
• Dmsw, average density of waste after burial (lb/yd3)
• dsand, density of sand (lb/ft3)
• dsoil, density of soil layer (lb/ft3)
• tclay, thickness of clay layer (ft)
• tgtx, thickness of geotextile (mils)
• tHDPE2, thickness of HDPE (mils)
• tsand1, thickness of the first sand layer in final cover (ft)
• tsand2, thickness of second sand layer in final cover (ft)
• tsoil, depth of top soil and vegetation support soil (ft)
♦ Calculated Parameters:
• Atl, area of top of final cover (ft2)
• cvrclay, amount of clay in final cover (lb/ton waste)
• cvrgtx, amount of geotextile in final cover (lb/ton waste)
• cvrHDPE, amount of HDPE in final cover (lb/ton waste)
• cvrsand, amount of sand in final cover (lb/ton waste)
• cvrsoil, amount of soil in final cover (lb/ton waste)
• Vw, required landfill capacity for waste (yd3)
The total amount of soil, clay, sand, HDPE, and geotextile in the final cover is calculated in equations 124–128 by following the steps outlined above.
⎟⎠⎞⎜
⎝⎛×××××= waste ton
lb 2000
mswwsoiltlsoilsoil D
1V1dAtcvr (124)
⎟⎠⎞⎜
⎝⎛×××××= astew ton
lb 2000
mswwsoiltlclayclay D
1V1dAtcvr (125)
( ) ⎟⎠⎞⎜
⎝⎛×××××+= astew ton
lb 2000
mswwsandtl2sand1sandsand D
1V1dAttcvr (126)
⎟⎠⎞⎜
⎝⎛×××××= × waste ton
lb 2000mils
ft000083.0
mswwHDPEtl2HDPEHDPE D
1V1dAtcvr (127)
⎟⎠⎞⎜
⎝⎛×××××= × astew ton
lb 2000mils
ft000083.0
mswwgtxtlgtxgtx D
1V1dAtcvr (128)

4. Life-Cycle Inventory of Landfill Closure
83
4.1.2 Gas Collection System
The piping for the gas collection system is usually made of either PVC or HDPE, and a site will normally use one or the other. However, for this landfill LCI model, two types of pipes are combined to represent a generic landfill. Based on a survey of landfill sites, the average HDPE and PVC consumption rates are 0.016 and 0.0081 lb/ton MSW, respectively [Environmental Research and Education Foundation, 1997]. Recall that this is within the same order of magnitude as the reality check performed in section 2.4.1. The default value assumes no gas collection for a landfill receiving ash.
4.1.3 Gas Monitoring System
The quantity of materials used for the gas monitoring system is based on a survey of landfill sites [Environmental Research and Education Foundation, 1997]. No sites with a gas monitoring system reported using HDPE for the gas vent wells. Based on the feedback, the amount of PVC used in the gas monitoring systems is 7.3 × 10⁻⁵ lb/ton MSW. This value is assumed to be zero for an ash landfill.
4.1.4 Emissions Due to Consumption of Resources
The objective of this section is to calculate emissions due to material consumption. The emissions due to production of soil, sand, HDPE, geotextile, and PVC are a function of the amount of material used (lb/ton waste) and the emission factor (lb emission/lb cover). Emission factors are presented in Appendix D. In this section, equations are presented for the inventory-flow-parameter fossil CO2. In the model, emissions are calculated for each of the LCI parameters. Required parameters follow.
♦ User Input Parameters:
• CMB_GTX CMB_A_CO2, emission factor for fossil CO2 due to geotextile production (lb CO2-F/lb geotextile) (Appendix D)
• CMB_HDPE CMB_A_CO2, emission factor for fossil CO2 due to HDPE production (lb CO2-F/lb HDPE) (Appendix D)
• CMB_PVC CMB_A_CO2, emission factor for fossil CO2 due to PVC production (lb CO2-F/lb PVC) (Appendix D)
• CMB_SAND CMB_A_CO2, emission factor for fossil CO2 due to sand production (lb CO2-F/lb sand) (Appendix D)
• CMB_SOIL CMB_A_CO2, emission factor for fossil CO2 due to off-site soil production (lb CO2-F/lb soil) (Appendix D)
• GCHDPE, amount of HDPE in gas collection system (lb/ton waste)
• GCPVC, amount of PVC in gas collection system (lb/ton waste)
• GMPVC, amount of PVC in gas monitoring system (lb/ton waste)

4. Life-Cycle Inventory of Landfill Closure
84
♦ Calculated Parameters:
• CLSR_GTX CLSR_A_CO2, fossil CO2 emitted due to geotextile production (lb/ton waste)
• CLSR_HDPE CLSR_A_CO2, fossil CO2 emitted due to HDPE production (lb/ton waste)
• CLSR_PVC CLSR_A_CO2, fossil CO2 emitted due to PVC production (lb/ton waste)
• CLSR_SOIL CLSR_A_CO2, fossil CO2 emitted while obtaining soil for final cover (lb/ton waste)
• CLSR_SAND CLSR_A_CO2, fossil CO2 emitted while obtaining sand for final cover (lb/ton waste)
• cvrclay, amount of clay in final cover (lb/ton waste)
• cvrgtx, amount of geotextile in final cover (lb/ton waste)
• cvrHDPE, amount of HDPE in final cover (lb/ton waste)
• cvrsand, amount of sand in final cover (lb/ton waste)
• cvrsc, amount of soil and clay in final cover (lb/ton waste)
• cvrsoil, amount of soil in final cover (lb/ton waste)
It is assumed that production or extraction of the different types of soil and clay will have similar emissions. Therefore, the total soil used in final cover is calculated as
claysoilsc cvrcvrcvr += (129)
The fossil CO2 emissions due to soil and clay production (lb CO2/ton waste) are calculated by multiplying the total soil used (lb soil/ton waste) and the emission factor (lb CO2/lb soil).
2CO_A_CMB CMB_SOIL cvrCLSR_A_CO2 SOIL_CLSR sc ×= (130)
The fossil CO2 emissions due to sand, HDPE, geotextile, and PVC production are similarly calculated in equations 131–134, respectively.
2CO_A_CMB CMB_SANDcvrCLSR_A_CO2 SAND_CLSR sand ×= (131)
( ) CO2_A_CMB HDPE_CMBGCcvrCLSR_A_CO2 HDPE_CLSR HDPEHDPE ×+= (132)
2CO_A_CMB CMB_GTX cvrCLSR_A_CO2 GTX_CLSR gtx ×= (133)
( ) 2CO_A_CMB CMB_PVCGMGCCLSR_A_CO2 PVC_CLSR PVCPVC ×+= (134)
4.2 Equipment Use
In the closure phase of a modern landfill, heavy equipment is required to place the final cover. Information obtained from a landfill survey [Environmental Research and Education Foundation, 1998] was used to determine the total fuel consumption and percent fuel usage of each equipment type. The value for total fuel consumption is 0.016 gal/ton MSW. This value is based on the fuel consumed per hour, on the hours of equipment use and on the

4. Life-Cycle Inventory of Landfill Closure
85
total amount of waste placed in the landfill operating unit. Fuel is consumed by a user-specified combination of the following equipment: scraper, bulldozer, backhoe, wheel loader, drum roller, water truck, pick-up, and tractor. Based on information obtained from the survey, the breakdown of fuel usage by landfill closure equipment is given in Table 14.
Table 14: Breakdown of Equipment Use for Landfill Closure
Daily Cover Equipment % of Total Fuel Use
Scraper 54
Bulldozer 24
Backhoe 1
Wheel loader 7
Drum roller 2
Water truck 4
Pick-up 6
Tractor/Disk 2
Total: 100
Table 14 represents the equipment used at an average site, and therefore the user can customize the fuel and equipment use to represent specific landfills.
4.2.1 Emissions Due to Equipment Use
This section models emissions associated with fuel use in heavy equipment. Emissions are a function of the percent equipment use, fuel usage, and the emission factor.
♦ User Input Parameters:
• CMB_SCRPR CMB_A_CO2, emission factor for fossil CO2 from a scraper (lb CO2-F/gal fuel) (Appendix D)
• fuel8, fuel used by heavy equipment during closure activities (gal/ton waste)
• scrpr, percentage of fuel used by the scraper (%)
♦ Calculated Parameters:
• CLSR_SCRPR CLSR_A_CO2, fossil CO2 emissions from a scraper (lb/ton waste)
To illustrate, fossil CO2 emissions from fuel combustion in a scraper are calculated by multiplying percent equipment use (scrpr), fuel usage (fuel8), and the emission factor (CMB_A_CO2 CMB_SCRPR).
8fuelCMB_A_CO2 SCRPR_CMB100scrpr
CLSR_A_CO2 SCRPR_CLSR ××= (135)

4. Life-Cycle Inventory of Landfill Closure
86
Emissions from a bulldozer, backhoe, wheel loader, drum roller, water truck, pick-up, and tractor are calculated in the same manner by using the appropriate percent equipment use and emission factor.
4.3 Fuel Consumed During Material Transport
Dump trucks and heavy trucks are used to transport cover materials and fuel to the site. Tables 15 and 16 summarize the material transported, haul distance, and type of truck used.
Table 15: Transport of Soil to Site During Landfill Closure
Material Distance Transported (mi) Truck Type
Soil and clay 1 Dump truck
Sand 1 Dump truck
Table 16: Transport of Other Materials to Site During Landfill Closure
Material Distance Transported (mi) Truck Type
Geotextiles 250 Heavy-duty truck
HDPE (used in cover) 250 Heavy-duty truck
HDPE (pipe) 250 Heavy-duty truck
Fuel 50 Heavy-duty truck
PVC 250 Heavy-duty truck
♦ User Input Parameters:
• actual3, weight of the actual payload (contents) of the heavy-duty truck (lb)
• actual4, weight of the actual payload (contents) of the dump truck (lb)
• Dfuel, density of diesel fuel (lb/gal)
• er3, return of heavy duty truck for transport of materials during landfill closure (empty return: YES[1] or NO[0], or any fraction between these two numbers)
• er4, return of dump truck for transport of materials during landfill closure (empty return: YES[1] or NO[0], or any fraction between these two numbers)
• fuel8, fuel used by heavy equipment during closure activities (gal/ton waste)
• GCHDPE, amount of HDPE in gas collection system (lb/ton waste)
• GCPVC, amount of PVC in gas collection system (lb/ton waste)
• GMPVC, amount of PVC in gas monitoring system (lb/ton waste)
• hd10, distance to haul fuel (mi)

4. Life-Cycle Inventory of Landfill Closure
87
• hd11, distance to haul PVC (mi)
• hd5, distance to haul clay and soil (mi)
• hd6, distance to haul sand (mi)
• hd7, distance to haul geotextile for cover (mi)
• hd8, distance to haul HDPE for cover (mi)
• hd9, distance to haul HDPE pipe (mi)
• max3, weight of the maximum payload (contents) of the heavy truck (lb)
• max4, weight of the maximum payload (contents) of the dump truck (lb)
• sc3, specific consumption for a heavy truck (mpg)
• sc4, specific consumption for a dump truck (mpg)
♦ Calculated Parameters:
• cvrgtx, amount of geotextile in final cover (lb/ton waste)
• cvrHDPE, amount of HDPE in final cover (lb/ton waste)
• cvrsand, amount of sand in final cover (lb/ton waste)
• cvrsc, amount of soil and clay in final cover (lb/ton waste)
• fuel10, fuel consumed by heavy trucks (gal/ton waste)
• fuel9, fuel consumed by dump trucks while transporting sand, soil and clay for final cover (gal/ton waste)
• hd12, weighted haul distance in dump truck (mi)
• hd13, weighted haul distance in heavy truck (mi)
• pclay, percent of dump truck load consisting of clay (%)
• pfuel, percent of heavy truck load consisting of fuel (%)
• pgtx, percent of heavy truck load consisting of geotextile (%)
• pHDPE2, percent of heavy truck load consisting of HDPE cover (%)
• pHDPE3, percent of heavy truck load consisting of HDPE pipe (%)
• pPVC, percent of dump truck load consisting of PVC (%)
• psand, percent of dump truck load consisting of sand (%)
Based on the assumption that two-thirds of a truck's fuel consumption is independent of the truck's load, the fuel consumption for the transportation of a given amount of material is
Load Actual
WeightxReturnEmpty 32
Load MaximumLoad Actual
31
32x
noiConsumpt SpecificDistanceFuel ⎟
⎟⎠
⎞⎜⎜⎝
⎛+⎥
⎦
⎤⎢⎣
⎡+= (136)

4. Life-Cycle Inventory of Landfill Closure
88
where
Actual Load = actual payload of the truck (lb)
Distance = one way distance that a specific quantity of material is transported (mi)
Empty Return = return of the truck (empty return: YES[1] or NO[0], or any fraction between these two numbers)
Maximum Load = maximum payload of the truck (lb)
Specific Consumption = fuel economy of the truck (mpg)
Weight = weight of the material (lb)
Fuel = fuel consumed (gal/ton waste)
Rather than calculating the fuel used to transport individual materials, the fuel used to transport a combination of materials is calculated. To do this, the fuel consumed by a dump truck carrying soil and sand as well as the fuel consumed by a heavy truck carrying HDPE, geotextile, and PVC is calculated. This is done to simplify the model and to minimize the use of equation 136. To determine a single fuel use for each truck type, the weighted distance traveled by the dump truck and heavy truck is calculated. The weighted haul distance is a function of the haul distance for each material carried in the truck and the percent each material contributes to the truck’s total load. For example, a dump truck transports soil, clay, and sand. Equation 137 calculates the percentage of soil and clay in the dump truck’s load.
100cvrcvr
cvrp
sandsc
scclay ×⎟⎟
⎠
⎞⎜⎜⎝
⎛+
= (137)
Equation 138 calculates the percentage of sand in the total load carried by the dump truck.
100cvrcvr
cvrp
sandsc
sandsand ×⎟⎟
⎠
⎞⎜⎜⎝
⎛+
= (138)
The weighted average haul distance for the dump truck is a function of the haul distance of each material and its percentage of the truck’s total load. The haul distance for a dump truck is calculated as
⎟⎠⎞
⎜⎝⎛ ×+⎟⎟
⎠
⎞⎜⎜⎝
⎛×=
100phd
100p
hdhd sand6
clay512 (139)
Based on equation 136, the fuel consumed by dump trucks while transporting soil, clay and sand is
4
sandsc4
4
4
4
129 actual
cvrcvrer32
maxactual
31
32
schdfuel +
×⎥⎥⎦
⎤
⎢⎢⎣
⎡+⎟⎟
⎠
⎞⎜⎜⎝
⎛+×= (140)

4. Life-Cycle Inventory of Landfill Closure
89
The calculations are repeated for a heavy truck transporting fuel, HDPE, geotextile, and PVC. The percentage that fuel, HDPE cover, HDPE pipe, geotextile, and PVC contribute to the total weight of the heavy truck’s load is calculated in equations 141–146, respectively.
( ) ( ) 100GMGCGCcvrcvr Dfuel
Dfuelp
PVCPVCHDPEgtxHDPEfuel8
fuel8fuel ×⎟
⎟⎠
⎞⎜⎜⎝
⎛
+++++××
= (141)
( ) ( ) 100GMGCGCcvrcvr Dfuel
cvrp
PVCPVCHDPEgtxHDPEfuel8
HDPE2HDPE ×⎟
⎟⎠
⎞⎜⎜⎝
⎛
+++++×= (142)
( ) ( ) 100GMGCGCcvrcvr Dfuel
GCp
PVCPVCHDPEgtxHDPEfuel8
HDPE3HDPE ×⎟
⎟⎠
⎞⎜⎜⎝
⎛
+++++×= (143)
( ) ( ) 100GMGCGCcvrcvr Dfuel
cvrp
PVCPVCHDPEgtxHDPEfuel8
gtxgtx ×⎟
⎟⎠
⎞⎜⎜⎝
⎛
+++++×= (145)
( ) ( ) 100GMGCGCcvrcvr Dfuel
GCp
PVCPVCHDPEgtxHDPEfuel8
PVCPVC ×⎟
⎟⎠
⎞⎜⎜⎝
⎛
+++++×= (146)
The weighted average haul distance for the heavy truck is a function of the haul distance of each material and its percentage of the material load. The haul distance for a heavy truck is calculated as
⎟⎠⎞
⎜⎝⎛ ×+⎟
⎠⎞
⎜⎝⎛ ×+⎟⎟
⎠
⎞⎜⎜⎝
⎛×+⎟
⎠⎞
⎜⎝⎛ ×+⎟
⎠⎞
⎜⎝⎛ ×=
100phd
100phd
100p
hd100
phd100phdhd PVC
113HDPE
9gtx
72HDPE
8fuel
1013 (147)
The fuel consumed by heavy trucks while transporting fuel, HDPE, geotextile, and PVC is calculated by using equation 136.
( )
3
PVCHDPEgtxHDPEfuel83
3
3
3
1310 actual
GCGCcvrcvrDfueler
32
maxactual
31
32
schdfuel
++++××⎥⎥⎦
⎤
⎢⎢⎣
⎡+⎟⎟
⎠
⎞⎜⎜⎝
⎛+×= (148)
4.3.1 Transport Emissions
This section presents equations describing emissions due to transporting materials (soil, HDPE, geotextile, PVC and fuel) to the site. Required parameters follow.
♦ User Input Parameters:
• CMB_HVY CMB_A_CO2, emission factor for fossil CO2 from heavy trucks (lb CO2-F/gal fuel) (Appendix D)
• CMB_LT CMB_A_CO2, emission factor for fossil CO2 from dump trucks (lb CO2-F/gal fuel) (Appendix D)
♦ Calculated Parameters:

4. Life-Cycle Inventory of Landfill Closure
90
• CLSR_DT CLSR_A_CO2, CO2 emissions from dump truck (lb/ton waste)
• CLSR_HT CLSR_A_CO2, CO2 emissions from heavy truck (lb/ton waste)
• fuel10, fuel consumed by heavy trucks (gal/ton waste)
• fuel9, fuel consumed by dump trucks while transporting sand, soil and clay for final cover (gal/ton waste)
The fossil CO2 emissions for a heavy truck are a function of the fuel consumed and the emission factor.
( )2CO_A_CMB CMB_HVYfuel CLSR_A_CO2 HT_CLSR 10 ×= (149)
The fossil CO2 emissions for a dump truck are calculated in the same manner.
( )2CO_A_CMB CMB_LTfuel CLSR_A_CO2 DT_CLSR 9 ×= (150)
4.3.2 Fuel Precombustion Emissions
This section develops equations for modeling fuel precombustion. Required parameters follow.
♦ User Input Parameters:
• fuel8, fuel used by heavy equipment during closure activities (gal/ton waste)
• T_F_PC_A_CO2 d_pc_em, diesel fuel precombustion emission factor (lb CO2/ gal fuel)
♦ Calculated Parameters:
• fuel10, fuel consumed by heavy trucks (gal/ton waste)
• fuel9, fuel consumed by dump trucks while transporting sand, soil and clay for final cover (gal/ton waste)
• fuel11, total fuel consumed by during closure activities (gal/ton waste)
• CLSR_PC CLSR_A_CO2, fossil CO2 precombustion emissions (lb/ton waste)
The total fuel consumed during closure activities is calculated as
109811 fuelfuelfuelfuel ++= (151)
The precombustion emissions are calculated by multiplying total fuel usage and the precombustion emission factor. To illustrate, the fossil CO2 precombustion emissions are
( )d_pc_em 2CO_A_PC_F_Tfuel CLSR_A_CO2 PC_CLSR 11 ×= (152)

4. Life-Cycle Inventory of Landfill Closure
91
4.4 Total Emissions
This section calculates total emissions due to closure activities. Required calculated parameters follow.
♦ Calculated Parameters:
• CLSR_BCKH CLSR_A_CO2, fossil CO2 emissions from a backhoe (lb/ton waste)
• CLSR_DR CLSR_A_CO2, fossil CO2 emissions from a drum roller (lb/ton waste)
• CLSR_DT CLSR_A_CO2, fossil CO2 emissions from a dump truck (lb/ton waste)
• CLSR_GTX CLSR_A_CO2, fossil CO2 emitted due to geotextile production (lb/ton waste)
• CLSR_HDPE CLSR_A_CO2, fossil CO2 emitted due to HDPE production (lb/ton waste)
• CLSR_HT CLSR_A_CO2, fossil CO2 emissions from a heavy truck (lb/ton waste)
• CLSR_PC CLSR_A_CO2, fossil CO2 precombustion emissions (lb/ton waste)
• CLSR_PU CLSR_A_CO2, fossil CO2 emissions from a pick-up (lb/ton waste)
• CLSR_PVC CLSR_A_CO2, fossil CO2 emitted due to PVC production (lb/ton waste)
• CLSR_SAND CLSR_A_CO2, fossil CO2 emitted while obtaining sand for final cover (lb/ton waste)
• CLSR_SCRPR CLSR_A_CO2, fossil CO2 emissions from a scraper (lb/ton waste)
• CLSR_SOIL CLSR_A_CO2, fossil CO2 emitted while obtaining soil for final cover (lb/ton waste)
• CLSR_TD CLSR_A_CO2, fossil CO2 emissions from a tractor (lb/ton waste)
• CLSR_WL CLSR_A_CO2, fossil CO2 emissions from a wheel loader (lb/ton waste)
• CLSR_WT CLSR_A_CO2, fossil CO2 emissions from a water truck (lb/ton waste)
The LCI can be calculated for three different time frames (20, 100, and 500 years), and closure emissions are reported halfway through the life of the landfill. Therefore, when using the default landfill life of 20 years, closure emissions occur, on average, 10 years after waste placement. Or, if the user chooses a landfill lifetime of 50 years, life-cycle emissions for landfill closure would occur 25 years after waste placement. For this landfill lifetime, closure emissions would be reported for the 100- and 500-year time horizons.
The total emissions for landfill closure are calculated using an IF statement. If the time frame selected (20, 100, or 500 years) is greater than half of the landfill life, emissions for each inventory flow parameter are calculated by summing emissions from material production, equipment use, material transport, and fuel precombustion. If the time horizon selected is less than half of the landfill life, closure emissions occurring during that time horizon are zero. To illustrate, total emissions for the inventory-flow-parameter fossil CO2 are calculated in this equation:

4. Life-Cycle Inventory of Landfill Closure
92
(153)
4.5 Default Values
Three values are given for each parameter to represent traditional, bioreactor and ash landfills, respectively.
4.5.1 actual3, weight of the actual payload (contents) of the heavy-duty truck (66,150 lb; 66,150 lb; 66,150 lb)
4.5.2 actual4, weight of the actual payload (contents) of the dump truck (39,690 lb; 39,690 lb; 39,690 lb)
4.5.3 CMB_GTX CMB_A_CO2, emission factor for fossil CO2 due to geotextile production (lb CO2-F/lb geotextile) (Appendix D)
4.5.4 CMB_HDPE CMB_A_CO2, emission factor for fossil CO2 due to HDPE production (lb CO2-F/lb HDPE) (Appendix D)
4.5.5 CMB_HVY CMB_A_CO2, emission factor for fossil CO2 from heavy trucks (lb CO2-F/gal fuel) (Appendix D)
4.5.6 CMB_LT CMB_A_CO2, emission factor for fossil CO2 from dump trucks (lb CO2-F/gal fuel) (Appendix D)
4.5.7 CMB_PVC CMB_A_CO2, emission factor for fossil CO2 due to PVC production (lb CO2-F/lb PVC) (Appendix D)
4.5.8 CMB_SAND CMB_A_CO2, emission factor for fossil CO2 due to sand production (lb CO2-F/lb sand) (Appendix D)
0,
CLSR_A_CO2 CLSR_PCCLSR_A_CO2 CLSR_HTCLSR_A_CO2 DT_CLSR
2CO_A_CLSR SCRPR_CLSRCLSR_A_CO2 CLSR_TDCLSR_A_CO2 CLSR_PUCLSR_A_CO2 CLSR_WTCLSR_A_CO2 CLSR_DR
CLSR_A_CO2 WL_CLSRCLSR_A_CO2 BCKH_CLSR
CLSR_A_CO2 CLSR_PVCCLSR_A_CO2 CLSR_GTX
CLSR_A_CO2 CLSR_HDPECLSR_A_CO2 CLSR_SANDCLSR_A_CO2 SOIL_CLSR
,2
NtimeIFCLSR_A_CO2 TOTAL_CLSR y
⎟⎟⎟⎟⎟⎟⎟⎟⎟⎟⎟⎟⎟⎟⎟⎟⎟⎟⎟⎟⎟⎟
⎠
⎞
⎜⎜⎜⎜⎜⎜⎜⎜⎜⎜⎜⎜⎜⎜⎜⎜⎜⎜⎜⎜⎜⎜
⎝
⎛
⎟⎟⎟⎟⎟⎟⎟⎟⎟⎟⎟⎟⎟⎟⎟⎟⎟⎟⎟⎟⎟⎟
⎠
⎞
⎜⎜⎜⎜⎜⎜⎜⎜⎜⎜⎜⎜⎜⎜⎜⎜⎜⎜⎜⎜⎜⎜
⎝
⎛
++
++++++
++++++
≥=

4. Life-Cycle Inventory of Landfill Closure
93
4.5.9 CMB_SCRPR CMB_A_CO2, emission factor for fossil CO2 from a scraper (lb CO2-F/gal fuel) (Appendix D)
4.5.10 CMB_SOIL CMB_A_CO2, emission factor for fossil CO2 due to off-site soil production (lb CO2-F/lb soil) (Appendix D)
4.5.11 Dfuel, density of diesel fuel (7.04 lb/gal, 7.04 lb/gal, 7.04 lb/gal)
4.5.12 dgtx, density of geotextile (5.90 lb/ft3, 5.90 lb/ft3, 5.90 lb/ft3)
4.5.13 DHDPE, density of HDPE used for daily cover (59.6 lb/ft3, 59.6 lb/ft3, 59.6 lb/ft3)
4.5.14 Dmsw, average density of waste after burial (1,500 lb/yd3; 1,500 lb/yd3; 3,500 lb/yd3)
4.5.15 dsand, density of sand (97.5 lb/ft3, 97.5 lb/ft3, 97.5 lb/ft3)
4.5.16 dsoil, density of soil layer (115 lb/ft3, 115 lb/ft3, 115 lb/ft3)
4.5.17 er3, return of heavy duty truck for transport of materials during landfill closure (empty return: YES[1] or NO[0], or any fraction between these two numbers) (1,1,1)
4.5.18 er4, return of dump truck for transport of materials during landfill closure (empty return: YES[1] or NO[0], or any fraction between these two numbers) (1,1,1)
4.5.19 fuel8, fuel used by heavy equipment during closure activities (1.60 × 10⁻² gal/ton waste, 1.60 × 10⁻² gal/ton waste, 1.60 × 10⁻² gal/ton waste)
4.5.20 GCHDPE, amount of HDPE in gas collection system (1.6 × 10⁻² lb/ton waste, 1.6 × 10⁻² lb/ton waste, 0 lb/ton waste)
4.5.21 GCPVC, amount of PVC in gas collection system (8.1 × 10⁻³ lb/ton waste, 8.1 × 10⁻³ lb/ton waste, 0 lb/ton waste)
4.5.22 GMPVC, amount of PVC in gas monitoring system (7.3 × 10⁻⁵ lb/ton waste, 7.3 × 10⁻⁵ lb/ton waste, 0 lb/ton waste)
4.5.23 hd10, distance to haul fuel (50 mi, 50 mi, 50 mi)
4.5.24 hd11, distance to haul PVC (250 mi, 250 mi, 250 mi)
4.5.25 hd5, distance to haul clay and soil (1 mi, 1 mi, 1 mi)
4.5.26 hd6, distance to haul sand (1 mi, 1 mi, 1 mi)
4.5.27 hd7, distance to haul geotextile for cover (250 mi, 250 mi, 250 mi)
4.5.28 hd8, distance to haul HDPE for cover (250 mi, 250 mi, 250 mi)

4. Life-Cycle Inventory of Landfill Closure
94
4.5.29 hd9, distance to haul HDPE pipe (250 mi, 250 mi, 250 mi)
4.5.30 max3, weight of the maximum payload (contents) of the heavy truck (66,150 lb; 66,150 lb; 66,150 lb)
4.5.31 max4, weight of the maximum payload (contents) of the dump truck (39,690 lb; 39,690 lb; 39,690 lb)
4.5.32 sc3, specific consumption for a heavy truck (6.4 mpg, 6.4 mpg, 6.4 mpg)
4.5.33 sc4, specific consumption for a dump truck (6.4 mpg, 6.4 mpg, 6.4 mpg)
4.5.34 scrpr, percentage of fuel used by the scraper (54%, 54%, 54%)
4.5.35 T_F_PC_A_CO2 d_pc_em, diesel fuel precombustion emission factor (lb CO2/gal fuel) (Appendix D)
4.5.36 tclay, thickness of clay layer (2 ft, 2 ft, 2 ft)
4.5.37 tgtx, thickness of geotextile (140 mils, 140 mils, 140 mils)
4.5.38 tHDPE2, thickness of HDPE (60 mils, 60 mils, 60 mils)
4.5.39 tsand1, thickness of the first sand layer in final cover (1 ft, 1 ft, 1 ft)
4.5.40 tsand2, thickness of second sand layer in final cover (1 ft, 1 ft, 1 ft)
4.5.41 tsoil, depth of top soil and vegetation support soil (3 ft, 3 ft, 3 ft)

95
5. Life-Cycle Inventory of Landfill Post-Closure
Once a final cover has been installed, the post-closure period begins. Post-closure activities include repairing final cover and inspecting of the leachate and gas collection systems. Soil, clay, sand, HDPE, geotextile, and fuel are potentially consumed while repairing the final cover. In addition, fuel is consumed by trucks while transporting material to the site and by vehicles during inspection and maintenance visits. In the model, the user has the flexibility of choosing the length of the post-closure period and the percent of cover to be replaced. In the default case, 10% of the cover is replaced over a 30-year post-closure period.
The life-cycle emissions for landfill post-closure begin after the final cover is placed. As discussed in section 4, the average ton of waste is placed halfway through the life of the landfill cell. Therefore, a final cover is applied and landfill post-closure activities also begin halfway through the landfill life.
5.1 Materials Consumption
Ten percent of the final cover is assumed to be replaced over 30 years. Thus, 10% of the soil, sand, clay, HDPE, and geotextile used during the closure phase is replaced during the post-closure period.
5.1.1 Emissions Due to Material Consumption
The objective of this section is to calculate emissions due to material consumption. Annual emissions associated with material consumption over 30 years are calculated by multiplying total closure emissions by the fraction of the cover replaced and dividing by the length of the post-closure period. The emissions due to production of clay, soil, sand, HDPE, and geotextile are a function of the amount of material used (lb material/ton waste), the emission factor (lb emission/lb material), the length of the post-closure period (years), and the percent of final cover to be replace (%). Emission factors are presented in Appendix D. In this section, equations are presented for the inventory-flow-parameter fossil CO2. In the model, emissions are calculated for each of the LCI parameters.
The required parameters follow. (Units of measure are in parentheses.)
♦ User Input Parameters:
• CMB_GTX CMB_A_CO2, emission factor for fossil CO2 due to geotextile production (lb CO2-F/lb geotextile) (Appendix D)
• CMB_HDPE CMB_A_CO2, emission factor for fossil CO2 due to HDPE production (lb CO2-F/lb HDPE) (Appendix D)
• CMB_SAND CMB_A_CO2, emission factor for fossil CO2 due to sand production (lb CO2-F/lb sand) (Appendix D)
• CMB_SOIL CMB_A_CO2, emission factor for fossil CO2 due to off-site soil production (lb CO2-F/lb soil) (Appendix D)
• npc, post-closure period (years)
• pcvr2, percent of final cover to be replaced over the entire post-closure period (%)

5. Life-Cycle Inventory of Landfill Post-Closure
96
♦ Calculated Parameters:
• cvrgtx, amount of geotextile in final cover (lb/ton waste)
• cvrHDPE, amount of HDPE in final cover (lb/ton waste)
• cvrsand, amount of sand in final cover (lb/ton waste)
• cvrsc, amount of soil and clay in final cover (lb/ton waste)
• PCLSR_GTX PCLSR_A_CO2, yearly fossil CO2 emissions due to geotextile production (lb/ton waste)
• PCLSR_HDPE PCLSR_A_CO2, yearly fossil CO2 emissions due to HDPE production (lb/ton waste)
• PCLSR_SAND PCLSR_A_CO2, yearly fossil CO2 emissions due to obtaining sand (lb/ton waste)
• PCLSR_SOIL PCLSR_A_CO2, yearly fossil CO2 emissions due to obtaining soil (lb/ton waste)
Fossil CO2 emitted while obtaining soil and clay is a function of the total soil and clay used (cvrsc), the emission factor (CMB_A_CO2 CMB_SOIL), the percent cover to be replaced (pcvr2), and the length of the post-closure period (npc).
pc
cvr2sc n
1100p
2CO_A_CMB CMB_SOILcvr2PCLSR_A_CO SOIL_PCLSR ×××= (154)
The emissions due to sand, HDPE, and geotextile consumption are similarly calculated in equations 155–157.
pc
cvr2sand n
1100p
2CO_A_CMB CMB_SANDcvr2PCLSR_A_CO SAND_PCLSR ×××= (155)
pc
cvr2HDPE n
1100p
2CO_A_CMB CMB_HDPEcvr2PCLSR_A_CO HDPE_PCLSR ×××= (156)
pc
cvr2gtx n
1100p
2CO_A_CMB CMB_GTXcvr2PCLSR_A_CO GTX_PCLSR ×××= (157)
5.2 Equipment and Fuel Use
Diesel fuel is consumed by equipment while repairing the final cover and transporting materials to the site. The fuel used by heavy equipment and trucks is proportional to the amount of cover that is replaced. In the default case, fuel use is 10% of the total fuel used in the closure phase.
Fuel is also consumed during site inspections and lawn mowing. Four different semi-annual inspections are included in the post-closure phase: general inspection, gas collection system inspection, leachate collection system inspection, and groundwater control system inspection. The vehicle used is assumed to be a light-duty truck. According to a survey of landfill sites, the yearly fuel use is 4.0 E-6 gal of gasoline per ton of waste. Also, according to this survey, the vegetation is mowed once a year, corresponding to 9.2 E-7 gal of gasoline used per year per ton of waste.

5. Life-Cycle Inventory of Landfill Post-Closure
97
5.2.1 Emissions Due to Fuel Use
This section presents equations modeling the precombustion and combustion emissions due to diesel and gasoline use during post-closure. In the model, emissions due to combusting fuel in a light-duty truck and in a lawn mower are calculated for each of the inventory flow parameters. In this documentation, the calculations are shown for the inventory-flow-parameter fossil CO2.
♦ User Input Parameters:
• fuel12, fuel used for inspections (gal/year-ton waste)
• fuel13, fuel used for mowing (gal/year-ton waste)
• g_pc_em T_F_PC_A_CO2, precombustion emission factor for gasoline and fossil CO2 (lb CO2-F/gal fuel) (Appendix D)
• npc, post-closure period (years)
• pcvr2, percent of final cover to be replaced over the entire post-closure period (%)
♦ Calculated Parameters:
• CLSR_BCKH CMB_A_CO2, fossil CO2 emissions from a backhoe during closure (lb/ton waste) (Appendix D)
• CLSR_BLLDZR CMB_A_CO2, fossil CO2 emissions from a bulldozer during closure (lb/ton waste) (Appendix D)
• CLSR_DR CMB_A_CO2, fossil CO2 emissions from a drum roller during closure (lb/ton waste) (Appendix D)
• CLSR_DT CMB_A_CO2, fossil CO2 emissions from a dump truck during closure (lb/ton waste) (Appendix D)
• CLSR_HT CMB_A_CO2, fossil CO2 emissions from a heavy truck during closure (lb/ton waste) (Appendix D)
• CLSR_PC CMB_A_CO2, fossil CO2 emissions from precombustion of diesel fuel during closure (lb/ton waste) (Appendix D)
• CLSR_PU CMB_A_CO2, fossil CO2 emissions from a pickup during closure (lb/ton waste) (Appendix D)
• CLSR_SCRPR CMB_A_CO2, fossil CO2 emissions from a scraper during closure (lb/ton waste) (Appendix D)
• CLSR_TD CMB_A_CO2, fossil CO2 emissions from a tractor during closure (lb/ton waste) (Appendix D)
• CLSR_WL CMB_A_CO2, fossil CO2 emissions from a wheel loader during closure (lb/ton waste) (Appendix D)
• CLSR_WT CMB_A_CO2, fossil CO2 emissions from a water truck during closure (lb/ton waste) (Appendix D)

5. Life-Cycle Inventory of Landfill Post-Closure
98
• CMB_LDT CMB_A_CO2, emission factor for fossil CO2 emissions from a light-duty truck (lb CO2-F/gal fuel) (Appendix D)
• CMB_MWR CMB_A_CO2, emission factor for the fossil CO2 emissions from a four-stroke lawnmower (lb CO2-F/gal fuel) (Appendix D)
• PCLSR_LDT PCLSR_A_CO2, yearly fossil CO2 emissions from using a light-duty truck (lb/ton waste) (Appendix D)
• PCLSR_MWR PCLSR_A_CO2, yearly fossil CO2 emissions from using a lawn mower (lb/ton waste)
• PCLSR_PC PCLSR_A_CO2, yearly fossil CO2 emissions from gasoline precombustion activities (lb/ton waste)
• PCLSR_PVC PCLSR_A_CO2, yearly fossil CO2 emissions from diesel combustion and precombustion (lb/ton waste)
The yearly emissions of equipment while applying final cover, by trucks transporting material, and by diesel precombustion are calculated as
pc
2cvr
n1
100p
CMB_A_CO2 PC_CLSRCMB_A_CO2 HT_CLSRCMB_A_CO2 DT_CLSR
CLSR_A_CO2 TD_CLSR CLSR_A_CO2 PU_CLSR
CLSR_A_CO2 BCKH_CLSR CLSR_A_CO2 DR_CLSR CLSR_A_CO2 WL_CLSR
CLSR_A_CO2 BLLDZR_CLSR CLSR_A_CO2 WT_CLSR
CLSR_A_CO2 SCRPR_CLSR
2PCLSR_A_CO PVC_PCLSR
××
⎟⎟⎟⎟⎟⎟⎟⎟⎟⎟⎟⎟⎟⎟⎟⎟
⎠
⎞
⎜⎜⎜⎜⎜⎜⎜⎜⎜⎜⎜⎜⎜⎜⎜⎜
⎝
⎛
++++
+++
++
+
=
(158)
The emissions due to combusting gasoline in a light truck and lawn mower are a function of the fuel used and the combustion emission factor. The fossil CO2 emissions for a light truck and lawn mower are presented in the following equations:
12fuel 2CO_A_CMB CMB_LDT2PCLSR_A_CO LDT_PCLSR ×= (159)
13fuel 2CO_A_CMB CMB_MWR2PCLSR_A_CO MWR_PCLSR ×= (160)
Gasoline precombustion emissions are a function of the total gasoline used by the light truck and lawn mower and the gasoline precombustion emission factor.
( )1312 fuelfuel 2CO_A_PC_F_T g_pc_em2PCLSR_A_CO PC_PCLSR +×= (161)

5. Life-Cycle Inventory of Landfill Post-Closure
99
5.3 Total Emissions
This section calculates total emissions due to post-closure activities. The required parameters follow.
♦ User Input Parameters:
• npc, post-closure period (years)
• Ny, expected useful life of landfill (years)
♦ Calculated Parameters:
• PCLSR_1 PCLSR_A_CO2, total yearly fossil CO2 emissions from post-closure activities (lb/ton waste)
• PCLSR_100 PCLSR_A_CO2, total post-closure fossil CO2 emissions during the 100-year time horizon (lb/ton waste)
• PCLSR_20 PCLSR_A_CO2, total post-closure fossil CO2 emissions during the 20-year time horizon (lb/ton waste)
• PCLSR_500 PCLSR_A_CO2, total post-closure fossil CO2 emissions during the 500-year time horizon (lb/ton waste)
• PCLSR_GTX PCLSR_A_CO2, yearly fossil CO2 emissions due to geotextile production (lb/ton waste)
• PCLSR_HDPE PCLSR_A_CO2, yearly fossil CO2 emissions due to HDPE production (lb/ton waste)
• PCLSR_LDT PCLSR_A_CO2, yearly fossil CO2 emissions from using a light-duty truck (lb/ton waste) (Appendix D)
• PCLSR_MWR PCLSR_A_CO2, yearly fossil CO2 emissions from using a lawn mower (lb/ton waste)
• PCLSR_PC PCLSR_A_CO2, yearly fossil CO2 emissions from gasoline precombustion activities (lb/ton waste)
• PCLSR_PVC PCLSR_A_CO2, yearly fossil CO2 emissions from diesel combustion and precombustion (lb/ton waste)
• PCLSR_SAND PCLSR_A_CO2, yearly fossil CO2 emissions due to obtaining sand (lb/ton waste)
• PCLSR_SOIL PCLSR_A_CO2, yearly fossil CO2 emissions due to obtaining soil (lb/ton waste)
The yearly emissions are a function of emissions due to material consumption and fuel use.
⎟⎟⎟⎟⎟⎟⎟⎟⎟⎟⎟
⎠
⎞
⎜⎜⎜⎜⎜⎜⎜⎜⎜⎜⎜
⎝
⎛
+++++++
=
2CO_A_PCLSR PC_PCLSRCO2_A_PCLSR MWR_PCLSR
CO2_A_PCLSR LDT_PCLSR CO2_A_PCLSR PVC_PCLSR CO2_A_PCLSR GTX_PCLSR
2CO_A_PCLSR HDPE_PCLSR CO2_A_PCLSR SAND_PCLSR
2CO_A_PCLSR SOIL_PCLSR
2PCLSR_A_CO 1_PCLSR (162)

5. Life-Cycle Inventory of Landfill Post-Closure
100
The final cover is assumed to be placed halfway through the operating life of the landfill. Post-closure activities begin after final cover is in place.
Emissions occurring during each of the time horizons are calculated using an IF statement. If the post-closure period falls within the user-selected time horizon, then the entire length of the post-closure period is used to calculate post-closure emissions. If the post-closure period begins after the selected time horizon, post-closure emissions are zero. If the post-closure period ends beyond the time horizon, then emissions are a fraction of those that would occur during the entire post-closure period. For example, with a default landfill life of 20 years, post-closure activities begin 10 years after waste placement. Based on this, a 20-year time horizon includes 10 years of post-closure activity. A 100- or 500-year time horizon includes 30 years of post-closure activities.
Emissions for the 20-year time horizon are calculated as
( )
⎪⎪⎪
⎭
⎪⎪⎪
⎬
⎫
⎪⎪⎪
⎩
⎪⎪⎪
⎨
⎧
⎥⎥⎥⎥⎥
⎦
⎤
⎢⎢⎢⎢⎢
⎣
⎡
×⎟⎟⎠
⎞⎜⎜⎝
⎛−
×≤⎟⎟⎠
⎞⎜⎜⎝
⎛+
<
=
0,
2PCLSR_A_CO 1_PCLSR2
N20
,2PCLSR_A_CO 1_PCLSRn ,20 n2
N IF
,202
NIF
2PCLSR_A_CO 20_PCLSR
y
pcpcy
y
(163)
Emissions for the 100-year time horizon are calculated as
⎪⎪⎪
⎭
⎪⎪⎪
⎬
⎫
⎪⎪⎪
⎩
⎪⎪⎪
⎨
⎧
⎥⎥⎥⎥⎥
⎦
⎤
⎢⎢⎢⎢⎢
⎣
⎡
×⎟⎟⎠
⎞⎜⎜⎝
⎛−
×≤⎟⎟⎠
⎞⎜⎜⎝
⎛+
<
=
0,
2PCLSR_A_CO 1_PCLSR2
N100
,2PCLSR_A_CO 1_PCLSRn ,100 n2
N IF
,1002
NIF
2PCLSR_A_CO 100_PCLSR
y
pcpcy
y
(164)
Emissions for the 500-year time horizon are calculated as
⎪⎪⎪
⎭
⎪⎪⎪
⎬
⎫
⎪⎪⎪
⎩
⎪⎪⎪
⎨
⎧
⎥⎥⎥⎥⎥
⎦
⎤
⎢⎢⎢⎢⎢
⎣
⎡
×⎟⎟⎠
⎞⎜⎜⎝
⎛−
×≤⎟⎟⎠
⎞⎜⎜⎝
⎛+
<
=
0,
2PCLSR_A_CO 1_PCLSR2
N500
,2PCLSR_A_CO 1_PCLSRn ,500 n2
N IF
,5002
NIF
2PCLSR_A_CO 500_PCLSR
y
pcpcy
y
(165)
Emissions are reported for the time horizon the user has selected. The emissions occurring during the user-selected time horizon are calculated using IF statements. If the 20-year time horizon is chosen, then 20-year emissions are reported. If the user selects the 100-year time horizon, then 100-year emissions are reported. Or, if the user selects the 500-year time horizon, then 500-year emissions are reported.

5. Life-Cycle Inventory of Landfill Post-Closure
101
( )⎟⎟⎠⎞
⎜⎜⎝
⎛=
=
=
2PCLSR_A_CO PCLSR_500 2,PCLSR_A_CO PCLSR_100 100,timeIF2,PCLSR_A_CO PCLSR_20 20,time
IF
2PCLSR_A_CO TOTAL_PCLSR (166)
5.4 Default Values
Three values are given for each parameter to represent traditional, bioreactor, and ash landfills respectively.
5.4.1 CMB_GTX CMB_A_CO2, emission factor for fossil CO2 due to geotextile production (lb CO2-F/lb geotextile) (Appendix D)
5.4.2 CMB_HDPE CMB_A_CO2, emission factor for fossil CO2 due to HDPE production (lb CO2-F/lb HDPE) (Appendix D)
5.4.3 CMB_LDT CMB_A_CO2, emission factor for fossil CO2 emissions from a light-duty truck (lb CO2-F/gal fuel) (Appendix D)
5.4.4 CMB_MWR CMB_A_CO2, emission factor for fossil CO2 emissions from a four-stroke lawnmower (lb CO2-F/gal fuel) (Appendix D)
5.4.5 CMB_SAND CMB_A_CO2, emission factor for fossil CO2 due to sand production (lb CO2-F/lb sand) (Appendix D)
5.4.6 CMB_SOIL CMB_A_CO2, emission factor for fossil CO2 due to off-site soil production (lb CO2-F/lb soil) (Appendix D)
5.4.7 fuel12, fuel used for inspections (4 × 10⁻⁶ gal/year-ton waste, 4 × 10⁻⁶ gal/year-ton waste, 4 × 10⁻⁶
gal/year-ton waste)
5.4.8 fuel13, fuel used for mowing (9.20 × 10⁻⁷ gal/year-ton waste, 9.20 × 10⁻⁷ gal/year-ton waste, 9.20 × 10⁻⁷
gal/year-ton waste)
5.4.9 g_pc_em T_F_PC_A_CO2, precombustion emission factor for gasoline and fossil CO2 (lb CO2-F/gal fuel) (Appendix D)
5.4.10 npc, post-closure period (30 years, 30 years, 30 years)
5.4.11 Ny, expected useful life of landfill (20 years, 20 years, 20 years)
5.4.12 pcvr2, percent of final cover to be replaced over the entire post-closure period (10%, 10%, 10%)
5.4.13 T_F_PC_A_CO2 d_pc_em, diesel fuel precombustion emission factor (lb CO2/gal fuel) (Appendix D)

103
6. Life-Cycle Inventory of Landfill Gas
The approach used to model landfill gas production, collection, and utilization is presented in this section. Landfill gas is produced for an extended period following waste burial, and the approach that has been adopted allows for varying collection and treatment alternatives at different times after burial.
In contrast with other unit operations involved in waste management, landfill gas emissions occur over a long period. Nonetheless, the landfill LCI must be integrated with other unit operations to develop a total system LCI. Since there is no single “correct” answer to the issue of the appropriate time horizon, the user is given the flexibility to select from three alternate time frames: 20, 100, or 500 years. In reviewing the landfill LCI model, it should be apparent that there would be little difference in cumulative gas production between 100 and 500 years for most common gas production scenarios.
6.1 Landfill Gas Composition
The major components of landfill gas are methane and carbon dioxide. These concentrations are input parameters and the default values are 55% and 45%, respectively. These concentrations are consistent with industry data and values listed in AP-42 [U.S. EPA, 1995]. Landfill gas comes from organic sources. Thus, the carbon dioxide emitted is considered biomass CO2, and any carbon dioxide produced from the combustion of landfill methane is also biomass CO2. The trace organic components of landfill gas are presented in Table 17. These factors were adopted from the EPA’s database on landfill gas emissions [U.S. EPA, 1995]. Concentrations are assumed to remain constant over time because there are no known data on trends of trace organic concentrations over time.
Table 17: Speciated Trace Constituents in Landfill Gas
Compound
Default Concentration (ppmv)
Benzene 1.91
Chloroform 0.03
Carbon tetrachloride 0.004
Ethylene dichloride 0.41
Methylene chloride 14.3
Trichloroethene 2.82
Perchloroethene 3.73
Vinyl chloride 7.34
Toluene 39.3
Xylenes 12.1
Ethylbenzene 4.61

6. Life-Cycle Inventory of Landfill Gas
104
6.2 Landfill Gas Production
This section develops equations modeling the production of landfill gas. The required parameters follow. (Units of measure are in parentheses.)
♦ User Input Parameters:
• f11, scaling factor between the ultimate gas yield predicted by the Solid Waste Association of North American (SWANA) and the ultimate gas yield predicted by laboratory analysis
• k, first order decay rate constant (years-1)
• lag, time between placement and start of gas generation (years)
• Lo, total landfill gas yield potential (ft3/ton waste)
• LoSWANA, ultimate gas yield predicted by SWANA (ft3/ton waste)
• s, first order rise phase constant (years-1)
• time, selected time horizon (20, 100, or 500 years)
• z12a, enter 1 to use the ultimate gas yield predicted by SWANA or enter 0 to use the laboratory ultimate gas yield
♦ Calculated Parameters:
• Gtime, total landfill gas generated during the user-selected time horizon (ft3/ton waste)
• Lolab, ultimate gas yield based on laboratory data (ft3 gas/wet ton waste)
Cumulative landfill gas production is calculated based on equation 167. This equation was adopted from a study by SWANA [SCS Engineers and Augenstein, 1996] and is connected with both field observations and laboratory measurements of refuse decomposition. By adjusting the lag time (lag), s and k, the same gas production model can be applied to traditional and bioreactor landfills. For traditional landfills, parameters were adopted from the SWANA study. For a bioreactor landfill, values were selected using engineering judgement because field data are not available [Pacey, 1999].
( ) ( ) ( )( )( )( ) ⎥⎦
⎤⎢⎣
⎡ ×+++−= −+−−−
sL
sekeskG olagtimesklagtimektime (167)
The allocation of landfill gas depends on the waste composition and the ultimate gas yield (Lo). As described in section 6.7, in the default case the ultimate gas yield is based on the methane yields of individual waste components. These methane yields and the waste composition are used to obtain the ultimate gas yield for the average ton (Lolab). The percent contribution of each waste component to this total gas yield is used to allocate landfill gas to the components of the waste stream.
The user can choose to use the laboratory ultimate gas yield (Lolab) or the value predicted by SWANA (LoSWANA). This is modeled with the following equation:
( )labSWANAa12o Lo,Lo,1zIFL == (168)
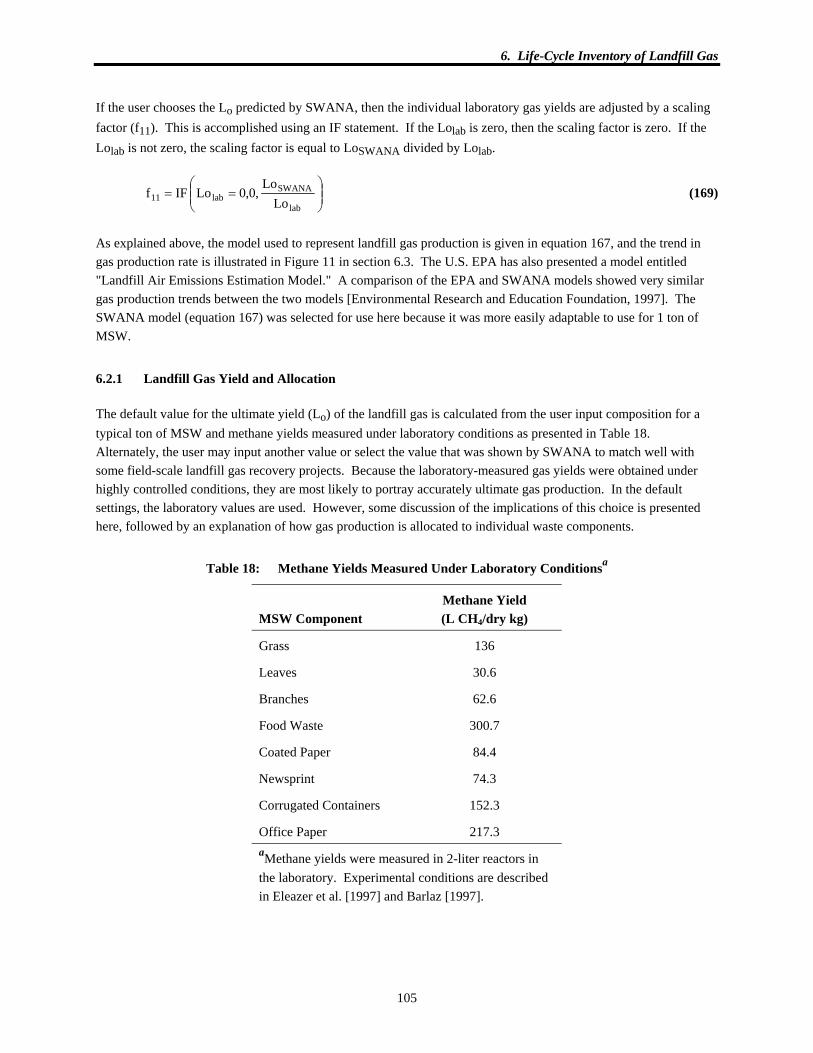
6. Life-Cycle Inventory of Landfill Gas
105
If the user chooses the Lo predicted by SWANA, then the individual laboratory gas yields are adjusted by a scaling factor (f11). This is accomplished using an IF statement. If the Lolab is zero, then the scaling factor is zero. If the Lolab is not zero, the scaling factor is equal to LoSWANA divided by Lolab.
⎟⎟⎠
⎞⎜⎜⎝
⎛==
lab
SWANAlab11 Lo
Lo,0,0LoIFf (169)
As explained above, the model used to represent landfill gas production is given in equation 167, and the trend in gas production rate is illustrated in Figure 11 in section 6.3. The U.S. EPA has also presented a model entitled "Landfill Air Emissions Estimation Model." A comparison of the EPA and SWANA models showed very similar gas production trends between the two models [Environmental Research and Education Foundation, 1997]. The SWANA model (equation 167) was selected for use here because it was more easily adaptable to use for 1 ton of MSW.
6.2.1 Landfill Gas Yield and Allocation
The default value for the ultimate yield (Lo) of the landfill gas is calculated from the user input composition for a typical ton of MSW and methane yields measured under laboratory conditions as presented in Table 18. Alternately, the user may input another value or select the value that was shown by SWANA to match well with some field-scale landfill gas recovery projects. Because the laboratory-measured gas yields were obtained under highly controlled conditions, they are most likely to portray accurately ultimate gas production. In the default settings, the laboratory values are used. However, some discussion of the implications of this choice is presented here, followed by an explanation of how gas production is allocated to individual waste components.
Table 18: Methane Yields Measured Under Laboratory Conditionsa
MSW Component
Methane Yield (L CH4/dry kg)
Grass 136
Leaves 30.6
Branches 62.6
Food Waste 300.7
Coated Paper 84.4
Newsprint 74.3
Corrugated Containers 152.3
Office Paper 217.3 aMethane yields were measured in 2-liter reactors in the laboratory. Experimental conditions are described in Eleazer et al. [1997] and Barlaz [1997].

6. Life-Cycle Inventory of Landfill Gas
106
To properly utilize the landfill process model, the user must understand that the LCI model is intended to represent a ton of MSW buried in a landfill. This is subtlety different from a model of the behavior of an operational or closed landfill that contains waste of multiple ages and states of decomposition. Thus, for most cases it is appropriate to utilize the default calculation for Lo. In the default case, Lo is calculated from the composition of an average ton of MSW and the laboratory-measured yields. The composition of an average ton of MSW can be defined by the model user in the landfill process model. Note that this composition need not be the composition of the ton to be managed by the user as defined in the Common section of the process model.
Once an overall Lo is calculated, it is allocated to the biodegradable components of MSW in the process model. This is done by calculating the percentage of Lo that can be attributed to each waste component in the typical ton. Thus, if 14% of landfill gas production can be attributed to food waste in the typical ton, then 14% of landfill gas production is allocated to food waste in the MSW actually buried as determined by the model solution. While Lo represents ultimate landfill gas production, this does not represent what is actually released to the environment after landfill gas collection and treatment as described in subsequent sections of this documentation.
One limitation to the allocation methodology described here is that the composition of waste that is buried in a landfill, per the model solution, will almost certainly be different from the composition of waste input as the typical ton. Thus, the most appropriate Lo for the waste actually buried will be in error. The model user is encouraged to review the model solution and to specifically review the composition of waste to be buried in a landfill. If this composition is highly unusual, such as all glass and plastic or 50% food waste, then the model user should rerun the model with an adjusted composition for the typical ton of MSW as well as adjusted default values for leachate quality (section 7). The process model will then automatically adjust the default Lo based on the default calculation.
We have explored the potential inaccuracy associated with the allocation methodology and it appears to be well within the overall uncertainty of the model. Specifically, the hypothetical methane yield for three mixtures of MSW was calculated. These three mixtures are based on (1) all MSW that is generated is buried in a landfill, (2) the composition of waste buried in a landfill is corrected for the recycling of each waste component at its national average recovery rate, and (3) the composition of waste buried in a landfill is corrected for the recycling of each waste component at a rate that exceeds the national average recovery rate. The calculated methane yield of these three waste mixtures ranged from 58.6 to 64.9 L CH4/wet kg, which is well within the uncertainty of the model [Barlaz, 1997]. Thus, the limitation described here is not expected to have a significant bearing on the overall model solution.
Another potential limitation that should be recognized relates to the specification of how landfill gas is treated (vent versus flare versus energy recovery) as described in section 6.4. It is possible that the user would specify energy recovery, but the model solution would show only a small amount of waste actually directed to a landfill. In this case, installation of a landfill gas energy recovery system may not be economical. Thus, the user is encouraged to review the model solution and to evaluate whether the selected gas management strategy is consistent with the mass of MSW directed to the landfill.
6.3 Landfill Gas Collection
This section models equations describing the quantity of collected and uncollected landfill gas. Three operational periods can be defined by the user for gas collection and treatment. The logic for three gas collection periods relates to the potential strategies for gas treatment. First, it is assumed that there is a period during which no gas collection system is in place. It is further assumed that the first gas collection system is temporary until the landfill receives its

6. Life-Cycle Inventory of Landfill Gas
107
final cover. A second landfill gas collection system is installed after the final cover is in place. This second collection and treatment period is assumed to be in use during the period of maximum gas production. A third landfill gas collection and treatment period allows for a time when gas production may decrease but is still too significant to vent. The default values for the three collection time periods are presented in Table 19.
Table 19: Default Values for Landfill Gas Collection
Model Parameter
Default Value (years)
Time between waste placement and implementation of first gas collection system 2
Time between waste placement and conversion to second gas collection system 5
Time between waste placement and conversion to third gas collection system 40
Time between waste placement and discontinuation of third gas collection system 80
The assumed gas collection efficiencies for years 2–5, 5–40, and 40–80 are 60%, 95%, and 90%, respectively. The weighted average of these values is 88%, which is the default collection efficiency. Note that gas produced prior to year 2 will be vented to the atmosphere.
Based on the concept of three gas collection periods and the system inefficiency, the volume of gas collected in periods 1, 2, and 3 is calculated in equations 170–176. The required parameters follow.
♦ User Input Parameters:
• gasun1, percent of gas not collected due to collection system inefficiency (%)
• k, first order decay rate constant (years-1)
• lag, time between placement and start of gas generation (years)
• Lo, total landfill gas yield potential (ft3/ton waste)
• P, pressure (atm)
• R, universal gas constant (L-atm)/(mol-K)
• s, first order rise phase constant (years-1)
• T, temperature (K)
• t0, time to implementation of first gas collection system (years)
• t1, time to implementation of second gas collection system (years)
• t2, time to implementation of third gas collection system (years)
• t3, time to discontinuation of third gas collection system (years)
♦ Calculated Parameters:
• gas1, gas produced and collected during the first collection period (ft3/ton waste)

6. Life-Cycle Inventory of Landfill Gas
108
• Gtime, total landfill gas generated during the user-selected time horizon (ft3/ton waste)
• gas2, gas produced and collected during the second collection period (ft3/ton waste)
• gas3, gas produced and collected during the third collection period (ft3/ton waste)
• gasun2, gas produced prior to collection system installation (ft3/ton waste)
• gasun3, gas not collected due to gas collection system inefficiency (ft3/ton waste)
• gasun4, gas produced after discontinuation of gas collection system (ft3/ton waste)
• n, moles of gas (mols)
• V, volume of gas (ft3)
( ) ( )( )( )( )( ) ( )( )( )( )
⎟⎠⎞
⎜⎝⎛ −×
⎪⎪
⎭
⎪⎪
⎬
⎫
⎪⎪
⎩
⎪⎪
⎨
⎧
⎥⎦
⎤⎢⎣
⎡⎟⎠⎞
⎜⎝⎛ ×+++−
−⎥⎦
⎤⎢⎣
⎡⎟⎠⎞
⎜⎝⎛ ×+++−
=−+−−−
−+−−−
100gas1
sLseke)sk
sLseke)sk
gas 1un
olag0tsklag0tk
olag1tsklag1tk
1 (170)
( ) ( )( )( )( )( ) ( )( )( )( )
⎟⎠⎞
⎜⎝⎛ −×
⎪⎪
⎭
⎪⎪
⎬
⎫
⎪⎪
⎩
⎪⎪
⎨
⎧
⎥⎦
⎤⎢⎣
⎡⎟⎠⎞
⎜⎝⎛ ×+++−
−⎥⎦
⎤⎢⎣
⎡⎟⎠⎞
⎜⎝⎛ ×+++−
=−+−−−
−+−−−
100gas1
sLseke)sk
sLseke)sk
gas 1un
olag1tsklag1tk
olag2tsklag2tk
2 (171)
( ) ( )( )( )( )( ) ( )( )( )( )
⎟⎠⎞
⎜⎝⎛ −×
⎪⎪
⎭
⎪⎪
⎬
⎫
⎪⎪
⎩
⎪⎪
⎨
⎧
⎥⎦
⎤⎢⎣
⎡⎟⎠⎞
⎜⎝⎛ ×+++−
−⎥⎦
⎤⎢⎣
⎡⎟⎠⎞
⎜⎝⎛ ×+++−
=−+−−−
−+−−−
100gas1
sLseke)sk
sLseke)sk
gas 1un
olag2tsklag2tk
olag3tsklag3tk
3 (172)
The volume of landfill gas produced during each period is converted to moles by using the following equation:
TR
VPn
3ftL32.28
×
××= (173)
The amount of gas that is not collected due to the absence of a gas collection system and collection system inefficiency is calculated in equations 174 and 175, respectively.
( ) ( ) ( )( )( )( ) ⎥⎦⎤
⎢⎣⎡ ×+++−= −+−−−
sLsekeskgas olagtsklagtk
2unoo (174)
( )100
gasgasGgas 1un2untime3un ×−= (175)
The volume of gas uncollected and released through the vents due to discontinuation of a gas collection system is calculated using an IF statement. If collection is discontinued during the chosen time horizon (20, 100, or 500

6. Life-Cycle Inventory of Landfill Gas
109
years), then the gas released to the environment is calculated. If gas collection is discontinued outside the chosen time horizon, then gas released during that time period is zero.
( ) ( ) ( )( )( )( )
( ) ( ) ( )( )( )( ) ⎟⎟⎟⎟⎟
⎠
⎞
⎜⎜⎜⎜⎜
⎝
⎛
⎟⎠⎞
⎜⎝⎛ −×
⎪⎪⎭
⎪⎪⎬
⎫
⎪⎪⎩
⎪⎪⎨
⎧
⎥⎦⎤
⎢⎣⎡ ×+++−
−⎥⎦⎤
⎢⎣⎡ ×+++−
>=−+−−−
−+−−−
0,100
gas1
sLsekesk
sLsekesk
,ttimeIFgas 1un
olagtsklagtk
olagtimesklagtimek
34un33
(176)
Figures 10 and 11 graphically represent the amount of landfill gas that is collected versus the amount not collected.
6.4 Landfill Gas Treatment
The LCI is highly sensitive to the selection of the gas treatment scenario. Where landfill gas is recovered for energy, there are significant offsets that are allocated to the landfill. These offsets are not realized if the landfill gas is not recovered for energy.
Collected landfill gas can be treated by a flare, turbine, boiler, or internal combustion engine (ICE). It can also be vented to the atmosphere. These treatment options are selected by the user and can be different for each of the three landfill gas collection and treatment periods. Gas that is not collected will leave the landfill either through the cover soil or through gas vents. Gas escaping through the cover may be oxidized by the soil microbes, oxidizing a fraction of the landfill gas constituents to CO2.
6.4.1 Treatment of Collected Landfill Gas
Equations modeling the quantity of gas collected by an active gas collection system for subsequent treatment (flare, turbine, venting, etc.) were developed in section 6.3. The default values for treatment of landfill gas during each of the three gas collection periods are shown in Table 20. Note that in the default case, landfill gas is not recovered for energy for a traditional landfill. For a bioreactor landfill, an ICE is used in treatment period 2.
Table 20: Percent of Landfill Gas Treatment Methods Used
Landfill Gas Treatment Periods
Treatment Method
First (%)
Second (%)
Third (%)
Vent (%) 100 0 0
Flare (%) 0 100 100
Turbine (%) 0 0 0
Direct use (%) 0 0 0
ICE (%) 0 0 0

6. Life-Cycle Inventory of Landfill Gas
110
0
20
40
60
80
100
120
140
0 2 3 4
Time in Years
Gas
Gen
erat
ion
Rat
ecu
ft p
er y
ear
per
ton
of w
aste
Collected
Not Collected due to Gas Collection System Inefficiency
Not Collected due to Lack of Gas Collection System
Lag Time
Waste Placement
Generated
Figure 10: Amount of Gas Not Collected Due to Absence of a Gas Collection System and Collection System Efficiency
0
20
40
60
80
100
120
140
160
0 10 20 30 40 50 60 70 80 90 100
Time in Years
Gas
Gen
erat
ion
Rat
ecu
ft p
er y
ear
per
ton
of w
aste
Not Collected due to Discontinuation of Gas Collection System
Collected
Not Collected due to Gas Collection System Inefficiency
Waste Placement
Generated
Discontinuation of Second Gas Collection System
Discontinuation of Third Gas Collection System
Discontinuation of First Gas Collection System
Figure 11: Amount of Gas Not Collected Due to Discontinuation of the Gas Collection System and Collection System Efficiency

6. Life-Cycle Inventory of Landfill Gas
111
Each treatment method will have different treatment efficiency and associated emissions as described in Table 21 and Table 22 [Environmental Research and Education Foundation, 1998].
Table 21: Landfill Gas Destruction Efficiencies (%)
Gas Component Vent Flare Turbine Boiler ICE
Carbon dioxide 0 0 0 0 0
Methane 0 99 99 99 99
Benzene 0 99.7 98.2 99.68 86.1
Chloroform 0 98 99.7 99.6 93
Carbon tetrachloride 0 98 99.7 99.6 93
Ethylene dichloride 0 98 99.7 99.6 93
Methylene chloride 0 98 99.7 99.6 93
Trichloroethene 0 98 99.7 99.6 93
Tetrachloroethene 0 98 99.7 99.6 93
Vinyl chloride 0 98 99.7 99.6 93
Toluene 0 99.7 98.2 99.8 86.1
Xylenes 0 99.7 98.2 99.8 86.1
Ethylbenzene 0 99.7 98.2 99.8 86.1
Table 22: Landfill Gas Emission Factors
Emission Factor (kg/hr/dscmm)a
Landfill Gas Emission Flare Turbine Boiler ICE
Carbon monoxide 0.72 0.22 0.0054 0.45
Nitrogen dioxide 0.039 0.083 0.032 0.24
Particulate matter 0.016 0.021 0.0079 0.046
Sulfur dioxideb 0.01 0.01 0.01 0.01
Hydrogen chloridec 0.0096 0.0098 0.0098 0.0091
Biomass carbon dioxided 195 195 195 195 aEmission factors are in kilogram/hour/dry standard cubic meter/minute. bBased on the sulfur content of the gas (46.9 ppmv). cBased on the chlorine content of the gas (from combusted constituents). dBased on the carbon content of combusted constituents (minus carbon monoxide emissions).
6.4.2 Emissions Due to Landfill Gas Treatment

6. Life-Cycle Inventory of Landfill Gas
112
Gas constituents emitted by equipment when treating landfill gas are presented in section 6.4.2.1. Components of landfill gas remaining after treatment are presented in section 6.4.2.2.
6.4.2.1 Equipment emissions
This section models equipment emissions due to the combustion of landfill gas in a flare, turbine, boiler, and ICE. The required parameters follow.
♦ User Input Parameters:
• CMB BLR CMB_A_CO2_BM, emission of biomass CO2 after gas combustion in a boiler (lb/mol gas)
• CMB FLR CMB_A_CO2_BM, emission of biomass CO2 after gas combustion in a flare (lb/mol gas)
• CMB ICE CMB_A_CO2_BM, emission of biomass CO2 after gas combustion in an ICE (lb/mol gas)
• CMB TRBN CMB_A_CO2_BM, emission of biomass CO2 after gas combustion in a turbine (lb/mol gas)
• effdu effCH4, CH4 destruction efficiency in a boiler (%)
• effflr eff CH4, CH4 destruction efficiency in a flare (%)
• effice eff CH4, CH4 destruction efficiency in an ICE (%)
• efftrbn eff CH4, CH4 destruction efficiency in a turbine (%)
• effvnt eff CH4, CH4 destruction efficiency in a vent (%)
• gas1du, use of boiler during first landfill gas treatment period (%)
• gas1flr, use of flare during the first landfill gas treatment period (%)
• gas1ice, use of ICE during first landfill gas treatment period (%)
• gas1trbn, use of turbine during first landfill gas treatment period (%)
• gasCH4, percent of methane in landfill gas (%)
♦ Calculated Parameters:
• EE_DU G_A_CO2_BM, total biomass CO2 emissions from a boiler (lb/ton waste)
• EE_DU1 G_A_CO2_BM, biomass CO2 emissions from a boiler during first landfill gas treatment period (lb/ton waste)
• EE_DU2 G_A_CO2_BM, biomass CO2 emissions from a boiler during second landfill gas treatment period (lb/ton waste)
• EE_DU3 G_A_CO2_BM, biomass CO2 emissions from a boiler during third landfill gas treatment period (lb/ton waste)
• EE_FLR G_A_CO2_BM, total biomass CO2 emitted from a flare during all three landfill gas treatment periods (lb/ton waste)
• EE_FLR1 G_A_CO2_BM, biomass CO2 emissions from a flare during first treatment period (lb/ton waste)

6. Life-Cycle Inventory of Landfill Gas
113
• EE_FLR2 G_A_CO2_BM, biomass CO2 emissions from a flare during second treatment period (lb/ton waste)
• EE_FLR3 G_A_CO2_BM, biomass CO2 emissions from a flare during third treatment period (lb/ton waste)
• EE_ICE G_A_CO2_BM, total biomass CO2 emitted from an ICE during all three landfill gas treatments (lb/ton waste)
• EE_ICE1 G_A_CO2_BM, biomass CO2 emissions from an ICE during first treatment period (lb/ton waste)
• EE_ICE2 G_A_CO2_BM, biomass CO2 emissions from an ICE during the second treatment period (lb/ton waste)
• EE_ICE3 G_A_CO2_BM, biomass CO2 emissions from an ICE during the third treatment period (lb/ton waste)
• EE_TRBN G_A_CO2_BM, total biomass CO2 emitted from a turbine during all three landfill gas treatments (lb/ton waste)
• EE_TRBN1 G_A_CO2_BM, biomass CO2 emissions from a turbine during first landfill gas treatment period (lb/ton waste)
• EE_TRBN2 G_A_CO2_BM, biomass CO2 emissions from a turbine during second landfill gas treatment period (lb/ton waste)
• EE_TRBN3 G_A_CO2_BM, biomass CO2 emissions from a turbine during third landfill gas treatment period (lb/ton waste)
• gas1a, gas collected and treated in first collection period (lb/ton waste)
Biomass CO2 emissions from a flare, turbine, boiler, and ICE are based on the quantity of gas combusted, percent equipment use, percent methane in the gas, and the efficiency of the equipment. For example, biomass CO2 emitted after combustion of gas in a flare is a function of the pounds of gas treated during the first collection period (gas1a), percent use of the flare (gas1flr), and the flare emissions factor (CMB_FLR CMB_A_CO2_BM). Biomass CO2 emissions from a turbine, boiler, and ICE are calculated in a similar manner.
Flare
( )
100
CH4eff flreff
1004CHgas
100flr1gas
a1gas BM_2CO_A_G 1FLR_EE ×××= (177)
Turbine
( )
100
CH4eff trbneff
1004CHgas
100trbn1gas
a1gas BM_2CO_A_G 1TRBN_EE ×××= (178)
Boiler

6. Life-Cycle Inventory of Landfill Gas
114
( )
100
CH4eff dueff
1004CHgas
100du1gas
a1gas BM_2CO_A_G 1DU_EE ×××= (179)
ICE
( )
100
CH4eff ICEeff
1004CHgas
100ICE1gas
a1gas BM_2CO_A_G 1ICE_EE ×××= (180)
Carbon monoxide, nitrogen dioxide, particulate matter, sulfur dioxide, and hydrogen chloride emissions are based on the amount of gas combusted, percent equipment use, and the emissions factor (Table 22). For example, carbon monoxide emissions from a flare are a function of the gas produced during the first treatment period (gas1a), the percent use of the flare (gas1flr), and the combustion factor for carbon monoxide in a flare (CMB_A_CO CMB_FLR). Carbon monoxide emissions from a turbine, boiler, flare, and ICE are similarly calculated.
Flare
CMB_FLR CO_A_CMB100flr1gas
a1gas CO_A_G 1FLR_EE ××= (181)
Turbine
CMB_FLR CO_A_CMB100trbn1gas
a1gas CO_A_G 1TRBN_EE ××= (182)
Boiler
CMB_BLR CO_A_CMB100du1gas
a1gas CO_A_G 1DU_EE ××= (183)
ICE
CMB_ICE CO_A_CMB100ICE1gas
a1gas CO_A_G 1ICE_EE ××= (184)
The equipment emissions calculated in equations 177–184 are repeated for the second and third landfill gas treatment periods. In these calculations, the emission factors remain the same. However, the gas produced and percent equipment use (Table 20) depends on the treatment period. Equipment emissions from the first, second, and third treatment periods are added to obtain total emissions. For example, the total biomass CO2 emitted from a flare, turbine, boiler, and ICE is calculated in the following equations:

6. Life-Cycle Inventory of Landfill Gas
115
Flare
G_A_CO2_BM EE_FLR3
G_A_CO2_BM EE_FLR2 G_A_CO2_BM 1FLR_EE
BM_2CO_A_G FLR_EE⎟⎟⎟
⎠
⎞
⎜⎜⎜
⎝
⎛++
= (185)
Turbine
G_A_CO2_BM EE_TRBN3
G_A_CO2_BM EE_TRBN2 G_A_CO2_BM 1TRBN_EE
BM_2CO_A_G TRBN_EE⎟⎟⎟
⎠
⎞
⎜⎜⎜
⎝
⎛++
= (186)
Boiler
G_A_CO2_BM EE_DU3
G_A_CO2_BM EE_DU2 G_A_CO2_BM 1DU_EE
BM_2CO_A_G DU_EE⎟⎟⎟
⎠
⎞
⎜⎜⎜
⎝
⎛++
= (187)
ICE
G_A_CO2_BM EE_ICE3
G_A_CO2_BM EE_ICE2 G_A_CO2_BM 1ICE_EE
BM_2CO_A_G ICE_EE⎟⎟⎟
⎠
⎞
⎜⎜⎜
⎝
⎛++
= (188)
6.4.2.2 Components of landfill gas remaining after treatment
Since destruction efficiencies are not 100%, there are components of landfill gas that remain after treatment. This section contains equations to calculate the components of landfill gas remaining after treatment.
♦ User Input Parameters:
• effdu effCH4, CH4 destruction efficiency in a boiler (%)
• effflr eff CH4, CH4 destruction efficiency in a flare (%)
• effice eff CH4, CH4 destruction efficiency in an internal combustion engine (%)
• efftrbn eff CH4, CH4 destruction efficiency in a turbine (%)
• effvnt eff CH4, CH4 destruction efficiency in a vent (%)
• gas1du, use of boiler in first landfill gas treatment period (%)
• gas1flr, use of flare during the first landfill gas treatment period (%)
• gas1ice, use of ICE during first landfill gas treatment period (%)
• gas1trbn, use of turbine during the first landfill gas treatment period (%)
• gas1vnt, use of vent during the first landfill gas treatment period (%)

6. Life-Cycle Inventory of Landfill Gas
116
• gasCH4, percent of methane in landfill gas (%)
♦ Calculated Parameters:
• COM_DU G_A_CH4, total CH4 emitted after treatment in a boiler (lb/ton waste)
• COM_DU1 G_A_CH4, CH4 remaining after landfill gas is treated by a boiler in the first treatment period (lb/ton waste)
• COM_DU2 G_A_CH4, CH4 remaining after landfill gas is treated by a boiler in the second treatment period (lb/ton waste)
• COM_DU3 G_A_CH4, CH4 remaining after landfill gas is treated by a boiler in the third treatment period (lb/ton waste)
• COM_FLR G_A_CH4, total CH4 emitted after flaring (lb/ton waste)
• COM_FLR1 G_A_CH4, CH4 remaining after landfill gas is treated by a flare in the first treatment period (lb/ton waste)
• COM_FLR2 G_A_CH4, CH4 remaining after landfill gas is treated by a flare the second treatment period (lb/ton waste)
• COM_FLR3 G_A_CH4, CH4 remaining after landfill gas is treated by a flare in the third treatment period (lb/ton waste)
• COM_ICE G_A_CH4, total CH4 emitted after treatment in an ICE (lb/ton waste)
• COM_ICE1 G_A_ CH4, CH4 remaining after landfill gas is treated by an ICE in the first treatment period (lb/ton waste)
• COM_ICE2 G_A_CH4, CH4 remaining after landfill gas is treated by an ICE in the second treatment period (lb/ton waste)
• COM_ICE3 G_A_CH4, CH4 remaining after gas is treated by an ICE in the third treatment period (lb/ton waste)
• COM_TRBN G_A_CH4, total CH4 emitted after treatment in a turbine (lb/ton waste)
• COM_TRBN1 G_A_ CH4, CH4 remaining after landfill gas is treated by a turbine in the first treatment period (lb/ton waste)
• COM_TRBN2 G_A_CH4, CH4 remaining after landfill gas is treated by a turbine in the second treatment period (lb/ton waste)
• COM_TRBN3 G_A_CH4, CH4 remaining after landfill gas is treated by a turbine in the third treatment period (lb/ton waste)
• COM_VNT G_A_CH4, total CH4 emitted after venting (lb/ton waste)
• COM_VNT1 G_A_ CH4, CH4 remaining after landfill gas is treated by a vent in the first treatment period (lb/ton waste)
• COM_VNT2 G_A_CH4, CH4 remaining after landfill gas is treated by a vent in the second treatment period (lb/ton waste)

6. Life-Cycle Inventory of Landfill Gas
117
• COM_VNT3 G_A_CH4, CH4 remaining after landfill gas is treated by a vent in the third treatment period (lb/ton waste)
• gas1a, gas collected and treated in first collection period (lb/ton waste)
• moleCH4, lb CH4 per mole (lb CH4/mole)
The quantity of landfill gas constituents remaining after treatment is a function of the pounds of gas treated, percent equipment use, percent of constituent in gas, and the destruction efficiency of the equipment. In the model, emissions are calculated for each of the inventory flow parameters remaining after treatment by a flare, vent, turbine, boiler, or ICE. This section contains calculations for the quantity of methane remaining after flaring.
Methane remaining after treatment by a flare in the first treatment period is a function of the quantity of the gas treated (gas1a), percent use of the flare (gasflr), percent methane in the gas (gasCH4), and destruction efficiency of methane in a flare (effflr effCH4).
Flare
4CHmole100eff flreff
1100
4CHgas100
flr1gasa1gas 4CH_A_G 1FLR_COM 4CH ×⎟
⎟⎠
⎞⎜⎜⎝
⎛⎟⎟⎠
⎞⎜⎜⎝
⎛−××= (189)
Vent
4CHmole100eff vnteff
1100
4CHgas100
vnt1gasa1gas 4CH_A_G 1VNT_COM 4CH ×⎟
⎟⎠
⎞⎜⎜⎝
⎛⎟⎟⎠
⎞⎜⎜⎝
⎛−××= (190)
Turbine
4CHmole100eff trbneff
1100
4CHgas100
trbn1gasa1gas 4CH_A_G 1TRBN_COM 4CH ×⎟
⎟⎠
⎞⎜⎜⎝
⎛⎟⎟⎠
⎞⎜⎜⎝
⎛−××= (191)
Boiler
4CHmole100eff dueff
1100
4CHgas100
du1gasa1gas 4CH_A_G 1DU_COM 4CH ×⎟
⎟⎠
⎞⎜⎜⎝
⎛⎟⎟⎠
⎞⎜⎜⎝
⎛−××= (192)
ICE
4CHmole100eff iceeff
1100
4CHgas100
ice1gasa1gas 4CH_A_G 1ICE_COM 4CH ×⎟
⎟⎠
⎞⎜⎜⎝
⎛⎟⎟⎠
⎞⎜⎜⎝
⎛−××= (193)
These calculations are repeated for the second and third treatment periods. Emissions are then summed to obtain the total methane remaining after treatment (equations 194–198).

6. Life-Cycle Inventory of Landfill Gas
118
Flare
G_A_CH4 COM_FLR3
G_A_CH4 COM_FLR2 G_A_CH4 1FLR_COM
CH4_A_G FLR_COM⎟⎟⎟
⎠
⎞
⎜⎜⎜
⎝
⎛++
= (194)
Vent
G_A_CH4 COM_VNT3
G_A_CH4 COM_VNT2 G_A_CH4 1VNT_COM
4CH_A_G VNT_COM⎟⎟⎟
⎠
⎞
⎜⎜⎜
⎝
⎛++
= (195)
Turbine
G_A_CH4 COM_TRBN3
G_A_CH4 COM_TRBN2 G_A_CH4 1TRBN_COM
CH4_A_G TRBN_COM⎟⎟⎟
⎠
⎞
⎜⎜⎜
⎝
⎛++
= (196)
Boiler
G_A_CH4 COM_DU3
G_A_CH4 COM_DU2 G_A_CH4 1DU_COM
CH4_A_G DU_COM⎟⎟⎟
⎠
⎞
⎜⎜⎜
⎝
⎛++
= (197)
ICE
G_A_CH4 COM_ICE3
G_A_CH4 COM_ICE2 G_A_CH4 1ICE_COM
CH4_A_G ICE_COM⎟⎟⎟
⎠
⎞
⎜⎜⎜
⎝
⎛++
= (198)
6.4.3 Treatment of Uncollected Landfill Gas
This section develops equations modeling the quantity of uncollected landfill gas and resulting emissions. Uncollected landfill gas falls into three categories:
• Gas not collected because of the time when the gas collection is installed. Waste placed will start to generate gas before the final landfill cover and gas collection systems are installed.
• Gas not collected because of the gas system collection inefficiency. Even with operation of a gas collection system in periods 1–3, there will be some landfill gas not collected by the collection system.
• Gas not collected because of the discontinuation of the gas collection system. Gas will not be collected between the end of collection period 3 and the year 500.
For the first two situations of uncontrolled landfill gas release mentioned above, the fugitive gas was assumed to pass through a soil barrier before being released to the environment. This could be daily cover or intermediate cover in the case of gas released before a collection system was in place, and final cover in the case of fugitive gas

6. Life-Cycle Inventory of Landfill Gas
119
emissions due to the collection efficiency of the landfill gas collection system. Microorganisms in the soil can oxidize some of the organic components present in the gas before they reach the surface.
The default values for biodegradation of this uncollected gas before it is released to the environment are presented in Table 23. The default values given in Table 23 were selected in consideration of a body of literature that shows a wide range in methane oxidation rates. At one extreme is a study by Bogner et al. [1995] that showed landfill covers to act as actual sinks for methane. Others have shown methane oxidation rates of 16–60% [Knightley et al. 1995; Visscher et al. 1999]. These studies were done over a wide range of conditions. Actual methane oxidation will vary as a function of season (temperature), cover soil depth, density, moisture and organic content, and a host of other factors. It should be noted that the 15% oxidation rate represents only the methane that actually passes through the cover soil and not the total methane generated. The default oxidation rates for other organics that are known to biodegrade under aerobic conditions were set to 15% because no other specific data on their behavior in landfill covers is available. The oxidation rate was set to 0% for compounds that are generally nondegradable under aerobic conditions.
Table 23: Treatment Efficiencies of Soil Cover
Landfill Gas Component % Oxidation to CO2
Organic compounds:
• Methane 15
• Benzene 15
• Toluene 15
• Xylenes 15
• Ethylbenzene 15
Chlorinated compounds:
• Chloroform 0
• Carbon tetrachloride 0
• Ethylene dichloride 0
• Methylene chloride 0
• Trichloroethene 0
• Perchloroethene 0
• Vinyl chloride 15
The required parameters for this section follow.
♦ User Input Parameters:
• gasbz, percent of landfill gas that is benzene (%)
• gasch, percent of landfill gas that is chloroform (%)

6. Life-Cycle Inventory of Landfill Gas
120
• gasCH4, percent of methane in landfill gas (%)
• gasCO2, percent of landfill gas that is biomass carbon dioxide (%)
• gasct, percent of landfill gas that is biomass carbon tetrachloride (%)
• gaseb, percent of landfill gas that is ethylbenzene (%)
• gased, percent of landfill gas that is ethylene dichloride (%)
• gasmc, percent of landfill gas that is methylene chloride (%)
• gastetra, percent of landfill gas that is tetrachloroethene (%)
• gastl, percent of landfill gas that is toluene (%)
• gastri, percent of landfill gas that is trichloroethene (%)
• gasvc, percent of landfill gas that is vinyl chloride (%)
• gasxy, percent of landfill gas that is xylene (%)
• oxdbz, percent of benzene that is converted to CO2 after passing through soil (%)
• oxdch, percent of chloroform that is converted to CO2 after passing through soil (%)
• oxdCH4, percent of methane that is converted to CO2 after passing through soil (%)
• oxdct, percent of carbon tetrachloride that is converted to CO2 after passing through soil (%)
• oxdeb, percent of ethylbenzene that is converted to CO2 after passing through soil (%)
• oxded, percent of ethylene dichloride that is converted to CO2 after passing through soil (%)
• oxdmc, percent of methylene chloride that is converted to CO2 after passing through soil (%)
• oxdtetra, percent of tetrachloroethene that is converted to CO2 after passing through soil (%)
• oxdtl, percent of toluene that is converted to CO2 after passing through soil (%)
• oxdtri, percent of trichloroethene that is converted to CO2 after passing through soil (%)
• oxdvc, percent of vinyl chloride that is converted to CO2 after passing through soil (%)
• oxdxy, percent of xylene that is converted to CO2 after passing through soil (%)
• P, pressure (atm)
• R, universal gas constant (L-atm)/(mol-K)
• T, temperature (K)
♦ Calculated Parameters:
• G_TBS G_A_CH4, CH4 in landfill gas after passing through soil (lb/ton waste)
• G_TBS G_A_CO2_BM, biomass CO2 emitted after treatment by soil (lb/ton waste)
• G_UN G_A_CO2_BM, biomass CO2 in uncollected gas (mol/ton waste)

6. Life-Cycle Inventory of Landfill Gas
121
• gassoiltrt, volume of gas treated by soil (ft3/ton waste)
• gassoiltrt2, volume of gas treated by soil (mol/ton waste)
• gasun2, gas produced prior to collection system installation (ft3/ton waste)
• gasun3, gas not collected due to gas collection system inefficiency (ft3/ton waste)
• gasun5, gas untreated to discontinuation of the gas collection system (mol gas/ton waste)
• moleCH4, lb CH4 per mole (lb CH4/mole)
• moleCO2, biomass CO2 per mole (lb CO2-B/mole)
The volume of gas that is treated by the soil is calculated as
3un2unsoiltrt gasgasgas += (199)
This volume is converted to moles per ton of waste with the following equation:
3ftL32.28
TRgasPgas soiltrt
2soiltrt ××
×= (200)
The biomass carbon dioxide in soil-treated gas is a function of the CO2 already present and the landfill gas constituents oxidized to CO2.
2COmole
100ctoxd
100ctgas
100vcoxd
100vcgas
2100
tetraoxd100
tetragas4
100trioxd
100trigas
3
100mcoxd
100mcgas
100edoxd
100edgas
2100
choxd100
chgas
100eboxd
100ebgas
8100
xyoxd
100xygas
8100
tloxd100
tlgas7
100bzoxd
100bzgas
6100
4CHoxd100
4CHgas100
2COgas
2soiltrtgas
G_A_CO2_BM G_TBS
×
+++
+++
+++
+++
×
=
⎟⎟⎟⎟⎟⎟⎟⎟⎟⎟⎟⎟⎟⎟⎟⎟
⎠
⎞
⎜⎜⎜⎜⎜⎜⎜⎜⎜⎜⎜⎜⎜⎜⎜⎜
⎝
⎛
⎟⎟⎟⎟⎟⎟⎟⎟⎟⎟⎟⎟⎟⎟⎟⎟
⎠
⎞
⎜⎜⎜⎜⎜⎜⎜⎜⎜⎜⎜⎜⎜⎜⎜⎜
⎝
⎛
⎟⎟⎠
⎞⎜⎜⎝
⎛⎟⎟⎠
⎞⎜⎜⎝
⎛
⎟⎟⎠
⎞⎜⎜⎝
⎛⎟⎟⎠
⎞⎜⎜⎝
⎛⎟⎟⎠
⎞⎜⎜⎝
⎛⎟⎟⎠
⎞⎜⎜⎝
⎛⎟⎟⎠
⎞⎜⎜⎝
⎛⎟⎟⎠
⎞⎜⎜⎝
⎛
⎟⎟⎠
⎞⎜⎜⎝
⎛⎟⎟⎠
⎞⎜⎜⎝
⎛⎟⎟⎠
⎞⎜⎜⎝
⎛⎟⎟⎠
⎞⎜⎜⎝
⎛⎟⎟⎠
⎞⎜⎜⎝
⎛⎟⎟⎠
⎞⎜⎜⎝
⎛
⎟⎟⎠
⎞⎜⎜⎝
⎛⎟⎟⎠
⎞⎜⎜⎝
⎛⎟⎟⎠
⎞⎜⎜⎝
⎛⎟⎟⎠
⎞⎜⎜⎝
⎛⎟⎟⎠
⎞⎜⎜⎝
⎛⎟⎟⎠
⎞⎜⎜⎝
⎛
⎟⎟⎠
⎞⎜⎜⎝
⎛⎟⎟⎠
⎞⎜⎜⎝
⎛⎟⎟⎠
⎞⎜⎜⎝
⎛⎟⎟⎠
⎞⎜⎜⎝
⎛⎟⎟⎠
⎞⎜⎜⎝
⎛
(201)
The methane in landfill gas remaining after soil treatment is a function of the quantity of gas treated (gassoiltrt2), the percent methane in the gas (gasCH4), and the percent oxidation to CO2 (oxdCH4).
4CHmole1004CHoxd
11004CHgas
2soiltrtgas 4CH_A_G TBS_G ×⎟⎟⎠
⎞⎜⎜⎝
⎛⎟⎟⎠
⎞⎜⎜⎝
⎛−××= (202)
Emissions for benzene, chloroform, carbon tetrachloride, ethylene dichloride, methylene chloride, trichloroethene, tetrachloroethene, vinyl chloride, toluene, xylenes, and ethylbenzene are calculated in the same manner as methane.
The landfill gas released at the end of collection period 3 is assumed to be released through vents as well as through the soil cover. The percent of gas released through the soil cover was assumed to be 12% of the total gas generated after period 3 (based on the collection efficiency of the active gas collection system). The destruction efficiencies

6. Life-Cycle Inventory of Landfill Gas
122
are shown in Table 23. For the 88% of the gas vented, there was no chance for the gas constituents to be degraded before they were released to the environment.
As an example, the carbon dioxide in untreated gas is calculated in the following equation. Methane and trace organic emissions are calculated in a similar manner.
2COmole1002COgas
5ungasBM_2CO_A_G UN_G ××= (203)
6.5 Offsets Due to Landfill Gas Treatment
Methane in landfill gas can be used by a turbine or ICE to generate electricity or in a boiler to generate steam. The use of landfill gas results in an offset of the precombustion and combustion emissions that result from generating a comparable amount of energy with fossil fuels. In the case of a turbine or ICE, electrical energy emissions are offset. In the case of a boiler, natural gas consumption is offset. The required parameters follow.
♦ User Input Parameters:
• comb_offset a_co2_bm, combustion offset for biomass CO2 (lb CO2-B/kWh)
• n_ng_pc_e n_a_co2_bm, natural gas precombustion emission for biomass CO2 (lb/ft3 natural gas)
• n_pc ng_r_e, energy due to natural gas precombustion (Btu/ft3)
• ng_comb ng_r_e, energy obtained from combusting natural gas (Btu/ft3)
• reg_comb_btu_offset_per_kwh, Btu offset per electric energy use (Btu/electric energy)
♦ Calculated Parameters:
• gas1, gas produced and collected during the first collection period (ft3/ton waste)
• gas1du, use of boiler in first landfill gas treatment period (%)
• gas1ice, use of ICE during first landfill gas treatment period (%)
• gas1trbn, use of turbine during first landfill gas treatment period (%)
• gasCH4, percent of methane in landfill gas (%)
• OFF_DU G_A_CO2_BM, total biomass CO2 offset when a boiler is used to treat landfill gas (lb CO2-B/ton waste)
• OFF_DU1 G_A_CO2_BM, biomass CO2 that is offset when a boiler is used in the first collection period (lb CO2-B/ton waste)
• OFF_DU1 G_ENGR, energy offset when using a boiler to treat landfill gas in the first treatment period (Btu/ton waste)
• OFF_DU2 G_A_CO2_BM, biomass CO2 that is offset when a boiler is used in the second collection period (lb CO2-B/ton waste)
• OFF_DU3 G_A_CO2_BM, biomass CO2 that is offset when a boiler is used in the third collection period (lb CO2-B/ton waste)

6. Life-Cycle Inventory of Landfill Gas
123
• OFF_ICE G_A_CO2_BM, total biomass CO2 offset when an ICE is used to treat landfill gas (lb CO2-B/ton waste)
• OFF_ICE1 G_A_CO2_BM, biomass CO2 that is offset when an ICE is used (lb CO2-B/ton waste)
• OFF_ICE2 G_A_CO2_BM, biomass CO2 that is offset when an ICE is used in the first collection period (lb CO2-B/ton waste)
• OFF_ICE3 G_A_CO2_BM, biomass CO2 that is offset when an ICE is used in the second collection period (lb CO2-B/ton waste)
• OFF_TRBN G_A_CO2_BM, total biomass CO2 offset when a turbine is used to treat landfill gas (lb CO2-B/ton waste)
• OFF_TRBN1 G_A_CO2_BM, biomass CO2 that is offset when a turbine is used the first collection period (lb CO2-B/ton waste)
• OFF_TRBN1 G_ENGR, energy offset when using a turbine to treat landfill gas during the first treatment period (Btu/ton waste)
• OFF_TRBN2 G_A_CO2_BM, biomass CO2 that is offset when a turbine is used the second collection period (lb CO2-B/ton waste)
• OFF_TRBN3 G_A_CO2_BM, biomass CO2 that is offset when a turbine is used the third collection period (lb CO2-B/ton waste)
Treating natural gas in a turbine or ICE, prevents emissions that would have been made while using other fuels to generate electricity. In the Common section of the process model, the user is able to define which fuel types are not used in response to implementation of an energy recovery landfill. The default values are oil and coal. The energy that is “saved” by combusting natural gas in a turbine during the first treatment period and by not burning oil and coal is calculated as
kwh_per_offset_btu_comb_reg
ng_r_e comb_ng100
trbn1gas
1004CHgas
1gaskWh thermal
kWh electric 33.0Btu 3413
kWh
G_ENGR 1TRBN_OFF
×⎟⎠⎞
⎜⎝⎛×⎟
⎠⎞
⎜⎝⎛
=
×××× (204)
The model also calculates the atmospheric, solid waste and waterborne emissions that are offset by processing landfill gas in a turbine or ICE. For example, the biomass CO2 offset by using a turbine in the first treatment periods is calculated as
a_co2_bm offset_combng_r_e comb_ng
1001gas
100gasgas
G_A_CO2_BM 1TRBN_OFF
kWh thermalkWh electric 33.0
Btu 3413kWhtrbn4CH
1 ×⎟⎠⎞
⎜⎝⎛×⎟
⎠⎞
⎜⎝⎛××××
= (205)
Treating landfill gas in a boiler prevents emissions that would have been made by mining natural gas. To illustrate, the energy and biomass carbon dioxide offsets from treating landfill gas in a boiler during the first treatment period are calculated in equations 190–191. In the model, offsets are calculated for each of the inventory flow parameters and for each of the three treatment periods.

6. Life-Cycle Inventory of Landfill Gas
124
ng_r_e pc_ng100du1gas
1004CHgas
1gasG_ENGR 1DU_OFF ×××= (206)
n_a_co2_bm e_pc_ng_n100du1gas
1004CHgas
1gasG_A_CO2_BM 1DU_OFF ×××= (207)
The offsets incurred by treating landfill gas in all three collection and treatment periods are summed to obtain the total offsets. For example, the total biomass CO2 offset by treating gas in a turbine, boiler, and ICE is calculated in the following equations:
Turbine
OFF TRBN G__ A_ CO2_ BM =
OFF_ TRBN1 G_ A_ CO2_ BM +
OFF_ TRBN2 G_ A_ CO2_ BM +
OFF_ TRBN3 G_ A_ CO2_ BM
⎛
⎝
⎜⎜⎜
⎞
⎠
⎟⎟⎟
(208)
Boiler
OFF DU G__ A_ CO2_ BM = OFF_ DU1 G_ A_ CO2_ BM +OFF_ DU2 G_ A_ CO2_ BM +OFF_ DU3 G_ A_ CO2_ BM
⎛
⎝
⎜⎜⎜
⎞
⎠
⎟⎟⎟
(209)
ICE
OFF ICE G__ A_ CO2_ BM = OFF_ ICE G_ A_ CO2_ BM +OFF_ ICE G_ A_ CO2_ BM +OFF_ ICE G_ A_ CO2_ BM
⎛
⎝
⎜⎜⎜
⎞
⎠
⎟⎟⎟
(210)
6.6 Total Landfill Gas Emissions
Total landfill gas emissions are a function of the equipment emissions, gas constituents remaining after treatment, the offsets incurred by using landfill gas and uncollected gaseous emissions. The required calculated parameters follow.
♦ Calculated Parameters:
• COM_DU G_A_CO2_BM, total biomass CO2 emitted after treatment in a boiler (lb/ton waste)
• COM_FLR G_A_ CO2_BM, total biomass CO2 emitted after flaring (lb/ton waste)
• COM_ICE G_A_ CO2_BM, total biomass CO2 emitted after treatment in an ICE (lb/ton waste)
• COM_TRBN G_A_ CO2_BM, total biomass CO2 emitted after treatment in a turbine (lb/ton waste)
• COM_VNT G_A_ CO2_BM, total biomass CO2 emitted after venting (lb/ton waste)
• DU G_A_CO2_BM, total biomass CO2 emissions from a boiler (lb/ton waste)
• EE_DU G_A_CO2_BM, total biomass CO2 emissions from a boiler (lb/ton waste)

6. Life-Cycle Inventory of Landfill Gas
125
• EE_FLR G_A_CO2_BM, total biomass CO2 emitted from a flare during all three landfill gas treatment periods (lb/ton waste)
• EE_ICE G_A_CO2_BM, total biomass CO2 emitted from an ICE during all three landfill gas treatments (lb/ton waste)
• EE_TRBN G_A_CO2_BM, total biomass CO2 emitted from a turbine during all three landfill gas treatments (lb/ton waste)
• FLR G_A_CO2_BM, total biomass CO2 emissions from a flare (lb/ton waste)
• ICE G_A_CO2_BM, total biomass CO2 emissions from an ICE (lb/ton waste)
• OFF_DU G_A_CO2_BM, total biomass CO2 offset when a boiler is used to treat landfill gas (lb CO2-B/ton waste)
• OFF_ICE G_A_CO2_BM, total biomass CO2 offset when an ICE is used to treat landfill gas (lb CO2-B/ton waste)
• OFF_TRBN G_A_CO2_BM, total biomass CO2 offset when a turbine is used to treat landfill gas (lb CO2-B/ton waste)
• TRBN G_A_CO2_BM, total biomass CO2 emissions from a turbine (lb/ton waste)
• VNT G_A_CO2_BM, total biomass CO2 emissions from a vent (lb/ton waste)
• LG_TOTAL G_A_CO2_BM, total biomass CO2 emitted during landfill gas production, collection, and treatment (lb/ton waste)
• G_TBS G_A_CO2_BM, biomass CO2 emitted after treatment by soil (lb/ton waste)
• G_UN G_A_CO2_BM, biomass CO2 in uncollected gas (mol/ton waste)
Carbon dioxide emissions from a vent, flare, turbine, boiler, and ICE are calculated equations 211–215.
Vent
_BM G_A_CO2 VNT_COM BM_2CO_A_G VNT = (211)
Flare
⎟⎟⎠
⎞⎜⎜⎝
⎛ +=
_BM G_A_CO2 EE_FLR G_A_CO2_BM FLR_COM
BM_2CO_A_G FLR (212)
Turbine
( )
TRBN G_
OFF TRBN G_
A_ CO2_ BM =
COM_ TRBN G_ A_ CO2_ BM +EE_ TRBN G_ A_ CO2_ BM
A_ CO2_ BM⎛⎝⎜
⎞⎠⎟ − _
(213)

6. Life-Cycle Inventory of Landfill Gas
126
Boiler
( )
DU G_
OFF DU G_
A_ CO2_ BM =
COM_ DU G_ A_ CO2_ BM +EE_ DU G_ A_ CO2_ BM
A_ CO2_ BM⎛⎝⎜
⎞⎠⎟ − _
(214)
ICE
( )
ICE G_
OFF ICE G_
A_ CO2_ BM =
COM_ ICE G_ A_ CO2_ BM +EE_ ICE G_ A_ CO2_ BM
A_ CO2_ BM⎛⎝⎜
⎞⎠⎟ − _
(215)
Total gas emissions include untreated and treated emissions. Total biomass CO2 emissions from a boiler are calculated as
⎟⎟⎟⎟⎟⎟⎟⎟
⎠
⎞
⎜⎜⎜⎜⎜⎜⎜⎜
⎝
⎛
G_A_CO2_BM ICE+ G_A_CO2_BM TRBN
+ G_A_CO2_BM FLR+ G_A_CO2_BM VNT
+ G_A_CO2_BM G_UN+ G_A_CO2_BM G_TBS
= G_A_CO2_BM TOTAL_LG (216)
6.7 Gas Allocation
Unlike the operation, closure, and post-closure phases of the landfill life cycle, the landfill gas LCI results depend heavily on the composition of the waste landfilled. Since landfill gas emissions are a by-product of waste decomposition, if the composition (and degradability) of the waste changes, the landfill gas LCI results also change. Thus, landfilling one ton of glass does not yield the same landfill gas LCI results as landfilling one ton of paper. The procedure chosen to allocate landfill gas is based on the waste component’s biodegradability.
♦ User Input Parameters:
• GH2O, moisture content of a waste stream component (%)
• GDWF, wet weight fraction of a waste stream component
• CH4DRY, dry weight methane yield of a waste stream component (ft3 CH4/dry lb)
• gasCH4, percent of methane in landfill gas (%)
♦ Calculated Parameters:
• CH4WW, wet weight methane yield (ft3/wet lb component)
• CH4WWF, methane yield per wet pound (ft3/wet lb CH4)

6. Life-Cycle Inventory of Landfill Gas
127
• GLAB, gas yield per wet ton waste (ft3 gas/wet ton waste)
• GP GOFF, the contribution of office paper to the total gas produced by an average ton of MSW (%)
• GP, the contribution of a waste component to the landfill gas produced by an average ton (%)
• GWW, wet weight (tons)
• GWWF, wet weight fraction
• LGOFF A_G_A_CO2_BM, biomass CO2 allocated to office paper (lb CO2-B/ton waste)
• LGOFF G_AH_BZ, benzene allocated to office paper (lb benzene/ton waste)
• LG_TOTAL G_A_CO2_BM, total biomass CO2 emitted during landfill gas production, collection, and treatment (lb/ton waste)
• LGTRACE G_WH_BZ, total benzene emitted while during landfill gas production, collection, and treatment (lb benzene/ton waste)
• Lolab, ultimate gas yield based on laboratory data (ft3 gas/wet ton waste)
• SUMWW, sum of wet weights (tons)
The first step in determining the contribution of each component to the gas produced by the average ton is to define the composition of the average ton of MSW. The user does this by specifying the wet weight fraction of each component in the waste stream. Note that the composition of the average ton is not necessarily the composition of the ton actually entering the landfill. This later composition is given in the model solution.
The percent contribution of each component to the total methane yield is based on its laboratory measured methane yield. The methane yields of individual components were recently measured in a study [Eleazer et al., 1997]. The model uses this data and the user-defined waste composition to calculate the percent contribution of each component to the landfill gas yield as follows:
1. The methane yields measured on a dry weight basis are converted to a wet weight yield. The user specifies the percent moisture of each component in the waste stream. The dry weight methane yields are converted to wet weight yields with an IF statement. If the percent moisture (GH2O) equals zero, then the wet weight methane yield (CH4WW) is equal to the dry weight yield (CH4DRY). If there is moisture in the waste stream component, then the wet weight methane yield is calculated.
⎟⎟⎟⎟
⎠
⎞
⎜⎜⎜⎜
⎝
⎛
+=
100G
1
4CH,4CH,GIF4CH
O2H
DRYDRY20HWW (217)
2. Next, the component’s methane yield per wet pound of MSW is calculated. This is done by multiplying the wet weight fraction (GWWF) and the component’s laboratory methane yield (CH4WW).
WWFWWWWF G4CH4CH ×= (218)

6. Life-Cycle Inventory of Landfill Gas
128
3. The component’s methane yield per wet pound of MSW is converted to the gas yield per wet ton of MSW. To prevent a division by zero error, an IF statement is used. If there is no methane in landfill gas (gasCH4), then the gas yield (GLAB) is zero. If methane is present, then the gas yield is a function of the methane yield (CH4WWF) and the percent of methane in the gas. GLAB is calculated for each modeled waste component.
⎟⎟⎟⎟⎟
⎠
⎞
⎜⎜⎜⎜⎜
⎝
⎛
×
⎟⎟⎠
⎞⎜⎜⎝
⎛== ton
lb2000
100gas
4CH,0,0gasIFG
4CH
WWF4CHLAB (219)
4. The component methane yields are then summed to obtain the total methane yield (Lolab).
∑=
=48
1iLABilab GLo (220)
The contribution to the gas produced by the average ton is the component methane yield divided by the total methane yield.
100LoGG
lab
LABP ×= (221)
This contribution to the total is used to allocate all emissions other than trace organics. For example, the biomass carbon dioxide allocated to office paper is calculated in the following equation. Total biomass emissions (LGTOTAL G_A_CO2_BM) are allocated to office paper based on the paper’s percent degradability (GP GOFF).
( )
100G G
G_A_CO2_BM LG BMA_G_A_CO2_ LG OFFPTOTALOFF ×=
(222)
Trace organics are allocated equally across all components of the waste stream. For example, the trace organic compound benzene is allocated to office paper with the following equation:
⎟⎟⎠
⎞⎜⎜⎝
⎛=
48G_WH_BZ LG
G_AH_BZ LG TRACEOFF (223)
6.8 Default Values
6.8.1 CH4DRY, dry weight methane yield of a waste stream component (ft3 CH4/dry lb)
6.8.2 comb_offset a_co2_bm, combustion offset for biomass CO2 (lb biomass CO2/kWh) (Electric Energy Model)
6.8.3 CMB BLR CMB_A_CO2_BM, emission of biomass CO2 after gas combustion in a boiler (lb/mol gas) (Appendix D)

6. Life-Cycle Inventory of Landfill Gas
129
6.8.4 CMB FLR CMB_A_CO2_BM, emission of biomass CO2 after gas combustion in a flare (lb/mol gas) (Appendix D)
6.8.5 CMB ICE CMB_A_CO2_BM, emission of biomass CO2 after gas combustion in an ICE (lb/mol gas) (Appendix D)
6.8.6 CMB TRBN CMB_A_CO2_BM, emission of biomass CO2 after gas combustion in a turbine (lb/mol gas) (Appendix D)
6.8.7 effdu effCH4, CH4 destruction efficiency in a boiler (99%, 99%, 99%)
6.8.8 effflr eff CH4, CH4 destruction efficiency in a flare (99%, 99%, 99%)
6.8.9 effice eff CH4, CH4 destruction efficiency in an ICE (99%, 99%, 99%)
6.8.10 efftrbn eff CH4, CH4 destruction efficiency in a turbine (99%, 99%, 99%)
6.8.11 effvnt eff CH4, CH4 destruction efficiency in a vent (0%, 0%, 0%)
6.8.12 GDWF, wet weight fraction of a waste stream component
6.8.13 GH2O, moisture content of a waste stream component (%)
6.8.14 gas1du, use of boiler in first landfill gas treatment period (0%, 0%, 0%)
6.8.15 gas1flr, use of flare during the first landfill gas treatment period (0%, 0%, 0%)
6.8.16 gas1ice, use of ICE during first landfill gas treatment period (0%, 0%, 0%)
6.8.17 gas1trbn, use of turbine during first landfill gas treatment period (0%, 0%, 0%)
6.8.18 gas1vnt, use of vent during the first landfill gas treatment period (100%, 100%, 100%)
6.8.19 gas2du, use of boiler during second landfill gas treatment period (0%, 0%, 0%)
6.8.20 gas2flr, use of flare during the second landfill gas treatment period (100%, 0%, 0%)
6.8.21 gas2ice, use of ICE during second landfill gas treatment period (0%, 100%, 0%)
6.8.22 gas2trbn, use of turbine during second landfill gas treatment period (0%, 0%, 0%)
6.8.23 gas2vnt, use of vent during the second landfill gas treatment period (0%, 0%, 100%)
6.8.24 gas3du, use of boiler during third landfill gas treatment period (0%, 0%, 0%)
6.8.25 gas3flr, use of flare during the third landfill gas treatment period (100%, 100%, 0%)

6. Life-Cycle Inventory of Landfill Gas
130
6.8.26 gas3ice, use of ICE during third landfill gas treatment period (0%, 0%, 0%)
6.8.27 gas3trbn, use of turbine during third landfill gas treatment period (0%, 0%, 0%)
6.8.28 gas3vnt, use of vent during the third landfill gas treatment period (0%, 0%, 100%)
6.8.29 gasbz, percent of landfill gas that is benzene (1.9 × 10⁻⁴ %, 1.9 × 10⁻⁴ %, 1.9 × 10⁻⁴ %)
6.8.30 gasch, percent of landfill gas that is chloroform (3.0 × 10⁻⁶ %, 3.0 × 10⁻⁶ %, 3.0 × 10⁻⁶ %)
6.8.31 gasCH4, percent of methane in landfill gas (55%, 55%, 55%)
6.8.32 gasCO2, percent of landfill gas that is biomass carbon dioxide (45%, 45%, 45%)
6.8.33 gasct, percent of landfill gas that is biomass carbon tetrachloride (4 × 10⁻⁷ %, 4 × 10⁻⁷ %, 4 × 10⁻⁷ %)
6.8.34 gaseb, percent of landfill gas that is ethylbenzene (4.60 × 10⁻⁴ %, 4.60 × 10⁻⁴ %, 4.60 × 10⁻⁴ %)
6.8.35 gased, percent of landfill gas that is ethylene dichloride (4.10 × 10⁻⁵ %, 4.10 × 10⁻⁵ %, 4.10 × 10⁻⁵ %)
6.8.36 gasmc, percent of landfill gas that is methylene chloride (1.40 × 10⁻³ %, 1.40 × 10⁻³ %, 1.40 × 10⁻³ %)
6.8.37 gastetra, percent of landfill gas that is tetrachloroethene (3.70 × 10⁻⁴ %, 3.70 × 10⁻⁴ %, 3.70 × 10⁻⁴ %)
6.8.38 gastl, percent of landfill gas that is toluene (3.90 × 10⁻³ %, 3.90 × 10⁻³ %, 3.90 × 10⁻³ %)
6.8.39 gastri, percent of landfill gas that is trichloroethene (2.80 × 10⁻⁴ %, 2.80 × 10⁻⁴ %, 2.80 × 10⁻⁴ %)
6.8.40 gasun1, percent of gas not collected due to collection system inefficiency (12%, 12%, 12%)
6.8.41 gasvc, percent of landfill gas that is vinyl chloride (7.30 × 10⁻⁴ %, 7.30 × 10⁻⁴ %, 7.30 × 10⁻⁴ %)
6.8.42 gasxy, percent of landfill gas that is xylene (1.20 × 10⁻³ %, 1.20 × 10⁻³ %, 1.20 × 10⁻³ %)
6.8.43 k, first order decay rate constant (0.03-1 years, 0.15/years-1, 0.03/years-1)
6.8.44 lag, time between placement and start of gas generation (1 year, 0 year, 1 year)
6.8.45 Lo, total landfill gas yield potential (ft3/ton waste)
6.8.46 LoSWANA, ultimate gas yield predicted by SWANA (5,160 ft3/ton waste; 5,160 ft3/ton waste; 5,160 ft3/ton waste)
6.8.47 ng_comb ng_r_e, energy obtained from combusting natural gas (91 Btu/ft3, 91 Btu/ft3, 91 Btu/ft3) (Refer to Electric Energy Worksheet)

6. Life-Cycle Inventory of Landfill Gas
131
6.8.48 n_ng_pc_e n_a_co2_bm, natural gas precombustion emission for biomass CO2 (0 lb/ft3 natural gas, 0 lb/ft3 natural gas, 0 lb/ft3 natural gas)
6.8.49 n_pc ng_r_e, energy due to natural gas precombustion (1,020 Btu/ft3; 1,020 Btu/ft3; 1,020 Btu/ft3)
6.8.50 oxdbz, percent of benzene that is converted to CO2 after passing through soil (15%, 15%, 15%)
6.8.51 oxdch, percent of chloroform that is converted to CO2 after passing through soil (0%, 0%, 0%)
6.8.52 oxdCH4, percent of methane that is converted to CO2 after passing through soil (15%, 15%, 15%)
6.8.53 oxdct, percent of carbon tetrachloride that is converted to CO2 after passing through soil (0%, 0%, 0%)
6.8.54 oxdeb, percent of ethylbenzene that is converted to CO2 after passing through soil (15%, 15%, 15%)
6.8.55 oxded, percent of ethylene dichloride that is converted to CO2 after passing through soil (0%, 0%, 0%)
6.8.56 oxdmc, percent of methylene chloride that is converted to CO2 after passing through soil (0%, 0%, 0%)
6.8.57 oxdtetra, percent of tetrachloroethene that is converted to CO2 after passing through soil (0%, 0%, 0%)
6.8.58 oxdtl, percent of toluene that is converted to CO2 after passing through soil (15%, 15%, 15%)
6.8.59 oxdtri, percent of trichloroethene that is converted to CO2 after passing through soil (0%, 0%, 0%)
6.8.60 oxdvc, percent of vinyl chloride that is converted to CO2 after passing through soil (15%, 15%, 15%)
6.8.61 oxdxy, percent of xylene that is converted to CO2 after passing through soil (15%, 15%, 15%)
6.8.62 P, pressure (atm)
6.8.63 R, universal gas constant (L-atm)/(mol-K)
6.8.64 reg_comb_btu_offset_per_kwh, Btu offset per electric energy use (Btu/electric energy)
6.8.65 s, first order rise phase constant (1/year, 0.3/year, 1/year)
6.8.66 T, temperature (273 K, 273 K, 273 K)
6.8.67 t0, time to implementation of first gas collection system (2 years, 2 years, 2 years)
6.8.68 t1,time to implementation of second gas collection system (5 years, 5 years, 5 years)
6.8.69 t2, time to implementation of third gas collection system (40 years, 40 years, 40 years)
6.8.70 t3, time to discontinuation of third gas collection system (80 years, 80 years, 80 years)
6.8.71 time, selected time horizon (20, 100 or 500 years)

6. Life-Cycle Inventory of Landfill Gas
132
6.8.72 z12a, enter 1 to use the ultimate gas yield predicted by SWANA or enter 0 to use the laboratory ultimate gas yield

133
7.0 Life-Cycle Inventory of Landfill Leachate
Landfill leachate contains soluble, suspended, or miscible materials removed from waste as well as products resulting from waste degradation. A leachate collection system placed on the bottom of the landfill is designed to prevent leachate from migrating out of the landfill. In the modern and ash landfill models, leachate is collected and sent to a Publicly Owned Treatment Works (POTW) for treatment. In the bioreactor landfill model, leachate is recirculated after it is collected.
The objective of this section is to model the final leachate emissions to the environment. This includes effluents from leachate that are treated and released to the environment as well as leachate pollutants that volatilize. Fugitive leachate that leaves the landfill because of collection system efficiency is also considered. The energy and materials required to treat the leachate and any fuel used to transport it are included in the LCI.
7.1 Leachate Generation
The objective of this section is to calculate the volume of leachate generated. Leachate generation and collection are defined by two sets of parameters: the fraction of precipitation that results in leachate and the manner in which the fraction changes with time. As illustrated in Figure 12, this fraction will decrease with time after refuse burial as a larger percentage of the buried refuse is covered with either an intermediate or final cover. Both the default fractions and the default time periods were selected based on a survey of landfills in which individual sites reported data on leachate generation and the amount of intermediate and final cover that was in place [Environmental Research and Education Foundation, 1997]. Based on the data collected, there was a relationship between leachate generation and the fraction of a site that had received its final cover. The default values selected correspond to time periods at which a landfill typically has some intermediate or final cover. Recall that since the model is based on one ton of MSW, the default time periods represent typical times after waste placement.
0
5
10
15
20
25
0 5 10 15 20 25 30 35 40
Years
Lea
chat
e as
a P
erce
nt o
f Pre
cipi
tatio
n
Figure 12: Leachate as a Percent of Precipitation

7. Life-Cycle Inventory of Landfill Leachate
134
The following values of leachate production as a percent of precipitation are based on field data [Environmental Research and Education Foundation, 1997]. The actual defaults are further adjusted as discussed in section 7.2.1 (refer to Figure 12):
• Leachate Production Period 1: waste 0 to 1.5 years old, 20% of precipitation
• Leachate Production Period 2: waste 1.5 to 5 years old, 6.6% of precipitation
• Leachate Production Period 3: waste 5 to 10 years old, 6.5% of precipitation
• Leachate Production Period 4: waste 10 years old and older, 0.04% of precipitation (see section 7.2.1).
7.2 Leachate Collection and Management
7.2.1 Overview
Once the amount of leachate generated has been established, we begin to examine how this leachate is managed. For traditional and ash landfills, this generally means treatment of collected leachate; while for a bioreactor landfill, this means initiation of leachate recirculation. To begin, the model allows for the specification of three leachate collection periods, henceforth referred to as collection periods 1, 2, and 3. Note the leachate collection periods are not the same as the leachate generation periods defined in the previous section. Collection period 1 can represent an initial period when no leachate is generated, and therefore none is recirculated for a bioreactor landfill. Period 2 is intended to represent the period over which leachate is collected and either treated (traditional and ash landfills) or recirculated (bioreactor landfill). Period 3 represents some time after the end of the post-closure monitoring period. Management alternatives for leachate in period 3 are discussed in more detail below.
Regarding collection period 1, when refuse is first buried in a landfill it is below field capacity. Thus, in theory the refuse will soak up the first volume of water that infiltrates into a landfill, and this will reduce the volume of leachate generated. To allow the potential to account for this initial uptake of water, the user has the opportunity to specify a period of time (collection period 1) after refuse burial during which no leachate is generated. During this period, all infiltration is assumed to be taken up by the refuse. However, the default value for this time period has been set to zero so that a user input fraction of precipitation becomes leachate starting with waste placement. This is consistent with field data noted in section 7.1.
During collection period 2, leachate is collected and treated (or recirculated in a bioreactor landfill). A fraction of the leachate is directly released to the environment because of system inefficiency as discussed below. Leachate generated and collected in traditional and ash landfills is sent to a POTW. The leachate generated and collected in a bioreactor landfill is recirculated. The parameter that is used to allow one series of equations to apply for all three landfill types is the “% of collected leachate routed to a publicly owned treatment works (POTW).” As presented in Table 24, the default value is set to 100% for ash and traditional landfills during collection period 2 and 0% for a bioreactor landfill during the same period.
The end of collection period 2 represents the end of the post-closure monitoring period, which is often assumed to be 30 years after placement of the final cover. Since the landfill process model is based on a ton of MSW, the default post-closure monitoring period ends at a time that represents 30 years plus the average time that a ton of

7. Life-Cycle Inventory of Landfill Leachate
135
Table 24: Percent of Leachate Sent to POTW
Period Traditional Bioreactor Ash
1: After waste placement and before recirculation 0 0 0
2: During recirculation 100 0 100
3: After the end of recirculation and before the end of treatment 100 0 100
MSW is in a landfill prior to placement of the final cover. The assumption that a landfill has a useful life of 20 years and that a ton of waste is placed in the middle of the useful life (10 years) suggests that the end of the post-closure monitoring period would be 40 years after waste placement. Thus, the default value for the end of leachate collection period 2 is 40 years.
Collection period 3 extends from the end of collection period 2 to the end of the user-selected time horizon over which model results are to be calculated (20, 100, or 500 years). The management of leachate in collection period 3 is difficult to address because of the absence of long-term data on how much leachate will be generated and how this leachate should be managed. In the development of Subtitle D regulations and the concept of a post-closure monitoring period, U.S. EPA was apparently assuming that there would be little or no leachate to collect at the end of the post-closure monitoring period. This appears quite reasonable as discussed below.
Subtitle D regulations specify that the landfill final cover should be no more permeable than the bottom liner. As the bottom liner is typically a composite liner that includes a geomembrane and 2 ft of clay, the regulations require a composite liner in the final cover. With this as a basis, the amount of leachate generated after the end of post-closure monitoring is quite small. Assuming that the final cover is 99.8% efficient, only 0.2% of the water that reaches that final cover will infiltrate into the landfill. Furthermore, if it is assumed that 80% of rainfall is lost by evapotranspiration plus runoff, then the amount of water that would actually enter the landfill is 0.04% precipitation. The leachate collection efficiency of 99.8% is an input parameter and applies to both the cover and the liner (section 7.3.1).
With this background, the process model has been written to provide the user with flexibility on how to manage leachate at the end of the post-closure period. In collection period 3, the user must specify whether leachate is (1) released to the environment or (2) contained in the landfill. In either case, the actual amount generated will be quite small (0.04% precipitation) as discussed above. If the user wishes to continue leachate treatment (traditional and ash) or leachate recirculation (bioreactor), then the user can simply specify that collection periods 2 and 3 last for 500 years which is the maximum time period used for LCI calculations in this model. As described here, the actual amount of water released to the environment after the end of the post-closure monitoring period is likely quite small if not zero. For example, 40 in./year of rainfall and 0.04% infiltration represents 434 gal/acre/year. If it is assumed that buried refuse is at 40% moisture and that field capacity is 50%, then the moisture-holding capacity of the refuse is 1.64 million gal/acre, which represents 3,785 years of infiltration. Similarly, if the bottom clay liner is assumed to be 3 ft thick, to have a porosity of 20%, and to be at 90% of saturation, then the bottom clay liner has a moisture-holding capacity of 19,550 gal/acre, which represents 45 years of infiltration. Neither the capacity of the refuse nor the soil is considered in the landfill process model. Furthermore, there is no allowance for any treatment in the soil layer. Thus, the statement that water is released to the environment is more a result of the need to write a mathematical model that includes a value greater than zero than a perfect representation of reality.

7. Life-Cycle Inventory of Landfill Leachate
136
To represent the case where there is no significant leachate to be collected at the end of the post-closure monitoring period, the following default values can be used to describe the Leachate Production Periods described in section 7.1:
• Leachate Production Period 1: waste 0 to 1.5 years old, 20% of precipitation
• Leachate Production Period 2: waste 1.5 to 5 years old, 6.6% of precipitation
• Leachate Production Period 3: waste 5 to 10 years old, 6.5% of precipitation
• Leachate Production Period 4: waste 10 to 500, 0.04% of precipitation
The leachate production periods and leachate generation fractions presented here represent the default assumptions, along with the assumption that whatever leachate is generated (0.04% of precipitation) is released to the environment. These defaults may be altered by the user to reflect a range of leachate management scenarios. The remainder of this section presents the equations required to represent leachate collection and management.
7.2.2 Leachate Production and Collection by Period
The amount of leachate produced during the following leachate collection periods is also calculated:
1. during collection period 1 (lchtgen2)
2. during collection period 2 (lchtgen3)
3. during collection period 3 (lchtgen4)
The required parameters follow.
♦ Input Parameters:
• lcht2, end of first leachate production period (years)
• lcht4, end of second leachate production period (years)
• lcht6, end of third leachate production period (years)
• ppt1, percent of rainfall that becomes leachate during the first period (%)
• ppt2, percent of rainfall that becomes leachate during the second period (%)
• ppt3, percent of rainfall that becomes leachate during the third period (%)
• ppt4, percent of rainfall that becomes leachate during the fourth period (%)
• pptyear, annual precipitation (in.)
• time1, start of leachate collection period 1 (years)
♦ Calculated Parameters:
• lcht1, start of first leachate production period (years)
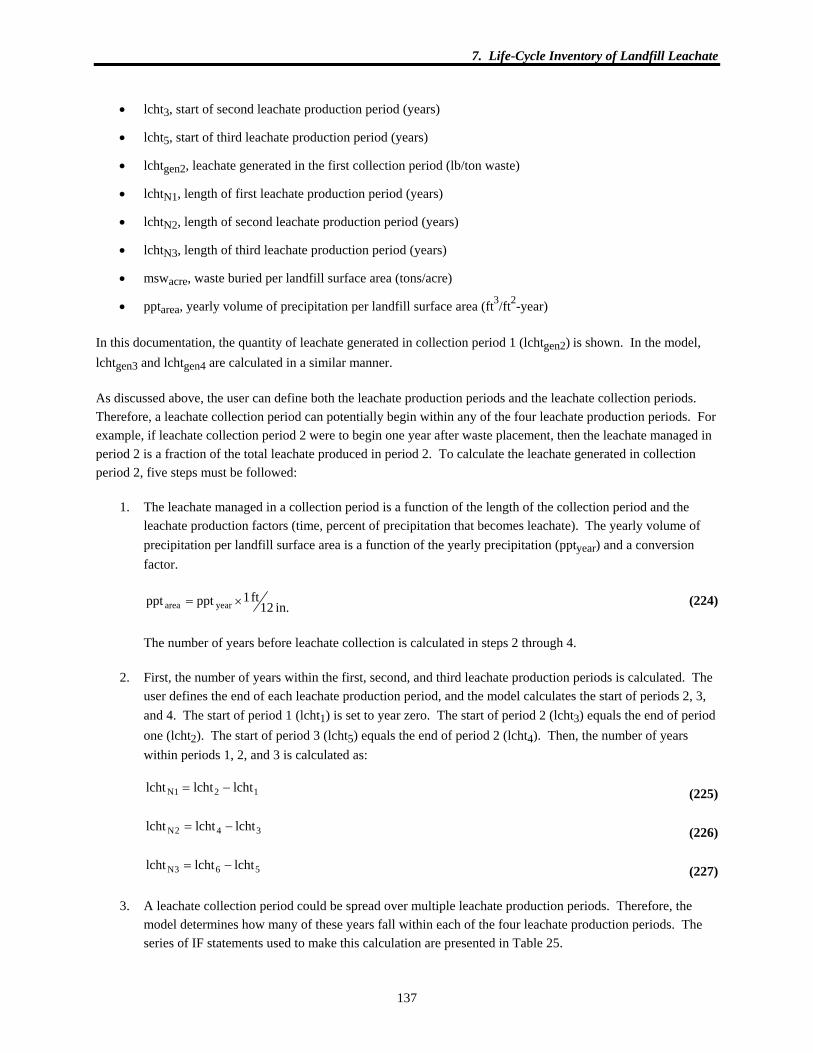
7. Life-Cycle Inventory of Landfill Leachate
137
• lcht3, start of second leachate production period (years)
• lcht5, start of third leachate production period (years)
• lchtgen2, leachate generated in the first collection period (lb/ton waste)
• lchtN1, length of first leachate production period (years)
• lchtN2, length of second leachate production period (years)
• lchtN3, length of third leachate production period (years)
• mswacre, waste buried per landfill surface area (tons/acre)
• pptarea, yearly volume of precipitation per landfill surface area (ft3/ft2-year)
In this documentation, the quantity of leachate generated in collection period 1 (lchtgen2) is shown. In the model, lchtgen3 and lchtgen4 are calculated in a similar manner.
As discussed above, the user can define both the leachate production periods and the leachate collection periods. Therefore, a leachate collection period can potentially begin within any of the four leachate production periods. For example, if leachate collection period 2 were to begin one year after waste placement, then the leachate managed in period 2 is a fraction of the total leachate produced in period 2. To calculate the leachate generated in collection period 2, five steps must be followed:
1. The leachate managed in a collection period is a function of the length of the collection period and the leachate production factors (time, percent of precipitation that becomes leachate). The yearly volume of precipitation per landfill surface area is a function of the yearly precipitation (pptyear) and a conversion factor.
in. 12ft 1pptppt yeararea ×= (224)
The number of years before leachate collection is calculated in steps 2 through 4.
2. First, the number of years within the first, second, and third leachate production periods is calculated. The user defines the end of each leachate production period, and the model calculates the start of periods 2, 3, and 4. The start of period 1 (lcht1) is set to year zero. The start of period 2 (lcht3) equals the end of period one (lcht2). The start of period 3 (lcht5) equals the end of period 2 (lcht4). Then, the number of years within periods 1, 2, and 3 is calculated as:
lcht lcht lchtN1 2 1= − (225)
342N lchtlchtlcht −= (226)
563N lchtlchtlcht −= (227)
3. A leachate collection period could be spread over multiple leachate production periods. Therefore, the model determines how many of these years fall within each of the four leachate production periods. The series of IF statements used to make this calculation are presented in Table 25.

7. Life-Cycle Inventory of Landfill Leachate
138
Table 25: Years Within Leachate Production Period
A B C
1 Period Years Remaining Number of Years that Fall Within the Period
2 1 IF (time1 > lchtN1, lchtN1, time1)
3 2 IF ((time1-lchtN1) < 0, 0, time1 - lchtN1) IF (B3 > lchtN2, lchtN2, B3)
4 3 IF ((B3-lchtN2) < 0, 0, B3 - lchtN2) IF (C4 > BchtN3, lchtN3, B4)
5 4 IF ((B4-lchtN3) < 0, 0, B4 - lchtN30 B5
4. The leachate generated in production periods 1, 2, 3, and 4 (ft3/ft2) is calculated in the following equations. The number of years from each leachate production period that are used in the calculations is calculated in column C of Table 25.
1 period within years ofnumber ppt
100ppt
1 period during produced leachate
area1 ××=⎟⎟
⎠
⎞⎜⎜⎝
⎛
(228)
2 period within years ofnumber ppt
100ppt
2 period during produced leachate
area2 ××=⎟⎟
⎠
⎞⎜⎜⎝
⎛
(229)
3 period within years ofnumber ppt
100ppt
3 period during produced leachate
area3 ××=⎟⎟
⎠
⎞⎜⎜⎝
⎛
(230)
4 period within years ofnumber ppt
100ppt
4 period during produced leachate
area4 ××=⎟⎟
⎠
⎞⎜⎜⎝
⎛
(231)
5. The total leachate generated is calculated by adding the leachate produced during each period. This total is converted to a mass in the following equation.
Llb. 20.2
ft L 32.28
acreft 43563
msw1leachatelcht 3
2
acre3gen ××××= (232)
The tons of MSW per acre (mswacre) are calculated in equation 100 in section 3.1.
These five steps are repeated to calculate the amount of leachate generated in each collection period. The leachate generated in collection period 2 (lchtgen3) is the difference between the total leachate generated before the period 2 ends and the leachate generated before period 2 begins. The leachate generated in collection period 3 (lchtgen4) is the total leachate generated minus the leachate generated in collection periods 1 and 2.
7.2.3 Management Alternatives for Leachate Collection Period 3
As discussed above, the model may be configured so that leachate is treated for 500 years by extending collection period 2 and 3 to 500 years and setting the time horizon to 500 years. If collection periods 2 and 3 are less than 500

7. Life-Cycle Inventory of Landfill Leachate
139
years, then leachate produced after treatment must either be contained in the landfill or released to the environment. The equations to address leachate management after treatment are presented in this section.
For the traditional and ash landfills, the user can choose whether to keep all leachate in the landfill after treatment or release this leachate to the environment. The user can do this by entering a 0 or 1 for the new variable called “lcht_release.” The user can enter a 0 to keep leachate in the landfill after the treatment period ends. The user can enter a 1 to release all leachate generated after the treatment period to the environment. In either case, the volume of leachate produced will be governed by the fraction of precipitation that becomes leachate, and the fraction of leachate released (for either a 0 or a 1) will be governed by the leachate collection efficiency.
In the bioreactor landfill, leachate can be released to the environment by entering 0 for both the leachate collection efficiency and for the percent leachate sent to the POTW in all collection periods.
This documentation presents equations for modeling leachate released in traditional and ash landfills. In the model some leachate quality parameters have constant concentrations, while the concentration of other constituents varies over time. This documentation also presents equations for calculating emissions for a parameter with constant concentration such as Total Suspended Solids (TSS) and for a parameter with variable concentration such as Biochemical Oxygen Demand (BOD).
7.2.3.1 Leachate contained within the landfill
The required parameters follow for leachate contained within a landfill.
♦ Input Parameters:
• dlcht, density of leachate (lb/gal)
• lchtTSS, concentration of TSS (lb TSS/gal leachate)
♦ Calculated Parameters:
• BODgen1, BOD generated during the chosen time horizon (lb/gal leachate)
• lchtuncol, leachate uncollected during chosen time horizon due to system efficiency (lb/ton waste)
If the user chooses 0 for the variable “lcht_release,” then the leachate is held in the landfill after treatment. Therefore, the fugitive leachate equals the leachate released because of collection system efficiency. The concentration of TSS and BOD in the fugitive leachate is calculated in the following equations:
lcht
uncolTSS d1lchtlcht ×× (233)
lcht
uncol1gen d1lchtBOD ×× (234)

7. Life-Cycle Inventory of Landfill Leachate
140
7.2.3.2 Leachate released to the environment
If the leachate is released to the environment, the fugitive leachate equals the leachate that escapes due to collection efficiency during treatment plus the leachate released to the environment once treatment is discontinued. The amount of fugitive leachate escaping during treatment and the amount of leachate released after treatment are calculated below. The required parameters follow for leachate released because of collection efficiency.
♦ Input Parameters:
• dlcht, density of leachate (lb/gal)
• lchtp, leachate collection efficiency (%)
• lchtTSS, concentration of TSS (lb TSS/gal leachate)
• time, selected time horizon (20, 100, or 500 years)
• time3, end of leachate collection period 3 (years)
♦ Calculated Parameters:
• BODgen1, BOD generated during the chosen time horizon (lb gal/leachate)
• BODgen2, BOD generated during treatment years (lb/gal leachate)
• lchtgen1, leachate generated during time horizon (lb/ton waste)
• leachate generated before treatment ends (lb/ton waste)
• L_UNCOL L_W_BOD, BOD in fugitive leachate (lb BOD/ton waste)
• L_UNCOL L_W_SS, suspended solids in fugitive leachate (lb TSS/ton waste)
The amount of fugitive leachate released before treatment ends depends on the time horizon for which the user chooses to report emissions (20, 100, or 500 years). Thus, the fugitive leachate must be calculated using an IF statement. If the time horizon ends before leachate treatment is completed, then the concentration of TSS in fugitive leachate (lb TSS/ton waste) is a function of the leachate produced during the time horizon (lb leachate/ton waste), density of leachate (lb leachate/gal leachate) leachate collection efficiency (%), and the concentration of TSS (lb TSS/gal leachate). If the time horizon extends beyond the leachate treatment period, then the concentration of TSS in fugitive leachate (lb leachate/ton waste) is a function of the amount of leachate generated before treatment ends (lb/ton waste), leachate collection efficiency (%), density of leachate (lb leachate/gal leachate) and concentration of TSS (lb TSS/gal leachate).
⎟⎟⎟⎟⎟⎟⎟⎟⎟
⎠
⎞
⎜⎜⎜⎜⎜⎜⎜⎜⎜
⎝
⎛
×⎟⎟⎠
⎞⎜⎜⎝
⎛−××
×⎟⎟⎠
⎞⎜⎜⎝
⎛−××
≤
TSSp
lcht
TSSp
lcht1gen
3
lcht100
lcht1
d1 ends treatmentbefore generated leachate
,lcht100
lcht1
d1lcht
,timetime
IF 235)

7. Life-Cycle Inventory of Landfill Leachate
141
The concentration of BOD is calculated in a similar manner:
⎟⎟⎟⎟⎟⎟⎟⎟⎟
⎠
⎞
⎜⎜⎜⎜⎜⎜⎜⎜⎜
⎝
⎛
×⎟⎟⎠
⎞⎜⎜⎝
⎛−××
×⎟⎟⎠
⎞⎜⎜⎝
⎛−××
≤
2genp
lcht
1genp
lcht1gen
3
BOD100
lcht1
d1 ends treatmentbefore generated leachate
,BOD100
lcht1
d1lcht
,timetime
IF (236)
The required parameters follow for leachate released after the treatment period.
♦ Input Parameters:
• dlcht, density of leachate (lb/gal)
• lchtTSS, concentration of TSS (lb TSS/gal leachate)
• time, selected time horizon (20, 100, or 500 years)
• time3, end of leachate collection period 3 (years)
♦ Calculated Parameters:
• BODgen2, BOD generated during treatment years (lb/gal leachate)
• leachate generated during the time horizon (lb/ton waste)
• leachate generated before treatment ends (lb/ton waste)
The leachate produced after treatment ends also depends on the time horizon for which the user chooses to report emissions (20, 100, or 500 years). Thus, the quantity leachate must be calculated using an IF statement. If the time horizon ends before leachate treatment is completed, then the emission is zero. If the time horizon extends beyond the leachate treatment period, then the concentration of TSS in fugitive leachate (lb leachate/ton waste) is a function of the amount of leachate generated during the time horizon (lb/ton waste), the mass of leachate generated during treatment (lb/ton waste), density of leachate (lb leachate/gal leachate) and concentration of TSS (lb TSS/gal leachate).
⎟⎟⎠
⎞⎜⎜⎝
⎛××⎟⎟
⎠
⎞⎜⎜⎝
⎛⎟⎟⎠
⎞⎜⎜⎝
⎛≤ TSS
lcht3 lcht
d1
ends treatmentbefore generated leachate
- horizon time theduring
generated leachate,0,timetimeIF (237)
The concentration of BOD is calculated in a similar manner.
⎟⎟⎠
⎞⎜⎜⎝
⎛××⎟⎟
⎠
⎞⎜⎜⎝
⎛⎟⎟⎠
⎞⎜⎜⎝
⎛≤ 2gen
lcht3 BOD
d1
ends treatmentbefore generated leachate
- horizon time theduring
generated leachate,0,timetimeIF (238)
The required parameters follow for total leachate released to the environment.

7. Life-Cycle Inventory of Landfill Leachate
142
♦ Input Parameters:
• dlcht, density of leachate (lb/gal)
• lchtp, leachate collection efficiency (%)
• lchtTSS, concentration of TSS (lb TSS/gal leachate)
• time, selected time horizon (20, 100, or 500 years)
• time3, end of leachate collection period 3 (years)
♦ Calculated Parameters:
• BODgen1, BOD generated during the chosen time horizon (lb gal/leachate)
• BODgen2, BOD generated during treatment years (lb/gal leachate)
• lchtgen1, leachate generated during time horizon (lb/ton waste)
• leachate generated during the time horizon (lb/ton waste)
• leachate generated before treatment ends (lb/ton waste)
If the user chooses to release leachate after treatment to the environment, then the total released is the fugitive leachate released during the treatment years plus the leachate released after treatment ends.
⎟⎟⎟⎟⎟⎟⎟⎟⎟⎟⎟
⎠
⎞
⎜⎜⎜⎜⎜⎜⎜⎜⎜⎜⎜
⎝
⎛
⎟⎟⎠
⎞⎜⎜⎝
⎛××⎟⎟
⎠
⎞⎜⎜⎝
⎛⎟⎟⎠
⎞⎜⎜⎝
⎛
+⎟⎟⎠
⎞⎜⎜⎝
⎛×⎟⎟⎠
⎞⎜⎜⎝
⎛−××⎟⎟
⎠
⎞⎜⎜⎝
⎛
×⎟⎟⎠
⎞⎜⎜⎝
⎛−××
≤
TSSlcht
TSSp
lcht
TSSp
lcht1gen
3
lchtd
1 ends treatmentbefore
generated leachate -
horizon time theduring generated leachate
lcht100
lcht1
d1
ends treatmentbefore generated leachate
,lcht100
lcht1
d1lcht
,timetime
IF (239)
⎟⎟⎟⎟⎟⎟⎟⎟⎟⎟⎟⎟⎟⎟
⎠
⎞
⎜⎜⎜⎜⎜⎜⎜⎜⎜⎜⎜⎜⎜⎜
⎝
⎛
⎟⎟⎟⎟⎟
⎠
⎞
⎜⎜⎜⎜⎜
⎝
⎛
××
⎟⎟⎠
⎞⎜⎜⎝
⎛⎟⎟⎠
⎞⎜⎜⎝
⎛
+⎟⎟⎠
⎞⎜⎜⎝
⎛×⎟⎟⎠
⎞⎜⎜⎝
⎛−××⎟⎟
⎠
⎞⎜⎜⎝
⎛
×⎟⎟⎠
⎞⎜⎜⎝
⎛−××
≤
2genlcht
2genp
lcht
1genp
lcht1gen
3
BODd
1
treatmentduring generated leachate
- horizon time theduring
generated leachate
BOD100
lcht1
d1
ends treatmentbefore generated leachate
,BOD100
lcht1
d1lcht
,timetime
IF (240)
The required parameters follow for total fugitive leachate emission.

7. Life-Cycle Inventory of Landfill Leachate
143
♦ Input Parameters:
• dlcht, density of leachate (lb/gal)
• lchtp, leachate collection efficiency (%)
• lchtTSS, concentration of TSS (lb TSS/gal leachate)
• lcht_release, enter 0 to hold leachate with landfill; enter 1 to release leachate to the environment.
• time, selected time horizon (20, 100, or 500 years)
• time3, end of leachate collection period 3 (years)
♦ Calculated Parameters:
• BODgen1, BOD generated during the chosen time horizon (lb/gal leachate)
• BODgen2, BOD generated during treatment years (lb/gal leachate)
• lchtgen1, leachate generated during time horizon (lb/ton waste)
• leachate generated during the time horizon (lb/ton waste)
• leachate generated during the treatment (lb/ton waste)
• leachate generated before treatment ends (lb/ton waste)
• L_UNCOL L_W_SS, suspended solids in fugitive leachate (lb TSS/ton waste)
• L_UNCOL L_W_BOD, BOD in fugitive leachate (lb BOD/ton waste)
The total leachate released to the environment is calculated using nested IF statements. The total leachate equation combines the user input parameters from section 7.2.3 and equations 233, 234, 239, and 240. The total TSS produced is calculated as:
⎟⎟⎟⎟⎟⎟⎟⎟⎟⎟⎟⎟⎟⎟⎟⎟⎟⎟⎟⎟⎟⎟⎟⎟⎟⎟
⎠
⎞
⎜⎜⎜⎜⎜⎜⎜⎜⎜⎜⎜⎜⎜⎜⎜⎜⎜⎜⎜⎜⎜⎜⎜⎜⎜⎜
⎝
⎛
⎟⎟⎟⎟⎟⎟⎟⎟⎟⎟⎟⎟
⎠
⎞
⎜⎜⎜⎜⎜⎜⎜⎜⎜⎜⎜⎜
⎝
⎛
⎟⎟⎟
⎠
⎞
⎜⎜⎜
⎝
⎛
××
+⎟⎟⎠
⎞⎜⎜⎝
⎛×⎟⎟⎠
⎞⎜⎜⎝
⎛−××
×⎟⎟⎠
⎞⎜⎜⎝
⎛−××
≤
⎟⎟⎟⎟⎟⎟⎟⎟⎟
⎠
⎞
⎜⎜⎜⎜⎜⎜⎜⎜⎜
⎝
⎛
×⎟⎟⎠
⎞⎜⎜⎝
⎛−××
×⎟⎟⎠
⎞⎜⎜⎝
⎛−××
≤
=
=
TSSlcht
TSSp
lcht
TSSp
lcht1gen
3
TSSp
lcht
TSSp
lcht1gen
3
lchtd
1
treatmentduring generated leachate -horizon time theduring generated leachate
lcht100lcht
1d
1 ends treatmentbefore generated leachate
,lcht100lcht
1d
1lcht
,timetime
IF
,
lcht100lcht
1d
1 ends treatmentbefore generated leachate
,lcht100lcht
1d
1lcht
,timetime
IF
,0release_lcht
IF
L_W_SS UNCOL_L
(241)

7. Life-Cycle Inventory of Landfill Leachate
144
The total BOD produced is calculated in a similar manner:
⎟⎟⎟⎟⎟⎟⎟⎟⎟⎟⎟⎟⎟⎟⎟⎟⎟⎟⎟⎟⎟⎟⎟⎟⎟⎟⎟
⎠
⎞
⎜⎜⎜⎜⎜⎜⎜⎜⎜⎜⎜⎜⎜⎜⎜⎜⎜⎜⎜⎜⎜⎜⎜⎜⎜⎜⎜
⎝
⎛
⎟⎟⎟⎟⎟⎟⎟⎟⎟⎟⎟⎟
⎠
⎞
⎜⎜⎜⎜⎜⎜⎜⎜⎜⎜⎜⎜
⎝
⎛
⎟⎟⎟
⎠
⎞
⎜⎜⎜
⎝
⎛
××
+⎟⎟⎠
⎞⎜⎜⎝
⎛×⎟⎟⎠
⎞⎜⎜⎝
⎛−××
×⎟⎟⎠
⎞⎜⎜⎝
⎛−××
≤
⎟⎟⎟⎟⎟⎟⎟⎟⎟
⎠
⎞
⎜⎜⎜⎜⎜⎜⎜⎜⎜
⎝
⎛
×⎟⎟⎠
⎞⎜⎜⎝
⎛−××
×⎟⎟⎠
⎞⎜⎜⎝
⎛−××
≤
=
=
2genlcht
2genp
lcht
1genp
lcht1gen
3
2genp
lcht
1genp
lcht1gen
3
BODd
1
treatmentduring generated leachate -horizon time theduring generated leachate
BOD100
lcht1
d1 ends treatmentbefore generated leachate
,BOD100
lcht1
d1lcht
,timetime
IF
,
BOD100
lcht1
d1 ends treatmentbefore generated leachate
,BOD100
lcht1
d1lcht
,timetime
IF
,0release_lcht
IF
L_W_BOD UNCOL_L
(242)
7.3 Leachate Collection
The purpose of this section is to present equations modeling the quantity of leachate collected regarding system efficiency and the user-selected time horizon.
7.3.1 Leachate Collection Efficiency
A fraction of the leachate is uncollected because of inefficiency of the leachate collection system. The default value for landfill collection efficiency is 99.8%. The required parameters follow.
♦ User Input Parameters:
• lchtp, leachate collection efficiency (%)
♦ Calculated Parameters:
• lchtcol2, leachate collected after waste placement and before the start of collection and recirculation (lb/ton waste)
• lchtcol3, leachate collected during recirculation (lb/ton waste)
• lchtcol4, leachate collected after the end of recirculation and before the end of treatment (lb/ton waste)
• lchtgen2, leachate generated in the first collection period (lb/ton waste)

7. Life-Cycle Inventory of Landfill Leachate
145
• lchtgen3, leachate generated during recirculation (lb/ton waste)
• lchtgen4, leachate generated after the end of recirculation and before the end of treatment (lb/ton waste)
First, the quantity of leachate collected after accounting for system efficiency is calculated. For example, the quantity of leachate generated and collected before leachate recirculation begins is a function of the amount of leachate generated (lchtgen2) and the collection efficiency (lchtp).
2genp
2col lcht100
lchtlcht ×= (243)
The amount of leachate collected during the recirculation period (lchtcol3) and after the end of recirculation and before the end of treatment (lchtcol4) is calculated in the following equations:
3genp
3col lcht100
lchtlcht ×= (244)
4genp
4col lcht100
lchtlcht ×= (245)
7.3.2 Time Horizon
Emissions are reported for the 20-, 100-, or 500-year time horizon. If the user selects the 20-year time horizon, it is possible that only a fraction of the total leachate generated and collected during the treatment period will be reported. The objective of this section is to present equations that model the amount of leachate collected during the selected time horizon. The required parameters follow.
♦ User Input Parameters:
• lchtp, leachate collection efficiency (%)
• time, selected time horizon (20, 100, or 500 years)
• time1, start of leachate collection period 1 (years)
• time2, end of leachate collection period 2 (years)
• time3, end of leachate collection period 3 (years)
♦ Calculated Parameters:
• lchtcol1, leachate collected during the time horizon (lb/ton waste)
• lchtcol2, leachate collected after waste placement and before the start of collection and recirculation (lb/ton waste)
• lchtcol3, leachate collected during recirculation (lb/ton waste)
• lchtcol4, leachate collected after the end of recirculation and before the end of treatment (lb/ton waste)
• lchtgen1, leachate generated during time horizon (lb/ton waste)

7. Life-Cycle Inventory of Landfill Leachate
146
• lchttime1, leachate collected during collection period 1 and in the chosen time horizon (lb/ton waste)
• lchttime2, leachate collected during collection period 2 and in the chosen time horizon (lb/ton waste)
• lchttime3, leachate collected during collection period 3 and in the chosen time horizon (lb/ton waste)
• lchtuncol, leachate uncollected during chosen time horizon due to system efficiency (lb/ton waste)
The user has the flexibility of selecting whether the LCI emissions will be reported for the 20-, 100-, or 500- year time horizon. The amount of leachate generated during the chosen time horizon (lchtgen1) is calculated in the same manner as (lchtgen2) in section 7.2. The quantity of leachate collected during the chosen time horizon is also a function of the collection efficiency and the amount of leachate generated.
lchtlcht
lchtcolp
gen1 1100= × (246)
The user can also define the start and end of leachate recirculation and the end of treatment. Therefore, the selected time horizon can potentially end before, during, or after leachate treatment. For example, in the default case, the 20-year time horizon ends 20 years before treatment ends. Thus, only a fraction of the total leachate collected and treated is reported for this time horizon. The following equations calculate the quantity of leachate collected and treated during the chosen time horizon. For example, the quantity of leachate collected before treatment begins is calculated using an IF statement. If the time horizon (time) is longer than the time until treatment begins (time1), then lchttime1 is equal to the leachate produced and collected before treatment starts (lchtcol2). If collection starts after the time horizon ends, then lchttime1 is the amount generated in the time horizon (lchtcol1).
( )1col2col1time lcht,lcht,1timetimeIFlcht ≥= (247)
If leachate recirculation (time2) ends before the time horizon, then lchttime2 is equal to the leachate collected during recirculation. If the time horizon ends during the recirculation period, then lchttime2 is equal to the leachate collected during the time horizon minus the leachate collected before recirculation.
( )( )( )2col1col3col2time lchtlcht,0,1timetimeIF,lcht,2timetimeIFlcht −≤≥= (248)
If leachate recirculation (time3) ends before the time horizon, then lchttime2 is equal to the leachate collected during recirculation. If the time horizon ends before the recirculation period, then lchttime2 is equal to the leachate collected during the time horizon minus the leachate collected before recirculation.
( )( )( )2col3col1col4col3time lchtlchtlcht,0,2timeIF,lcht,3timetimeIFlcht −−≥= (249)
The fugitive leachate released to the environment during the chosen time horizon because of system efficiency is the difference between the leachate generated and leachate collected.
1col1genuncol lchtlchtlcht −= (250)

7. Life-Cycle Inventory of Landfill Leachate
147
7.4 Leachate Quality
In the previous section, the methodology used to calculate the quantity of leachate produced per ton of MSW over a user-specified time horizon was presented. This quantity of leachate (gal/ton MSW) must be multiplied by the relevant leachate contaminant concentration, i.e., lb BOD/gal leachate, to obtain the actual amount of a contaminant produced per ton of material buried, i.e., lb BOD/MSW. This quantity will be referred to as the contaminant yield. The contaminant yield is reduced by a contaminant-specific leachate treatment efficiency to calculate the mass of a leachate contaminant released to the environment per ton of waste buried. In addition, the contaminant yields must be developed on an MSW-component-specific basis. Thus, ultimately, the model must derive factors such as lb BOD attributable to ONP/ton MSW. The objective of this section is to present the methodology used to calculate the release of leachate contaminants to the environment on the basis of each MSW component. An overview of the methodology used to make this calculation is presented first, followed by the relevant equations. The methodology will be described using BOD as an example. The complete list of leachate constituents considered in the study is presented in Table 26.
Table 26: Leachate Constituents Considered in the Study
Organic Compounds Hydrocarbons Metals
BOD Benzene Arsenic
COD Chloroform Barium
NH3 Carbon tetrachloride Cadmium
PO4 Ethylene dichloride Chromium
TSS Methylene chloride Lead
Trichloroethene Mercury
Perchloroethene Selenium
Vinyl chloride Silver
Toluene
Xylenes
Ethylbenzene
The leachate contaminant yields are calculated based on user input values for a large number of parameters. These parameters include the annual rainfall; the desired time horizon (20, 100, 500 years); the temporal variation in leachate concentration for each leachate quality parameter based on a landfill containing MSW with a typical composition; the fraction of precipitation that becomes leachate; and a series of time periods associated with leachate generation, collection and treatment as described in the previous section. The ultimate contaminant yield is also calculated in consideration of the leachate collection and treatment efficiencies.
To calculate the component-specific BOD yield, it is first necessary to make some assumptions about the BOD concentration in leachate produced from a landfill that contains typical MSW. The default assumptions for BOD concentration versus time are illustrated in Figure 13, where the BOD concentration is observed to remain constant

7. Life-Cycle Inventory of Landfill Leachate
148
for a short period and then to decrease linearly in two segments to zero. Figure 13 is based on a landfill containing typical MSW.
0
2000
4000
6000
8000
10000
0 5 10 15 20 25 30 35 40 45 50
Age of Waste (years old)
BO
D C
once
ntra
tion
(mg/
liter
)
Figure 13: BOD Concentration in Landfill Leachate Over Time (per ton of waste)
Based on this curve and the volume of leachate produced annually, the total amount of BOD produced in lb/ton of MSW is calculated by the model. This BOD yield is based on the BOD generated in a landfill filled with typical MSW. The composition of typical MSW can be revised by the user in the landfill section of the process model. This composition of typical MSW is also used for the gas production modeling described in section 6.
The BOD yield that is calculated based on the method described in section 7.2 has units of lb BOD/ton of MSW and is based on a typical ton of MSW. This overall BOD yield must then be allocated to individual waste components. This allocation is based on the fraction of the total landfill gas that is attributed to a specific component. For example, if, based on a typical or generic ton of MSW, 20% of the landfill gas is attributable to food waste, then 20% of the total BOD for a generic ton of MSW would be attributed to food waste. The logic for this allocation strategy is that leachate BOD can only originate from the biodegradable components of MSW. Thus, if a landfill contained 100% glass, then both the gas and BOD yields would be zero in the SWM-LCI model. The default yields for BOD, COD, TSS, NH3, and PO4 for each MSW component are presented in Table 27. These yields are a result of the allocation methodology and can be adjusted by varying either the default MSW composition or the default BOD concentration.
In summary, the allocation method presented here begins by calculating the total BOD yield associated with a ton of MSW. The ton is presumed to have a typical composition and this composition is specified by the user in the landfill process model input section. Of course, the way that the SWM-LCI model works is that the composition of actual waste that is buried in a landfill is part of the model solution. Thus, it is nearly impossible for the composition of the actual ton of MSW sent to a landfill per the model solution to correspond with the composition of the average ton specified by the user. The model user is encouraged to review the model solution output and review the composition of waste to be buried in a landfill. If this composition is highly unusual, such as all glass

7. Life-Cycle Inventory of Landfill Leachate
149
and plastic or 50% food waste, then the model user should rerun the model with an adjusted composition for the typical ton of MSW and adjusted default values for the curve describing the behavior of the BOD concentration versus time. As water quality parameters are tracked but not optimizable, rerunning the model with updated information on BOD will not change the model solution.
Table 27: TSS, BOD, COD, NH3, and PO4 Yields
Waste Component TSS
lb/ton MSW
BOD
lb/ton MSW
COD
lb/ton MSW
NH3
lb/ton MSW
PO4
lb/ton MSW
Yard Trimmings, Leaves 1.62E-05 4.40E-02 1.44E-01 8.25E-05 3.30E-06
Yard Trimmings, Grass 1.74E-05 4.73E-02 1.55E-01 2.22E-02 1.56E-04
Yard Trimmings, Branches 8.17E-06 2.22E-02 7.28E-02 2.06E-04 7.92E-07
Old Newsprint 2.54E-05 6.91E-02 2.27E-01 6.74E-06 8.63E-08
Old Corrugated Cardboard 1.26E-05 3.42E-02 1.12E-01 1.82E-05 2.33E-07
Office Paper 1.21E-05 3.28E-02 1.08E-01 4.36E-06 5.58E-08
Phone Books 1.03E-06 2.75E-03 9.03E-03 2.66E-07 3.38E-09
Books 5.35E-06 1.45E-02 4.76E-02 7.95E-07 1.01E-08
Old Magazines 4.26E-06 1.15E-02 3.79E-02 1.46E-06 1.86E-08
3rd Class Mail 6.86E-06 1.86E-02 6.11E-02 2.91E-06 3.72E-08
Paper Other #1 9.46E-06 2.57E-02 8.42E-02 1.82E-09 0.00E+00
Paper Other #2 1.22E-05 3.31E-02 1.09E-01 1.82E-09 0.00E+00
Paper Other #3 8.18E-06 2.22E-02 7.28E-02 1.82E-09 0.00E+00
Paper Other #4 6.13E-07 1.63E-03 5.35E-03 1.82E-09 0.00E+00
Paper Other #5 6.13E-07 1.63E-03 5.35E-03 1.82E-09 0.00E+00
CCCR Other 1.24E-08 1.30E-08 6.39E-08 1.82E-09 0.00E+00
Mixed Paper 1.24E-08 1.30E-08 6.39E-08 1.82E-09 0.00E+00
HDPE - Translucent 1.24E-08 1.30E-08 6.39E-08 1.82E-09 0.00E+00
HDPE - Pigmented 1.24E-08 1.30E-08 6.39E-08 1.82E-09 0.00E+00
PET 1.24E-08 1.30E-08 6.39E-08 1.82E-09 0.00E+00
Plastic - Other # 1 1.24E-08 1.30E-08 6.39E-08 1.82E-09 0.00E+00
Plastic - Other # 2 1.24E-08 1.30E-08 6.39E-08 1.82E-09 0.00E+00
Plastic - Other # 3 1.24E-08 1.30E-08 6.39E-08 1.82E-09 0.00E+00
Plastic - Other # 4 1.24E-08 1.30E-08 6.39E-08 1.82E-09 0.00E+00
continued

7. Life-Cycle Inventory of Landfill Leachate
150
Table 27: Continued
Waste Component TSS
lb/ton MSW
BOD
lb/ton MSW
COD
lb/ton MSW
NH3
lb/ton MSW
PO4
lb/ton MSW
Plastic - Other # 5 1.24E-08 1.30E-08 6.39E-08 1.82E-09 0.00E+00
Mixed Plastic 1.24E-08 1.30E-08 6.39E-08 1.82E-09 0.00E+00
CCNR Other 1.24E-08 1.30E-08 6.39E-08 1.82E-09 0.00E+00
Ferrous Cans 1.24E-08 1.30E-08 6.39E-08 1.82E-09 0.00E+00
Ferrous Metal - Other 1.24E-08 1.30E-08 6.39E-08 1.82E-09 0.00E+00
Aluminum Cans 1.24E-08 1.30E-08 6.39E-08 1.82E-09 0.00E+00
Aluminum - Other #1 1.24E-08 1.30E-08 6.39E-08 1.82E-09 0.00E+00
Aluminum - Other #2 1.24E-08 1.30E-08 6.39E-08 1.82E-09 0.00E+00
Glass - Clear 1.24E-08 1.30E-08 6.39E-08 1.82E-09 0.00E+00
Glass - Brown 1.24E-08 1.30E-08 6.39E-08 1.82E-09 0.00E+00
Glass - Green 1.24E-08 1.30E-08 6.39E-08 1.82E-09 0.00E+00
Mixed Glass 1.24E-08 1.30E-08 6.39E-08 1.82E-09 0.00E+00
CNNR Other 1.24E-08 1.30E-08 6.39E-08 1.82E-09 0.00E+00
Paper - Non-recyclable 3.30E-05 8.95E-02 2.94E-01 1.82E-09 0.00E+00
Food Waste 8.06E-05 2.19E-01 7.19E-01 5.99E-03 3.45E-07
CCCN Other 1.24E-08 1.30E-08 6.39E-08 1.82E-09 0.00E+00
Plastic - Non-Recyclable 1.24E-08 1.30E-08 6.39E-08 1.82E-09 0.00E+00
Misc. 1. 1.24E-08 1.30E-08 6.39E-08 1.82E-09 0.00E+00
CCNN Other 1.24E-08 1.30E-08 6.39E-08 1.82E-09 0.00E+00
Ferrous - Non-recyclable 1.24E-08 1.30E-08 6.39E-08 1.82E-09 0.00E+00
Al - Non-recyclable 1.24E-08 1.30E-08 6.39E-08 1.82E-09 0.00E+00
Glass - Non-recyclable 1.24E-08 1.30E-08 6.39E-08 1.82E-09 0.00E+00
Misc. 0.00E+00 1.30E-08 6.39E-08 1.82E-09 0.00E+00
CNNN Other 1.24E-08 0.00E+00 6.39E-08 1.82E-09 0.00E+00
The strategy described above for BOD is also applied to the COD. However, different allocation strategies are used for the other components listed in Table 26. For both NH3 and PO4, the total yields per ton of generic MSW are allocated on a percentage basis using the percentages presented in Table 28.

7. Life-Cycle Inventory of Landfill Leachate
151
Table 28: Default Percent Contribution of Each Waste Component to NH3 and PO4 Concentrations
Waste Component NH3 PO4 Waste Component NH3 PO4
Yard Trimmings, Leaves 9.37E-01 1.02E+01 Plastic - Other # 5 0.00E+00 0.00E+00
Yard Trimmings, Grass 4.60E+01 8.78E+01 Mixed Plastic 0.00E+00 0.00E+00
Yard Trimmings, Branches 1.00E+00 1.05E+00 CCNR Other 0.00E+00 0.00E+00
Old Newsprint 3.11E-02 1.08E-01 Ferrous Cans 0.00E+00 0.00E+00
Old Corrugated Cardboard 7.43E-03 2.58E-02 Ferrous Metal - Other 0.00E+00 0.00E+00
Office Paper 5.04E-03 1.75E-02 Aluminum Cans 0.00E+00 0.00E+00
Phone Books 1.24E-03 4.30E-03 Aluminum – Other #1 0.00E+00 0.00E+00
Books 2.23E-03 7.74E-03 Aluminum - Other #2 0.00E+00 0.00E+00
Old Magazines 4.58E-03 1.59E-02 Glass – Clear 0.00E+00 0.00E+00
3rd Class Mail 7.39E-03 2.57E-02 Glass – Brown 0.00E+00 0.00E+00
Paper Other #1 0.00E+00 0.00E+00 Glass – Green 0.00E+00 0.00E+00
Paper Other #2 0.00E+00 0.00E+00 Mixed Glass 0.00E+00 0.00E+00
Paper Other #3 0.00E+00 0.00E+00 CNNR Other 0.00E+00 0.00E+00
Paper Other #4 0.00E+00 0.00E+00 Paper - Non-recyclable 0.00E+00 0.00E+00
Paper Other #5 0.00E+00 0.00E+00 Food Waste 5.20E+01 8.13E-01
CCCR Other 0.00E+00 0.00E+00 CCCN Other 0.00E+00 0.00E+00
Mixed Paper 0.00E+00 0.00E+00 Plastic – Non-Recyclable 0.00E+00 0.00E+00
HDPE - Translucent 0.00E+00 0.00E+00 Miscellaneous 1. 0.00E+00 0.00E+00
HDPE - Pigmented 0.00E+00 0.00E+00 CCNN Other 0.00E+00 0.00E+00
PET 0.00E+00 0.00E+00 Ferrous – Non-recyclable 0.00E+00 0.00E+00
Plastic - Other # 1 0.00E+00 0.00E+00 Al - Non-recyclable 0.00E+00 0.00E+00
Plastic - Other # 2 0.00E+00 0.00E+00 Glass - Non-recyclable 0.00E+00 0.00E+00
Plastic - Other # 3 0.00E+00 0.00E+00 Miscellaneous 0.00E+00 0.00E+00
Plastic - Other # 4 0.00E+00 0.00E+00 CNNN Other 0.00E+00 0.00E+00
These percentages were derived based on laboratory-scale reactors in which the decomposition and leachate composition of several MSW components were tested separately [Barlaz, 1997]. Specifically, the percent allocation represents the relative initial concentrations of NH3 and PO4 in the leachate for each individual component. Note that for both NH3 and PO4, grass and food waste account for most of the emissions.

7. Life-Cycle Inventory of Landfill Leachate
152
For all metals, the metal yield for each ton of generic MSW was allocated based on the fraction of the total metal in MSW attributable to a specific component [A. J. Chandler & Associates Ltd. et al., 1993]. These fractions are presented in Tables 29 and 30. For example, if the total arsenic yield from a generic ton of MSW was 1 lb As/ton MSW buried, and leaves contribute 2% of the arsenic to a typical ton of MSW, then the arsenic yield used in the model would be 0.02 lb As/ton. Finally, for trace organic contaminants, the yield was allocated equally across all waste components present in a typical ton of MSW. This is because there is no known scientific basis for any allocation scheme that attributes more or less of a trace organic contaminant to a specific waste component.
Table 29: Percent Contribution of Each Waste Component to Total Metal Concentration
Waste Component Arsenic Barium Cadmium Chromium Mercury Lead Selenium
Yard Trimmings, Leaves 2.10E-01 1.37E+01 1.11E+01 1.45E+01 1.52E+01 1.40E+01 1.19E-01
Yard Trimmings, Grass 6.28E-02 4.09E+00 3.32E+00 4.34E+00 4.54E+00 4.18E+00 3.56E-02
Yard Trimmings, Branches 7.38E-03 1.59E+00 5.80E-01 9.84E-01 1.24E+00 1.61E+00 1.94E-02
Old Newsprint 1.04E-02 1.03E+00 9.80E-02 4.02E+00 1.21E+01 3.13E-01 9.06E-02
Old Corrugated Cardboard 2.19E-03 8.22E-02 2.34E-02 3.27E-02 1.37E-01 4.38E-02 8.61E-03
Office Paper 3.21E-03 6.81E-02 1.59E-02 4.18E-02 2.79E-01 3.52E-02 3.65E-02
Phone Books 4.86E-04 2.02E-02 3.90E-03 3.93E-03 6.87E-02 4.61E-03 3.95E-03
Books 4.37E-04 2.45E-01 2.81E-02 4.73E-02 8.24E-02 1.73E-05 8.40E-03
Old Magazines 3.22E-03 2.43E-01 2.07E-02 1.28E-01 2.54E-01 2.15E-02 1.38E-02
3rd Class Mail 4.35E-03 1.86E-01 3.96E-01 5.95E-01 5.47E-01 2.63E+00 6.42E-03
Paper Other #1 4.49E-03 3.74E-01 1.19E-01 3.93E-01 9.76E-01 5.53E-01 3.16E-02
Paper Other #2 3.77E-03 3.14E-01 9.98E-02 3.29E-01 8.18E-01 4.64E-01 2.65E-02
Paper Other #3 2.52E-03 2.10E-01 6.68E-02 2.21E-01 5.48E-01 3.11E-01 1.78E-02
Paper Other #4 1.86E-04 1.55E-02 4.91E-03 1.62E-02 4.03E-02 2.28E-02 1.31E-03
Paper Other #5 1.86E-04 1.55E-02 4.91E-03 1.62E-02 4.03E-02 2.28E-02 1.31E-03
CCCR Other 0.00E+00 0.00E+00 0.00E+00 0.00E+00 0.00E+00 0.00E+00 0.00E+00
Mixed Paper 0.00E+00 0.00E+00 0.00E+00 0.00E+00 0.00E+00 0.00E+00 0.00E+00
HDPE - Translucent 1.44E-03 8.59E-01 5.36E-01 2.15E-01 2.17E-01 5.51E-01 8.49E-03
HDPE - Pigmented 5.67E-04 3.39E-01 2.11E-01 8.47E-02 8.55E-02 2.17E-01 3.35E-03
PET 7.29E-04 2.61E-02 3.10E-01 7.57E-02 6.87E-02 1.77E-01 2.69E-03
Plastic - Other # 1 5.25E-03 1.83E+00 2.08E+00 6.78E-01 6.60E-01 1.69E+00 2.58E-02
Plastic - Other # 2 3.85E-03 1.34E+00 1.53E+00 4.97E-01 4.84E-01 1.24E+00 1.90E-02
Plastic - Other # 3 2.55E-03 8.88E-01 1.01E+00 3.29E-01 3.21E-01 8.19E-01 1.26E-02
continued

7. Life-Cycle Inventory of Landfill Leachate
153
Table 29: Continued
Waste Component Arsenic Barium Cadmium Chromium Mercury Lead Selenium
Plastic - Other # 4 4.13E-04 1.44E-01 1.64E-01 5.33E-02 5.19E-02 1.33E-01 2.03E-03
Plastic - Other # 5 1.22E-04 4.23E-02 4.82E-02 1.57E-02 1.53E-02 3.90E-02 5.98E-04
Mixed Plastic 0.00E+00 0.00E+00 0.00E+00 0.00E+00 0.00E+00 0.00E+00 0.00E+00
CCNR Other 0.00E+00 0.00E+00 0.00E+00 0.00E+00 0.00E+00 0.00E+00 0.00E+00
Ferrous Cans 2.34E-02 5.31E-02 9.36E+00 3.21E+00 9.53E+00 3.49E+00 8.02E-03
Ferrous Metal - Other 7.86E+01 3.79E+01 1.99E+01 1.87E+01 3.14E+01 2.28E+01 1.01E+01
Aluminum Cans 5.87E-04 7.99E-01 5.66E-01 8.30E-01 2.48E-01 2.66E-01 1.08E-03
Aluminum - Other #1 3.73E-04 4.50E-02 1.53E+00 3.11E-01 1.40E-01 5.89E-06 2.75E-04
Aluminum - Other #2 1.67E+00 1.70E-01 9.50E-01 3.89E+00 1.42E-01 2.45E-01 3.62E-01
Glass - Clear 5.83E-03 7.11E+00 1.80E+00 8.13E-01 4.40E-01 2.02E+00 2.65E-01
Glass - Brown 4.16E-02 4.12E+00 6.59E-01 1.39E+00 1.36E+00 1.97E+00 1.71E-01
Glass - Green 2.00E-02 3.56E+00 3.94E-02 9.60E+00 7.71E-02 1.29E-01 7.25E-03
Mixed Glass 0.00E+00 0.00E+00 0.00E+00 0.00E+00 0.00E+00 0.00E+00 0.00E+00
CNNR Other 0.00E+00 0.00E+00 0.00E+00 0.00E+00 0.00E+00 0.00E+00 0.00E+00
Paper - Non-recyclable 1.33E-02 5.69E-01 1.21E+00 1.83E+00 1.68E+00 8.07E+00 1.97E-02
Food Waste 2.30E-02 1.19E+00 2.46E+00 2.15E+00 2.16E+00 4.36E+00 5.65E-02
CCCN Other 0.00E+00 0.00E+00 0.00E+00 0.00E+00 0.00E+00 0.00E+00 0.00E+00
Plastic - Non-Recyclable 9.34E-04 5.78E-01 3.13E+00 1.19E+00 1.23E-01 1.56E+00 4.54E-03
Miscellaneous 1. 1.57E+01 1.22E+01 3.51E+01 2.55E+01 1.24E+01 2.45E+01 8.80E+01
CCNN Other 0.00E+00 0.00E+00 0.00E+00 0.00E+00 0.00E+00 0.00E+00 0.00E+00
Ferrous - Non-recyclable 3.28E+00 1.58E+00 8.31E-01 7.81E-01 1.31E+00 9.50E-01 4.21E-01
Al - Non-recyclable 3.64E-01 3.70E-02 2.07E-01 8.49E-01 3.10E-02 5.36E-02 7.90E-02
Glass - Non-recyclable 5.37E-03 2.52E+00 5.07E-01 1.40E+00 1.73E-01 6.19E-01 7.59E-02
Miscellaneous. 0.00E+00 0.00E+00 0.00E+00 0.00E+00 0.00E+00 0.00E+00 0.00E+00
CNNN Other 0.00E+00 0.00E+00 0.00E+00 0.00E+00 0.00E+00 0.00E+00 0.00E+00

7. Life-Cycle Inventory of Landfill Leachate
154
Table 30: Percent Contribution of Each Waste Component to Total Metal Concentration
Waste Component Copper Iron Zinc Waste Component Copper Iron Zinc
Yard Trimmings, Leaves 2.59E-01 1.26E+01 2.55E+00 Plastic - Other # 5 6.97E-05 8.12E-03 6.26E-03
Yard Trimmings, Grass 7.77E-02 3.78E+00 7.65E-01 Mixed Plastic 0.00E+00 0.00E+00 0.00E+00
Yard Trimmings, Branches 4.83E-03 9.14E-01 2.48E-01 CCNR Other 0.00E+00 0.00E+00 0.00E+00
Old Newsprint 3.62E-03 3.36E-01 7.62E-02 Ferrous Cans 4.90E-03 2.20E-01 3.45E+00
Old Corrugated Cardboard 1.43E-04 3.36E-02 8.88E-03 Ferrous Metal - Other 8.07E+01 5.53E+01 2.01E+01
Office Paper 2.58E-04 5.44E-02 1.25E-01 Aluminum Cans 2.65E-02 1.91E-01 9.66E-02
Phone Books 7.95E-05 5.42E-03 1.18E-03 Aluminum - Other #1 1.70E-03 1.05E-01 1.36E-02
Books 5.72E-04 1.19E-02 2.34E-02 Aluminum - Other #2 6.51E-03 3.40E-01 5.04E+01
Old Magazines 9.19E-04 1.46E-01 1.50E-02 Glass – Clear 1.68E-03 3.72E-01 8.52E-02
3rd Class Mail 1.14E-03 1.48E-01 7.15E-02 Glass – Brown 7.26E-03 1.25E+00 3.69E-01
Paper Other #1 1.23E-03 1.25E-01 7.55E-02 Glass – Green 1.61E-04 1.46E-01 1.05E-02
Paper Other #2 1.03E-03 1.05E-01 6.33E-02 Mixed Glass 0.00E+00 0.00E+00 0.00E+00
Paper Other #3 6.92E-04 7.04E-02 4.24E-02 CNNR Other 0.00E+00 0.00E+00 0.00E+00
Paper Other #4 5.08E-05 5.18E-03 3.12E-03 Paper - Non-recyclable 3.49E-03 4.55E-01 2.19E-01
Paper Other #5 5.08E-05 5.18E-03 3.12E-03 Food Waste 1.08E-02 1.65E+00 8.67E-01
CCCR Other 0.00E+00 0.00E+00 0.00E+00 CCCN Other 0.00E+00 0.00E+00 0.00E+00
Mixed Paper 0.00E+00 0.00E+00 0.00E+00 Plastic – Non-Recyclable
6.71E-04 1.20E-01 1.78E-01
HDPE - Translucent 9.03E-04 9.74E-02 9.94E-02 Miscellaneous. 1. 1.55E+01 1.80E+01 7.48E+00
HDPE - Pigmented 3.56E-04 3.84E-02 3.92E-02 CCNN Other 0.00E+00 0.00E+00 0.00E+00
PET (used PET) 3.69E-04 4.79E-02 2.15E-02 Ferrous – Non-recyclable
3.37E+00 2.31E+00 8.37E-01
Plastic - Other # 1 3.01E-03 3.51E-01 2.71E-01 Al - Non-recyclable 1.42E-03 7.42E-02 1.10E+01
Plastic - Other # 2 2.21E-03 2.57E-01 1.99E-01 Glass - Non-recyclable 7.30E-04 1.60E-01 5.35E-02
Plastic - Other # 3 1.46E-03 1.71E-01 1.32E-01 Miscellaneous 0.00E+00 0.00E+00 0.00E+00
Plastic - Other # 4 2.37E-04 2.76E-02 2.13E-02 CNNN Other 0.00E+00 0.00E+00 0.00E+00

7. Life-Cycle Inventory of Landfill Leachate
155
7.4.1 BOD and COD
The objective of this section is to present the default BOD and COD leachate concentrations. The BOD concentration profile in Figure 13 can be broken into four time frames as shown in Table 31.
Table 31: Default Parameters for Modeling the BOD Concentration in Landfill Leachate for Traditional and Bioreactor Landfills
Traditional Landfill Time After Burial
(years)
Bioreactor Landfill Time After Burial
(years)
BOD Concentration (mg/l)
0 to 1.5 0 to 1 10,000
1.5 to 10 1 to 3 Linear Decrease From 10,000 to 1,000
10 to 50 3 to 10 Linear Decrease From 1,000 to 0
>50 > 10 0
All BOD concentrations can be changed by the user. The COD concentration in landfill leachate is calculated in a similar manner to the BOD concentration. However, instead of assuming a COD concentration in all cases (as was done for BOD), a BOD/COD ratio was assumed for the first two phases as shown in the following table (Table 32). Furthermore, rather than assuming that the COD concentration declines to zero as the waste gets older (as was done for BOD concentration), the COD concentration is assumed to be constant over time after the waste is 100 years old.
Table 32: Default Parameters for Modeling the COD Concentration in Landfill Leachate for Traditional and Bioreactor Landfills
Traditional Landfill
Time After Waste Placement (years)
Bioreactor LandfillTime After Waste Placement (years)
BOD/COD Ratio COD Concentration(mg/l)
0 to 1.5 0 to 1 0.8 12,500
1.5 to 10 1 to 3 Linear Decrease From 0.8 to 0.3
12,500 to 3,333
10 to 50 3 to 10 -- Linear Decrease From 1000 to 100
> 50 > 10 -- 100
In ash landfills, the concentration of BOD was assumed to be zero given the near complete absence of degradable organic matter and the COD concentration was assumed to be constant over time. The default COD concentration is 92.9 mg/l leachate [U.S. EPA, 1990].

7. Life-Cycle Inventory of Landfill Leachate
156
7.4.2 TSS, NH3, and PO4
As opposed to BOD and COD concentrations, which are assumed to vary over time, the concentrations of TSS, NH3, and PO4 are assumed to be constant over time. Data collected from industry and other sources were compiled to determine the concentrations of TSS, NH3, and PO4 in landfill leachate [Environmental Research and Education Foundation, 1997]. From these data, the low and high median concentrations of TSS, NH3, and PO4 were determined. These data are presented in the following table (Table 33) and are assumed to be the same for traditional and bioreactor landfills.
Table 33: TSS, NH3, and PO4 Concentrations in Landfill Leachate for Traditional and Bioreactor Landfills
Leachate Constituent Low Median Concentration (mg/l)
High Median Concentration (mg/l)
TSS 57 57
NH3 343 343
PO4 8.5 10
For ash landfills, the high and low median concentrations of NH3 and PO4 were also based on data from industry and literature data [U.S. EPA, 1990], and the default values are presented in Table 34.
Table 34: NH3 and PO4 Concentrations in Landfill Leachate for Ash Landfills
Leachate Constituent Low Median Concentration (mg/l)
High Median Concentration (mg/l)
NH3 12.0 12.0
PO4 0.1 0.1
The high median values in Tables 33 and 34 are the current model default settings, and the user can adjust them.
7.4.3 Trace Organic Constituents
The trace organic constituent concentrations are assumed to be constant over time. The low and high median concentrations are based on industry data [Environmental Research and Education Foundation, 1997] and are presented in Table 35.
The high median values in Table 35 are the current model default settings, and the user can adjust these values. The default concentration for ash landfills is assumed to be zero.

7. Life-Cycle Inventory of Landfill Leachate
157
Table 35: Trace Organic Concentrations in Landfill Leachate for Traditional and Bioreactor Landfills
Leachate Constituent Low Median Concentration (μg/l)
High Median Concentration (μg/l)
Benzene 2.5 7.0
Chloroform 2.5 10.0
Carbon tetrachloride 2.5 --
Ethylene dichloridea 2.5 1.5
Methylene chloride 4.0 178
Trichloroethene 2.5 8.0
Perchloroethene 2.5 9.7
Vinyl chloride 5.0 10.0
Toluene 87 160
Xylenes 45.1 56.0
Ethylbenzene 9.0 18.1 aThe high median concentration for ethylene dichloride was lower than the low median concentration because the detected values for ethylene dichloride from some sites was lower than the minimum reporting limit.
7.4.4 Heavy Metals
Based on available data, there are no discernible trends in leachate metal concentrations [Environmental Research and Education Foundation, 1997]. Thus, heavy metal concentrations in landfill leachate are assumed to remain constant over time. The high and low median concentrations for metals are shown in Table 36. The high median values are the current model default settings, and the user can adjust them.
Table 36: Metal Concentrations in Leachate for Traditional and Bioreactor Landfills
Leachate Low Median Concentration (μg/l) High Median Concentration (μg/l)
Arsenic 29 30
Barium 679 860
Cadmium 2.5 7
Chromium 52 85
Lead 5.7 13
Mercury 0.10 0.42
Selenium 2.5 9.7
Silver 12.5 66

7. Life-Cycle Inventory of Landfill Leachate
158
Based on literature data [U.S. EPA, 1990], ash landfill leachate contains arsenic, barium, cadmium, chromium, lead, and selenium, as well as copper, iron, and zinc. The concentration of these metals is assumed to be constant over time. The low and high median concentrations are presented in Table 37, and again, the high median is used as the default value.
Table 37: Metal Concentrations in Ash Leachate
Leachate Constituent Low Median Concentration (μg/l)
High Median Concentration (μg/l)
Arsenic 66.5 1.9 × 10²
Barium 3.0 × 10³ 4.0 × 10³
Cadmium 1.6 2.6
Chromium 12.5 20.0
Copper 5.3 8.4
Iron 2.7 × 10³ 2.7 × 10³
Lead 13.8 28.3
Mercury 0 0
Selenium 50.2 1.6 × 10²
Silver 0 0
Zinc 57.2 57.61
7.5 Transport of Leachate to the POTW
This section models the fuel consumed while transporting leachate from the landfill to a POTW. The required parameters follow.
♦ Input Parameters:
• actual5, weight of the actual payload (contents) of the heavy-duty truck (lb)
• er5, return of truck from hauling leachate from POTW (empty return: YES[1] or NO[0], or any fraction between these two numbers)
• hd14, haul distance to POTW (mi)
• max5, weight of the maximum payload (contents) of the truck (lb)
• potw1, percent of leachate sent to POTW during collection period 1 (%)
• potw2, percent of leachate sent to POTW during collection period 2 (%)
• potw3, percent of leachate sent to POTW during collection period 3 (%)
• sc5, specific consumption for a heavy truck (mpg)

7. Life-Cycle Inventory of Landfill Leachate
159
♦ Calculated Parameters:
• fuel14, fuel consumed while transporting leachate to POTW (gal/ton waste)
• LCHTPOTW, total leachate sent to POTW (lb/ton waste)
• lchtpotw1, leachate sent to POTW during collection period 1 (lb/ton waste)
• lchtpotw2, leachate sent to POTW during collection period 2 (lb/ton waste)
• lchtpotw3, leachate sent to POTW during collection period 3 (lb/ton waste)
• lchttime1, leachate collected during collection period 1 and in the chosen time horizon (lb/ton waste)
• lchttime2, leachate collected during collection period 2 and in the chosen time horizon (lb/ton waste)
• lchttime3, leachate collected during collection period 3 and in the chosen time horizon (lb/ton waste)
The quantity of leachate sent to the POTW is a function of the leachate generated and percent of collected leachate sent to the POTW. For example, the leachate sent to the POTW during period 1 is a function of the leachate generated (lchttime1) and the percent sent to the POTW (potw1).
lcht lcht potwpotw time1 1
1100
= × (251)
The leachate sent to the POTW during the recirculation period is calculated as
lcht lcht potwpotw time2 2
2100
= × (252)
The leachate sent to the POTW after the end of recirculation and before the end of treatment is calculated as
lcht lcht potwpotw time3 3
3100
= × (253)
The total leachate sent to the POTW is calculated with the following equation:
3potw2potw1potwPOTW lchtlchtlchtLCHT ++= (254)
Leachate is assumed to be transported 15 mi by a heavy-duty truck to the POTW. This distance is a user input parameter. The transportation distance and the total amount of leachate transported are used to calculate heavy-truck fuel consumption. The fuel consumed during leachate transportation is calculated as
5
POTW5
5
5
5
1414 actual
LCHTer
32
maxactual
31
32
schd
fuel ×⎥⎥⎦
⎤
⎢⎢⎣
⎡+⎟⎟
⎠
⎞⎜⎜⎝
⎛+×= (255)

7. Life-Cycle Inventory of Landfill Leachate
160
7.5.1 Emissions Due to Leachate Transport
This section models emissions due to leachate transport. The model calculates emissions for each of the LCI parameters. This section of the documentation presents equations for fossil carbon dioxide, and the calculated parameters follow.
♦ User Input Parameter:
• CMB_HVY CMB_A_CO2, emission factor for fossil CO2 from heavy trucks (lb CO2-F/gal fuel) (Appendix D)
♦ Calculated Parameters:
• d_pc_em T_F_PC_A_CO2, fossil CO2 emission factor for diesel precombustion (lb CO2-F/gal fuel)
• fuel14, fuel consumed while transporting leachate to POTW (gal/ton waste)
• L_HVY L_A_CO2, fossil CO2 emissions due to diesel combustion in a heavy truck (lb/ton waste)
• L_MTRL_TOTAL L_A_CO2, total fossil CO2 emissions due to transporting leachate to the POTW (lb/ton waste)
• L_PCBM1 L_A_CO2, fossil CO2 emissions due to diesel fuel precombustion (lb/ton waste)
Emissions due to diesel combustion in a heavy truck are a function of the total amount of fuel used (fuel14) and the combustion emission factor (CMB_HVY CMB_A_CO2).
2CO_A_CMB CMB_HVYfuel L_A_CO2 HVY_L 14 ×= (256)
Diesel precombustion emissions are a function of the total fuel used (fuel14) and the precombustion emissions factor (d_pc_em T_F_PC_A_CO2).
O2T_F_PC_A_C em_pc_dfuel L_A_CO2 1PCMB_L 14 ×= (257)
The total fossil CO2 emissions due to transporting leachate to the POTW are the sum of the combustion and precombustion emissions.
⎟⎟⎠
⎞⎜⎜⎝
⎛ +=
L_A_CO2 L_PCMB1 L_A_CO2 HVY_L
L_A_CO2 TOTAL_MTRL_L (258)
7.6 Leachate Treatment
The default treatment efficiencies of an average POTW are shown in Table 38 [U.S. EPA, 1989; U.S. EPA, 1992]. The constituents remaining in the leachate after treatment are assumed to be released into the environment as water effluents. The trace organics have a removal efficiency of 0% since they are assumed to be volatilized during aerobic biological treatment and thus released to the environment untreated. The objective of this section is to calculate the quantity of constituents remaining in leachate after treatment and the energy required to treat the leachate.

7. Life-Cycle Inventory of Landfill Leachate
161
Table 38: POTW Treatment Efficiencies
Leachate Constituent Removal Efficiency (%)
BOD 92
COD 80
NH3 21.6
PO4 21.6
TSS 96
Heavy Metals 85
Trace Organics 0
7.6.1 BOD Generation
The objective of this section is to calculate the BOD generated during all leachate treatment periods within the chosen time horizon (20, 100, or 500 years). The required parameters follow.
♦ User Input Parameters:
• BOD2, end of first BOD production period (years)
• BOD4, end of second BOD production period (years)
• BOD6, end of third BOD production period (years)
♦ Calculated Parameters:
• BOD1, start of first BOD production period (years)
• BOD3, start of second BOD production period (years)
• BOD5, start of third BOD production period (years)
• BODb1, y-intercept of first segment in BOD production curve (years)
• BODb2, y-intercept of second segment in BOD production curve (years)
• BODb3, y-intercept of third segment in BOD production curve (years)
• BODcon1, BOD concentration at the start of the first BOD production period (lb/gal leachate)
• BODcon2, BOD concentration at the end of the first BOD production period (lb/gal leachate)
• BODcon3, BOD concentration at the start of the second BOD production period (lb/gal leachate)
• BODcon4, BOD concentration at the end of the second BOD production period (lb/gal leachate)
• BODcon5, BOD concentration at the start of the third BOD production period (lb/gal leachate)
• BODcon6, BOD concentration at the end of the third BOD production period (lb/gal leachate)

7. Life-Cycle Inventory of Landfill Leachate
162
• BODgen1, BOD generated during the chosen time horizon (lb/gal leachate)
• BODgen2, BOD generated during the treatment years (lb/gal leachate)
• BODm1, slope of first segment in BOD production curve (years)
• BODm2, slope of second segment in BOD production curve (years)
• BODm3, slope of third segment in BOD production curve (years)
• BODN1, length of first BOD production period (years)
• BODN2, length of second BOD production period (years)
• BODN3, length of third BOD production period (years)
• BODtrt, BOD generated and treated during the chosen time horizon (lb/gal leachate)
First, the quantity of BOD generated during the time horizon (BODgen1) and during the treatment years (BODgen2) is calculated. The BOD concentration can be calculated as the area under the BOD generation curve presented in Figure 13. Since the user has the flexibility of defining the start and end points on the BOD generation curve, the time horizon and treatment period could be spread over multiple BOD generation periods. The BOD generated during the chosen time horizon is calculated in the steps below. The BOD generated during the treatment period is calculated in a similar manner.
1. The length of each BOD generation period is calculated as
BOD BOD BODN1 2 1= − (259)
BOD BOD BODN2 4 3= − (260)
BOD BOD BODN3 6 5= − (261)
2. To calculate the area, the slope and y-intercept are first determined. The slope of each segment in the BOD generation curve is calculated using an IF statement. If there is no change in BOD concentration between segments, then the slope is zero. If there is a change is BOD concentration, then the slope is calculated as the change is concentration over the change in time (Table 39):
Table 39: Slope of Segments in BOD Concentration Profile
Period Slope
1 BODm1 = IF (((BOD2 - BOD1) = 0), 0, (BODcon2 - BODcon1)/(BOD2 - BOD1)
2 BODm2 = IF (((BOD4 - BOD3) = 0), 0, (BODcon4 - BODcon3)/(BOD4 - BOD3)
3 BODm3 = IF (((BOD6 - BOD5) = 0), 0, (BODcon6 - BODcon5)/(BOD6 - BOD5)
3. The y-intercept of each line segment in Figure 13 is also calculated using an IF statement. If the slope is zero, then the intercept is the concentration at the beginning of the period. If the slope is not zero, then the

7. Life-Cycle Inventory of Landfill Leachate
163
y-intercept is calculated as a function of the slope, the time at the beginning of the segment, and the concentration at the beginning of the segment (Table 40):
Table 40: Y-Intercept of Segments in BOD Concentration Profile
Period Y-Intercept
1 BODb1 = IF (BODm1 = 0, BODcon2, - (BODm1 * BOD1) + BODcon1
2 BODb2 = IF (BODm2 = 0, BODcon4, - (BODm2 * BOD3) + BODcon3
3 BODb3 = IF (BODm3 = 0, BODcon6, - (BODm3 * BOD5) + BODcon5
4. Using the slope and y-intercept, the area under each segment of the BOD generation curve is determined with a series of IF statements presented in Tables 41 and 42. An overview of the calculations and then a more detailed description of the statements within each column follow.
Table 41: Time Horizon on BOD Concentration Profile
A B C D
1 Period Years Remaining Years in Period End of Period
2 1 Time IF (time > BODN1, BODN1, time) IF (C2 = 0, 0, IF (C2 < BODN1, time, BOD2))
3 2 IF (time - BODN1) < 0, 0, time - BODN1 IF (B3 > BODN2, BODN2, B3) IF (C3 = 0, 0, IF (C3 < BODN2, time, BOD4))
4 3 IF (B3 - BODN2) < 0, 0, B3 - BODN2 IF (B4 > BODN3, BODN3, B4) IF (C4 = 0, 0, IF C4 < BODN3, time, BOD6))
5 4 IF (B4 - BODN3) < 0, 0, B4 - BODN3 = B5
Table 42: BOD Concentration
E F
1 BOD (lb/gal) Total BOD (lb/gal)
2 ( ) ( )( ) ⎟⎟⎠
⎞⎜⎜⎝
⎛⎟⎟⎠
⎞⎜⎜⎝
⎛−×+⎟⎟
⎠
⎞⎜⎜⎝
⎛−×= 11b
21
21m BOD2DBODBOD2D2
BOD,0,02DIF
=E2 + E3 + E4
3 ( ) ( )( ) ⎟⎟⎠
⎞⎜⎜⎝
⎛⎟⎟⎠
⎞⎜⎜⎝
⎛−×+⎟
⎠⎞
⎜⎝⎛ −×= 32b
23
22m BOD3DBODBOD3D2
BOD,0,03DIF
4 ( ) ( )( ) ⎟⎟⎠
⎞⎜⎜⎝
⎛⎟⎟⎠
⎞⎜⎜⎝
⎛−×+⎟
⎠⎞
⎜⎝⎛ −×= 53b
25
23m BOD4DBODBOD4D2
BOD,0,03DIF

7. Life-Cycle Inventory of Landfill Leachate
164
In Table 41, the model determines where the time horizon falls on the BOD production curve with a series of IF statements. Next, the model uses this information in Table 42 to determine the BOD produced within each production period:
Column A: Lists the BOD production period with reference to Figure 13.
Column B: Determines how many years in the time horizon are remaining after the first, second, third, or fourth treatment periods.
B3: For example, there are 20 years in the time horizon. If the time horizon is shorter than the first BOD production period, then the years remaining are zero. If the time horizon is greater than the start of the first BOD production period, then the time remaining is calculated.
Column C: Determines the years that fall within each period.
C2: For example, if the time horizon is greater than the first BOD production period, then the length is BODN1. If the time horizon is shorter than the BOD production period, then the length of the time in the period is the length of the time horizon.
Column D: Calculates the end of the BOD production period.
D2: For example, if the length of the first BOD production period is zero, then the period ends at year zero. If the length of the BOD period is not zero and if time horizon ends during the first BOD production period, then the end of the production period is the time horizon. If the length of the BOD period is not zero and if the time horizon ends after the first BOD production period, then the end of the period is BOD2.
Column E: Calculates the BOD yield.
The equation for the line segments in the BOD curve presented in Figure 13 is
bmxy += (262)
where m is the slope of the line, x is the time, and b is the y-intercept.
The total yield for a time period is the area under the line. The area under a line is calculated by taking the integral of the equation for the line. The integral of the equation of a line is calculated as
∫∫ +=f
s
f
s bmxy
(263)
( ) ( )sfbsf
2my 22 −+−=
(264)
where f is the finish of the BOD period and s is the start of the BOD period.

7. Life-Cycle Inventory of Landfill Leachate
165
This equation is used in column E to calculate the BOD yield for each production period.
Column F: Calculates the total BOD yield.
The total BOD yield is the sum of the BOD concentration in periods 1, 2, 3, and 4.
The calculations outlined in steps 1 through 5 are repeated to calculate the BOD generated during the treatment years. Next, the model determines the BOD treated during the chosen time horizon. This is accomplished with an IF statement. If the difference between the BOD generated during the time horizon (BODgen1) and the treatment period (BODgen2) is negative, then the BOD treated is the BOD generated during the time horizon. If the difference is positive, then the BOD treated is the amount generated during the treatment period:
( )2gen1gen2gen1gentrt BOD ,BOD, 0BODBODIFBOD <−= (265)
7.6.1.1 Emissions due to BOD removal
This section calculates emissions due to BOD removal. The required parameters follow.
♦ User Input Parameters:
• a_CO2, precombustion emission factor for CO2 due to electric energy consumption (lb/ton waste)
• CO2_per_BOD, pounds of biomass CO2 generated per pound of BOD removed (lb CO2-B/lb BOD)
• dlcht, density of leachate (lb/gal)
• effBOD, BOD removal efficiency (%)
• lchtec, kWh consumed per pound BOD removed (kWh/lb BOD)
• sldg_per_BOD, lb sludge generated per lb BOD removed (lb sludge/lb BOD)
♦ Calculated Parameters:
• BODrmvd, BOD removed at POTW (lb/ton waste)
• BODtrt, BOD generated and treated during the chosen time horizon (lb/gal leachate)
• L_EE_PC L_A_CO2, the precombustion and combustion fossil CO2 emissions due to energy consumption (lb/ton waste)
• L_POTW_E L_A_CO2_BM, the total biomass CO2 emitted while removing BOD (lb/ton waste)
• L_POTW_ENG L_ENGR, the total energy required to remove BOD (Btu/ton waste)
• L_TRT L_W_BOD, BOD remaining after leachate treatment (lb BOD/ton waste)
• LCHTPOTW, total leachate sent to POTW (lb/ton waste)
• sldgBOD, sludge generated from BOD removal (lb/ton waste)

7. Life-Cycle Inventory of Landfill Leachate
166
The removal of BOD from leachate requires energy and produces sludge and CO2 as products. The CO2 released from the treatment of BOD is biomass CO2. The BOD removed is a function of the concentration of treated BOD, the amount of leachate sent to the POTW, the efficiency of BOD removal, and the density of leachate.
100
effd
1LCHTBODBOD BOD
lchtPOTWtrtrmvd ×××= (266)
The sludge generated from BOD removal is a function of the cell yield and the amount of BOD removed.
rmvdBOD BODBOD_per_sldgsldg ×= (267)
The biomass carbon dioxide emitted while removing BOD is a function of the mass of CO2 produced per pound of BOD removed and the total BOD removed.
rmvdBODDCO2_per_BO L_A_CO2_BM E_POTW_L ×= (268)
The energy required to remove BOD is a function of the concentration of BOD treated, the leachate sent to the POTW, the efficiency of BOD removal, and the kWh of electricity required per pound of BOD removed.
KJ
Btu 055.1 Wh1
KJ 6.3kWh
Wh1000100
effd
1LCHTBODlcht
L_ENGR ENG_POTW_L
BOD
lchtPOTWtrtec ×××××××
= (269)
The precombustion and combustion emissions due to energy consumption are calculated as
2CO_aBODlcht L_A_CO2 PC_EE_L rmvdec ××= (270)
The BOD remaining in leachate after treatment is a function of the total leachate sent to the POTW (lchtPOTW), the BOD treated and generated in the chosen time horizon (BODtrt), the density of the leachate (dlcht), and the removal efficiency of BOD (effBOD).
⎟⎟⎠
⎞⎜⎜⎝
⎛ −×××=
100eff100
d1BODLCHT L_W_BOD TRT_L BOD
lchttrtPOTW (271)
The COD that is removed in a POTW is biodegradable. Thus, the biomass CO2 produced, the sludge produced, and the power consumed are all considered in the calculations for BOD treatment.
7.6.2 COD Removal and Resulting Emissions
The objective of this section is to calculate the amount of COD generated during the leachate treatment period in the chosen time horizon. The required parameters follow.
♦ User Input Parameters:
• dlcht, density of leachate (lb/gal)
• effCOD, COD removal efficiency (%)

7. Life-Cycle Inventory of Landfill Leachate
167
♦ Calculated Parameters:
• CODgen1, amount of COD generated during the chosen time horizon (lb/gal leachate)
• CODgen2, amount of COD generated during treatment years (lb/gal leachate)
• CODtrt, amount of COD generated and treated during the chosen time horizon (lb/gal leachate)
• LCHTPOTW, total leachate sent to POTW (lb/ton waste)
• L_TRT L_W_COD, COD remaining in leachate after treatment (lb/ton waste)
The COD generated during the chosen time horizon (CODgen1) and the COD generated during the treatment years (CODgen2) is the area under the COD generation curve as defined in Table 32. The COD concentration is calculated in the same manner as the BOD concentration.
Next, the model determines the COD treated during the chosen time horizon. This is accomplished with an IF statement. If the difference between the COD generated during the time horizon (CODgen1) and the treatment period (CODgen2) is negative, then the COD treated is the COD generated during the time horizon. If the difference is positive, then the COD treated is the amount generated during the treatment period. The equation for this IF statement is
( )2gen1gen2gen1gentrt COD ,COD, 0CODCODIFCOD <−= (272)
The COD remaining in leachate after treatment is a function of the total leachate sent to the POTW (lchtPOTW), the COD treated and generated in the chosen time horizon (CODtrt), the density of the leachate, and the removal efficiency of COD (effCOD):
⎟⎟⎠
⎞⎜⎜⎝
⎛ −×××=
100eff100
d1CODLCHT L_W_COD TRT_L COD
lchttrtPOTW (273)
7.6.3 Removal of TSS, NH3, and PO4
The objective of this section is to calculate emissions due to NH3, PO4, and TSS after treatment. The required parameters follow.
♦ User Input Parameters:
• dlcht, density of leachate (lb/gal)
• effPO4, phosphate removal efficiency (%)
• effTSS, suspended solids removal efficiency (%)
• effNH3, ammonia removal efficiency (%)
• lchtPO4, concentration of PO4 in leachate (lb/gal leachate)
• lchtNH3, concentration of NH3 in leachate (lb/gal leachate)
• lchtTSS, concentration of TSS (lb TSS/gal leachate)

7. Life-Cycle Inventory of Landfill Leachate
168
♦ Calculated Parameters:
• L_TRT L_W_NH3, NH3 remaining after leachate treatment (lb/ton waste)
• L_TRT L_W_PO4, PO4 remaining after leachate treatment (lb/ton waste)
• L_TRT L_W_TSS, TSS remaining after leachate treatment (lb/ton waste)
• LCHTPOTW, total leachate sent to POTW (lb/ton waste)
• sldgPO4, sludge generated from phosphate removal (lb/ton waste)
• sldgTSS, sludge generated from TSS removal (lb/ton waste)
The TSS remaining in leachate after treatment is a function of the total leachate sent to the POTW (LCHTPOTW), the concentration of TSS in leachate (lchtTSS), the density of the leachate (dlcht), and the removal efficiency of TSS (effTSS).
⎟⎠
⎞⎜⎝
⎛ −×××=
100eff100
d1lchtLCHT L_W_TSS TRT_L TSS
lchtTSSPOTW (274)
The TSS removed as sludge is calculated with the following equation:
⎟⎠
⎞⎜⎝
⎛×××=
100eff
d1lchtLCHT ldgs TSS
lchtTSSPOTWTSS (275)
The NH3 removed from the leachate is oxidized to NO3. The energy required for aeration for NH3 treatment is negligible relative to the BOD and is neglected. It is assumed that all of the NH3 that is converted to NO3 is released and not transferred to the sludge. The NH3 remaining in leachate after treatment is a function of the total leachate sent to the POTW (LCHTPOTW), the concentration of NH3 in leachate (lchtNH3), the density of the leachate (dlcht), and the removal efficiency of NH3 (effNH3).
⎟⎠
⎞⎜⎝
⎛ −×××=
100eff100
d1lchtLCHT L_W_NH3 TRT_L 3NH
lcht3NHPOTW (276)
The PO4 removed from the leachate is assumed to remain in the sludge as phosphorous. Therefore, the pounds of phosphorous in the incoming leachate removed by the treatment process are added to the total amount of sludge produced. There is no energy required for PO4 removal. The sludge generated from phosphate removal is a function of the total leachate sent to the POTW (LCHTPOTW), the concentration of phosphate in the sludge (lchtPO4), and the efficiency of phosphate removal (effPO4).
100
effd
1lchtLCHTsldg 4PO
lcht4POPOTW4PO ×××= (277)
The PO4 remaining in leachate after treatment is a function of the total leachate sent to the POTW (LCHTPOTW), the concentration of PO4 in leachate (lchtPO4), the density of the leachate (dlcht), and the removal efficiency of PO4 (effPO4).

7. Life-Cycle Inventory of Landfill Leachate
169
⎟⎠
⎞⎜⎝
⎛ −×××=
100eff100
d1lchtlcht L_W_PO4 TRT_L 3NH
lcht3NHPOTW (278)
7.6.4 Heavy Metals
The default removal efficiency for heavy metals was specified in Table 38. Heavy metals that are removed precipitate from the landfill leachate and contribute to the total amount of sludge produced during the wastewater treatment process. No energy is required for heavy metals removal. The required parameters follow.
♦ User Input Parameters:
• dlcht, density of leachate (lb/gal)
• effmtls, metals removal efficiency (%)
• lchtAg, concentration of silver in leachate (lb/gal leachate)
• lchtAs, concentration of arsenic in leachate (lb/gal leachate)
• lchtBa, concentration of barium in leachate (lb/gal leachate)
• lchtCd, concentration of cadmium in leachate (lb/gal leachate)
• lchtCr, concentration of chromium in leachate (lb/gal leachate)
• lchtHg, concentration of mercury in leachate (lb/gal leachate)
• lchtPb, concentration of lead in leachate (lb/gal leachate)
• lchtSe, concentration of selenium in leachate (lb/gal leachate)
♦ Calculated Parameters:
• L_TRT L_WM_Ba, barium remaining after leachate treatment (lb/ton waste)
• LCHTPOTW, total leachate sent to POTW (lb/ton waste)
• sldgBOD, sludge generated from BOD removal (lb/ton waste)
• sldgmtls, sludge generated from metals removal (lb/ton waste)
• sldgPO4, sludge generated from phosphate removal (lb/ton waste)
• sldgtotal, total sludge produced (lb/ton waste)
• sldgTSS, sludge generated from TSS removal (lb/ton waste)
The sludge produced from metals removal is a function of the leachate sent to the POTW (LCHTPOTW), the total concentration of each metal in the leachate (lchtAs + lchtBa + lchtCd + lchtCr +lchtPb + lchtHg + lchtSe + lchtAg), metal removal efficiency (effmtls), and leachate density (dlcht).
( )lcht
mtlsPOTWAgSeHgPbCrCdBaAs
mtls
d1
100eff
LCHTlchtlchtlchtlchtlchtlchtlchtlcht
sldg
×××+++++++
= (279)

7. Life-Cycle Inventory of Landfill Leachate
170
The total sludge produced from leachate treatment in a POTW is the sludge produced due to BOD, PO4, metals, and TSS removal.
TSSmtls4POBODtotal sldgsldgsldgsldgsldg +++= (280)
The concentration of metals remaining in leachate after treatment is a function of the total leachate sent to the POTW, the concentration of metals in leachate, the density of the leachate, and the metals removal efficiency. For example, the barium remaining in leachate after treatment is calculated as
⎟⎠
⎞⎜⎝
⎛ −×××=
100eff100
d1lchtLCHT L_WM_Ba TRT_L mtls
lchtBaPOTW (281)
7.6.5 Trace Organics
Trace organic constituents removed by the wastewater treatment process are volatilized and released to the environment as air emissions. There is no energy required for trace organic constituent removal. The required parameters follow.
♦ User Input Parameters:
• dlcht, density of leachate (lb/gal)
• effbz, benzene removal efficiency (%)
• lchtBz, concentration of benzene in leachate (lb/gal leachate)
♦ Calculated Parameters:
• L_TRT L_AH_BZ, benzene volatilized to atmosphere (lb/ton waste)
• LCHTPOTW, total leachate sent to POTW (lb/ton waste)
Emissions due to treatment of trace organics are a function of the total leachate sent to the POTW, concentration of trace organics in the leachate, removal efficiency, and leachate density. For example, benzene emissions are calculated as
⎟⎟⎠
⎞⎜⎜⎝
⎛ −×××=
100eff100
d1lchtLCHT L_AH_BZ TRT_L bz
lchtBzPOTW (282)
7.6.6 Fugitive Leachate
The objective of this section is to calculate emissions due to untreated leachate. The BOD in fugitive leachate is a function of the concentration of BOD generated during the chosen time horizon and the volume of uncollected leachate. The required parameters follow.
♦ User Input Parameters:
• dlcht, density of leachate (lb/gal)
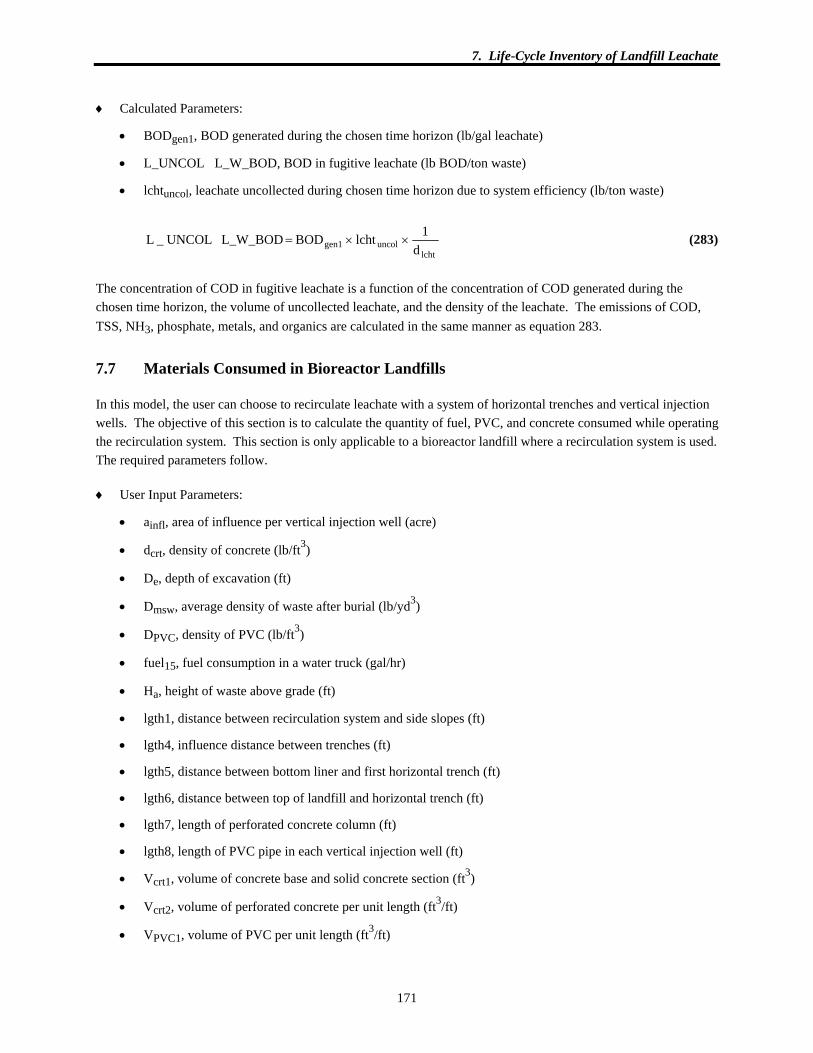
7. Life-Cycle Inventory of Landfill Leachate
171
♦ Calculated Parameters:
• BODgen1, BOD generated during the chosen time horizon (lb/gal leachate)
• L_UNCOL L_W_BOD, BOD in fugitive leachate (lb BOD/ton waste)
• lchtuncol, leachate uncollected during chosen time horizon due to system efficiency (lb/ton waste)
lcht
uncolgen1 d1lchtBOD L_W_BOD UNCOL_L ××= (283)
The concentration of COD in fugitive leachate is a function of the concentration of COD generated during the chosen time horizon, the volume of uncollected leachate, and the density of the leachate. The emissions of COD, TSS, NH3, phosphate, metals, and organics are calculated in the same manner as equation 283.
7.7 Materials Consumed in Bioreactor Landfills
In this model, the user can choose to recirculate leachate with a system of horizontal trenches and vertical injection wells. The objective of this section is to calculate the quantity of fuel, PVC, and concrete consumed while operating the recirculation system. This section is only applicable to a bioreactor landfill where a recirculation system is used. The required parameters follow.
♦ User Input Parameters:
• ainfl, area of influence per vertical injection well (acre)
• dcrt, density of concrete (lb/ft3)
• De, depth of excavation (ft)
• Dmsw, average density of waste after burial (lb/yd3)
• DPVC, density of PVC (lb/ft3)
• fuel15, fuel consumption in a water truck (gal/hr)
• Ha, height of waste above grade (ft)
• lgth1, distance between recirculation system and side slopes (ft)
• lgth4, influence distance between trenches (ft)
• lgth5, distance between bottom liner and first horizontal trench (ft)
• lgth6, distance between top of landfill and horizontal trench (ft)
• lgth7, length of perforated concrete column (ft)
• lgth8, length of PVC pipe in each vertical injection well (ft)
• Vcrt1, volume of concrete base and solid concrete section (ft3)
• Vcrt2, volume of perforated concrete per unit length (ft3/ft)
• VPVC1, volume of PVC per unit length (ft3/ft)

7. Life-Cycle Inventory of Landfill Leachate
172
♦ Calculated Parameters:
• dht, depth that could be occupied by horizontal trench (ft)
• Dlls, depth of liner and leachate collection system (ft)
• fuel16, fuel use per ton of waste (gal/ton waste)
• Ldv, length of disposal volume (ft)
• lgth2, maximum length of trench (ft)
• Mcrt, mass of concrete per ton of waste (lb/ton waste)
• MPVC1, mass of PVC in horizontal trenches per ton of waste (lb/ton waste)
• MPVC2, mass of PVC in vertical injection wells per ton of waste (lb/ton waste)
• Mwl, expected mass flow (ton/day)
• Nht, number of horizontal trenches
• Nvl, number of vertical lifts
• Nwell, number of vertical injection wells
• Vcrt3, volume of concrete per vertical injection well (ft3/well)
• VPVC3, volume of single PVC pipe in a single well (ft3)
• Vw, required landfill capacity for waste (yd3)
• Wdv, width of disposal volume (ft)
Waste prewetting is most commonly done by water tankers. According to information provided by industry [Felker, personal communication, 1998], the default value for fuel consumption in a water truck (fuel15) is 0.75 gal/hr. If the water truck operates for four hours a day, then the total fuel consumption is
dayhr. 4
Mfuel
fuelwl
1516 ×= (284)
The vertical injection wells are assumed to be constructed from a perforated concrete manhole and are filled with gravel as described in section 2.2.5. The horizontal trenches contain a perforated PVC pipe and are filled with sand. The quantity of sand and gravel was not calculated because they were found to have a minimal impact on the LCI emissions. The linear feet of PVC piping in the leachate recirculation system is a function of the average length of a horizontal trench, the number of horizontal trenches per layer, the number of layers, and the length of vertical injection wells.
To calculate the PVC used in horizontal trenches, the number of horizontal trenches must be determined. The number of trenches is based on the maximum length of the horizontal trench, the depth that could be occupied by the horizontal trench, and the number of vertical lifts. The calculation of each of these parameters is described below.

7. Life-Cycle Inventory of Landfill Leachate
173
The maximum length of the horizontal trench is a function of the length and width of the landfill and the distance between the trench and the side slope. The maximum length is calculated using an IF statement. If the width of the site is less than the length, then the maximum length is the width minus twice the distance between trench and side slope. If the length of the site is greater than the width, then the maximum length is the length of the site minus twice the distance between trench and side slope.
( ) ( )( )1thlg2L,1thlg2W,LWIF 2thlg dvdvdvdv ×−×−<= (285)
The depth of the horizontal trench is a function of the height above grade (Ha), the excavation depth (De), the distance between the bottom liner and horizontal trench (lgth5), the distance between the top of the liner and horizontal trench (lgth6), and the depth of the leachate collection system (Dlls).
( ) llseaht D6thlg5thlgDH d −−−+= (286)
The number of vertical lifts is calculated by using a CEILING function. If the influence distance between trenches is greater than zero, then the number of vertical lifts is the depth of the horizontal trench divided by twice the influence distance. The CEILING function rounds this calculated value up to the next integer. If the influence distance between trenches is zero, then the number of vertical lifts is zero.
⎟⎟⎠
⎞⎜⎜⎝
⎛⎟⎟⎠
⎞⎜⎜⎝
⎛×
>= 0,1,24thlg
dCEILING,04thlgIF N ht
vl (287)
The number of horizontal trenches per lift is calculated by using a CEILING function. If twice the influence distance between trenches is not zero, then the number of horizontal trenches is the average length of the trench divided by twice the influence distance. The CEILING function rounds this calculated value up to the next integer. If the influence distance between trenches is zero, then the number of horizontal trenches is zero.
( ) ⎟⎟⎠
⎞⎜⎜⎝
⎛⎟⎟⎠
⎞⎜⎜⎝
⎛×
>×= 0,1,24thlg
2thlgCEILING,024thlgIF Nht (288)
The mass of PVC in the horizontal trench is a function of the volume of PVC per linear foot, the length of the average length of the trench, the number of vertical lifts, the number of trenches per lift, the density of PVC, waste volume, and density of the waste.
( ) tonlb 2000
dVd
NN2thlgv Mmsww
PVChtvl1PVC1PVC ×
×××××= (289)
The number of vertical injection wells is calculated using an IF statement. If the area of influence equals zero, then the number of vertical injection wells equals zero. If the radius of influence does not equal zero, then the number of vertical injection wells is a function of the area of the landfill and the area of influence per well. The INT function returns the next highest integer if a fraction is calculated.
⎟⎟⎟
⎠
⎞
⎜⎜⎜
⎝
⎛
⎟⎟⎟
⎠
⎞
⎜⎜⎜
⎝
⎛ ××==
linf
2dvdv
linfwell aft 43563
acreLWINT,0,0aIF N (290)

7. Life-Cycle Inventory of Landfill Leachate
174
The volume of concrete per well is the volume of perforated concrete plus the volume of the solid concrete section.
1crt2crt3crt V7thlgV V +×= (291)
The following equation converts the volume of concrete to the mass per ton of waste:
tonlb 2000
ydft 27
dVd
NV M3
msww
crtwell3crtcrt ××
×××= (292)
The volume of PVC pipe in a single well is a function of the volume of PVC per linear foot and the pipe length in each well.
8thlgV V 2PVC3PVC ×= (293)
The total mass of PVC pipe in the vertical injection wells is a function of the volume of PVC in a single well, the number of wells, and the amount of waste buried.
tonlb 2000
ydft 27
dVd
NV M3
msww
crtwell3PVC2PVC ××
×××= (294)
7.7.1 Emissions Due to Material Consumption
The objective of this section is to calculate emissions due to fuel, PVC, and concrete consumption in bioreactor landfills. The model calculates emissions for each of the inventory flow parameters. The documentation contains emissions for the parameter fossil CO2. The required parameters follow.
♦ User Input Parameters:
• CMB_CRT CMB_A_CO2, emission factor for fossil CO2 due to concrete production (lb CO2-F/lb concrete)
• CMB_PVC CMB_A_CO2, emission factor for fossil CO2 due to PVC production (lb CO2-F/lb PVC)
• CMB_TK CMB_A_CO2, emission factor for fossil CO2 from a water truck (lb CO2-F/gal fuel)
• d_pc_em T_F_PC_A_CO2, fossil CO2 emission factor for diesel precombustion (lb CO2-F/gal fuel)
♦ Calculated Parameters:
• fuel16, fuel use per ton of waste (gal/ton waste)
• L_CRT L_A_CO2, fossil CO2 emissions due to concrete consumption (lb/ton waste)
• L_PCBM2 L_A_CO2, fossil CO2 emissions due to diesel precombustion (lb/ton waste)
• L_PVC L_A_CO2, fossil CO2 emissions due to PVC consumption (lb/ton waste)
• L_WT L_A_CO2, fossil CO2 emissions due to diesel combustion in a water truck (lb/ton waste)
• Mcrt, mass of concrete per ton of waste (lb/ton waste)
• MPVC1, mass of PVC in horizontal trenches per ton of waste (lb/ton waste)

7. Life-Cycle Inventory of Landfill Leachate
175
• MPVC2, mass of PVC in vertical injection wells per ton of waste (lb/ton waste)
The emissions due to material consumption are a function of the total material used and the emissions factor. The fossil CO2 emissions due to PVC use, concrete use, diesel combustion, and diesel precombustion are calculated in the following equations, respectively.
( ) 2CO_A_CMB PVC_CMBMM L_A_CO2 PVC_L 2PVCPVC1 ×+= (295)
2CO_A_CMB CRT_CMB M L_A_CO2 CRT_L crt ×= (296)
2CO_A_CMBCMB_TK fuel L_A_CO2 WT_L 16 ×= (297)
O2T_F_PC_A_C em_pc_d fuel L_A_CO2 2PCBM_L 16 ×= (298)
7.8 Total Leachate Emissions
The purpose of this section is to calculate the total emissions due to treated and fugitive leachate, fuel and material consumption, and treatment of leachate in a POTW. The required parameters follow.
♦ Calculated Parameters:
• L_CRT L_A_CO2, fossil CO2 emissions due to concrete consumption (lb/ton waste)
• L_HVY L_A_CO2, fossil CO2 emissions due to diesel combustion in a heavy truck (lb/ton waste)
• L_PCBM1 L_A_CO2, fossil CO2 emissions due to diesel fuel precombustion (lb/ton waste)
• L_PCBM2 L_A_CO2, fossil CO2 emissions due to diesel precombustion (lb/ton waste)
• L_POTW_E L_SW_2, total sludge produced during leachate treatment (lb/ton waste)
• L_PVC L_A_CO2, fossil CO2 emissions due to PVC consumption (lb/ton waste)
• L_WT L_A_CO2, fossil CO2 emissions due to diesel combustion in a water truck (lb/ton waste)
• LCHT_TOTAL L_W_SS, suspended solids emitted in treated and fugitive leachate (lb/ton waste)
• LCHT_TRT L_W_SS, suspended solids emitted in treated leachate (lb/ton waste)
• LCHT_UNCOL L_W_SS, suspended solids emitted in fugitive leachate (lb/ton waste)
• L_EE_PC L_A_CO2_BM, biomass CO2 due to electric energy precombustion and combustion (lb/ton waste)
• MTRL_TOTAL L_A_CO2, fossil CO2 emissions due to diesel precombustion and combustion (lb/ton waste)
• POTW_E L_A_CO2_BM, biomass CO2 emitted during leachate treatment (lb/ton waste)
• POTW_ENG L_ENGR, total energy required by POTW (Btu/ton waste)
• POTW_TOTAL L_A_CO2_BM, total biomass CO2 produced during leachate treatment and during electric energy combustion and precombustion (lb/ton waste)

7. Life-Cycle Inventory of Landfill Leachate
176
• POTW_TOTAL L_ENGR, total energy consumed during leachate treatment and during electric energy combustion and precombustion (Btu/ton waste)
• sldgtotal, total sludge produced (lb/ton waste)
Total emissions from the treated and untreated leachate are the sum of the fugitive and treated leachate emissions. For example, the total TSS emitted in landfill leachate is calculated as follows:
L_W_SS L_TRT
L_W_SS UNCOL_L L_W_SS TOTAL_LCHT ⎟⎟
⎠
⎞⎜⎜⎝
⎛ += (299)
In traditional and ash landfills, the total emissions due to transporting leachate to the POTW are the sum of the diesel precombustion and combustion emissions. For example, the fossil CO2 emitted due to leachate transportation are calculated as:
L_A_CO2 L_PCBM2
L_A_CO2 HVY_L L_A_CO2 TOTAL_MTRL ⎟⎟
⎠
⎞⎜⎜⎝
⎛ += (300)
In bioreactor landfills, there are additional emissions due to PVC and concrete consumption as well as fuel consumption in a water truck. Therefore, the total emissions are calculated as
L_A_CO2 L_PCBM2L_A_CO2 L_WT
L_A_CO2 L_CRT L_A_CO2 L_PVC
L_A_CO2 L_PCBM1L_A_CO2 HVY_L
L_A_CO2 TOTAL_MTRL
⎟⎟⎟⎟⎟⎟⎟⎟
⎠
⎞
⎜⎜⎜⎜⎜⎜⎜⎜
⎝
⎛
+++
++
= (301)
Treating leachate in a POTW produces sludge and biomass CO2 and consumes energy. The total sludge emission is as follows:
totalldgs L_SW_2 E_POTW_L = (302)
The total biomass CO2 produced due to leachate treatment in a POTW is a function of the biomass CO2 produced during treatment and the CO2 emissions due to electric energy precombustion and combustion.
L_A_CO2_BM L_EE_PCL_A_CO2_BM POTW_E
L_A_CO2_BM TOTAL_POTW ⎟⎟⎠
⎞⎜⎜⎝
⎛ += (303)
The total energy consumed is a function of the energy consumed during leachate treatment and during electric energy precombustion.
L_ENGR L_EE_PC
L_ENGR POTW_ENG L_ENGR TOTAL_POTW ⎟⎟
⎠
⎞⎜⎜⎝
⎛ += (304)

7. Life-Cycle Inventory of Landfill Leachate
177
7.9 Leachate Allocation
The objective of this section is to allocate total emissions to components of the waste stream. The required parameters follow.
♦ User Input Parameters:
• YTL P_As, the percent contribution of leaves to arsenic in landfill leachate (%)
♦ Calculated Parameters:
• G_YTL G_P, the percent contribution of leaves to the landfill gas production (%)
• L_YTL A_L_W_As, total arsenic emissions allocated to leaves (lb/ton waste)
• L_YTL A_L_W_BOD, total BOD emissions allocated to leaves (lb/ton waste)
• LCHT_TOTAL A_L_W_As, the total arsenic in landfill leachate (lb/ton waste)
• LCHT_TOTAL A_L_W_BOD, the total BOD in landfill leachate (lb/ton waste)
• MTRL_TOTAL A_L_W_As, the total arsenic produced due to material consumption (lb/ton waste)
• MTRL_TOTAL A_L_W_BOD, the total BOD produced due to material consumption (lb/ton waste)
• POTW_TOTAL A_L_W_As, the total arsenic produced due to electric energy combustion and precombustion (lb/ton waste)
• POTW_TOTAL A_L_W_BOD, the total BOD produced due to electric energy combustion and precombustion (lb/ton waste)
The total trace organic emissions are allocated equally among all waste flow components.
The emissions of metals, ammonia, and phosphate in leachate and due to the operation of the POTW are allocated based on their concentration in waste stream components. The percent contribution of the ammonia, phosphate, and metals to items in the waste stream are presented in Tables 28, 29, and 30. As an example, the arsenic allocated to leaves is calculated in the following equation. The total arsenic in landfill leachate (LCHT_TOTAL L_W_As) and the arsenic due to electric energy consumption of the POTW (POTW_TOTAL L_W_As) are allocated based on the percent arsenic in leachate due to leaves (YTL P_As). The arsenic produced due to materials consumption (MTRL_TOTAL L_W_As) is allocated equally among waste stream constituents.
⎟⎟⎟⎟⎟⎟⎟
⎠
⎞
⎜⎜⎜⎜⎜⎜⎜
⎝
⎛
×
+×
+×
=
481 _L_W_AsA MTRL_TOTAL
100P_As YTL
_L_W_AsA POTW_TOTAL
100P_As YTL As_W_L_A LCHT_TOTAL
A_L_W_As YTL_L (305)
All other atmospheric, solid waste, and waterborne emissions due to leachate treatment and POTW operation are allocated based on their percent contribution to landfill gas produced by the average ton of MSW. This percent contribution is calculated in section 6.7. For example, the BOD allocated to leaves is calculated in the following equation. The total BOD in landfill leachate (LCHT_TOTAL L_W_BOD) and the BOD due to electric energy

7. Life-Cycle Inventory of Landfill Leachate
178
consumption of the POTW (POTW_TOTAL L_W_BOD) is a function of the contribution of leaves to landfill gas. The BOD produced due to materials consumption (MTRL_TOTAL L_W_BOD) is allocated equally among waste stream constituents.
⎟⎟⎟⎟⎟⎟⎟
⎠
⎞
⎜⎜⎜⎜⎜⎜⎜
⎝
⎛
×
+×
+×
=
481 BOD_W_LA_ MTRL_TOTAL
100G_P G_YTL BOD_W_LA_ POTW_TOTAL
100G_P G_YTL BOD_W_LA_ LCHT_TOTAL
A_L_W_BOD YTL_L (306)
7.10 Default Values
Three values are given for each parameter to represent traditional, bioreactor, and ash landfills, respectively.
7.10.1 a_CO2, precombustion emission factor for CO2 due to electric energy consumption (lb/ton waste) (Appendix D)
7.10.2 actual5, weight of the actual payload (contents) of the heavy-duty truck (6.62 × 10⁴ lb, 6.62 × 10⁴ lb, 6.62 × 10⁴ lb)
7.10.3 ainfl, area of influence per vertical injection well (1 acre, 1 acre, 1 acre)
7.10.4 BOD2, end of first BOD production period (1.5 years, 1 year, 1.5 years)
7.10.5 BOD4, end of second BOD production period (10 years, 3 years, 10 years)
7.10.6 BOD6, end of third BOD production period (50 years, 10 years, 50 years)
7.10.7 BODcon1, BOD concentration at the start of the first BOD production period (10,000 lb/gal leachate; 10,000 lb/gal leachate; 0 lb/gal leachate)
7.10.8 BODcon2, BOD concentration at the end of the first BOD production period (10,000 lb/gal leachate; 10,000 lb/gal leachate; 0 lb/gal leachate)
7.10.9 BODcon3, BOD concentration at the start of the second BOD production period (10,000 lb/gal leachate; 10,000 lb/gal leachate; 0 lb/gal leachate)
7.10.10 BODcon4, BOD concentration at the end of the second BOD production period (1,000 lb/gal leachate; 1,000 lb/gal leachate; 0 lb/gal leachate)
7.10.11 BODcon5, BOD concentration at the start of the third BOD production period (1,000 lb/gal leachate; 1,000 lb/gal leachate; 0 lb/gal leachate)
7.10.12 BODcon6, BOD concentration at the end of the third BOD production period (0 lb/gal leachate, 0 lb/gal leachate, 0 lb/gal leachate)

7. Life-Cycle Inventory of Landfill Leachate
179
7.10.13 CO2_per_BOD, pounds of biomass CO2 generated per pound of BOD removed (3.6 lb CO2-B/lb BOD, 3.6 lb CO2-B/lb BOD, 3.6 lb CO2-B/lb BOD)
7.10.14 De, depth of excavation (40 ft, 40 ft, 40 ft)
7.10.15 dcrt, density of concrete (1.48 × 10² lb/ft3, 1.48 × 10² lb/ft3, 1.48 × 10² lb/ft3)
7.10.16 dlcht, density of leachate (8.34 lb/gal, 8.34 lb/gal, 8.34 lb/gal)
7.10.17 Dmsw, average density of waste after burial (1.50 × 10³ lb/yd3, 1.50 × 10³ lb/yd3, 1.50 × 10³ lb/yd3)
7.10.18 DPVC, density of PVC (8.43 × 101 lb/ft3, 8.43 × 101 lb/ft3, 8.43 × 101 lb/ft3)
7.10.19 effBOD, BOD removal efficiency (92.1%, 92.1%)
7.10.20 effCOD, COD removal efficiency (80%, 80%, 80%)
7.10.21 effmtls, metals removal efficiency (85%, 85%, 85%)
7.10.22 effNH3, ammonia removal efficiency (21.6%, 21.6%, 21.6%)
7.10.23 effPO4, phosphate removal efficiency (21.6%, 21.6%, 21.6%)
7.10.24 effTSS, suspended solids removal efficiency (96%, 96%, 96%)
7.10.25 er5, return of truck from hauling leachate from POTW (empty return: YES[1] or NO[0], or any fraction between these two numbers) (1, 1, 1)
7.10.26 fuel15, fuel consumption in a water truck (0 gal/hr, 0.75 gal/hr, 0 gal/hr)
7.10.28 Ha, height of waste above grade (40 ft, 40 ft, 40 ft)
7.10.29 hd14, haul distance to POTW (15 mi, 15 mi, 15 mi)
7.10.30 lcht2, end of first leachate production period (1.5 years, 1.5 years, 1.5 years)
7.10.31 lcht4, end of second leachate production period (5 years, 3 years, 5 years)
7.10.32 lcht6, end of third leachate production period (10 years, 5 years, 10 years)
7.10.33 lchtAg, concentration of silver in leachate (66 μg/l leachate, 66 μg/l leachate, 0 μg/l leachate)
Note: Actual data input is in lb/gal.
7.10.34 lchtAs, concentration of arsenic in leachate (30 μg/l leachate, 30 μg/l leachate, 1.63 × 10⁻⁶ μg/l leachate)
Note: Actual data input is in lb/gal.

7. Life-Cycle Inventory of Landfill Leachate
180
7.10.35 lchtBa, concentration of barium in leachate (7.10 × 10⁻⁶ μg/l leachate, 7.10 × 10⁻⁶ μg/l leachate, 1.95 × 10² μg/l leachate)
Note: Actual data input is in lb/gal.
7.10.36 lchtCd, concentration of cadmium in leachate (5.80 × 10⁻⁸ μg/l leachate, 5.80 × 10⁻⁸ μg/l leachate, 1.58 × 10⁻⁸ μg/l leachate)
Note: Actual data input is in lb/gal.
7.10.37 lchtCr, concentration of chromium in leachate (85 μg/l leachate, 85 μg/l leachate, 20 μg/l leachate)
Note: Actual data input is in lb/gal.
7.10.38 lchtec, kWh consumed per pound BOD removed (0.45 kWh/lb BOD, 0.45 kWh/lb BOD, 0.45 kWh/lb BOD)
7.10.39 lchtHg, concentration of mercury in leachate (0.42 μg/l leachate, 0.42 μg/l leachate, 0 μg/l leachate)
Note: Actual data input is in lb/gal.
7.10.40 lchtNH3, concentration of NH3 in leachate (343 mg/l leachate, 343 mg/l leachate, 0 mg/l leachate)
Note: Actual data input is in lb/gal.
7.10.41 lchtp, leachate collection efficiency (99.8%, 99.8%, 99.8%)
7.10.42 lchtPb, concentration of lead in leachate (13 μg/l leachate, 13 μg/l leachate, 28.3 μg/l leachate)
Note: Actual data input is in lb/gal.
7.10.43 lchtPO4, concentration of PO4 in leachate (10 mg/l leachate, 10 mg/l leachate, 0.1 mg/l leachate)
Note: Actual data input is in lb/gal.
7.10.44 lchtrelease, enter 0 to hold leachate produced after treatment in the landfill; enter 1 to release leachate produced after treatment to the environment (0, 0, 0)
7.10.45 lchtSe, concentration of selenium in leachate (9.7 μg/l leachate, 9.7 μg/l leachate, 1.64 × 10² μg/l leachate)
Note: Actual data input is in lb/gal.
7.10.46 lgth1, distance between recirculation system and side slopes (0, 20 ft, 0)
7.10.47 lgth4, influence distance between trenches (0, 25 ft, 0)
7.10.48 lgth5, distance between bottom liner and first horizontal trench (0, 10 ft, 0)

7. Life-Cycle Inventory of Landfill Leachate
181
7.10.49 lgth6, distance between top of landfill and horizontal trench (0, 10 ft, 0)
7.10.50 lgth7, length of perforated concrete column (0, 65 ft¸0)
7.10.51 lgth8, length of PVC pipe in each vertical injection well (0, 65 ft¸0)
7.10.52 max5, weight of the maximum payload (contents) of the truck (6.62 × 10⁴ lb, 6.62 × 10⁴ lb, 6.62 × 10⁴ lb)
7.10.53 potw1, percent of leachate sent to POTW during collection period 1 (100%, 0%, 100%)
7.10.54 potw2, percent of leachate sent to POTW during collection period 2 (100%, 0%, 100%)
7.10.55 potw3, percent of leachate sent to POTW during collection period 3 (100%, 0%, 100%)
7.10.56 ppt1, percent of rainfall that becomes leachate during the first period (20%, 20%, 20%)
7.10.57 ppt2, percent of rainfall that becomes leachate during the second period (6.6%, 6.6%, 6.6%)
7.10.58 ppt3, percent of rainfall that becomes leachate during the third period (6.5%, 6.5%, 6.5%)
7.10.59 ppt4, percent of rainfall that becomes leachate during the fourth period (0.2%, 0.2%, 0.2%)
7.10.60 pptyear, annual precipitation (35 in., 35 in., 35 in.)
7.10.61 sc5, specific consumption for a heavy truck (6.4 mpg, 6.4 mpg, 6.4 mpg)
7.10.62 sldg_per_BOD, lb sludge generated per lb BOD removed (0.5 lb sludge/lb BOD, 0.5 lb sludge/lb BOD, 0.5 lb sludge/lb BOD)
7.10.63 time, selected time horizon (20, 100 or 500 years)
7.10.64 time1, start of leachate collection period 1 (0 year, 0 year, 0 year)
7.10.65 time2, end of leachate collection period 2 (40 years, 20 years, 40 years)
7.10.66 time3, end of leachate collection period 3 (40 years, 20 years, 40 years)
7.10.67 vcrt1, volume of concrete base and solid concrete section (0, 263 ft3, 0)
7.10.68 vcrt2, volume of perforated concrete per unit length (0, 9.91 ft3/ft, 0)
7.10.69 VPVC1,volume of PVC per unit length (0, 0.02 ft3/ft, 0)
7.10.70 YTL P_As, the percent contribution of leaves to arsenic in landfill leachate (0.17%, 0.17%, 0.17%)

183
References
A.J. Chandler & Associates Ltd., Compass Environmental Inc., Rigo & Rigo Associates., The Environmental Research Group-University of New Hampshire, Wastewater Technology Centre. "Waste Analysis, Sampling, Testing and Evaluation (WASTE) Program: Effect of Waste Stream Characteristics on MSW Incineration: The Fate and Behavior of Metals. The Final Report of Mass Burn MSW Incineration Study (Burnaby, B.C.). Volume II. Technical Report." April 1993.
Barlaz, M. A. “Biodegradative Analysis of Municipal Solid Waste in Laboratory-Scale Landfills.” U.S. Environmental Protection Agency Report #EPA 600/R-97-071, Washington, D.C., 1997.
Bogner J, Spokas K, Burton E, Sweeney R, and Corona V. “Landfills As Atmospheric Methane Sources and Sinks.” Chemosphere, 31(9):4119–4130, 1995.
De Visscher, A. , Thomas, D., Boeckx, P., and Van Cleemput, O. “Methane Oxidation in Simulated Landfill Cover Soil Environments.” Environ. Sci. Technol., 33:1854–1859, 1999.
Dodge Heavy Construction Cost Data. McGraw-Hill, New York, 1987.
Eleazer, W. E, Odle, W. S., Wang, Y.-S., and M. A. Barlaz. "Biodegradability of Municipal Solid Waste Components in Laboratory-Scale Landfills." Env. Sci. Technol., 31(3):911–917, 1997.
Environmental Research and Education Foundation. "Draft Report on the Life-Cycle Inventory of a Modern Municipal Solid Waste Landfill." Prepared by Ecobalance, 1997.
Environmental Research and Education Foundation. "Final Report on the Life-Cycle Inventory of a Modern Municipal Solid Waste Landfill." Prepared by Ecobalance, 1998.
Felker, M., Waste Management. Personal communication with M. A. Barlaz, 17 December 1997.
Felker, M., Waste Management. Personal communication with M. A. Barlaz, 18 June 1998.
Kerr's Cost Data for Landscape Construction. Van Nostrand Reinhold, New York, 1994.
Kightley, D., Nedwell, D.B., and Cooper, M. “Capacity for Methane Oxidation in Landfill Cover Soils Measured in Laboratory-Scale Soil Microcosms.” Appl. Environ. Microb., 61:592–601, 1995.
Pacey, J. Personal communication with M. A. Barlaz, September 1999.
R. S. Means Company, Inc. Means Building Construction Cost Data, 53rd Annual Edition, Construction Publishers and Consultants, Kingston, Mass, 1995.
R. S. Means Company, Inc. Means Building Construction Cost Data, 51st Annual Edition, Construction Publishers and Consultants, Kingston, Mass, 1993.
RCRA Subtitle D, 40 CFR Part 258, U.S. Environmental Protection Agency, October 9, 1991.
Richardson, G. N., G. N. Richardson & Associates, Inc. Interviews.

References
184
SGS Engineers, and D. Augenstein. "The Verification and Validation of Selected Modes for Predicting Landfill Gas Quality and Quantity." Prepared for The Solid Waste Association of North America, SCS Engineers in association with D. Augenstein, Institute for Environmental Management, 1996.
Tchobanoglous, G., Theisen, H., and Vigil, S. Integrated Solid Waste Management—Engineering Principles and Management Issues, McGraw-Hill, 1993.
U.S. EPA. "Characterization of Municipal Waste Combustion Ash, Ash Extracts, and Leachates." U.S. EPA Contract Number 68-01-7310, March 1990.
U.S. EPA. "Emission Factor Documentation for AP-42 Section 2.4, Municipal Solid Waste Landfills." U.S. Environmental Protection Agency, Office of Air Quality Planning and Standards, Office of Air and Radiation, September 1995.
U.S. EPA. "Turning Liability into an Asset: A Landfill Gas-to-Energy Project Development Handbook." U.S. Environmental Protection Agency. September 1996.
U.S. EPA. "Assessment of Needed Publicly Owned Wastewater Treatment Facilities in the United States 1988 Needs Survey Report to Congress." EPA 430/09-89-001, U.S. Environmental Protection Agency, February 1989.
U.S. EPA. Documentation for the EPA Computer Program for Development of Local Discharge Limitations Under The Pretreatment Program. US EPA. Office of Water (EN-336). 21W-4003. May 1991. Treatment of Photographic Processing Wastes. T. W. Bober, T. J. Dagon and H. E. Fowler, Handbook of Indust. Waste Treatment, Vol. 1. 1992)

A-1
Appendix A: Depth of Liner and Leachate Collection Systems
The total vertical distance occupied by the liner, leachate collection, and any cover soil over the system impacts the volume available in the landfill by taking up space otherwise available for waste burial. The thickness of each component is developed in separate sections, but this appendix combines these thicknesses into a single thickness for use in additional calculations. The following parameters are used in this derivation:
• Dlls, depth of the liner and leachate collection system (ft)
• Dspl, depth of compacted soil in the primary liner (ft)
• Dssl, depth of compacted soil in the secondary liner (ft)
• Dslc, depth of leachate collection system (ft)
• Dsl, depth of protective soil over the liner and leachate collection system (ft)
• z4, logical input, = +1 if a liner is used, 0 otherwise
• z6, logical input, = +1 if a double composite liner is used, 0 otherwise (single composite)
There are four depths to consider based on the liner and leachate design:
• Soil for the primary liner is included if any liner is used.
• Soil for the secondary liner is included if a secondary liner is used.
• Sand for a leachate collection system is included if any liner is used.
• Material for the leachate detection zone is included if a secondary liner is used.
• Soil over the system is included if a liner is used.
Based on these logical assumptions, the equation for the total thickness is derived:
( ) ( ) ( ) ( )D D z D z z D z D zlls spl ssl slc sl= × + × × + × + ×4 4 6 4 4

B-1
Appendix B: Discount Factors
Three factors are required in this analysis to account for the time value of money. These are (1) conversion of a present worth to an annual cost (A/P), (2) conversion of an annual cost to a present worth (P/A), and (3) conversion of a future worth to an annual cost (A/F).
With i as the effective annual interest rate and n as the period of interest in years, the general equations are:
(1) ( )( ) 1i1
i1iP/A n
n
−+
+×=
(2) ( )( )n
n
i1i1i1A/P
+×
−+=
(3) ( ) 1i1
iF/A n −+=
(4) ( )ni1
1F/P+
=

C-1
Appendix C: Site Soil Utilization
The volume of soil (yd3) excavated for development of the clearing and excavation cost function is calculated in equation 21 of section 2. This soil is available for use in construction of the liner and berms and for daily and final cover requirements, depending upon the quality of the excavated soil. It is assumed that all soil excavated is of suitable quality for berms and cover, except for fraction specified as difficult excavation. Quality requirements for the liner construction are distinguished from the requirements for berms and daily and final cover. A user-specified parameter is used to calculate the fraction of the excavation suitable for liner construction:
f10, fraction of excavation suitable for liner construction, daily cover, berms, and final cover
f2, fraction of excavated volume considered difficult to excavate
The volume requirements for the berm and the liner are developed in the corresponding section (section 2) of this document:
Vbm, volume of berm (yd3)
Vl, , volume of soil for liner construction (yd3/cell)
scvr, volume of soil for cover liner (yd3)
The calculation of daily cover volume for the site is developed here simply as a function of the volume of waste and the waste:soil ratio as
100p
100p
VV soil1cvrw1c ××=
where
Vcl = volume of soil required for daily cover (yd3),
Pcvr1 = percent of total landfill volume occupied by cover (%),
Psoil = percent of daily cover that is soil (%), and
Vw = required landfill capacity for waste (yd3).
The calculation of final cover volume for the site is developed here simply as a function of the area of the site disposal volume and the thickness of the clay layer:
( )( )3
3
ft27yd
claytlfc tAV ××=
where
Vfc = volume of soil required for final cover (yd3),

Appendix C: Site Soil Utilization
C-2
Atl, = area of the top of the liner (ft2), and
tclay = thickness of clay layer (ft).
The calculation for parameter Atl is provided in equation 57 in section 2.4.2
The calculations presented below account for soil use several items. They determine if additional soil must be purchased for each item and account for excess soil from each construction activity that is available for use in another construction activity. It is assumed that soil able to be used for liner or daily cover and that is needed based on the volume requirements is stockpiled and not used for berm construction. The accounting of soil volume is developed based on decreasing quality requirements and not on the order of construction.
The following parameters are calculated in this development:
• Vsl, volume of soil excavated usable for liner construction (yd3)
• Vs, volume of soil required to cover leachate collection system (yd3)
• Vslx, volume of soil excavated usable for liner construction but excess (yd3)
• Vslp, volume of soil required to be purchased for liner construction (yd3)
• Vstl, volume of soil excavated usable for cover liner construction (yd3)
• scvr1, volume of soil required for top soil and vegetative support cover (yd3)
• Vstlx, volume of soil excavated usable for cover liner construction but excess (yd3)
• Vstlp, volume of soil required to be purchased for cover construction (yd3)
• Vsc, volume of soil excavated usable for daily cover (yd3)
• Vc1, volume of soil required for daily cover (yd3)
• Vscx, volume of soil excavated usable for daily cover but excess (yd3)
• Vscp, volume of off-site soil required to be purchased for daily cover (yd3)
• Ponsite, percent of daily cover soil volume that can be obtained on site as calculated in the soil budget (%)
• Poffsite, percent of daily cover that is off-site soil (%)
• Vsb, volume of soil excavated usable for berm and final cover (yd3)
• Vbm1, volume of soil available from excavation after main liner, top soil and vegetative support cover (yd3)
• Vsbx, volume of soil excavated usable for berm construction but excess (yd3)
• Vsbp, volume of soil required to be purchased for berm construction (yd3)
• Vsfc, volume of soil excavated usable for final cover (yd3)
• Vfc, volume of soil required for final cover (yd3)
• Vsfcx, volume of soil excess after final cover (yd3)

Appendix C: Site Soil Utilization
C-3
• Vsfcp, volume of soil purchased for final cover (yd3)
• Vsh, volume of soil to be hauled off site (yd3)
The soil volume required may be less than, equal to, or greater than the available excavated soil. The SIGN function is used in the accounting of total remaining excavated soil:
( )⎪⎩
⎪⎨
⎧
−
+=
0<N if ,10=N if ,00>N if ,1
NSIGN
The function ( )[ ]1NSIGN21 + returns a value of 0 if N < 0 and 1 if N > 0. Then, if this function is multiplied
by the value N, the return is a value of 0 if N ≤ 0 or N if N > 0.
Liner Construction
The soil required for liner construction (Vl × Nr) and the soil required to cover the leachate collection system (Vs) are calculated. If the volume of liner soil (Vs + (Vl × Nr)) is greater than the usable, excavated volume (Vsl), an amount of soil (Vslp) must be purchased. If the volume of liner soil is less than the usable, excavated volume, the excess soil (Vslx) will be used for top soil and vegetative support cover.
( ) e20lsl Vf1fV ×−×=
( )( )3
3
ft27yd
slrls DNAV ×××=
( )( ) ( )( )( )1VNVVSIGNVNVVV srlsl21
srlslslx +−×−×−×−=
( )( ) ( )( )( )1VVNVSIGNVVNVV slsrl21
slsrlslp +−+××−+×=
Top Soil and Vegetative Support Cover
The volume of soil available (Vstl) is equal to the excess soil from liner construction (Vslx). If the volume of top soil and support soil (scvr1) is greater than the available soil (Vstl), an amount of soil (Vstlp) must be purchased. If the volume of cover soil is less than available volume, the excess soil (Vstlx) will be used for berm construction.
slxstl V V =
scvr1 Vscvr =
( ) ( )( )11scvrVSIGN1scvrVV stl21
stlstlx +−×−=
( ) ( )( )1V1scvrSIGNV1scvrV stl21
stlstlp +−×−=

Appendix C: Site Soil Utilization
C-4
Berm Construction
The volume of soil available (Vsb) is equal to the excess soil from cover construction (Vstlx). If the volume required for berm construction (Vbml) is greater than the available soil (Vsb), an amount of soil (Vsbp) must be purchased. If the volume of cover soil is less than available volume, the excess soil (Vsbx) will be used for daily cover soil.
stlxsb V V =
bm1bm V V =
( ) ( )( )1VVSIGNVVV 1bmsb21
1bmsbsbx +−×−=
( ) ( )( )1VVSIGNVVV sb1bm21
sb1bmsbp +−×−=
Daily Cover Soil
The volume of soil available (Vsc) is equal to the excess soil from cover construction (Vscx). If the volume required for daily cover (Vc1) is greater than the available soil (Vsc), an amount of soil (Vscp) must be purchased. If the volume of cover soil is less than available volume, the excess soil (Vscx) will be used for daily cover soil. The percent of daily cover that is on-site soil and the percent of daily cover that is off-site soil are also calculated.
( )( ) ( )( )s1bmrle210sc VV1scvrNVVf1fV +++×−×−×=
100p
100p
VV soil1cvrw1c ××=
( ) ( )( )1VVSIGNVVV 1csc21
1cscscx +−×−=
( ) ( )( )1VVSIGNVVV sc1c21
sc1cscp +−×−=
⎟⎟⎠
⎞⎜⎜⎝
⎛×
−== 100
VVV
,0,0VIFP1c
scp1c1consite
⎟⎟⎠
⎞⎜⎜⎝
⎛×== 100
VV
,0,0VIFP1c
scp1coffsite
Final Cover
The volume of soil available (Vsfc) is equal to the soil remaining after daily cover application (Vscx). If the volume required for final cover (Vfc) is greater than the available soil (Vsfc), an amount of soil (Vsfcp) must be purchased. If the volume of cover soil is less than available volume, the excess soil (Vsfcx) will be removed from site.
( )( ) ( ) ( ) ( ) ( )sbxsbscxscstlxstlslxsle210sfc VVVVVVVVVf1fV −−−−−−−−×−×=

Appendix C: Site Soil Utilization
C-5
( )( )3
3
ft27yd
claytlfc tAV ××=
( ) ( )( )1VVSIGNVVV fcsfc21
fcsfcsfcx +−×−=
( ) ( )( )1VVSIGNVVV sfcfc21
sfcfcsfcp +−×−=
Soil to be Removed from Site
Finally, any excess soil or soil not suitable for any use must be hauled away from the site.
( )e2sfcxsh VfVV ×+=

E-1
Appendix E. Alphabetic List of Parameters Used in Calculations
A
a_CO2, precombustion emission factor for CO2 due to electric energy consumption (lb/ton waste)
Ab, area of berm cross section (ft2)
ACM3, area of HDPE cover (ft2/acre)
actual1, weight of an actual payload (contents) of a heavy-duty truck (lb)
actual2, weight of an actual payload (contents) of a dump truck (lb)
actual3, weight of the actual payload (contents) of the heavy-duty truck (lb)
actual4, weight of the actual payload (contents) of the dump truck (lb)
actual5, weight of the actual payload (contents) of the heavy-duty truck (lb)
AHDPE, area of HDPE per acre (ft2/acre)
ainfl, area of influence per vertical injection well (1 acre, 1 acre, 1 acre)
Al, area over which liner is installed (ft2/cell)
Am, floor area of equipment storage building (ft2)
As, area of land required for landfill and buffer zone (acres)
Atl, area of top of final cover (ft2)
B
BOD1, start of first BOD production period (years)
BOD2, end of first BOD production period (years)
BOD3, start of second BOD production period (years)
BOD4, end of second BOD production period (years)
BOD5, start of third BOD production period (years)
BOD6, end of third BOD production period (years)
BODb1, y-intercept of first segment in BOD production curve (years)
BODb2, y-intercept of second segment in BOD production curve (years)
BODb3, y-intercept of third segment in BOD production curve (years)
BODcon1, BOD concentration at the start of the first BOD production period (lb/gal leachate)
BODcon2, BOD concentration at the end of the first BOD production period (lb/gal leachate)
BODcon3, BOD concentration at the start of the second BOD production period (lb/gal leachate)

Appendix E: Alphabetic List of Parameters Used in Calculations
E-2
BODcon4, BOD concentration at the end of the second BOD production period (lb/gal leachate)
BODcon5, BOD concentration at the start of the third BOD production period (lb/gal leachate)
BODcon6, BOD concentration at the end of the third BOD production period (lb/gal leachate)
BODgen1, BOD generated during the chosen time horizon (lb/gal leachate)
BODgen2, BOD generated during treatment years (lb/gal leachate)
BODm1, slope of first segment in BOD production curve (years)
BODm2, slope of second segment in BOD production curve (years)
BODm3, slope of third segment in BOD production curve (years)
BODN1, length of first BOD production period (years)
BODN2, length of second BOD production period (years)
BODN3, length of third BOD production period (years)
BODrmvd, BOD removed at POTW (lb/ton waste)
BODtrt, BOD generated and treated during the chosen time horizon (lb/gal leachate)
C
c1, unit cost of land ($/acre)
c2, unit cost of clearing land ($/acre)
c3, unit cost of standard excavation ($/yd3)
c4, unit cost of difficult excavation (i.e., muck, rock, etc.) ($/yd3)
c5, unit cost of industrial fencing, material and installation ($/linear ft)
c6, unit cost of earthen berm construction ($/yd3)
c7, unit cost of procurement and delivery of soil adequate for berm construction ($/yd3)
c8, cost of hauling soil ($/yd3-mi)
c9, cost of construction of a maintenance and equipment storage building ($/ft2)
c10, cost of a gatehouse/personnel support building and flare ($)
c11, cost of a public drop-off station ($)
c12, installed cost of industrial truck scale, capacity 50 tons ($)
c13, unit cost of electrical connection to utility grid ($)
c14, unit cost of sanitary sewer connections and piping ($/linear ft)
c15, unit cost of septic system ($)

Appendix E: Alphabetic List of Parameters Used in Calculations
E-3
c16, unit cost of potable water connection ($)
c17, unit cost of potable water well installation and connection ($)
c18, unit cost of gas connection ($)
c22, unit cost of road construction suitable for heavy-vehicle traffic ($/linear ft)
c23, unit cost of road construction for upgrade of existing roads ($/linear ft)
c24, unit cost of well drilling and installation ($/linear ft of well depth)
c25, unit cost of low-level landscaping ($/acre)
c26, cost of high-level landscaping around buildings and site entrance ($)
c27, unit cost of procurement and installation of flexible membrane liner ($/ft2)
c29, unit cost of procurement and delivery of soil suitable for liner construction ($/yd3)
c30, unit cost of procurement and delivery of soil additive to decrease permeability ($/yd3)
c31, unit cost of procurement, delivery, and installation of drainage material for leachate detection and cover (sand) ($/yd3)
c32, unit cost of installation of compacted soil liner, including soil preparation ($/yd3)
c33, unit cost of purchase, delivery, and installation of leachate collection layer (gravel) ($/yd3)
c34, cost to procure and install leachate pump and associated piping and electrical ($)
c35, cost of leachate storage tank ($)
c36, cost to procure and install PVC piping ($/ft)
c41, total cost of site preoperational studies and activities ($)
c42, unit cost of procurement and delivery of soil suitable for daily cover ($/yd3)
c43, minimum annual labor costs ($/year)
c44, incremental labor costs for each increase in landfill tonnage above Mwm (day
tonyear
$
)
c45, cost of equipment procurement and maintenance per mass of waste handled (day
tonyear
$)
c46, annual cost of well monitoring ($/well-year)
c47, leachate treatment and disposal cost including transport to publicly owned treatment works (POTW) ($/gal)
c48, annual perpetual care cost ($/year)
c49, cost of off-site hauling of soil ($/yd3-mi)
c50, total cost of cell-one preoperational studies and activities ($)
c51, unit cost of procurement of on-site daily cover soil ($/yd3)

Appendix E: Alphabetic List of Parameters Used in Calculations
E-4
c52, unit cost of procurement and installation of HDPE ($/ft2)
c53, revenue-generating cover ($/yd3)
c54, unit cost of concrete ($/yd3)
c55, cost of procurement of geotextile ($/ft2)
c56, cost of procurement and installation of HDPE for final cover ($/ft2)
c57, cost of installing geotextile for final cover ($/ft2)
c58, capital cost of turbine ($)
c59, capital cost of internal combustion engine ($)
c60, cost if turbine is used in gas treatment ($)
c61, cost if internal combustion engine is used in gas treatment ($)
CB, cost function of earthen berm ($)
CC, cost function for initial construction ($/yd3)
Cc, total cost of site clearing ($)
CCC, cost function for cell one construction ($-year/cell-yd3)
CCE, cost function of site clearing and excavation ($)
CCL, cost of clay for final cover ($)
CCM, the total cost of daily cover ($/year)
CCM1, cost of off-site soil for daily cover ($/year)
CCM2, cost of on-site soil for daily cover ($/year)
CCM3, cost of HDPE for daily cover ($/year)
CCM4, revenue from revenue-generating cover ($/year)
CCO, cost function of cell-one preoperational studies and activities ($)
CDO, cost function of daily operations ($/year)
Ce, total cost of site excavation ($)
Ceq, annual cost of equipment ($/year)
CF, cost function of site fencing ($)
CFC, final cover cost ($)
CGE, cost of gas collection system ($)
CGTX, cost of geotextile liner ($)
CH4DRY, dry weight methane yield of a waste stream component (ft3 CH4/dry lb)

Appendix E: Alphabetic List of Parameters Used in Calculations
E-5
CH4WW, wet weight methane yield (ft3/wet lb component)
CH4WWF, methane yield per wet pound (ft3/wet lb CH4)
CHDPE, cost of HDPE liner ($)
CIC, cost function for initial construction ($/yd3)
CIL, cost function of initial landscaping ($)
Cl, annual cost of labor ($/year)
CL, cost function for land ($)
CLC, cost function of leachate pumping and storage system ($)
CLCP, cost function of leachate collection piping ($)
CLD, cost of low-level landscaping ($)
CLS, cost function of liner system ($)
CLSR_BCKH CLSR_A_CO2, fossil CO2 emissions from a backhoe (lb/ton waste)
CLSR_BCKH CMB_A_CO2, fossil CO2 emissions from a backhoe during closure (lb/ton waste)
CLSR_BLLDZR CMB_A_CO2, fossil CO2 emissions from a bulldozer during closure (lb/ton waste)
CLSR_DR CLSR_A_CO2, fossil CO2 emissions from a drum roller (lb/ton waste)
CLSR_DR CMB_A_CO2, fossil CO2 emissions from a drum roller during closure (lb/ton waste)
CLSR_DT CLSR_A_CO2, fossil CO2 emissions from a dump truck (lb/ton waste)
CLSR_DT CMB_A_CO2, fossil CO2 emissions from a dump truck during closure (lb/ton waste)
CLSR_GTX CLSR_A_CO2, fossil CO2 emitted due to geotextile production (lb/ton waste)
CLSR_HDPE CLSR_A_CO2, fossil CO2 emitted due to HDPE production (lb/ton waste)
CLSR_HT CLSR_A_CO2, fossil CO2 emissions from a heavy truck (lb/ton waste)
CLSR_PC CLSR_A_CO2, fossil CO2 precombustion emissions (lb/ton waste)
CLSR_PC CMB_A_CO2, fossil CO2 emissions from precombustion of diesel fuel during closure (lb/ton waste)
CLSR_PU CLSR_A_CO2, fossil CO2 emissions from a pick-up (lb/ton waste)
CLSR_PU CMB_A_CO2, fossil CO2 emissions from a pickup during closure (lb/ton waste)
CLSR_PVC CLSR_A_CO2, fossil CO2 emitted due to PVC production (lb/ton waste)
CLSR_SAND CLSR_A_CO2, fossil CO2 emitted while obtaining sand for final cover (lb/ton waste)
CLSR_SCRPR CLSR_A_CO2, fossil CO2 emissions from a scraper (lb/ton waste)
CLSR_SCRPR CMB_A_CO2, fossil CO2 emissions from a scraper during closure (lb/ton waste)
CLSR_SOIL CLSR_A_CO2, fossil CO2 emitted while obtaining soil for final cover (lb/ton waste)

Appendix E: Alphabetic List of Parameters Used in Calculations
E-6
CLSR_TD CLSR_A_CO2, fossil CO2 emissions from a tractor (lb/ton waste)
CLSR_TD CMB_A_CO2, fossil CO2 emissions from a tractor during closure (lb/ton waste)
CLSR_WL CLSR_A_CO2, fossil CO2 emissions from a wheel loader (lb/ton waste)
CLSR_WL CMB_A_CO2, fossil CO2 emissions from a wheel loader during closure (lb/ton waste)
CLSR_WT CLSR_A_CO2, fossil CO2 emissions from a water truck (lb/ton waste)
CLSR_WT CMB_A_CO2, fossil CO2 emissions from a water truck during closure (lb/ton waste)
Clt, annual cost of leachate treatment ($/year)
CMB BLR CMB_A_CO2_BM, emission of biomass CO2 after gas combustion in a boiler (lb/mol gas)
CMB FLR CMB_A_CO2_BM, emission of biomass CO2 after gas combustion in a flare (lb/mol gas)
CMB ICE CMB_A_CO2_BM, emission of biomass CO2 after gas combustion in an ICE (lb/mol gas)
CMB TRBN CMB_A_CO2_BM, emission of biomass CO2 after gas combustion in a turbine (lb/mol gas)
CMB_CRT CMB_A_CO2, emission factor for fossil CO2 emission due to concrete production (lb CO2-F/lb concrete)
CMB_GTX CMB_A_CO2, emission factor for fossil CO2 due to geotextile production (lb CO2-F/lb geotextile)
CMB_HDPE CMB_A_CO2, emission factor for fossil CO2 due to HDPE production (lb CO2-F/lb HDPE)
CMB_HVY CMB_A_CO2, emission factor for fossil CO2 from heavy trucks (lb CO2-F/gal fuel)
CMB_LDT CMB_A_CO2, emission factor for fossil CO2 emissions from a light-duty truck (lb CO2-F/gal fuel)
CMB_LT CMB_A_CO2, emission factor for fossil CO2 from dump trucks (lb CO2-F/gal fuel)
CMB_MWR CMB_A_CO2, emission factor for fossil CO2 emissions from a four-stroke lawnmower (lb CO2-F/gal fuel)
CMB_PVC CMB_A_CO2, emission factor for fossil CO2 due to PVC production (lb CO2-F/lb PVC)
CMB_SAND CMB_A_CO2, emission factor for fossil CO2 due to sand production (lb CO2-F/lb sand)
CMB_SCRPR CMB_A_CO2, emission factor for fossil CO2 from a scraper (lb CO2-F/gal fuel)
CMB_SOIL CMB_A_CO2, emission factor for fossil CO2 due to off-site soil production (lb CO2-F/lb soil)
CMB_TK CMB_A_CO2, emission factor for fossil CO2 emission from diesel combustion in a water truck (lb CO2-F/gal fuel)
CMB_WL CMB_A_CO2, emission factor for fossil CO2 from a wheel loader (lb CO2-F/gal fuel)
CMC, cost of mixing and compaction clay for final cover ($)
CMW, cost of monitoring wells ($)
CO, cost function for operations ($/yd3)
CO2_per_BOD, pounds of biomass CO2 generated per pound of BOD removed (lb CO2-B/lb BOD)

Appendix E: Alphabetic List of Parameters Used in Calculations
E-7
CODgen1, amount of COD generated during the chosen time horizon (lb/gal leachate)
CODgen2, amount of COD generated during treatment years (lb/gal leachate)
CODtrt, amount of COD generated and treated during the chosen time horizon (lb/gal leachate)
COM_DU G_A_CH4, total CH4 emitted after treatment in a boiler (lb/ton waste)
COM_DU G_A_CO2_BM, total biomass CO2 emitted after treatment in a boiler (lb/ton waste)
COM_DU1 G_A_CH4, CH4 remaining after landfill gas is treated by a boiler in the first treatment period (lb/ton waste)
COM_DU2 G_A_CH4, CH4 remaining after landfill gas is treated by a boiler in the second treatment period (lb/ton waste)
COM_DU3 G_A_CH4, CH4 remaining after landfill gas is treated by a boiler in the third treatment period (lb/ton waste)
COM_FLR G_A_ CO2_BM, total biomass CO2 emitted after flaring (lb/ton waste)
COM_FLR G_A_CH4, total CH4 emitted after flaring (lb/ton waste)
COM_FLR1 G_A_CH4, CH4 remaining after landfill gas is treated by a flare in the first treatment period (lb/ton waste)
COM_FLR2 G_A_CH4, CH4 remaining after landfill gas is treated by a flare the second treatment period (lb/ton waste)
COM_FLR3 G_A_CH4, CH4 remaining after landfill gas is treated by a flare in the third treatment period (lb/ton waste)
COM_ICE G_A_ CO2_BM, total biomass CO2 emitted after treatment in an ICE (lb/ton waste)
COM_ICE G_A_CH4, total CH4 emitted after treatment in an ICE (lb/ton waste)
COM_ICE1 G_A_ CH4, CH4 remaining after landfill gas is treated by an ICE in the first treatment period (lb/ton waste)
COM_ICE2 G_A_CH4, CH4 remaining after landfill gas is treated by an ICE in the second treatment period (lb/ton waste)
COM_ICE3 G_A_CH4, CH4 remaining after gas is treated by an ICE in the third treatment period (lb/ton waste)
COM_TRBN G_A_ CO2_BM, total biomass CO2 emitted after treatment in a turbine (lb/ton waste)
COM_TRBN G_A_CH4, total CH4 emitted after treatment in a turbine (lb/ton waste)
COM_TRBN1 G_A_ CH4, CH4 remaining after landfill gas is treated by a turbine in the first treatment period (lb/ton waste)
COM_TRBN2 G_A_CH4, CH4 remaining after landfill gas is treated by a turbine in the second treatment period (lb/ton waste)
COM_TRBN3 G_A_CH4, CH4 remaining after landfill gas is treated by a turbine in the third treatment period (lb/ton waste)
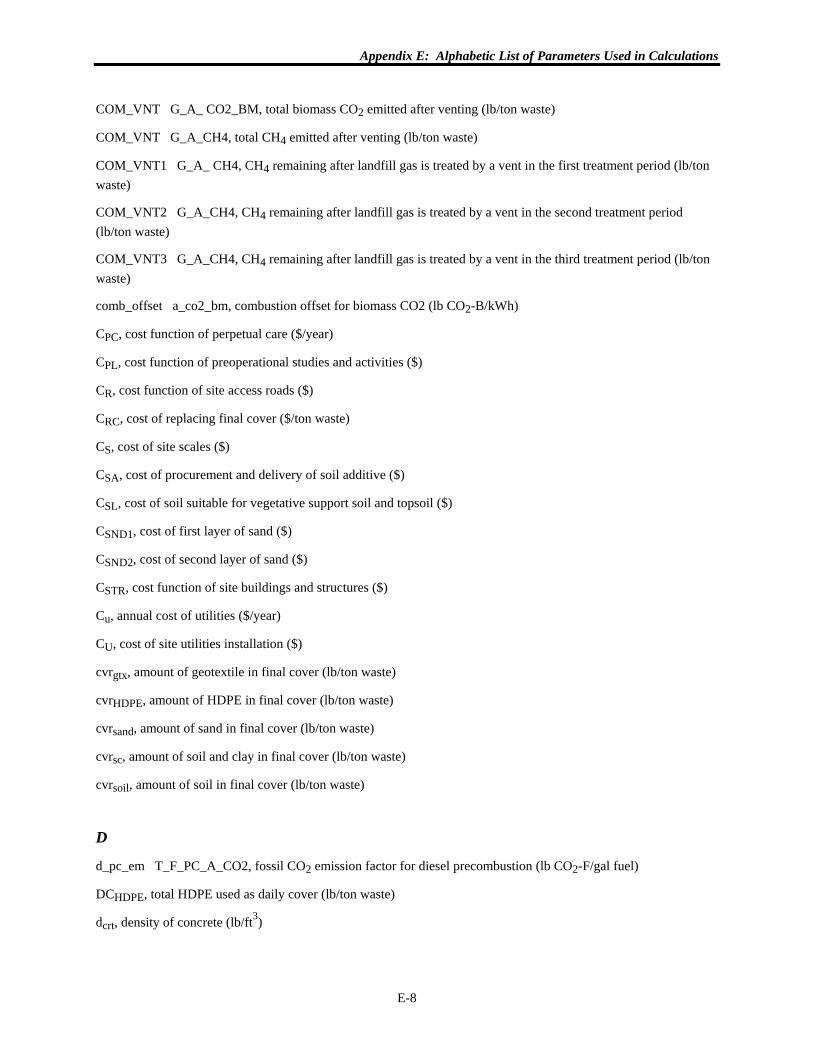
Appendix E: Alphabetic List of Parameters Used in Calculations
E-8
COM_VNT G_A_ CO2_BM, total biomass CO2 emitted after venting (lb/ton waste)
COM_VNT G_A_CH4, total CH4 emitted after venting (lb/ton waste)
COM_VNT1 G_A_ CH4, CH4 remaining after landfill gas is treated by a vent in the first treatment period (lb/ton waste)
COM_VNT2 G_A_CH4, CH4 remaining after landfill gas is treated by a vent in the second treatment period (lb/ton waste)
COM_VNT3 G_A_CH4, CH4 remaining after landfill gas is treated by a vent in the third treatment period (lb/ton waste)
comb_offset a_co2_bm, combustion offset for biomass CO2 (lb CO2-B/kWh)
CPC, cost function of perpetual care ($/year)
CPL, cost function of preoperational studies and activities ($)
CR, cost function of site access roads ($)
CRC, cost of replacing final cover ($/ton waste)
CS, cost of site scales ($)
CSA, cost of procurement and delivery of soil additive ($)
CSL, cost of soil suitable for vegetative support soil and topsoil ($)
CSND1, cost of first layer of sand ($)
CSND2, cost of second layer of sand ($)
CSTR, cost function of site buildings and structures ($)
Cu, annual cost of utilities ($/year)
CU, cost of site utilities installation ($)
cvrgtx, amount of geotextile in final cover (lb/ton waste)
cvrHDPE, amount of HDPE in final cover (lb/ton waste)
cvrsand, amount of sand in final cover (lb/ton waste)
cvrsc, amount of soil and clay in final cover (lb/ton waste)
cvrsoil, amount of soil in final cover (lb/ton waste)
D
d_pc_em T_F_PC_A_CO2, fossil CO2 emission factor for diesel precombustion (lb CO2-F/gal fuel)
DCHDPE, total HDPE used as daily cover (lb/ton waste)
dcrt, density of concrete (lb/ft3)

Appendix E: Alphabetic List of Parameters Used in Calculations
E-9
DCsoil, off-site soil used per ton of waste (lb/ton waste)
De, depth of excavation (ft)
Deff, effective landfill density (lb/yd3)
Dfuel, density of diesel fuel (lb/gal)
dgtx, density of geotextile (lb/ft3)
DHDPE, density of HDPE used for daily cover (lb/ft3)
dht, depth that could be occupied by horizontal trench (ft)
dlcht, density of leachate (lb/gal)
Dlls, depth of liner and leachate collection system (ft)
Dmsw, average density of waste after burial (lb/yd3)
Doverall, overall effective landfill density (lb/yd3)
DPVC, density of PVC (lb/ft3)
dsand, density of sand (lb/ft3)
Dsl, depth of protective soil over the liner and leachate collection system (ft)
Dslc, depth of leachate collection system (ft)
dsoil, density of soil layer (lb/ft3)
Dsoil, density of the off-site soil (lb/ft3)
Dspl, depth of compacted soil in the primary liner (ft)
Dssl, depth of compacted soil in the secondary liner (ft)
DU G_A_CO2_BM, total biomass CO2 emissions from a boiler (lb/ton waste)
E
EE_DU G_A_CO2_BM, total biomass CO2 emissions from a boiler (lb/ton waste)
EE_DU1 G_A_CO2_BM, biomass CO2 emissions from a boiler during first landfill gas treatment period (lb/ton waste)
EE_DU2 G_A_CO2_BM, biomass CO2 emissions from a boiler during second landfill gas treatment period (lb/ton waste)
EE_DU3 G_A_CO2_BM, biomass CO2 emissions from a boiler during third landfill gas treatment period (lb/ton waste)
EE_FLR G_A_CO2_BM, total biomass CO2 emitted from a flare during all three landfill gas treatment periods (lb/ton waste)
EE_FLR1 G_A_CO2_BM, biomass CO2 emissions from a flare during first treatment period (lb/ton waste)

Appendix E: Alphabetic List of Parameters Used in Calculations
E-10
EE_FLR2 G_A_CO2_BM, biomass CO2 emissions from a flare during second treatment period (lb/ton waste)
EE_FLR3 G_A_CO2_BM, biomass CO2 emissions from a flare during third treatment period (lb/ton waste)
EE_ICE G_A_CO2_BM, total biomass CO2 emitted from an ICE during all three landfill gas treatments (lb/ton waste)
EE_ICE1 G_A_CO2_BM, biomass CO2 emissions from an ICE during first treatment period (lb/ton waste)
EE_ICE2 G_A_CO2_BM, biomass CO2 emissions from an ICE during the second treatment period (lb/ton waste)
EE_ICE3 G_A_CO2_BM, biomass CO2 emissions from an ICE during the third treatment period (lb/ton waste)
EE_TRBN G_A_CO2_BM, total biomass CO2 emitted from a turbine during all three landfill gas treatments (lb/ton waste)
EE_TRBN1 G_A_CO2_BM, biomass CO2 emissions from a turbine during first landfill gas treatment period (lb/ton waste)
EE_TRBN2 G_A_CO2_BM, biomass CO2 emissions from a turbine during second landfill gas treatment period (lb/ton waste)
EE_TRBN3 G_A_CO2_BM, biomass CO2 emissions from a turbine during third landfill gas treatment period (lb/ton waste)
effBOD, BOD removal efficiency (%)
effbz, benzene removal efficiency (%)
effCOD, COD removal efficiency (%)
effdu effCH4, CH4 destruction efficiency in a boiler (%)
effdu2, efficiency of boiler (%)
effflr eff CH4, CH4 destruction efficiency in a flare (%)
effice eff CH4, CH4 destruction efficiency in an ICE (%)
effice eff CH4, CH4 destruction efficiency in an ICE (%)
effice2, efficiency of internal combustion engine (%)
effmtls, metals removal efficiency (%)
effNH3, ammonia removal efficiency (%)
effPO4, phosphate removal efficiency (%)
efftrbn eff CH4, CH4 destruction efficiency in a turbine (%)
efftrbn2, efficiency of turbine (%)
effTSS, suspended solids removal efficiency (%)
effvnt eff CH4, CH4 destruction efficiency in a vent (%)
er1, return of heavy-duty truck (empty return: YES[1] or NO[0], or any fraction between these two numbers)
Appendix E: Alphabetic List of Parameters Used in Calculations
E-11
er2, return of dump truck (empty return: YES[1] or NO[0], or any fraction between these two numbers)
er3, return of heavy-duty truck for transport of materials during landfill closure (empty return: YES[1] or NO[0], or any fraction between these two numbers)
er4, return of dump truck for transport of materials during landfill closure (empty return: YES[1] or NO[0], or any fraction between these two numbers)
er5, return of truck from hauling leachate from POTW (empty return: YES, 1 or NO, 0, or any fraction between these two numbers)
F
f1, fraction of below-grade volume required to be excavated
f2, fraction of excavated volume considered difficult to excavate
f3, fraction of buffer zone to be cleared and landscaped prior to operating landfill
f4, fraction of soil additive to mix with native or purchased soil to achieve required permeability
f5, engineering design multiplier for capital investment
f6, engineering design multiplier for landfill operations
f7, labor fringe rate
f9, utilities costs fraction (of personnel costs)
f10, fraction of excavation suitable for liner construction, daily cover, berms, and final cover
f11, scaling factor between the ultimate gas yield predicted by the Solid Waste Association of North American (SWANA) and the ultimate gas yield predicted by laboratory analysis
fcr1, capital recovery factor for initial construction
fcr2, capital recovery factor for staged construction
fcr3, capital recovery factor for perpetual care costs
fcr4, capital recovery factor for closure costs
fcr5, converts future value to present value
fcr6, annualizes present value
FLR G_A_CO2_BM, total biomass CO2 emissions from a flare (lb/ton waste)
fuel1, fuel used at a site with daily cover (gal/ton waste)
fuel2, fuel used at a site with no daily cover (gal/ton waste)
fuel3, fuel consumed by heavy trucks while transporting fuel for use at sites with daily cover (gal/ton waste)
fuel4, fuel consumed by dump trucks while transporting off-site soil (gal/ton waste)
fuel5, fuel consumed by heavy trucks while transporting fuel and HDPE (gal/ton waste)

Appendix E: Alphabetic List of Parameters Used in Calculations
E-12
fuel6, fuel consumed by heavy trucks while transporting fuel for use in sites with no daily cover (gal/ton waste)
fuel7, total fuel consumed during landfill operations (gal/ton waste)
fuel8, fuel used by heavy equipment during closure activities (gal/ton waste)
fuel9, fuel consumed by dump trucks while transporting sand, soil and clay for final cover (gal/ton waste)
fuel10, fuel consumed by heavy trucks (gal/ton waste)
fuel11, total fuel consumed during closure activities (gal/ton waste)
fuel12, fuel used for inspections (gal/year-ton waste)
fuel13, fuel used for mowing (gal/year-ton waste)
fuel14, fuel consumed while transporting leachate to POTW (gal/ton waste)
fuel15, fuel consumption in a water truck (gal/hr)
fuel16, fuel use per ton of waste (gal/ton waste)
G
g_pc_em T_F_PC_A_CO2, precombustion emission factor for gasoline and fossil CO2 (lb CO2-F/gal fuel)
G_TBS G_A_CH4, CH4 in landfill gas after passing through soil (lb/ton waste)
G_TBS G_A_CO2_BM, biomass CO2 emitted after treatment by soil (lb/ton waste)
G_UN G_A_CO2_BM, biomass CO2 in uncollected gas (mol/ton waste)
G_YTL G_P, the percent contribution of leaves to the landfill gas production (%)
gas(t),landfill gas produced during year t under the first landfill gas treatment (ft3/ton waste)
gas_totalt, cumulative landfill gas production at time t (ft3/ton waste)
gas1, gas produced and collected during the first collection period (ft3/ton waste)
gas1a, gas collected and treated in first collection period (lb/ton waste)
gas1du, use of boiler in first landfill gas treatment period (%)
gas1flr, use of flare during the first landfill gas treatment period (%)
gas1ice, use of ICE during first landfill gas treatment period (%)
gas1trbn, use of turbine during first landfill gas treatment period (%)
gas1vnt, use of vent during the first landfill gas treatment period (%)
gas2, gas produced and collected during the second collection period (ft3/ton waste)
gas2du, use of boiler during second landfill gas treatment period (%)
gas2flr, use of flare during the second landfill gas treatment period (%)
gas2ice, use of ICE during second landfill gas treatment period (%)

Appendix E: Alphabetic List of Parameters Used in Calculations
E-13
gas2trbn, use of turbine during second landfill gas treatment period (%)
gas2vnt, use of vent during the second landfill gas treatment period (%)
gas3, gas produced and collected during the third collection period (ft3/ton waste)
gas3du, use of boiler during third landfill gas treatment period (%)
gas3flr, use of flare during the third landfill gas treatment period (%)
gas3ice, use of ICE during third landfill gas treatment period (%)
gas3trbn, use of turbine during third landfill gas treatment period (%)
gas3vnt, use of vent during the third landfill gas treatment period (%)
gasbz, percent of landfill gas that is benzene (%)
gasch, percent of landfill gas that is chloroform (%)
gasCH4, percent of methane in landfill gas (%)
gasCO2, percent of landfill gas that is biomass carbon dioxide (%
gasct, percent of landfill gas that is biomass carbon tetrachloride (%)
gaseb, percent of landfill gas that is ethylbenzene (%)
gased, percent of landfill gas that is ethylene dichloride (%)
gasmc, percent of landfill gas that is methylene chloride (%)
gassoiltrt, volume of gas treated by soil (ft3/ton waste)
gassoiltrt2, volume of gas treated by soil (mol/ton waste)
gast, landfill gas produced during year t (ft3/ton waste)
gastetra, percent of landfill gas that is tetrachloroethene (%)
gastl, percent of landfill gas that is toluene (%)
gastri, percent of landfill gas that is trichloroethene (%)
gasun1, percent of gas not collected due to collection system inefficiency (%)
gasun2, gas produced prior to collection system installation (ft3/ton waste)
gasun3, gas not collected due to gas collection system inefficiency (ft3/ton waste)
gasun4, gas produced after discontinuation of gas collection system (ft3/ton waste)
gasun5, gas untreated to discontinuation of the gas collection system (mol gas/ton waste)
gasvc, percent of landfill gas that is vinyl chloride (%)
gasxy, percent of landfill gas that is xylene (%)
GCHDPE, amount of HDPE in gas collection system (lb/ton waste)

Appendix E: Alphabetic List of Parameters Used in Calculations
E-14
GCPVC, amount of PVC in gas collection system (lb/ton waste)
GDWF, wet weight fraction of a waste stream component
GH2O, moisture content of a waste stream component (%)
GLAB, gas yield per wet ton waste (ft3 gas/wet ton waste)
GMPVC, amount of PVC in gas monitoring system (lb/ton waste)
GP GOFF, the contribution of office paper to the total gas produced by an average ton of MSW (%)
GP, the contribution of a waste component to the landfill gas produced by an average ton (%)
Gtime, total landfill gas generated during the user-selected time horizon (ft3/ton waste)
GWW, wet weight (tons)
GWWF, wet weight fraction
H
Ha, height of waste above grade (ft)
Hb, height of waste below grade (ft)
Hbm, height of berm (ft)
HD1, one-way distance fuel is transported to the landfill (mi)
HD2, one-way distance off-site soil for daily cover is transported to the landfill (mi)
HD3, one-way distance HDPE is transported to the landfill (mi)
HD4, weighted distance needed to transport fuel and HDPE to the site (mi)
hd5, distance to haul clay and soil (mi)
hd6, distance to haul sand (mi)
hd7, distance to haul geotextile for cover (mi)
hd8, distance to haul HDPE for cover (mi)
hd9, distance to haul HDPE pipe (mi)
hd10, distance to haul fuel (mi)
hd11, distance to haul PVC (mi)
hd12, weighted haul distance in dump truck (mi)
hd13, weighted haul distance in heavy truck (mi)
hd14, haul distance to POTW (mi)
I

Appendix E: Alphabetic List of Parameters Used in Calculations
E-15
i, effective annual interest rate
ICE G_A_CO2_BM, total biomass CO2 emissions from an ICE (lb/ton waste)
J–K
k, first order decay rate constant (year-1)
L
L_CRT L_A_CO2, fossil CO2 emissions due to concrete consumption (lb/ton waste)
L_EE_PC L_A_CO2, the precombustion and combustion fossil CO2 emissions due to energy consumption (lb/ton waste)
L_EE_PC L_A_CO2_BM, biomass CO2 due to electric energy precombustion and combustion (lb/ton waste)
L_HVY L_A_CO2, fossil CO2 emissions due to diesel combustion in a heavy truck (lb/ton waste)
L_MTRL_TOTAL L_A_CO2, total fossil CO2 emissions due to transporting leachate to the POTW (lb/ton waste)
L_PCBM1 L_A_CO2, fossil CO2 emission due to diesel fuel precombustion (lb/ton waste)
L_PCBM2 L_A_CO2, fossil CO2 emissions due to diesel precombustion (lb/ton waste)
L_POTW_E L_A_CO2_BM, the total biomass CO2 emitted while removing BOD (lb/ton waste)
L_POTW_E L_SW_2, total sludge produced during leachate treatment (lb/ton waste)
L_POTW_ENG L_ENGR, the total energy required to remove BOD (Btu/ton waste)
L_PVC L_A_CO2, fossil CO2 emission due to PVC consumption (lb/ton waste)
L_TRT L_AH_BZ, benzene volatilized to atmosphere (lb/ton waste)
L_TRT L_W_BOD, BOD remaining after leachate treatment (lb/ton waste)
L_TRT L_W_COD, COD remaining in leachate after treatment (lb/ton waste)
L_TRT L_W_NH3, NH3 remaining after leachate treatment (lb/ton waste)
L_TRT L_W_PO4, PO4 remaining after leachate treatment (lb/ton waste)
L_TRT L_W_TSS, TSS remaining after leachate treatment (lb/ton waste)
L_TRT L_WM_Ba, barium remaining after leachate treatment (lb/ton waste)
L_UNCOL L_W_BOD, BOD in fugitive leachate (lb BOD/ton waste)
L_UNCOL L_W_SS, suspended solids in fugitive leachate (lb TSS/ton waste)
L_WT L_A_CO2, fossil CO2 emission due to diesel combustion in a water truck (lb/ton waste)
L_YTL A_L_W_As, total arsenic emissions allocated to leaves (lb/ton waste)
L_YTL A_L_W_BOD, total BOD emissions allocated to leaves (lb/ton waste)
L4, distance between leachate collection pipes (ft)

Appendix E: Alphabetic List of Parameters Used in Calculations
E-16
lag, time between placement and start of gas generation (year)
Lb, buffer zone distance (ft)
LCHT_TOTAL A_L_W_As, the total arsenic in landfill leachate (lb/ton waste)
LCHT_TOTAL A_L_W_BOD, the total BOD in landfill leachate (lb/ton waste)
LCHT_TOTAL L_W_SS, suspended solids emitted in treated and fugitive leachate (lb/ton waste)
LCHT_TRT L_W_SS, suspended solids emitted in treated leachate (lb/ton waste)
LCHT_UNCOL L_W_SS, suspended solids emitted in fugitive leachate (lb/ton waste)
lcht1, start of first leachate production period (years)
lcht2, end of first leachate production period (years)
lcht3, start of second leachate production period (years)
lcht4, end of second leachate production period (years)
lcht5, start of third leachate production period (years)
lcht6, end of third leachate production period (years)
lchtAg, concentration of silver in leachate (μg/l leachate)
lchtAs, concentration of arsenic in leachate (μg/l leachate)
lchtBa, concentration of barium in leachate (μg/l leachate)
lchtBz, concentration of benzene in leachate (lb/gal leachate)
lchtCd, concentration of cadmium in leachate (μg/l leachate)
lchtcol1, leachate collected during the time horizon (lb/ton waste)
lchtcol2, leachate collected after waste placement and before the start of collection and recirculation (lb/ton waste)
lchtcol3, leachate collected during recirculation (lb/ton waste)
lchtcol4, leachate collected after the end of recirculation and before the end of treatment (lb/ton waste)
lchtCr, concentration of chromium in leachate (μg/l leachate)
lchtec, kWh consumed per pound BOD removed (kWh/lb BOD)
lchtgen1, leachate generated during time horizon (lb/ton waste)
lchtgen2, leachate generated in the first collection period (lb/ton waste)
lchtgen3, leachate generated during recirculation (lb/ton waste)
lchtgen4, leachate generated after the end of recirculation and before the end of treatment (lb/ton waste)
lchtHg, concentration of mercury in leachate (μg/l leachate)
lchtN1, length of first leachate production period (years)
lchtN2, length of second leachate production period (years)

Appendix E: Alphabetic List of Parameters Used in Calculations
E-17
lchtN3, length of third leachate production period (years)
lchtNH3, concentration of NH3 in leachate (mg/l leachate)
lchtp, leachate collection efficiency (%)
lchtPb, concentration of lead in leachate (μg/l leachate)
lchtPO4, concentration of PO4 in leachate (mg/l leachate)
LCHTPOTW, total leachate sent to POTW (lb/ton waste)
lchtpotw1, leachate sent to POTW during collection period 1 (lb/ton waste)
lchtpotw2, leachate sent to POTW during collection period 2 (lb/ton waste)
lchtpotw3, leachate sent to POTW during collection period 3 (lb/ton waste)
lchtrelease, enter 0 to hold leachate produced after treatment in the landfill; enter 1 to release leachate produced after treatment to the environment.
lchtSe, concentration of selenium in leachate (μg/l leachate)
lchttime1, leachate collected during collection period 1 and in the chosen time horizon (lb/ton waste)
lchttime2, leachate collected during collection period 2 and in the chosen time horizon (lb/ton waste)
lchttime3, leachate collected during collection period 3 and in the chosen time horizon (lb/ton waste)
lchtTSS, concentration of TSS (lb TSS/gal leachate)
lchtuncol, leachate uncollected during chosen time horizon due to system efficiency (lb/ton waste)
Ldv, length of disposal volume (ft)
leachate generated before treatment ends, (lb/ton waste)
leachate generated during the time horizon, (lb/ton waste)
leachate generated during the treatment, (lb/ton waste)
LG_TOTAL G_A_CO2_BM, total biomass CO2 emitted during landfill gas production, collection, and treatment (lb/ton waste)
LGOFF A_G_A_CO2_BM, biomass CO2 allocated to office paper (lb CO2-B/ton waste)
LGOFF G_AH_BZ, benzene allocated to office paper (lb benzene/ton waste)
lgth1, distance between recirculation system and side slopes (ft)
lgth2, maximum length of trench (ft)
Lgth3, average length of horizontal trench for leachate recirculation (ft)
lgth3, maximum length of horizontal trench (ft)
lgth4, influence distance between trenches (ft)
lgth5, distance between bottom liner and first horizontal trench (ft)
lgth6, distance between top of landfill and horizontal trench (ft)
Appendix E: Alphabetic List of Parameters Used in Calculations
E-18
lgth7, length of perforated concrete column (ft)
lgth8, length of PVC pipe in each vertical injection well (ft)
LGTRACE G_WH_BZ, total benzene emitted while during landfill gas production, collection, and treatment (lb benzene/ton waste)
LHDPE, total HDPE in gas collection system (ft)
LL_EE_PC L_A_CO2_BM, biomass CO2 due to electric energy pre-combustion and combustion (lb./ton waste)
Llcp, distance between leachate collection pipes (ft)
Lo, total landfill gas yield potential (ft3/ton waste)
Lolab, ultimate gas yield based on laboratory data (ft3 gas/wet ton waste)
Lor, distance of required off-site roads to be upgraded (mi)
LoSWANA, ultimate gas yield predicted by SWANA (ft3/ton waste)
Lplc, length of PVC piping installed for leachate collection (ft)
LPVC2, total PVC in gas collection system (ft)
Ls, total site length (ft)
Lsd, distance to area for excess soil disposal (mi)
Lsr, distance of required roads for site entrance and for access to on-site facilities (ft)
Lw, distance between monitoring wells around perimeter of disposal volume (ft)
Lwd, depth of typical well (ft)
M
max1, weight of the maximum payload (contents) of the heavy-duty truck (lb)
max2, weight of the maximum payload (contents) of the dump truck (lb)
max3, weight of the maximum payload (contents) of the heavy truck (lb)
max4, weight of the maximum payload (contents) of the dump truck (lb)
max5, weight of the maximum payload (contents) of the truck (lb)
Mcrt, mass of concrete per ton of waste (lb/ton waste)
moleCH4, lb CH4 per mole (lb CH4/mole)
moleCO2, biomass CO2 per mole (lb CO2-B/mole)
MPVC2, mass of PVC in vertical injection wells per ton of waste (lb/ton waste)
MPVC1, mass of PVC in horizontal trenches per ton of waste (lb/ton waste)
mswacre, waste buried per landfill surface area (tons/acre)

Appendix E: Alphabetic List of Parameters Used in Calculations
E-19
MTRL_TOTAL A_L_W_As, the total arsenic produced due to material consumption (lb/ton waste)
MTRL_TOTAL A_L_W_BOD, the total BOD produced due to material consumption (lb/ton waste)
MTRL_TOTAL L_A_CO2, fossil CO2 emissions due to diesel precombustion and combustion (lb/ton waste)
Mwl, expected mass flow (ton/day)
Mwm, maximum daily tonnage handled by labor costs of c43 (ton/day)
N
n, moles of gas (mols)
n_ng_pc_e n_a_co2_bm, natural gas precombustion emission for biomass CO2 (lb/ft3 natural gas)
n_pc ng_r_e, energy due to natural gas precombustion (Btu/ft3)
ng_comb ng_r_e, energy obtained from combusting natural gas (Btu/ft3)
Nht, number of horizontal trenches
NMW, number of monitoring wells
Npc, number of years of perpetual care (years)
npc, post-closure period (years)
Nr, number of distinct regions of the landfill developed over the life of the facility
Ns, the number of scales required
Nvl, number of vertical lifts
Nwell, number of vertical injection wells
Ny, expected useful life of landfill (years)
O
O_BCKH O_A_CO2, fossil CO2 emissions from a backhoe (lb/ton waste)
O_BLLDZR O_A_CO2, fossil CO2 emissions from a bulldozer (lb/ton waste)
O_CMPCTR O_A_CO2, fossil CO2 emissions from a compactor (lb/ton waste)
O_DT O_A_CO2, fossil CO2 emitted while transporting off-site soil in a dump truck (lb/ton waste)
O_GRDR O_A_CO2, fossil CO2 emissions from a grader (lb/ton waste)
O_HDPE O_A_CO2, fossil CO2 emitted during production of HDPE (lb/ton waste)
O_HVY1 O_A_CO2, fossil CO2 emitted while transporting fuel to operate equipment at a site with offsite soil daily cover (lb/ton waste)
O_HVY2 O_A_CO2, fossil CO2 emitted while transporting fuel to operate equipment at a site with on-site soil as daily cover (lb/ton waste)

Appendix E: Alphabetic List of Parameters Used in Calculations
E-20
O_HVY3 O_A_CO2, fossil CO2 emitted while transporting fuel to operate equipment at a site with revenue generating cover (lb/ton waste)
O_HVY4 O_A_CO2, fossil CO2 emitted while transporting fuel to operate equipment at a site with HDPE as daily cover (lb/ton waste)
O_HVY5 O_A_CO2, fossil CO2 emitted while transporting fuel to operate equipment at sites with no daily cover (lb/ton waste)
O_MSC O_A_CO2, fossil CO2 emissions from miscellaneous equipment (lb/ton waste)
O_PC O_A_CO2, fossil CO2 precombustion emissions (lb/ton waste)
O_SCRPR O_A_CO2, fossil CO2 emissions for using a scraper on a site with daily cover (lb/ton waste)
O_SOIL O_A_CO2, fossil CO2 emissions for obtaining off-site soil (lb/ton waste)
O_TOTAL O_A_CO2, total CO2 emissions for operations phase (lb/ton waste)
O_WL O_A_CO2, fossil CO2 emissions from a wheel loader (lb/ton waste)
OFF_DU G_A_CO2_BM, total biomass CO2 offset when a boiler is used to treat landfill gas (lb CO2-B/ton waste)
OFF_DU1 G_A_CO2_BM, biomass CO2 that is offset when a boiler is used in the first collection period (lb CO2-B/ton waste)
OFF_DU1 G_ENGR, energy offset when using a boiler to treat landfill gas in the first treatment period (Btu/ton waste)
OFF_DU2 G_A_CO2_BM, biomass CO2 that is offset when a boiler is used in the second collection period (lb CO2-B/ton waste)
OFF_DU3 G_A_CO2_BM, biomass CO2 that is offset when a boiler is used in the third collection period (lb CO2-B/ton waste)
OFF_ICE G_A_CO2_BM, total biomass CO2 offset when an ICE is used to treat landfill gas (lb CO2-B/ton waste)
OFF_ICE1 G_A_CO2_BM, biomass CO2 that is offset when an ICE is used (lb CO2-B/ton waste)
OFF_ICE2 G_A_CO2_BM, biomass CO2 that is offset when an ICE is used in the first collection period (lb CO2-B/ton waste)
OFF_ICE3 G_A_CO2_BM, biomass CO2 that is offset when an ICE is used in the second collection period (lb CO2-B/ton waste)
OFF_TRBN G_A_CO2_BM, total biomass CO2 offset when a turbine is used to treat landfill gas (lb CO2-B/ton waste)
OFF_TRBN1 G_A_CO2_BM, biomass CO2 that is offset when a turbine is used the first collection period (lb CO2-B/ton waste)
OFF_TRBN1 G_ENGR, energy offset when using a turbine to treat landfill gas during the first treatment period (Btu/ton waste)
OFF_TRBN2 G_A_CO2_BM, biomass CO2 that is offset when a turbine is used the second collection period (lb CO2-B/ton waste)

Appendix E: Alphabetic List of Parameters Used in Calculations
E-21
OFF_TRBN3 G_A_CO2_BM, biomass CO2 that is offset when a turbine is used the third collection period (lb CO2-B/ton waste)
oxdbz, percent of benzene that is converted to CO2 after passing through soil (%)
oxdch, percent of chloroform that is converted to CO2 after passing through soil (%)
oxdCH4, percent of methane that is converted to CO2 after passing through soil (%)
oxdct, percent of carbon tetrachloride that is converted to CO2 after passing through soil (%)
oxdeb, percent of ethylbenzene that is converted to CO2 after passing through soil (%)
oxded, percent of ethylene dichloride that is converted to CO2 after passing through soil (%)
oxdmc, percent of methylene chloride that is converted to CO2 after passing through soil (%)
oxdtetra, percent of tetrachloroethene that is converted to CO2 after passing through soil (%)
oxdtl, percent of toluene that is converted to CO2 after passing through soil (%)
oxdtri, percent of trichloroethene that is converted to CO2 after passing through soil (%)
oxdvc, percent of vinyl chloride that is converted to CO2 after passing through soil (%)
oxdxy, percent of xylene that is converted to CO2 after passing through soil (%)
P
P, pressure (atm)
pclay, percent of dump truck load consisting of clay (%)
PCLSR_1 PCLSR_A_CO2, total yearly fossil CO2 emissions from post-closure activities (lb/ton waste)
PCLSR_100 PCLSR_A_CO2, total post-closure fossil CO2 emissions during the 100-year time horizon (lb/ton waste)
PCLSR_20 PCLSR_A_CO2, total post-closure fossil CO2 emissions during the 20-year time horizon (lb/ton waste)
PCLSR_500 PCLSR_A_CO2, total post-closure fossil CO2 emissions during the 500-year time horizon (lb/ton waste)
PCLSR_GTX PCLSR_A_CO2, yearly fossil CO2 emissions due to geotextile production (lb/ton waste)
PCLSR_HDPE PCLSR_A_CO2, yearly fossil CO2 emissions due to HDPE production (lb/ton waste)
PCLSR_LDT PCLSR_A_CO2, yearly fossil CO2 emissions from using a light-duty truck (lb/ton waste)
PCLSR_MWR PCLSR_A_CO2, yearly fossil CO2 emissions from using a lawn mower (lb/ton waste)
PCLSR_PC PCLSR_A_CO2, yearly fossil CO2 emission from gasoline precombustion activities (lb./ton waste)
PCLSR_PVC PCLSR_A_CO2, yearly fossil CO2 emissions from diesel combustion and precombustion (lb/ton waste)

Appendix E: Alphabetic List of Parameters Used in Calculations
E-22
PCLSR_SAND PCLSR_A_CO2, yearly fossil CO2 emissions due to obtaining sand (lb/ton waste)
PCLSR_SOIL PCLSR_A_CO2, yearly fossil CO2 emissions due to obtaining soil (lb/ton waste)
Pcvr2, percent of final cover to be replaced over the entire post-closure period (%)
Pcvr1, percent of total landfill volume occupied by cover (%)
Pdv, disposal volume perimeter (ft)
pfuel, percent of heavy truck load consisting of fuel (%)
pgtx, percent of heavy truck load consisting of geotextile (%)
PHDPE1, percent of daily cover that is HDPE (%)
pHDPE2, percent of heavy truck load consisting of HDPE cover (%)
pHDPE3, percent of heavy truck load consisting of HDPE pipe (%)
Pncvr, percentage of the site that receives no daily cover (%)
Poff, percent of site that uses off-site soil as daily cover (%)
Poffsite, percent of daily cover that is off-site soil (%)
Pon, percent of daily cover that is on-site soil (%)
Ponsite, percent of daily cover soil volume that can be obtained on site as calculated in the soil budget (%)
POTW_E L_A_CO2_BM, biomass CO2 emitted during leachate treatment (lb/ton waste)
POTW_ENG L_ENGR, total energy required by POTW (Btu/ton waste)
POTW_TOTAL A_L_W_As, the total arsenic produced due to electric energy combustion and precombustion (lb/ton waste)
POTW_TOTAL A_L_W_BOD, the total BOD produced due to electric energy combustion and precombustion (lb/ton waste)
POTW_TOTAL L_A_CO2_BM, total biomass CO2 produced during leachate treatment and during electric energy combustion and precombustion (lb/ton waste)
POTW_TOTAL L_ENGR, total energy consumed during leachate treatment and during electric energy combustion and precombustion (Btu/ton waste)
potw1, percent of leachate sent to POTW during collection period 1 (%)
potw2, percent of leachate sent to POTW during collection period 2 (%)
potw3, percent of leachate sent to POTW during collection period 3 (%)
ppt1, percent of rainfall that becomes leachate during the first period (%)
ppt2, percent of rainfall that becomes leachate during the second period (%)
ppt3, percent of rainfall that becomes leachate during the third period (%)
ppt4, percent of rainfall that becomes leachate during the fourth period (%)

Appendix E: Alphabetic List of Parameters Used in Calculations
E-23
pptyear, annual precipitation (in.)
pPVC, percent of dump truck load consisting of PVC (%)
Prevgen, percent of daily cover that is revenue-generating cover (%)
Ps, site perimeter (ft)
psand, percent of dump truck load consisting of sand (%)
Psoil, percent of daily cover that is soil (%)
Q–R
R, universal gas constant (L-atm)/(mol-K)
r_total, total revenue from landfill gas production due to first, second, and third treatment periods ($/ton waste)
r1, revenue from electric buyback ($/kWh)
r2, revenue from thermal energy ($/MBtu)
Rb, slope of the grade of the berm as rise over run
Rda, slope of the grade of the disposal volume above site grade as rise over run
Rdb, slope of the grade of the disposal volume below site grade as rise over run
reg_comb_btu_offset_per_kwh, Btu offset per electric energy use (Btu/electric energy)
rev(t), future value of revenue from landfill gas ($/ton waste)
rev_annual, total revenue from landfill gas annualized over the lifetime of the landfill ($/ton waste)
rev_annual1, total revenue from landfill gas, for the first treatment period, annualized over the lifetime of the landfill ($/ton waste)
rev_annual2, total revenue from landfill gas, for the second treatment period, annualized over the lifetime of the landfill ($/ton waste)
rev_annual3, total revenue from landfill gas, for the third treatment period, annualized over the lifetime of the landfill ($/ton waste)
rev_pv(t), present value of revenue from landfill gas ($/ton waste)
rev_total, sum of the yearly revenue from landfill gas production ($/ton waste)
Rlgo, rate of leachate generated (active cell)(gal/acre-day)
RLW, length-to-width ratio
S
s, first order rise phase constant (year-1)
sc1, specific consumption for a heavy duty truck (mpg)

Appendix E: Alphabetic List of Parameters Used in Calculations
E-24
sc2, specific consumption for a dump truck (mpg)
sc3, specific consumption for a heavy truck (mpg)
sc4, specific consumption for a dump truck (mpg)
sc5, specific consumption for a heavy truck (mpg)
scrpr, percentage of fuel used by the scraper (%)
scrprcvr, percentage of fuel used by the scraper (%)
scvr, volume of soil for cover liner (yd3)
scvr1, volume of soil for topsoil and vegetative support cover (yd3)
sldg_per_BOD, lb sludge generated per lb BOD removed (lb sludge/lb BOD)
sldgBOD, sludge generated from BOD removal (lb/ton waste)
sldgmtls, sludge generated from metals removal (lb/ton waste)
sldgPO4, sludge generated from phosphate removal (lb/ton waste)
sldgtotal, total sludge produced (lb/ton waste)
sldgTSS, sludge generated from TSS removal (lb/ton waste)
SUMWW, sum of wet weights (tons)
T
T, temperature (K)
t, year of gas treatment (year)
T_F_PC_A_CO2 d_pc_em, diesel fuel precombustion emission factor (lb CO2/ gal fuel)
t0, time to implementation of first gas collection system (years)
t1, time to implementation of second gas collection system (years)
t2, time to implementation of third gas collection system (years)
t3, time to discontinuation of third gas collection system (years)
tclay, thickness of clay layer (ft)
tgtx, thickness of geotextile (mils)
THDPE, thickness of the HDPE used for daily cover (15 mils, 15 mils, 0 mils)
tHDPE2, thickness of HDPE (mils)
time, selected time horizon (20, 100 or 500 years)
time1, start of leachate collection period 1 (years)
time2, end of leachate collection period 2 (years)

Appendix E: Alphabetic List of Parameters Used in Calculations
E-25
time3, end of leachate collection period 3 (years)
TOTALCOST1, total cost of burial of municipal solid waste per unit volume ($/yd3)
TOTALCOST2, total cost of burial of municipal solid waste per ton($/ton waste)
TOTALCOST3, cost per ton of MSW minus the revenue generated from landfill gas ($/ton waste)
TRBN G_A_CO2_BM, total biomass CO2 emissions from a turbine (lb/ton waste)
tsand1, thickness of the first sand layer in final cover (ft)
tsand2, thickness of second sand layer in final cover (ft)
tsoil, depth of top soil and vegetation support soil (ft)
U–V
V, volume of gas (ft3)
Va, available volume for the disposal site (yd3)
Vbm, volume of the berm (yd3)
Vbm1, volume of soil available from excavation after main liner, top soil and vegetative support cover (yd3)
Vc, volume of concrete in vertical injection wells (yd3)
Vc1, volume of soil required for daily cover (yd3)
VCM1, volume of off-site soil used for daily cover (yd3)
VCM2, volume of on-site soil used for daily cover (yd3)
VCM4, volume of revenue-generating cover (yd3)
Vcrt1, volume of concrete base and solid concrete section (ft3)
Vcrt2, volume of perforated concrete per unit length (ft3/ft)
Vcrt3, volume of concrete per vertical injection well (ft3/well)
Ve, excavated volume (yd3)
Vfc, volume of soil required for final cover (yd3)
Vl, volume of soil for liner construction (yd3/cell)
Vmsw, average landfill airspace volume per landfill surface area (yd3/acre)
VNT G_A_CO2_BM, total biomass CO2 emissions from a vent (lb/ton waste)
VPVC1, volume of PVC per unit length (ft3/ft)
VPVC3, volume of single PVC pipe in a single well (ft3)
Vs, volume of soil required to cover leachate collection system (yd3)
Vsa, volume of soil additive required (yd3)

Appendix E: Alphabetic List of Parameters Used in Calculations
E-26
Vsb, volume of soil excavated usable for berm and final cover (yd3)
Vsbp, volume of soil required to be purchased for berm construction (yd3)
Vsbx, volume of soil excavated usable for berm construction but excess (yd3)
Vsc, volume of soil excavated usable for daily cover (yd3)
Vscp, volume of off-site soil required to be purchased for daily cover (yd3)
Vscx, volume of soil excavated usable for daily cover but excess (yd3)
Vsfc, volume of soil excavated usable for final cover (yd3)
Vsfcp, volume of soil purchased for final cover (yd3)
Vsfcx, volume of soil excess after final cover (yd3)
Vsh, volume of soil to be hauled off site (yd3)
Vsl, volume of soil excavated usable for liner construction (yd3)
Vslp, volume of soil required to be purchased for liner construction (yd3)
Vslx, volume of soil excavated usable for liner construction but excess (yd3)
Vsnd, volume of sand in the first layer (yd3)
Vsnd2, volume of sand in the second layer (yd3)
Vstl, volume of soil excavated usable for cover liner construction (yd3)
Vstlp, volume of soil required to be purchased for cover construction (yd3)
Vstlx, volume of soil excavated usable for cover liner construction but excess (yd3)
Vtsa, volume of soil additive to decrease permeability of liner and final cover (yd3)
Vw, required landfill capacity for waste (yd3)
W
Wbl, width of the bottom of the berm (ft)
Wbu, width of the top of the berm (ft)
Wdv, width of disposal volume (ft)
wlcvr, percentage of the fuel used by a wheel loader at a site with no daily cover (0.5%, 0.5%, 0.5%)
Ws, total site width (ft)
X–Z
YTL P_As, the percent contribution of leaves to arsenic in landfill leachate (%)
Appendix E: Alphabetic List of Parameters Used in Calculations
E-27
z1, logical input, = +1 if septic system is used instead of public sewer, 0 otherwise
z2, logical input, = +1 if on-site well water is used instead of public water, 0 otherwise
z3, logical input, = +1 if gas is used on site, 0 otherwise
z4, logical input, = +1 if a liner is used, 0 otherwise
z6, logical input, = +1 if a double composite liner is used, 0 otherwise (single composite)
z9, logical input; = +1 if sand is used for leachate collection piping channels; 0 otherwise (for gravel) (+1, +1, +1)
z12, logical input, = +1 if the turbine used for primary landfill gas treatment, 0 otherwise
z12a, enter 1 to use the ultimate gas yield predicted by SWANA or enter 0 to use the laboratory ultimate gas yield
z13, logical input, = +1 if the turbine used for secondary landfill gas treatment, 0 otherwise
z14, logical input, = +1 if the turbine used for the third landfill gas treatment, 0 otherwise
z15, logical input, = +1 if the internal combustion engine used for the primary landfill gas treatment, 0 otherwise
z16, logical input, = +1 if the internal combustion engine used for the secondary landfill gas treatment, 0 otherwise
z17, logical input, = +1 if the internal combustion engine used for the third landfill gas treatment, 0 other wise