draft: for discussion purposes only information
TRANSCRIPT

Draft: Do not circulate this version Page i
DRAFT: For Discussion Purposes Only
Information, Technology and Information Worker Productivity:
Task Level Evidence
Sinan Aral, MIT Sloan School Erik Brynjolfsson, MIT Sloan School and Harvard Business School
Marshall Van Alstyne, MIT Sloan School and Boston University
May 6, 2005
Abstract: Past research has typically looked at fairly aggregate data on the relationship between IT and business value. In an effort to reveal the fine-grained relationships between IT use, information flows, and individual information-worker productivity, we study task level practices of information workers at a midsize executive recruiting firm. We analyze (1) detailed accounting data on revenues, completion rates, team participation and compensation for 1300+ projects over 5 years, (2) data on a matched set of individual workers self-reported information technology skills, use and information sharing, and (3) direct observation of over 125,000 e-mail messages over a period of 10 months by these same workers. These data make it possible to develop and econometrically test a multistage model of production and interaction activities at the firm, and to analyze the correlations among key technologies, work practices, and output. We find that (a) information technology use is positively correlated with increased revenues and project completion; (b) asynchronous information seeking such as email and DB access promote multitasking while synchronous information seeking such as phone and face-to-face contact show a negative correlation and (c) the structure and size of a worker’s communication network, including such social network metrics as betweeness and constraint are highly correlated with performance. Overall, these data show a statistically significant and positive relationship among technology use, social network characteristics, completed projects and revenues for project-based information workers. The strong results are likely due to the fine grained detail of daily communications activity and task level revenues and are consistent with simple models of queuing and multitasking. The methods in this paper can be replicated in other settings, suggesting a new frontier for IT value research. Keywords: Productivity, Information Worker, Task-Level Evidence, Social Networks, Multitasking, Production Function, Econometrics. Acknowledgements: We are grateful to the National Science Foundations (grants ISS-9876233 and IIS-0085725), Intel Corporation, the Marvin Bower Fellowship, and the MIT Center for eBusiness for generous funding for this research. We thank Abraham Evans-El, Jia Fazio, Saba Gul, Davy Kim and Jennifer Kwon for their remarkable and tireless research assistance.

Draft: Do not circulate this version Page 1
“In the physical sciences, when errors of measurement and other noise are found to be of the same order of magnitude as the phenomena under study, the response is not to try to squeeze more information out of the data by statistical means; it is instead to find techniques for observing the phenomena at a higher level of resolution. The corresponding strategy for [social science] is obvious: to secure new kinds of data at the micro level.” -- Herbert Simon
1. Introduction
We now see the computer age everywhere, including in the national productivity
statistics. Over the last decade, studies of the relationship between information technology (IT)
and economic productivity have examined empirical evidence at the country (e.g. Dewan &
Kraemer 2000), industry (e.g. Jorgenson and Stiroh, 2000), and firm (e.g. Brynjolfsson & Hitt
1996) levels. However, a number of important questions remain unanswered. The mechanisms
by which information technology (IT) affects productivity are not well understood. In particular,
the output and production function for information workers such as managers, consultants,
researchers, marketers, lawyers and accountants remain poorly modeled and measured.
Accordingly, the new frontier for IT productivity research requires opening the black box of the
traditional firm to understand how IT affects information work.
Information workers now account for as much as 70% of the U.S. labor force and
contribute over 60% of the total valued added in the U.S. economy (deleted per rules). Ironically,
as more and more of the workforce focuses on processing information, researchers have less and
less information about how they create value. Unlike bushels of wheat, tons of steel or even
desktop computers, the real output of most information workers is difficult to measure. Counting
meetings attended or memos filed is not closely linked to the value these activities may, or may
not, create. Yet if IT is to have a significant effect on the economy, it almost surely must be via
its use by information workers and the tasks they perform. Does the use of IT lead professionals
to complete their tasks more quickly? Does it allow a given worker to do more tasks in a given
time? Can information work be explicitly linked to revenues? How do skill levels affect these
relationships? If an important role of IT is its use in obtaining and sharing information, how are
social networks and communications flows affected by IT’s use?
In seeking answers to these questions, we concluded that existing data sets were
inadequate. Even firm or establishment level data are at too high a level of aggregation for our
purposes. Instead, this research is inspired by studies such as Ichniowski, Shaw and Prennushi’s
(1997) landmark study of steel finishing lines. By focusing on a single industry, they were able

Page 2
to specify a very precise production function and measure the effects of particular work practices
and technologies. The corresponding strategy for comprehending information work is clear: to
secure task-level data for a specific group of information workers.
Fortunately, while much information work focuses on producing intermediate output that
only indirectly affects a firm’s revenues, some information workers are very project-oriented. In
this study we focus on executive recruiters, or head hunters, whose primary work involves filling
specific job openings. Because projects completed by each recruiter, and the corresponding
revenue impact, are explicitly measured in the firm’s accounting statements, the problem of
output observability can be largely addressed in this setting. These data include complete project
level and individual level accounting records of revenues generated per person per project, the
number of projects completed, project duration, the number of simultaneous projects, and project
and individual level characteristics. Furthermore, we obtained the express cooperation of the
recruiters themselves and their employers to allow us to monitor their email usage and conduct
detailed surveys of their activities, skills, technology use and behaviors. Our IT variables focus
on the use of the technology, not merely its presence, and include direct, message-level
observation of communications volume, the size and shape of email contact networks, professed
ability to use database technology, and relative time spent on various tasks. When combined with
interviews and visits, these data enabled us to specify and estimate several equations relating
technology, skill, worker characteristics, task completion and revenue generation. The narrow
focus on one industry allowed us to precisely define the production process and our concentrated
data collection from one firm eliminates many sources of heterogeneity that confound
productivity estimation at more aggregate levels of analysis.
Although our analysis is preliminary, our findings suggest that using IT to manage human
contacts and data has a statistically significant correlation with individual productivity as
measured by increased revenues and completed projects.
Using new and more detailed data provides a better understanding of internal work
practices in a group of firms that rely heavily on information work and information workers.
Correlations among key variables illustrate ways that IT can affect intermediate and final stage
output. This approach, however, also has its weaknesses. In particular, since our data cover such
a small fraction of the economy, findings may not be generalizable. The results should be

Page 3
interpreted as descriptive of the firms, workers, technologies and practices in our sample, but are
not necessarily valid outside our sample.
2. Background and Data
2.1 Research Setting and the Role of IT
We studied one medium sized executive recruiting firm over five years. The firm is
headquartered in a large mid-western city and has thirteen regional offices throughout the United
States. The employees occupy three basic positions – partner, consultant and researcher, and
conduct their ‘searches’ in teams. While the difficulty or complexity of projects differ based on
project characteristics, the primary service offered to clients is fairly uniform: to find and deliver
suitable candidates for upper level executive positions. Our interviews indicate that the process
for securing and executing a contract is relatively standard and can be described as follows: A
partner secures a contract with a client and works to assemble a project team (team size µ = 2,
min = 1, max = 5). In assembling the team, the partner must determine employees’ availability
by assessing the current project portfolios of potential team members and request approval of
team assignments from the regional directing partner, who also examines employees’ availability
and approves the assignment of each team member to the project. Once the team is assembled,
the search follows a staged process. First, the team establishes a universe of potential candidates
based on (i) identifying candidates in similar positions at other firms and (ii) their internal
database of resumes and other leads. These candidates are vetted on the basis of perceived
quality, their match with the job description and other factors. After conducting this initial due
diligence, the team chooses a subset of candidates for internal interviews. After internal
interviews and more detailed evaluation, a final pool of approximately six potential candidates
are presented to the client along with detailed background information, notes and the results of
the team’s due diligence presented in a formal report to the client. The team then facilitates the
client’s interviews with each candidate and the client, if satisfied with the pool, makes offers to
one or more candidates.
Based on several detailed interviews with the CIO and other employees, we determined
that the firm uses IT in essentially two ways: as a communication vehicle (e.g. phone, voicemail
and email) and as a central repository of information and knowledge about ongoing projects,
potential candidates and internal task coordination embodied in the Executive Search System

Page 4
(ESS), a proprietary database and knowledge management system. Both of these functions
contribute to the execution of work tasks and facilitate the information exchanges teams require
to systematically assemble, analyze, codify and share knowledge about candidates and clients.
The Executive Search System (ESS) is a proprietary knowledge repository built into an
off the shelf relational database. It contains information on current and past projects, the firm’s
own employees (e.g. contact information, areas of expertise, work history and current
assignments), clients and potential candidates (e.g. resumes, prior due diligence, and notes or
work ups on their previous jobs).1 Not only does the ESS serve as the basis of candidate
searches, providing a repository of firm knowledge about potential candidates and previous due
diligence, but it also helps employees coordinate and manage dependencies across projects. For
example, when searching for potential candidates, employees must honor contractual obligations
that prevent poaching the employees of past clients for a specified time. The ESS maintains an
up to date record of the potential candidates that are ‘frozen’ due to prior client obligations and
employees use this information in selecting candidates at various stages of the search process.
When assembling a project team, the ESS is used to determine employees’ current workloads
and their availability for assignment to a new project. Employees rely on the information in the
ESS to help them manage project dependencies and make decisions on team composition and
candidate pools during the search process.
2.2 Data
Placement contracts involve well-defined criteria for locating and vetting high quality
executives on behalf of a client. Information flows and access also affect project success rates.
Data for this study include three data sets from the firm and one data set from outside the firm.
The first is exact internal accounting records of: (i) revenues generated by individual recruiters,
(ii) contract start and stop dates, (iii) projects handled simultaneously by each recruiter, (iv) labor
costs and compensation, (v) project team composition, (vi) job level of recruiters, and (vii) job
level of placed candidates. Accounting data cover the period 2000-2004. These provide
excellent output measures that can also be normalized for quality.
1 “Client” refers to a firm that needs to hire one or more executives; “candidate” refers to a potential hire; and “recruiter” refers to someone expert in locating, vetting, and placing candidates.

Page 5
The second set of data covers 10 months of complete email history captured from the
corporate mail server. We wrote and developed capture software specific to this project then took
multiple steps to maximize data integrity and levels of participation. New code was tested at
Microsoft Research Labs for server load, accuracy and completeness of message capture, and
security exposure. To account for differences in user deletion patterns, we set administrative
controls to prevent data expunging for 24 hours. The project went through nine months of
human subjects review prior to launch and content was masked using cryptographic techniques
to preserve individual privacy. Spam messages were excluded by focusing on internal
communications or on external contacts who had received at least one message from anyone
inside the firm. Based on an opt-out policy, participants received $100 in exchange for
permitting use of their data, resulting in 87% coverage of recruiters eligible to participate and
more than 125,000 email messages captured.2
The third data set is collected survey responses on information seeking behaviors,
perceptions, experience, education, human factors, and time allocation. Survey questions were
generated from a review of relevant literature (Bulkley & Van Alstyne, 2004) and interviews
with multiple recruiters. Experts in survey methods at the Inter-University Consortium for
Political and Social Science Research vetted the survey instrument, which was then pretested for
comprehension and ease-of-use. Individual participants received $25 for completed surveys.
Participation exceeded 85%. Depending on the model tested, preliminary analyses are reported
for 40-71 individuals based on complete observations for participation consent, survey response,
and accounting records for more than 1300 projects.
The fourth data set involves independent controls for placement cities to normalize for
project difficulty and will be described below. Together, these data provide a desktop level view
of how different professional workers use IT in conjunction with measures of individual
performance. The sum of individually secured contracts also provides a complete picture of firm-
level revenues.
Following our qualitative assessment of the role of IT in the firm’s production process,
we concentrated our measurement of IT around (a) the intensity and skill with which employees
used the ESS system, and (b) the frequency of use of different modes of communication in
2 A joint F test comparing performance means of those who opted out with those who remained did not show statistically significant differences. F (Sig): Rev02 2.295 (.136), Comp02 .837 (.365), Multi .386 (.538).

Page 6
maintaining contacts and seeking information. In measuring ESS skill, we asked respondents to
evaluate their personal effectiveness using the ESS system and their ability to find, add and
modify the records it contains. As these two factors were highly correlated (Spearman = .88***,
α = .94), we combined them into a single measure. To measure ESS use intensity, we asked
respondents to estimate the proportion of time they spent gathering information from the ESS in
order to perform their work. Finally, we asked respondents to estimate the number of people they
communicated with in a typical day face to face, over the phone and over email.3
Defining “Information Flows”: The Email Network
Email traffic was measured over two separate continuous 5 week pEmail traffic was measured over two separate continuous 5 week periods:eriods:October 2002 October 2002 –– February 2003 & October 2003 February 2003 & October 2003 –– February 2004February 2004
PartnerConsultantResearcher
Near whole network data coverageOnly a few employees opted out
Figure 1: The complete email network of the firm. [xx EB: I prefer the sparser network from the ppt pack]
To capture the role of the flow of information we constructed variables that measure both
the relative levels and structure of the information flows observed in the email traffic of the firm.
The social network analysis literature has established a strong body of work useful for measuring
the flow of information (e.g. Granovetter 1973, Burt 1992). But, while this literature links
networked relationships and topology to performance, studies with actual output data in the
social networks field are rare. We combine social network analysis and productivity research to
measure information flows in our setting. Measures of the level of email traffic count the total
number of emails sent and received, the individual’s network size, and their in-degree and out-
degree. Measures of communication structure include the ‘betweeness centrality’ of an
3 The survey responses indicating the number of email contacts were very similar to actual email logs. Respondents reported a mean number of email contacts equal to 34.9, while the actual data revealed a mean of 33.5. Although we could not reject the hypothesis that these were not equal, their similarity gave us confidence in our survey answers.

Page 7
individual’s email network (Freeman 1979), which measures the probability that the individual
will fall on the shortest path between any two other individuals linked by email communication
and the ‘constraint’ of the network (Burt 1992), which measures the degree to which an
individual’s contacts are connected to each other (a proxy for the redundancy of contacts).
3. Models and Hypotheses
Our data afford the opportunity to construct a detailed model of the production process of
executive recruiters and to test the relationship between IT and information flows on
intermediate process metrics and final output measures. We conduct both individual and project
level analyses that test the broader relationship between IT, information flows and output, and
the specific mechanisms through which IT and information may impact the production process
of information workers.
3.1 A Production Model of Revenue and Project Output for Executive Recruiting
A decade ago, moving from aggregate data to more fine grained data at the firm level
helped resolve the ‘IT productivity paradox’ (Brynjolfsson & Hitt 1996). Explorations at the firm
level, however, are constrained by the coarse granularity of the data and still tend to
conceptualize the relationship between IT and productivity in terms of ‘black box’ production
functions. Estimations of firm level production functions help explain whether IT increases
productivity, but cannot address how IT increases productivity. We believe that to extend the
frontier of IT-productivity research, we must open the black box and examine measurable
individual and project-level evidence on IT and productivity.
RevenueCompletedProjects
Multitasking
ProjectDuration
IT
IT variables Final Output
Production Function321 βββα ITLKY =
Figure 2: A “Black Box” production function relationship between IT and output
As a first step in the model development, we took a more traditional approach and
examined the relationship between IT and revenues directly. We also tested a popular conception
of how IT may improve productivity: by increasing the pace of work. All else being equal, faster

Page 8
completion of projects should lead to more revenues and there has been much discussion of how
IT speeds work activities into the “fast lane” and drives business at “internet speed.” Indeed, in
our exploratory analysis, we did find a positive correlation between IT and revenue. However, to
our surprise, we also found that our IT variables were actually correlated with longer project
duration on average.4 This seeming paradox indicated that our simple model of production at
recruiting firms was not accurate. All else was not equal. While IT seemed to be helping
individual workers bring more revenue to the firm, it was not simply speeding up their work.
After further interviews and analysis we revised our hypotheses and developed a more complete
production model. Specifically, we found that employees often vary the number of projects they
work on at a time such that workers’ revenues and project completion rates are a function not
only of how fast they work, but also of how much multitasking they do. Furthermore, not all
projects are equal. Some are more difficult than others, and take somewhat more effort.
Accordingly, we refined a more comprehensive model and collected new data to control for
project difficulty with an array of project variables.
In our production model, employees take on projects (contracts to locate candidates for
specific clients), and the number and duration of these projects determine the total dollar
“bookings” (contracts landed) and “billings” (contracts executed). These represent firm revenues
and equal one third of a placed candidate’s final salary. If we consider white collar workers as
managing queued tasks, each with distinct start and stop points, we can measure the relationship
between IT, information flows and intermediate measures of output. In particular, data on
project multitasking and start and stop times over the sample period index the rate at which
projects are completed. These relationships are depicted in Figure 3.
Figure 3: Our model of the production function represents a set of queued job tasks. The influence of IT and Information Flows can then be examined at the task level.
4 Higher ESS skill and more internal email contacts were correlated with higher revenue for individual workers (p > .10 and p> .001 respectively) yet both these metrics were weakly correlated with longer project duration (p < .10).

Page 9
An aggregate model of production activity can be specified as in equation (1). This
specification resembles that of Ichniowski, Shaw & Prennushi (1997), and increment to R2, PE
and Box-Cox tests indicate this additive form is preferred to a multiplicative Cobb-Douglas
specification.
(1) iiiiiQ εα ++++= δYγXβH
The determinants of productivity (Qi) in eq. (1) include dummy variables (Hi) for the job level of
individual workers, human capital (Xi) reflected in recruiters’ age, gender, educational
attainment and years of experience, IT and information flow variables (Yi), constant (α) and error
terms. In different models, Qi represents revenues, completed projects and the number of
simultaneous projects depending on the hypothesis. In contrast to earlier work, capital is constant
across all observations (i.e. recruiters) and is thus included in the constant term. Instead, the IT
variables of interest pertain to skill and use of the technology, not its mere presence. Dummy
variables that were found to be statistically significant in any of the regressions were kept and
used in all regressions while the others were discarded to preserve degrees of freedom.
3.2 A Model of Project Level Multitasking
We developed measures of multitasking based on the multitasking profiles of each
individual employee over every day of the five year time span of the study. A multitasking
profile characterizes the other projects an employee is engaged in while working on a given focal
project. This profile not only accounts for the number of simultaneous contracts assigned to an
employee during a given day, but also tracks an employee’s relative share of project effort, the
job types of other projects they are working on (e.g. the job classes of the projects and the cities
in which they are based), and the dollar value of each project to the firm.
We were privileged to have access to specific data about the project profile of each
individual employee on each day of the five year study period and objective proxies for the share
of effort devoted to bookings and billings revenue for each employee and each project portfolio.
With these data we constructed a measure of multitasking that tracks the average number of
other projects a project team is working on during the focal project. Using equation (1) as our
estimating equation, we measured the relationship between IT, information flows and
multitasking to determine whether heavy IT users or those more skilled at using IT were
multitasking more or shortening their project duration. We also examined whether the level and

Page 10
structure of email traffic predicted the number of simultaneous tasks a project team conducted
during a given focal project. We also used this variable to examine the relationship between
greater multitasking and project duration in our third and final model specification. Figure 4
displays a multitasking profile for one employee during the period 9/05/2002 to 11/26/2002.
3.3 A Model of Project Duration
To test whether IT, information flows and the level of multitasking are related to the
speed with which teams execute projects, we conceived a parsimonious model of project
completion rate. As the dataset contains right censored data (projects that did not complete
during the window of observation), ordinary least squares regression analysis is problematic
(Tuma and Hannan 1984), but the problem of right censoring can be overcome by using a hazard
rate model of the likelihood of a project completing on a given day, conditional on it not having
been completed before that day. Hazard rate models are frequently used by epidemiologists and
medical researchers to estimate the impacts of medical treatments or diseases on patients’
survival rates. Here, we employ the same concept to estimate the relationship between IT use and
information flows on the completion rate of projects. We employ a Cox proportional hazards
model specification formalized in equation (2):
(2) Xb etrtR β)()( =

Page 11
where R(t) represents the project completion rate, t is project time in the risk set, and r(t)b the
baseline completion rate. The effects of independent variables are specified in the exponential
power, β is a vector of estimated coefficients and X is a vector of independent variables. The
coefficients in this model have a straightforward interpretation:β represents the percent increase
or decrease in the project completion rate associated with a one unit increase in the independent
variable. Coefficients greater than 1 represent an increase in the project completion rate equal to
β -1, and coefficients less than 1 represent a decrease in the project completion rate equal to 1-
β . Specification tests reveal no significant duration dependence in any of our explanatory
variables and the proportional hazards assumption is shown to be valid using both statistical and
graphical tests.5
4. Alternate Hypotheses and Control Variables
Based on our interviews, we posit four broad factors that could influence our dependent
variables besides the independent variables of interest:
Characteristics of Individual Recruiters. We included controls for traditional human
capital variables (e.g. age, level of education, industry experience and managerial level) to
control for differences related to worker education, skill and experience.
Team Size. Adding more labor to a project may speed up work or slow it down depending
on tradeoffs between the added complexity of a larger team and the output contribution of
additional labor. We controlled for this effect by including a variable for the size of each team.
Job Type. Certain positions may be easier or harder to fill. For instance, firms may be less
willing to tolerate long vacancies at the CEO position while allowing a longer search period for
positions lower in the organizational hierarchy. More senior executives also have more
experience with recruiters and with job mobility. To control for the effect of Job Type, we
include a dummy variable for the eight job classes the firm recognizes in its own records: CEO,
5 Two alternative measures of project completion time appear in the literature. First, some measure completion time as the degree to which projects are finished on schedule (Ancona and Caldwell 1992). The reason is to attempt to control for inherent differences in projects’ difficulty and scope. In our setting, project completion dates are not formally scheduled. Fortunately, our data allow direct measures of project difficulty via a set of control variables. Second, completion time has also been measured as the deviation from the mean completion time of a group, as an alternative proxy for project difficulty (Eisenhardt and Tabrizi 1995). Given our ability to use control variables for project difficulty, we chose to measure project completion time directly as the number of days between the start and end of a contract. These are cleanly defined as the dates that a client signs a contract (start) and that a candidate accepts a job (end).

Page 12
COO, CIO, Medical Executive, Human Resources Executive, Business Development Executive
and a category called ‘Other.’6 We also include control variables on Task Characteristics for
similar reasons. We measure these by survey responses about the routiness of employees’ tasks
and the interdependence of their tasks with other people and teams. These variables help control
for differences between projects’ interdependence and complexity.
City Characteristics. The characteristics of the city in which a position is to be filled can
influence contract completion speed. Crime rates, weather conditions, the cost of living and
other city characteristics may increase or decrease the attractiveness of a position in a given city
from the perspective of the candidate pool. In order to control for variance explained by these
factors we collected a large independent data set on city characteristics for all the cities in our
sample from the web site Sperling’s Best Places.7 Results of a factor analysis revealed four
underlying factors that showed significant results in our models: cost of living, crime rates
(violent crime and property crime per capita), weather conditions (number of sunny days per
annum) and commute time. We therefore included these controls in project level analyses.8
5. Results
5.1 Drivers of Production
Just as Ichniowski, Shaw and Prennushi (1997) found that line uptime was the key driver
of production in steel finishing plants, we determined through interviews and statistical analysis
that in our setting, the key driver of production is the number of completed projects per unit time.
As recruiting teams complete projects, they generate revenue for the firm. Our model of the
production process therefore hypothesizes that the first intermediate variable in the ‘black box’ is
completed projects: Completed Projects Revenues.
We tested this hypothesis by examining the relationship between completed projects and
revenue generation per person per day over the five year period. The results in Model 1, Table 1
6 To check whether the “other” category contained clusters of similar projects, we also ran specifications controlling for sub-categories of ‘Other’ jobs clustered by their project descriptions. These specifications did not return different results from our final models. We therefore retained the firm’s original classification. 7 http://www.bestplaces.net/ 8 We collected city level data on tax rates for sales, income and property, the aggregate cost of living, home ownership costs, rate of home appreciation, air quality, water quality, number of superfund sites near the city, physicians per capita, health care costs per capita, violent and property crime per capita, public education expenditures per capita, average student to teacher ratio, an index of ultraviolet radiation levels, risk indices for earthquakes, tornadoes and hurricanes, the average number of sunny, cloudy, and rainy days per year, average number of days below freezing per year and average commute time to work.

Page 13
demonstrate strong support for our basic model. The number of completed projects per day is a
strong driver of individual information worker revenue generation. The coefficient indicates that
the individual worker’s share of the revenue generated from a day’s work on an (eventually)
completed team project is worth on average $2,048.67 dollars per day for the firm.
We then tested the second fundamental hypothesis of our model, that both revenues and
completed projects are driven by the number of projects an individual works on per unit time and
the length of time it takes that individual to finish projects on average. We examined the
relationship between multitasking, average duration, revenues and completed projects in Models
2 and 3 in Table 1. The results demonstrate that more simultaneous projects and faster
completion times (shorter duration) are associated with greater project completion and revenue
generation per person per day.9
5.2. The Relationship between IT, Information Flows and Multitasking
9 As the variables for multitasking and duration are normalized with mean = 0 and s.d. = 1, the coefficients can be interpreted as follows: a one standard deviation increase in multitasking is associated with a .64 standard deviation increase in completed projects and a .92 standard deviation increase in revenues. Duration can be interpreted analogously.

Page 14
The purpose of our work is to understand the role of information and information
technology in the information worker production process. So, in order to test whether IT use and
skill, and properties of the flow of information in workers’ email traffic had any relationship to
the intermediate output variables shown to drive production, we first tested the relationship
between our IT and information flow variables on the amount of multitasking project teams
engaged in during their projects. Our project level analysis included controls for team
characteristics and the job class of each individual project, but did not include controls for city
characteristics, which are potentially salient for project duration but should not influence how
many projects teams work on. The results, reported in Table 2, Models 1-5, reveal some
interesting relationships.10
The coefficients in Models 1-3 demonstrate that teams whose members were heavy
multitaskers communicated with more people over email and significantly less people through
face to face interaction or over the phone. As the variables are normalized, they can be
interpreted as follows: a one standard deviation increase in the number of email contacts is
associated on average with a .637 standard deviation increase in the number of simultaneous
10 The models include a dummy variable for whether the project was right censored or did not finish during the observation window.

Page 15
projects the team is working on during the focal project. We also see, from the coefficients in
Models 4 and 5, that those teams more skilled at using the ESS and who use the system more to
gather information work on more projects simultaneously.
We also tested the analogous relationships between properties of the flow of information
in workers’ email traffic and their amount of multitasking. The results for both the levels and
structure of information flows in teams’ email traffic are reported in Table 3, Models 1-7.11
The four different measures of the levels of communication flowing into and out of
worker’s email boxes all demonstrate strongly that heavy multitaskers communicate more over
email. These results strengthen and extend the result from the survey measure of email contacts
reported in Table 2. When considering the structural properties of worker’s email traffic, more
multitasking is associated with greater betweeness centrality of workers in the firm’s network of
communication. Betweeness centrality is a proxy for the probability of being privy to a given
11 The models include a dummy variable for whether the project was right censored or did not finish during the observation window.

Page 16
piece of information flowing through the communication network of the firm. Heavy
multitaskers are in the ‘thick’ of the flow of information and are likely to be ‘in between’ a larger
number of pairs of other employees in terms of their communication structure. The results also
demonstrate that employees with ‘redundant contacts’ multitask less. The coefficient on the
constraint variable shows that those who are entangled in closed networks (networks whose
members are all closely tied to each other) work on less projects simultaneously. These workers
need not communicate with diverse contacts in diverse parts of the organization because their
work is self contained in a small social circle of recurring teammates. It is not surprising that
employees working on more projects at once need to be aware of more lines of communication
and information and thus appear in these structural positions. However, it should be noted that
we cannot make causal claims about the results reported in this table. It could be that heavy
multitaskers seek more information and position themselves in the thick of information flows or
that highly central employees are more likely to be chosen to conduct more tasks or chose to
conduct more tasks on their own. Nevertheless, the results demonstrate that information flows
are associated with the multitasking behavior of information workers.
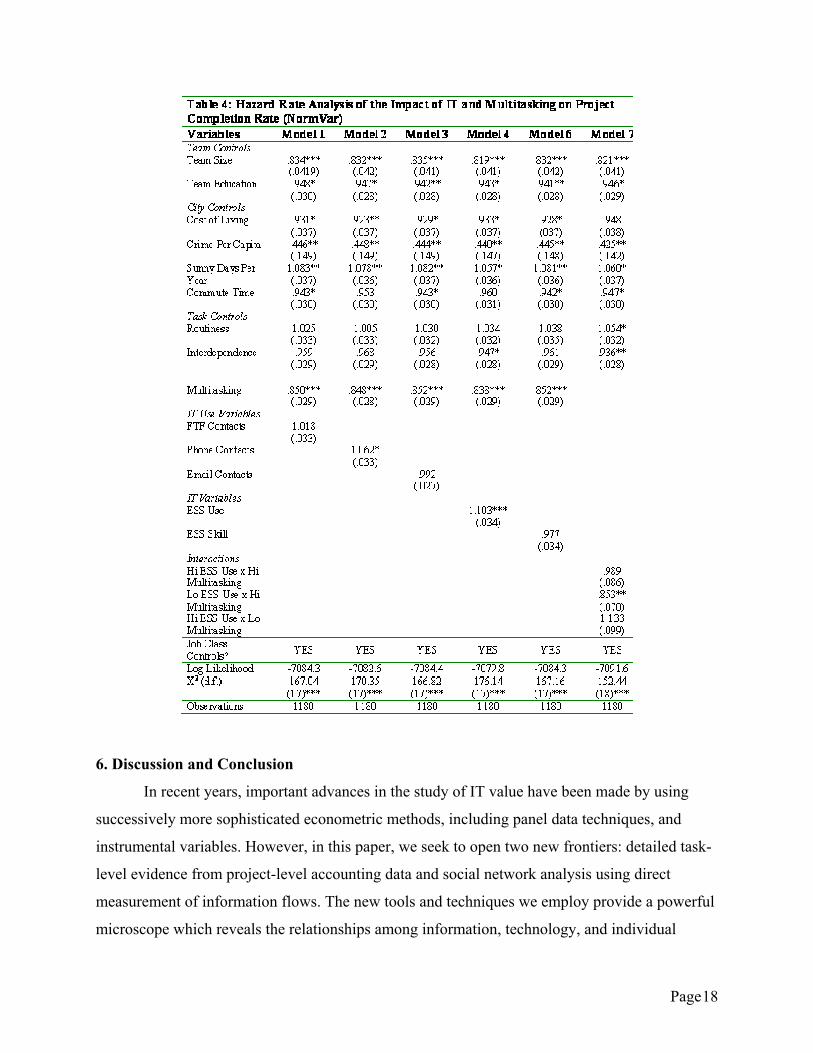
5.3 The Relationship between IT, Information Flows, Multitasking and Project Duration
To test the relationships between multitasking, IT, information flows and project
duration, we estimated the hazard rate model of project completion time. Our specification tests
the relationship between explanatory variables and projects’ instantaneous transition rate – a
measure of the likelihood of project completion at time t, conditional on the project not having
completed before t. In these analyses, we include control variables for city characteristics to
control for the relative attractiveness of cities. We also include controls for the job type, and task
characteristics. Table 4 shows the analysis of the relationship between IT, multitasking and
project completion rates.
In examining the results, we see that the cost of living, crime rates, and greater commute
times all reduce the project completion rate on average, meaning that cities with more crime,
higher costs or longer commute times to work may be less attractive to potential candidates,
while good weather seems to boost the completion rate. Multitasking is strongly associated with
longer project duration and slower completion rates. A one standard deviation increase in project
level multitasking (~ 3 extra projects, s.d. = 2.8) reduces the completion rate on average by about

Page 17
15%. Holding the level of multitasking constant, teams that use the ESS to gather information
more complete projects about 10% faster on average, and teams that use the phone more also
seem to execute projects faster, although the significance level is weak at the 90% confidence
level. Finally, we include a set of interaction terms between multitasking and ESS Use. We split
both variables at the mean and created dummy variables for the high and low categories for each
variable. The “high multitasking” and “high ESS Use” dummy variables imply that project team
members multitask and use the ESS to gather information more than average (1 if above the
normalized mean and 0 if below the mean). This categorization creates four quadrants of project
teams (high multitasking/high ESS use; high multitasking/low ESS use; low multitasking/high
ESS use; and low multitasking/low ESS use teams). We normalized the omitted category
“low/low” to zero, so coefficients can be interpreted as how each quadrant performed compared
to the “low/low” quadrant. We expect teams that multitask heavily and use the ESS less than
average will take longer to complete projects and that “high multitasking” teams who use the
ESS more than average will mitigate the negative impact of multitasking on project duration.
The coefficients on the interaction terms demonstrate just that: teams high in multitasking but
low in ESS use take 15% longer to finish projects than teams low in multitasking and low in ESS
use. The insignificant result on the high ESS Use/high multitasking interaction is actually also a
significant finding. Teams high in multitasking and high in ESS Use do not decrease their
project completion rates relative to teams low in multitasking and ESS Use. While the final
interaction term between high ESS use and low multitasking has the expected sign, it is not
statistically significant.
Finally, we tested the relationship between information flows, multitasking and project
completion rates in the same model as the IT variables just described. All control variables and
the multitasking variable display significant results of almost identical magnitude as reported in
Table 4. However, of the six information flow variables (total emails, network size, in-degree,
out-degree, betweeness and constraint) only in-degree returned a significant parameter estimate
at the 95% level (β = 1.064, SE = .034). It seems that while information flows and network
structure are strongly associated with multitasking behavior, they are not related to the speed
with which projects are completed, controlling for multitasking. Although, having more frequent
incoming email from more people seems weakly associated with faster completion times, no
other information flow variables are related at greater than 90% confidence.
Page 18
6. Discussion and Conclusion
In recent years, important advances in the study of IT value have been made by using
successively more sophisticated econometric methods, including panel data techniques, and
instrumental variables. However, in this paper, we seek to open two new frontiers: detailed task-
level evidence from project-level accounting data and social network analysis using direct
measurement of information flows. The new tools and techniques we employ provide a powerful
microscope which reveals the relationships among information, technology, and individual

Page 19
information worker productivity in a way that would be impossible with any amount of firm,
industry or country-level data.
The contributions of this research appear at four different levels. First, we show that
information work need not defy measurement. On the contrary, we identify a context with
objective measures of white collar output as well as IT use and information flows associated with
that output. In this setting, we gathered data in exacting detail on 1300 projects over five years,
125,000 point-to-point email messages over ten months, and employee perceptions through the
use of interactive online surveys. These data include contract dates, effort levels of individual
people on individual contracts, team composition, multitasking, and project quality controls such
as jobs levels and placement city attributes. We negotiated access, wrote and developed the tools
to gather unbiased email exchanges, and collected these data live inside a working firm.
Second, we use this increased detail to peer inside the black box production function of
information workers. We develop and validate a multitasking and duration model of individual
projects that allows us to examine the associations between information, technology and the
intermediate steps in performing white collar tasks. We also develop and validate a hazard rate
model of project completion. Thus we directly explore the association between using technology
and the ability to juggle more tasks and complete them faster.
Third, we find statistically significant evidence that use of IT correlates with
performance. This is measured by completed projects, which shows a direct correspondence with
revenues. Specifically, with all other variables equal, those workers with an increased use of
email and ESS tools are able to handle substantially more simultaneous projects than those who
do not make use of this technology. In contrast, traditional modes of communication such as
face to face meetings and phone calls are correlated with a decline in multitasking. Controlling
for multitasking, heavy ESS users who multitask finish projects faster, while light ESS users who
multitask finish them more slowly.
Fourth, we apply social network analysis methods to our email data and find that position
and flow matter. Betweenness centrality shows a positive association with ability to multitask as
do in-degree, out-degree, and network size. The total volume of communication is also
statistically significant as is the measure of constraint, which shows that constrained networks
and redundant contacts correspond to reduced multitasking.

Page 20
In sum, we demonstrate a substantial program of correspondence among information,
technology, and output in this setting. The tools and techniques developed for this paper can be
readily applied to other settings where email or ESS are used and project level information work
is performed, including sales, consulting, law, medicine, software development, venture capital,
investing, underwriting and architecture, among others. This portends a radical improvement in
the coming decade in our understanding of the relationship between IT, information work and
value creation.
References
TBD: Tapscott, 1982, Tapscott & Caston, 1993, Dewan & Kraemer 2000, Lichtenberg 1995, Dewan & Min 1997, Ancona and Caldwell 1992, Eisenhardt and Tabrizi 1995 … others? Bulkley, N. & Van Alstyne, M. (2004) “Why Information Should Influence Productivity” in Network Organization: A Cross Cultural Perspective (ed). Manuel Castells. Burt, R (1992) Structural Holes: The Social Structure of Competition. Harvard University Press, Cambridge, MA. Brynjolfsson, E. and L. M. Hitt (1996). "Paradox lost? Firm-level evidence on the returns to information systems spending." Management Science 42(4): 541-558. Freeman, L (1979) Centrality in social networks: Conceptual clarification. Social Networks 1(3) 215-234. Granovetter, M. (1973) The strength of weak ties. American Journal of Sociology 6(6): 1360-1380. Ichniowski, C., K. Shaw, and Prennushi. (1997). "The Effects of Human Resource Management Practices on Productivity: A Study of Steel Finishing Lines." American Economic Review 87(3): 291-313. Jorgenson D. & K Stiroh, 2000. "U.S. Economic Growth at the Industry Level," American Economic Review, vol. 90(2), pages 161-167, May. Oliner, S. and D. Sichel (2000). “The Resurgence of Growth in the Late 1990s: Is Information Technology the Story?” Journal of Economic Perspectives 14(4): 3-22. Tuma and Hannan (1984) Social Dynamics: Models and Methods. Academic Press, New York.