draft - in.gov · draft indiana state rail plan draft i table of contents chapter 1: introduction
TRANSCRIPT

DRAFT

DRAFT
Indiana State Rail Plan DRAFT
i
Table of Contents Chapter 1: Introduction .................................................................................................................... 1-1
1.1 The Rail System’s Role in Indiana ................................................................................... 1-11.2 Federal Mandate for State Rail Plans ............................................................................... 1-11.3 State Rail Plan Vision and Stakeholder Consultation ..................................................... 1-2
1.3.1 Summary of Stakeholder Consultation ..................................................................... 1-21.3.2 Vision Statement, Goals & Objectives ..................................................................... 1-4
Chapter 2: Public Rail Program Activities in Indiana .................................................................... 2-12.1 Indiana’s Legislative Rail Authority ................................................................................ 2-12.2 Indiana DOT’s Rail Organizations and Roles ................................................................. 2-2
2.2.1 INDOT’s Rail Organization ...................................................................................... 2-22.3 Public Sector Rail Planning in Indiana ............................................................................ 2-3
2.3.1 Indiana Economic Development Corporation .......................................................... 2-32.3.2 Metropolitan Planning Organizations ....................................................................... 2-32.3.3 Local Economic Development Agencies ................................................................. 2-62.3.4 Ports of Indiana .......................................................................................................... 2-62.3.5 Educational Institutions ............................................................................................. 2-6
2.4 State Rail Funding in Indiana ........................................................................................... 2-72.4.1 Indiana Industrial Rail Service Fund ........................................................................ 2-72.4.2 Indiana Railroad Grade Crossing Fund .................................................................... 2-82.4.3 Indiana Economic Development Corp. Industrial Development Grant Fund ........ 2-8
2.5 Federal Rail Programs and Funding Options ................................................................... 2-82.5.1 Federal Rail Intercity Passenger and High Speed Rail Programs ........................... 2-9
2.6 Rail-Related Legislative Proposals ................................................................................ 2-142.7 Indiana Rail Studies ......................................................................................................... 2-15
2.7.1 Rail Freight Studies ................................................................................................. 2-162.7.2 Rail Passenger Studies ............................................................................................. 2-16
2.8 Indiana’s Involvement in Multi-State Planning ............................................................. 2-17Chapter 3: Indiana Rail System Profile ........................................................................................... 3-1
3.1 Class I Railroads ................................................................................................................ 3-33.1.1 CSX System ............................................................................................................... 3-53.1.2 Norfolk Southern ..................................................................................................... 3-103.1.3 Canadian National .................................................................................................... 3-163.1.4 Canadian Pacific Railway ....................................................................................... 3-16
DRAFT
Indiana State Rail Plan DRAFT
ii
3.1.5 Union Pacific ............................................................................................................ 3-163.2 Regional Railroads .......................................................................................................... 3-173.3 Local Railroads ................................................................................................................ 3-173.4 Switching and Terminal Railroads ................................................................................. 3-223.5 Excursion Railroads ........................................................................................................ 3-243.6 Abandoned or Discontinued Rail Lines ......................................................................... 3-25
Chapter 4: Indiana Rail Freight Traffic Profile ............................................................................... 4-14.1 Commodity Profile ............................................................................................................ 4-1
4.1.1 Interstate Inbound ...................................................................................................... 4-14.1.2 Interstate Outbound ................................................................................................... 4-24.1.3 Intrastate Traffic ......................................................................................................... 4-34.1.4 Overhead Traffic ........................................................................................................ 4-4
4.2 Geographic Profile ............................................................................................................ 4-54.2.1 Destinations of Traffic from Indiana ........................................................................ 4-54.2.2 Origins of Traffic to Indiana ..................................................................................... 4-64.2.3 Originating Counties in Indiana ................................................................................ 4-74.2.4 Terminating Counties in Indiana .............................................................................. 4-9
4.3 Rail Freight Traffic Densities ......................................................................................... 4-104.4 Rail Freight Traffic Trends ............................................................................................. 4-114.5 Rail Freight Traffic Forecasts ......................................................................................... 4-114.6 Industry Developments that Could Impact Major Rail Commodities ......................... 4-14
4.6.1 Field Crops ............................................................................................................... 4-144.6.2 Ethanol ...................................................................................................................... 4-154.6.3 Conclusion – Bio-fuels and Field Crops ................................................................ 4-184.6.4 Coal ........................................................................................................................... 4-184.6.5 Manufacturing and Steel .......................................................................................... 4-22
Chapter 5: Role of Indiana’s Freight Rail System in the State’s Intermodal Network ................ 5-15.1 Indiana’s Current Role within the National Intermodal Network .................................. 5-25.2 Indiana’s Potential Role within the National Intermodal Network ................................ 5-35.3 Trade Trends Impacting Indiana Intermodal Traffic ....................................................... 5-65.4 Non-Containerized Truck/Rail Facilities ....................................................................... 5-125.5 Maritime Facilities .......................................................................................................... 5-15
Chapter 6: Impacts of Freight Rail Transportation in Indiana ....................................................... 6-16.1 Economics .......................................................................................................................... 6-1

DRAFT
Indiana State Rail Plan DRAFT
iii
6.2 Environment ....................................................................................................................... 6-36.3 Land Use ............................................................................................................................ 6-66.4 Energy Efficiency .............................................................................................................. 6-76.5 Community Impact .......................................................................................................... 6-106.6 Summary .......................................................................................................................... 6-10
Chapter 7: Rail Safety and Security ................................................................................................ 7-17.1 Rail Safety .......................................................................................................................... 7-1
7.1.1 Railroad Grade Crossing Safety ................................................................................ 7-27.1.2 Rail Safety Inspection Program ................................................................................ 7-47.1.3 Hazardous Materials .................................................................................................. 7-47.1.4 Positive Train Control ............................................................................................... 7-5
7.2 Rail Security ...................................................................................................................... 7-57.2.1 Federal and State Roles in Railroad Security ........................................................... 7-57.2.2 Strategic Rail Corridor Network ............................................................................... 7-6
Chapter 8: Rail Passenger Service in Indiana ................................................................................. 8-18.1 Existing Intercity Passenger Rail System Routes ............................................................ 8-1
8.1.2 Ridership .................................................................................................................... 8-58.1.3 Stations ....................................................................................................................... 8-88.1.4 Intercity Rail Service Performance Evaluation ...................................................... 8-11
8.2 Commuter Rail Service ................................................................................................... 8-188.2.1 Ridership .................................................................................................................. 8-208.2.2 Financial Performance and Funds Souring ............................................................ 8-208.2.3 On-Time Performance ............................................................................................. 8-208.2.4 Ongoing Improvements ........................................................................................... 8-218.2.5 Stations ..................................................................................................................... 8-22
Chapter 9: Proposed Passenger Rail Service .................................................................................. 9-19.1 Intercity and High Speed Rail Plans ................................................................................ 9-1
9.1.1 Midwest Regional Rail Initiative .............................................................................. 9-19.1.2 Indianapolis to Louisville High Speed Rail Service ................................................ 9-59.1.3 Ohio Hub .................................................................................................................... 9-5
9.2 Commuter Rail Plans ........................................................................................................ 9-69.2.1 NICTD West Lake Corridor Study ........................................................................... 9-69.2.2 Other NICTD Plans ................................................................................................... 9-79.2.3 Indy Connect .............................................................................................................. 9-9
DRAFT
Indiana State Rail Plan DRAFT
iv
9.2.4 Bloomington-Indianapolis-Muncie ......................................................................... 9-109.3 Passenger Rail Service Objectives ................................................................................. 9-11
Chapter 10: Review of Indiana Rail Lines .................................................................................... 10-110.1 Ability of Primary Rail Corridors to Accommodate Current and Future Traffic .... 10-110.2 Gross Weight Railcars, 286,000-pound ..................................................................... 10-410.3 FRA Track Class .......................................................................................................... 10-610.4 Needs Identified by Class II and Class III Carriers ................................................... 10-710.5 Grade Crossings ........................................................................................................... 10-810.6 North-South Connections .......................................................................................... 10-15
Chapter 11: Indiana’s Rail Investment Program ........................................................................... 11-111.1 Indiana Rail Investment Policies ................................................................................ 11-111.2 Indiana’s Rail Passenger Investment Plan ................................................................. 11-211.3 Indiana’s Rail Freight Investment Plan ...................................................................... 11-2
Appendices Appendix A: Stakeholder Outreach Report
Appendix B: Long-Range Investment Program
Appendix C: Short-Range Investment Program
Appendix D: Survey of Other State Participation in Funding of Freight and Passenger Rail Infrastructure and Maintenance

DRAFT
Indiana State Rail Plan DRAFT
v
Table of Exhibits Exhibit 2- 1: INDOT Rail Office within Capital Program Management Organization ............... 2-3Exhibit 2- 2: Indiana MPOs ............................................................................................................. 2-5Exhibit 3- 1: Indiana Rail Network ................................................................................................. 3-2Exhibit 3- 2: Indiana Class I Railroads ........................................................................................... 3-3Exhibit 3- 3: Rail Signaling Systems in Indiana ............................................................................. 3-4Exhibit 3- 4: CSX Network .............................................................................................................. 3-5Exhibit 3- 5: CSX Subdivisions ....................................................................................................... 3-6Exhibit 3- 6: Norfolk Southern Network ....................................................................................... 3-11Exhibit 3- 7: Norfolk Southern Subdivisions ................................................................................ 3-12Exhibit 3- 8: Canadian National Network ..................................................................................... 3-16Exhibit 3- 9: Indiana Regional Railroads ...................................................................................... 3-17Exhibit 3- 10: Local Railroads in Indiana ..................................................................................... 3-18Exhibit 3- 11: Indiana Switching and Terminal Railroads ........................................................... 3-22Exhibit 3- 12: Excursion Railroads in Indiana .............................................................................. 3-24Exhibit 3- 13: Abandoned Rail Lines in Indiana (2001-2011) .................................................... 3-27Exhibit 4-1: Indiana Rail Traffic Directional Flows ...................................................................... 4-1Exhibit 4-2: Top Five Interstate Inbound Commodities ................................................................ 4-2Exhibit 4-3: Top Five Interstate Outbound Commodities .............................................................. 4-3Exhibit 4-4: Top Five Intrastate Commodities ............................................................................... 4-4Exhibit 4-5: Top Seven Overhead Commodities ............................................................................ 4-5Exhibit 4-6: Destination of Interstate Rail Traffic Originated in Indiana ..................................... 4-6Exhibit 4-7: Origin of Interstate Rail Traffic Terminating in Indiana ........................................... 4-7Exhibit 4-8: Originating Counties of Rail Traffic in Indiana ......................................................... 4-8Exhibit 4-9: Terminating Counties of Rail Traffic in Indiana ....................................................... 4-9Exhibit 4-10: 2008 Density of Indiana Rail Lines in Millions of Gross Ton-Miles per Mile ... 4-10Exhibit 4-11: Rail Traffic Trends in Indiana (1999-2009) ........................................................... 4-11Exhibit 4-12: Compound Annual Growth Rates for Inbound, Outbound and Intrastate Freight 2009 - 2040 ..................................................................................................................................... 4-12Exhibit 4-13: Growth Rates for Top Commodities ...................................................................... 4-13Exhibit 4-14: Distribution of Tonnage Increase in Rail Traffic to/from Indiana between 2007 and 2040 by Region ............................................................................................................................... 4-13Exhibit 4-15: Corn Production, Yield and Planted Acreage in Indiana ...................................... 4-14Exhibit 4-16: Soybean Production, Yield and Planted Acreage in Indiana ................................ 4-15Exhibit 4-17: Ethanol Plants in Indiana ........................................................................................ 4-16Exhibit 4-18: Indiana Corn Production and Ethanol Plants ......................................................... 4-17Exhibit 4-19: Rail and Truck Ethanol Distribution System ......................................................... 4-18Exhibit 4-20: Coal Mines in Indiana ............................................................................................. 4-19Exhibit 4-21: Indiana Coal-Fired Power Plants and Rail Network ............................................. 4-20Exhibit 4-22: Coal Production Projection ..................................................................................... 4-21

DRAFT
Indiana State Rail Plan DRAFT
vi
Exhibit 5- 1: RoadRailer™ Bogey Connecting Two Trailer Bodies ............................................. 5-1Exhibit 5- 2: Percentage Change since 1999 of Carloads/Units .................................................... 5-2Exhibit 5- 3: Profile of Indiana’s Intermodal Terminals ................................................................ 5-3Exhibit 5- 4: Midwest Fast-Freight Rail System ............................................................................ 5-4Exhibit 5- 5: Historical and Forecasted World Imports Percentage of World GDP .................... 5-7Exhibit 5- 6: Major U.S Population Centers ................................................................................... 5-8Exhibit 5- 7: Value of Foreign Trade Flow by Region of the World ($Millions) ........................ 5-9Exhibit 5- 8: National Gateway Project ........................................................................................ 5-12Exhibit 5- 9: Kingsbury Inland Logistics Port Refrigerated Service .......................................... 5-14Exhibit 5- 10: Bulk Transload Facilities in Indiana ..................................................................... 5-14Exhibit 5-11: Vehicle Ramps in Indiana ....................................................................................... 5-15Exhibit 5- 12: Rail/Maritime Connections of National or State Significance ............................ 5-15Exhibit 5- 13: Map of Rail/Maritime Connections of National or State Significance ............... 5-16Exhibit 6- 1: Millions of Rail Tons Originated in Indiana (2008) ................................................. 6-1Exhibit 6- 2: Millions of Rail Tons Terminated in Indiana (2008) ............................................... 6-2Exhibit 6- 3: Greenhouse Gas Emissions by Industry Sector ........................................................ 6-4Exhibit 6- 4: Ton-miles per Gallon (1995-2009) ............................................................................ 6-7Exhibit 7- 1: Total Rail Accidents/Incidents in Indiana (2001-2010) ........................................... 7-2Exhibit 7- 2: Rail Accidents/Incidents in Indiana by Type (2001-2010) ...................................... 7-2Exhibit 7- 3: Indiana Highway-Rail Grade Crossing ..................................................................... 7-3Exhibit 7- 4: Indiana Grade Crossing Incidents .............................................................................. 7-4Exhibit 7- 5: Indiana STRACNET Map .......................................................................................... 7-7Exhibit 8- 1: Route Segments of Cardinal/Hoosier State ............................................................... 8-1Exhibit 8- 2: Cardinal/Hoosier State Route .................................................................................... 8-2Exhibit 8- 3: Route Segments of the Capitol Limited .................................................................... 8-2Exhibit 8- 4: Capitol Limited Route ................................................................................................ 8-3Exhibit 8- 5: Route Segments of the Lake Shore Limited ............................................................. 8-3Exhibit 8- 6: Lake Shore Limited Route ......................................................................................... 8-4Exhibit 8- 7: Route Segments of the Michigan City Services ....................................................... 8-5Exhibit 8- 8: Michigan City Service Route ..................................................................................... 8-5Exhibit 8- 9: Amtrak Ridership in Indiana from FY 2008 to FY 2010 ......................................... 8-7Exhibit 8- 10: Amtrak Stations in Indiana ...................................................................................... 8-9Exhibit 8- 11: Fare Box Recoveries for Trains Running through or Serving Indiana ............... 8-12Exhibit 8- 12: Change in Passenger Miles per Train Mile, Two Years Ending March 2011 to Two Years Ending March 2010 ..................................................................................................... 8-13Exhibit 8- 13: On Time Performance for Amtrak Routes that Pass through Indiana ................. 8-14Exhibit 8- 14: Host Railroad Responsible Delays in Minutes Delay per 10,000 Train Miles 2nd Quarter FY 2011 ............................................................................................................................. 8-15Exhibit 8- 15: Amtrak Responsible Delays in Minutes per 10,000 Train Miles, ....................... 8-162nd Quarter FY 2011 ....................................................................................................................... 8-16Exhibit 8- 16: Amtrak Customer Service Index (CSI) for 2nd Quarter, Fiscal Year 2011 ......... 8-17

DRAFT
Indiana State Rail Plan DRAFT
vii
Exhibit 8- 17: NICTD System Map ............................................................................................... 8-19Exhibit 8- 18: Kensington Bypass and Catenary Upgrade ........................................................... 8-21Exhibit 8- 19: NICTD Stations in Indiana .................................................................................... 8-23Exhibit 9- 1: The Midwest Regional Rail System .......................................................................... 9-2Exhibit 9- 2: Federally Designated High Speed Rail Routes in Indiana ....................................... 9-3Exhibit 9- 3: Ohio Hub Network ..................................................................................................... 9-6Exhibit 9- 4: Michigan Reroute Options ......................................................................................... 9-8Exhibit 9- 5: South Bend Proposed Reroute ................................................................................... 9-9Exhibit 9- 6: Potential Commuter Rail Routes Serving the Indianapolis Area .......................... 9-10Exhibit 10- 1: Primary Rail Corridors within Indiana .................................................................. 10-2Exhibit 10- 2: Forecasted Increases in Traffic on Indiana Corridors (2005-2035) .................... 10-3Exhibit 10- 3: Indiana Corridor Level of Service in 2035 without Improvements .................... 10-4Exhibit 10- 4: Ability of Rail Lines within Indiana to Accommodate 286,000-lb Railcars ...... 10-6Exhibit 10- 5: Capacity Needs Identified by Short Line/Regional Railroads in Indiana ........... 10-7Exhibit 10- 6: Capacity Needs Identified by Short Line/Regional Railroads During State Rail Plan Outreach .................................................................................................................................. 10-8Exhibit 10- 7: Top Ten States by Number of Active Public Highway-Rail Grade Crossings ... 10-8Exhibit 10- 8: Number of Public Roadway Miles per Highway-Rail Grade Crossing .............. 10-9Exhibit 10- 9: Indiana Highway-Rail Grade Crossings by County ........................................... 10-10Exhibit 10- 10: Annual Train-Activated Warning Device Maintenance Cost for Public Highway-Rail Crossings ............................................................................................................................... 10-11Exhibit 10- 11: Flashing Signals with Cantilevered Structure, Gates ....................................... 10-12Exhibit 10- 12: Approximate Annual Cost of Maintaining Warning Devices in Indiana ........ 10-13Exhibit 10- 13: Correlation between FRA Roadway Classification and IRTG Member Roadway Classification ................................................................................................................................. 10-14Exhibit 10- 14: Annual Cost of Resurfacing Public Highway-Rail At-Grade Crossings in Indiana
........................................................................................................................................................ 10-15Exhibit 10- 15: Density of Indiana Rail Lines in Million Gross Tons per Mile ....................... 10-16Exhibit 10- 16: Southeast Connections ....................................................................................... 10-18

DRAFT
DRAFT
Chapter 1: Introduction 1-1
Chapter 1: Introduction
1.1 The Rail System’s Role in Indiana Since its inception in the 1830s, Indiana’s rail system has played a central role in the State’s development and growth. The rail routes through Indiana to Chicago and St. Louis provided connections to the west, offering faster and more efficient passenger service. The rail system also supported Indiana’s manufacturing growth by delivering the raw materials. During these growth years, Indianapolis emerged as the first major city due to its role as a rail hub.
Even today, following a number of periods of consolidation of the rail network, Indiana’s rail system ranks high among other states in a number of rail-related categories. For instance, Indiana ranks among the top 10 states in rail tons originated, total rail tons carried, total rail carloads carried, and rail employment and wages. In terms of commodities, it also ranks in the top 10 among states for coal tonnage originated and terminated, farm products originated, food products originated, primary metals originated and terminated, and petroleum products terminated.
Today, Indiana’s economy remains highly dependent on the rail system servicing its energy, agricultural, construction, and manufacturing industries. In addition, the recognized benefits of moving goods and passengers by rail in terms of reduced energy usage, pollution emissions, and highway maintenance costs provide significant initiative for increased public attention to both the accomplishments and the potential of the rail system to benefit transportation and economic development in Indiana.
1.2 Federal Mandate for State Rail Plans In 2008, the U.S. Congress passed the Passenger Rail Investment and Improvement Act (PRIIA), with the expressed intent of improving passenger rail service in the Unites States. The Act re-authorized Amtrak and appropriated funds for both Amtrak and individual states to improve rail passenger service, operations, and facilities. The Act also required that states applying for rail passenger funding have an approved State Rail Plan and included new Rail Plan requirements. Previously approved Indiana State Rail Plans were developed following federal requirements established in the 1970s, primarily for the purpose of preserving light density freight rail branch lines.
State Rail Plan requirements in the Passenger Rail Investment and Improvement Act include the following:
• An identification of rail infrastructure issues that reflect consultation with the public and relevant stakeholders
• A review and inventory of all rail lines in the state and an analysis of the role of rail transportation within in a multimodal environment

DRAFT
DRAFT
Chapter 1: Introduction 1-2
• A statement of the state’s passenger rail service objectives for routes in the state
• A statement of public financing issues for rail projects and service in the state
This document fulfills the requirements of the PRIIA legislation and serves as Indiana’s State Rail Plan. The Plan represents a compendium of recent rail studies supplemented by additional analysis and investigation as required to meet federal requirements. The Plan was developed with extensive public participation and involvement by the State’s railroads, rail users, and other rail stakeholders in both the public and private sectors.
1.3 State Rail Plan Vision and Stakeholder Consultation
1.3.1 Summary of Stakeholder Consultation The Indiana Department of Transportation (INDOT) is committed to engaging rail stakeholders and the public in rail planning activities. The goals for stakeholder and public involvement for the State Rail Plan are to:
• Gain an understanding of the need, the potential impacts of and opportunities for rail transportation to improve the overall efficiency and sustainability of Indiana’s transportation system;
• Solicit input relative to rail policies, projects, and programs to better meet transportation needs while also making Indiana a more attractive location to conduct business and a better place to live;
• Provide input for developing a strategy for making rail investment decisions.
As discussed in more detail in Appendix A, an extensive outreach effort was conducted as part of the Indiana State Rail Plan, aimed at seeking input from relevant stakeholders. Outreach activities included those listed below.
• Stakeholder interviews and stakeholder questionnaires. A series of questionnaires/ interview guides were developed to solicit stakeholder views on the role(s) of Indiana rail network; rail policy, projects, and programs that would enable the rail system to better meet the state’s needs; strategy for making rail investment decisions. Three versions of the questionnaire were administered, one directed at rail carriers, another for shippers, and another for other individuals or organizations. Over two hundred completed questionnaires were received.
• Rail planning forums, meetings. Three rail planning open houses were held at the INDOT Vincennes and LaPorte District Offices, and at the Indianapolis Traffic Management Center. Additionally, study team members met with the Indiana Railroad Transportation Group.

DRAFT
DRAFT
Chapter 1: Introduction 1-3
• Government agency and railroad coordination. Members of the study’s advisory committee kept rail carriers and government agencies informed of the Rail Plan.
• The INDOT website. INDOT published information about the Plan on its website, as well as provided an online questionnaire where individuals and organizations could express their views for the Plan.
The stakeholders from whom INDOT received input can broadly be classified into the following groups:
• Freight railroads. The study team received feedback from 14 freight rail carriers.
• Passenger railroads. Feedback was received from three carriers that provide passenger service.
• Rail shippers. Eight rail shippers provided input.
• Government officials, including elected representatives at a town or county level, metropolitan planning organizations, and other government officials. Twenty government entities provided input to the Plan.
• Economic development agencies or advocates, passenger rail advocacy groups, other rail advocates. Feedback was received from 17 organizations with an interest in rail.
• General Public. Feedback was received from 147 individuals.
The issues and opportunities identified varied across stakeholders, both within categories of stakeholders and between categories of stakeholders. However, several themes appeared frequently, across multiple categories of stakeholders. These are as follows:
• Stakeholders stressed the benefits of both passenger and freight rail in terms of energy efficiency, environmental efficiency (emissions), reduced highway cost and congestion, and potential for user benefits, such as vehicle cost savings and shipper cost savings.
• Many would like INDOT to take a more multi-modal, integrated approach to transportation infrastructure within the state, with rail receiving a larger share of funding and serving as an alternative to roadways.
• Rail can be used as an economic development tool, linking Indiana to markets and making Indiana businesses more efficient and competitive, and supporting Indiana’s identity as the “Crossroads of America.”
• Rail infrastructure will need to be improved before the Indiana rail network can reach its full potential, including upgrades to short line infrastructure, improvements to rail lines that support passenger rail.

DRAFT
DRAFT
Chapter 1: Introduction 1-4
1.3.2 Vision Statement, Goals & Objectives Given stakeholder feedback, the following vision is adopted for this rail plan,
The future Indiana rail system will provide safe, reliable, efficient, and effective mobility for moving both people and goods. It will contribute to a more balanced transportation system where rail can help to alleviate roadway congestion, contribute to economic development, improve energy efficiency, and protect environmental quality. It will better link Indiana to domestic and international markets. Through prudent, cost-effective investment, the reliability, safety, capacity, and connectedness of Indiana’s rail infrastructure will continue to be improved.
Based upon the vision described above and INDOT goals as articulated in the INDOT Long Range Transportation Plan, goals and objectives as set forth in this Rail Plan are listed below. Goals break down the vision into manageable pieces. Objectives provide the general types of actions and policies that will be employed to achieve the goals.
Goal: Transportation System Effectiveness
Support an efficient and well-integrated rail system.
• Assist with upgrades to Class II, Class III infrastructure
Objectives:
• Support improved connectivity of the Indiana rail infrastructure with other modes and within the rail network.
• Provide improved transportation options to Indiana communities and industries in a manner that is most cost effective
Goal: Transportation Safety
Help reduce the risks of the rail system, as well as raise safety awareness of rail safety issues.
• Reduce risks at at-grade highway-rail grade crossings
Objectives:
• Promote awareness of safety hazards related to highway-rail grade crossings and trespassing on rail right of ways
• Reduce the number of at-grade highway-rail grade crossings

DRAFT
DRAFT
Chapter 1: Introduction 1-5
Goal: Economic Development
Support economic competitiveness by reducing freight transportation costs and connecting Indiana with regional, national, and international markets; better connect people with economic opportunities.
• Preserve and enhance existing rail corridors
Objectives:
• Support track improvements related to new business opportunities
• Support efforts to better connect Indiana with regional, national, international markets through new or improved transportation service options
Goal: Balanced Transportation Policy
Ensure that rail is on a “level playing field” with other transportation modes.
• Identify the benefits and costs of rail projects compared to other transportation options or doing nothing
Objectives:
Goal: Transportation Finance
Support adequate and reliable funding for rail system from all sources: federal, state, local governments and the private sector.
Objectives:
• Evaluate options for public/private partnerships
• Identify and compete for sources of funding for rail projects and programs
Goal: Natural Environment and Energy
Contribute to energy conservation efforts and protection of the environment.
Objectives:
• Include environmental quality, particularly air quality, and energy efficiency in the project evaluation process.

DRAFT
DRAFT
Chapter 2: Public Rail Program Activities in Indiana 2-1
Chapter 2: Public Rail Program Activities in Indiana Rail activities undertaken within the public sector in Indiana entail the organizational aspects of rail planning and project programming which are conducted by the state and various local agencies. In addition to describing rail planning in Indiana, this chapter will also address the systems that are in place to support decision making and project implementation.
Multimodal planning requires close coordination within a state department of transportation itself as well as with other federal and state agencies, local transportation agencies, railroads operating within the state, and the general public. The role of each of these entities and their interactions are described below.
2.1 Indiana’s Legislative Rail Authority Indiana state transportation law provides the Indiana Department of Transportation the authority to qualify for and disburse federal rail funding, and to establish a state program from which it can make rail loans and grants to qualified entities within the state.
IC 8-3-1.5, enacted in 1975, authorized the Indiana Department of Transportation to exercise those powers necessary for the state to qualify for rail service continuation subsidies pursuant to the provisions of the federal Regional Rail Reorganization of 1973. This included authority to: 1) establish a state plan for rail transportation and local rail services; 2) administer and coordinate the state plan; 3) provide in the plan for equitable distribution of federal rail service continuation subsidies; 4) to promote, supervise, and support safe, adequate, and efficient rail service; 5) to employ sufficiently trained and qualified personnel; 6) maintain adequate programs of investigation, research, promotion, and development in connection with such purposes and to provide for public participation; 7) provide satisfactory assurance on behalf of the state that such fiscal control of accounting procedures will be adopted by the state as may be necessary to assure proper disbursement of federal funds; and, 8) comply with the regulations of the Secretary of Transportation and the U.S. Department of Transportation affecting federal rail assistance to the state under Title VI of the Federal Regional Rail Reorganization Act of 1973.
Subsequently, IC 8-3-1.7, enacted in 1982, vested the Indiana Department of Transportation administrative control of the Industrial Rail Service Fund to provide loans to railroads that will be used to purchase or rehabilitate real or personal property that will be used by the railroad in providing railroad transportation services; provide grants to a railroad owned or operated by a port authority; make grants to Class II or Class III railroads for the rehabilitation of railroad infrastructure or railroad construction; and, pay for rail planning and operating expenses of the Department of Transportation.
The Indiana Rail Office oversees this assistance program as well as carrying out planning, providing information, and coordinating efforts to encourage an efficient rail transportation system to meet the needs of Indiana.

DRAFT
DRAFT
Chapter 2: Public Rail Program Activities in Indiana 2-2
2.2 Indiana DOT’s Rail Organizations and Roles
2.2.1 INDOT’s Rail Organization Rail responsibilities within INDOT are primarily located in three areas.
The Rail Office is responsible for rail safety enforcement, Industrial Rail Service Fund grant administration, rail regulation, administering the Railroad Grade Crossing Fund (RRGCF) and passenger planning activities. In these capacities the Rail Office interacts with the state’s railroads, local units of government, and also participates with other states and national organizations with regard to rail planning and policy development.
The Rail Office is located within the Modal & Intermodal Planning and Policy Division which currently reports to the Deputy Commissioner of Capital Program Management.
The Office of Traffic Safety administers the federal highway-rail crossing program. This program entails safety analysis, project selection, and project funding and implementation of grade crossing improvements and closings. The Office of Traffic Safety typically interacts with the Rail Office, railroad companies and local units of government. The Office also has an on-going relationship with Indiana Operation Lifesaver, a subsidiary of the national Operation Lifesaver organization which advocates grade crossing education and safety. The rail office has an employee on the IOL board and a certified operation lifesaver presenter. The Office of Traffic Safety is part of the Division of Asset Management which also reports to the Deputy Commissioner of Capital Program Management.
The Utilities & Railroads division coordinates with railroads whenever an INDOT project has impact on railroad facilities or operations, typically because the project either crosses or runs adjacent to a railroad right of way. Utilities & Railroads reviews INDOT plans and works with designers to have plans approved by effected railroads. Agreements are negotiated to build the improvements in accordance with approved processes governing this type of work. The Utilities & Railroads division reports to the Engineering Support & Design Services Deputy Commissioner.
INDOT’s internal organization has had several changes in recent years and will likely undergo further changes in the future.

DRAFT
DRAFT
Chapter 2: Public Rail Program Activities in Indiana 2-3
Exhibit 2- 1: INDOT Rail Office within Capital Program Management Organization
2.3 Public Sector Rail Planning in Indiana Although the Indiana Department of Transportation has primary responsibility for rail planning, policy and project development, a number of additional state and local agencies in Indiana also have a vested interest in the viability and efficiency of the state rail system in carrying out their responsibilities. These include:
2.3.1 Indiana Economic Development Corporation The Indiana Economic Development Corporation (IEDC) is the state’s lead economic development agency. The IEDC is organized to respond quickly to the needs of businesses. The IEDC is focused exclusively on economic development and has incorporated all state entities with economic development responsibilities into its organizational structure. The Department oversees a variety of programs and services aimed at growing and retaining businesses in Indiana and attracting new business to the state.
The IEDC provides financial support for infrastructure improvements in conjunction with projects creating jobs and generating capital investment in Indiana through its Industrial Development Grant Fund. Eligible rail-related assistance provided by the Fund will be described later in this Chapter.
2.3.2 Metropolitan Planning Organizations Metropolitan Planning Organizations (MPOs) are federally mandated and funded transportation policy-making organizations comprised of local government and transportation officials. The formation of an MPO is required for any urbanized area with a population greater than 50,000.

DRAFT
DRAFT
Chapter 2: Public Rail Program Activities in Indiana 2-4
MPOs are required to maintain Long Range Transportation Plans as well as a Transportation Improvement Plan, or TIP, which is a multi-year program of transportation projects to be funded with federal and other transportation funding sources. As MPO planning activities have evolved to address the movement of freight as well as passengers, they have included consideration of multimodal solutions, improved intermodal connections, and more specific rail and rail-related project solutions.
There are 14 MPOs in Indiana representing 16 Indiana Urbanized Areas. Several MPOs have bi-state agreements which reach into Kentucky, Michigan, and Ohio. A list of those agencies housing MPOs serving Indiana metropolitan areas and the Indiana counties they serve are as follows:
Madison County Council of Governments (MCCOG) – Madison County and parts of Delaware, Hancock, and Hamilton Counties
Bloomington/Monroe County Metropolitan Planning Organization (BMCMPO) – Monroe County
Ohio-Kentucky-Indiana Regional Council of Governments (OKI) – Dearborn County
Columbus Area Metropolitan Planning Organization (CAMPO) – Bartholomew County and parts of Shelby and Johnson Counties
Evansville Metropolitan Planning Organization (EMPO) – Vanderburgh County, Warrick County with planning assistance to Gibson County and Posey County
Indianapolis Metropolitan Planning Organization (IMPO) – Marion County, Hamilton County, Hendricks County, Johnson County, Boone County, Hancock County, Morgan County, and Shelby County
Northeastern Indiana Regional Coordinating Council (NIRCC) – DeKalb County, Allen County, Wells County, and Adams County
Kokomo-Howard County Governmental Coordinating Council (KHCGCC) – Howard County
Tippecanoe County Area Plan Commission (TCAPC) – Tippecanoe County
Kentuckiana Regional Planning and Development Agency (KIPDA) – Clark County, Floyd County
Delaware-Muncie Metropolitan Plan Commission (DMMPC) – Delaware County
Northwestern Indiana Regional Planning Commission (NIRPC) – Lake County, Porter County, and LaPorte County

DRAFT
DRAFT
Chapter 2: Public Rail Program Activities in Indiana 2-5
Michiana Area Council of Governments (MACOG) – Elkhart County, St. Joseph County, Marshall County, and Kosciusko County
West Central Indiana Economic Development District (WCIEDD) – Vigo County
Exhibit 2- 2 below provides a map of MPOs within Indiana.
Exhibit 2- 2: Indiana MPOs
Source: NIRCC, Wilbur Smith
The Indiana MPO Council functions as a forum for the Indiana MPOs to discuss issues and share solutions. The Council has two MPO Committees related to rail transportation in Indiana – the Rail Safety/High Speed Rail and Freight/Commerce Committees. The Indiana MPO Council also organizes an annual MPO Conference in which various rail-related topics are presented.
DRAFT
DRAFT
Chapter 2: Public Rail Program Activities in Indiana 2-6
2.3.3 Local Economic Development Agencies The State of Indiana has a number of local public and private economic development agencies which recruit industries and businesses on the basis of their location, available labor force, room for growth, and transportation assets.
The Indiana Economic Development Directory lists over 80 entities around the state, including economic development agencies, chambers of commerce, development councils, corporations, and associations at the regional, county or city level of government. Many of these agencies offer incentives such as tax exemptions and credits and other means of assistance to attract business interests. The economic development arms of major corporations in Indiana, such as utilities, also work closely with local, regional and state officials and provide comprehensive site information.
Although these agencies do not generally work directly with freight railroad operators, they do have a vested interest in the level of rail services and rail assistance programs available to supplement their incentives.
2.3.4 Ports of Indiana The Ports of Indiana is a quasi-governmental organization that operates a statewide system of ports, foreign trade zones, and economic development programs under the authority of the Indiana Port Commission. The Ports of Indiana promotes Indiana’s logistics assets through its website and publishes the Indiana Logistics Directory annually.1
2.3.5 Educational Institutions
A number of Indiana colleges, universities, and community colleges have conducted rail-related studies or offer educational programs related to transportation/logistics. University leaders in the transportation area also participate in the various advocacy groups promoting the economic benefits of the logistics industry and improved rail freight and passenger mobility in Indiana. Examples of research centers within the state include the following:
• The Joint Transportation Research Program (JTRP) brings together research resources of Purdue University, INDOT and industry representatives.
• The Indiana University Transportation Research Center conducts research in the areas of transportation safety, urban public transit, transport management, and transport regulatory policy.
1 www.portsofindiana.com

DRAFT
DRAFT
Chapter 2: Public Rail Program Activities in Indiana 2-7
2.4 State Rail Funding in Indiana Historically, the railroad industry has operated and been financed under private ownership. Federal funding programs typically were not eligible for rail purposes except for safety improvements at highway-rail at-grade crossings.
Public rail financing, however, was made available when the rail industry faced economic crises, such as the massive railroad bankruptcies in the 1970s and 1980s, and when industry trends threatened to significantly reduce rail access to shippers who were not located on high density rail lines.
Indiana’s involvement in financial assistance to the rail industry dates back to the 1970s with its administration of the federal Local Rail Service Assistance (LRSA) Program which was established by the Regional Rail Reorganization Act of 1973 to provide financial support to states for the continuation of rail freight service on abandoned light density lines in the Northeast. The subsequent Local Rail Freight Assistance Program expanded funding to all states and allowed capital assistance for rehabilitation of lines prior to abandonment. Although federal funding for this program has not been authorized since the early 1990s, its effectiveness led Indiana and a number of other states to establish state funded programs to address their own specific rail needs.
State assistance programs have generally grown and become more diversified over time. In addition to branch line/short line preservation or improvement, various state programs have expanded eligibility to include capacity constraint and clearance restriction improvements on major rail lines and intermodal facilities. State-supported rail programs have also been established to initiate and/or expand intercity rail passenger service and to participate in economic development initiatives through investments that result in improved rail access or efficiency.
The following is a description of existing state-funded programs utilized or available to Indiana for rail system improvements.
2.4.1 Indiana Industrial Rail Service Fund The Indiana Industrial Rail Service Fund (IRSF) was established in 1982. The funding is intended to help upgrade Class II and III freight railroad physical plant and assist in railroad track improvements related to new business development. The program provides grant and/or loan funding for the rehabilitation of railroad infrastructure or railroad construction. Funding cannot exceed 75 percent of the total cost of the project, but the railroad’s contribution may include funds from other state or federal entities.
Funding for the program is generated through a small percentage of the state sales tax and the repayment of past IRSF loans. The maximum grant award is limited based on the total amount available from the funding source, which currently averages $1.5 to $1.7 million annually. The

DRAFT
DRAFT
Chapter 2: Public Rail Program Activities in Indiana 2-8
IRSF is administered by the INDOT Rail Office. In FY2011 IRSF grants totaling $1,498,407 were awarded to eight railroads in the state.
2.4.2 Indiana Railroad Grade Crossing Fund The state-funded Railroad Grade Crossing Fund was instituted by the Indiana State Legislature in 1997 to provide funding for railroad crossing safety improvement projects throughout the state. This program applies to both passive crossings, (which do not utilize automated train-activated warning devices) and train-activated crossings. The funding source for this program is an appropriation from the Indiana General Assembly funded by the Indiana Motor Vehicle Highway Fund.
Railroads and local public agencies can apply for other safety improvement grants which include advance warning signs, pavement marking, overhead streetlights, surface improvements, vegetation management, and signal lighting upgrades.
The Railroad Grade Crossing Fund can also be used for crossing closures. Crossing closure awards, which permanently close a rail-highway intersection to vehicular and pedestrian traffic, have ranged from $15,000 to $55,000 based on the predicted accident rate at the crossing, and the funding criteria established in each fiscal year. Only local public agencies can receive a closure award. Railroads oftentimes provide an additional economic incentive for a community to close a crossing.
2.4.3 Indiana Economic Development Corp. Industrial Development Grant Fund
The Indiana Economic Development Corporation (IEDC) provides financial support for infrastructure improvements in conjunction with projects creating jobs and generating capital investment in Indiana. The program provides funding to local governments for off-site infrastructure projects associated with an expansion of an existing Indiana company or the location of a new facility in Indiana. Funding must be matched by a combination of local government and company financial support.
Eligible uses for these funds include the construction, extension or completion of rail spurs and sidings.
2.5 Federal Rail Programs and Funding Options Historically, there have been few dedicated federal programs for rail capital assistance available to states. In 2008, however, the Passenger Rail Improvement and Investment Act (PRIIA) and related appropriation bills provided funds directly to states for rail intercity passenger investments. In early 2009, the American Recovery and Reinvestment Act also provided flexible transportation funding to states for capital projects as well as funding for passenger rail development.

DRAFT
DRAFT
Chapter 2: Public Rail Program Activities in Indiana 2-9
The following describes these and other programs specifically available for rail assistance as well as programs which may be eligible for selected rail-related applications.
2.5.1 Federal Rail Intercity Passenger and High Speed Rail Programs Over the past two years, the federal government has placed a high priority on the improvement of intercity rail passenger service both as a source of economic stimulus and as an essential future mode of passenger transportation. The following are the legislative and budget initiatives which have been approved to assist states in intercity rail passenger planning and development.
Passenger Rail Improvement and Investment Act (PRIIA) of 2008
This legislation authorized over $13 billion between 2009 and 2013 for Amtrak and promotes the development of new and improved intercity rail passenger services. The Act also establishes an intercity passenger rail capital grant program for states. States are required to identify passenger rail corridor improvement projects in their State Rail Plan.
PRIIA established three new competitive grant programs for funding high-speed intercity passenger rail improvements.
Intercity Passenger Rail Service Corridor Capital Assistance Program
This program is intended to create the framework for a new intercity passenger rail service corridor capital assistance program. The program authorized USDOT to use appropriated funds to make grants to assist in financing the costs of facilities, infrastructure, and equipment necessary to provide or improve intercity passenger rail transportation. States or groups of states, interstate compacts and public intercity passenger rail agencies established by states are eligible for these grants. In addition, to be eligible for funding under this program, projects must be included in an approved State Rail Plan.
Existing or proposed intercity passenger services in Indiana are eligible under this program.
High Speed Rail Corridor Development Program
PRIIA also authorized $1.5 billion annually to establish and implement a high-speed rail corridor development program. Funding is currently restricted to projects intended to develop the ten federally-designated high-speed corridors for intercity passenger rail services that may reasonably be expected to reach speeds of at least 110 miles per hour.
Several FRA-designated High Speed Rail Corridor segments are located within Indiana and are therefore eligible for financial assistance under this program. The corridors include Chicago-Detroit, Chicago-Indianapolis-Cincinnati, Chicago-Cleveland, and Chicago-Indianapolis-Louisville.

DRAFT
DRAFT
Chapter 2: Public Rail Program Activities in Indiana 2-10
Congestion Grants
This program authorizes $325 million annually for grants to states, or to Amtrak in cooperation with states, for financing the capital costs of facilities, infrastructure, and equipment for high-priority rail corridor projects necessary to reduce congestion or facilitate intercity passenger rail ridership growth.
As noted, funding for these authorized programs associated with PRIIA must be appropriated annually.
USDOT Budget Appropriations
Federal funding authorized under PRIIA or other authorization programs must be appropriated under annual budget or other legislative bills.
USDOT’s FFY 2010 budget provided $2.5 billion in funding for the high-speed rail state grant program authorized under PRIIA. USDOT’s FFY 2011 budget, however, eliminated HSR funding and reduced FFY 2010 funding to $2.1 billion. FFY 2010 funds which were allocated to but rejected by other states will be made available by USDOT. Funds are provided to states, on a competitive basis, up to 50 percent of the capital cost of improving intercity rail passenger service.
Previous DOT Appropriation Acts also provided funding that could be utilized for intercity rail passenger improvements under similar terms. The FFY 2009 DOT Appropriations Act provided $90 million to states. The FFY 2008 DOT Appropriations Act provided $30 million to states. Up to ten percent of the funding available under these appropriations is available for rail corridor planning grants.
American Recovery and Reinvestment Act (ARRA)
As a result of the economic recession of 2008, the federal government approved the American Recovery and Reinvestment Act in February, 2009 to stimulate the economy partly through the funding of infrastructure projects which could be initiated in the short term. Programs which could be utilized for rail-related projects under this Act are described below.
Flexible Highway Program
This program provided states a total of $27.5 billion of flexible highway funding for surface transportation improvements, including rail improvements. Eligibility criteria included projects being “shovel ready” for early implementation.
Intercity Passenger Rail/High Speed Rail Program
This program provided $8 billion of High-Speed Intercity Passenger Rail funding to “jump start” intercity passenger rail improvements authorized under PRIIA. Indiana submitted an application

DRAFT
DRAFT
Chapter 2: Public Rail Program Activities in Indiana 2-11
for $71,364,980 million for the Indiana Gateway project on the NS Chicago Line between Porter, IN and the Indiana/Illinois state line. The project was funded. A joint application for the Chicago-Kalamazoo-Detroit corridor for a Service Development Plan and Service NEPA was funded for $3.2 million.
Transportation Investment Generating Economic Recovery (TIGER) Discretionary Grants Program
This program allowed local and state governments to apply for $1.5 billion of discretionary funding. Grants were eligible for capital investment in rail, highway, bridge, public transportation, and port projects and awarded by USDOT on a competitive basis.
The Town of Waterloo, IN received a grant of $1,820,100 to construct a full-length platform and additional parking at the recently renovated historic Waterloo station building. The station is the third busiest Amtrak station in Indiana, serving Amtrak’s Capital Limited and Lake Shore Limited services.
Rail-Related SAFETEA-LU Funding Programs
The Safe, Accountable, Efficient Transportation Equity Act – a Legacy for Users (SAFETEA-LU), the current authorization bill for the nation’s surface transportation program, was originally scheduled to expire on October 1, 2009. The Act has been extended until a new transportation authorization bill is approved by Congress. The Act is expected to be extended to March 31, 2012.
The SAFETEA-LU bill contains a number of program provisions with specific eligibility for rail. These include:
Section 130 Highway-Rail Grade Crossing Program
This program provides federal support in an effort to reduce the incidence of accidents, injuries and fatalities at public highway-rail crossings. States may utilize funds to improve railroad crossings, including the installation or upgrading of warning devices, the elimination of at-grade crossings through grade separation, or the consolidation or closing of crossings. The federal share for these funds is currently 100 percent.
INDOT receives approximately $7.2 million in Section 130 funding annually, completing an average of 20-25 projects per year.
Rail Line Relocation and Improvement Capital Grant Program
Section 9002 of SAFETEA-LU authorized $350 million per year for the purpose of providing financial assistance for local rail line and improvement projects. Any construction project that improves the route or structure of a rail line and 1) involves a lateral or vertical relocation of any portion of the rail line or, 2) is carried out for the purpose of mitigating the adverse affects of rail

DRAFT
DRAFT
Chapter 2: Public Rail Program Activities in Indiana 2-12
traffic on safety, motor vehicle traffic flow, community quality of life, or economic development, is eligible. The federal share for these funds is 90 percent, not to exceed $20 million.
Indiana has been allocated $441,000 for a grade separation project in Elkhart, $380,000 for a rail bridge rehabilitation project in Perry Co., and $906,000 for rail line rehabilitation planning in Terre Haute through this program.
Rail Rehabilitation and Improvement Financing (RRIF)
Section 9003 of SAFETEA-LU provides loans and credit assistance to both public and private sponsors of rail and intermodal projects. Eligible projects include acquisition, development, improvement, or rehabilitation of intermodal or rail equipment and facilities. Direct loans can fund up to 100 percent of a capital project with repayment terms of up to 25 years and interest rates equal to the cost of borrowing from the government. A total of $35 billion was authorized for this program, of which $7 billion was directed to short line and regional railroads.
Eligible borrowers include railroads, state and local governments, government sponsored authorities and corporations, and joint ventures that include at least one railroad. To-date, no railroad operations within Indiana have received RRIF funding.
Other SAFETEA-LU Programs with Selected Rail Applications
In addition to the above programs, a number of additional programs, although primarily intended for highway use, are eligible for rail projects at the discretion of states and with the approval of the administering federal agency. These programs include:
National Highway System (NHS) Program
This program can be utilized to improve designated highway intermodal connectors between the NHS system and intermodal facilities, such as truck-rail transfer facilities. The federal share of NHS funding is 80 percent.
Congestion Mitigation and Air Quality (CMAQ) Improvement Program
This program funds transportation projects and programs that improve air quality by reducing transportation-related emissions in non-attainment and maintenance areas for ozone, carbon monoxide, and particulate matter. Examples of CMAQ-funded rail projects include the construction of intermodal facilities, rail track rehabilitation, diesel engine retrofits and idle-reduction projects in rail yards, and new rail sidings.
State Departments of Transportation and Metropolitan Planning Organizations select and approve projects for funding. The federal matching share for these funds is 80 percent.

DRAFT
DRAFT
Chapter 2: Public Rail Program Activities in Indiana 2-13
Surface Transportation Program (STP)
The Surface Transportation Program is a general grant program available for improvements on any Federal-Aid highway, bridge or transit capital project. Eligible rail improvements include lengthening or increasing vertical clearance of bridges, crossing eliminations, and improving intermodal connectors.
State Departments of Transportation and Metropolitan Planning Organizations select and approve projects for funding under this program. The federal matching share for these funds is 80 percent.
Transportation Infrastructure Finance and Innovation Act (TIFIA)
This program provides credit assistance to large scale projects (over $50 million or one-third of a state’s annual federal-aid funds) of regional or national significance that might otherwise be delayed or not constructed because of risk, complexity or cost. A wide variety of intermodal and rail infrastructure projects are eligible and can include equipment, facilities, track, bridges, yards, buildings and shops. The interest rate for TIFIA loans is the U.S. Treasury rate and the debt must be repaid within 35 years.
High Priority Projects
This program provided designated funding over a five-year period for 5,091 projects identified in SAFETEA-LU. Though primarily highway-related, some projects were rail-related.
Transportation Enhancement Program
These funds are available to strengthen the cultural, aesthetic and environmental aspects of the nation’s intermodal transportation system. Eligible projects can include the rehabilitation of historic transportation buildings or facilities, and the preservation of abandoned rail corridors.
Projects are chosen at the state government level in Indiana. The federal share of project costs is 80 percent.
Private Activity Bonds
SAFETEA-LU established a new financial assistance program that provides up to $15 billion in private activity bonds for transportation infrastructure projects. States and local governments are allowed to issue tax-exempt bonds to finance projects sponsored by the private sector. Eligible projects include privately owned or operated highway and rail-truck transfer facilities.
State Infrastructure Banks (SIB)
This program allows all states to set aside 10 percent of highway formula grants to establish revolving funds which can be used to provide loans and other credit tools to public or private sponsors for eligible transportation projects. Multi-state SIBs may also be utilized to fund
DRAFT
DRAFT
Chapter 2: Public Rail Program Activities in Indiana 2-14
projects that cross jurisdictional boundaries. States must provide 20 percent of the capitalization amount and debt must be repaid within 30 years.
Other Federal Programs Available for Rail-Related Funding
In addition to transportation programs available under the Transportation Authorization Bill, other programs are administered by federal agencies for which rail-related capital projects are eligible. These programs include:
U.S. Department of Commerce Economic Development Administration (EDA)
The U.S. Department of Commerce provides EDA grants for projects in economically distressed industrial sites that promote job creation or retention. Eligible projects must be located within EDA-designated redevelopment areas or economic development centers. Eligible rail projects include railroad spurs and sidings. The EDA also provides disaster recovery grants.
Grant assistance is available for up to 50 percent of the project, although EDA could provide up to 80 percent for projects in severely depressed areas.
An EDA Recovery Act grant of $2.23 million was provided in FY2010 to the City of Jasper to improve the Beaver Lake Dam protecting the road and rail system from further damage. In FY2008 Tell City and Perry County received $2 million for rail and bridge improvements, and $900,000 was granted to construct a rail spur at the Kendallville East Industrial Park.
U.S. Department of Agriculture Programs
The U.S. Department of Agriculture Community Facility Program and Rural Development Program provide grant or loan funding mechanisms to fund construction, enlargement, extension or improvement of community facilities providing essential services in rural areas and towns. Grant assistance is available for up to 75 percent of the project cost.
Eligible rail-related community facilities include transportation infrastructure for industrial parks and municipal docks.
2.6 Rail-Related Legislative Proposals Legislative proposals with potential to affect the rail industry are offered by federal and state legislative bodies, as well as the rail industry itself. The following are current legislative proposals that could affect the Indiana rail program over the near term.
Prospective Changes to Federal Rail Assistance Programs
As noted above, SAFETEA-LU, the current federal transportation funding authorization legislation, has been extended into 2011.

DRAFT
DRAFT
Chapter 2: Public Rail Program Activities in Indiana 2-15
Within SAFETEA-LU legislation, Congress established a National Policy and Revenue Commission to review transportation issues and to issue recommendations. The resulting report, Transportation for Tomorrow, calls for significant changes in the way national transportation needs are addressed in the future. Specifically, the Commission called for new program areas to better meet the nation’s economic reliance on transportation. Suggested new program areas which could be associated with the rail mode include: Asset Management; Freight Transportation; Congestion Relief-Metropolitan Mobility; Safe Mobility; Access to Small Cities and Rural Areas; and, Intercity Passenger Rail.
The report recommends that federal funding of these recommended programs be based on individual plans developed by each state and metropolitan area, as well as those developed by multi-state coalitions.
Railroad Track Maintenance Credit Program
This program, commonly known as the Short Line Tax Credit Program, was originally authorized within the Internal Revenue Code in 2005 to provide tax credits to qualified entities for an amount equal to 50 percent of qualified railroad maintenance expenditures. It applied to railroad tracks owned or leased by Class II or Class III railroads and ran through 2007. The maximum credit amount allowed was $3,500 per mile of track.
The Emergency Economic Stabilization Act of 2008 extended the tax credits through December 31, 2009 and also qualified railroad track maintenance expenditures made anytime during 2008 eligible for tax credits. The tax credit program was further extended through 2011 as part of the federal income tax extensions passed in late 2010. A number of short line railroads operating in Indiana have taken advantage of this program.
Freight Rail Infrastructure Capacity Expansion Legislative Proposal
This legislative proposal, endorsed by the Association of American Railroads (AAR), would provide a 25 percent tax incentive for projects that expand rail capacity. Eligible projects would include new track, intermodal facilities, and other projects that expand freight capacity. Railroads, as well as any businesses that make capacity-enhancing rail investments, would be eligible for the incentives.
2.7 Indiana Rail Studies Over the past decade, INDOT has sponsored or participated in a number of studies addressing both freight and passenger rail operations to determine the needs and benefits of the state’s rail system. A brief summary of these studies is provided below.

DRAFT
DRAFT
Chapter 2: Public Rail Program Activities in Indiana 2-16
2.7.1 Rail Freight Studies • 2002 Indiana State Rail Plan – This plan provided a broad view of the freight and
passenger rail industry in Indiana. The plan detailed the importance of the state’s freight industry in relation to the various sectors of Indiana’s economy. The plan also outlined some of the benefits and challenges faced by Indiana’s short line railroads and an overview of passenger rail planning activities and an analysis of existing services.
• INDOT Market Research Project, Perspective on Freight Stakeholders (2004) – This research study identified concerns of major shippers and carriers for consideration in the statewide planning process, and provided initial recommendations to INDOT regarding the integration of freight and goods mobility issues in the statewide plan. The Market Research Project can be found online at http://www.in.gov/indot/files/completePDFdocument.pdf
• Indiana Multimodal Freight and Mobility Plan (2009) – This entailed a comprehensive analysis of the current and future freight transportation system in Indiana. It identified gaps and needs, proposed solutions, and a methodology for evaluating freight projects. This project also included a 2009 State Rail Plan to direct Indiana’s future freight and passenger rail policy, provide a framework to guide future decisions regarding rail system investments, and ensure the efficient use of resources to support system-wide objectives. The Rail Plan was commissioned prior to the Passenger Rail Investment and Improvement Act and therefore did not comply with the State Rail Plan requirements included in the legislation. The Rail Plan is available online at http://www.in.gov/indot/files/FR_Indiana_Rail_Plan_07082009.pdf
2.7.2 Rail Passenger Studies • Northern Indiana/Northwest Ohio Routing Study (2002) – This study addressed the
financial and economic feasibility of alternative alignments in the Chicago-Cleveland corridor and provided recommended alternatives for further analysis. The study can be found online at http://www.in.gov/indot/files/NorthernIndiana_NorthwesternOhioRoutingStudy.pdf.
A number of rail passenger studies have also been undertaken to the feasibility of rail passenger services by INDOT, Indiana Metropolitan Planning Organizations and other transportation agencies. These include:
• Central Indiana Commuter Rail Feasibility Study (2008)
• West Side Corridor New Starts Study, Northern Indiana Committee Rail District
• Northeast Corridor Alternatives Analysis Completion Study: Evaluation of Alternatives

DRAFT
DRAFT
Chapter 2: Public Rail Program Activities in Indiana 2-17
Report, Indianapolis MPO, 2008 http://www.indympo.org/Plans/DiRecTionS/Documents/RTSAlternativesEval_Final.pdf
Passenger rail initiatives will be discussed in more detail in Chapter 9 of this document.
2.8 Indiana’s Involvement in Multi-State Planning The Indiana Legislature has passed enabled legislation that allows the state to participate in multistate compacts and other partnerships to study and establish passenger rail services. These compacts and partnerships include:
• The Midwest Interstate Passenger Rail Commission – This commission was formed by compact agreement in 2000 to promote, develop, and implement improvements to intercity rail passenger service in the Midwest. Current state members are Illinois, Indiana, Iowa, Kansas, Michigan, Minnesota, Missouri, Nebraska, North Dakota, Ohio, and Wisconsin.
• Midwest Regional Rail Initiative – INDOT participates in this ongoing effort to develop and expand access to an improved passenger rail system in the Midwest. Participating states are Illinois, Indiana, Iowa, Michigan, Minnesota, Missouri, Ohio, Nebraska, and Wisconsin.
• States for Passenger Rail Coalition – This coalition is an alliance of state departments of transportation that support intercity passenger rail initiatives and advocate for federal funding. Its mission is to promote the development, implementation, and expansion of intercity passenger rail services with involvement and support from state governments. Currently 32 states are members of the coalition.
• The American Association of State Highway Transportation Officials – Standing Committee on Rail Transportation – This committee is composed of rail officials from state departments of transportation. The Committee conducts conferences, prepares technical studies and reports, and advocates and promotes various federal issues and projects for both freight and intercity passenger rail improvements.

DRAFT
DRAFT
Chapter 3: Indiana Rail System Profile 3-1
Chapter 3: Indiana Rail System Profile The freight rail system in Indiana is comprised of three Class I railroads and 39 regional, local, and switching & terminal carriers. Class I railroads are defined by the Federal Surface Transportation Board (STB) as having more than $250 million in annual carrier operating revenue for three consecutive years in 1991 dollars. With inflation, the threshold as of 2009 was about $379 million. Class I carriers primarily operate long-haul service over high-density lines. Regional railroads operate at least 350 miles of track and/or have revenue of between $20 million and $250 million in 1991 dollars. They are considered “Class II” carriers. As of 2009 the lower threshold for Class II carriers with inflation was about $30 million. Short line railroads (Class III) operate less than 350 miles of track and have annual revenue of less than $30 million per year. Class III carriers can provide line-haul service and switching and/or terminal services for other railroads. A switching or terminal railroad company primarily performs switching service, and/or furnishes terminal trackage, bridges, or other facilities. Exhibit 3- 1 is a map of the Indiana freight rail network.

DRAFT
DRAFT
Chapter 3: Indiana Rail System Profile 3-2
Exhibit 3- 1: Indiana Rail Network
Source: Wilbur Smith Associates with INDOT data
The Indiana rail network is comprised of about 3,884 route miles of active rail lines. Of these, Class I carriers operate over 2,315 route miles, regional carriers operate over 269 route miles,

DRAFT
DRAFT
Chapter 3: Indiana Rail System Profile 3-3
local carriers operate over 1,107 route miles, and switching & terminal carriers operate over 194 miles of track.
The following is a profile of the railroads operating within Indiana and their principal line segments. The descriptions focus on the location of the rail lines, the lines’ physical and operational characteristics, railroad facilities located on the line and other information available from public sources.
3.1 Class I Railroads CSX and Norfolk Southern have extensive rail networks in Indiana. Each railroad’s principal east-west route passes through Indiana making the state a critical system component for transcontinental traffic and traffic moving between the East and Midwest. The Canadian National Railway (CN), through its Grand Trunk (GT) Railroad subsidiary, also serves the state albeit on a much more limited basis. CN recently expanded its access into Indiana through the acquisition of the Elgin, Joliet, & Eastern Railway (EJE).
Exhibit 3- 2 provides a summary of the rail route mileage owned and operated by Class I railroads within Indiana. In addition, a short summary of each of the Class I railroads’ major rail lines in the state is also provided. These descriptions provide the rail lines’ name and endpoints as designated by the railroad, its total length and the number of miles within Indiana, trackage rights granted to other railroads, connections with other rail carriers, operating speeds, signal systems, and any other information pertinent to the rail line.
Exhibit 3- 2: Indiana Class I Railroads
Class I Railroads Miles Leased
Miles Owned
Miles Owned, Not Operated
Miles Operated
Trackage Rights
Canadian National Railway 0 112 0 112 0 Canadian Pacific 0 0 0 0 197 CSX Transportation 15 1,237 225 1,027 259 Norfolk Southern Corporation 2 1,247 73 1,176 265 Union Pacific Railroad 0 0 0 0 4
Total 17 2,596 298 2,315 725 Source: INDOT/Class I RR Annual Reports
Most Class I railroad operations are controlled by signal systems. The two most common systems are Centralized Traffic Control (CTC) and Automatic Block Signaling (ABS).
Centralized Traffic Control is commonly found on high- or medium-density lines. CTC is a series of electronic switches, or interlockings, that are designed so that conflicting train movements cannot be authorized. A train dispatcher remotely controls signals and powered switches, generally over a long section of railroad. Train operators observe the controlled signals to authorize train movements.

DRAFT
DRAFT
Chapter 3: Indiana Rail System Profile 3-4
Automatic Block Signaling consists of a series of signals that govern blocks of track between signals. Under ABS, signals are automatically activated by the condition of the block beyond the signal, providing restrictive signal aspects to move between blocks so that safe braking distances are ensured if two trains attempt to enter the same block.
Rail lines without automatic signal systems are operated by Track Warrant Control (TWC). TWC is used primarily on medium- and low-density lines. TWC provides for a train dispatcher to verbally instruct the train to proceed, usually via radio. The dispatcher designates the stations or mileposts between which the train may move.
Exhibit 3- 3 displays the signaling systems of rail lines in Indiana, based upon data maintained by the U.S. Department of Transportation. Most rail lines listed as No Signal/Other are dispatched by TWC.
Exhibit 3- 3: Rail Signaling Systems in Indiana
Source: Wilbur Smith Associates with INDOT, USDOT data

DRAFT
DRAFT
Chapter 3: Indiana Rail System Profile 3-5
Class I railroads are primarily long-haul carriers. Rail traffic is sorted in a major classification yard and routed to smaller local yards where local switching locomotives directly serve rail customers, or to interchange points with short line railroads which complete pick-up or delivery to customers on their lines. Major classification yards and other yards located on major rail lines in Indiana will be identified for each railroad. Information on Class I railroads operating in Indiana is provided below.
3.1.1 CSX System CSX has an extensive rail network that covers 23 states east of the Mississippi River, shown in Exhibit 3- 4. It serves nearly every major economic and population center east of the Mississippi River and provides connections to western U.S. markets at Chicago, St. Louis, Memphis, and New Orleans. CSX serves all major Atlantic ports with major intermodal operations connecting the Ports of New York and New Jersey, Philadelphia, Baltimore and Norfolk with Midwest markets.
Exhibit 3- 4: CSX Network
Source: CSX website

DRAFT
DRAFT
Chapter 3: Indiana Rail System Profile 3-6
CSX operates over 1,000 route miles in Indiana. Major classification yards in Indiana are Avon Yard located in Indianapolis and Evansville Yard. All CSX main lines within Indiana can accommodate rail cars with gross weights of up to 286,000 pounds, the current industry accepted capacity standard. Some CSX branch lines within the state cannot accommodate these heavier railcars.
Exhibit 3- 5 is a map of CSX’s major rail lines in Indiana labeled by their commonly used line names.
Exhibit 3- 5: CSX Subdivisions
Source: Wilbur Smith Associates
DRAFT
DRAFT
Chapter 3: Indiana Rail System Profile 3-7
Descriptions of CSX rail lines are as follows:
• Barr Subdivision – This former B&O rail line extends 26.8 miles from Willow Creek, IN west to Blue Island, IL with a total of 17.4 miles within Indiana. Amtrak operates over this line between Willow Creek and Pine Jct. At Willow Creek the Barr Subdivision connects to CSX’s Porter and Garrett Subdivisions. The line also connects to the CSX Ft. Wayne Subdivision at Pine Jct. and the Indiana Harbor Belt Railroad and the EJ&E at Clark Jct. Local service is provided at Whiting Yard. The line is double track with authorized speed of 60 mph for freight trains and 79 mph for passenger trains. Trains are controlled by CTC. This line is part of CSX’s core intermodal system.
• Garrett Subdivision – This former B&O line extends from Deshler, OH to Willow Creek, IN with approximately 126 miles within Indiana. Amtrak also operates over this line. At Willow Creek the line connects with CSX’s Barr and Porter Subdivisions. The line connects with CP at Wellsboro and with NS at Walkerton, Milford Jct., and St. Joe. Local service is provided at Garrett Yard. The line is double track with speeds of 50 to 60 mph for freight and 79 mph for passenger trains. Operations are controlled by CTC. This line is part of CSX’s core intermodal system.
The Barr and Garrett subdivisions form one of CSX’s major east-west mainlines through Indiana between Willard, OH and Chicago, IL.
• St. Louis Line Subdivision – This former Conrail line extends approximately 224 miles from Indianapolis to East St. Louis, IL. A total of 67 miles lie within Indiana. The line connects with CSX’s Lafayette Subdivision at Greencastle and CE&D Subdivision and Danville Secondary line at Terre Haute. Avon Yard is located on this line. Local service is also provided at Duane Yard in Terre Haute. The line is double track with maximum speeds of 50 mph for freight and 60 mph for intermodal trains. Operations are controlled by CTC. This line is part of CSX’s core intermodal system.
• Indianapolis Belt Subdivision – This 12.1 mile long line connects the St. Louis Subdivision with the Indianapolis Line Subdivision around the city of Indianapolis. Hawthorne Yard is located adjacent to this line. This single track line has a maximum authorized speed of 10 mph. Operations over the line are via Traffic Warrant Control (TWC).
• Indianapolis Line Subdivision – This line extends a total of 140.2 miles between Indianapolis and Bellefontaine, OH. A total of 96.3 miles lie within Indiana. At its western end it connects with the Indianapolis Belt Subdivision. The line connects with NS at Anderson and Muncie and the Central Indiana & Western RR at Anderson. Local service is provided at So. Anderson Yard. This double track line has maximum authorized speeds of 50 mph for freight and 60 mph for intermodal trains. Train

DRAFT
DRAFT
Chapter 3: Indiana Rail System Profile 3-8
operations are conducted via a combination of CTC and ABS. This line is part of CSX’s core intermodal system.
The St. Louis, Indianapolis Belt, and Indianapolis Line Subdivisions form a major CSX east-west corridor across Indianapolis connecting St. Louis and Cleveland, OH.
• Illinois Subdivision – This former B&O line extends 159 miles between East St. Louis, IL and Washington, IN. A total of 18.2 miles lie within Indiana. The line connects with CSX’s Indiana Subdivision at its eastern end and CE&D Subdivision at Vincennes. The line also connects to the Indiana Southern RR at Chappel. The single track line allows maximum speeds of 25 to 35 mph and is controlled by ABS.
• Indiana Subdivision – This former B&O line extends 169 miles between Washington, IN and Cincinnati, OH. A total of 148.6 miles lie within Indiana. The line connects with CSX’s Illinois Subdivision at its eastern end and also with its Hoosier Subdivision at Mitchell. In addition, it connects with the Central Railroad Co. of Indiana at Lawrenceburg and the Madison RR at N. Vernon. The line is single track with maximum speeds ranging between 25 and 40 mph. Train operations are controlled by a combination of CTC and ABS.
The Illinois and Indiana Subdivisions together form a third CSX east-west corridor through Indiana connecting East St. Louis to Cincinnati.
• CE&D Subdivision – This line extends a total of 147.5 miles from Danville Junction to South Ingle. The entire line lies within Indiana. CP Rail has trackage rights over this line. The line connects with CSX’s Decatur Subdivision at Hillsdale, St. Louis Subdivision at East Haley, Illinois Subdivision at Vincennes, and the Evansville Terminal Subdivision at North Ingle. The line also connects with NS at Princeton. Local services are provided at Breyer Yard near Danville, Baker Yard in Terre Haute, Alice Yard in Vincennes, and Wasford Yard in Evansville. This single track line has maximum operating speeds ranging from 40 to 60 mph. Train operations are controlled by CTC. This line is part of CSX’s core intermodal network and serves as its north-south corridor between Chicago and Evansville.
• Grand Rapids Subdivision – This line extends 114.5 miles from Grand Rapids, MI to Porter, IN. Approximately 18 miles lie within Indiana. Amtrak also operates over the line. The line is single track with maximum allowable speeds of 50 mph for freight and ranges of 50 to 79 mph for passenger trains. Operations are conducted via CTC protection.
• Porter Subdivision – This former Michigan Central line extends a total of 19.2 miles between CSX’s Grand Rapids Subdivision to Ivanhoe. The line connects with CSX’s

DRAFT
DRAFT
Chapter 3: Indiana Rail System Profile 3-9
Garrett Subdivision at Willow Creek and Fort Wayne Subdivision at Tolleston. CSX currently does not use this line east of Willow Creek, but UP uses it via trackage rights to reach NS’ Elkhart Yard. This line is single track with maximum operating speeds of 40 mph. Train operations are controlled via ABS protection.
• Monon Subdivision – This former Monon Railroad line extends a total 90.1 miles between Maynard and the CSX Lafayette Subdivision. Amtrak has trackage rights over this line. NS connects to the line at St John and Shelby. CN (EJ&E) also connects to the line at Dyer, and the Toledo, Peoria & Western Railroad connects at Reynolds. Local service is provided at Monon Yard. This line is single track with authorized speeds of 40 to 50 miles per hourfor freight and 50 to 79 mph for passenger trains. Train operations are controlled by ABS.
• Lafayette Subdivision – This former Monon Railroad line extends a total of 73.6 miles between Farmers Crossing and Cloverdale. The line connects to the Monon Subdivision at its northern end and also connects to CSX’s St. Louis Subdivision near Greencastle and Crawfordsville Branch at Ames Jct. Amtrak and NS have trackage rights over the line. This line connects to NS and the Kankakee, Beaverton & Southern Railroad at Lafayette Junction. Local service is provided at Lafayette and Monon Yards. This single track line has authorized speeds of 40 to 50 mph for freight and 50 to 79 mph for passenger trains. Train operations are controlled by ABS.
• Crawfordsville Branch Subdivision – This line extends a total of 33.6 miles between Ames, where it connects to the Lafayette Subdivision to Clermont, where it connects to CSX’s Frankfort Subdivision. Amtrak has trackage rights over this line. This single track line has authorized speeds of 50 mph for freight and 60 to 70 mph for passenger trains. Train operations are controlled via TWC.
• Frankfort Secondary Subdivision – This line extends a total of 37 miles between Clermont, where it connects to the Crawfordsville Branch Subdivision to Frankfort. The line connects to NS at Frankfort. This single track line has a maximum authorized speed of 25 mph with trains controlled via TWC.
• Indianapolis Subdivision – This line extends a total of 99.6 miles between Indianapolis and Cincinnati. Approximately 78.3 miles lie within Indiana. The line connects with the Indianapolis Line, Indianapolis Belt and Shelbyville Secondary Subdivisions at its western end and the Cincinnati Terminal Subdivision at its eastern end. Amtrak has trackage rights over the line. Bunge Corporation operating as Honey Creek Railroad connects to the line at Rushville and the C&NC Railroad connects at Connersville. Local service is provided at Connersville and Cottage Grove Yards. The line is single track with authorized speeds of 40 to 50 mph for freight and 50 to 60 mph for passenger trains. Train operations are controlled via ABS.

DRAFT
DRAFT
Chapter 3: Indiana Rail System Profile 3-10
• Hoosier Subdivision – This former Monon Railroad line extends a total of 72.2 miles between Bedford and the Indiana/Kentucky state line near Louisville. The line connects to the Indiana Rail Road at its northern end and NS at the southern end. It also connects with the CSX Indiana Subdivision at Mitchell. This single track line has a maximum authorized speed limit of 30 to 40 mph. Train operations are controlled via ABS.
• Decatur Subdivision – This line extends a total of 84.3 miles from the CE&D Subdivision at Hillsdale, IN to Decatur, IL. Approximately 8 miles lie within Indiana. This line is single track with an authorized speed of 25 mph. Train operations are controlled via TWC.
• Dansville Secondary Subdivision – This line extends a total of 41.2 miles from the St. Louis Subdivision near St. Mary’s, IN to Vermillion Grove, IL. A total of 8 miles lie within Indiana. This line is single track with an authorized speed of 25 mph. Train operations are controlled via TWC.
• Shelbyville Secondary Subdivision – This line extends a total of 28.3 miles between Mack and Indianapolis Subdivision at Indianapolis. The line also connects to the Indianapolis Belt Subdivision. Local service is provided at Hill Yard in Indianapolis. This line is single track with authorized speeds ranging from 10 to 25 mph. Train operations are controlled via TWC.
• Louisville Secondary Subdivision – This line extends a total of 4 miles between the Indianapolis Subdivision and the Louisville & Indiana RR. The line also connects to the Indianapolis Belt Subdivision at Dale. This single track line has a maximum authorized speed of 10 mph and operations are controlled via TWC.
• Evansville Terminal Subdivision – This line serves the terminal area around Evansville, IN including the Port of Evansville. Access to the Evansville Terminal line is via the CE&D Subdivision. Authorized speeds within the terminal area are generally 10 mph and operations are controlled via CTC.
3.1.2 Norfolk Southern Norfolk Southern (NS) has significant operations east of the Mississippi River serving nearly all metropolitan areas. Its gateways to the west are Chicago, Kansas City, St. Louis, Memphis, New Orleans, and through haulage rights, Dallas. NS focuses its international operations on the Port of Norfolk. NS’ major classification yard in Indiana is located at Elkhart.
The Norfolk Southern rail network is shown in Exhibit 3- 6.

DRAFT
DRAFT
Chapter 3: Indiana Rail System Profile 3-11
Exhibit 3- 6: Norfolk Southern Network
Source: Norfolk Southern website
Exhibit 3- 7 is a map of major NS rail lines in Indiana which are labeled with their commonly used line names.

DRAFT
DRAFT
Chapter 3: Indiana Rail System Profile 3-12
Exhibit 3- 7: Norfolk Southern Subdivisions
Source: Wilbur Smith Associates

DRAFT
DRAFT
Chapter 3: Indiana Rail System Profile 3-13
Descriptions of NS rail lines within Indiana are as follows:
• Chicago Line – This former Conrail line extends a total of 342.1 miles between Cleveland and Chicago with approximately 153 miles within Indiana. Amtrak has trackage rights over the line and CP Rail has trackage rights west of Butler. The line connects with NS’ Huntington Division at Butler, Marion District at Goshen, Kalamazoo Line at Elkhart, and Kankakee Line at Gary. It also connects to CSX at Porter, CN at South Bend, Evansville Western RR at Elkhart, Chicago, Southshore and South Bend RR at New Carlisle, EJ&E at Buffington, and Indiana Harbor Belt RR at Gary. Local service is provided at Elkhart Yard, Olivers Yard at South Bend, and Colehour Yard at Gary. The line is double track with CTC signal protection. Speed limits on the line are 50 mph for freight trains. This line is part of NS’ intermodal network.
• Chicago District – This line extends a total of 151.4 miles between Ft. Wayne and Forest Hills, IL. A total of 137.4 miles lie within Indiana. The line connects with NS’ Huntington and New Castle Districts at Fort Wayne, Marion District at Claypool, Michigan City District at Argos, and Kankakee Line at Gary. The line also connects with the Chicago, Ft. Wayne & Eastern RR at Fort Wayne, Fulton County RR at Argos, Chesapeake & Indiana RR at Thomaston, CN at Spriggsboro, EJ&E at Van Loon, and Indiana Harbor Belt RR at Gary. This line is primarily single track with a maximum authorized speed of 50 mph. Trains operate via CTC protection. This line is part of NS’ intermodal network.
• Fostoria District – This former Norfolk & Western line extends a total of 119.2 miles between Bellevue, OH and Fort Wayne, IN. Approximately 13.7 miles of the line lie within Indiana. This line connects with NS’ Huntington District and Woodburn Branch at New Haven. Local operations are provided at East Wayne Yard. The line is single track and controlled by CTC protection with maximum speeds of 50 mph. This line is part of NS’ intermodal network.
• Lafayette District – This line extends a total of 172 miles between Peru, IN and Decatur, IL. A total of 90 miles lie within Indiana. The line connects with CSX and the Kankakee, Beaverville & Southern RR at both Lafayette and Danville, and with the Winamac Southern RR and the Toledo, Peoria & Western Railway at Logansport. Local operations are provided at East Yard at Lafayette, Logansport Yard, and Peru Yard. The line is single track with a maximum operating speed of 50 mph. Train operations are controlled by CTC.
• Huntington District – This line extends at total of 107.6 miles between Montpelier, OH and Peru, IN. A total of 86.6 miles lie within Indiana. The line connects with the NS Chicago Line at Butler, Chicago and New Castle Districts at Ft. Wayne, and Marion

DRAFT
DRAFT
Chapter 3: Indiana Rail System Profile 3-14
District at Wabash. It also connects with CSX at St. Joe and the Chicago, Ft. Wayne, & Eastern RR at Ft. Wayne. Local service is provided at Peru Yard. This line is single track with a maximum allowable speed of 50 mph. Train operations are controlled via CTC.
• Southern West District – This line extends a total of 158.4 miles from St. Louis to NS’ Southern West District at Princeton, IN. A total of 11.6 miles lie within Indiana. The line connects with CSX at Princeton. This line is single track with a maximum operating speed of 50 mph. Train operations are controlled by ABS.
• Southern East District – This line extends a total of 102.5 miles from Princeton, IN to the Louisville, KY area. The line connects with NS’ Evansville Branch and the Dubois County RR at Huntingburg, CSX at New Albany, the Indiana Southern RR at Oakland City, and the Lucas Oil Rail Line at Corydon Jct. Local operations are provided at Huntingburg Yard. This line is single track with maximum operating speeds of 45 to 50 mph. Train operations are controlled by ABS.
The above lines form NS’ four major east-west lines across Indiana. The Chicago Line and the Chicago/Fostoria Districts extends from Chicago to major Ohio markets, the Lafayette/ Huntington Districts connect St. Louis and Kansas City to major Michigan markets, and the Southern East and West Districts connect St. Louis to Louisville, KY.
• New Castle District – This former Conrail line extends a total of 169.3 miles between Mill, OH near Cincinnati and Fort Wayne, IN. Approximately 117.2 miles of the line lie within Indiana. The line connects with NS’ Chicago District at Ft. Wayne, Huntington District at Hugo, and Frankfort District at Muncie. The line also connects with CSX at Muncie, the Chicago, Ft. Wayne & Eastern RR at Ft. Wayne, the Wabash Central RR at Bluffton, the C&NC RR at New Castle, and the Indiana Eastern RR at Richmond. The line is single track with CTC signal protection. Maximum speeds are 50 mph.
• Marion Branch – This line extends a total of 111 miles between Goshen and Anderson. The line connects to NS’ Chicago Line at Goshen, Chicago District at Claypool, Huntington District at Wabash, Red Key line at Marion, and Frankfort District at Alexandria. The line also connects to CSX at Milford and Anderson, to the Chicago, Ft. Wayne & Eastern RR at Warsaw, the Central Railroad of Indianapolis at Marion, and the Central Indiana & Western RR at Anderson. The line is single track with maximum speeds of 45 to 50 mph. Train operations are controlled via CTC.
The New Castle District and Marion Branch comprise NS’ two major north-south routes within Indiana.
• Kalamazoo Branch – This line extends a total of 102.3 miles between Elkhart, IN and Grand Rapids, MI. A total of 14.8 miles lie within Indiana. This line is single track with a

DRAFT
DRAFT
Chapter 3: Indiana Rail System Profile 3-15
maximum speed of 50 mph. Train operations are controlled by CTC.
• Frankfort District – This line extends a total of 97.3 miles between Frankfort and Hale. The line connects with NS’ Frankfort Branch at Frankfort, the Marion Branch at Alexandria, the New Castle District at Muncie, and the Red Key Branch at Red Key. The line also connects with CSX at Frankfort and Muncie. The line is single track with a maximum speed of 49 mph. Train operations are controlled by TWC.
• Frankfort Branch – This line extends a total of 24 miles between Frankfort and Lafayette. The line connects with NS’ Frankfort District at Frankfort and the Kokomo Spur at Tipton. Local operations are provided at Frankfort Yard and East Yard at Muncie. The line is single track with a maximum speed of 49 mph. Train operations are controlled via CTC.
• Michigan City Branch – This line extends 27.3 miles between Argos and Kankakee. The line connects to the NS Chicago District at Argos, CSX at Walkerton, and CN at Stillwell. It also connects to the Fulton County RR at Argos, the Chicago, Ft. Wayne & Eastern RR at Plymouth, and the Chicago, South Shore & South Bend RR at Stillwell. The line is single track with maximum operating speeds of 25 to 40 mph. Train operations are controlled via TWC.
• Kankakee Line – This line extends 27.1 miles between the Indiana Harbor Belt RR at Gibson and Schneider. The line connects with the NS Chicago District at Osborne and Kankakee Branch at Schneider. It also connects with CN at Hays, the EJ&E at Hartsdale, and CSX at St. John. The line is single track with maximum operating speeds of 35 to 45 mph. Train operations are controlled via CTC.
• Kankakee Branch – This line extends a total of 130 miles between Nipsco, IN and Hennepin, IL. A total of 31.2 miles lie within Indiana. The line connects to the NS Kankakee Line at Scheider and with CSX at Shelby. The line is single track with a maximum operating speed of 30 mph. Train operations are controlled via TWC.
• Evansville Branch – This line extends 46.8 miles from Evansville to Huntingburg. The line connects with NS’ Yankeetown Branch at Booneville, Rockport Branch at Rockport Jct., and Southern East District at Huntingburg. It also connects with CSX at Evansville. This line is single track with maximum operating speeds of 35 mph. Train operations are controlled by TWC.
• Rockport Branch – This line extends 13 miles between Rockport and Rockport, Jct. The line connects with the NS Evansville Branch at Rockport Jct. The line is single track with a maximum operating speed of 25 mph. Train operations are controlled by TWC.

DRAFT
DRAFT
Chapter 3: Indiana Rail System Profile 3-16
3.1.3 Canadian National The Canadian National (CN) Railway operates primarily in Canada but serves a number of major markets in the U.S. through its Grand Trunk subsidiary.
Exhibit 3- 8 is a map of CN’s rail network.
Exhibit 3- 8: Canadian National Network
Source: Canadian National
Within Indiana, the Canadian National RR operates primarily between Chicago and Gary, and from Griffith to South Bend and north into Michigan. CN owns and operates a total of 112 miles of rail line in Indiana. CP Rail has trackage rights over CN’s system in Indiana. CN also purchased the Elgin, Joliet & Eastern Rwy. (EJ&E) in 2009.
3.1.4 Canadian Pacific Railway The Canadian Pacific Railway (CP), through its Soo Line subsidiary, serves Indiana via 197 miles of trackage rights over other Class I railroads. CP trackage rights are primarily over the CN lines described above.
3.1.5 Union Pacific The Union Pacific Railroad (UP) serves Indiana via four miles of trackage rights in the East Chicago area.
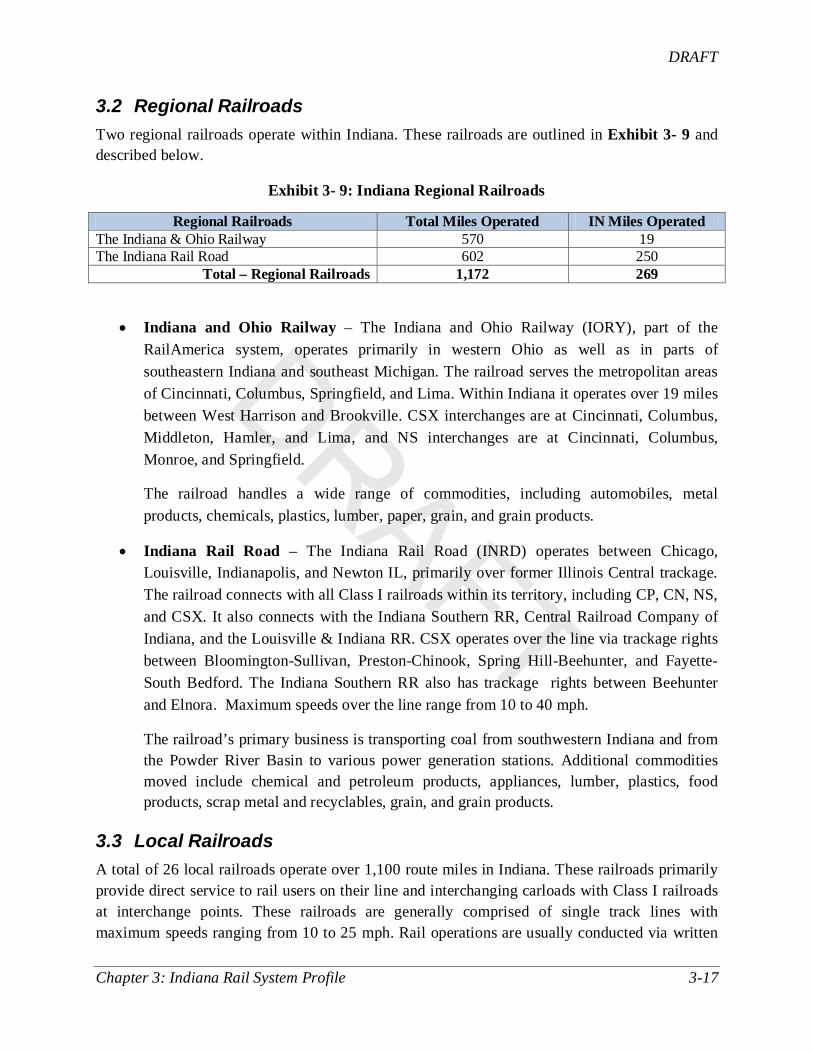
DRAFT
DRAFT
Chapter 3: Indiana Rail System Profile 3-17
3.2 Regional Railroads Two regional railroads operate within Indiana. These railroads are outlined in Exhibit 3- 9 and described below.
Exhibit 3- 9: Indiana Regional Railroads
Regional Railroads Total Miles Operated IN Miles Operated The Indiana & Ohio Railway 570 19 The Indiana Rail Road 602 250
Total – Regional Railroads 1,172 269
• Indiana and Ohio Railway – The Indiana and Ohio Railway (IORY), part of the RailAmerica system, operates primarily in western Ohio as well as in parts of southeastern Indiana and southeast Michigan. The railroad serves the metropolitan areas of Cincinnati, Columbus, Springfield, and Lima. Within Indiana it operates over 19 miles between West Harrison and Brookville. CSX interchanges are at Cincinnati, Columbus, Middleton, Hamler, and Lima, and NS interchanges are at Cincinnati, Columbus, Monroe, and Springfield.
The railroad handles a wide range of commodities, including automobiles, metal products, chemicals, plastics, lumber, paper, grain, and grain products.
• Indiana Rail Road – The Indiana Rail Road (INRD) operates between Chicago, Louisville, Indianapolis, and Newton IL, primarily over former Illinois Central trackage. The railroad connects with all Class I railroads within its territory, including CP, CN, NS, and CSX. It also connects with the Indiana Southern RR, Central Railroad Company of Indiana, and the Louisville & Indiana RR. CSX operates over the line via trackage rights between Bloomington-Sullivan, Preston-Chinook, Spring Hill-Beehunter, and Fayette- South Bedford. The Indiana Southern RR also has trackage rights between Beehunter and Elnora. Maximum speeds over the line range from 10 to 40 mph.
The railroad’s primary business is transporting coal from southwestern Indiana and from the Powder River Basin to various power generation stations. Additional commodities moved include chemical and petroleum products, appliances, lumber, plastics, food products, scrap metal and recyclables, grain, and grain products.
3.3 Local Railroads A total of 26 local railroads operate over 1,100 route miles in Indiana. These railroads primarily provide direct service to rail users on their line and interchanging carloads with Class I railroads at interchange points. These railroads are generally comprised of single track lines with maximum speeds ranging from 10 to 25 mph. Rail operations are usually conducted via written

DRAFT
DRAFT
Chapter 3: Indiana Rail System Profile 3-18
or radio train orders. Local railroads operating in Indiana are outlined in Exhibit 3- 10 and described below.
Exhibit 3- 10: Local Railroads in Indiana
Local Railroads Miles Leased
Miles Owned
Miles Operated
Bee Line 0 11 11 Central Railroad of Indiana 0 64 64 Central Railroad of Indianapolis 0 27 27 Chesapeake and Indiana Railroad Company 33 0 33 Chicago, Ft. Wayne & Eastern Railroad 169 0 169 Chicago, South Shore, & South Bend RR 62 0 62 City of Auburn Port Authority 0 2 2 Dubois County Railroad 16 0 16 Elkhart & Western Railroad Co. 0 10 10 Evansville Western Railway 0 30 30 Fulton County, LLC 0 14 14 Gary Railway Company 0 72 72 Grand Elk Railroad 13 0 13 Honey Creek/Bunge Corporation 0 5 5 Hoosier Southern Railroad 0 22 22 Indiana Eastern Railroad 30 0 30 Indiana Northeastern Railroad Company 0 45 45 Indiana Southern Railroad, Inc. 0 191 191 Kankakee, Beaverville & Southern Railroad 0 65 65 Louisville & Indiana Railroad Company 0 106 106 Lucas Rail Lines 0 10 10 Madison Railroad 0 26 26 Ohio Valley Railroad Company 0 3 3 Southern Indiana Railway 0 8 8 U S Rail Corporation 13 0 13 Toledo, Peoria & Western Railroad Corp. 0 61 61
Total – Local Railroads 336 771 1,107 Source: Indiana DOT
• Bee Line Railroad – The Bee Line (BLEX), which is operated by the Kankakee, Beaverville & Southern RR extends 11 miles between its interchange with KB&S RR at Handy and Steward. Major commodities carried include corn and soybeans.
• Central Railroad of Indiana – The Central Railroad of Indiana (CIND), a part of the RailAmerica system, operates over 64 miles of rail line from Shelbyville to the Indiana and Ohio border, continuing to Cincinnati. The railroad interchanges with CSX, NS, the Indiana Rail Road, and the Louisville & Indiana RR near Indianapolis. Major

DRAFT
DRAFT
Chapter 3: Indiana Rail System Profile 3-19
commodities carried include grain, soybeans, chemicals, automobiles, steel and aggregates.
• Central Railroad of Indianapolis – The Central Railroad of Indianapolis (CERA), a part of the RailAmerica system, operates over 27 miles of rail line between Kokomo and Marion, and between Marion and Amboy in north central Indiana. The railroad interchanges with NS and US Rail Corp. at Kokomo and with NS at Marion. Trackage rights are provided to NS between Kokomo and Tipton, to the Toledo, Peoria & Western RR between Amboy-Marion and Kokomo-Marion, and to the Central RR of Indiana between Frankfort and Kokomo. Major commodities carried are corn, soybean, wheat and fertilizer.
• Chesapeake & Indiana Railroad – The Chesapeake & Indiana Railroad (CKIN), owned by the Town of North Judson and operated under lease by the Indiana Boxcar Corp., operates in northwestern Indiana. From La Crosse, it operates over 40 miles of rail line to Malden, North Judson, and Wellsboro. The railroad interchanges with NS at Thomason and with CSX at Wellsboro. Major commodities carried are grain and fertilizer.
• Chicago, Ft. Wayne & Eastern RR – The Chicago, Ft. Wayne & Eastern RR (CFE), a part of the Rail America system, operates 33 miles between Tolleston, IN and Crestline, OH over trackage leased from CSX. The railroad interchanges with NS at Ft. Wayne. NS has trackage rights over the line. Major commodities carried include grain, steel, paper, and chemicals.
• Chicago, South Shore & South Bend RR – The Chicago, South Shore & South Bend RR (CSSB) operates 156 miles of rail line from Chicago to South Bend and south to Kingsbury, IN. The railroad interchanges with CSX at Miller, with NS at South Bend, and with the EJ&E at Gary. Major commodities carried are steel, roofing materials, and coal.
• City of Auburn Port Authority RR – The City of Auburn Port Authority RR (CAPA) extends 2.4 miles between Auburn Jct. and Auburn. The railroad interchanges with CSX at Auburn Jct. The major commodity carried is plastic resin.
• Dubois County Railroad – The Dubois County Railroad (DCRR), a subsidiary of the Indiana Railway Museum, extends 16 miles from Huntingburg to Dubois. The railroad interchanges with NS at Huntingburg. Major commodities carried are soybean meal and petroleum products.
• Elkhart & Western Railroad – The Elkhart & Western Railroad (EWR), a wholly-owned subsidiary of Pioneer Railcorp, operates over 10 miles of track west of Elkhart and NS’ line between Walkerton and Argos. The railroad interchanges with NS at

DRAFT
DRAFT
Chapter 3: Indiana Rail System Profile 3-20
Elkhart. Major commodities carried are auto frames, cement, lumber, food products, plastic, and aggregates.
• Evansville Western Railway – The Evansville Western Railway (EVWR), a subsidiary of Four Rivers Transportation, operates over 78 miles of rail line between Evansville and Okawville, IL, including a branch line at Mt. Vernon. The railroad interchanges with CSX at Evansville. Major commodities moved include coal, grain, food products, chemicals, fertilizers, lumber and building materials.
• Fulton County Railroad – The Fulton County Railroad (FC) operates over 15 miles of rail line between Rochester and Argos. Trackage rights are provided to NS, Central RR of Indiana, and Central RR of Indianapolis. The railroad interchanges with NS at Argos. Major commodities moved are grain and fertilizer. Train service operations are suspended.
• Gary Railway Company – The Gary Railway (GRW) is owned and operated by Transtar, Inc., a subsidiary of United States Steel Corp. The railroad operates over 72 miles of yard track throughout Gary. The railroad interchanges with CN at Gary as well as with several other Class I carriers connected along the lines of the former EJ&E. The railroad serves US Steel and four other steel-related industries within the US Steel complex.
• Grand Elk Railroad – The Grand Elk Railroad (GDLK), which is owned by Watco Companies, operates over 13 miles of rail line between Elkhart and Grand Rapids, MI. The railroad leases the line from NS and interchanges with NS at Elkhart. Major commodities moved include automotive parts, plastics, metals, forest and agricultural products, and aggregates.
• Honey Creek Railroad – The Honey Creek Railroad (HCRR) owned by Bunge Corporation operates over 5 miles of mainline between Rushville and Sexton. The railroad interchanges with CSX at Rushville. Major commodities carried are grain and fertilizer.
• Hoosier Southern Railroad – The Hoosier Southern Railroad (HOS) is owned and operated by the Perry County Port Authority. The railroad operates over 22 miles of rail line between Lincoln City and Cannelton, interchanging with NS at Lincoln City. Major commodities carried include pig iron, sand, and clay.
• Indiana Eastern Railroad – The Indiana Eastern Railroad (IERR), a subsidiary of Respondek Railroad, operates over 23 miles of rail line between Richmond and Fernald, OH over track leased from CSX. The railroad interchanges with CSX at Cottage Grove. Trackage rights are provided to NS between Richmond and Boston. Major commodities

DRAFT
DRAFT
Chapter 3: Indiana Rail System Profile 3-21
moved include coal, grain, scrap metal, fertilizer and chemicals.
• Indiana Northeastern Railroad – The Indiana Northeastern Railroad (INE) operates over 45 miles of rail line between South Milford and Montpelier, OH. From Steubenville it also extends north to Hillsdale, MI. The railroad interchanges with NS at Montpelier. Major commodities moved include grain, coal, fertilizer, flour, plastics, scrap metals, and lumber.
• Indiana Southern Railroad – The Indiana Southern Railroad (ISRR), which is part of the RailAmerica system, operates over 191 miles of rail line between Indianapolis and Evansville. The railroad interchanges with CSX at Indianapolis and Evansville, with NS at Oakland City Jct., and with the Indiana Rail Road at Bee Hunter and Switz City. Trackage rights are provided to CP between Elnora and Washington, and to CSX and CP between Washington and Lynnville. Major commodities carried include coal and agricultural commodities.
• Kankakee, Beaverville & Southern Railroad – The Kankakee, Beaverville & Southern RR (KBSR) operates over 65 miles of rail line between Kankakee, IL, Danville, IL and Lafayette, IN. Within Indiana it also operates branch lines between Sheff and Free, and between Handy and Steward. The railroad interchanges with both CSX and NS at Lafayette. Major commodities moved include grain, seeds, agricultural chemicals, and plastics.
• Louisville & Indiana Railroad – The Louisville & Indiana Railroad (LIRC), a subsidiary of the Anacostia & Pacific Co., operates over 106 miles of rail line between Indianapolis and Louisville, KY. CSX has trackage rights over various portions of the line. The railroad interchanges with CSX at Indianapolis and Seymour and with the Indiana Rail Road at Indianapolis. Major commodities moved include cement, chemicals, food products, grain, lumber, manufactured goods, paper, plastics, scrap, and steel.
• Lucas Rail Lines – The Lucas Rail Line (LORL), owned by Lucas Oil Co., operates over 10 miles of rail line between Corydon and Corydon Jct. where it interchanges with NS. Major commodities moved are oil and fuel additives.
• Madison Railroad – The Madison Railroad (CMPA), a division of the City of Madison Port Authority, operates over 26 miles of rail line between Madison and North Vernon where it interchanges with CSX. The railroad also owns and operates 17 miles of track within an industrial park offering a team track and railcar storage facilities. Major commodities carried include polyethylene, coal byproducts, and steel coils.
• Ohio Valley Railroad – The Ohio Valley Railroad (OVR), a division of the Ohio Valley Railroad Co., is located off of and interchanges with the Indiana Southwestern Railroad

DRAFT
DRAFT
Chapter 3: Indiana Rail System Profile 3-22
in the Evansville area. The three mile line is primary used to access a repair shop for rolling stock and car storage.
• Southern Indiana Railway – The Southern Indiana Railway (SIND) operates over 8 miles of rail line between Watson, Sellersburg, and Speed. The railroad interchanges with CSX at Watson. The major commodity carried is cement.
• US Rail Corporation – The US Rail Corporation (USRP) operates over 13 miles of rail line between Kokomo and Logansport, Logansport and Bringhurst, and between Amboy and Marion. These lines are leased from the Winamac Southern RR. The railroad interchanges with NS at Logansport, Clymers and Marion, with the Toledo, Peoria & Western Railway at Logansport, and with the Central Railroad of Indianapolis at Kokomo. Major commodities carried include grain and fertilizer.
• Toledo, Peoria & Western Railway – The Toledo, Peoria & Western Railway (TPW), part of the RailAmerica system, operates from Logansport to Mapleton, IL. It also operates between Trimmer Jct. and Winamac and between North Judson and Monterey. Total track mileage is approximately 61 miles. The railroad interchanges with CSX at Reynolds, NS at Logansport and Marion, the Central Railroad of Indianapolis at Kokomo, and US Rail Corp. at Logansport and Van Jct. The Central RR of Indianapolis has trackage rights between Van and Logansport. Major commodities include corn, agricultural products, and fertilizer.
3.4 Switching and Terminal Railroads Exhibit 3- 11 lists the switching and terminal railroads operating in Indiana.
Exhibit 3- 11: Indiana Switching and Terminal Railroads
Switching & Terminal Railroads Miles Leased
Miles Owned
Miles Operated
C & NC Railroad Corporation 0 27 27 Central Indiana & Western Railroad 0 9 9 Indian Creek Railroad 0 5 5 Indiana Harbor Belt Railroad Company 0 26 26 Indiana Southwestern Railway Company 0 26 26 Kendallville Terminal Railway Company 0 2 2 Maumee & Western Railroad Company 0 3 3 MG Rail, Inc. 11 0 11 Vermillion Valley Railroad Company 6 0 6 Wabash Central Railroad Corporation 0 26 26 Winamac Southern Railway Company 0 52 52
Total – Switching & Terminal Railroads 17 176 194 Source: Indiana DOT

DRAFT
DRAFT
Chapter 3: Indiana Rail System Profile 3-23
The switching and terminal railroads operating in Indiana, which generally have the same operating attributes as local railroads, are described below.
• C&NC Railroad – The C&NC Railroad (CNC) operates over 27 miles of track between Connersville and New Castle. The railroad interchanges with CSX at Connersville and with NS at New Castle. The major commodity carried is salt.
• Central Indiana & Western Railroad – The Central Indiana & Western Railroad (CEIW) operates over nine miles of rail line between Anderson and Lapel. The railroad interchanges with both CSX and NS at Anderson. Major commodities carried are glass-making materials such as silica sand, soda ash and cullet.
• Indian Creek Railroad – The Indian Creek Railroad (ICRK), owned by Rydman & Fox, Inc., operates over 5 miles of rail line between Anderson and Florida. The railroad interchanges with NS at Panhandle Jct. north of Anderson. Major commodities carried are grain and fertilizer.
• Indiana Harbor Belt Railroad – The Indiana Harbor Belt Railroad (IHB), jointly owned by CSX, NS and CP Rail, operates 54 miles of main track between Franklin Park, IL and Hammond, IN with approximately 26 miles within Indiana. Trackage rights are provided to UP, CP, and CN over various portions of the rail line. The railroad interchanges with 16 Class I, regional, and local rail carriers in its service area of Illinois and Indiana. Major commodities carried include steel, aluminum, food products, and autos.
• Indiana Southwestern Railway – The Indiana Southwestern Railway (ISW), a subsidiary of Pioneer Railcorp, operates over 26 miles of rail line between Evansville and Cynthiana. The railroad interchanges with CSX at Evansville. Major commodities carried include grain, plastics, and rail equipment.
• Kendallville Terminal Railway – The Kendallville Terminal Railway (KTR), a subsidiary of Pioneer Railcorp, operates approximately two miles of rail line in Kendallville, where it interchanges with NS. Major commodities carried include sugar, syrup, corn and sodium.
• Maumee & Western Railroad – The Maumee & Western Railroad (MAW) operates over three miles of rail line between Woodburn, IN and Liberty Center, OH. A portion of the rail line in Ohio is currently out of service. The railroad interchanges with NS at Woodburn. Major commodities carried include grain, minerals, plastics, and fertilizer.
• MG Rail Inc. – MG Rail, Inc. (MGFI) is operated by the Consolidated Grain & Barge Co. on track owned by the Clark Maritime Center of the Indiana Port Commission. The line extends 11 miles from Watson, where it interchanges with CSX to the Port. Major

DRAFT
DRAFT
Chapter 3: Indiana Rail System Profile 3-24
commodities carried include grain, agricultural products, steel, plastics, petroleum products, and chemicals.
• Vermillion Valley Railroad – The Vermillion Valley Railroad (VVRR), owned by the Indiana Boxcar Corp., operates over six miles of rail line between Olin, IN and Danville, IL. The line is owned by FNG Logistics Co., a subsidiary of Flex-N-Gate Corp. The railroad interchanges with CSX at Danville. The major commodity carried is biodiesels. Rail cars are also stored on the line.
• Wabash Central Railroad – The Wabash Central Railroad (WBCR) operates over 26 miles of rail line between Van Buren and Craigsville. The railroad interchanges with NS at Bluffton. Major commodities carried include grain and plastics.
• Winamac Southern Railway Company – The Winamac Southern operates over 52 miles of rail line, with two lines radiating from Logansport. One line is between Logansport and Kokomo, while the other is between Logansport and Bringhurst. The railroad interchanges with the Norfolk Southern at Logansport and with the Norfolk Southern and Central Railroad Company of Indianapolis at Kokomo. Major commodities include grain and fertilizer.
3.5 Excursion Railroads This category of railroads, also commonly known as tourist, historic, or scenic railroads are often rail lines which were once run as commercial freight railroads and were reopened by volunteers for historic or tourism purposes. Some of these railroads still conduct or operate active freight operations. Others operate over former or re-built rail lines which may or may not be connected to the national rail system.
Exhibit 3- 12 lists the Excursion Railroad operations in Indiana. A short description of each railroad also follows.
Exhibit 3- 12: Excursion Railroads in Indiana
Excursion Railroads Miles Leased Miles Owned Miles Operated
Hoosier Heritage Port Authority 0 38 38 Carthage, Knightstown and Shirley Railroad 0 10 10 French Lick Scenic Railway 0 10 10 Hoosier Valley Railroad Museum 0 10 10 Whitewater Valley Railroad 0 19 19
Total – Excursion Railroads 0 87 87
• Hoosier Heritage Port Authority – The Indiana Transportation Museum operates excursion trains on 38 miles of rail line owned by the Hoosier Heritage Port Authority. The railroad operates out of Forest Park in Nobleville and travels north to the end of the

DRAFT
DRAFT
Chapter 3: Indiana Rail System Profile 3-25
line in Tipton and south to 39th
• Carthage, Knightstown, and Shirley Railroad – The CK&S carries riders on a 10 mile, hour-long ride on track once owned by the Big Four railroad company near Knightstown, about 30 miles from Indianapolis. The railroad operates from May through October. Special events include a Mother’s Day train, Train Robbery adventures, and Pumpkin Patch trains in October.
Street in Indianapolis. The Indiana Rail Road operates freight service over this line as necessary. The Indiana Transportation Museum is an all-volunteer, non-profit museum dedicated to preserving and showcasing railroads of Indiana. It operates many different excursions including dinner trains, trains transporting people to the Indiana State Fair, and holiday trains such as the Polar Express and Pumpkin Train.
• French Lick Scenic Railway – The Indiana Railway Museum operates the French Lick Scenic Railway located in French Lick. The railroad operates passenger trains over 10 miles of track between French Lick and Cuzco. The railroad operates between March and December. Special event trains include Train Robbery, Easter, and Polar Express excursions. Dessert and cocktail trains are available.
• Hoosier Valley Railroad Museum – The Hoosier Valley Railroad Museum operates excursion trains over a 10 mile rail line from North Judson, located in the northwestern part of the state. Trains operate, generally on Saturdays, from May through October. The museum operates both diesel and steam locomotives.
• Whitewater Valley Railroad – The Whitewater Valley Railroad serves as an operating railroad museum dedicated to the preservation of branch line railroading. The railroad operates its regularly scheduled trains over a 19 mile route between Connersville and Metamora. An alternative “Metamora Shuttle” carries passengers on a two-mile excursion along the restored canal. Regular schedule trains operate between May and October. Special trains, which operate throughout the year, include a Wild West Train, Easter Bunny Express, Train to Dinner, Thomas the Tank Engine, and Polar Bear Express.
3.6 Abandoned or Discontinued Rail Lines Over the past 60 years over 3,300 miles of rail line have been abandoned in Indiana. Many of those rail lines which were considered redundant or not feasible to operate from a financial perspective could be valuable today to provide rail freight or passenger capacity. Fortunately, the increase in rail demand has increased efforts by both public transportation agencies and the rail industry to preserve rail lines or rights of way which could be valuable in the future. These actions have considerably reduced abandonments over the past decade.

DRAFT
DRAFT
Chapter 3: Indiana Rail System Profile 3-26
Rail freight service, including the lines over which rail service is operated, are under the jurisdiction of the U.S. Surface Transportation Board (STB). Rail owners and operators must apply to the STB for permission to discontinue, or abandon, freight service on a line.
For an active rail line, the STB requires the railroad must publish a notice to abandon the line once a week for at least three consecutive weeks and provide notice at its stations and to its rail customers. For a line on which no service has been provided over the past two years and where no customers object, prior notice is not required and the carrier is exempt from many of the STB abandonment requirements. For each abandonment application, the STB establishes a docket number and collects information and testimony before deciding whether to allow abandonment or permit other actions as may be requested by interested parties. In addition to STB’s authority to grant or deny abandonment of a rail line, it may also impose other conditions, such as granting “Interim Trail Use” or “Public Use” of the line.
The National Trails Act allows for reserving railroad right-of-way through the interim use of the railroad corridor as a trail. Interim trail use can be utilized when it is determined that the railroad right-of-way may be needed in the future for railroad use. Public agencies may also request that the rail corridor be made available for “public use” if it has determined that the right-of-way is suitable for highway or mass transit usage, conservation, energy production or transmission, or recreation.
In Indiana, the State Legislature created the Transportation Corridor Planning Board to examine the most efficient and beneficial reuse of abandoned rail corridors. State legislation provides for four potential use strategies: 1) as a future freight rail line; 2) as a future passenger rail line; 3) as a pedestrian trail; and, 4) as an underground utility corridor. The Indiana DOT Rail Office coordinated Board activities and utilizes a 2003 Master Plan to provide a framework to allow the Board to prioritize the future use of abandoned corridors. The Transportation Corridor Planning Board no longer meets as it met the requirement of the enacting legislation.

DRAFT
DRAFT
Chapter 3: Indiana Rail System Profile 3-27
Exhibit 3- 13: Abandoned Rail Lines in Indiana (2001-2011)
Railroad Line Description Docket No. 2 Miles Year CSSB Monon Sub. Michigan City Industrial Track AB-334(1X) 0.5 2001 CSX Decatur Sub. Montezuma (191.41) to Hillsdale (192.58) AB-55(579X) 1.17 2001 CSX Nabb Branch Clarksville (50.5) to New Albany (54.3) AB-55(591X) 3.8 2001 CSX Jefferson Br. Jeffersonville (6.7) to Watson (1.3) AB-55(592X) 5.4 2001 INRD Elletsville Line Elletsville (MP 213.69 to 213.41) AB-295(4X) 0.28 2001
CIND Lawrenceburg IT Lawrenceburg (24.6 to 25.6) FD-34186 1 2002
CSX Louisville Sub. Charlestown (40.60 to 40.80) AB-55(587X) 0.2 2002
CSX Decatur Sub. Indianapolis (127.8) to Speedway (127.19) AB-55 (621X) 0.61 2002
CSX South Monon Cloverdale (189.65) to (189.07) AB-55 (623X) 0.58 2002
CSSB Nickel Plate Michigan City Industrial Track AB-334 (2X) 0.6 2003
CSX Indianapolis Line New Castle, Henry Co.
AB-55 (639X) 1.64 2003
CSX Wabash Region LaCrosse to Wellsboro; North Judson to Madison AB-55(643X) 32.97 2003
CR/Honey Creek
Honey Creek Secondary
Sulphur Springs to New Castle in Henry County AB-865 (1X) 5.9 2004
INRD Elletsville Line Elletsville Q216.13 to MP Q213.69 AB-295 (6X) 2.44 2005
NS Blackford Co. Converse to Hartford City AB-290 (257X) 8.6 2005
Owensville Term.
Owensville & Poseyville Lines Browns, IL (205.0) to Poseyville (227.6) AB-477 (3X) 22.5 2005
CIND Decatur Greensburg IN MP 64.67 to MP 67.27 in Decatur Co. AB-459 ( 3X) 2.6 2006
CERA Grant County Marion (TS-154.65) to West Marion Belt (TS-157.01) AB-511 (3X) 2.36 2007
CSX Muncie Belt Industrial Muncie QIM 0.0 to MP QIM 1.4
AB-55 (679X) 1.4 2007
NS Grant County Marion MP TS 153.35 to MP TS 157.01 AB-290 (291X) 3.66 2007
Honey Creek
Honey Creek Secondary
Sulphur Springs to New Castle in Henry County FD 34869 NA 2007
CSX Arlington Industrial Indianapolis QIA 1.11 to QIA0.1 AB-55(688X) 1.01 2008
INRD Sunrise Mine at Carlisle Carlisle and Sullivan FD 35137 NA 2008
NS St. Joseph & LaPorte MP I 131.60 - Milepost I 136.00
AB-290 (307X) 4.4 2008
CERA Howard County Kokomo Tipton Ind MP 51.5 to 54.3 & W. Kokomo MP 181.26 to 183.64 AB-511 (4X) 5.18 2009
INRD Linton-Midland Line Midland MP 206.85 to Linton MP 212.49 AB-295 (7x) 5.64 2009
ISW
Posey and Vanderburgh Counties
Poseyville MP 227.5 to German Township MP 240.2 & Cynthiana MP 277.5 to Poseyville M.P. 282.0 AB-1065X 17.2 2011
2 Details of abandonment proceedings can be found on the STB website at www.stb.dot.gov.

DRAFT
DRAFT
Chapter 4: Indiana Rail Freight Traffic Profile 4-1
Chapter 4: Indiana Rail Freight Traffic Profile The rail network within Indiana is an important component to the nation’s rail network. In 2009, Indiana was ranked ninth in the nation for total tons carried and tenth in the nation for total carloads. The rail network within the state carried approximately 285 million tons of freight in 2008 and 247 million tons in 2009.3
4.1 Commodity Profile
Indiana was among the top ten states in terms of originating rail tonnage for coal, farm products, food products, primary metal products, and waste and scrap. Indiana is the largest originating state for primary metal products, accounting for 21 percent of the nation’s originating rail primary metal tonnage. Indiana is among the top ten destination states for coal, petroleum products, primary metal products, and waste and scrap.
In 2009, railroads in Indiana carried a total of 247 million tons and 5.4 million carloads of freight (Exhibit 4-1). Of this, 212.4 million tons was carload freight, accounting for 86 percent of the total rail traffic; and the remaining was intermodal freight. The vast majority, approximately 70 percent of the rail traffic was overhead freight4
Exhibit 4-1: Indiana Rail Traffic Directional Flows
, which passed through Indiana between markets outside the State.
Traffic Type Tons (million) Percent Carloads/Units Percent Interstate Inbound 28.6 11.56% 329,234 6.11% Interstate Outbound 25.8 10.45% 338,301 6.28% Intrastate 21.5 8.71% 199,708 3.70% Through Freight 171.1 69.28% 4,523,782 83.91%
Total= 247.0 100.00% 5,391,025 100.00% Source: Prepared by Wilbur Smith Associates, based on STB Waybill Sample Data
4.1.1 Interstate Inbound A total of 28.6 million tons of freight was transported inbound to Indiana in 2009 from other states. Exhibit 4-2 presents the top five inbound commodities with a combined 22.9 million tons or 80 percent of total inbound freight. Coal is the top inbound commodity, accounting for 46 percent of the 2009 total inbound tonnage. According to the Energy Information Administration (EIA), approximately 90 percent of inbound coal was used by the coal-fired power plants in Indiana. Primary metal products represented 11 percent of inbound tonnage, and chemical products represented 9.6 percent.
3 The decline in rail traffic within Indiana during 2009 is consistent with national trends. According to the Association of American Railroads, overall tons originated by U.S. railroads were 14 percent less in 2009 than in 2008 4 Overhead freight represents freight that originates and terminates outside of the study area.

DRAFT
DRAFT
Chapter 4: Indiana Rail Freight Traffic Profile 4-2
Exhibit 4-2: Top Five Interstate Inbound Commodities
Source: Prepared by Wilbur Smith Associates, based on STB Waybill Sample Data
4.1.2 Interstate Outbound A total of 25.8 million tons of freight was transported outbound from Indiana in 2009. The top five originating commodities presented in Exhibit 4-3 totaled 21.8 million tons or 85 percent of the total outbound freight. As shown in Exhibit 4-3, farm products were the top outbund commodities, including corn, hay, soybeans and wheat, with a total tonnage of 7.1 million in 2009. Food products and primary metal products were the second and third highest volume commodities in 2009, accounting for 26 and 16 percent of the total outbound freight respectively.
0
2,000,000
4,000,000
6,000,000
8,000,000
10,000,000
12,000,000
14,000,000
Coal Primary Metal Products
Chemicals or Allied Products
Waste or Scrap Materials
Petroleum or Coal Products

DRAFT
DRAFT
Chapter 4: Indiana Rail Freight Traffic Profile 4-3
Exhibit 4-3: Top Five Interstate Outbound Commodities
Source: Prepared by Wilbur Smith Associates, based on STB Waybill Sample Data
4.1.3 Intrastate Traffic In 2009, railroads in Indiana shipped approximately 21.5 million tons of freight within the state. Exhibit 4-4 presents the top five intrastate commodities in Indiana, which had a total tonnage of 21.2 million or 99 percent of the total intrastate rail freight. The top commodity was coal, which was 17 million tons or 79 percent of the total intrastate freight. Approximately 97 percent of the coal was mined in Gibson, Greene, Sullivan, Vigo and Pike Counties and used by the coal-fired power plants within the same county or shipped out to Vermillion and Marion Counties.
0
1,000,000
2,000,000
3,000,000
4,000,000
5,000,000
6,000,000
7,000,000
8,000,000
Farm Products Food or Kindred Products
Primary Metal Products
Hazardous Materials
Coal

DRAFT
DRAFT
Chapter 4: Indiana Rail Freight Traffic Profile 4-4
Exhibit 4-4: Top Five Intrastate Commodities
Source: Prepared by Wilbur Smith Associates, based on STB Waybill Sample Data
4.1.4 Overhead Traffic A total of 171.1 million tons of freight was transported across Indiana with origins and destinations out of state. Exhibit 4-5 indicates that coal, hazardous materials and food products were the top three commodities in 2009. The top seven commodities were 137.6 million tons, or 80 percent of the total overhead traffic. Ninety eight percent of overhead coal shipments originated in Illinois or Wyoming. Michigan was the top market for overhead coal shipments, receiving over 46 percent of the overhead coal. Other major markets include Illinois, Ohio, New York and Pennsylvania. Among the overhead traffic was a total of 33.7 million tons of intermodal traffic, which was mostly carried between markets in the Midwest and Northeast.
0
2,000,000
4,000,000
6,000,000
8,000,000
10,000,000
12,000,000
14,000,000
Coal Primary Metal Products
Farm Products Waste or Scrap Materials
Nonmetallic Minerals

DRAFT
DRAFT
Chapter 4: Indiana Rail Freight Traffic Profile 4-5
Exhibit 4-5: Top Seven Overhead Commodities
Source: Prepared by Wilbur Smith Associates, based on STB Waybill Sample Data
4.2 Geographic Profile
4.2.1 Destinations of Traffic from Indiana The top destinations of freight originating in Indiana include states in the Midwest and Southwest. Georgia, Ohio, Illinois, North Carolina and Alabama were the top five destinations of Indiana freight, receiving 12.8 million tons of goods or 49 percent of total outbound freight. Ohio received a large share of primary metal products, and Georgia, Illinois, North Carolina, and Alabama are the top markets of Indiana’s agriculture and food products. Indiana also shipped hazardous materials, coal, transportation equipment and construction materials (i.e., clay, concrete, glass or stone).
0
5,000,000
10,000,000
15,000,000
20,000,000
25,000,000
30,000,000
35,000,000
Coal Hazardous Materials
Misc. Mixed Shipments
Food or Kindred Products
Chemicals or Allied Products
Farm Products Transportation Equipment

DRAFT
DRAFT
Chapter 4: Indiana Rail Freight Traffic Profile 4-6
Exhibit 4-6: Destination of Interstate Rail Traffic Originated in Indiana
Source: Prepared by Wilbur Smith Associates, based on STB Waybill Sample Data
4.2.2 Origins of Traffic to Indiana Exhibit 4-7 presents the top states that shipped freight to Indiana. Around 36 percent of inbound freight originates in Illinois. Ohio ranked second, with around 11 percent of the total. Indiana also received petroleum products, waste and scrap materials and primary metal products from West Viginia, Virgina, Pennsylvania and Michigan.

DRAFT
DRAFT
Chapter 4: Indiana Rail Freight Traffic Profile 4-7
Exhibit 4-7: Origin of Interstate Rail Traffic Terminating in Indiana
Source: Prepared by Wilbur Smith Associates, based on STB Waybill Sample Data
4.2.3 Originating Counties in Indiana Exhibit 4-8 shows the top originating counties of rail traffic in Indiana. Five counties, including Gibson, Lake, Sullivan, Vigo and Tippecanoe Counties, produced approximately 49 percent of the total freight in 2009. The most important commodities shipped from these counties include coal, primary metal products and food products. Areas generating farm products are mainly clustered around the center of Indiana, including high production counties such as Montgomery, Carroll, Fountain and Cass Counties.

DRAFT
DRAFT
Chapter 4: Indiana Rail Freight Traffic Profile 4-8
Exhibit 4-8: Originating Counties of Rail Traffic in Indiana
Source: Prepared by Wilbur Smith Associates, based on STB Waybill Sample Data

DRAFT
DRAFT
Chapter 4: Indiana Rail Freight Traffic Profile 4-9
4.2.4 Terminating Counties in Indiana Exhibit 4-9 shows the top terminating counties of rail traffic in Indiana. As shown in the map, the largest share of traffic to Indiana terminates in the Northwest and Southwest part of the state. Gibson and Lake Counties, which are located in the Evansville and Chicago metropolitan areas, are the top two destinations receiving freight, with 18 and 10 percent of the total freight, respectively.
Exhibit 4-9: Terminating Counties of Rail Traffic in Indiana
Source: Prepared by Wilbur Smith Associates, based on STB Waybill Sample Data

DRAFT
DRAFT
Chapter 4: Indiana Rail Freight Traffic Profile 4-10
4.3 Rail Freight Traffic Densities Exhibit 4-10 displays the density of rail lines within Indiana in millions of gross ton-miles per mile per year.
Exhibit 4-10: 2008 Density of Indiana Rail Lines in Millions of Gross Ton-Miles per Mile
Source: Prepared by Wilbur Smith Associates based upon data supplied by INDOT and the FRA

DRAFT
DRAFT
Chapter 4: Indiana Rail Freight Traffic Profile 4-11
As can be seen, the rail lines with the highest density of rail traffic cross east-west in the northern portion of the state. Other high density rail lines include the CSX CE&D subdivision, which runs along the Illinois border; the CSX St. Louis Line and Indianapolis Line subdivisions, which cross the state southwest/northeast through Indianapolis; and the NS Lafayette District/Huntington Districts, which pass through Lafayette to Fort Wayne in a southwest/northeast direction.
4.4 Rail Freight Traffic Trends According to the data provided by the U.S. Bureau of Transportation Statistics, originating and terminating rail traffic to/from Indiana held relatively constant over the 1999 to 2007 period and then declined somewhat in 2008 and 2009. During most years, the state’s rail network handled between 60 and 70 million tons of inbound freight and between 50 and 60 million tons of outbound freight. Originating freight was the highest in 1999, which was 58.7 million tons, and terminating freight reached a peak in 2004, which was 73 million tons. Terminating traffic was more impacted by the recession of 2008/2009 than originating traffic.
Exhibit 4-11: Rail Traffic Trends in Indiana (1999-2009)
Source: U.S. Bureau of Transportation Statistics, State Transportation Statistics, available online at: http://www.bts.gov/publications/state_transportation_statistics/
4.5 Rail Freight Traffic Forecasts This analysis presents rail traffic forecasts based on the Freight Analysis Framework-3 (FAF3) database. FAF3 is the latest revision of a series of databases developed by the U.S. Department of Transportation, Federal Highway Administration (FHWA), which began with an original FAF
0
10
20
30
40
50
60
70
80
1999 2000 2001 2002 2003 2004 2005 2006 2007 2008 2009
Milli
on T
ons
Terminating Traffic Originating Traffic

DRAFT
DRAFT
Chapter 4: Indiana Rail Freight Traffic Profile 4-12
database, was first revised in version FAF2. The base year of the FAF3 data set is 2007. FAF3
FAF
provides forecasts at five year intervals to 2040.
3
Exhibit 4-12
forecasts show that rail freight flows including freight to, from, and within Indiana, are expected to increase by over 50 percent over the 2009 – 2040 period, with an annual growth rate of 1.4 percent. Outbound interstate rail freight, (from Indiana to other states) will achieve the highest growth rate of 2 percent, and growth rates for inbound interstate (from other states to Indiana) and intrastate freight (shipments within Indiana) will be 1 percent and 1.3 percent, respectively ( ).
Exhibit 4-12: Compound Annual Growth Rates for Inbound, Outbound and Intrastate Freight 2009 - 2040
Source: Freight Analysis Framework, version 3
Exhibit 4-13 presents the annual growth rates for the top five commodities for each movement direction. For the inbound movement, four out of five commodities are expected to grow moderately, between 0.5 percent and 1 percent. Fertilizer shipments are expected to decline. Two major outbound commodities from Indiana, base metals and animal feed, are expected to have strong growth rates, over 2 percent, while coal products and basic chemicals will decline. Intrastate movement of gravel, cereal grains and base metals are expected to grow.
1.34%
1.97%
0.98%
0.00% 0.50% 1.00% 1.50% 2.00% 2.50%
Inbound Interstate
Outbound Interstate
Intrastate

DRAFT
DRAFT
Chapter 4: Indiana Rail Freight Traffic Profile 4-13
Exhibit 4-13: Growth Rates for Top Commodities
Inbound Commodity CAGR Outbound Commodity CAGR Intrastate Commodity CAGR
Coal 1.12% Cereal Grains 0.96% Coal 0.84% Base Metals 0.55% Base Metals 2.06% Coal Products -0.31% Basic Chemicals 1.16% Coal Products -0.48% Gravel 2.03% Fertilizers -0.32% Animal Feed 2.22% Cereal Grains 1.72% Coal Products 0.52% Basic Chemicals -0.94% Base Metals 2.26%
Source: Freight Analysis Framework, version 3
Exhibit 4-14 displays a regional breakdown of forecasted rail tonnage increases. As can be seen, over half of the forecasted increase in rail tonnage is expected to be internal to Indiana or between Indiana and Great Lakes states. Increases in rail tonnage to/from Illinois will account for a majority of the increase with Great Lakes states. The other two major sources of increase in rail traffic with Indiana will be the Southeast and Montana/Wyoming. The latter will consist overwhelmingly of increases in Powder River Basin coal shipments.
Exhibit 4-14: Distribution of Tonnage Increase in Rail Traffic to/from Indiana between 2007 and 2040 by Region
Source: Freight Analysis Framework, version 3
27%
26%22%
14%
4%4%
2% 1% 0% 0% 0% 0%
Great Lakes (WI, MI, OH, IL, MN)
Internal to Indiana
Southeast
Montana/Wyoming
Other Midwestern States
Texas and Oklahoma
Northeast
California
Other Western States
Northwest (WA, OR)
Alaska
Arizona/New Mexico

DRAFT
DRAFT
Chapter 4: Indiana Rail Freight Traffic Profile 4-14
4.6 Industry Developments that Could Impact Major Rail Commodities
4.6.1 Field Crops According to the U.S. Department of Agriculture’s (USDA) 2007 Census of Agriculture, Indiana ranked fourth in the nation for soybean production and fifth in corn production. Based on FAF3
Exhibit 4-15
forecasts, in the short-term, the outbound rail movement of cereal grains (which includes corn and soybeans) is expected to increase 9.6 percent over the period 2009 to 2020, with an annual growth rate of 0.8 percent. The annual growth rate will increase in the long-term, so that it is 0.9 percent over the 2009 to 2040 period. During the same time period, cereal grain intrastate movements by rail are expected to grow at a faster rate, with an annual growth rate of 1.7 percent. shows the production, yield and planted area of corn in Indiana over the past 20 years (1991 to 2010). The planted area was stable between 5.5 million and 6 million acres. The state’s annual production of corn was approximately 900 million bushels, which is equal to 22.9 million tons.5
Exhibit 4-15: Corn Production, Yield and Planted Acreage in Indiana
According to forecasts from the USDA, from 2011 to 2021, the U.S. corn production is expected to grow by 12.7 percent, with an annual growth rate of 1.2 percent.
Source: U.S. Department of Agriculture
Exhibit 4-16 shows the production, yield and planted area of soybeans in Indiana over the past 20 years (1991 to 2010). Production increased at 2.8 percent per year or 67 percent. According to the USDA, production of soybean is expected to grow by approximately 10 percent nationwide 5 Assuming 0.0254 tons per bushel, http://www.spectrumcommodities.com/pdf/convfactY2K.pdf
0
1,000
2,000
3,000
4,000
5,000
6,000
7,000
0
200
400
600
800
1000
1200
1991 1994 1997 2000 2003 2006 2009
Pla
nted
Are
a
Pro
duct
ion
and
Yie
ld
Planted Area (thousand acres) Production (million bushels) Yield (bushels per acre)

DRAFT
DRAFT
Chapter 4: Indiana Rail Freight Traffic Profile 4-15
over the next ten years, with an annual growth rate of 1 percent. Soybean oil accounts for about 90 percent of all biodiesel fuel feedstocks in the U.S. Indiana currently has five biodiesel plants with a combined capacity of 118 million gallons per year. An annual soybean demand for these plants is 70 million bushels. A plant in Claypool is the largest biodiesel plant in the world and consumes a significant portion of Indiana’s soybean harvest.
Exhibit 4-16: Soybean Production, Yield and Planted Acreage in Indiana
Source: U.S. Department of Agriculture
4.6.2 Ethanol Corn can easily be converted to ethanol (ethyl alcohol). Under current production standards, fuel facilities produce about 2.8 gallons of ethanol per 56 pound bushel of corn. From that conversion process about 17 pounds of dry distilled grains (DDGs) are produced per bushel of corn. DDGs are an excellent protein source for livestock. Ethanol has emerged as an important market for rail. In some cases, rail is used to transport the corn feedstock to ethanol plants, although trucking is more often used. Rail tank cars are used to transport the finished ethanol product. DDGs can be shipped by rail either in container for overseas markets or specialized covered hoppers to North American markets. As of March, 2011, Indiana is ranked sixth for ethanol production in the U.S., with 11 ethanol plants under operation and the annual production capacity is 913 million gallons, accounting for over 6.5 percent of the total capacity in the U.S. With the construction of two new ethanol plants in Mt. Vernon, IN, the total production capacity of ethanol in the state will be 1.1 billion gallons per year. In 2010, the state produced 821 million gallons of ethanol.
0
500
1,000
1,500
2,000
2,500
3,000
3,500
4,000
0
10
20
30
40
50
60
70
80
90
1991 1994 1997 2000 2003 2006 2009
Pro
duct
ion
Pla
nted
Are
a an
d Y
ield
Plant Area (million acres) Production (million bushels) Yield (bushels per acre)

DRAFT
DRAFT
Chapter 4: Indiana Rail Freight Traffic Profile 4-16
Exhibit 4-17: Ethanol Plants in Indiana
Company Location Nameplate Capacity
Operating Production
Under Construction/
Expansion Capacity
Abengoa Bioenergy Corp. Mt. Vernon, IN NA NA *88.0
Aventine Renewable Energy, LLC Mount Vernon, IN NA NA 110
Cardinal Ethanol Union City , IN 100 100 NA Central Indiana Ethanol, LLC Marion, IN 40 40 NA Green Plains Renewable Energy Bluffton, IN 115 115 NA Iroquois Bio-Energy Company, LLC Rensselaer, IN 40 40 NA New Energy Corp. South Bend, IN 102 102 NA POET Biorefining - Alexandria Alexandria, IN 68 68 NA POET Biorefining - Cloverdale Cloverdale, IN 92 NA NA
POET Biorefining - North Manchester
North Manchester, IN 68 68 NA
POET Biorefining - Portland Portland, IN 68 68 NA The Andersons Clymers Ethanol, LLC Clymers, IN 110 110 NA Valero Renewable Fuels Linden, IN 110 110 NA
Indiana Total= 913 821 198 Source: Renewable Fuels Association website, available online at: http://www.ethanolrfa.org/bio-refinery-locations/
Ethanol plants are located in close proximity to corn farming areas. Exhibit 4-18 presents the corn production by county and the location of the ethanol plants. Due to the short haul distance, the raw material is usually carried by truck to the plants. As shown in the exhibit, almost every ethanol plant is located along the Class I railroads, and the railroad is used for long haul distance, shipping ethanol from the plants to the terminals for fuel blending and storage (Exhibit 4-19).

DRAFT
DRAFT
Chapter 4: Indiana Rail Freight Traffic Profile 4-17
Exhibit 4-18: Indiana Corn Production and Ethanol Plants
Source: United States Department of Agriculture

DRAFT
DRAFT
Chapter 4: Indiana Rail Freight Traffic Profile 4-18
Exhibit 4-19: Rail and Truck Ethanol Distribution System
Source: National Bioenergy Center, National Renewable Energy Laboratory; E95 is Fuel Ethanol (200-proof alcohol denatured with 5 percent natural gasoline)
4.6.3 Conclusion – Bio-fuels and Field Crops Rail transportation of corn and soybeans, the state’s highest volume field crops, is expected to continue to grow. Future developments in ethanol and biodiesel production within Indiana could alter traffic flows. On the one hand, more of the state’s corn and soybean production could remain within the state, feeding ethanol and biodiesel plants instead of more distant markets. This would tend to decrease the usage of rail, since bio-fuel feed-stocks are usually transported to production plants by truck. However, rail could be used for some of these moves, and it could increase the volume of intrastate grain movements. Ethanol and biodiesel production generates rail traffic through shipments of ethanol and biodiesel to blending facilities. DDGs are also frequently shipped by rail.
4.6.4 Coal Indiana is the sixth largest producer of coal in the U.S. Mines are located in southwestern Indiana and are part of the coal production area referred to as the “Illinois Basin.” In 2008 and 2009, the

DRAFT
DRAFT
Chapter 4: Indiana Rail Freight Traffic Profile 4-19
state produced approximately 36 million tons of coal annually, and the output amount accounted for roughly three percent of total U.S. coal production.6 According to the Indiana Geological Survey7
Exhibit 4-20
, the state has approximately 57 billion tons of unmined coal, of which nearly 17 billion tons is recoverable using current technology. Based on current production rates, Indiana's 17 billion tons of available coal could last more than 500 years. shows the locations of the coal mines.
Exhibit 4-20: Coal Mines in Indiana
Source: Indiana Coal Mine Information System
In 2009 and 2010, the annual coal consumption of the state accounted for 52 million tons, and approximately 92 percent was used in generating electricity. In Indiana, coal is the primary source of fuel for electricity generation. Over the 1990 to 2008 period, electricity production
6 Energy Information Administration 7 Indiana Geological Survey, available online at http://igs.indiana.edu/coal/index.cfm

DRAFT
DRAFT
Chapter 4: Indiana Rail Freight Traffic Profile 4-20
from coal–fired power plants accounted for between 94 percent and 95 percent of the total production in the state.
Currently, the state has 30 coal-fired power plants with the total capacity around 21,551 megawatts (MW). As shown in Exhibit 4-21, these coal-fired power plants are spread throughout the state. Coal from mines outside of Indiana brought in by railcar and river barge primarily from Wyoming, West Virginia, and Illinois.
Exhibit 4-21: Indiana Coal-Fired Power Plants and Rail Network
Source: BNSF Railway
Over the 1990 to 2008 period, electricity generation capacity in the state increased by 27 percent and the coal-fired power plant capacity increased by 25 percent with an annual growth rate of 0.8 percent. As of March 2011, there are three proposed coal-fired power plants. One is the Edwardsport coal-fired power plant in the southwest of Indiana, the proposed capacity is 630 MW, which would consume three million tons of coal if running fully on capacity. Indiana

DRAFT
DRAFT
Chapter 4: Indiana Rail Freight Traffic Profile 4-21
Gasification, Leucadia National Corporation is also developing a SNG (substitute natural gas) facility in the southwest region. The plant is designed to generate 40 BCF SNG and 134 MW electricity annually, and the annual coal consumption for the plant is expected to be three million tons. In September 2010, Clean Coal Refining Corp announced their initial plans to develop a clean coal refining facility, which would use about 2.5 million tons of coal annually to produce about eight million barrels of oil, the majority of which would be further refined into diesel fuel or heating oil, as well as fuel for power plants. The plant could potentially produce coal-derived jet fuel.
According to the forecast from EIA, coal production from “Interior” mines, of which Indiana mines are part, is expected to show moderate increases, increasing 0.7 percent per year from 2010 to 2035 (Exhibit 4-22). Based on forecast from FAF3
Exhibit 4-22: Coal Production Projection
database, inbound coal shipped by rail will keep increasing, with a growth of 40 percent over the period 2009 to 2040, with an annual growth rate of 1.1 percent.
Source: Energy Information Administration
The developments described above suggest that coal shipments by rail will continue to rise. However, a larger portion of coal shipped by rail will probably be brought into the state from western coal mines in Wyoming and Montana. On the other hand, improvements to rail infrastructure could promote a modal shift from truck to rail for intrastate shipments of coal from Indiana mines to Indiana power plants. The introduction of cleaner coal technologies could also promote greater usage of Indiana coal.

DRAFT
DRAFT
Chapter 4: Indiana Rail Freight Traffic Profile 4-22
4.6.5 Manufacturing and Steel Indiana was ranked first in the nation for originating primary metal rail shipments in 2008.8 Base metal is the second largest outbound commodity.9 According to FAF3
Overall, Indiana is in a strong position in terms of manufacturing. Although employment has decreased, Indiana manufacturing production has increased. As the 2009 Rail Plan
forecasts, in 2040 the volume of outbound base metals shipped by rail is expected to increase to 10 million tons, with a growth of 88 percent from 2009 to 2040, equal to two percent per year.
10
8 American Association of Railroads
pointed out, the state’s share of U.S. manufacturing output increased from 3.2 percent in 1982 to 4.1 percent in 2006. Output increased in each of the state’s four largest manufacturing industries, motor vehicles and parts, fabricated metals, food processing, and pharmaceuticals between 1997 and 2006. Motor vehicle manufacturing tends to rely heavily on rail, both for delivery of finished vehicles and for delivery of parts and intermediate goods. The state’s share of U.S. motor vehicle-related production increased from 8.5 percent in 1997 to 12.2 percent in 2006. These figures suggest that rail shipments of steel, transportation equipment, and other manufactured commodities should continue to increase in the future.
9 Freight Analysis Framework 10 Cambridge Systematics, Indiana Rail Plan

DRAFT
DRAFT
Chapter 5: Role of Rail in the State’s Intermodal Network 5-1
Chapter 5: Role of Indiana’s Freight Rail System in the State’s Intermodal Network
The ability to use multiple modes for a single shipment provides Indiana shippers with valuable transportation options. A company may not have direct access to the rail network but would still like to benefit from the economies of rail transportation. Frequently for truck/rail moves, the rail transportation provides the long-distance or “line haul” portion of the move. It moves at a lower cost per ton-mile but is only economically feasible over a relatively long distance. Trucking provides the local connection to shippers’ front doors. Rail can also provide an important link for maritime shipments to reach to or from their final origins/destinations.
Within the rail industry, the term “intermodal” most often refers to the movement of containers or trailers on rail, or the so-called “container on flat car” (COFC) or “trailer on flat car” (TOFC) service. This occurs by a combination of truck and rail, or if the shipment is international, by ocean-going linkage. For the purposes of this rail plan, “intermodal” will also refer to the NS Triple Crown Service (TCS). The TCS uses different technology from traditional COFC/TOFC. Truck trailers are lifted onto sets of railcar wheels or “bogeys” to become part of a train. The company that manufactures the specialized trailers and bogeys is RoadRailer™. This particular equipment is referred to as “bimodal” because the same equipment is used in both rail and truck service. The truck trailers are not simply loaded onto railcars; they actually become part of the railcars. Indiana is somewhat unusual in the degree to which bimodal rail is used within the state. The NS Triple Crown Service has its hub in Fort Wayne, IN.
Exhibit 5- 1: RoadRailer™ Bogey Connecting Two Trailer Bodies
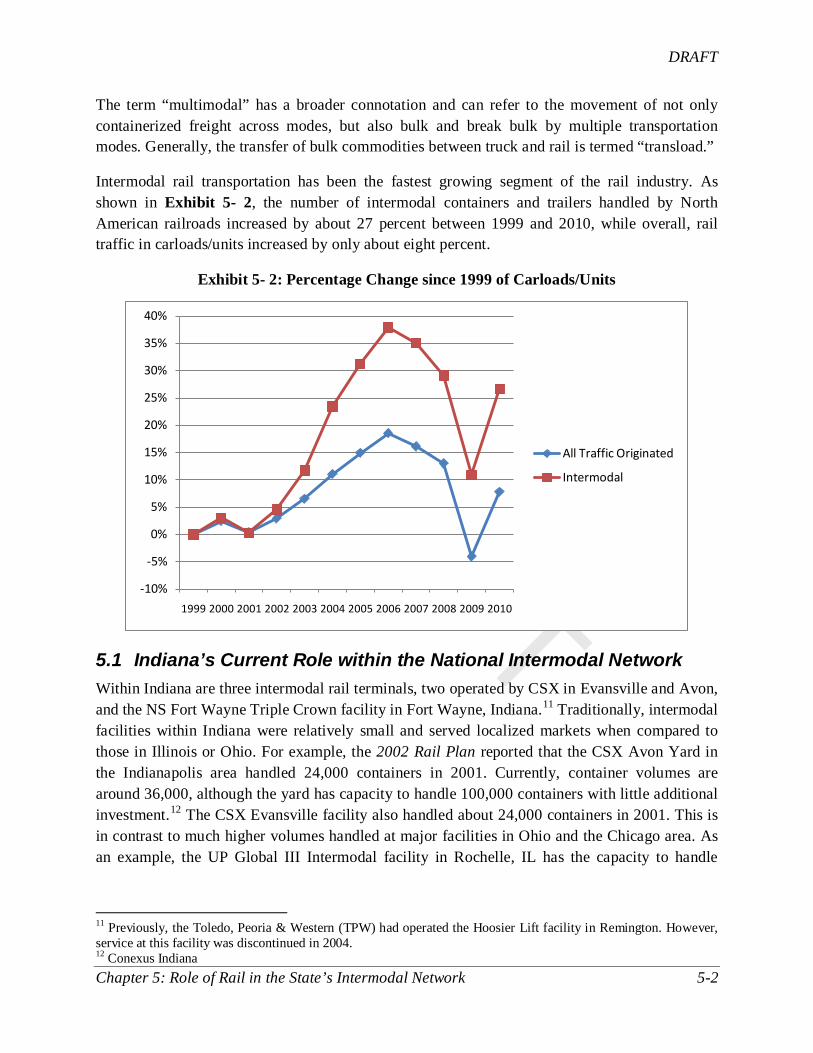
DRAFT
DRAFT
Chapter 5: Role of Rail in the State’s Intermodal Network 5-2
The term “multimodal” has a broader connotation and can refer to the movement of not only containerized freight across modes, but also bulk and break bulk by multiple transportation modes. Generally, the transfer of bulk commodities between truck and rail is termed “transload.”
Intermodal rail transportation has been the fastest growing segment of the rail industry. As shown in Exhibit 5- 2, the number of intermodal containers and trailers handled by North American railroads increased by about 27 percent between 1999 and 2010, while overall, rail traffic in carloads/units increased by only about eight percent.
Exhibit 5- 2: Percentage Change since 1999 of Carloads/Units
5.1 Indiana’s Current Role within the National Intermodal Network Within Indiana are three intermodal rail terminals, two operated by CSX in Evansville and Avon, and the NS Fort Wayne Triple Crown facility in Fort Wayne, Indiana.11 Traditionally, intermodal facilities within Indiana were relatively small and served localized markets when compared to those in Illinois or Ohio. For example, the 2002 Rail Plan reported that the CSX Avon Yard in the Indianapolis area handled 24,000 containers in 2001. Currently, container volumes are around 36,000, although the yard has capacity to handle 100,000 containers with little additional investment.12
11 Previously, the Toledo, Peoria & Western (TPW) had operated the Hoosier Lift facility in Remington. However, service at this facility was discontinued in 2004.
The CSX Evansville facility also handled about 24,000 containers in 2001. This is in contrast to much higher volumes handled at major facilities in Ohio and the Chicago area. As an example, the UP Global III Intermodal facility in Rochelle, IL has the capacity to handle
12 Conexus Indiana
-10%
-5%
0%
5%
10%
15%
20%
25%
30%
35%
40%
1999 2000 2001 2002 2003 2004 2005 2006 2007 2008 2009 2010
All Traffic Originated
Intermodal

DRAFT
DRAFT
Chapter 5: Role of Rail in the State’s Intermodal Network 5-3
720,000 containers.13
Exhibit 5- 3 The NS Rickenbacker terminal near Columbus, OH will eventually have
the capacity to handle 400,000. summarizes intermodal terminals within Indiana.
Exhibit 5- 3: Profile of Indiana’s Intermodal Terminals
Carrier Facility Capacity
NS Triple Crown Service Ft. Wayne N/A
CSX Indianapolis 100,000 lifts CSX Evansville 31,000 lifts
The primary reason for the relative modesty of Indiana’s intermodal terminals is the state’s proximity to Chicago. Most containers that arrive at West Coast ports destined for locations within the eastern portion of the country are shipped by rail to Chicago. According to www.createprogram.org one quarter of all U.S. rail traffic touches Chicago, and 46 percent of all intermodal units in the U.S. touch Chicago. It is generally cheaper and easier to offload containers from trains in Chicago and ship them to markets in Indiana by truck than to ship these containers from Chicago a relatively short distance by rail to markets within Indiana. Rail costing is based on length of haul, with most of the cost associated with switching of the car to be loaded or unloaded. With the higher proportionate cost and rates associated with moving a railcar between Chicago and locations in Indiana, a joint line rail movement becomes less competitive to a truck option from or to Chicago. Because the carriers that serve the West Coast ports (i.e., UP and BNSF have little presence in Indiana) the movement from Chicago would traditionally need to be on an eastern carrier’s intermodal network, namely CSX or NS.
Indiana’s proximity to Chicago also impacts Indiana’s role in regards to intermodal traffic from the South and from the East Coast. Usually, intermodal terminals are built so that the markets of each terminal on a carrier’s system do not overlap. Because CSX and NS have terminals that collectively have the capacity of somewhere between 1.5 and three million containers per year in Chicago, there has historically been little reason to locate additional terminals in northwest Indiana. Many of the new intermodal hubs developed by these carriers have focused on locations with less of an overlap to Chicago, such as the NS Rickenbacker Terminal in Columbus, OH and the CSX intermodal hub in North Baltimore, OH.
The lack of intermodal access, particularly in central Indiana, is a major concern to several of the shippers who provided input for this plan. For example, an automotive manufacturer mentioned that the company would benefit from direct input service from the Southwest.
5.2 Indiana’s Potential Role within the National Intermodal Network For shipments from the West Coast, alternative rail routings to Chicago have been recommended in the past. For example a paper published in the Transportation Journal, Fall edition 200714
13 Illinois Department of Transportation
,

DRAFT
DRAFT
Chapter 5: Role of Rail in the State’s Intermodal Network 5-4
recommended that a Midwest Fast-Freight Rail System be constructed (MFFRS). This would be a route roughly parallel to Interstate 70. It could incorporate existing rail lines as well as include new alignments. The MFFRS could be a common connector, by designing connectivity for all seven Class I railroads, for the timely and efficient movement of rail freight through and to the Midwest. This corridor would pass through Indianapolis.
Exhibit 5- 4: Midwest Fast-Freight Rail System
Several of the facts that were presented to support the MFFRS are below:
• Most freight traffic into and out of Chicago is pass-through. Relatively little freight actually stops in Chicago.
• Much of the intermodal freight passing through Chicago must be trucked between rail yards.
• Through freight is delayed on average about two days passing through Chicago.
• Many of the rail yards in Chicago are physically constrained. They cannot be expanded due to land uses of surrounding areas.
• By 2035 the freight rail trade by volume with Chicago is expected to increase by 89 percent (www.createprogram.org).
• Routing traffic through Chicago is sometimes circuitous. For some trans-continental moves, Chicago represents a northern detour.
14 Keith Bucklew, “The Heartland Fast-Freight Rail System, Transportation Journal, Fall edition 2007.
DRAFT
DRAFT
Chapter 5: Role of Rail in the State’s Intermodal Network 5-5
• The CREATE program is intended to improve passenger and freight rail flows in Chicago. However, this project is unlikely to resolve all of rail issues within the Chicago region. Currently, $2.4 billion of CREATE projects are unfunded. Even if all projects of the CREATE program were completed, the magnitude of forecasted traffic increases is such that the CREATE program would be unlikely to eliminate Chicago’s status as a bottleneck.
These factors render the future dominance of Chicago an inefficient alternative. The MFFRS is intended to provide a more efficient system, and could provide impetus for intermodal growth in Indianapolis. One potential complication of the MFFRS relates to carrier incentives. Rail carriers earn additional revenue from carrying freight as far along their own systems as possible. Many Class I rail carrier have termini in Chicago, so Chicago represents the revenue-maximizing location at which to hand off their freight to another carrier. While not necessarily the fastest alternative, carriers have an incentive to route traffic through Chicago.
In part due to congestion in Chicago, the pattern of routing traffic through Chicago appears to be changing, as is the pattern of reclassifying and off-loading cargo in Chicago. Eastern rail carriers and western carriers are forming joint line service in higher volume lanes. Joint line service allows for the train to move from origin station to destination station as one unit and not have to be reclassified upon interchange. For example, Union Pacific and Norfolk Southern offer joint boxcar service between Northern California and the Northeast. The train continues, undisrupted through Chicago. This allows for quicker transit through the corridor, thus making it very truck competitive.
UP and CSX initiated a service in which containers are transferred from UP to CSX trains in St. Louis and delivered directly to the CSX Avon Yard in Indianapolis. Although transit times originally compared unfavorably to those between West Coast ports and Chicago, the service has improved recently. When it was initiated, it did not generate enough volume for a direct steel wheel interchange at St. Louis. Rather, containers were placed on chassis and trucked 10 miles between a UP terminal in Dupo, IL and a CSX terminal in East St. Louis. Apparently, cars are now directly interchanged in blocks by rail without a “rubber tire” connection. A further improvement would be dedicated trains, which would not have to be blocked, but could be transferred directly between UP and CSX. Higher container volumes would be needed to justify this service. A recent study on behalf of Conexus Indiana identified 40,000 steamship container loads annually moving from West Coast ports via rail to Chicago, then to central Indiana that might be suitable for conversion to direct rail service.15
These joint line service agreements point to a potentially larger role for Indiana within the nation’s intermodal network in the future. Representatives from the Ports of Indiana refer to the state as the “Crossroads of America,” pointing out that more than 82 million people live within
15 TranSystems, Conexus Indiana Intermodal Analysis Final Report, April 29, 2009.

DRAFT
DRAFT
Chapter 5: Role of Rail in the State’s Intermodal Network 5-6
500 miles of Indianapolis, and that the state already serves as an important truck and rail corridor.
Some have suggested Northwest Indiana as a potential location for Chicago-area intermodal terminals and logistics parks. Several sites have been constructed on the outskirts of Chicago, such as the BNSF Logistics Park Chicago. This facility handles about 800,000 containers per year and is located in Elwood, IL, about 50 miles south of Chicago. Advocates have suggested that similar sites could be constructed in Indiana, which would provide access to Chicago without the congestion. Over the past several years, at least one site was proposed for LaPorte County but little has come of the proposal.
Many believe that Indiana is a promising location for new intermodal facilities. International trade is expected to increase dramatically, and much of this trade will travel by rail intermodal. Container volumes at both West Coast and East Coast ports are expected to grow. Furthermore, domestic intermodal has recently been growing faster than handling of foreign trade. Some other projects that have been proposed to improve intermodal service within Indiana are as follows:
• Avon Yard Intermodal improvements. These improvements would bolster the efficiency and increase the capacity of the CSX Avon Yard to 150,000 lifts per year. The increased capacity would enable sufficient container volumes to justify direct service to/from the West Coast, which would bypass Chicago.
• The CSX Evansville intermodal facility is currently landlocked and cannot expand. The facility would be relocated to site closer to the Toyota manufacturing plant in Princeton. This would allow the facility to expand while at the same time bringing the facility closer to a major customer.
• Add conventional intermodal to NS Triple Crown Fort Wayne facility to enable direct access to Mexico, and southwest United States.
• Construct intermodal facility on the Chicago, Fort Wayne & Eastern (CFER) in Fort Wayne. Construct new interchange facility to interchange containers at Valparaiso onto the Canadian National (CN).
• Construct intermodal terminals on the Indiana Rail Road at Terre Haute and Indianapolis.
5.3 Trade Trends Impacting Indiana Intermodal Traffic There is general consensus among industry observers that the volume of international trade will continue its upward trend once the world economy has recovered. Given that international trade represents about half of the intermodal rail market, growth in international trade will contribute to the growth in intermodal rail traffic.

DRAFT
DRAFT
Chapter 5: Role of Rail in the State’s Intermodal Network 5-7
Exhibit 5- 5: Historical and Forecasted World Imports Percentage of World GDP
Source: IHS Global Insight
Furthermore, there is agreement that much of U.S. foreign trade will be tied to population centers in the eastern half of the nation, where two thirds of the nation’s population resides.
15
20
25
30
35
40
1980 1985 1990 1995 2000 2005 2010 2015 2020 2025 2030
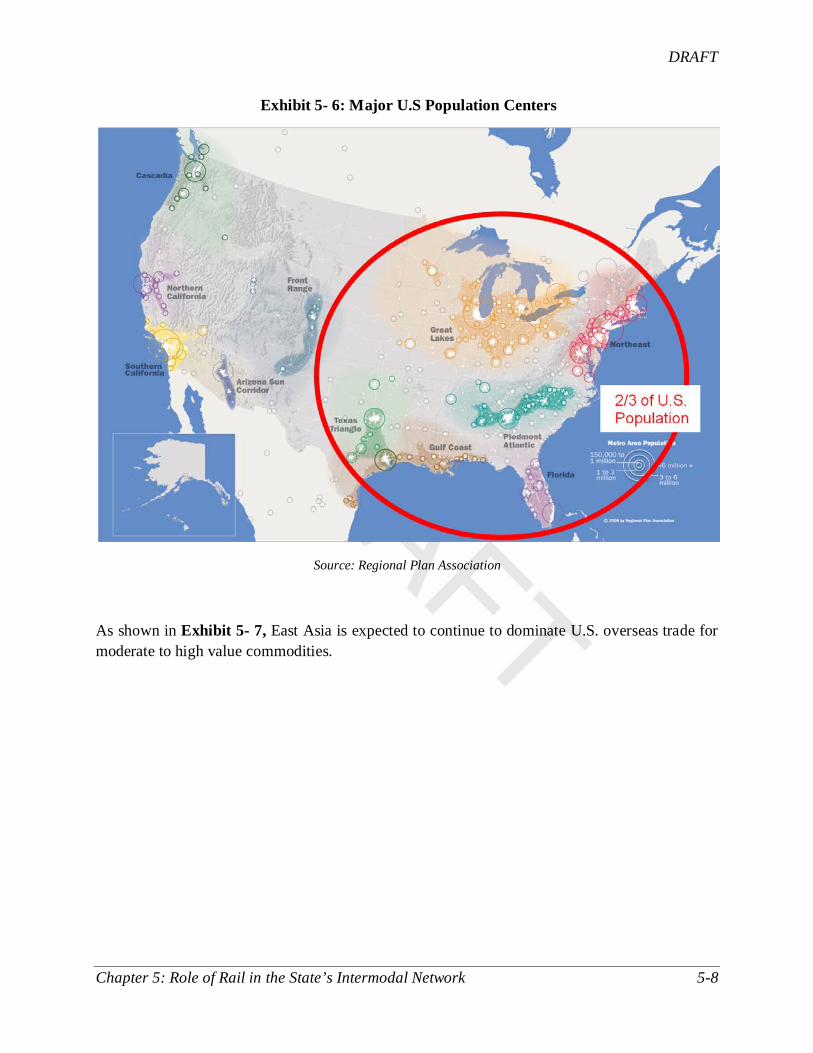
DRAFT
DRAFT
Chapter 5: Role of Rail in the State’s Intermodal Network 5-8
Exhibit 5- 6: Major U.S Population Centers
Source: Regional Plan Association
As shown in Exhibit 5- 7, East Asia is expected to continue to dominate U.S. overseas trade for moderate to high value commodities.
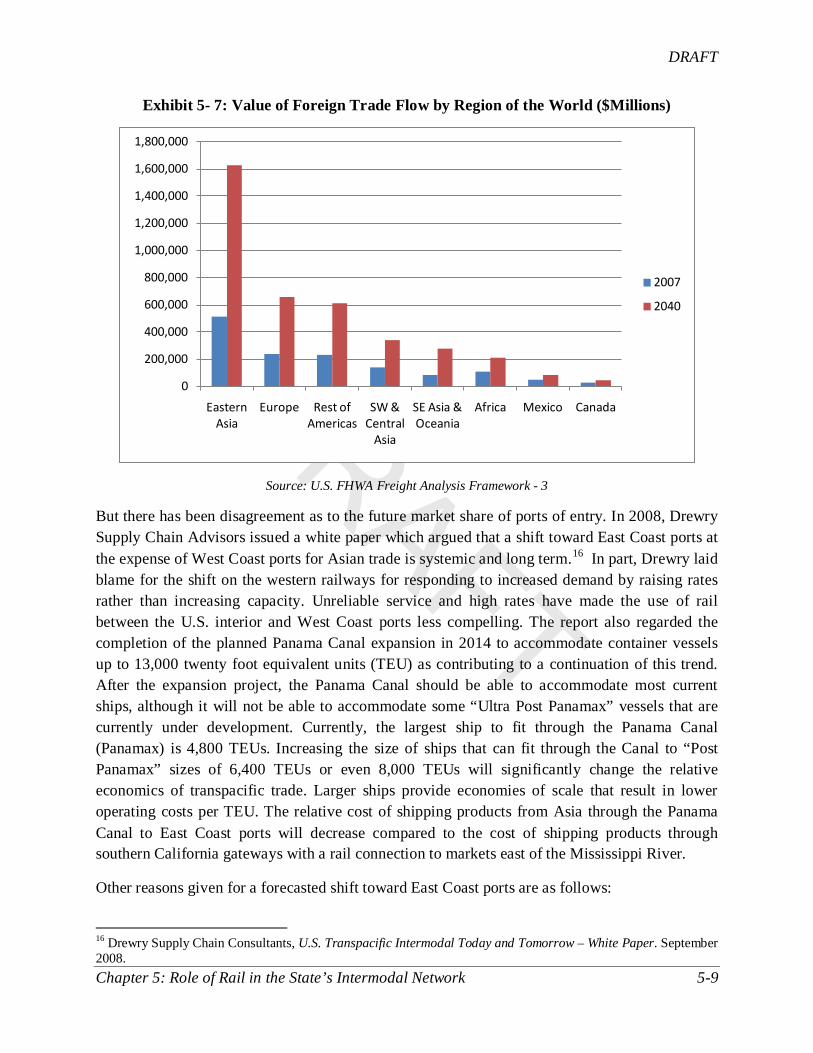
DRAFT
DRAFT
Chapter 5: Role of Rail in the State’s Intermodal Network 5-9
Exhibit 5- 7: Value of Foreign Trade Flow by Region of the World ($Millions)
Source: U.S. FHWA Freight Analysis Framework - 3
But there has been disagreement as to the future market share of ports of entry. In 2008, Drewry Supply Chain Advisors issued a white paper which argued that a shift toward East Coast ports at the expense of West Coast ports for Asian trade is systemic and long term.16
Other reasons given for a forecasted shift toward East Coast ports are as follows:
In part, Drewry laid blame for the shift on the western railways for responding to increased demand by raising rates rather than increasing capacity. Unreliable service and high rates have made the use of rail between the U.S. interior and West Coast ports less compelling. The report also regarded the completion of the planned Panama Canal expansion in 2014 to accommodate container vessels up to 13,000 twenty foot equivalent units (TEU) as contributing to a continuation of this trend. After the expansion project, the Panama Canal should be able to accommodate most current ships, although it will not be able to accommodate some “Ultra Post Panamax” vessels that are currently under development. Currently, the largest ship to fit through the Panama Canal (Panamax) is 4,800 TEUs. Increasing the size of ships that can fit through the Canal to “Post Panamax” sizes of 6,400 TEUs or even 8,000 TEUs will significantly change the relative economics of transpacific trade. Larger ships provide economies of scale that result in lower operating costs per TEU. The relative cost of shipping products from Asia through the Panama Canal to East Coast ports will decrease compared to the cost of shipping products through southern California gateways with a rail connection to markets east of the Mississippi River.
16 Drewry Supply Chain Consultants, U.S. Transpacific Intermodal Today and Tomorrow – White Paper. September 2008.
0
200,000
400,000
600,000
800,000
1,000,000
1,200,000
1,400,000
1,600,000
1,800,000
Eastern Asia
Europe Rest of Americas
SW & Central
Asia
SE Asia & Oceania
Africa Mexico Canada
2007
2040

DRAFT
DRAFT
Chapter 5: Role of Rail in the State’s Intermodal Network 5-10
• Routing of Asian cargo westerly through the Suez Canal to East Coast ports is increasing.
• Manufacturing in Asia could shift as Chinese wage rates increase. These shifts would favor countries such as Vietnam or India for which a westward transit through the Suez Canal to the East Coast could be more economical than a Transpacific transit with a rail connection.
• Lingering concerns about congestion, delays, rising user-fees, and labor strife at the Ports of Los Angeles and Long Beach have lead shippers to diversify the ports that they use. This is often referred to as the “Four Corners Strategy.”
• East Coast ports have the reputation of better labor relations than West Coast ports. The labor union representing East Coast dockworkers, the ILA, is seen as less combative and confrontational than its counterpart on the West Coast, the ILWU.
• Mounting congestion at Midwestern rail yards, particularly Chicago, has introduced uncertainty into rail land bridge movements into the eastern half of the U.S.
• West Coast ports are capacity constrained.
Other industry observers are skeptical that a significant shift to East Coast ports will take place. While some shift may occur, it will very minor. They argue that:
• Each time there is a disturbance in Southern California, shippers divert some of their traffic to other ports, including East Coast or Gulf ports. But once the situation stabilizes, shippers typically revert much of this traffic back to Southern California.
• Shipping cost is only one component of the supply chain decision. Even if the Panama Canal expansion reduces the cost of all-water moves from Asia to the East Coast, transiting the Panama Canal is still slower and potentially subject to more delays when compared to land bridg movements through West Coast ports. Land bridge movements through West Coast ports still retain a time advantage compared to both the Panama Canal and Suez routes for shipments from the Far East.
• The expansion of the Panama Canal will only provide capacity to keep up with overall demand for international trade. Given expected trade increases, the expansion will allow the canal to maintain market share, but not increase it.
• Although western railroads have increased their rates recently, they would not be expected to price themselves out of the market for eastbound intermodal traffic. Carriers follow a cycle where they raise rates as they reach capacity, carriers add capacity, and then lower rates. As the additional capacity is consumed, the cycle starts again. Western railroads are rapidly adding capacity to their mainlines. For example, UP is double

DRAFT
DRAFT
Chapter 5: Role of Rail in the State’s Intermodal Network 5-11
tracking the Sunset Route between Los Angeles and El Paso, and BNSF is triple tracking Cajon Pass in California on the Transcontinental (Transcon) route. Those who believe that western railroads will invariably raise their rates are describing a snap shot in time. There is no guarantee that this trend will continue in the future.
• There is plenty of room to add capacity at West Coast ports. Prince Rupert, Oakland have more capacity forthcoming. Los Angeles is proceeding with the new TraPak terminal, and Tacoma is proceeding with the new terminal for “K” Line. West Coast ports will be able to expand on their existing footprint, since the cargo handled per acre is relatively low by international standards (compared to Asian and European ports). East Coast ports face many of the same constraints as West Coast ports and are no better equipped to expand.
• Relatively few East Coast or Gulf Coast ports have the channel depth or clearance (e.g. New York/New Jersey Bayonne Bridge) to handle large post Panamax ships.
• Rumors of manufacturing shifting away from China to other Asian countries are exaggerated. China still has the largest untapped reserve industrial labor force. It still is a better location for manufacturing with better logistics than competing areas.
So what are the implications of the East Coast/West Coast market share of Asian trade for Indiana? This is uncertain. On the one hand, a reduction of land bridge movements through Chicago to eastern locations would tend to decrease eastbound trade traffic travelling through Indiana. On the other hand, an increase in trade between East Coast and Gulf ports and Chicago would tend to increase westbound and north/south rail traffic travelling through Indiana.
Many of the new inland capacity enhancements directed at forecasted growth in East Coast port traffic have focused on locations east of Indiana, particularly in Ohio. For example, the Rickenbacker Intermodal Terminal was opened near Columbus, OH in 2008. This terminal has a current capacity of 250,000 lifts per year with a future capacity of 400,000 lifts. The Rickenbacker Terminal is a component of the Norfolk Southern Heartland Corridor project, which was intended to increase the speed of double stack containers moving between the East Coast to the Midwest.
The Northwest Ohio Terminal in North Baltimore, OH began operations in February 2011. The facility is expected to eventually handle two million containers or trailers per year, including block swaps (shifting groups of railcars with a common destination between trains.) This terminal is a component of the CSX National Gateway project, which is intended to improve the flow of rail traffic throughout the nation by increasing the use of double-stack trains, creating a more efficient rail route that links Mid-Atlantic ports with Midwestern markets. The Northwest Ohio Terminal is also intended to enable West Coast freight to bypass Chicago.
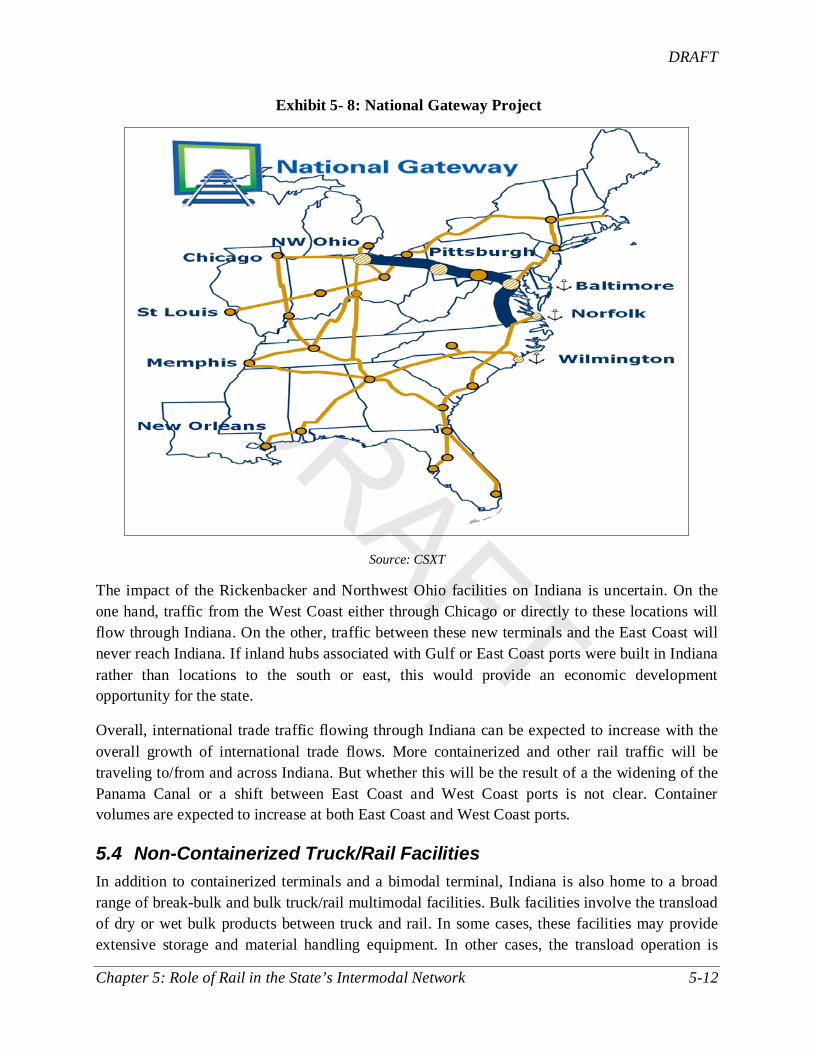
DRAFT
DRAFT
Chapter 5: Role of Rail in the State’s Intermodal Network 5-12
Exhibit 5- 8: National Gateway Project
Source: CSXT
The impact of the Rickenbacker and Northwest Ohio facilities on Indiana is uncertain. On the one hand, traffic from the West Coast either through Chicago or directly to these locations will flow through Indiana. On the other, traffic between these new terminals and the East Coast will never reach Indiana. If inland hubs associated with Gulf or East Coast ports were built in Indiana rather than locations to the south or east, this would provide an economic development opportunity for the state.
Overall, international trade traffic flowing through Indiana can be expected to increase with the overall growth of international trade flows. More containerized and other rail traffic will be traveling to/from and across Indiana. But whether this will be the result of a the widening of the Panama Canal or a shift between East Coast and West Coast ports is not clear. Container volumes are expected to increase at both East Coast and West Coast ports.
5.4 Non-Containerized Truck/Rail Facilities In addition to containerized terminals and a bimodal terminal, Indiana is also home to a broad range of break-bulk and bulk truck/rail multimodal facilities. Bulk facilities involve the transload of dry or wet bulk products between truck and rail. In some cases, these facilities may provide extensive storage and material handling equipment. In other cases, the transload operation is

DRAFT
DRAFT
Chapter 5: Role of Rail in the State’s Intermodal Network 5-13
little more than a rail siding with room for trucks to load/unload with transfer equipment. The transfer of break-bulk goods refers to the transfer of products that are in separable units, such as bags, bales, drums, beams, boards, etc. Frequently, break-bulk facilities are associated with warehouses, where product is stored within an enclosed area before being transferred to/from rail or trucking. Indiana is home to four vehicle ramps which support the automotive industry. These ramps are used to load and unload finished vehicles onto or off of trains for distribution across North America.
According to the U.S. Department of Agriculture, Indiana is fifth among states in the value of grain production. The state’s grain elevators vary considerably in size, ranging from a capacity of only several hundred thousand bushels, capable of loading two dozen cars, to very large, “unit loader” facilities that can fill an entire trainload full of grain. Among the largest facilities are the Bunge, North America facility in Decatur, which has a capacity of 13 million bushels, the ADM facility in Beech Grove with a 12 million bushel capacity, and the Kokomo Grain facility in Kokomo with an 11 million bushel capacity. In addition, the Consolidated Grain & Barge facility in Mt. Vernon can fill a 130 car train, as can the Cargill Facility in Monterey. The CSX website lists 39 elevators served in Indiana, while NS lists 77 grain elevators.
Truck/rail transfer facilities provide a vital service to important industries within the state. Companies in areas such as manufacturing, agriculture, construction, and energy may not necessarily have direct access to the rail network. Multimodal facilities allow these companies to benefit from the economics of rail transportation without direct rail access.
These facilities can also be associated with the development of industrial parks. An example of an economic development initiative with a rail transload element is the Inland Logistics Port at Kingsbury. The primary emphasis of the park is refrigerated cargoes, but sites within the park could also handle bulk cargoes and petro chemicals. CSX is offering dedicated unit train refrigerated service between the site and Port Manatee, FL, with pending service to the Port of New York/ New Jersey. Manifest service is also available. Several rail stakeholders consulted during this project believe that additional industrial developments combined with transload facilities could generate future economic development opportunities.

DRAFT
DRAFT
Chapter 5: Role of Rail in the State’s Intermodal Network 5-14
Exhibit 5- 9: Kingsbury Inland Logistics Port Refrigerated Service
Source: Kingsbury Inland Logistics Port
Exhibit 5- 10 provides a listing of bulk transload facilities, and Exhibit 5-11 provides a listing of automotive ramps from the INDOT 2030 Long Range Transportation Plan.
Exhibit 5- 10: Bulk Transload Facilities in Indiana
Name Location (City) Railroad Jeffersonville Flexi-Flo Jeffersonville Louisville & Indiana, CSX Bloomfield Bulk Transfer Bloomfield Indiana Railroad Milford Junction Bulk TransFlo Milford CSX East Chicago Bulk TransFlo East Chicago CSX MDT Transloading Services Hammond Indiana Harbor Belt Matlack Bulk Intermodal Whiting Norfolk Southern Indianapolis Flexi-Flo Terminal Indianapolis CSX Transfer of Indiana Indianapolis CSX Indianapolis Bulk Transfer Indianapolis Indiana Railroad Indiana Reload Center Indianapolis Indiana Railroad Lafayette Bulk TransFlo Lafayette CSX Evansville Bulk TransFlo Evansville CSX
Source: INDOT 2030 Long Range Transportation Plan

DRAFT
DRAFT
Chapter 5: Role of Rail in the State’s Intermodal Network 5-15
Exhibit 5-11: Vehicle Ramps in Indiana
Name Location (City) Railroad South Bend Vehicle Ramp South Bend Norfolk Southern Oliver Yard South Bend Canadian National Elkhart Ramp Elkhart Norfolk Southern Nappanee Nappanee CSX
Source: INDOT 2030 Long Range Transportation Plan
5.5 Maritime Facilities In addition to truck/rail facilities, many of Indiana’s ports are also served by the state’s rail network. Port facilities within the state are located either along the shore of Lake Michigan in the northwest corner of the state or along the Ohio River on the southern border of the state. Port facilities with rail access in Indiana are a cost-effective means to transport heavy commodities. Facilities along Lake Michigan for the most part are served by lake vessels. These are bulk and break-bulk cargo vessels that are capable of navigating within constraints of the Great Lakes/St. Lawrence Seaway System (GLSLS). These vessels tend to be shallower and narrower than ocean-going vessels. Port facilities along the Ohio River are served by tug-barge combinations. Within the INDOT 2030 Long Range Transportation Plan, several ports were identified as having state or national significance. Those ports that were identified as having national or state significance that have rail access are listed in Exhibit 5- 12. Many of the rail-served ports within the state serve the steel industry, although Indiana ports are important to a variety of other industries as well, such as agriculture, construction, lumber and paper. Exhibit 5- 13 provides a map of these facilities.
Exhibit 5- 12: Rail/Maritime Connections of National or State Significance
Name Location (City) Railroad Served Major Cargoes
Port of Indiana Mount Vernon EVWR Coal, Grain Port of Indiana Jeffersonville MGRI Petroleum Products, Non-metallic
Minerals Port of Indiana Burns Harbor NS, IHB Steel, Agricultural Products, Non-
metallic Minerals, Lumber, Paper Gary Harbor – USX Steel Gary PVTX, CN Iron Ore Indiana Harbor and Canal East Chicago IHB, CN Iron Ore, Limestone Perry County Port Authority Tell City HOS Pig Iron, Coke, Coal, Woodchips

DRAFT
DRAFT
Chapter 5: Role of Rail in the State’s Intermodal Network 5-16
Exhibit 5- 13: Map of Rail/Maritime Connections of National or State Significance

DRAFT
DRAFT
Chapter 6: Impacts of Freight Rail Transportation 6-1
Chapter 6: Impacts of Freight Rail Transportation in Indiana Freight rail service has a large impact on the competitive position of Indiana businesses, as well as on the general quality of life within the state. This chapter discusses freight rail impacts to Indiana’s economy, environment, energy, land use, community character and quality of life.
6.1 Economics Rail is a vital component of economic activity within Indiana. Transportation investment can improve access and attract new business. The presence of an effective and cost efficient rail network can dramatically reduce the cost of doing business and can be a consideration in establishing the site for new business. Many of the state’s most important industries rely heavily on rail, including coal and energy, construction products, agriculture and steel. Exhibit 6- 1 and Exhibit 6- 2 show the products that are shipped in the highest volumes by rail in Indiana.
Exhibit 6- 1: Millions of Rail Tons Originated in Indiana (2008)
Source: Association of American Railroads State Profile website
0 2 4 6 8 10 12 14 16 18
All Other
Petroleum Products
Transportation Equipment
Waste and Scrap
Chemicals
Food Products
Farm Products
Iron and Steel
Coal
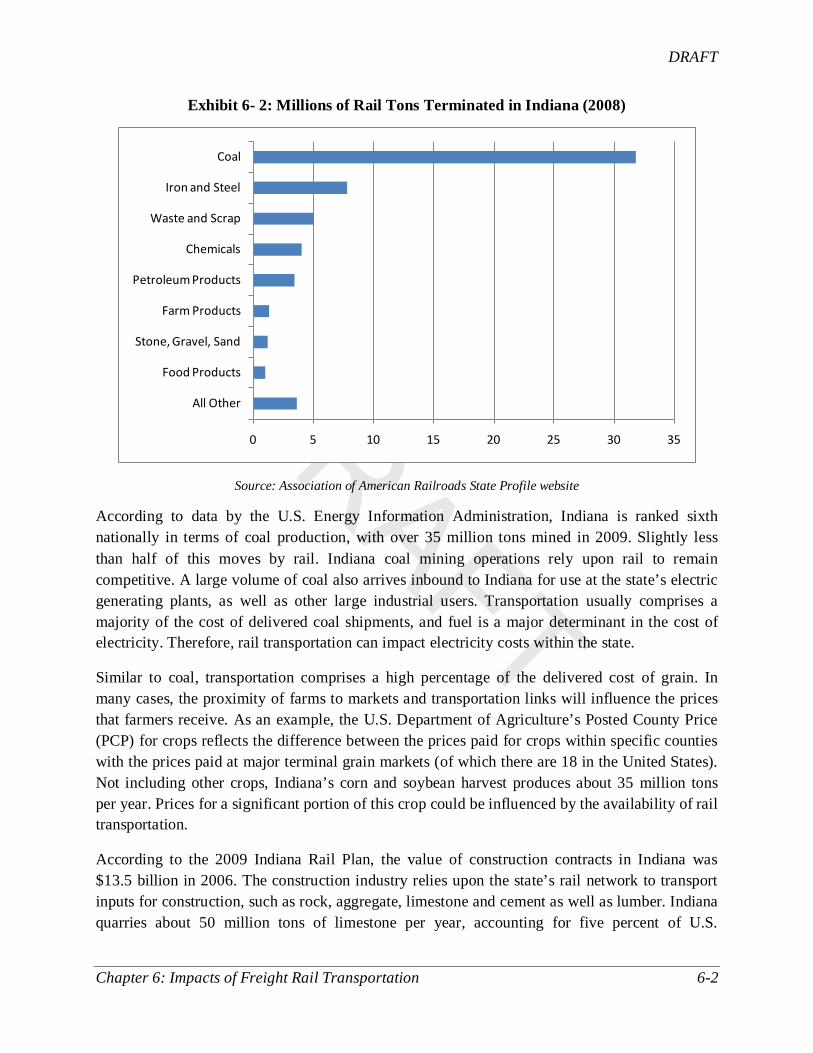
DRAFT
DRAFT
Chapter 6: Impacts of Freight Rail Transportation 6-2
Exhibit 6- 2: Millions of Rail Tons Terminated in Indiana (2008)
Source: Association of American Railroads State Profile website
According to data by the U.S. Energy Information Administration, Indiana is ranked sixth nationally in terms of coal production, with over 35 million tons mined in 2009. Slightly less than half of this moves by rail. Indiana coal mining operations rely upon rail to remain competitive. A large volume of coal also arrives inbound to Indiana for use at the state’s electric generating plants, as well as other large industrial users. Transportation usually comprises a majority of the cost of delivered coal shipments, and fuel is a major determinant in the cost of electricity. Therefore, rail transportation can impact electricity costs within the state.
Similar to coal, transportation comprises a high percentage of the delivered cost of grain. In many cases, the proximity of farms to markets and transportation links will influence the prices that farmers receive. As an example, the U.S. Department of Agriculture’s Posted County Price (PCP) for crops reflects the difference between the prices paid for crops within specific counties with the prices paid at major terminal grain markets (of which there are 18 in the United States). Not including other crops, Indiana’s corn and soybean harvest produces about 35 million tons per year. Prices for a significant portion of this crop could be influenced by the availability of rail transportation.
According to the 2009 Indiana Rail Plan, the value of construction contracts in Indiana was $13.5 billion in 2006. The construction industry relies upon the state’s rail network to transport inputs for construction, such as rock, aggregate, limestone and cement as well as lumber. Indiana quarries about 50 million tons of limestone per year, accounting for five percent of U.S.
0 5 10 15 20 25 30 35
All Other
Food Products
Stone, Gravel, Sand
Farm Products
Petroleum Products
Chemicals
Waste and Scrap
Iron and Steel
Coal

DRAFT
DRAFT
Chapter 6: Impacts of Freight Rail Transportation 6-3
production. About 30 percent of minerals and raw materials shipped from Indiana to other states were shipped by rail in 2007.17
As can be seen from
Exhibit 6- 1 and Exhibit 6- 2 above, Iron and Steel is the product category with the second highest volume of shipments for traffic both to and from Indiana. The state is unusual to have such a high proportion of rail traffic be iron and steel. Based upon statistics by the American Iron and Steel Institute, Indiana is the nation’s largest producer of raw steel products. The steel industry is particularly reliant upon rail transportation. Steel is a highly competitive industry where U.S. firms compete within a global marketplace. The availability of cost effective transportation options allow firms to operate and thrive within this environment.
In 2008, the research wing of the American Trucking Association estimated that the marginal cost of operating a truck per mile is $1.73.18 Work for the Federal Highway Administration (FHWA) has estimated that the average 18 wheel, five-axle truck has a payload of about 18 tons.19
The rail industry also impacts Indiana’s economy through railroad employment. It is estimated that the freight rail industry directly employed 6,120 people in the State of Indiana in 2009, with annual wages and benefits over $564 million. The freight rail also supports 15,576 retirement beneficiaries in the state, with annual paid retirement benefits over $261 million. Indiana is ranked ninth across the nation for railroad employment and tenth in wages.
Therefore, the average cost per ton-mile for trucking would be about $0.096. Based upon data by the Association of American Railroads for the same year, the average operating expense per ton-mile for rail was $0.027. Even if this dramatic cost differential does not hold in all cases and other factors may influence shipper costs, there are potential savings from using rail. For shippers shipping or receiving low value, dense products long distances, rail access is not just a convenience, but a necessity for doing business.
6.2 Environment Diesel locomotives produce both noise and air pollution. Major emissions from locomotive diesel engines are nitrogen oxides (NOx) and particulate matter (PM). Other environmental issues associated with rail include coal dust that could be blown from trains, as well as the risk of train accidents and associated spills. Also, intermodal ramps and other rail yards tend to concentrate truck traffic into a specific area with possible negative impacts on those living in the immediate vicinity.
However, these negative impacts must be balanced against comparable air quality and noise impacts by trucks. According to the Association of American Railroads (AAR), railroads, on average, are four times more fuel efficient than trucks on a ton-mile transported basis. Greenhouse gas emissions are directly related to fuel consumption; every ton-mile of freight
17 Cambridge Systematics, Indiana State Rail Plan, 2009 18 American Transportation Research Institute, An Analysis of the Operational Costs of Trucking, December 2008 19 Battelle, Development of Truck Payload Equivalent Factor, June 15, 2007

DRAFT
DRAFT
Chapter 6: Impacts of Freight Rail Transportation 6-4
moved by rail instead of truck reduces greenhouse gas emissions by 75 percent. Another study conducted by Texas Transportation Institute (TTI) shows that for shipping one million ton-miles of freight, the truck generated over 71 tons of Greenhouse Gas Emissions (GHG), while freight rail only generated 26.88 tons of GHG.
According to 2010 Environmental Protection Agency data, as shown in Exhibit 6- 3, total U.S. greenhouse gas emissions were 6,957 teragrams of carbon dioxide equivalents, with transportation accounting for 27.1 percent. Of the transportation sector’s greenhouse gas emissions, trucking accounted for 21.5 percent, while freight railroads produced only 2.4 percent. By comparison trucks and rail move comparable ton‐miles, according to the Commodity Flow Survey, for the single mode; truck shipped 1,342,104 ton-miles while rail shipped 1,344,040 ton-miles in 2007. Goods shipped by multiple modes, including truck-rail, rail-water and truck-water only accounted for 342,279 ton–miles. The estimates above indicate that freight rail shipped almost equivalent ton-miles of goods as the truck did, while truck produced almost 10 times of greenhouse gas emissions as the rail.
Exhibit 6- 3: Greenhouse Gas Emissions by Industry Sector
Source: Environmental Protection Agency
The EPA has established the SmartWay Transport Partnership to provide help to companies to calculate emissions associated with product transport. All Class I railroads operating in the U.S. participate in SmartWay.
The EPA has continued to work toward continued reductions in emissions. Taking advantage of emission control technology already implemented in highway trucks and buses, the EPA, locomotive manufacturers and the rail industry are expected to integrate engine and fuel controls to gain the greatest emission reductions. U.S. emission standards for railroad locomotives apply

DRAFT
DRAFT
Chapter 6: Impacts of Freight Rail Transportation 6-5
to newly manufactured and remanufactured railroad locomotives and locomotive engines. These standards have been adopted by the EPA in two regulatory actions.
The first emissions regulations for railroad locomotives were established in December 1997 and published in 1998. These regulations established tiers, based on when locomotives were manufactured, to guide the industry. Tier 0 standards were established for locomotives originally manufactured between 1973 and 2001. Tier 1 standards addressed new locomotives manufactured in 2002 through 2004. Tier 2 standards were established for new locomotives manufactured in 2005 and later. The Tier 0 and Tier 1 standards were intended to reduce NOx emissions by 33 percent and 50 percent, respectively, while preventing increases in other emissions such as PM. Tier 2 standards reduced NOx by 67 percent from pre‐control levels and reduced PM by 50 percent.
For the new requirements as of March 2008, the EPA introduced Tier 3 standards, to be met by engine design methods, become effective for locomotives manufactured in 2012. These standards maintain Tier 2 NOx standards while reducing PM emissions an additional 50 percent. Tier 4 standards, which are expected to require after‐treatment technologies, become effective in 2015. Tier 4 standards require a 90 percent reduction in NOx and a 93 percent reduction in PM from uncontrolled levels.
These regulations include new idle reduction requirements for newly built and remanufactured locomotives and adopt provisions to encourage a new generation of clean switcher locomotives based on clean, non-road diesel engine standards. The rule is designed to cut emissions from all types of diesel locomotives including line haul, switcher, and passenger rail.
By 2030, this program is designed to reduce annual emissions of NOx nationally by about 800,000 tons and PM emissions by 27,000 tons; those emission reductions are expected to continue to increase beyond 2030 as fleet turnover largely is completed.
Recently, the emissions of railroad yard locomotives have received attention, since rail yards tend to be located in urban areas with high pollution concentrations and because yard locomotives operate within these specific areas. A number of areas have assisted railroads in acquiring low emissions locomotives. For example, CSX initiated operation of two GenSet locomotives at the Avon Yard, just outside of Indianapolis in late 2009. The GenSet locomotives were funded by CSX and through Federal Congestion, Mitigation, and Air Quality Improvement (CMAQ) funds. The Town of Avon applied for funding on behalf of CSX, and the funding was administered through the State of Indiana. GenSet locomotives emit 80 percent less nitrogen oxides, 90 percent less particulate matter, and use 30 percent less fuel when compared to current older switch engines. Another environmentally friendly yard locomotive is referred to as the “Green Goat.” It uses diesel-battery hybrid technology which is designed to cut air emissions by 80 percent and reduce diesel fuel usage by 16 percent when compared to conventional diesels used in switching service.

DRAFT
DRAFT
Chapter 6: Impacts of Freight Rail Transportation 6-6
The railroads serving Indiana contribute to improved air quality through a decrease in highway vehicle miles traveled and vehicle emissions (both carbon and greenhouse gas).
Recent evidence also suggests that rail transportation poses lower risks for spills of hazardous materials. For example, research by the Texas Transportation Institute calculated that the rate of hazardous material spills in gallons per million ton-miles was 6.06 gallons for truck and 2.86 for rail.20
6.3 Land Use
Land use planning authority in Indiana resides with local governments. As with many states, the Indiana Department of Transportation is charged with providing a transportation system that effectively serves the transportation needs of the communities, businesses, industries, and citizens. The coordination of both land use planning and transportation planning is necessary to providing an efficient and effective coordinated system.
Rail operations have the potential to generate a range of land use impacts. Passenger rail service can promote transit-oriented development in high-density urban areas. An effective passenger rail service can improve access to city centers. New-built or refurbished rail stations can attract commercial activities and residential demand, which support more jobs, payroll and taxes revenue.
However, rail operations can also create land use issues resulting from noise and air pollution which need to be resolved. Rail yards sometimes conflict with adjoining residential and commercial areas. In many of Indiana’s urban areas, land is scarce for freight rail expansion.
There is also a trend by carriers to shift intermodal terminals away from city centers. Cities such as Memphis and Kansas City have seen intermodal rail operations moved from city centers to locations on the outskirts of these metropolitan areas. These situations can generate questions over land use with some residents concerned that the new terminals will generate suburban sprawl, while others view these developments as economic development generators. This type of debate occurred in Indiana when an intermodal terminal was proposed in LaPorte County. Supporters touted the economic benefits, while detractors opposed the project due to the potential loss of rural and agricultural land. The project has not progressed.
Some urban areas have considered rail bypass projects which aim to route freight rail operations away from city centers. The Indianapolis Metropolitan Planning Organization (MPO) recently considered whether all freight traffic that passes through the region, crossing downtown Indianapolis could be rerouted along a belt line that creates a semi-circle to the south of downtown. Rail lines radiating from downtown would then have capacity to provide passenger service.
20 Texas Transportation Institute, A Modal Comparison of Domestic Freight Transportation Effects on the General Public, Amended March 2009

DRAFT
DRAFT
Chapter 6: Impacts of Freight Rail Transportation 6-7
Local land use decisions that are contrary to rail operations must be balanced against the continued need for rail access to urban areas.
6.4 Energy Efficiency Freight railroads are an energy efficient choice for moving goods. Nationally, in 2009 one gallon of fuel moved one ton of freight by rail 480 miles.21 By contrast, the Texas Transportation Institute calculated that in 2007 truck freight moved one ton of cargo 155 miles.22 A recent study for the Federal Railroad Administration (FRA) estimated that the average long haul truck could transport one ton of freight 120 miles in 2002.23
Exhibit 6- 4
Moving more freight by rail is a straight‐ forward way to meaningfully reduce both energy use and greenhouse gas emissions without harming the economy. Furthermore, the fuel efficiency of rail has steadily improved over time. As shown in , the average number of miles a ton of freight moves per gallon of fuel has increased from 375 in 1995 to 480 in 2009, an improvement of about 1.8 percent per year. This rate of improvement compares favorably to improvements in truck fuel efficiency. For example, a recent analysis for the FRA found that improvements in fuel efficiency for trucking averaged between 0.76 percent and 1 percent, a rate of improvement that is lower than that of the railroad industry.24
Exhibit 6- 4: Ton-miles per Gallon (1995-2009)
Source: Association of American Railroads
21 Association of American Railroads, Railroad Facts, 2010 Edition 22 Texas Transportation Institute, A Modal Comparison of Domestic Freight Transportation Effects on the General Public, Amended March 2009 23 ICF International, Final Report: Comparative Evaluation of Rail and Truck Fuel Efficiency on Competitive Corridors, November 19, 2009 24 Ibid
0
100
200
300
400
500
600
1995 1996 1997 1998 1999 2000 2001 2002 2003 2004 2005 2006 2007 2008 2009
DRAFT
DRAFT
Chapter 6: Impacts of Freight Rail Transportation 6-8
Based on data from the American Association of State Highway and Transportation Officials, if one percent of long‐haul freight currently moved by truck was moved by rail instead, fuel savings would be approximately 111 million gallons per year. Moving more freight by rail would also help cut highway congestion by taking trucks off the road, especially along key corridors.
The rail mode’s fuel efficiency superiority over trucking is primarily based on the fact that it can move long and heavy loads over steel rails which result in much lower friction, and the resulting loss of energy, than trucks’ rubber tires on pavement. Also contributing to their efficiency is trains normally run at steady‐state speeds, with limited inefficiency due to acceleration, and low driven wheel traction loading.
However, in the U.S, a significant portion of the energy expended is attributed to non-haul purposes. For example, almost half of the energy consumed by freight rail is not used to move freight:
• More than 30 percent is used for empty backhaul
• About 4 percent is reported lost or spilled each year
• About 4 percent is consumed in idling
• 10 percent is used by yard locomotives assembling and switching cars
Improvements to these operations could help to promote further increases in fuel efficiency.
The Association of American Railroads, in their publication Freight Railroads & Greenhouse Gas Emissions, May 2010, also notes that railroads are curbing fuel consumption through the use of technology, training of personnel and changes in operating practices. A summary of initiatives that are improving fuel efficiency is below:
• Locomotives – Railroads, nationally, have spent billions of dollars on thousands of new environmentally friendly locomotives and have overhauled thousands of older locomotives to improve their environmental friendliness. Even if there were no improvement in efficiency over current models, improvements in efficiency just from the replacement of older models would improve fuel efficiency by 8 to 10 percent over the next 20 years. If manufacturers continue to improve efficiency as in the past, improvement will be 15 to 20 percent.25
• Locomotive Monitoring Systems – Railroads use sophisticated onboard monitoring
Use of GenSet and hybrid locomotives continues to grow. GenSets have two or three independent engines that cycle on and off, depending on need. Hybrids are equipped with a small, fossil‐fueled engine in addition to a large bank of rechargeable batteries.
25 Ibid

DRAFT
DRAFT
Chapter 6: Impacts of Freight Rail Transportation 6-9
systems to gather and evaluate information on location, topography, track curvature, train length, and weight; they provide engineers with real‐time coaching on the optimum speed for that train from a fuel savings and operational standpoint.
• Training – In many cases, railroad fuel efficiency is directly related to how well an engineer handles a train. In effect, railroads use the skills of their engineers to save fuel by offering training programs through which engineers and simulators provide fuel‐saving tips.
• Information Technology – Railroads use advanced computer software to improve their operational efficiency and, therefore, their fuel efficiency. For example, railroads use sophisticated modeling software to identify the best ways to sequence cars in a large classification yard. The result is more efficient yard operation.
• Innovative trip planning systems – Railroads also use trip planning systems that automatically analyze a mix of ever‐changing variables (e.g., crew and locomotive availability, congestion in rail yards, the priority of different freight cars, track conditions, etc.) to optimize how and when freight cars are assembled to form trains and when those trains depart. The result is smoother traffic flow, better asset utilization, and reduced fuel use.
• Reduced idling – Locomotives often have to idle when not in use for various reasons, such as preventing freezing of the coolant (most lack antifreeze), charging batteries and air reservoirs, and providing for crew comfort. However, some railroads are implementing stop‐start idling‐reduction technology that allows main engines to shut down when ambient conditions are favorable. One advantage of GenSet locomotives is that their smaller engines use antifreeze, thus allowing them to shut down in cold weather. Some railroads also use auxiliary power units that warm engines so that locomotives can be shut down in cold weather.
• Components and design – Railroads use innovative freight car and locomotive components and designs to save fuel. For example, advanced top‐of‐rail lubrication techniques save fuel by reducing friction and wear. Also, improving the aerodynamic profile of trains saves fuel by reducing drag. Keeping cars of similar size or lading together in a train minimizes gaps and cross-section changes that produce aerodynamic drag.
Many of these innovations and practices are being explored and/or practiced nationally and locally by railroads operating in Indiana.
DRAFT
DRAFT
Chapter 6: Impacts of Freight Rail Transportation 6-10
6.5 Community Impact Community and quality of life impacts related to rail transportation include safety, security, noise and air pollution, and energy. Environmental and energy contributions have been discussed earlier in this chapter. Safety and security issues are addressed in Chapter 7.
One additional community impact which has been the subject of recent attention is noise pollution related to railroad operations. This is primarily in the form of locomotive horns, which by law must be utilized as trains approach at-grade crossings as means to warn motorists and pedestrians. According to the comments of railroad employees, the noise impact is also their largest occupational health hazard.
The Federal Railroad Administration has provided localities nationwide with the opportunity to establish quiet zones at these crossing locations. A quiet zone is a grade crossing at which trains are prohibited from sounding their horns in order to decrease the noise level for nearby residential communities. Communities wishing to establish quiet zones must equip proposed grade crossings with adequate safety measures to overcome the decrease in safety created by silencing the train horns. The additional safety measures must be constructed at the community’s expense and must meet federal specifications.
Rail service in Indiana improves the quality of life in Indiana in various ways. It removes trucks from already congested roadways. According to AAR, a freight train can carry the freight of 280 and more trucks, which can create space on the roadways for 1,100 passenger cars. Relieving highway congestions also helps to save huge economic costs due to travel delays and waste of fuels. According to TTI, highway congestions in the U.S. cost $87 billion in wasted travel time and 2.8 billion gallons of fuel every year.
Freight rail service in Indiana also helps the tax payers to save money on infrastructures. According to AAR, to construct and maintain one mile of highway for a decade would cost $15 million, while only between $2 million and $4 million for one mile of railroads.
The rail industry also offers the opportunity to not only move people and goods in a fuel‐efficient manner, but will also participate significantly in the transition to alternative energy sources such as ethanol, bio fuels, and wind energy. Improvements to both the freight and passenger rail networks with strategic investments by both the private and public sectors can significantly increase the level of these benefits.
6.6 Summary A reliable, efficient, well‐maintained rail transportation system is essential to having a competitive and sustainable economy for Indiana, the region, and the nation. Rail provides Indiana business and industries a low cost transportation option for moving goods and resources within, into, out of, and through Indiana.

DRAFT
DRAFT
Chapter 6: Impacts of Freight Rail Transportation 6-11
Rail transportation is increasingly being considered a preferred alternative due to its ability to relieve congestion, concentrate development patterns, and offer a competitive advantage to business and industries in the state.
Rail transportation also has a lower environmental impact than truck and passenger vehicle transportation. As stewards of the environment, it is critical that Indiana continue to promote energy efficient transportation choices, especially rail transportation. Rail service cuts fuel consumption, leading to less dependence on foreign petroleum.
Greater reliance on passenger and freight rail will also reduce the need for highway construction. Expansion of the highway system often causes the loss of economically, environmentally, and historically valuable land, which, in turn, can contribute to inefficient land use patterns.
Preserving Indiana’s railroad network and improving its access to freight and intermodal facilities must continue to be a priority for Indiana as a means to address future economic development initiatives, as well as to provide the state’s business communities with expanded transportation options.

DRAFT
DRAFT
Chapter 7: Rail Safety and Security 7-1
Chapter 7: Rail Safety and Security Rail is a relatively safe mode of transportation. A recent analysis suggests that between 2002 and 2005, the rate of fatalities associated with rail transportation was about 0.65 per billion ton-miles, whereas the rate of fatalities associated with truck freight was about 4.4 per billion ton-miles.26
A number of federal and Indiana state agencies, in concert with local communities and Indiana rail operators continue to make progress in regards to rail safety and security. The following is a summary of these issues and activities in Indiana.
Likewise, the rate of injuries associated with rail during the same time period was found to be about 5.8 per billion ton-miles, while the rate of injuries associated with truck transportation was about 99 per billion ton-miles. That said, rail transportation is not without risks. Rail safety has been a high priority for rail carriers and public agencies alike. The focus of rail security has been aimed at threats posed by terrorists using the rail mode to harm large numbers of citizens and disrupting transportation in general.
7.1 Rail Safety Rail safety requirements are provided through a combination of federal and state laws. Most safety-related rules and regulations fall under the jurisdiction of the Federal Railroad Administration (FRA), as outlined in the Rail Safety Act of 1970 and other legislation, such as the recent Rail Safety Improvement Act of 2008.
The primary rail safety issues relate to the following:
• highway/rail at-grade crossing safety
• rail safety inspection
• trespassers on rail lines
• movement of hazardous materials
• the implementation of new technology
These issues fall under the FRA’s jurisdictions, but state agencies are heavily involved in efforts to improve rail safety. The FRA maintains a database of all accidents/incidents that are associated with railroad transportation, based upon carrier monthly reporting. As is shown in Exhibit 7- 1, the level of rail safety in Indiana has improved significantly in the past decade, with fatalities, injuries, and the number of accidents declining.
26 Texas Transportation Institute, A Modal Comparison of Domestic Freight Transportation Effects on the General Public, Amended March 2009

DRAFT
DRAFT
Chapter 7: Rail Safety and Security 7-2
Exhibit 7- 1: Total Rail Accidents/Incidents in Indiana (2001-2010)
2001 2002 2003 2004 2005 2006 2007 2008 2009 2010 Fatalities 28 26 29 39 36 23 34 28 27 16 Nonfatal Injuries 240 201 201 211 194 207 204 192 168 161 Other Accidents/Incidents 171 150 168 174 214 149 164 137 83 107
Total 439 377 398 424 444 379 402 357 278 284
Total rail accidents/incidents are the sum of train accidents, crossing incidents, and other accidents and incidents occurring in Indiana as reported by the FRA. Train accidents are defined as an “event involving on-track rail equipment that results in monetary damage to the equipment and track above a certain threshold. Lading, clearing costs and environmental damage is not included. A highway-rail incident is considered to be “any impact between a rail and a highway user at a crossing site, regardless of severity.” Other incidents are “events other than train accidents or crossing incidents that caused a death or nonfatal condition to any person.” Most fatalities in this category are trespassers. As shown in Exhibit 7- 2, train accidents usually account for a relatively small portion of accidents/incidents. In most years, other accidents/incidents occur with greater frequency than highway-rail incidents.
Exhibit 7- 2: Rail Accidents/Incidents in Indiana by Type (2001-2010)
2001 2002 2003 2004 2005 2006 2007 2008 2009 2010 Train Accidents 90 54 84 81 95 65 78 67 42 42 Highway-Rail Incidents 165 175 146 159 177 140 164 141 98 112 Other Accidents/Incidents 184 148 168 184 172 174 160 149 138 130
Total 439 377 398 424 444 378 402 357 278 284 Source: FRA Office of Safety Analysis
7.1.1 Railroad Grade Crossing Safety Highway-rail at-grade crossings are the locations where the public is most likely to be exposed to potential harm from rail operations. These are also the locations where potential hazards from the rail system are most visible. There are more than 6,000 public highway-rail crossings within Indiana. Of these, about 30 percent have flashing lights and gates, about 23 percent have flashing lights only, and the remaining roughly 48 percent have stops signs plus crossbucks, crossbucks only, or other. Exhibit 7- 3 summarizes Indiana’s highway-rail grade crossings by type of countermeasure. The 2009 Manual on Uniform Traffic Control Devices requires stop or yield signs at all passive grade crossings by 2019 in addition to crossbucks.

DRAFT
DRAFT
Chapter 7: Rail Safety and Security 7-3
Exhibit 7- 3: Indiana Highway-Rail Grade Crossing
Warning Device Number Percent of Total Active — Flashing Lights and Gates 1,954 33.0% Active — Flashing Lights Only 1,272 21.5% Other 163 2.8% Passive — Crossbucks with stop signs 981 16.6% Passive — Crossbucks Only 1,547 26.1% Totals 5,917 100%
Source: INDOT
The INDOT Office of Traffic Safety administers the federal aid rail-highway crossing program. This safety fund is commonly referred to as “Section 130” because it is authorized by United States Code Title 23, Section 130. The goal of this program is to improve the safety of the most hazardous public rail-highway crossings in the State of Indiana. Funds cannot be used to improve rail-highway crossings on privately owned roadways. Funds from the program are used to improve warning devices at crossings, such as installing warning bells, flashing lights, overhead cantilevers with flashing lights, and gates. Improvements are “train activated,” such that the warning signal is initiated with the approach of a train. With the current level of federal funding, Section 130 funds are used to upgrade approximately 20 to 25 crossings per year in Indiana. INDOT relies on federal guidance to select crossings to be improved. This criterion includes: the risk of accidents at a crossing as indicated by a “hazard index,” type of improvement to be implemented, type of protection existing on the rail corridor, type of development near the rail-highway crossing, expected motorist behavior at rail-highway crossing, and local interest in the improvement. An initial evaluation is provided by the hazard index, and the other criteria listed earlier are used to evaluate among those locations with high hazard indexes. Indiana’s Federal apportionment of Section 130 funds has averaged about $7 million over the past several years.
INDOT can also provide technical assistance to locally funded rail safety improvements at rail-highway crossings and can help to draft agreements with the affected railroad. INDOT must review the project to ensure that it meets all of the necessary requirements of Indiana state law.
The INDOT Rail Office administers the Railroad Grade Crossing Fund or RRGCF. This program was established by the Indiana Legislature and is applicable at both passive and train activated crossings. The focus of the program is on passive improvements and closures. The program is funded through the Indiana Motor Vehicle Highway Fund. Local public agencies and Class II and Class III railroads apply for other safety improvement grants with a maximum award amount of $40,000 for FY11. Crossing closure award amounts were determined by the U.S. Department of Transportation (USDOT) predicted accident rate and range from $15,000 to $37,500. In FY2011, $580,016.00 in awards was made from the RRGCF.
Grade crossing incident statistics within Indiana over the past decade are shown in Exhibit 7- 4. Crossing incidents decreased by about 29 percent between 2001 and 2010.

DRAFT
DRAFT
Chapter 7: Rail Safety and Security 7-4
Exhibit 7- 4: Indiana Grade Crossing Incidents
2001 2002 2003 2004 2005 2006 2007 2008 2009 2010 Fatalities 19 17 20 26 21 13 19 20 14 9 Injuries 62 44 37 37 32 37 48 46 38 38 Other 72 101 78 88 113 84 81 64 35 62
Total 153 162 135 151 166 134 148 130 87 109 Source: FRA Office of Safety Analysis
In addition to INDOT, local communities, Federal agencies, and rail carriers, organizations such as the Indiana Operation Lifesaver (INOL) have been working to decrease the grade crossing crash and casualty events. INOL seeks to educate the public (of all ages) about the dangers at highway-rail grade crossings and railroad rights-of-way. This educational initiative is particularly important since more than half of all crashes at railroad crossings with active protection occur when motorists ignore lights and gates that are in place and operating.
7.1.2 Rail Safety Inspection Program The Federal Rail Safety Act of 1970 authorizes states to work with the Federal Railroad Administration to enforce railroad safety regulations. The federal Rail Safety Act of 1970 authorized states to work with FRA to enforce railroad regulations at their expense. Indiana does not currently participate in the FRA Certified rail inspection program.
7.1.3 Hazardous Materials Federal common carrier obligations mandate that railroads are required to transport hazardous materials whether they want to or not. Each year, railroads transport 1.5 million to 1.6 million carloads of hazardous materials. In 2007, 99.996 percent of rail hazardous material shipments reach their destination without release caused by train accident.27
Potentially the highest risk materials to be transported by rail are toxic inhalation hazard materials (TIH). In 2007, railroad transported about 76,000 carloads of TIH materials (less than a quarter percent of total carloads), almost exclusively in tank cars. In November 2008, the USDOT established rules under which trains carrying TIH materials must be routed on the safest and most secure rail lines. Railroads must conduct ongoing comprehensive risk analyses of their primary TIH routes and any alternative practical alternative routes over which they have authority to operate.
Rail hazmat accidents have decreased by 81 percent since 1980.
Railroads have initiated the following to improve the safety of hazmat transportation on their systems:
• Developing safer tank cars
27 Association of American Railroads Policy and Economics Department
DRAFT
DRAFT
Chapter 7: Rail Safety and Security 7-5
• Training emergency responders and employees in hazmat transportation
• Providing local authorities with lists of hazardous materials being transported through their communities
• Providing Transportation Security Administration with TIH movement data
• Conducting rigorous hazmat route risk analyses
At the state level, the Indiana Department of Homeland Security oversees the registration and regulation of transporters of hazardous materials.
7.1.4 Positive Train Control Positive Train Control (PTC) systems are integrated command, control, communications, and information systems for controlling train movements. These systems can automatically stop or slow trains before certain accidents, caused by human error, occur. Potential accidents avoided include train-to-train collisions, derailments from excessive speeds, movement of trains through a track switch in the wrong position, unauthorized incursions of trains where maintenance activities are taking place.
The Rail Safety Improvement Act of 2008 required railroads to place PTC systems in service by December 31, 2015 on Class I rail road with more than 5 million gross ton-miles per mile, with commuter or intercity passenger rail operations, or movement of TIH materials. The FRA estimates that about 65,000 route miles of Class I freight rail lines would be impacted, although industry estimates suggest closer to 73,000 route miles. The FRA estimates that the system will cost $5.4 billion to implement and then another $816 million per year to maintain. Annual benefits from accident prevention will be $65 million.28
The cost of implementing PTC could have implications for future rail service plans and for future rail investment.
However, the FRA believes that there will be additional business benefits to railroads that will compensate the otherwise unfavorable relationship between benefits and costs. The railroad industry disputes the forecasted business benefits.
7.2 Rail Security Since the events of September 11, 2001, the focus of rail security has shifted more toward responses to potential terrorist threats to the rail system.
7.2.1 Federal and State Roles in Railroad Security The U.S. Department of Homeland Security addresses rail system security through the following:
28 FRA, Positive Train Control Regulatory Impact Analysis, December 8, 2009.

DRAFT
DRAFT
Chapter 7: Rail Safety and Security 7-6
• Training and deploying manpower and assets for high risk areas
• Developing and testing new security technologies
• Performing security assessments of systems across the country
• Providing funding to state and local partners
The Department of Homeland Security provided Freight Rail Security Grants to the Indiana Harbor Belt Railroad in fiscal year 2008 and 2010. Other companies that operate in Indiana that received grants over the past several years include the Chicago, Ft. Wayne & Eastern, Chicago South Shore and South Bend, CSX, Indiana & Ohio, Indiana Rail Road, Indiana Southern, NS, and Louisville and Indiana.
The Association of American Railroads, working with Homeland Security and other federal agencies, has organized the Rail Security Task Force. This task force developed a comprehensive risk analysis and security plan for the rail system that includes:
• A database of critical rail assets
• Assessments of railroad vulnerabilities
• Analysis of terrorism threat
• Calculation of risk and identification of countermeasures
The railroad sector maintains communications with the U.S. Department of Defense (DOD), the U.S. Department of Homeland Security, and the U.S. Department of Transportation, the Federal Bureau of Investigations and local law enforcement agencies on all aspects of rail security.
The lead agency for rail security in Indiana is the Indiana Department of Homeland Security (IDHS). Rail security is implicit within the organization’s work in coordinating security planning and risk assessments, training and certifying emergency services and first responder personnel, maintaining emergency response and recovery capabilities.
7.2.2 Strategic Rail Corridor Network The Strategic Rail Corridor Network (STRACNET) is a 32,000 mile interconnected network of rail corridors and associated connector lines that have been identified by the U.S. military as important to national defense. The STRACNET connects all major Army installations, depots and ports of embarkation. Rail transportation is extremely important to DOD since the predominance of heavy and tracked vehicles will deploy by rail to seaports of embarkation. The practical implications of the STRACNET are that all rail lines on the network must maintain a clearance profile to accommodate 86 percent of DOD types of equipment and 99 percent of individual pieces of equipment in the DOD inventory. All lines must have overhead clearance of at least 16.92 feet above rails and a horizontal clearance of 12 feet. These are taller and wider

DRAFT
DRAFT
Chapter 7: Rail Safety and Security 7-7
clearances than the AAR “Plate C” standard of 15 feet 6 inch clearance above rails and 10 foot 8 inch width. INDOT works with the Military Surface Deployment and Distribution Command to ensure that the defense implications of these rail lines are considered in planning and any network changes. Military installations in Indiana that require reliable rail service include Camp Atterbury Joint Maneuver Training Center (CA JMTC) near Edinburgh and Crane Naval Surface Warfare Center near Crane, IN. The STRACNET network in Indiana is shown in Exhibit 7- 5.
Exhibit 7- 5: Indiana STRACNET Map
Source: U.S. Surface Deployment and Distribution Command
DRAFT
DRAFT
Chapter 8: Rail Passenger Service in Indiana 8-1
Chapter 8: Rail Passenger Service in Indiana This chapter discusses the existing intercity rail and commuter rail operations in Indiana. These services are provided by Amtrak and the Northern Indiana Commuter Transportation District, respectively. Intercity rail passenger services focus primarily on long distance trips, often measuring in the hundreds, if not thousands, of miles. Commuter rail service focuses on moving workers from residential areas to urban work centers on weekdays, with trips averaging typically from 30 to 50 miles. However, commuter rail systems can also provide access to tourism and cultural attractions.
8.1 Existing Intercity Passenger Rail System Routes Intercity passenger rail travel is provided by the National Railroad Passenger Corporation, also known as Amtrak, to a limited number of cities across Indiana’s northern and central regions. Amtrak Thruway Motor Coach services provide connections to Amtrak trains in South Bend and Indianapolis, as well as in Louisville, KY, serving southern Indiana residents. Amtrak services in Indiana are discussed below.
8.1.1.1 Cardinal/Hoosier State
The Cardinal operates between New York and Chicago. The service consists of one round-trip three days a week. The Hoosier State route joins the Cardinal route in Indianapolis, providing a daily route to Chicago. The Cardinal only makes five station stops in Indiana: Connersville, Indianapolis, Crawfordsville, Lafayette, Rensselaer and Dyer. Other stops on the Cardinal route include Philadelphia, Baltimore, Washington DC and Charleston, WV. Westbound the Cardinal leaves New York’s Penn Station at 6:45 AM and arrives in Chicago at 10:05 AM the following day. Eastbound, the train leaves Chicago at 5:45 PM and reaches New York at 9:56 PM the next day. Station stops in Indianapolis are made at 4:57 AM (westbound) and 11:50 PM (eastbound). Exhibit 8- 1 shows the distances between some of the stops along this route.
Exhibit 8- 1: Route Segments of Cardinal/Hoosier State
Route Segment Distance New York – Philadelphia 91 miles Philadelphia – Baltimore 94 miles Baltimore – Washington D.C. 40 miles Washington D.C. – Charleston 394 miles Charleston – Cincinnati 209 miles Cincinnati – Indianapolis 123 miles Indianapolis – Chicago 196 miles
Total 1,147 miles (225 miles within Indiana) Source: Amtrak System Time Table, effective Nov 2010 – April 2011
Through Indiana, the Cardinal and Hoosier State trains run on tracks belonging to CSX Transportation.

DRAFT
DRAFT
Chapter 8: Rail Passenger Service in Indiana 8-2
Exhibit 8- 2: Cardinal/Hoosier State Route
Source: Amtrak
8.1.1.2 Capitol Limited
The Capitol Limited operates between Washington DC and Chicago. The service consists of one round-trip daily, stopping at Waterloo, Elkhart and South Bend. Intermediate stops outside of Indiana include Pittsburgh, Cleveland, and Toledo. Westbound the train leaves Washington DC at 4:05 PM and arrives in Chicago at 8:45 AM the following day. The train on the eastbound route leaves Chicago at 6:10 PM and reaches Washington DC at 12:40 PM the following day. Stops are made in Indiana from 6:36 AM to 7:51 AM (westbound) and 8:34 PM to 9:44 PM (eastbound). Exhibit 8- 3 shows the distances between some of the stops along this route.
Exhibit 8- 3: Route Segments of the Capitol Limited
Route Segment Distance Washington D.C. – Cleveland 439 miles Cleveland – Toledo 107 miles Toledo – South Bend 150 miles South Bend – Chicago 84 miles
Total 780 miles (140 miles within Indiana)
The Capitol Limited runs on the Norfolk Southern Railway’s Chicago-Cleveland line between Chicago and Porter, South Bend and beyond.

DRAFT
DRAFT
Chapter 8: Rail Passenger Service in Indiana 8-3
Exhibit 8- 4: Capitol Limited Route
Source: Amtrak
8.1.1.3 Lake Shore Limited
The Lake Shore Limited operates between Boston and New York City (the two sections connecting in Albany, NY) and Chicago. The service consists of one round-trip per day and makes the same Indiana stops as the Capitol Limited. Intermediate stops outside of Indiana include Syracuse, NY, Erie, PA, and Cleveland, OH. Westbound trains leave New York at 3:45 PM and Boston at 11:55 AM and arrive in Chicago at 9:45 AM the next day. Eastbound, the train leaves Chicago at 9:30 PM and arrives in Boston at 9:10 PM and New York at 6:35 PM the next day. West of Cleveland, the Lake Shore Limited travels the same route as the Capitol Limited. Indiana stops occur between 7:33 AM and 8:49 AM (westbound) and between 11:59 PM and 1:15 AM (eastbound). Exhibit 8- 5 shows the distances between some of the stops along this route.
Exhibit 8- 5: Route Segments of the Lake Shore Limited
Route Segment Distance New York – Cleveland 618 miles Boston – Cleveland 676 miles Cleveland – Toledo 107 miles Toledo – South Bend 150 miles South Bend – Chicago 84 miles
Total
959 miles New York – Chicago 1,017 miles Boston – Chicago
(140 miles within Indiana) Source: Amtrak System Time Table, effective Nov 2010 – April 2011

DRAFT
DRAFT
Chapter 8: Rail Passenger Service in Indiana 8-4
Exhibit 8- 6: Lake Shore Limited Route
Source: Amtrak
8.1.1.4 Michigan City Services
Amtrak operates three Michigan services traversing northern Indiana: the Wolverine between Chicago, Detroit and Pontiac; the Blue Water between Chicago and Port Huron; and the Pere Marquette, between Chicago and Grand Rapids. Only the Wolverine has stops in Indiana: Michigan City and Hammond-Whiting.
The Wolverine has three round trips daily. Eastbound trains depart Chicago at 7:30 AM, 12:16 PM, and 6:00 PM, and arrive at Pontiac via Detroit at 3:07 PM, 7:45 PM and 1:31 AM, respectively. Westbound, trains depart Pontiac at 6:05 AM, 10:40 AM and 5:35 PM, and arrive in Chicago at 11:24 AM, 4:16 PM and 11:03 PM, respectively. Eastbound train stops in Indiana for the Wolverine occur at 7:55 AM and 12:41 PM at Hammond-Whiting and at 1:22 PM and 7:03 PM at Michigan City. Westbound train stops occur at 3:23 PM and 10:23 PM at Hammond-Whiting and at 9:38 PM at Michigan City. This train runs on the NS Chicago Cleveland line to Porter, thence on the Amtrak line to Michigan City and on to Michigan.
The Blue Water has one round trip daily. Eastbound trains depart Chicago at 4:10 PM and arrive in Port Huron at 12:11 AM. Westbound, trains depart Port Huron at 6:00 AM, and arrive in Chicago at 11:59 AM. Indiana residents can access this train at New Buffalo, MI, 10 miles east of Michigan City at 6:23 PM (eastbound) and 11:34 AM (westbound). The Blue Water shares its route with the Wolverine between Chicago and Battle Creek, MI.
The Pere Marquette has one round trip daily. Eastbound trains depart Chicago at 5:20 PM and arrive in Grand Rapids at 10:20 PM. Westbound, trains depart Grand Rapids at 7:35 AM and arrive in Chicago at 10:33 AM. Indiana residents can access this train at St. Joseph-Benton Harbor, MI, 37 miles east of Michigan City at 8:03 PM (eastbound) and 9:39 AM (westbound). The Pere Marquette shares its route with the Capitol Limited, the Lakeshore Limited, Wolverine and Blue Water between Chicago and Porter, and thence it runs on the CSXT through Michigan City and on to Michigan.

DRAFT
DRAFT
Chapter 8: Rail Passenger Service in Indiana 8-5
Exhibit 8- 7: Route Segments of the Michigan City Services Route Segment Distance
Chicago – Grand Rapids 176 miles Chicago – Port Huron 319 miles Battle Creek – Detroit 121 miles Detroit – Pontiac 23 miles
Total
539 miles (48 miles within Indiana with two routes)
Exhibit 8- 8: Michigan City Service Route
Source: Amtrak
8.1.1.5 Thruway Motorcoach Connections29
The Cardinal/Hoosier State intercity rail service is supplemented by daily Amtrak Thruway Motorcoach service in Chicago, Indianapolis and Louisville, KY; Louisville serves southern Indiana residents. Thruway service, provided by Greyhound Lines, departs Louisville Greyhound Station at 12:01 AM arriving in Indianapolis at 2:10 AM. Another departs at 10:10 AM, arriving in Indianapolis at 1:155 PM. Southbound, a bus departs Chicago at 3:25 PM, arriving in Indianapolis at 8:40 PM and at Louisville at 11:30 PM. Another departs Indianapolis at 5:00and arrives in Louisville Greyhound Station at 7:10 AM.
Thruway also provides connections from Indianapolis to the City of New Orleans in Champaign-Urbana, IL; to the Texas Eagle in Bloomington-Normal, IL; and to the California Zephyr and Southwest Chief at Galesburg, IL. Burlington Trailway buses depart Indianapolis westbound at 9:20A and 12:50 PM and eastbound buses arrive in Indianapolis at 8:00 PM and 11:30 PM.
8.1.2 Ridership National intercity rail passenger ridership and revenues reached their highest levels in Amtrak history in FY 2010 with nearly 29 million passengers carried and $1.74 billion in ticket revenues. Passenger train boardings and alightings in Indiana in FY 2010 totaled just over 136,000, up 10 percent from the FY 2009. Boardings and alightings in the state for FY 2008 and FY 2009 were
29 Hoosier Ride also provides a feeder bus service into the Indianapolis Greyhound station, which is co-located with Amtrak and at the South Bend Regional Airport, which is co-located with NICTD service. This service is operated by Miller Trailways and is funded through a rural transit grant that is administered by INDOT.

DRAFT
DRAFT
Chapter 8: Rail Passenger Service in Indiana 8-6
over 123,000 and 124,000, respectively. Exhibit 8- 9 shows the boardings and alightings at each station in Indiana for FY 2008 through FY 2010.

DRAFT
DRAFT
Chapter 8: Rail Passenger Service in Indiana 8-7
Exhibit 8- 9: Amtrak Ridership in Indiana from FY 2008 to FY 2010
Source: Great American Stations: National Association of Railroad Passengers, Amtrak Ridership Statistics (2004 – 2009)
Connersville Crawfordsville Dyer Elkhart Hammond-Whiting Indianapolis Lafayette Michigan City Rensselaer South Bend Waterloo
FY2008 647 4,942 2,162 14,026 6,280 33,035 22,361 2,176 1,830 17,420 17,664FY2009 546 5,207 2,324 13,311 6,010 31,651 24,022 2,288 1,820 18,309 18,818FY2010 659 5,488 2,257 16,080 6,638 32,125 25,805 3,395 1,847 21,063 21,372
0
5,000
10,000
15,000
20,000
25,000
30,000
35,000
Num
ber o
f Rid
ers

DRAFT
DRAFT
Chapter 8: Rail Passenger Service in Indiana 8-8
8.1.3 Stations As well as being gateways to trains, rail stations are a focus for activity. They foster economic development, commercial endeavors, tourism, cultural activities, civic pride and historic preservation. There are 11 Amtrak stations in Indiana.
Station facilities are either platforms with or without shelters or structures with enclosed waiting rooms. Two of these stations – Elkhart and Lafayette – occupy historic structures. The other nine stations provide more utilitarian shelters or none at all.
Of the 11 Indiana stations, six are served by the Cardinal, five by the Hoosier State, three by the Capitol Limited and Lake Shore Limited, and two by the Wolverine. As previously noted, Amtrak Thruway Motorcoach services stop at Indianapolis. One station, Crawfordsville, served by the Cardinal and the Hoosier State, is a flag stop. Passengers generally are required to have reservations to board and alight flag stop stations; otherwise, the train will pass the station at speed. A passenger can pay the conductor for a ticket.
Only two of the stations are staffed, Indianapolis and South Bend. Both have checked baggage service. Only Lafayette has Amtrak’s QuikTrak automatic ticket vending machines. Two stations are fully wheelchair accessible; five others have some barriers for wheelchairs.
With the exception of Indianapolis, there are no intercity bus connections at the stations. Indianapolis’s station sits atop an intermodal center. Limited parking is generally available at or near the stations.
A Report on Accessibility and Compliance with the Americans with Disabilities Act of 1990, produced by Amtrak in 2009, notes that 10 Indiana stations are required to be ADA compliant. The 10 were assessed as to the levels of ADA compliance of their station structures, platforms and pathways. None of the stations was cited as fully compliant (rated at between 80 percent and 100 percent compliant) in terms of their station structures, platforms and pathways. Six stations were rated as partially complaint on all three counts (rated at 21 percent to 79 percent compliant). These were Connersville, Dyer, Elkhart, Lafayette, Michigan City, and South Bend.
Indianapolis and Waterloo were found to be fully compliant in terms of their station structure, and partially compliant in terms of their platforms and pathways. Hammond-Whiting was found to be fully compliant in terms of its pathways, but partially compliant in terms of its station structure and platforms. Rensselaer was found to be minimally compliant (rated at 1 percent to 20 percent compliant) in terms of its station structures, platforms and pathways.
For the 10 Indiana stations, ADA Compliance and State of Good Repair needs totaled to $15 million. Exhibit 8- 10 summarizes Indiana station-specific information. The information appearing there was obtained from the current Amtrak system timetable, Great American Stations (www.greatamericanstations.com), and the 2009 Amtrak ADA Compliance Study.

DRAFT
DRAFT
Chapter 8: Rail Passenger Service in Indiana 8-9
Exhibit 8- 10: Amtrak Stations in Indiana
Location Hammond-Whiting Michigan City South Bend Elkhart Waterloo
Owner
Amtrak (facility and parking) / Norfolk Southern Railway (platform and tracks) Amtrak
Northern Indiana Commuter Transportation District (facility and parking) / Norfolk Southern Railway (platform and tracks)
City of Elkhart (facility and parking)/ Norfolk Southern Railway (platform and tracks)
Amtrak (facility)/ Norfolk Southern Railway (platform and tracks)
Address 1135 North Calumet Avenue Hammond, IN 46320
100 Washington Street Michigan City, IN 46360
2702 West Washington Avenue, South Bend, IN 46628
131 Tyler Avenue Elkhart, IN 46515
Lincoln and Center Street Waterloo, IN 46793
Served by Wolverine Wolverine Capitol Limited and Lake Shore Limited
Capitol Limited and Lake Shore Limited
Capitol Limited and Lake Shore Limited
Flag Stop Regular stop Regular stop Regular stop Regular stop Regular stop
Shelter
Modern brick and metal structure built by Amtrak in the early 1980s Platform only
Utilitarian one-story concrete block structure
Historic two-story depot, of red brick and limestone, constructed in 1900
Small glass and metal shelter adjacent to platform
ADA
Station wheelchair accessible, not all station facilities accessible Partially ADA compliant Fully wheelchair accessible
Fully wheelchair accessible: no barriers between platform and train.
Station wheelchair accessible, not all station facilities accessible
Depot Hours Monday to Friday: noon to 5pm; weekend closed No station hours
6:30 am to 2:00 pm, and 5:30 pm to 1am
Open for train arrivals and departures No station hours
Baggage Service No baggage service No baggage service Checked baggage service No baggage service No baggage service
Restrooms Open during station hours No restrooms Open during station hours Open for train arrivals and departures No restrooms
Ticketing. No ticketing No ticketing Staffed counter No ticketing No ticketing
Telephones No telephones No telephones Payphone available during station hours Payphone available Payphone available
Shared Uses No shared use No shared use No shared use No shared use No shared use
Parking
Short term parking on street adjacent to station for passengers; long term pay parking available from private lot
Short and long term parking available adjacent to station
Unattended long term and short term parking available
Unattended long term and short term parking available
Unattended long term and short term parking available
Thruway No Thruway connection No Thruway connection No Thruway connection No Thruway connection No Thruway connection
Other
$2.107 million in ADA Compliance and State of Good Repair needs
$0.603 million in ADA Compliance and State of Good Repair needs
$2.689 million in ADA Compliance and State of Good Repair needs
$2.056 million in ADA Compliance and State of Good Repair needs
$1.674 million in ADA Compliance and State of Good Repair needs

DRAFT
DRAFT
Chapter 8: Rail Passenger Service in Indiana 8-10
Exhibit 8- 10: Amtrak Stations in Indiana (cont.) Location Dyer Rensselaer Lafayette Crawfordsville Indianapolis Connersville
Owner CSXT /Amtrak (facility) CSXT/Amtrak (facility)
City of Lafayette (facility and parking) / CSXT (platform and tracks) CSXT/Amtrak (facility) City of Indianapolis
CSXT /Amtrak (platform)
Address 913 Sheffield Avenue Dyer, IN 46311
776 North Cullen Street Rensselaer, IN 47978
200 North Second Street Lafayette, IN 47901
400 North Green Street Crawfordsville, IN 47933
350 South Illinois Street Indianapolis, IN 46225
1012 Eastern Avenue Connersville, IN 47331
Served by Cardinal and Hoosier State
Cardinal and Hoosier State
Cardinal and Hoosier State Cardinal and Hoosier State Cardinal and Hoosier State Cardinal
Flag Stop Regular stop Regular stop Regular stop Flag stop Regular stop Regular stop
Shelter
Glass and aluminum shelter adjacent to the platform, some seating
Simple enclosed shelter with wooden benches, lighting, and electrical heat that stands by the platform
Romanesque style brick “Big Four” depot was built in 1902
Enclosed shelter on the platform
Modern intermodal Indianapolis station sits south of the historic 1888 Indianapolis Union Station, under a 1979 concrete train shed; waiting room
Brick shelter on the platform
ADA Partially ADA compliant. Minimally ADA compliant
Station wheelchair accessible, not all station facilities accessible
Station wheelchair accessible, not all station facilities accessible
Station wheelchair accessible, not all station facilities accessible
Partially ADA compliant
Depot Hours No station hours No station hours 6:00 am to 10:00 pm daily No station hours Open 24 hours daily No station hours
Baggage service No baggage service No baggage service No baggage service No baggage services Checked baggage service No baggage service
Restrooms No restrooms No restrooms Restrooms available during station hours No restrooms Restrooms available No restrooms
Ticketing No ticketing No ticketing Quik-Trak self-serve ticketing kiosk No ticketing Staffed counter No ticketing
Telephones No telephones No telephones Payphones during station hours Payphones available Payphones available No telephones
Shared Uses No shared use No shared use No shared use No shared use Set above an intermodal station No shared use
Parking
Free short and long term parking available for passengers adjacent to the station
Free short and long term parking available for passengers adjacent to the station
City parking available for passengers; long term parking requires permit
Unattended short and long term parking available for passengers adjacent to station
Public parking available at Crowne Plaza Hotel at station
Unattended parking available adjacent to shelter
Intermodal No Thruway connection No Thruway connection No Thruway connection No Thruway connection Thruway and Greyhound connection
No Thruway connection
Other
$1.027 million in ADA Compliance and State of Good Repair needs
$1.121 million in ADA Compliance and State of Good Repair needs
$0.682 million in ADA Compliance and State of Good Repair needs
Not reviewed in 2009 Amtrak ADA compliance study
$2.193 million in ADA Compliance and State of Good Repair needs
$0.890 million in ADA Compliance and State of Good Repair needs
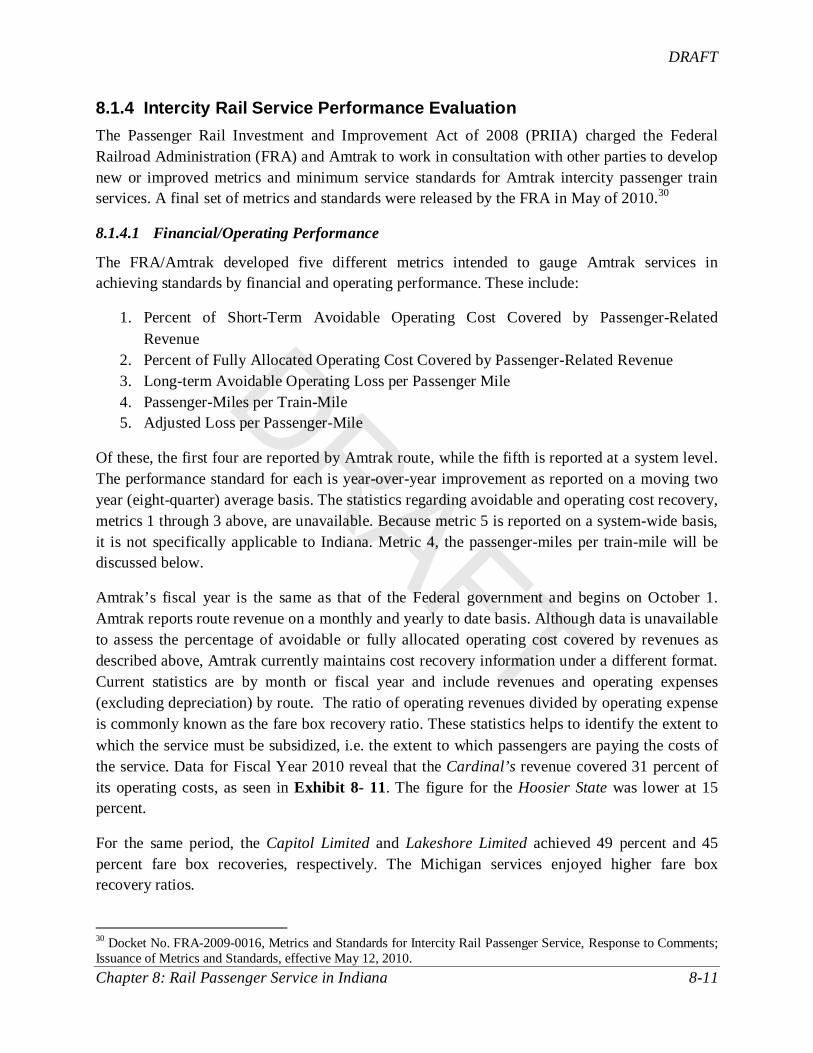
DRAFT
DRAFT
Chapter 8: Rail Passenger Service in Indiana 8-11
8.1.4 Intercity Rail Service Performance Evaluation The Passenger Rail Investment and Improvement Act of 2008 (PRIIA) charged the Federal Railroad Administration (FRA) and Amtrak to work in consultation with other parties to develop new or improved metrics and minimum service standards for Amtrak intercity passenger train services. A final set of metrics and standards were released by the FRA in May of 2010.30
8.1.4.1 Financial/Operating Performance
The FRA/Amtrak developed five different metrics intended to gauge Amtrak services in achieving standards by financial and operating performance. These include:
1. Percent of Short-Term Avoidable Operating Cost Covered by Passenger-Related Revenue
2. Percent of Fully Allocated Operating Cost Covered by Passenger-Related Revenue 3. Long-term Avoidable Operating Loss per Passenger Mile 4. Passenger-Miles per Train-Mile 5. Adjusted Loss per Passenger-Mile
Of these, the first four are reported by Amtrak route, while the fifth is reported at a system level. The performance standard for each is year-over-year improvement as reported on a moving two year (eight-quarter) average basis. The statistics regarding avoidable and operating cost recovery, metrics 1 through 3 above, are unavailable. Because metric 5 is reported on a system-wide basis, it is not specifically applicable to Indiana. Metric 4, the passenger-miles per train-mile will be discussed below.
Amtrak’s fiscal year is the same as that of the Federal government and begins on October 1. Amtrak reports route revenue on a monthly and yearly to date basis. Although data is unavailable to assess the percentage of avoidable or fully allocated operating cost covered by revenues as described above, Amtrak currently maintains cost recovery information under a different format. Current statistics are by month or fiscal year and include revenues and operating expenses (excluding depreciation) by route. The ratio of operating revenues divided by operating expense is commonly known as the fare box recovery ratio. These statistics helps to identify the extent to which the service must be subsidized, i.e. the extent to which passengers are paying the costs of the service. Data for Fiscal Year 2010 reveal that the Cardinal’s revenue covered 31 percent of its operating costs, as seen in Exhibit 8- 11. The figure for the Hoosier State was lower at 15 percent.
For the same period, the Capitol Limited and Lakeshore Limited achieved 49 percent and 45 percent fare box recoveries, respectively. The Michigan services enjoyed higher fare box recovery ratios.
30 Docket No. FRA-2009-0016, Metrics and Standards for Intercity Rail Passenger Service, Response to Comments; Issuance of Metrics and Standards, effective May 12, 2010.

DRAFT
DRAFT
Chapter 8: Rail Passenger Service in Indiana 8-12
Excluding the Hoosier State, the financial performance of Amtrak trains through Indiana has fare box recovery ratio fall 31 to 105 percent in FY2010. For Fiscal Year 2010, Amtrak’s total long distance service generated a 48 percent fare box recovery.
Exhibit 8- 11: Fare Box Recoveries for Trains Running through or Serving Indiana (October to September 2010 and 2009, in Millions of Dollars)
Train
FY 2010 FY 2009 % Change Fare Box FY09 to
FY10 Revenue Expense Fare Box Revenue Expense
Fare Box
Cardinal $7.0 $22.3 31% $7.0 $21.6 32% -1% Hoosier State $0.8 $5.5 15% $0.7 $3.7 19% -4% Capitol Limited $20.2 $41.1 49% $19.1 $37.7 51% -2%
Lakeshore Limited $29.3 $64.8 45% $25.5 $55.9 46% 0%
Wolverines $18.1 $35.5 51% $16.2 $32.7 50% 1% Blue Water $8.9 $12.3 72% $9.1 $11.8 77% -5% Pere Marquette $6.9 $6.6 105% $5.3 $6.3 84% 20%
While the statistics are currently unavailable to characterize changes in the percentage of short-term avoidable, long-term avoidable, fully allocated operating costs covered by passenger revenues, it is still instructive to consider changes in fare box recovery ratios between the most recent and prior fiscal year. In terms of changes to fare box recovery ratio, results were mixed. Fare box recovery improved for the Pere Marquette and Wolverine service between FY2010 and FY2009, but held constant or decreased for the remaining routes.
As mentioned above, Amtrak/FRA have also developed a metric which measures passenger miles per train mile per route. This statistic effectively records the load factors of Amtrak trains, i.e., the average number of passengers on a train at a given time on the train’s route. The results as displayed in Exhibit 8- 12 suggest that load factors have generally improved. The one exception is the Pere Marquette, which saw a slight decrease in passenger miles per train mile.

DRAFT
DRAFT
Chapter 8: Rail Passenger Service in Indiana 8-13
Exhibit 8- 12: Change in Passenger Miles per Train Mile, Two Years Ending March 2011 to Two Years Ending March 2010
Train April 2009 - March 2011
April 2008 - March 2010 Change Percent
Change Cardinal 124 123 1 1% Hoosier State 63 61 2 3% Capitol Limited 193 192 1 1% Lakeshore Limited 222 200 22 11%
Wolverines 152 144 8 6% Blue Water 135 119 16 13% Pere Marquette 124 126 -2 -2%
8.1.4.2 On-Time Performance
The FRA and Amtrak developed the following metrics to evaluate route performance in terms of on-time performance and train delays:
1. Change in Effective Speed, to be calculated on a rolling four-quarter basis and compared to a fixed FY2008 baseline;
2. Percent of trains on time (OTP) at endpoint of the route; and 3. Percent of trains on time (OTP) all-stations on the route.
The standard for on time performance is 80 percent for services serving Indiana. Amtrak defines On-Time Performance (OTP) as the total number of trains arriving on-time at a station divided by the total number of trains operated on that route. A train is considered on-time if it arrives at a station within an allowed number of minutes, or tolerance, of its scheduled arrival time. Trains are allowed a certain tolerance based on how far they travel. Exhibit 8- 13 provides the most recently available On-time Performance statistics for train routes through Indiana. The results suggest that train speeds have improved since FY2008 but that, with the exception of the Pere Marquette all-station OTP statistic, all routes are operating below standard for On-time Performance.

DRAFT
DRAFT
Chapter 8: Rail Passenger Service in Indiana 8-14
Exhibit 8- 13: On Time Performance for Amtrak Routes that Pass through Indiana
Train
Change in Effective Speed (mph) FY2008 to
12 months ended 3/11
Endpoint OTP 2nd
All-Station OTP 2 Quarter
FY 2011 nd
Cardinal
Quarter FY 2011
0.9 52.6% 42.2% Hoosier State 1.8 65.7% 74.4% Capitol Limited 1.5 57.8% 52.1% Lakeshore Limited 0.8 55.2% 39.3%
Wolverines 1.3 24.9% 43.2% Blue Water 2.6 60.2% 75.5% Pere Marquette 2.5 64.4% 81.6%
Amtrak/FRA metrics also consider the cause of delays. For routes that pass through Indiana, host-responsible delays are expected to be no more than 900 minutes per 10,000 train-miles. As can be seen from Exhibit 8- 14 below, each Amtrak service through Indiana with the exception of the Hoosier State exceeds the 900 minute standard for host railroad delays on at least one host carrier line. Values that exceed the standard are indicated in red.
Train interference delays including freight train, passenger train, commuter train interference result from meeting or following other trains in the area.
Signal delays are related signal failures or signal maintenance. Included are delays from reduced speeds to allow safe operation due to the signal problems.
Slow order delays result from temporary reductions in allowable train speeds, except for heat or cold orders.
Routing delays are caused by delayed dispatch, diversions, late track bulletins, etc.

DRAFT
DRAFT
Chapter 8: Rail Passenger Service in Indiana 8-15
Exhibit 8- 14: Host Railroad Responsible Delays in Minutes Delay per 10,000 Train Miles 2nd Quarter FY 2011
Train Host
Total Delay (Min)
Largest Delay Category 2nd Largest Delay Category
Cause Minutes Cause Minutes Cardinal BBRR
312,488
Freight Train Interference
692 Passenger Train Interference
686
CSX 781 Freight Train Interference
281 Signal Delays 278
NS 1,086 Freight Train Interference
466 Signal Delays 311
Hoosier State
CSX 876 Freight Train Interference
356 Signal Delays 349
Capitol Limited
CSX 938 Freight Train Interference
274 Slow Order Delays 191
NS 1,359 Freight Train Interference
689 Routing 285
Lakeshore Limited
CSX 1,404 Freight Train Interference
387 Slow Order Delays 336
MNRR 1,237 Commuter Train Interference
487 Routing 305
NS 1,401 Freight Train Interference
676 Routing 274
Wolverines Amtrak 640 Passenger Train Interference
383 Signal Delays 115
CN 2,596 Slow Order Delays 1,404 Freight Train Interference
503
NS 2,208 Slow Order Delays 700 Signal Delays 525 Blue Water Amtrak 584 Passenger Train
Interference 446 Routing 47
CN 1,505 Freight Train Interference
636 Passenger Train Interference
484
NS 2,686 Routing 1,194 Freight Train Interference
531
Pere Marquette
CSX 805 Signal Delays 505 Routing 120 NS 3,158 Freight Train
Interference 1,035 Signal Delays 788
Amtrak and FRA have also determined a standard of 325 minutes or less per 10,000 trail-miles for Amtrak responsible delays. As can be seen from Exhibit 8- 15 below, the Lake Shore Limited is the only service that passes through Indiana for which this standard has been met. Values that exceed the standard are indicated in red.
31 Buckingham Branch Railroad
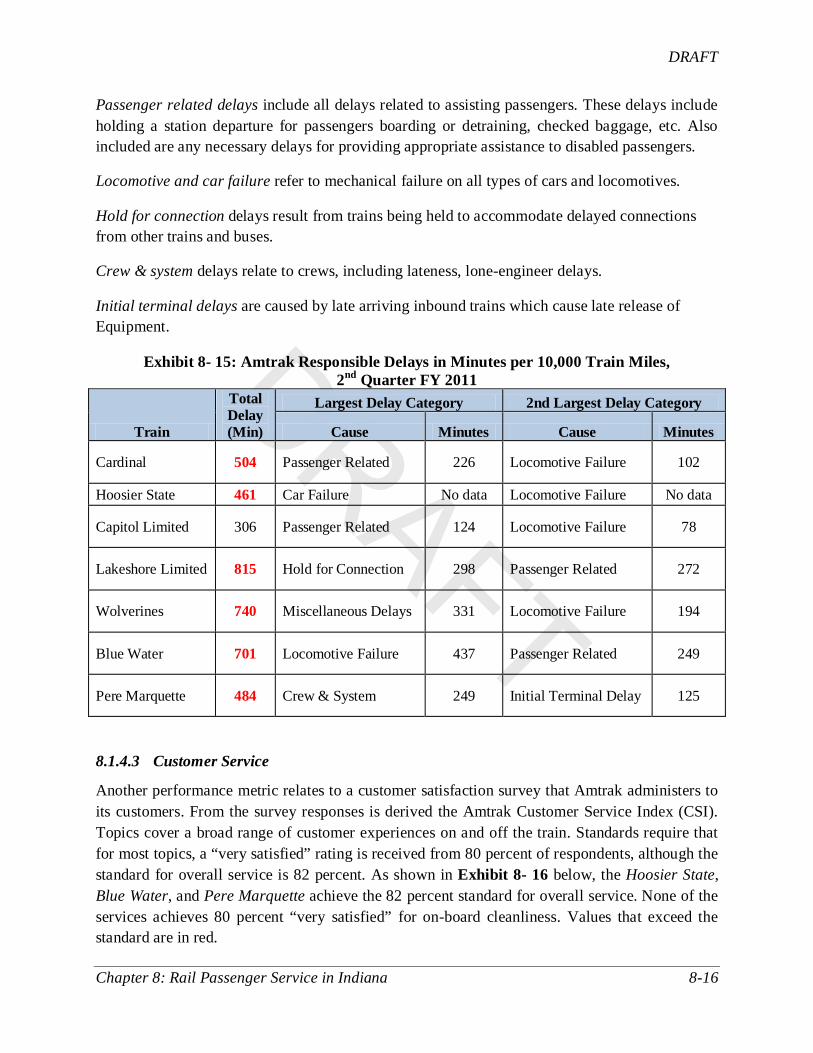
DRAFT
DRAFT
Chapter 8: Rail Passenger Service in Indiana 8-16
Passenger related delays include all delays related to assisting passengers. These delays include holding a station departure for passengers boarding or detraining, checked baggage, etc. Also included are any necessary delays for providing appropriate assistance to disabled passengers.
Locomotive and car failure refer to mechanical failure on all types of cars and locomotives.
Hold for connection delays result from trains being held to accommodate delayed connections from other trains and buses.
Crew & system delays relate to crews, including lateness, lone-engineer delays.
Initial terminal delays are caused by late arriving inbound trains which cause late release of Equipment.
Exhibit 8- 15: Amtrak Responsible Delays in Minutes per 10,000 Train Miles, 2nd
Train
Quarter FY 2011 Total Delay (Min)
Largest Delay Category 2nd Largest Delay Category
Cause Minutes Cause Minutes
Cardinal 504 Passenger Related 226 Locomotive Failure 102
Hoosier State 461 Car Failure No data Locomotive Failure No data
Capitol Limited 306 Passenger Related 124 Locomotive Failure 78
Lakeshore Limited 815 Hold for Connection 298 Passenger Related 272
Wolverines 740 Miscellaneous Delays 331 Locomotive Failure 194
Blue Water 701 Locomotive Failure 437 Passenger Related 249
Pere Marquette 484 Crew & System 249 Initial Terminal Delay 125
8.1.4.3 Customer Service
Another performance metric relates to a customer satisfaction survey that Amtrak administers to its customers. From the survey responses is derived the Amtrak Customer Service Index (CSI). Topics cover a broad range of customer experiences on and off the train. Standards require that for most topics, a “very satisfied” rating is received from 80 percent of respondents, although the standard for overall service is 82 percent. As shown in Exhibit 8- 16 below, the Hoosier State, Blue Water, and Pere Marquette achieve the 82 percent standard for overall service. None of the services achieves 80 percent “very satisfied” for on-board cleanliness. Values that exceed the standard are in red.

DRAFT
DRAFT
Chapter 8: Rail Passenger Service in Indiana 8-17
Exhibit 8- 16: Amtrak Customer Service Index (CSI) for 2nd
Train
Quarter, Fiscal Year 2011 Overall Service
Amtrak Personnel
Information Given
On-Board Comfort
On-Board Cleanliness
On-Board Food Service
Cardinal 71 75 60 64 48 56 Hoosier State 86 93 79 85 68 N/A Capitol Limited 78 78 69 79 65 69
Lakeshore Limited 67 74 53 68 52 64
Wolverines 72 77 68 72 56 65 Blue Water 82 81 77 80 64 68 Pere Marquette 88 90 80 88 72 N/A
8.1.4.4 Summary- Amtrak Service Performance Measures and Standards
A picture begins to emerge of the performance of existing Amtrak services within Indiana. The financial performance of Amtrak routes varies considerably. Generally, the Michigan services have better fare box recovery ratios than other routes that cross Indiana. The two routes that cross the northern portion of the state, the Capitol Limited and the Lake Shore Limited, have fare box recovery ratios roughly in line with the overall performance of Amtrak long distance trains, while the Cardinal and Hoosier State do worse. One important explanation appears to be that load factors are highest on the Lake Shore Limited trains and lowest on the Hoosier State trains: the northern trains are carrying more people and thus earning more revenue per train mile.
Delays, whether host railroad or Amtrak caused, are chronic on the Amtrak routes that cross Indiana and generally exceed FRA standards. Rider satisfaction with Amtrak customer service varies by route, but generally the Michigan trains and the Hoosier State score better than other routes for customer service.
Note that the performance indicators above do not characterize the convenience of Amtrak train schedules within the state or the speed of Amtrak services relative to transportation alternatives. These issues were a concern to numerous stakeholders during the outreach component of this project. One example is the service between Indianapolis and Chicago. Megabus provides bus service between Indianapolis and Chicago with six to seven daily departures each way. As of August 17, 2011, most tickets are $26, and the transit time is 3 hours, 15 minutes. Amtrak provides one daily departure each way, tickets are $22, and transit time is about 4 hours. Passengers may prefer the relative comfort of a train, but current passenger rail service is slower with fewer departures than competing bus service.

DRAFT
DRAFT
Chapter 8: Rail Passenger Service in Indiana 8-18
8.1.4.5 Measures to Improve Service
Major initiatives to improve intercity passenger rail within Indiana, such as the Midwest Regional Rail Initiative, will be discussed in more detail in the next chapter. However, other additional measures are worth discussing here. Section 210 of the PRIIA requires Amtrak to embark upon a comprehensive program to improve its long distance trains. Amtrak ranked its long-distance trains using a composite score, which included Customer Satisfaction Index (CSI), on-time performance (OTP), and cost recover (CR). Of 15 long-distance routes, two services in Indiana scored in the bottom third, including the Cardinal, which was ranked 14, and the Capitol Limited, which was ranked 11. Amtrak has published Performance Improvement Plans (PIP) for these two services.
As part of the PIP, Amtrak proposes to expand the Cardinal service to seven days per week and eliminate the Hoosier State service because it would be redundant. Amtrak believes that a seven day per week service would be less confusing and more compelling for potential customers. Furthermore, Amtrak will not have to pay as much for trains and crews as they sit idle at the endpoints of the route. Amtrak has also presented a plan to use the CN right of way from Clarke Road to a connection with the CSX at Munster. Amtrak believes that this new route will reduce delays and improve safety, since Amtrak trains will no longer need to gain authority and access as many host railroads’ tracks.
Amtrak’s PIP for the Capitol Limited service focuses on a change in operations at Pittsburgh, where passengers no longer will need to walk between trains, since their cars will be switched between trains instead. Although this change will result in slightly longer transit times, it should make the service more popular with customers, since they can retain the same seat throughout the entire journey.
8.2 Commuter Rail Service Commuter rail service in Northern Indiana is provided by Northern Indiana Commuter Transportation District (NICTD). The NICTD system is shown in Exhibit 8- 17.
The origin of NICTD lies in the early part of the 20th Century, when a network of electric intercity railroads was built across the East and Midwest. Built before automobiles were widely adopted, these railroads provided passenger service between cities in the region. One of these lines was a streetcar that ran between East Chicago and Indiana Harbor, called the Chicago and Indiana Air Line Railway. It was later renamed the Chicago, Lake Shore, and South Bend Railway, reflecting an aggressive plan for expansion.32
32 Northern Indiana Commuter Rail District. History of the South Shore Rail Passenger Service, available at
Eventually, the railroad expanded to
http://www.nictd.com/links/ourhistory.htm
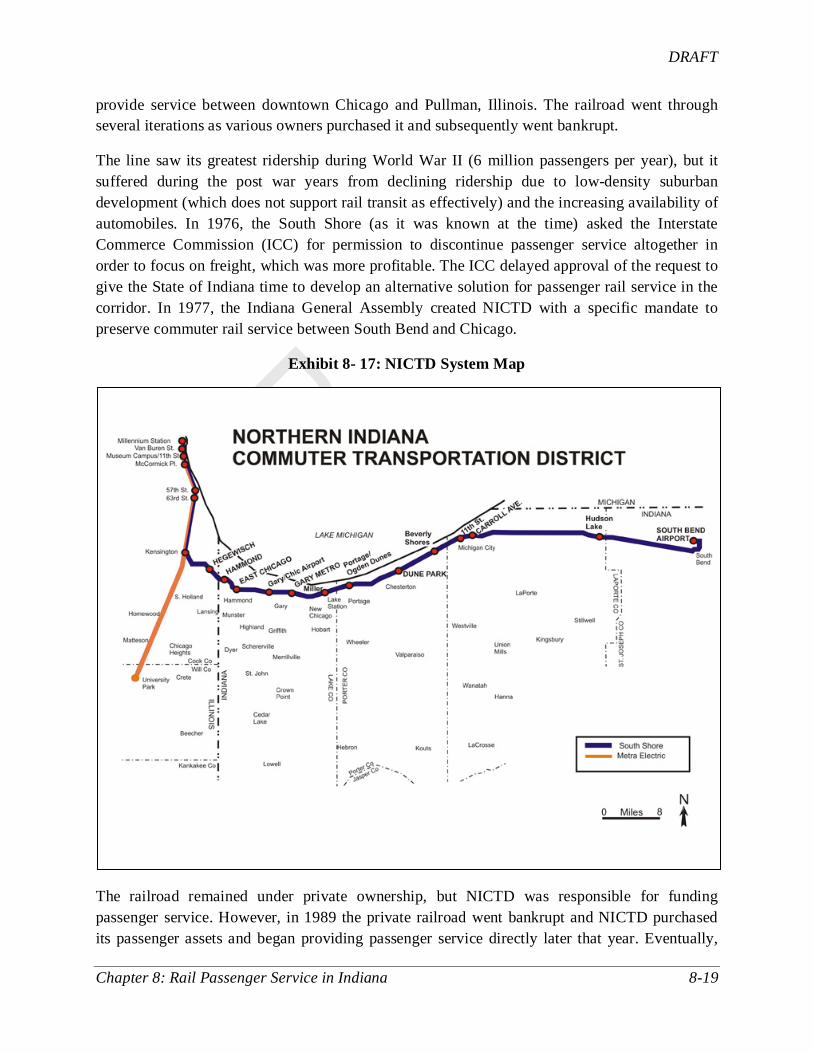
DRAFT
DRAFT
Chapter 8: Rail Passenger Service in Indiana 8-19
provide service between downtown Chicago and Pullman, Illinois. The railroad went through several iterations as various owners purchased it and subsequently went bankrupt.
The line saw its greatest ridership during World War II (6 million passengers per year), but it suffered during the post war years from declining ridership due to low-density suburban development (which does not support rail transit as effectively) and the increasing availability of automobiles. In 1976, the South Shore (as it was known at the time) asked the Interstate Commerce Commission (ICC) for permission to discontinue passenger service altogether in order to focus on freight, which was more profitable. The ICC delayed approval of the request to give the State of Indiana time to develop an alternative solution for passenger rail service in the corridor. In 1977, the Indiana General Assembly created NICTD with a specific mandate to preserve commuter rail service between South Bend and Chicago.
Exhibit 8- 17: NICTD System Map
The railroad remained under private ownership, but NICTD was responsible for funding passenger service. However, in 1989 the private railroad went bankrupt and NICTD purchased its passenger assets and began providing passenger service directly later that year. Eventually,

DRAFT
DRAFT
Chapter 8: Rail Passenger Service in Indiana 8-20
the agency also bought the track and right-of-way necessary to provide passenger service. Annual ridership increased from 1.5 million passengers in 1978 to 3.5 million in 1999. The Chicago South Shore and South Bend Railroad still provides freight service just as it did before the bankruptcy, operating along shared trackage with the NICTD.
Currently, NICTD operates 20 westbound and 21 eastbound trains each weekday between South Bend and Millennium Station in Chicago (not all trains run the full length of the system), and 10 westbound and 11 eastbound trains on Saturdays, Sundays, and holidays.
NICTD trains operate on Metra Electric (Metra is a Chicago-based commuter rail system, operating both electrified and non-electrified lines) tracks between Chicago and Kensington, and on its own tracks from Kensington to South Bend.
8.2.1 Ridership In 2009, NICTD carried 3.9 million passengers, per NICTD records. Average weekday ridership was 13,000 passengers. Average weekend day ridership was 5,200 passengers. In 2010, NICTD carried fewer passengers. Ridership in that year was 3.7 million.
Results for both years were well below results for the years just predating the recent economic recession. Ridership in 2007 totaled just over 4.2 million, and in 2008 it was just below that figure. Clearly, the economic downtown took a toll on NICTD ridership.
8.2.2 Financial Performance and Funds Souring According to the National Transit Database for 2009, NICTD fare revenues totaled $17.7 million in that year, and operating costs were $39.3 million, generating a fare box recovery ratio of 45 percent.
The largest source of capital funds expended in 2009 was provided by the state at 73 percent, with federal funds providing the remaining 27 percent. Total capital expended in the year was $29.1 million.
8.2.3 On-Time Performance NICTD’s on-time performance for the five year period from 2006 to 2010 varied between a low of 71.4 percent in 2008 and a high of 86.1 percent in 2010. In 2007, on-time performance was 74.3 percent. The 2007 and 2008 figures were driven primarily by poor on-time performance of eastbound peak, off-peak and weekend trains in those years. Westbound peak trains in all years varied narrowly between a low of 87.2 percent in 2008 and a high of 93.2 percent in 2006.
NICTD related that on-time performance is generally affected by summer construction and maintenance, much of which is performed while trains are moving. Making matters worse is construction and maintenance during service hours on the single track portion of the line between South Bend and Gary.
DRAFT
DRAFT
Chapter 8: Rail Passenger Service in Indiana 8-21
8.2.4 Ongoing Improvements NICTD is completing a bypass of the Kensington Station in Illinois (Exhibit 8- 18). The project will provide a second NICTD route through the Kensington Interlocking, providing additional operating windows for NICTD trains. The project required a three-part agreement between NICTD, Metra and the Canadian National Railway.33
Exhibit 8- 18: Kensington Bypass and Catenary Upgrade
Per NICTD, the improvement will give NICTD access to Metra’s Tracks 3 and 4, allowing parallel moves and reducing conflicts. The total cost of this project is about $18 million.
33 Chesterton Tribune, March 29, 2010.

DRAFT
DRAFT
Chapter 8: Rail Passenger Service in Indiana 8-22
NICTD also reported that it is completing Phase 2 of its catenary modernization program between Michigan City and Gary in 2011. The agency is installing new wire, hardware and weight tensioning in tangent track sections. Phase 3 between South Bend and Michigan City has not been programmed for lack of funding.
Phase 3 of NICTD’s Centralized Traffic Control (CTC) upgrade should be completed in 2011. CTC allows a dispatcher in a remote location to move trains across track segments by use of wayside signals and radio communications.
Lastly, as must all intercity and commuter railroads, NICTD must have implemented Positive Train Control (PTC) by January 1, 2016 on its system. PTC automatically tracks a train’s position and brings the train to a controlled stop if; the locomotive engineer is exceeding the maximum allowable speed on a track segment; if a train does not possess the authority to be on a specific track segment; or, if a train cannot slow down soon enough to enter a new speed zone or stop before violating its track authority.34
8.2.5 Stations
NICTD estimates implementation of PTC will cost $32 million.
Exhibit 8- 19 summarizes the NICTD Indiana station-specific information. Stations along the South Shore Line have various amenities such as vehicle parking, ticket vending machines (TVMs), and agent services. Given the high proportion of commuters who arrive at the station by car, parking facilities are by far the most heavily utilized amenity.
NICTD owns most of the Indiana stations. Two stops are flag stops, where waiting passengers must activate a strobe light alerting the approaching train’s operator to stop at the station.
Two stations are staffed. Seven have TVMs. One station houses NICTD’s administrative office. At the five stations with neither TVMs nor ticketing staff, boarding passengers can pay cash fares to the train crew.
Most stations have transit connections.
All but the South Bend Station are in the Central Time Zone.
34 Trains Magazine, May 2011, page 6

DRAFT
DRAFT
Chapter 8: Rail Passenger Service in Indiana 8-23
Exhibit 8- 19: NICTD Stations in Indiana
Location Hammond East Chicago Gary/Chicago Airport Metro Center (Gary) Miller (Gary) Portage/Ogden Dunes
Owner NICTD NICTD Leased by NICTD City of Gary NICTD NICTD
Address 4531 Hohman Avenue 5615 Indianapolis Boulevard
Also known as Clark Rd. located near 2nd Ave., approximately 1 mile from Airport terminal
Adam Benjamin Metro Center -- 200 West 4th Avenue
Lake Street and U.S. Highway 12
Hillcrest Road and U.S. Highway 12
Flag Stop Regular stop Regular stop Flag stop Regular stop Regular stop Regular stop Shelter Remodeled station house Umbrella platform shelter 3 plexi-glass shelters Umbrella platform shelter Brick and tile ADA shelter only
Agent Hours No agent 5:10 A.M. - 12:35 P.M. Mo-Fr No agent No agent No agent No agent Ticketing/Ticket Vending Machine (TVM) TVM available TVM available No TVM TVM available No TVM No TVM ADA Accessible Accessible
Accessible
Accessible
Parking Parking Spaces: 718 free Parking spaces: 1,200 free Parking spaces: 56 free Parking spaces: 224 ; $1.00 daily fee Parking spaces: 248 free Parking Spaces: 230 free
Intermodal Hammond Transit East Chicago bus transit; Hammond Transit
Access to airport by shuttle service Gary Public Transportation Corp
Gary Public Transportation Corp
Time Zone Central Central Central Central Central Central
Location Dune Park (Chesterton) Beverly Shores (Porter Co.) 11th Carroll Avenue (Michigan City) Street (Michigan City) Hudson Lake (LaPorte Co.) South Bend Airport
Owner NICTD NICTD NICTD NICTD NICTD Leased by NICTD
Address
33 East U.S. Highway 12 -- (Junction of Indiana Route 49 and U.S. Highway 12)
U.S. Highway 12 and Broadway Street 114 East 11th Street
503 North Carroll Avenue -- (219) 874-4221 ext 247
County Road 700N and Chicago Road
4485 Progress Drive -- (Off of W. Lincolnway) -- (574) 233-3111
Flag Stop Regular stop Flag Stop Regular stop Regular stop Regular stop Regular stop
Shelter
Station building with waiting room and restrooms (NICTD administrative office here)
Historic tile roof structure and stucco (Spanish style) structure with waiting room.
Small metal and glass shelter at end of adjacent parking lot, near 11th Street/Pines Street intersection Small metal and glass shelter Small metal and glass shelter Overhead metal structure
Agent Hours No agent No agent No agent
Agent Hours: 6:20 A.M. - 2:40 P.M. Mon-Fri -- Closed 11:00 A.M. - 11:30 A.M. Daily No agent
6:05 A.M. - 1:30 P.M. Fri, Sat, Sun
Ticketing/Ticket Vending Machine (TVM) TVM available TVM available No TVM TVM available No TVM TVM available
ADA Accessible
Accessible
Accessible
Parking Parking spaces: 519 free Parking spaces: 39 free Parking spaces: 37 free (Lot fills quickly)
Parking spaces 201 free (Lot fills quickly) Parking spaces: 20 free
South Bend Airport provides several different parking lots and rates.
Intermodal V-Line
Michigan City Transit Michigan City Transit
TRANSPO
Time Zone Central Central Central Central Central Eastern

DRAFT
DRAFT
Chapter 9: Proposed Passenger Rail Service 9-1
Chapter 9: Proposed Passenger Rail Service This chapter discusses plans for new and improved intercity, high speed and commuter rail services proposed for Indiana. The intercity and high speed services identified are in truth interstate services, involving Indiana’s neighbors – Illinois, Michigan, Ohio and Kentucky. Discussed also are improvement plans identified by NICTD and commuter rail start-up concepts centering on Indianapolis.
9.1 Intercity and High Speed Rail Plans There are various initiatives under study for new intercity high speed rail services operating through Indiana. Most of these are part of the Midwest Regional Rail Initiative involving 3,000 miles of track and trains operating at speeds up to 110 mph, linking the upper Midwest’s largest cities and the bulk of its population.
The Northern Indiana Commuter Transportation District has been investigating service expansions, and the Indianapolis Metropolitan Planning Organization has been studying the feasibility of commuter rail in the region.
These intercity and commuter rail concepts are discussed below.
9.1.1 Midwest Regional Rail Initiative The Midwest Regional Rail Initiative (MWRRI) is an ongoing effort to improve rail service in the Midwest, sponsored by transportation agencies from the states of Illinois, Indiana, Iowa, Michigan, Minnesota, Missouri, Nebraska, Ohio, and Wisconsin. Additional sponsors and stakeholders include Greyhound Lines, Inc., the Federal Railroad Administration (FRA), and Amtrak.
The proposed Midwest Regional Rail System (MWRRS) is the result of the vision of these agencies and stakeholders. The plan for this system includes improved level of service for passenger rail through:
• A 3,000-mile system, using existing rail rights-of-way shared with freight and commuter rail
• Safe, comfortable and reliable service to over 100 Midwestern cities, linking the region’s major economic centers
• Access to approximately 80 percent of the region’s 65 million residents
• State-of-the-art train equipment capable of operating at speeds of up to 110 mph
• More and better amenities, including first class seating for all, power outlets at each seat, wireless network access and food service

DRAFT
DRAFT
Chapter 9: Proposed Passenger Rail Service 9-2
• Modern stations and intermodal facilities
• Dedicated feeder bus service connecting communities without direct rail service to the system
In addition to providing shorter travel times, reducing congestion on all modes of travel, and improving the environment, the MWRRS is designed to provide economic benefits and new jobs by reinvigorating the region’s manufacturing, service, and tourism industries. Freight rail operations also will benefit from reduced congestion and enhanced safety as a result of MWRRS track and signal improvements in shared corridors. The MWRRS is shown in Exhibit 9- 1.
Exhibit 9- 1: The Midwest Regional Rail System
Source: Ohio Rail Development Commission
Federally designated high speed rail routes in Indiana appear in Exhibit 9- 2. These include alternatives between Chicago, northern Indiana, Toledo and Cleveland, and routes to the south to Indianapolis and thence to Cincinnati and Louisville.

DRAFT
DRAFT
Chapter 9: Proposed Passenger Rail Service 9-3
Exhibit 9- 2: Federally Designated High Speed Rail Routes in Indiana
9.1.1.1 Chicago-Detroit-Pontiac High Speed Rail
In 2009, the Michigan DOT, in cooperation with the Illinois and Indiana DOTs, produced a Service NEPA Environmental Assessment, Chicago-Detroit/Pontiac Rail Corridor Improvements from Chicago, Illinois to Pontiac, Michigan.
The route is part of the Midwest Regional Rail System. It is comprised of the Norfolk Southern (NS) Chicago-Cleveland Line between Chicago and Porter; the Amtrak Michigan Line between Porter and Kalamazoo; the NS line between Kalamazoo and Dearborn; Conrail Shared Assets Operations trackage between Dearborn and Detroit; and Canadian National Railway trackage between Detroit and Pontiac. This is the route of the existing Amtrak Wolverine service, as well as of the Blue Water service between Chicago and Battle Creek (the Blue Water follows a more northerly route east of Battle Creek to Port Huron). The sole stop for these services in Indiana is Michigan City (a Wolverine stop only).

DRAFT
DRAFT
Chapter 9: Proposed Passenger Rail Service 9-4
The purpose of the project is to preserve the long term viability of the route for high speed operations. The project would involve upgrades of the track and stations to allow higher speeds. It would also involve the purchase 134 miles of the NS line between Kalamazoo and Dearborn, as NS is planning to downgrade this speeds on the line. It would also include purchase of new rolling stock.
In October 2009, the FRA announced the award of $150 million in High-Speed Intercity Passenger Rail (HSIPR) Program funding to Michigan DOT for the proposed purchase and incremental restoration of the NS Kalamazoo-Dearborn line.
9.1.1.2 Chicago-Cleveland High Speed Rail
In October 2009, Indiana DOT submitted an application to the FRA for HSIPR Program for funding the Chicago-Cleveland High Speed Rail Project. That project, estimated to cost $2.8 billion, would implement high speed rail services at speeds of up to 110 mph in the states of Indiana, Illinois and Ohio.
The route is part of the Midwest Regional Rail System. It is comprised of various segments belonging to four railroads. These include the NS between Chicago and Buffington; the CSX Transportation (CSX) between Buffington and Fort Wayne; the NS again between Fort Wayne and Woodburn; the Maumee and Western Railroad between Woodburn and Delta; and, the NS again between Delta, Toledo and Cleveland. Stops in Indiana would include Gary Regional Airport, Plymouth, Warsaw and Fort Wayne.
The project would consist of new track, track upgrades and the purchase of rolling stock. However, this project was not selected for a grant under the HSIPR Program, per the selections announced in October, 2010.
An alternative to this 354-mile “southern route” is a “northern route” which would remain on the NS between Chicago, South Bend, Toledo and Cleveland.
A study funded by OrthoWorx assessed the impacts of a high speed rail connection between Warsaw and Chicago.35
35 Parsons Brinkerhoff for OrthoWorx, Inc., Economic Impacts of Midwest High Speed Rail on the Orthopedics Industry of Warsaw, Indiana, Revised January 2011.
Warsaw is on the southern route. The study estimated that such a connection would provide between $32.2 million to $44.6 million in travel time savings (2009 dollars) over a 20-year period for the orthopedics industry and its partners. In addition, the study estimated between $39.0 million and $46.1 million in productivity benefits for the orthopedics industry over the same time period. According to the report, high speed rail would improve the competitiveness of the orthopedics industry cluster in Warsaw.

DRAFT
DRAFT
Chapter 9: Proposed Passenger Rail Service 9-5
9.1.1.3 Indiana Rail Gateway
In August of 2009, Indiana DOT submitted an application to the FRA for HSIPR Program for funding of the Indiana Rail Gateway Project. That project, estimated to cost $71.3 million, would upgrade the NS Chicago-Cleveland line between Porter and the Indiana/Illinois state line. The NS line hosts the Lake Shore Limited, the Capitol Limited, the Wolverine, Blue Water and Pere Marquette Amtrak services. It would also include an upgrade on the Amtrak Michigan Line east of Porter.
The project would facilitate MWRRS operations between Chicago, Michigan and Ohio.
The project consists of eight independent projects – seven on the NS line and one on the Amtrak line. NS proposed provide supplemental funding. This project was selected for a grant under the HSIPR Program.
9.1.2 Indianapolis to Louisville High Speed Rail Service Apart from the MWRRI, Indiana DOT has also studied the potential for a high speed rail service between Indianapolis and Louisville. This service would replace the discontinued Amtrak Kentucky Cardinal and connect with the Cardinal and Hoosier State services in Indianapolis.
9.1.3 Ohio Hub The “Ohio Hub” Strategy, also known as Ohio and Lake Erie Regional Rail, was developed through a feasibility study completed by the Ohio Rail Development Commission (ORDC) and the Ohio Department of Transportation (ODOT). The study examined four intercity travel corridors, as illustrated in Exhibit 9- 3.
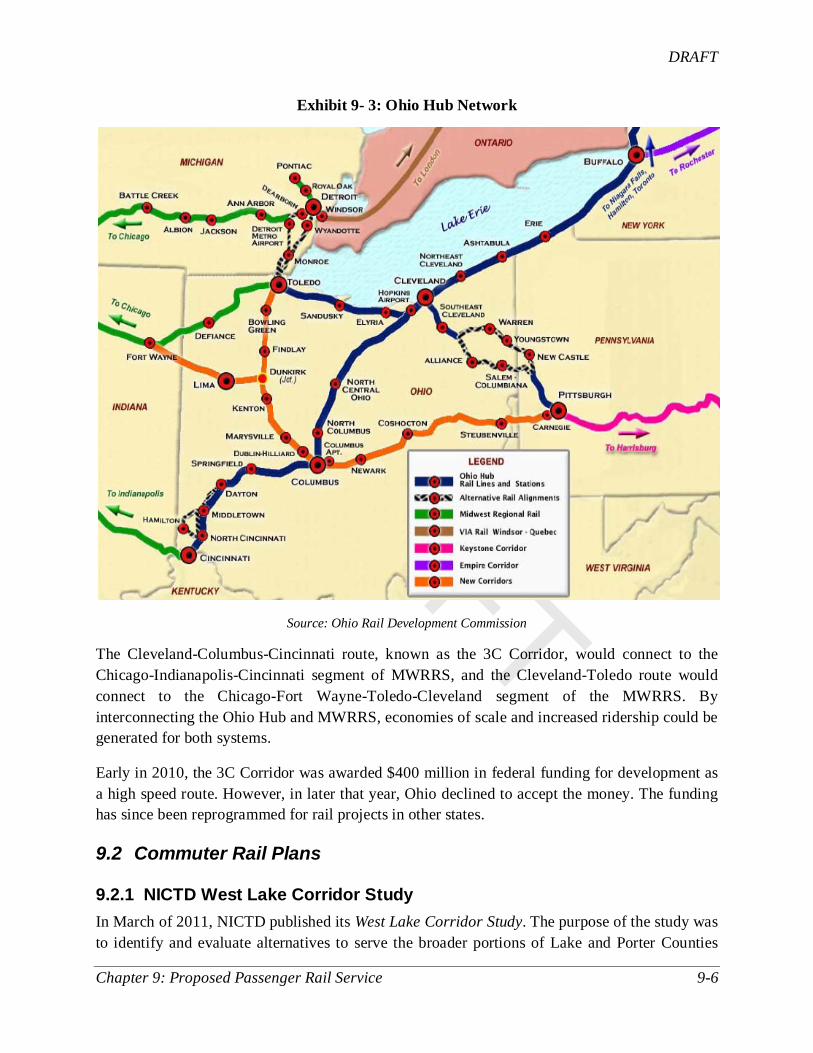
DRAFT
DRAFT
Chapter 9: Proposed Passenger Rail Service 9-6
Exhibit 9- 3: Ohio Hub Network
Source: Ohio Rail Development Commission
The Cleveland-Columbus-Cincinnati route, known as the 3C Corridor, would connect to the Chicago-Indianapolis-Cincinnati segment of MWRRS, and the Cleveland-Toledo route would connect to the Chicago-Fort Wayne-Toledo-Cleveland segment of the MWRRS. By interconnecting the Ohio Hub and MWRRS, economies of scale and increased ridership could be generated for both systems.
Early in 2010, the 3C Corridor was awarded $400 million in federal funding for development as a high speed route. However, in later that year, Ohio declined to accept the money. The funding has since been reprogrammed for rail projects in other states.
9.2 Commuter Rail Plans
9.2.1 NICTD West Lake Corridor Study In March of 2011, NICTD published its West Lake Corridor Study. The purpose of the study was to identify and evaluate alternatives to serve the broader portions of Lake and Porter Counties

DRAFT
DRAFT
Chapter 9: Proposed Passenger Rail Service 9-7
with commuter services to downtown Chicago. Four specific transportation and community needs were identified:
1. Improve access to Chicago
2. Expand transit area coverage and transportation options
3. Support economic development and redevelopment in Northwestern Indiana
4. Develop practical solutions to the area’s transportation deficiencies
Phase 1 of the study was focused on gaining an understanding of the various demographic, growth/development, existing transportation, and travel patterns of the region. Out of this analysis, a Transportation Systems Management (TSM) concept and four alternatives were developed to improve access to Chicago and expand transit coverage to the Indiana region – three involving commuter rail:
1. TSM – Regional express bus from northwest Indiana to Chicago
2. Alternative 1 – Commuter rail from Valparaiso and Lowell (two lines) to Chicago
3. Alternative 2 – Commuter rail from Valparaiso (one line) to Chicago
4. Alternative 3 – Commuter rail from Lowell (one line) to Chicago
5. Alternative 4 – Regional express bus to NICTD stations for transfer and furtherance by rail to Chicago
Ultimately, Alternative 1 was considered the most desirable alternative in meeting the needs for travel from northwest Indiana to Chicago.
Phase 2 was a more detailed look at the costs for implementing Alternative 1. The analysis revealed that the cost of constructing both alignments to Valparaiso and Lowell was too expensive. Thus, it was decided to phase the project one corridor at a time. The Lowell Corridor alignment was selected as the better corridor for implementing commuter rail as a first phase.
9.2.2 Other NICTD Plans NICTD is investigating two changes to its existing route. First is a potential reroute through Michigan City (Exhibit 9- 4). NICTD trains presently run through much of Michigan City on 11th Street, where tracks are embedded in the street (street running). Potential alternatives include running trains on the CSX Transportation right-of-way to the south or on various options to the north. Further investigation of potential alternatives will take place in 2011. During the outreach process for this Plan, several stakeholders provided feedback regarding potential reroutes of the 11th Street tracks. Some were concerned about crossing closures and the impact that this would have on the community.

DRAFT
DRAFT
Chapter 9: Proposed Passenger Rail Service 9-8
Also, NICTD is considering a new route to access the South Bend Station from the west (Exhibit 9- 5), rather than approaching it circuitously from the east as it does today.
These improvements, if implemented, would result in fewer route miles between South Bend and Chicago and thus faster transit times – a mobility benefit. The elimination of street running in Michigan City would be a safety enhancement as well.
Exhibit 9- 4: Michigan Reroute Options

DRAFT
DRAFT
Chapter 9: Proposed Passenger Rail Service 9-9
Exhibit 9- 5: South Bend Proposed Reroute
9.2.3 Indy Connect Indy Connect, Central Indiana's Transportation Initiative, is a partnership of the Indianapolis Metropolitan Planning Organization (MPO), Central Indiana Regional Transportation Authority (CIRTA), and IndyGo that is dedicated to providing Central Indiana residents with transportation options in support of the future development of the region.36
The plan includes various transportation modes: Bus Rapid Transit (BRT), conventional bus, Light Rail Transit (LRT), and commuter rail.
This plan has investigated five commuter rail routes emanating from Union Station in Indianapolis on existing freight rail lines, as shown in Exhibit 9- 6. The first three likely to be implemented are:
• Union Station northeast to Noblesville, also known as the Northeast Corridor
• Union Station south to Franklin
• Union Station northwest to Zionsville
36 http://www.indyconnect.org/who.htm

DRAFT
DRAFT
Chapter 9: Proposed Passenger Rail Service 9-10
The corridor likely to be built first is the Northeast Corridor. According to the Northeast Corridor AA/DEIS, this is the corridor of the greatest need, having a greater concentration of development, more congestion on its roadway network, and more public support. The Indiana Rail Road, a regional short line, provides freight rail services on the line.
Exhibit 9- 6: Potential Commuter Rail Routes Serving the Indianapolis Area
9.2.4 Bloomington-Indianapolis-Muncie The Indiana General Assembly passed an act in 2007 requiring INDOT to study the feasibility of a commuter rail system with service from Muncie to Indianapolis and from Indianapolis to Bloomington, including stops in Anderson, Noblesville, Fishers, Indianapolis, and Bloomington. The study, Central Indiana Commuter Rail Feasibility Study (August, 2008), evaluated potential routes, estimated costs, potential ridership, and the effect of the project on existing transportation systems. The Indianapolis-Muncie service could have impacts on the Indy Connect Northeast Corridor project, were the service to follow the Northeast Corridor to Noblesville (the INDOT study also looked at alternative alignments to Muncie). The Chief Executive Officer (CEO) of the Indiana Rail Road Company (INRD), which owns the rail line between Indianapolis and Bloomington, recently expressed interest in establishing commuter rail operations on the line.37
37 Thomas G. Hoback, Progressive Railroading: Maximum MOW: A Look at Indiana Rail Road's Record Year of Spending, July 27, 2011.
At one point, the INRD connected into Union Station. A connection would need to be reestablished.

DRAFT
DRAFT
Chapter 9: Proposed Passenger Rail Service 9-11
9.3 Passenger Rail Service Objectives INDOT’s passenger rail goals are consistent with the overall rail goals and objectives as set forth in Chapter 1 of this Plan. INDOT is supportive of a multi-modal strategy to address current and future surface transportation needs of the State of Indiana and Indiana taxpayers.
INDOT will work with our partners at the Midwest Regional Rail Initiative (MWRRI) and other rail partners on developing the Midwest Regional Rail System (MWRRS) as dictated by available funding. The objectives and minimum service levels of the MWRRI are as follows:38
• The rail network as shown in
Exhibit 9- 1
• State-of-the-art train equipment capable of operating at speeds of up to 110 mph
• Transit times that are comparable to or faster than automobile drive times
• More and better amenities, including first class seating for all, power outlets at each seat, wireless network access and food service
• Modern stations and intermodal facilities
• Dedicated feeder bus service connecting communities without direct rail service to the system
• Improved train frequencies
• Better on-time performance
INDOT will pursue these objectives to the extent that intercity rail improvements are proven to be a cost effective transportation solution for Indiana taxpayers, considering not only funding for design and construction, but also funding for maintaining, operating and capital investment. It is also imperative that intercity passenger rail investments not hinder current or future freight rail operations.
In terms of commuter rail, INDOT’s objectives as set out by the INDOT Office of Transit are to,
• Improve access to employment, services, education, and recreation for all Indiana citizens
• Increase modal choices through high occupancy, shared-ride travel options to provide every community with a broad range of transportation options
• Encourage energy conservation
38 Transportation Economics & Management Systems, Inc., Midwest Regional Rail System, Executive Report, September 2004.

DRAFT
DRAFT
Chapter 10: Review of Indiana Rail Lines 10-1
Chapter 10: Review of Indiana Rail Lines The Indiana rail network is extensive, with almost 4,000 route miles operated by 42 rail carriers. Rail lines within the state are owned by a variety of entities, including private carriers, shippers, and port authorities. The vast majority of rail lines within the state are owned by rail carriers that haul freight.39
10.1 Ability of Primary Rail Corridors to Accommodate Current and Future Traffic
Many of the issues associated with rail lines in Indiana are similar to those in other states, while some are unique to Indiana. These will be discussed in more detail below.
In response to the projected increases in rail demand, the railroad industry initiated a study to identify the rail lines that will see the greatest increase in volume and where existing and projected capacity constraints will affect the fluidity and reliability required for the rail network to remain competitive. To determine rail mainline system capacity needs for the country, the National Rail Freight Infrastructure Capacity and Investment Study, published by the Association of American Railroads in September 2007, was developed.
An initial step in the study was to identify the “Primary Rail Freight Corridors.” These are higher volume corridors, or the freight “mainlines.” These corridors were evaluated on the basis of both current rail volumes compared to current capacity and future (2035) volumes compared to current capacity. Current volumes were estimated using the 2005 Surface Transportation Board (STB) Waybill Sample. Freight volumes were forecasted using the U.S. Federal Highway Administration’s (FHWA) Freight Analysis Framework 2.2 forecasts for rail freight demand in 2035 by type of commodity and by the origin and destination locations of shipments moving within the U.S. and through international land and port gateways.
The study estimated capacity of freight corridors as a function of the number of tracks on each rail line, the type of train control, and the mix of trains using the corridor. Freight volumes were compared to capacity to estimate current and future levels of service (LOS) from Level A to Level F. The interpretation of LOS ratings is similar to that used for the highway system. Namely:
• LOS Grade A, B, C (Below Capacity): Capacity can accommodate traffic, including during maintenance, can recover from incidents
• LOS Grade D (Near Capacity): Heavy train flow. Moderate capacity to accommodate maintenance, recover from incidents
• LOS Grade E (At Capacity): Very heavy flow compared to capacity with limited ability to accommodate maintenance and recover from incidents
39 The primary exception is the South Shore Line, which is owned by the Northern Indiana Commuter Transportation District

DRAFT
DRAFT
Chapter 10: Review of Indiana Rail Lines 10-2
• LOS Grade F (Above Capacity): Unstable flows: service break-down conditions
Within Indiana, the identified primary corridors include the NS, CSX, and CN mainlines that run east-west in the northern portion of the state, the CSX CE&D Subdivision, which runs along the border with Illinois, and the two mainlines that run southwest/northeast through the state, the CSX St. Louis Line/Indianapolis Line, and the NS Lafayette District/Huntington District. Identified primary rail corridors are displayed in Exhibit 10- 1.
Exhibit 10- 1: Primary Rail Corridors within Indiana

DRAFT
DRAFT
Chapter 10: Review of Indiana Rail Lines 10-3
The study found that most of the rail lines within Indiana are currently operating below capacity. The two exceptions were the rail lines entering Chicago from northwestern Indiana and a small section of the CSX CE&D Subdivision just north of Evansville, which was considered to be near capacity.
However, the study also forecasted significant traffic increases on Indiana rail lines during the thirty years from 2005 to 2035. Forecasted percent increases are displayed in Exhibit 10- 2.
Exhibit 10- 2: Forecasted Increases in Traffic on Indiana Corridors (2005-2035)
The study predicts that if the capacity of many of Indiana’s primary rail corridors is not expanded, many of these corridors will be at or over capacity by 2035 (see Exhibit 10- 3).

DRAFT
DRAFT
Chapter 10: Review of Indiana Rail Lines 10-4
Exhibit 10- 3: Indiana Corridor Level of Service in 2035 without Improvements
10.2 Gross Weight Railcars, 286,000-pound As in other states, short line and regional railroads in Indiana are struggling with new standards in railcar weight. Shippers and Class I carriers are increasingly switching to heavier 286,000-pound gross weight railcars. Studies have found that Class I operating costs per ton for 286,000-pound railcars are nearly nine percent less than operating costs per ton 263,000-pound railcars.40
40 Kenneth Cassavant and Denver Tolliver, Impacts of Heavy Axle Loads on Light Density Lines in the State of Washington, 2001

DRAFT
DRAFT
Chapter 10: Review of Indiana Rail Lines 10-5
Research has found that lines with 90-pound rail41 may be able to accommodate 286,000-pound railcars if the line has excellent tie maintenance, good ballast, and trains operate at low speeds.42
A number of the commodities most commonly shipped in Indiana are often shipped in 286,000-pound cars, including coal, steel, chemicals, petroleum products, and grain. Railroads that are unable to accommodate the 286,000-pound standard are becoming increasingly obsolete. While most Class I rail lines can accommodate these heavier railcars, many smaller Class II and Class III rail lines cannot accommodate 286,000-pound railcars. Indiana has an unusually large number of small railroads operating within the state. It is ranked third in the nation for number of operating railroads.
However, if these criteria are not in place, rail sections must be upgraded to 100 pounds and above.
43 All but five of these are Class II and Class III carriers.44 At least 16 carriers operating within the state operate rail lines that are unable to accommodate these heavier cars. At least 230 bridges within the state would need to be upgraded or replaced in order to accommodate 286,000-pound railcars.45
Short line rail carriers consulted for this study cited heavy axle loading as one of, if not the greatest challenge, facing railroads in Indiana. The necessity of improving bridges to accommodate these cars is particularly problematic.
Exhibit 10- 4 classifies rail lines within the state with regard to their ability to accommodate 286,000-pound rail movements. The lines in red indicate that none of the rail line can accommodate 286,000-pound cars; yellow lines indicate that at least a portion of the rail line can handle 286,000-pound cars; and green lines indicate that all of the line can handle heavier railcars. Although the data underlying the map was collected in 2006 by INDOT based upon carrier feedback, it is probable that the situation has not changed dramatically.
41 Weight of a three foot segment 42 Zeta-Tech, Estimation of the Investment in Track and Structures Needed to Handle 286,000-Pound Rail Cars 43 Association of American Railroads statistics, including carriers operating by trackage rights 44 The AAR statistics include railroads that have trackage rights into the state but that do not own or lease rail lines 45 Indiana 2009 Class II and Class III Annual Reports

DRAFT
DRAFT
Chapter 10: Review of Indiana Rail Lines 10-6
Exhibit 10- 4: Ability of Rail Lines within Indiana to Accommodate 286,000-lb Railcars
10.3 FRA Track Class The ability to handle heavy railcars is one indication of a rail line’s condition. Another is the FRA classification of a rail line. Per Title 49 Code of Federal Regulations, Part 213, (49 CFR 213), the FRA has established minimum track safety standards requirements and maintenance levels for railroad operations. These standards dictate the speed at which trains can travel over rail lines. Requirements are established for the minimum frequency of track inspection, standards for track geometry, rail and joint defects, rail fasteners, rail anchors, tie condition, switch condition, vegetation control, ballast, sub grade, drainage, and continuous welded rail. The FRA

DRAFT
DRAFT
Chapter 10: Review of Indiana Rail Lines 10-7
class of track provides a proxy for the condition of a line segment. Higher levels of maintenance, more frequent inspections, and better track conditions are required for successively higher FRA track classes. Tracks are classified into six categories. The lowest categories are as follows:
• Excepted Track – Trains are not permitted to operate at over 10 mph on excepted tracks. Passenger trains are not allowed on the line, and only limited hazardous materials are allowed on the line.
• Class 1 – Freight train speeds are limited to 10 miles per hour and passenger trains are limited to 15 miles per hour
• Class 2 – Freight train speeds are limited to 25 miles per hour and passenger trains are limited to 30 miles per hour.
It is frequently a goal of states for all operational rail lines within the state to exceed a minimum standard. The viability of rail lines with excepted track is significantly improved when the infrastructure is upgraded to at least Class 1 and preferably Class 2. Some states set a goal to bring rail lines to a minimum of Class 2, so that all rail lines operate at speeds of at least 25 miles per hour. At least 177 miles of operating track within Indiana is considered excepted.46
10.4 Needs Identified by Class II and Class III Carriers
Significant upgrade would be needed to bring these rail lines into a good state of repair. Additionally, at least 314 miles are Class 1 track, which is often considered inadequate for efficient operation.
INDOT requires that all Class II and Class III carriers submit annual reports to the state. As part of these reports, carriers are asked to identify future capacity needs. The individual reports are proprietary. However, Exhibit 10- 5 below provides a general sense of the types of issues that carriers identified.
Exhibit 10- 5: Capacity Needs Identified by Short Line/Regional Railroads in Indiana
Future Capacity Needs Number of Carriers Identifying the Need Upgrade rail to 286,000 lb. standards 10 Install siding/improve existing siding 8 Upgrade bridges to 286,000 lb. standard 5 Upgrade or establish new yard 5 Repair bridges 4 New connection to another carrier 2
46 Indiana Department of Transportation, Annual Report of Class II & Class III Railroads and Port Authorities

DRAFT
DRAFT
Chapter 10: Review of Indiana Rail Lines 10-8
Carriers have also provided project needs for this Rail Plan in Appendix A. These capital project needs are categorized in Exhibit 10- 6 below.
Exhibit 10- 6: Capacity Needs Identified by Short Line/Regional Railroads during State Rail Plan Outreach
Future Capacity Needs Number of Carriers Identifying the Need Track Upgrade 7 New connection to another carrier 4 Upgrade bridges to 286,000 lb. standard 4 New/improved access to a customer 3 Improvements to a yard 2 Engine house/maintenance facility 2 New locomotives 1 New runaround siding 1 Grade separation 1 Grade Crossing Rehabilitation 1
10.5 Grade Crossings Highway-rail at-grade crossings were discussed in Chapter 7, but they also warrant mention as part of an assessment of rail lines within Indiana. Highway-rail crossings are a larger issue within Indiana than in most other states. As shown below, Indiana ranks fourth in the nation for the number of public highway-rail at-grade crossings.
Exhibit 10- 7: Top Ten States by Number of Active Public Highway-Rail Grade Crossings
Source: FRA Highway-Rail Crossing Inventory Data
0
2,000
4,000
6,000
8,000
10,000
12,000
Texas
Illinois
California
Indiana
Ohio
Georgia
Kansas
Michigan
Minnesota
Iowa

DRAFT
DRAFT
Chapter 10: Review of Indiana Rail Lines 10-9
The related issue is that Indiana is much smaller geographically than many of these other states with fewer roadway miles. While Texas has the largest number of grade crossings, these are distributed over more than 300,000 miles of public roadway compared to Indiana’s approximately 95,000 miles.47
Exhibit 10- 8: Number of Public Roadway Miles per Highway-Rail Grade Crossing
Measured in terms of public roadway mileage per highway-rail grade crossing, crossings are more frequent in Indiana than in any of these ten states. A highway-rail grade crossing is encountered approximately every 16 miles of public roadway in Indiana.
Sources: FRA Highway-Rail Crossing Inventory Data, FHWA 2008 Highway Statics
This issue is particularly acute within Indiana due to the heavy concentration of grade crossings within specific areas. The highest number of crossings is in Lake County in northwestern Indiana and Marion County, around Indianapolis. Within Lake County, rail lines are also clustered toward the northern part of the county, near Gary and Portage. Rail lines in Lake County include some of the most heavily used rail lines in the nation, carrying in excess of 60 trains per day. The Northwest Indiana Regional Planning Commission (NIRPC), which has jurisdiction over Lake, Porter, and LaPorte Counties, recently commissioned a study to identify problematic at-grade highway-rail grade crossings. The study identified 79 crossings that are “problematic” in that they cause an unusual level of inconvenience, hazard, or other problem.
47 Mileages from the FHWA Highway Statistics, 2008.
0
5
10
15
20
25
30
35
Indiana
Illinois
Ohio
Georgia
Michigan
Iowa
California
Kansas
Minnesota
Texas

DRAFT
DRAFT
Chapter 10: Review of Indiana Rail Lines 10-10
Exhibit 10- 9: Indiana Highway-Rail Grade Crossings by County
.
Highway-rail grade crossings featured prominently among stakeholder concerns during the stakeholder outreach process. Many stakeholders were interested in additional crossing improvements and crossing closures. A number of cities, towns, and other government entitites favored solutions to reduce the number of grade crossings in downtown areas. For example, a

DRAFT
DRAFT
Chapter 10: Review of Indiana Rail Lines 10-11
group of public and private entities commissioned a study in 2004 to look at the possibility of routing the CSX mainline through Indianapolis to a largely grade-separated bypass that would skirt the downtown area.48
Analysis of data provided by Indiana’s rail carriers, the Michigan Department of Transportation, and the Federal Railroad Administration suggests that Indiana railroads spend somewhere in the neighborhood of $33 million per year on maintaining crossings within the state. The cost of maintaining highway-rail at-grade crossings depends upon the type of warning device, the number of roadway lanes and railroad tracks that are crossed, and the volume of roadway traffic. A study by the Michigan Department of Transportation estimates that the cost of maintaining active crossing warning devices is as shown in
Some government entities were concerned about the maintenance of crossings by railroads, noting that small rail carriers may not always have the resources to maintain public grade crossings. Another problem relates to crossings for which the roadbed has been raised without a commensurate rise in roadway approaches, so that long vehicles bottom out over the crossing. For their part, many railroads feel that it is unfair that rail carriers have the financial obligation to maintain highway-rail at-grade crossings, since this maintenance is for the benefit of the motoring public, not the railroad. Railroads claim they ironically are paying for damage that has been disproportionately caused by heavy trucks, their main competitor. Railroads generally claim that if they did not bear the full cost of maintaining crossings, these funds would be applied elsewhere, such as to capacity expansion.
Exhibit 10- 10.49
Exhibit 10- 10: Annual Train-Activated Warning Device Maintenance Cost for Public Highway-Rail Crossings
The cost of maintaining devices is given by the type of warning device, i.e. whether it consists solely of flashing lights on a post, flashing lights on a cantilever structure, or gates, as well as by the number of tracks the roadway crosses.
Warning Device Maintenance Cost Flashing signals on a single track crossing $2,542 Flashing signals on a multiple track crossing $2,538 Flashing signals and cantilever structure(s) on a single track crossing $2,962 Flashing signals and cantilever structure(s) on a multiple track crossing $2,750 Flashing signals and gate(s) on a single track crossing $3,956 Flashing signals and gate(s) on a multiple track crossing $4,514 Flashing signals, cantilever structure(s) and gate(s) on a single track crossing $4,778 Flashing signals, cantilever structure(s) and gate(s) on a multiple track crossing $4,796
Source: Michigan Department of Transportation
48 R.L. Banks & Associates, Inc., Downtown Indianapolis Railroad Relocation Feasibility Study Study, February 10, 2004. 49 Michigan Department of Transportation, Bureau of Aeronautics and Freight Services, Railroad Active Traffic Control Devices Maintenance Cost Report. June 30, 2010.

DRAFT
DRAFT
Chapter 10: Review of Indiana Rail Lines 10-12
Exhibit 10- 11: Flashing Signals with Cantilevered Structure, Gates
Source: FHWA Manual on Uniform Control Devices
When multiplied by the number of train activated warning devices within the state, the annual cost of maintaining these devices is approximately $12.5 million per year. The funding is provided by the railroads.
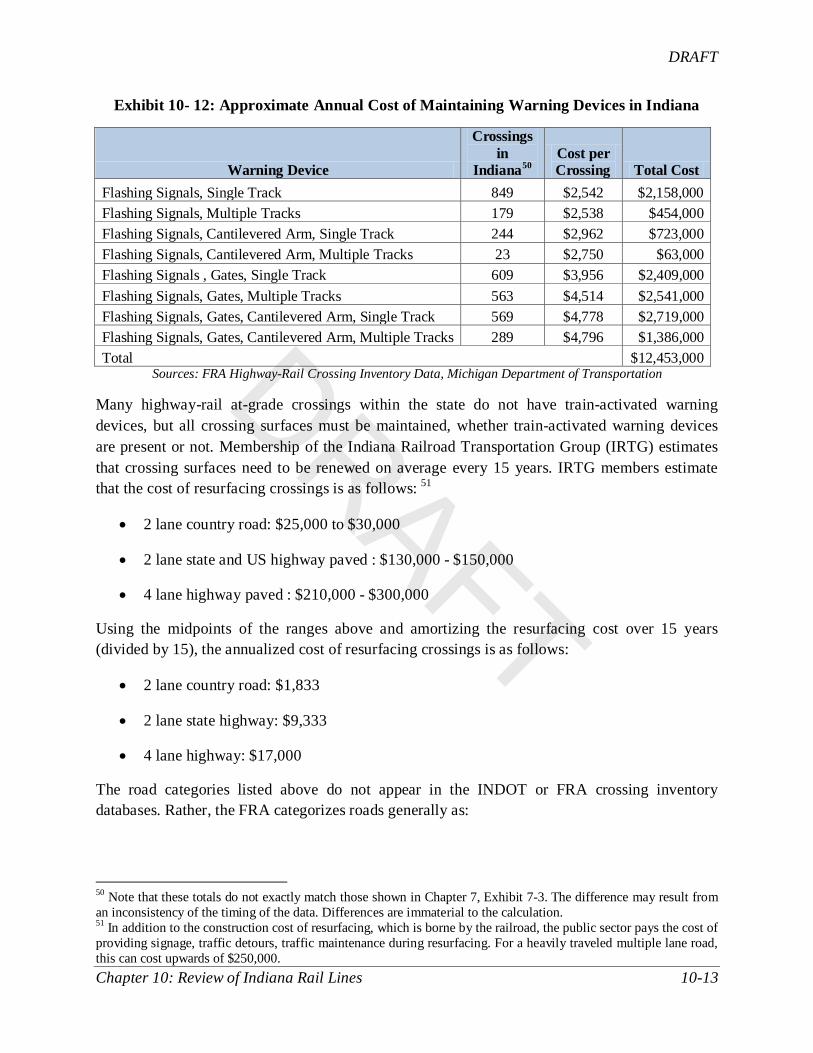
DRAFT
DRAFT
Chapter 10: Review of Indiana Rail Lines 10-13
Exhibit 10- 12: Approximate Annual Cost of Maintaining Warning Devices in Indiana
Warning Device
Crossings in
Indiana50Cost per Crossing Total Cost
Flashing Signals, Single Track 849 $2,542 $2,158,000 Flashing Signals, Multiple Tracks 179 $2,538 $454,000 Flashing Signals, Cantilevered Arm, Single Track 244 $2,962 $723,000 Flashing Signals, Cantilevered Arm, Multiple Tracks 23 $2,750 $63,000 Flashing Signals , Gates, Single Track 609 $3,956 $2,409,000 Flashing Signals, Gates, Multiple Tracks 563 $4,514 $2,541,000 Flashing Signals, Gates, Cantilevered Arm, Single Track 569 $4,778 $2,719,000 Flashing Signals, Gates, Cantilevered Arm, Multiple Tracks 289 $4,796 $1,386,000 Total $12,453,000
Sources: FRA Highway-Rail Crossing Inventory Data, Michigan Department of Transportation
Many highway-rail at-grade crossings within the state do not have train-activated warning devices, but all crossing surfaces must be maintained, whether train-activated warning devices are present or not. Membership of the Indiana Railroad Transportation Group (IRTG) estimates that crossing surfaces need to be renewed on average every 15 years. IRTG members estimate that the cost of resurfacing crossings is as follows: 51
• 2 lane country road: $25,000 to $30,000
• 2 lane state and US highway paved : $130,000 - $150,000
• 4 lane highway paved : $210,000 - $300,000
Using the midpoints of the ranges above and amortizing the resurfacing cost over 15 years (divided by 15), the annualized cost of resurfacing crossings is as follows:
• 2 lane country road: $1,833
• 2 lane state highway: $9,333
• 4 lane highway: $17,000
The road categories listed above do not appear in the INDOT or FRA crossing inventory databases. Rather, the FRA categorizes roads generally as:
50 Note that these totals do not exactly match those shown in Chapter 7, Exhibit 7-3. The difference may result from an inconsistency of the timing of the data. Differences are immaterial to the calculation. 51 In addition to the construction cost of resurfacing, which is borne by the railroad, the public sector pays the cost of providing signage, traffic detours, traffic maintenance during resurfacing. For a heavily traveled multiple lane road, this can cost upwards of $250,000.
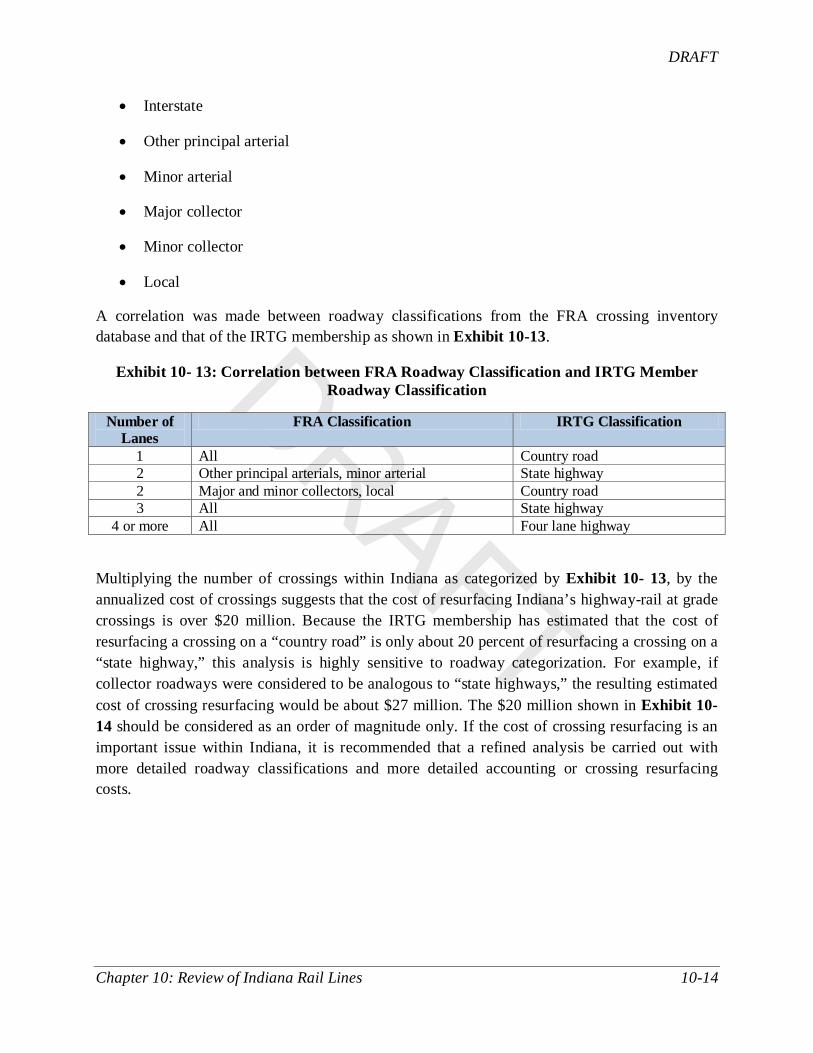
DRAFT
DRAFT
Chapter 10: Review of Indiana Rail Lines 10-14
• Interstate
• Other principal arterial
• Minor arterial
• Major collector
• Minor collector
• Local
A correlation was made between roadway classifications from the FRA crossing inventory database and that of the IRTG membership as shown in Exhibit 10-13.
Exhibit 10- 13: Correlation between FRA Roadway Classification and IRTG Member Roadway Classification
Number of Lanes
FRA Classification IRTG Classification
1 All Country road 2 Other principal arterials, minor arterial State highway 2 Major and minor collectors, local Country road 3 All State highway
4 or more All Four lane highway
Multiplying the number of crossings within Indiana as categorized by Exhibit 10- 13, by the annualized cost of crossings suggests that the cost of resurfacing Indiana’s highway-rail at grade crossings is over $20 million. Because the IRTG membership has estimated that the cost of resurfacing a crossing on a “country road” is only about 20 percent of resurfacing a crossing on a “state highway,” this analysis is highly sensitive to roadway categorization. For example, if collector roadways were considered to be analogous to “state highways,” the resulting estimated cost of crossing resurfacing would be about $27 million. The $20 million shown in Exhibit 10- 14 should be considered as an order of magnitude only. If the cost of crossing resurfacing is an important issue within Indiana, it is recommended that a refined analysis be carried out with more detailed roadway classifications and more detailed accounting or crossing resurfacing costs.

DRAFT
DRAFT
Chapter 10: Review of Indiana Rail Lines 10-15
Exhibit 10- 14: Annual Cost of Resurfacing Public Highway-Rail At-Grade Crossings in Indiana
Road Type
Crossings in
Indiana52Annualized Cost of Resurfacing
Annual Cost of Resurfacing
Country Road 4,832 $1,833 $8,859,000 State Highway 744 $9,333 $6,944,000 Four Lane Highway 262 $17,000 $4,454,000 Total $20,257,000
10.6 North-South Connections One issue that has been mentioned by several stakeholders is a lack of north-south connectivity. This particularly impacts coal, since Indiana coal fields are located in the southwestern corner of the state, while many of the largest coal-fired power plants are located in the northern part of the state. One power company in northern Indian mentioned that it is difficult for the company to receive shipments of Indiana coal at its power stations. Coal trains are routed through Chicago, which is circuitous and causes delay due to rail congestion in Chicago. In part, this situation results from poor interchanges within the state between NS and CSX. However, traffic from Indiana mines that originates on CSX served mines and terminates at CSX served power plants is also routed through Chicago. Indiana coal has high sulfur content, but as Indiana power plants have invested in new scrubbers, a greater usage of Indiana coal could be more feasible. Improved north-south connections may also allow Indiana coal to be shipped from ports such as the Port of Indiana at Burns Harbor to power producers on the Great Lakes and perhaps for export.
Indiana’s lack of north-south rail connectivity is also a problem since, as shown in Exhibit 4-14 in Chapter 4, trade with the Southeast U.S. is expected to account for 22 percent of the increase in rail tonnage to and from Indiana between 2007 and 2040. Currently, there is no mainline that directly connects Indianapolis with southeastern markets. Of existing north-south mainlines, the CSX CE&D Subdivision runs along the Indiana/Illinois border, while other north-south mainlines run through Cincinnati.
52 Note that these totals do not exactly match those shown in Chapter 7, Exhibit 7-3. The difference may result from an inconsistency of the timing of the data. Differences are immaterial to the calculation.

DRAFT
DRAFT
Chapter 10: Review of Indiana Rail Lines 10-16
Exhibit 10- 15: Density of Indiana Rail Lines in Million Gross Tons per Mile
Various solutions have been put forward to improve north-south connections within the state. The Center for Coal Technology Research (CCTR) at Purdue University has been studying options for an Indiana Coal Corridor. One option put forward is an organization that would be a “quasi-governmental private industry partnership” which would negotiate trackage rights along a

DRAFT
DRAFT
Chapter 10: Review of Indiana Rail Lines 10-17
route over multiple carriers.53
Another proposal put forward does not focus on coal shipments, but instead seeks to improve overall connectivity between Indiana and the Southeast. Rail lines south of Indianapolis, such as the Louisville & Indiana Railroad (LI), the Central Railroad Company of Indiana (CIND), or the CSX Indianapolis Subdivision could become part of a marketed interline service over enhanced rail infrastructure, thus better connecting Indiana with southeastern markets. To some extent, this is already happening. CSX has announced that it will be filing an application with the U.S. Surface Transportation Board for a perpetual non-exclusive overhead freight operating easement for joint use over 106.5 miles of the LIRC between Indianapolis and Louisville, KY. As part of the deal, CSX will rehabilitate the line to FRA Class IV standards, so that trains could operate to 49 miles per hour, and 286,000-pound carloads can be accommodated, including double stack intermodal trains. Once the rehabilitation is completed, CSX will reroute trains from other parts of its network onto the line, particularly those between Louisville and Cincinnati. The move will establish a direct connection between CSX’s operations in Indianapolis and the CSX mainlines into Louisville from the south.
This entity would also have responsibility for marketing and coordinating the operational details of the service.
53 Thomas F. Brady, Ph.D. and Chad M. Pfitzer, A Prescriptive Analysis of Indiana Coal Transportation Infrastructure, May 2007.
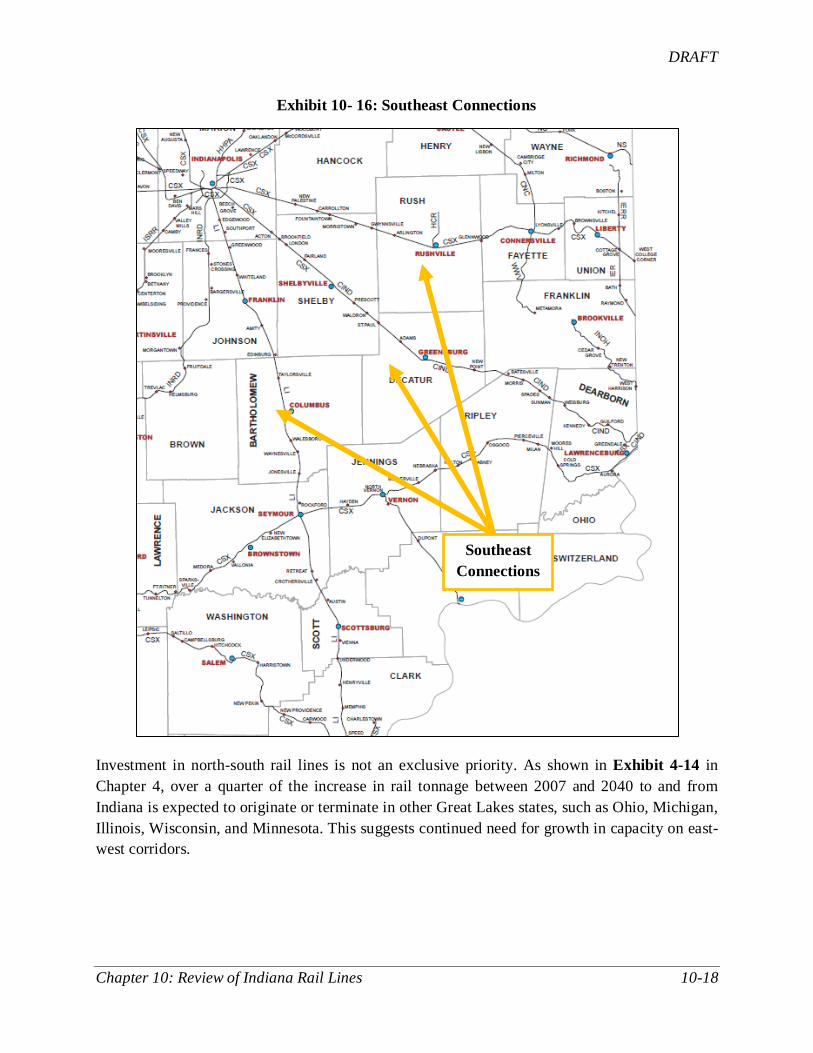
DRAFT
DRAFT
Chapter 10: Review of Indiana Rail Lines 10-18
Exhibit 10- 16: Southeast Connections
Investment in north-south rail lines is not an exclusive priority. As shown in Exhibit 4-14 in Chapter 4, over a quarter of the increase in rail tonnage between 2007 and 2040 to and from Indiana is expected to originate or terminate in other Great Lakes states, such as Ohio, Michigan, Illinois, Wisconsin, and Minnesota. This suggests continued need for growth in capacity on east-west corridors.
Southeast Connections

DRAFT
DRAFT
Chapter 11: Indiana’s Rail Investment Program 11-1
Chapter 11: Indiana’s Rail Investment Program The federal Passenger Rail Investment and Improvement Act of 2008 requires that short and long range investment programs for current and future freight and passenger infrastructure needs be included in each state rail plan. These plans are to be comprised of a list of future rail capital projects expected to be undertaken or supported in whole or in part by the state, and include a funding program for projects and the anticipated public and private benefits associated with each project.
The following sections describe Indiana’s policies for transportation investments in general and for rail investments in particular. The Short and Long – Range Rail Programs are provided in Appendix B and C.
11.1 Indiana Rail Investment Policies FHWA regulations require state transportation planning to consider eight planning factors. Indiana supports and includes these factors in developing its transportation programs, including its rail program. These factors are:
• Support economic vitality, especially by enabling global competitiveness, productivity, and efficiency
• Increase the safety of the transportation system
• Increase the security of the transportation system
• Increase accessibility and mobility options available to people and freight
• Protect and enhance the environment, promote energy conservation, improve the quality of life, and promote consistency between transportation improvements and economic development patterns
• Enhance the integration and connectivity of the transportation system, across modes, for people and freight
• Promote efficient system management and operations
• Emphasize preservation of the existing transportation system
Indiana’s long and short-range project prioritization processes are also clearly defined in state plans. Indiana’s 10-year infrastructure program Major Moves (2006-2015) used a scoring process for major new capacity projects with construction costs expected to exceed $5 million. The three primary components which comprise Major Moves project scores are 1) transportation efficiency; 2) safety; and 3) economic development.

DRAFT
DRAFT
Chapter 11: Indiana’s Rail Investment Program 11-2
Indiana also has more specific project justification and prioritization methodologies for its specific rail programs which will be described in the sections below.
11.2 Indiana’s Rail Passenger Investment Plan Indiana’s Short-Range (1-5 Year) Program is comprised of projects for which funding has been identified or allocated. Due to current budget constraints, it has been determined that large-scale rail passenger projects must be funded primarily through federal funding programs.
Intercity rail projects on the Short-Range Program are currently limited to the Indiana Gateway project on the Chicago-Kalamazoo-Detroit corridor. A federal grant application submitted by Indiana, Illinois and Michigan resulted in an award of $71 million for rail crossovers and related signal system improvements and rail addition and siding improvements within Indiana. Indiana also received an additional $365,000 of redirected funds which were not utilized by other states.
The Short-Range Program also includes programmed capital projects for the Northern Indiana Commuter Transportation District (NICTD) as found in the Northwest Indiana Regional Planning Commission (NIRPC) and Michiana Area Council of Governments (MACOG) Transportation Improvement Plans (TIP). These consist mainly of project funded through the Federal Transit Administration (FTA) Capital Investment Funds (Section 5309). NICTD is responsible for developing its own project selection criteria and utilizing the same in selecting Rail Modernization projects.
A number of additional rail passenger projects identified through the public outreach process are listed on the Long-Range (6-20 Year) Program. As funding becomes available in the future, these proposed projects will be evaluated in terms of their respective public benefits and could be moved to the Short-Term Program as they so merit.
11.3 Indiana’s Rail Freight Investment Plan Similar to the passenger projects, rail freight projects included in the Short-Range Program are those for which funding has been identified. The Short-Range Program of freight projects is primarily comprised of projects funded through the long-established State Industrial Rail Service Fund and Grade Crossing fund and the federal Section 130 Grade Crossing Improvement Program. Projects selected with the funds available through these programs have been selected based on their individual evaluation criteria.
Industrial Rail Service Fund projects are limited to Class II or III railroads and selected on the basis of the following criteria:
• The extent the project accommodates 286,000 lb. carload weights
• The extent to which projects provide new rail access to business or rehabilitate lines to a higher FRA track class
• Existing rail carloadings per mile

DRAFT
DRAFT
Chapter 11: Indiana’s Rail Investment Program 11-3
• The total number of Indiana jobs the project will generate
• The types of commodities originated or terminated
• The extent to which the project provides or improves access to intermodal facilities or Class I railroad connections
• The extent of the railroad financial contribution to the total project cost
Short-Range projects funded by the state Railroad Grade Crossing Fund address crossings with passive warning devices, i.e. crossings which do not have automatic train-activated warning devices. Projects are evaluated and selected on the basis of the community’s population, the volume of rail traffic, and project type including advance warning signs, pavement markings, overhead streetlights, median barriers and signal lighting upgrades. Crossing closure projects are also advanced through this program with projects selected on the basis of the predicted accident rate at the subject crossing.
Short-Range grade crossing projects funded through the federal Section 130 Highway-Rail Grade Crossing Program are evaluated and selected based on the federally approved accident prediction and hazard index criteria. The leading criteria include annual average daily highway traffic, average daily train traffic, and the type of existing warning equipment.
The Long-Range rail freight projects, largely identified through the stakeholder outreach effort, include both large and smaller scale projects. Projects involving potential improvement of Class II and III railroads and grade crossing improvements will be evaluated and moved to the Short-Range Program as funding becomes available through existing or new programs. Initiation and implementation of larger scale freight projects, due to current budgetary constraints, will likely be dependent on the level of federal funding provided over the short to intermediate term.