draft manual for non-structural and structural reductions ... · us epa region 1 draft reductions...
TRANSCRIPT

US EPA Region 1 Draft Reductions Workbooks Manual 5/26/2011
1
Manual for Non-structural and Structural Reductions Calculators of the Phosphorus
Control Plan Template
Contents ............................................................................................................................................. Page
Phosphorus Control Plan template overview .............................................................................................................. 2
Using the PCP Template to complete permit reporting requirements ............................................................. 2
Year 2 Reporting ................................................................................................................................................................. 2
Year 4 Reporting ................................................................................................................................................................. 3
PCP Descriptions Template ................................................................................................................................................. 3
Workbook 1: Phosphorus Loading and Required Reductions Calculator ........................................................ 3
Workbook 2: Non-structural Phosphorus Reductions Calculator ...................................................................... 4
Worksheet 1: Introduction ............................................................................................................................................ 4
Worksheet 2: Summary .................................................................................................................................................. 4
Worksheet 3: Street Sweeping ...................................................................................................................................... 5
Worksheet 4: Catch Basin Cleaning ............................................................................................................................. 6
Worksheet 5: Phosphorus Fertilizer Elimination ................................................................................................. 7
Worksheet 6: Leaf Litter Pickup ................................................................................................................................... 8
Worksheet 7: Conversions and Coefficients ............................................................................................................ 9
Workbook 3: Structural Phosphorus Reductions Calculator .............................................................................. 10
Worksheet 1: Introduction .......................................................................................................................................... 11
Worksheet 2: Summary ................................................................................................................................................ 11
Worksheet 3 through Worksheet 8 ........................................................................................................................... 12
Worksheet 9: BMP Effectiveness ................................................................................................................................ 13
Worksheet 10: Conversions and Coefficients ....................................................................................................... 15
References ................................................................................................................................................................................ 16
US EPA Region 1 Draft Reductions Workbooks Manual 5/26/2011
2
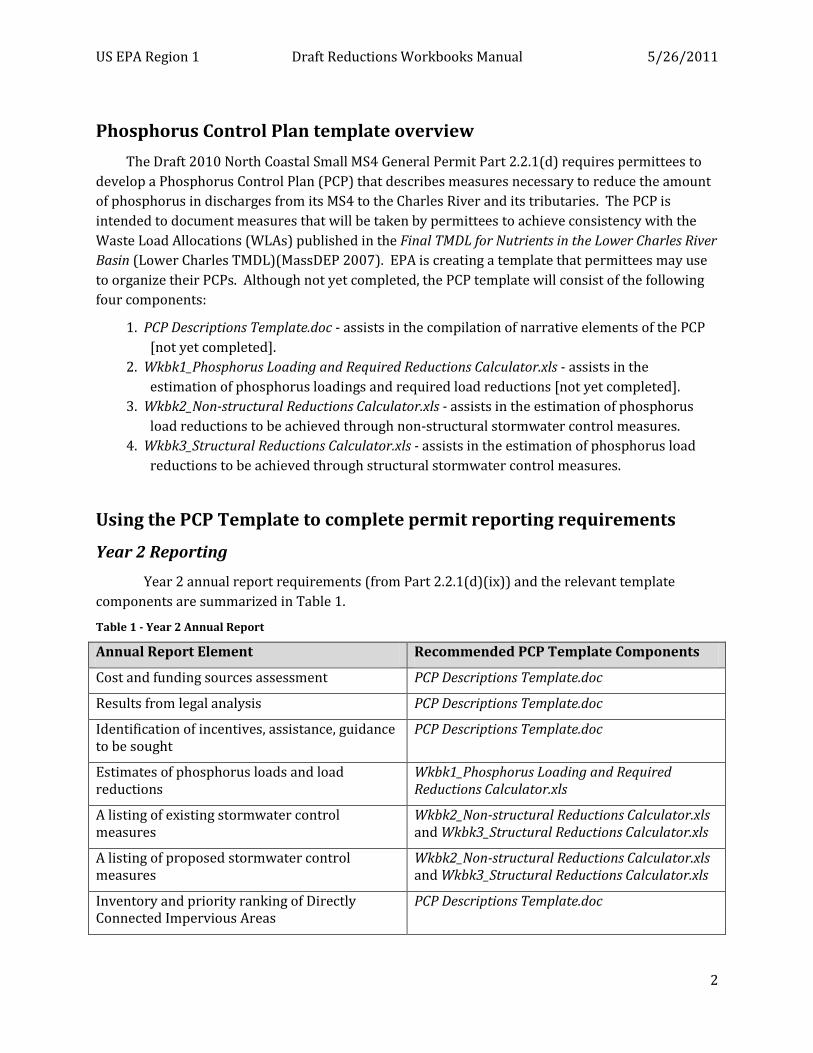
Phosphorus Control Plan template overview
The Draft 2010 North Coastal Small MS4 General Permit Part 2.2.1(d) requires permittees to
develop a Phosphorus Control Plan (PCP) that describes measures necessary to reduce the amount
of phosphorus in discharges from its MS4 to the Charles River and its tributaries. The PCP is
intended to document measures that will be taken by permittees to achieve consistency with the
Waste Load Allocations (WLAs) published in the Final TMDL for Nutrients in the Lower Charles River
Basin (Lower Charles TMDL)(MassDEP 2007). EPA is creating a template that permittees may use
to organize their PCPs. Although not yet completed, the PCP template will consist of the following
four components:
1. PCP Descriptions Template.doc - assists in the compilation of narrative elements of the PCP
[not yet completed].
2. Wkbk1_Phosphorus Loading and Required Reductions Calculator.xls - assists in the
estimation of phosphorus loadings and required load reductions [not yet completed].
3. Wkbk2_Non-structural Reductions Calculator.xls - assists in the estimation of phosphorus
load reductions to be achieved through non-structural stormwater control measures.
4. Wkbk3_Structural Reductions Calculator.xls - assists in the estimation of phosphorus load
reductions to be achieved through structural stormwater control measures.
Using the PCP Template to complete permit reporting requirements
Year 2 Reporting
Year 2 annual report requirements (from Part 2.2.1(d)(ix)) and the relevant template
components are summarized in Table 1.
Table 1 - Year 2 Annual Report
Annual Report Element Recommended PCP Template Components
Cost and funding sources assessment PCP Descriptions Template.doc
Results from legal analysis PCP Descriptions Template.doc
Identification of incentives, assistance, guidance to be sought
PCP Descriptions Template.doc
Estimates of phosphorus loads and load reductions
Wkbk1_Phosphorus Loading and Required Reductions Calculator.xls
A listing of existing stormwater control measures
Wkbk2_Non-structural Reductions Calculator.xls and Wkbk3_Structural Reductions Calculator.xls
A listing of proposed stormwater control measures
Wkbk2_Non-structural Reductions Calculator.xls and Wkbk3_Structural Reductions Calculator.xls
Inventory and priority ranking of Directly Connected Impervious Areas
PCP Descriptions Template.doc
US EPA Region 1 Draft Reductions Workbooks Manual 5/26/2011
3
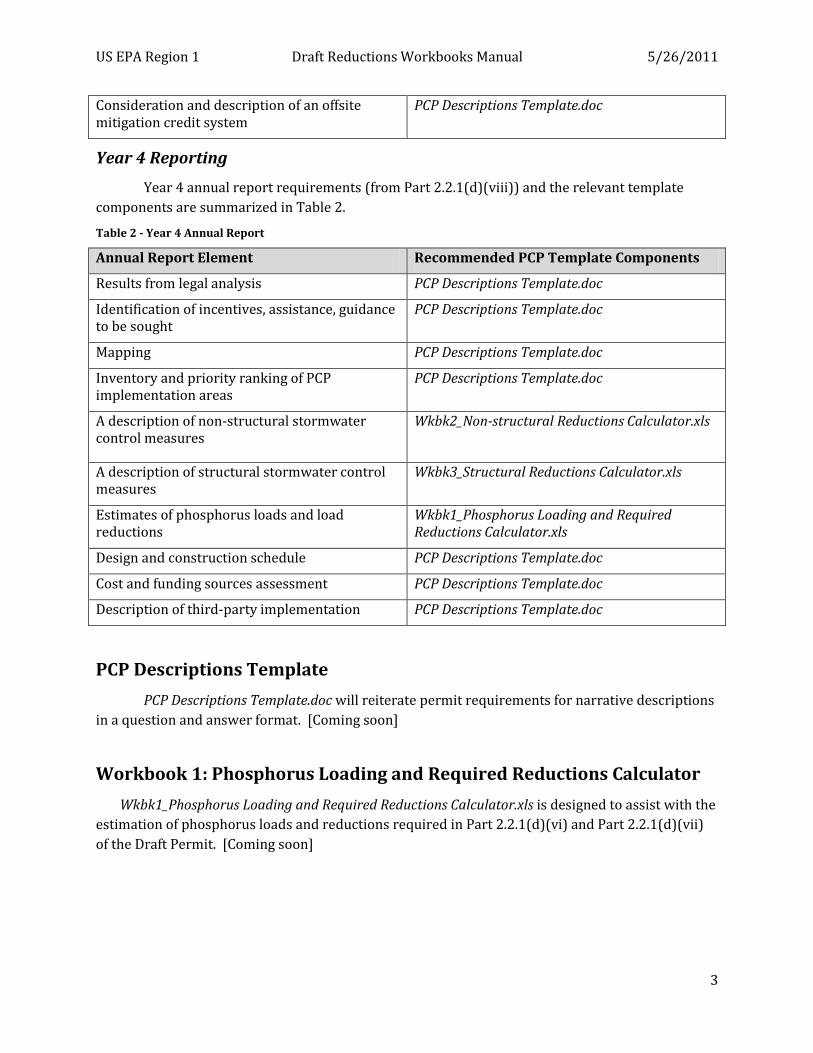
Consideration and description of an offsite mitigation credit system
PCP Descriptions Template.doc
Year 4 Reporting
Year 4 annual report requirements (from Part 2.2.1(d)(viii)) and the relevant template
components are summarized in Table 2.
Table 2 - Year 4 Annual Report
Annual Report Element Recommended PCP Template Components
Results from legal analysis PCP Descriptions Template.doc
Identification of incentives, assistance, guidance to be sought
PCP Descriptions Template.doc
Mapping PCP Descriptions Template.doc
Inventory and priority ranking of PCP implementation areas
PCP Descriptions Template.doc
A description of non-structural stormwater control measures
Wkbk2_Non-structural Reductions Calculator.xls
A description of structural stormwater control measures
Wkbk3_Structural Reductions Calculator.xls
Estimates of phosphorus loads and load reductions
Wkbk1_Phosphorus Loading and Required Reductions Calculator.xls
Design and construction schedule PCP Descriptions Template.doc
Cost and funding sources assessment PCP Descriptions Template.doc
Description of third-party implementation PCP Descriptions Template.doc
PCP Descriptions Template
PCP Descriptions Template.doc will reiterate permit requirements for narrative descriptions
in a question and answer format. [Coming soon]
Workbook 1: Phosphorus Loading and Required Reductions Calculator
Wkbk1_Phosphorus Loading and Required Reductions Calculator.xls is designed to assist with the
estimation of phosphorus loads and reductions required in Part 2.2.1(d)(vi) and Part 2.2.1(d)(vii)
of the Draft Permit. [Coming soon]

US EPA Region 1 Draft Reductions Workbooks Manual 5/26/2011
4
Workbook 2: Non-structural Phosphorus Reductions Calculator
Wkbk2_Non-structural Reductions Calculator.xls is designed to assist with the estimation of
phosphorus loads and reductions required in Part 2.2.1(d)(iii) of the Draft Permit. The Non-
structural Phosphorus Reductions Calculator contains seven worksheets:
1. Introduction: explains format and gives directions for workbook use
2. Summary: calculates reductions expected from non-structural BMPs
3. Street Sweeping
4. Catch Basin Cleaning
5. Phosphorus Fertilizer Elimination
6. Leaf Litter Pickup
7. Conversions and Coefficients: lists unit conversions, Phosphorus Load Export (PLE) rates,
and the translation of Mass GIS 2005 Land Use codes into land use categories
This workbook provides a convenient method to organize information about non-structural
Best Management Practices (BMPs) performed or planned as part of the Phosphorus Control Plan
(PCP). BMP effectiveness percentages are estimated using available studies and, when there is less
published research available, best professional judgment. The Lower Charles TMDL (MassDEP
2007) recommends an adaptive management approach in calculating phosphorous reduction
effectiveness, therefore, MS4s are encouraged to build upon this list of quantifiable BMPs and
further refine BMP estimated effectiveness by contributing scientific studies.
This workbook does not explicitly account for the decreasing percent reductions achieved
as BMPs are applied in series (also known as the “treatment train”). See the Massachusetts TSS
calculator for more details on the effect of the treatment chain (MassDEP 2008). This simplification
may cause the workbook to overestimate phosphorus reductions, but the magnitude of the impact
is considered acceptable in a planning-level analysis.
To prevent accidental change of cells containing formulas, some cells are “locked” in the
template. To edit any locked cell, use the Unprotect Sheet command (Review tab, Changes group in
Excel 2007) to remove protection from the worksheet. No password is required.
Worksheet 1: Introduction
No inputs are required for this worksheet.
This worksheet gives basic directions and lists the contents of the Non-structural
Phosphorus Reductions Calculator.
The color code used in all workbooks of the PCP Template is provided.
Worksheet 2: Summary
Inputs required for this worksheet:
Intention to implement PCP either (a) over the entire municipality within the Charles
River watershed or (b) only in the area of the municipality tributary to the MS4
system.

US EPA Region 1 Draft Reductions Workbooks Manual 5/26/2011
5
Phosphorus load to Charles River for PCP implementation area
Required percent reduction for PCP implementation area
This worksheet summarizes information to estimate the percentage of required phosphorus
reductions that will be achieved through non-structural BMPs.
The scope of PCP implementation (“Total” or “MS4-Only”) for this planning exercise should
be chosen from the dropdown list in Cell D6. The 1998-2002 Phosphorus Load (in metric units)
and the Percent Reduction Required for the corresponding implementation area should then be
entered in Cell D7 and Cell D8, respectively. If the PCP will be implemented over the entire
(“Total”) municipality within the Charles River watershed, then the 1998-2002 Phosphorus Load
can be obtained from Table G-2 in the Draft Permit. If the PCP will be implemented only inside the
MS4 area (“MS4-Only”), then the municipality must estimate the MS4-Only Phosphorus Load. Refer
to Draft Permit part 2.2.1(d)(vi) for more details.
Cell D11 through Cell D14 summarize non-structural load reductions achieved from the
other worksheets of this workbook. Non-structural load reductions are summed in Cell D15. Cell
D16 calculates the percent reduction achieved from non-structural BMPs by dividing the Total Non-
structural Reductions by the 1998-2002 Phosphorus Load. Column C converts results to United
States (US) customary units.
Worksheet 3: Street Sweeping
Inputs required for this worksheet:
For programmatic street sweeping:
o Street sweeping areas by land use category
o Frequency of sweeping and sweeping technology used in each land use area
For individual site street sweeping:
o Implementation areas by land use category
o Frequency of sweeping and sweeping technology used at each site
Worksheet 3: Street Sweeping is divided into three sections. The BMP Effectiveness table at
the top of the worksheet contains references used to calculate an effectiveness coefficient for street
sweeping. The Programmatic section in the middle of the worksheet is intended to calculate
phosphorus reductions from street sweeping as it is implemented across wide areas of a
municipality. The Individual Site section at the bottom of the worksheet is intended to calculate
phosphorus reductions from street sweeping implemented on a site-by-site basis. An instance of
street sweeping should be counted as either programmatic or as an individual site, but not as both.
Total load reductions achieved implementing programmatic and individual site street sweeping are
summed at the bottom of the worksheet.
Street sweeping effectiveness found in the BMP Effectiveness table is derived from a study
conducted by the Center for Watershed Protection (CWP 2008). The CWP study estimates the
effectiveness of monthly and weekly sweeping by mechanical broom technology and by
regenerative air / vacuum assisted technology. CWP does not provide efficiency estimates for
biannual sweeping, so these are provided using best professional judgment.
US EPA Region 1 Draft Reductions Workbooks Manual 5/26/2011
6
To use the programmatic section of the Street Sweeping worksheet, use Column D to enter
the area of each land use type (in US customary units) that is included in the municipal street
sweeping program. In this example, land use data from Franklin, Massachusetts is used. Data
extracted from MassGIS 2005 land use datalayers (MassGIS 2009) is aggregated into nine land use
categories according to the scheme provided on the lower section of the Conversions and
Coefficients Worksheet. For most land use categories in this example, the entire area within the
PCP Implementation Area is included in programmatic street sweeping. For Agriculture and Forest
land use categories, only small amounts of impervious surface exist and so street sweeping
implementation is assumed limited to areas near an impervious area. To compute this area, a
buffer tool was used to delineate Agriculture and Forest areas within 50 feet of the MassGIS
impervious cover datalayer (MassGIS 2007).
Column E provides an estimate of the amount of phosphorus that is exported per acre, per
year from each land use category. This approach of estimating phosphorous exported per acre is
similar to the land use analysis included with the Lower Charles TMDL (MassDEP 2007). Sources
for the Phosphorus Load Export (PLE) rates can be found on upper section of the Conversions and
Coefficients Worksheet.
For each area that is swept, provide information on the frequency of sweeping and the type
of technology used. This is done by using the dropdown lists in Column F and Column G. Column H
refers to the BMP Effectiveness table at the top of the worksheet to match the frequency and
technology used with the expected effectiveness.
In Column I, the area treated is multiplied by the PLE rate and by the sweeping effectiveness
to calculate the phosphorus load reductions for each land use. The phosphorus reductions by land
use are summed to calculate the programmatic reductions reported in Cell I22. Column J converts
the result to metric units.
Individual site street sweeping reductions are calculated in the same way as the
programmatic reductions on the lower section of the worksheet. Column B allows the user to enter
a name for the site. Column C provides a dropdown list for land use categories which will
automatically populate Column E with the correct PLE rate for the chosen land use category. The
remaining columns are identical to the programmatic calculations described above.
Worksheet 4: Catch Basin Cleaning
Inputs required for this worksheet:
For programmatic catch basin cleaning:
o Areas by land use in which catch basins are present
o Total number of catch basins and number of catch basins cleaned in each land
use area
For individual site catch basin cleaning:
o Developed area of site that drain to catch basins
o Total number of catch basins and number of catch basins cleaned at each site
Worksheet 4: Catch Basin Cleaning is divided into three sections. The BMP Effectiveness
table at the top of the worksheet contains a reference used to calculate an effectiveness coefficient

US EPA Region 1 Draft Reductions Workbooks Manual 5/26/2011
7
for the BMP. The Programmatic section in the middle of the worksheet is intended to calculate
phosphorus reductions from a BMP as it is implemented across wide areas of a municipality. The
Individual Site section at the bottom of the worksheet is intended to calculate phosphorus
reductions from BMPs implemented on a site-by-site basis. An instance of a BMP should be counted
as either programmatic or as an individual site, but not as both. Total load reductions achieved
implementing programmatic and individual site BMPs are summed at the bottom of the worksheet.
The same CWP study (CWP 2008) used to estimate street sweeping effectiveness is also
used here to estimate catch basin cleaning effectiveness. The study reports effectiveness given an
estimate of how many times per year a catch basin is cleaned. The report also notes that effective
implementation of catch basin cleaning may need to target problem catch basins. In order to
address problem catch basins, the Draft Permit requires permittee to optimize catch basin cleaning
so that catch basin sumps stay no more than 50% full (Draft Permit part 2.4.7.1(d)(iii)). Although
the measure of catch basin cleaning used in the study is not the same as the draft permit, the
resulting effectiveness coefficient of 2% found by the study remains a useful estimate of the
potential effectiveness of a catch basin cleaning program.
To use the programmatic section of the Catch Basin Cleaning worksheet, enter the area of
each land use type that is included in the municipal catch basin cleaning program in Column D. As
is described above for the street sweeping worksheet, land use data for the town of Franklin is used
for this example. PLE rates are given in Column E to estimate the amount of phosphorus load
expected from the land use.
For each area with catch basins, provide information on the number of catch basins present
(Column F) and the number of catch basins cleaned according to the Draft Permit part 2.4.7.1(d)(iii)
(Column G). Column H calculates a percentage of catch basins within the treatment area at which
cleaning is performed.
In Column I, the area treated is multiplied by the PLE rate and by the percentage of catch
basins cleaned, and by the catch basin cleaning effectiveness to calculate the phosphorus load
reductions for each land use. The phosphorus reductions by land use are summed to calculate the
programmatic reductions reported in Cell I22. Column J converts results to metric units.
Individual site street sweeping reductions are calculated in the same way as the
programmatic reductions on the lower section of the worksheet. Column B allows the user to enter
a name for the site. Column C provides a dropdown list for land use categories which will
automatically populate Column E with the correct PLE rate for the chosen land use category. The
remaining columns are identical to the programmatic calculations described above.
Worksheet 5: Phosphorus Fertilizer Elimination
Inputs required for this worksheet:
Areas by land use in which phosphorus fertilizer is eliminated
Area of sites at which phosphorus fertilizer is eliminated
Worksheet 5: Phosphorus Fertilizer Elimination estimates the effectiveness coefficient of
the BMP, the programmatic load reductions, and the individual site load reductions associated with
the elimination of phosphorous fertilizer. This worksheet functions very similar to the other non-

US EPA Region 1 Draft Reductions Workbooks Manual 5/26/2011
8
structural BMP worksheets. To reduce repetition, only the particular features of the worksheet are
discussed here. Refer to the descriptions of the Street Sweeping Worksheet and the Catch Basin
Cleaning Worksheet for more information about worksheet organization.
The estimated effectiveness of phosphorus fertilizer elimination (10%) is given in cell C8.
This value is lower than the effectiveness reported in the study performed by the University of
Michigan (Lehman et al. 2009) due to factors in the study that have the potential to overestimate
the load reductions possible from this BMP. One factor is the overestimate of the mean reduction in
phosphorus loading of 31%. This value only includes sites where a statistically significant
reduction occurred. If all sites in the study are included in the effectiveness calculation, the average
reduction is much smaller (21%). Another factor that may inflate the effectiveness found in this
study is phosphorus reductions were only measured during five months of the year. The reductions
seen during the growing season when phosphorus would typically be applied may not be
representative of the entire year. A seasonal variability in observed phosphorus reductions can be
seen even within the study period, as the 41% reductions are reported in May are much higher than
phosphorus reductions found in the summer. Finally, a public education campaign was initiated at
the same time as the phosphorus fertilizer elimination, and therefore the reductions achieved are
likely to include behavioral changes factors in addition to the elimination of phosphorus fertilizers.
The University of Minnesota study (Vlach et al. 2008) reported a much lower effectiveness (12% to
15%). The results are limited, however, due to the small size of the watersheds studied and the
uniformly residential land use that is present. This workbook attempts to apply an effectiveness
coefficient to a variety of land uses where fertilizers may be far less prevalent.
Please note that Cell D15 in this example shows zero area of implementation of phosphorus
fertilizer elimination in the Freeway land use category because it is assumed that fertilizer is
applied in the highway right-of-way. A similar assumption could be made for other land uses that
would not be impacted by a ban on phosphorus fertilizer.
In Column F, the area treated is multiplied by the PLE rate and by the effectiveness of
phosphorus fertilizer elimination to calculate the phosphorus load reductions for each land use.
Worksheet 6: Leaf Litter Pickup
Inputs required for this worksheet:
Areas by land use served by leaf litter pickup program
Area of sites performing leaf litter pickup
Worksheet 6: Leaf Litter Pickup estimates the effectiveness coefficient of the BMP, the
programmatic load reductions, and the individual site load reductions associated with leaf litter
pickup. This worksheet functions very similar to the other non-structural BMP worksheets. To
reduce repetition, only the particular features of the worksheet are discussed here. Refer to the
descriptions of the Street Sweeping Worksheet and the Catch Basin Cleaning Worksheet for more
information about worksheet organization.
There is very little data available regarding the effectiveness of leaf litter pickup programs
to reduce phosphorus loads. As the USGS study notes, a great deal of the phosphorus in roadways
can be attributed to leaf litter in residential neighborhoods. It is unknown, however, how leaf litter

US EPA Region 1 Draft Reductions Workbooks Manual 5/26/2011
9
varies by land use and what percentage of the phosphorus present in the roadway would eventually
enter the receiving water body. Also, it is unknown what a leaf litter collection program would
consist of, in terms of participation and procedures. An effectiveness of 5% was selected using
professional judgment. Using the adaptive management approach, this estimate can be refined by
MS4s through scientific study.
In Column F, the area treated is multiplied by the PLE rate and by the effectiveness of leaf
litter pickup to calculate the phosphorus load reductions for each land use.
Worksheet 7: Conversions and Coefficients
No inputs are required for this worksheet.
Unit conversion factors used in this workbook are included on the left side of this
worksheet.
Phosphorus Load Export (PLE) rates used in this worksheet are included on the right side of
this worksheet. The PLE rates have been updated from the TMDL to reflect improved
understanding of the relationship between land use and phosphorus loading. The Optimal
Stormwater Management Plan Alternatives: A Demonstration Project in Three Upper Charles River
Communities report (TetraTech 2009), and the Draft General Permit for Designated Discharges (EPA
2010) also use the same updated PLE rates that are provided in the PCP Template.
US EPA Region 1 Draft Reductions Workbooks Manual 5/26/2011
10
Workbook 3: Structural Phosphorus Reductions Calculator
Wkbk3_Structural Reductions Calculator.xls is designed to assist with the estimation of
phosphorus loads and reductions required in Part 2.2.1(d)(iv) of the Draft Permit. The Structural
Phosphorus Reductions Calculator contains ten worksheets:
1. Introduction: explains format and gives directions for workbook use
2. Summary: calculates required reductions from structural BMPs, calculates expected
reductions from structural BMPs, and allows the user to check structural BMP treatment
areas against available impervious surface areas
3. Infiltration BMPs
4. Biofiltration BMPs
5. Other filtration BMPs
6. Storm water wetlands
7. Detention BMPs
8. Rain water harvesting systems
9. BMP effectiveness matrix
10. Conversions and Coefficients: lists unit conversions, Phosphorus Load Export (PLE) rates,
and the translation of Mass GIS 2005 Land Use codes into land use categories
Similar to the Non-Structural Calculator, this workbook provides a method for organizing
information about structural Best Management Practices (BMPs) performed or planned as part of
the Phosphorus Control Plan (PCP). MS4s are encouraged to use this workbook in the context of
adaptive management by contributing scientific studies to refine the estimates of effectiveness for
the BMPs listed and for other BMPs not included.
This workbook does not explicitly account for the decreasing percent reductions achieved
as BMPs are applied in series (also known as the “treatment train”). This simplification may cause
the workbook to overestimate phosphorus reductions, but the magnitude of the impact is assumed
to be acceptable in a planning-level analysis.
To prevent accidental change of cells containing formulas, some cells are “locked” in the
template. To edit any locked cell, use the Unprotect Sheet command (Review tab, Changes group in
Excel 2007) to remove protection from the worksheet. No password is required.
Many BMPs listed require pre-treatment for effective performance and may not be
appropriate in areas where Land Uses with Higher Potential Pollution Loads (LUHPPLs) and in
Critical Environmental Areas. Where possible, refer to the Massachusetts Stormwater Handbook
for design and operation guidance (MassDEP 2008).
BMPs are grouped according to treatment processes performed. The BMP Effectiveness
worksheet provides a listing of all BMPs considered and estimates of phosphorus removal
effectiveness based on the references listed and using best professional judgment.
The Structural Phosphorus Reductions Calculator makes an assumption that all structural
BMPs will be designed to catch and treat runoff only from impervious areas. This is done to
simplify estimates of sizing and phosphorus reductions achieved. Documenting BMP design in this
US EPA Region 1 Draft Reductions Workbooks Manual 5/26/2011
11
way will aid in the estimation of changes to Directly Connected Impervious Area required by Draft
Permit part 2.4.6.9.
Worksheet 1: Introduction
No inputs are required for this worksheet.
This worksheet gives basic directions and lists the contents of the Structural Phosphorus
Reductions Calculator.
The color code used in all workbooks of the PCP Template is provided.
Worksheet 2: Summary
Inputs required for this worksheet:
Intention to implement PCP either (a) over the entire municipality within the Charles
River watershed or (b) only in the area of the municipality tributary to the MS4
system.
Phosphorus load to Charles River for PCP implementation area
Required percent reduction for PCP implementation area
Estimated phosphorus loading percent reduction from non-structural BMPs (from
Non-structural Phosphorus Reductions Calculator)
Impervious areas present in PCP implementation area, differentiated by land use
category (from MassGIS datalayers)
This worksheet summarizes information to help the user estimate the amount of structural
BMPs required, and to estimate the utilization of potential treatment areas across various land use
categories.
The top section of the worksheet is similar to the Summary Worksheet of the Non-structural
Calculator. The scope of PCP implementation (“Total” or “MS4-Only”) for this planning exercise
should be chosen from the dropdown list in Cell D5. The 1998-2002 Phosphorus Load (in metric
units) and the Percent Reduction Required for the corresponding implementation area should then
be entered in Cell D7 and Cell D8, respectively. If the PCP will be implemented over the entire
(“Total”) municipality within the Charles River watershed, then the 1998-2002 Phosphorus Load
can be obtained from Table G-2 in the Draft Permit. If the PCP will be implemented only inside the
MS4 area (“MS4-Only”), then the municipality must estimate the MS4-Only Phosphorus Load. Refer
to Draft Permit part 2.2.1(d)(vi) for more details. The estimated percent reduction from non-
structural BMPs should be entered in Cell C8. This will cause Cell D18 to display the remaining
percent reduction of phosphorus (from the 1998-2002 Phosphorus Load) that will be needed to
comply with the WLAs of the TMDL.
Cell D10 through Cell D15 summarize structural load reductions achieved from the other
worksheets of this workbook. Structural load reductions are summed in Cell D16. Cell D19
calculates the percent reduction achieved from structural BMPs by dividing the Total Structural
Reductions by the 1998-2002 Phosphorus Load. Column C converts results to United States (US)
customary units. The number of BMPs listed, treatment areas, BMP type, and treatment depth
US EPA Region 1 Draft Reductions Workbooks Manual 5/26/2011
12
should be adjusted on Worksheet 3 through Worksheet 8 until the Structural Reduction Achieved is
sufficient to match the Structural Reduction Required.
The bottom section of the worksheet gives guidance regarding the placement of BMPs in
different land use categories. The impervious areas present in each land use category in the PCP
implementation area should be entered into Column C. Column D shows the areas that have been
entered in other worksheets. Column E calculates the amount of impervious area of each land use
type that is treated. As structural BMPs are listed, checking this Treated Area Summary will allow
the user to identify land use types that have untreated impervious area, and alert the user (with
percentages over 100%) when there is a proposal to treat more than the available impervious area.
The high percentages of impervious area treated in this example reflect one possible strategy to
minimize BMP cost. BMP performance curves indicate that the largest gains in treatment
effectiveness per depth of treatment (the steepest part of the curve) occur at smaller treatment
depths (TetraTech 2010). Therefore, designing a stormwater treatment system that captures at
least a small treatment depth from all, or nearly all, impervious areas may be the most economically
efficient.
To prevent accidental change of cells containing formulas, some cells are “locked” in the
template. To edit any locked cell, use the Unprotect Sheet command (Review tab, Changes group in
Excel 2007) to remove protection from the worksheet. No password is required.
Worksheet 3 through Worksheet 8
Information required for each BMP category:
Site name
BMP type
Land use category of site
Impervious area treated by BMP
Water Quality Depth for which BMP is sized
The format of all the structural BMP worksheets is very similar. The instructions given here
apply to all structural BMP worksheets.
For each BMP, a description of the site is entered in Column B. BMPs can be described by
individual site (e.g., “Smith driveway”), or included in a macro-level implementation area (e.g.,
“About 3,000 driveways”) that reflect an estimation of the impervious area to be treated across
many individual sites.
The type of infiltration BMP is selected in the dropdown list in Column C. Select the land
use category of the site from the dropdown list in Column D. Column E will automatically populate
the Phosphorus Load Export (PLE) rate for an impervious surface for the chosen land use category.
Enter the impervious area (in acres) treated by the BMP in Column F. Enter the Water
Quality Depth that the BMP is sized for in Column G. The Water Quality Volume is calculated in
Column H. The Water Quality Volume value may be useful to calculate the cost of BMP construction
and to calculate the recharge volume of infiltration BMPs. Column I references the BMP
effectiveness table at the top of the worksheet. The BMP effectiveness table, in turn, references the
BMP effectiveness matrix on Worksheet 9. BMP effectiveness coefficients will be discussed below

US EPA Region 1 Draft Reductions Workbooks Manual 5/26/2011
13
in the description of Worksheet 9. In Column J, the PLE rate for impervious surfaces is multiplied
by the impervious area treated and by the treatment effectiveness to calculate the phosphorus load
reduction for each BMP. Column K converts the phosphorus load reduction into metric units.
Worksheet 9: BMP Effectiveness
No inputs are required for this worksheet.
This worksheet provides a summary of structural BMP types and the references available
from which the percent effectiveness of each is estimated. Column B provides categories into which
BMPs are grouped by treatment process. These categories correspond to Worksheet 3 through
Worksheet 8. The treatment effectiveness for each BMP type is given by treatment depth in Column
D through Column F. Column G through Column AG show references for the treatment
effectiveness. Page 5 of this workbook (Column AS through Column AV) give full names and
hyperlinks to the sources used.
Not all treatment depths for all BMP types have a reference available, and not all references
are weighted equally in the best professional judgment estimation of treatment effectiveness used
in this example. The Stormwater Best Management Practices (BMP) Performance Analysis
(TetraTech 2010) is very useful because it performed continuous modeling of performance using
eleven years of precipitation data and created performance curves that show the relationship
between treatment depth and treatment effectiveness. For most BMPs, this study was most heavily
weighted, and for determination of treatment effectiveness of 0.25-inch water quality depth, this is
the only source available. The BMP Performance Evaluation Tool (PET) was used to extract
performance data from the performance curves. The BMP-PET and an instruction guide are posted
online and are free to download (EPA 2011).
Meta-analyses of BMP performance studies prepared by the Center for Watershed
Protection (CWP 2000, 2007) and the Mid-Atlantic Water Program (MAWP 2009) were also used to
inform effectiveness estimation. The phosphorus treatment estimates of the Massachusetts
Stormwater Handbook are included in this worksheet, but are not weighted very heavily because
few references are provided and the values supplied have a wide range. The Massachusetts
Handbook was useful, however, as a fairly comprehensive list of BMPs and as source of more
detailed design and operation information. Other than pre-treatment BMPs and BMP accessories,
most structural BMPs from the Massachusetts Handbook are included in this workbook.
Infiltration BMP effectiveness
The TetraTech study provides performance curves for surface infiltration basins and
subsurface infiltration trenches. Since an infiltrating water quality swale is essentially an elongated
infiltration basin, the effectiveness of the basin can be used as the effectiveness of the swale.
Similarly, porous pavement is essentially an infiltration trench that is open to the surface, so porous
pavement with no underdrain can be modeled as an infiltration trench. This is consistent with the
guidance given in the BMP-PET instructions (EPA 2011). To simplify calculations for this planning
level tool, a single land use and soil type was assumed for all infiltration BMPs.
US EPA Region 1 Draft Reductions Workbooks Manual 5/26/2011
14
Biofiltration BMP effectiveness
The TetraTech study provides performance curves for a biofiltration area with an
underdrain. Since a dry water quality swale without an underdrain is essentially an elongated
bioretention area, the effectiveness of the biofiltration area can be extended to the dry water
quality swale.
Other Filtration BMP effectiveness
The TetraTech study provides performance curves for porous pavement with an
underdrain, but reports effectiveness based on filter media depth rather than treatment volume.
For consistency and convenience in a planning level tool, the treatment volume approach is used for
filtration BMPs in this workbook. Assuming 15% void space is the pervious pavement, the smallest
available filter depth (12 inches) can store a water quality depth of 1.8 inches. For the purposes of
this example, all porous pavement installations are assumed sized sufficient to hold a water quality
depth of 1 inch and to provide treatment consistent with the performance curve at a 12-inch media
depth.
Filtering systems can vary widely depending on design, media, and installation, and so the
effectiveness coefficients reported here would need to be tailored to the individual system. The
Massachusetts Stormwater Evaluation Project (MaSTEP 2011) has compiled research for many
proprietary stormwater treatment products, and is a valuable resource for evaluating options. Just
a few relevant studies are referenced in this worksheet, and best professional judgment estimates
are given of the range of performance that can be expected from filtering BMPs.
Note that MaSTEP has also reviewed hydrodynamic separators for phosphorus removal, but
since effectiveness in this category is low (20% - 30%), they are not included in the worksheet.
Constructed Stormwater Wetlands
The TetraTech study provides performance curves for the gravel wetland type of
constructed stormwater wetland. The gravel wetland is unique among construct stormwater
wetlands because during low flow conditions, flow is passed through a filter media. This may
improve treatment over other constructed stormwater wetland designs that more resemble wet
detention basins. The median effectiveness of constructed stormwater wetlands in the CWP
Database and the Mid-Atlantic Water program did not include treatment depth, but the results were
generalized as a little less effective than the gravel wetland.
Although a wet water quality swale is essentially an elongated constructed stormwater
wetland, the available evidence indicated lower performance than other types of constructed
stormwater wetlands. The TetraTech study yielded very low effectiveness for this BMP that does
not agree with other published effectiveness studies. For this BMP, the TetraTech study was
weighted less heavily.
Detention BMPs
Dry detention basins have very little capacity for treatment, especially for a pollutant like
phosphorus that is associated with a very fine particle size. This was confirmed in the TetraTech
study.

US EPA Region 1 Draft Reductions Workbooks Manual 5/26/2011
15
Wet detention basins may function in a very similar fashion to constructed stormwater
wetlands. The CWP Database reports that some wet ponds are quite effective at removing
phosphorus, especially those treating smaller catchment areas. However, re-suspension of
phosphorus is typically high in wet detention basins and so an effectiveness coefficient equal to
constructed stormwater wetlands is assumed here.
Rainwater Harvesting Systems
Very little research is available documenting the effectiveness of rainwater harvesting
systems at reducing phosphorus loads. Often, roof runoff is considered relatively clean so no credit
is given for reducing or eliminating this flow. An argument could be made, however, that any
impervious surface contributes to increased flows that cause erosion following storms. In addition,
the presence of both dry and wet deposition of phosphorus means that even roof runoff is a source
of phosphorus loads.
In order to be effective, rainwater harvesting systems must remove roof runoff from
stormwater flows. If this can be done, as a simplifying assumption, the percentage of phosphorus
removed may be assumed to be equal to the percentage of flow that is removed by a given design
volume. The cumulative distribution curve of precipitation volume by rainfall depth for Boston,
Massachusetts is included as Figure 3-2. From this figure we can read that from 1948 to 2004, 45%
of storms are 0.25 inches or less, 65% of storms are of 0.5 inches or less, and 85% of storms are of
1.0 inch or less. If we make the simplifying assumption that phosphorus concentration is constant,
these removal volumes can be used as treatment effectiveness coefficients.
Worksheet 10: Conversions and Coefficients
No inputs are required for this worksheet.
Unit conversion factors used in this workbook are included on the left side of this
worksheet.
Phosphorus Load Export (PLE) rates used in this worksheet are included on the right side of
this worksheet. In addition to the composite PLE rates used in the Non-structural Reductions
Calculator, the Structural Reductions Calculator uses an approach first taken by the Upper/Middle
Charles TMDL (Mass DEP 2009) to disaggregate loading rates for areas with pervious and
impervious cover. In the Upper/Middle Charles, and then again in the Demonstration Project in
Three Upper Charles River Communities (TetraTech 2009), pervious and impervious PLE rates were
set so that, given average rates of imperviousness across different land uses, the overall
phosphorus load would still match the monitoring data of the Lower Charles TMDL, but on a
subwatershed scale provide a more accurate representation of phosphorus loads. For example,
using the pervious and impervious PLEs would show that a parcel in a more highly urbanized area
(and thus having a higher percentage of impervious cover) would have a greater phosphorus load
per unit area than a parcel with the same land use in a rural area (and thus having a lower
percentage of impervious area). Also, more refined estimates of influent phosphorus load will give
a more accurate estimate of phosphorus loads reduced.
Like the rest of this template, of course, the PLE rates used here are subject to revision as
knowledge of pollution dynamics across the watershed improves. Given the uncertainties inherent

US EPA Region 1 Draft Reductions Workbooks Manual 5/26/2011
16
in stormwater management, this PCP Template cannot give definite answers about the exact
number and type of non-structural and structural BMPs that are needed to comply with the WLAs
of the TMDL, but this template can give a general estimate of the amount of BMPs that are
necessary and provide a means of evaluating plan scenarios.
References
Center for Watershed Protection. 2000. National Pollutant Removal Performance Database for
Stormwater Treatment Practices. 2nd ed. http://www.stormwatercenter.net/Library/STP-
Pollutant-Removal-Database.pdf
Center for Watershed Protection. 2007. National Pollutant Removal Performance Database for
Stormwater Treatment Practices. 3rd ed.
http://www.stormwaterok.net/CWP%20Documents/CWP-
07%20Natl%20Pollutant%20Removal%20Perform%20Database.pdf
Center for Watershed Protection. 2008. Deriving Reliable Pollutant Removal Rates for Municipal
Street Sweeping and Storm Drain Cleanout Programs in the Chesapeake Bay Basin. N. L. Law,
et al. http://www.worldsweeper.com/Street/Studies/CWPStudy/CBStreetSweeping.pdf
EPA. 2010. “Draft General Permit for Residually Designated Discharges in Milford, Bellingham, and
Franklin, Massachusetts.” Accessed April 28, 2011.
http://www.epa.gov/ne/npdes/charlesriver/index.html
EPA. 2011. “Stormwater BMP Tools and External Resources.” Accessed May 5, 2011.
http://www.epa.gov/region1/npdes/stormwater/index.html#swbmptools
Lehman, J. T., D. W. Bell and K. E. McDonald. 2009. Evidence for Reduced River Phosphorus
Following Implementation of a Lawn Fertilizer Ordinance. Lake and Reservoir Management.
25(3).
http://www.a2gov.org/government/publicservices/systems_planning/Environment/Docu
ments/FertilizerStudyYear1.pdf
Lenth, J. et al. 2010. White Paper. Filterra® Bioretention Systems: Technical Basis for High Flow
Rate Treatment and Evaluation of Stormwater Quality Performance.
http://www.filterra.com/images/uploads/2010-09-
20_Filterra_High_Flow_Rate_Treatment_Whitepaper.pdf
MassDEP. 2007. Final Total Maximum Daily Load for Nutrients in the Lower Charles River Basin,
Massachusetts. http://www.mass.gov/dep/water/resources/charlesp.pdf
MassDEP. 2008. Massachusetts Stormwater Handbook.
http://www.mass.gov/dep/water/laws/policies.htm
MassDEP. 2009. Draft Total Maximum Daily Load for Nutrients in the Upper/Middle Charles River,
Massachusetts http://www.mass.gov/dep/water/resources/ucharles.pdf
MassGIS. 2007. “Impervious Surface Datalayers.”
http://www.mass.gov/mgis/impervious_surface.htm

US EPA Region 1 Draft Reductions Workbooks Manual 5/26/2011
17
MassGIS. 2009. “Land Use (2005) Datalayers.” http://www.mass.gov/mgis/lus2005.htm
MaSTEP. 2011. “Stormwater Technologies Clearinghouse.” Accessed May 5, 2011.
http://mastep.net/index.cfm
Mid-Atlantic Water Program. 2009. Developing Best Management Practice Definitions and
Effectiveness Estimates for Nitrogen, Phosphorus and Sediment in the Chesapeake Bay
Watershed. http://archive.chesapeakebay.net/pubs/BMP_ASSESSMENT_REPORT.pdf
TetraTech, Inc. 2009. Optimal Stormwater Management Plan Alternatives: A Demonstration Project
in Three Upper Charles River Communities.
http://www.epa.gov/region1/topics/water/pdfs/OptimalSWMngtPlanAlternativesUpperC
harlesPilotStudy.pdf
TetraTech, Inc. 2010. Stormwater Best Management Practices (BMP) Performance Analysis.
http://www.epa.gov/ne/npdes/stormwater/assets/pdfs/BMP-Performance-Analysis-
Report.pdf
Vlach, B.J., J. Barten, J. Johnson, and M. Zachay. 2008. “Case Study #9: Assessment of Source
Reduction due to Phosphorus-free Fertilizers”. In Assessment of Stormwater Best
Management Practices, ed. J. S. Gulliver and J.L. Anderson. St Paul, MN: University of
Minnesota.
http://wrc.umn.edu/prod/groups/cfans/@pub/@cfans/@wrc/documents/asset/cfans_ass
et_115795.pdf