draft overview report - murray-darling basin authority€¦ · web viewnorthern basin review -...
TRANSCRIPT

Northern Basin ReviewTechnical overview of the socioeconomic analysis – interim report
October 2016

Northern Basin Review - Technical overview of the socioeconomic analysis – interim report
Summary
The Northern Basin Review investigates the sustainable diversion limits in the northern basin. The review is informed by a socioeconomic analysis of how different levels of water recovery are likely to affect northern basin communities and industries, other social research (reported separately), analysis of new scientific information and new hydrological modelling.
The socioeconomic analysis for the Northern Basin Review uses three inputs: community-level modelling, floodplain grazing modelling and results from a survey of Aboriginal sociocultural capitals. Changes in irrigated production and employment are the key indicators for the community-level modelling.
This report focuses on 21 communities in the northern basin, recognising water recovery affects individual communities in different ways. These impacts are influenced by the social characteristics and structure of each community as well as the make-up of its local economy. This analysis expands on the socioeconomic analysis undertaken at the regional level for the development of the Basin Plan in 2012, and is the first time such information has been available for individual communities.
Developing the community-level modelling capability underpinning this analysis relied on extensive consultation with the communities and expert input from KPMG and the University of Canberra. Through this approach, it was possible to examine the effect reduced water availability has on the area of irrigation and, consequently, employment at the community level.
The MDBA collected information from town and farm businesses, individuals, community groups, industry organisations, and governments, and learnt how communities have been changing. These changes have been driven by numerous factors, such as advances in technology, the mining boom, commodity prices, droughts and floods, increasing employment in government services, and demographic changes. This information has enabled the MDBA to place the expected effects of water recovery within the context of all the other changes affecting the communities.
The social and economic analysis has highlighted how the effects of recovering water for the environment can be influenced by changes in the volume, location or type of entitlements recovered, and whether the recovery is through infrastructure investment or purchase. Outputs from the modelling, interpreted with the use of all the other social and economic information collated, clearly articulates the expected effects of water recovery in different communities. The timing and the pace of water recovery are two other factors influencing the effects on communities. For example, the purchase of large parcels of water over very short periods of time was found to have significant long-term effects as businesses take time (2-5 years) to adjust to the changes.
Of the 21 communities studied, five communities had little irrigation and no expected water recovery. However, understanding the economic structure and drivers of change in these communities was fundamental to developing the modelling capability for estimating the effects of water recovery in communities where irrigation is more important.
Seven of the communities studied are likely to experience quite small effects under the water recovery scenarios considered in the review. For Boggabri, Gunnedah, Goondiwindi, Mungindi, Narrabri and Walgett, water recovery was estimated to have an impact of less than 2% on total employment. This level of change would be difficult to distinguish from the other processes of change affecting those communities. In Brewarrina, it is expected some benefits would accrue to
Page 2

Northern Basin Review - Technical overview of the socioeconomic analysis – interim report
the community through the expected gains to floodplain graziers on the Lower Balonne floodplain.
Across the remaining nine communities, the expected effects of water recovery range from being modest to quite large changes. In five of these communities, Bourke, Moree, Narromine, Trangie and Wee Waa, the effects of water recovery across the scenarios considered are estimated to reduce total employment by less than 4.2%. These changes are likely to be noticeable, even against the backdrop of the other changes affecting those communities.
For Warren and Collarenebri, the recovery of water occurred some time ago. The effects are large and are continuing to work their way through those communities. The reduction in total employment from the recovery of water is estimated to be around 11% in Warren and 21% in Collarenebri. These effects on employment add to the substantial, yet similar, changes already occurring in those communities for other reasons.
In St George and Dirranbandi, it was possible to describe the effects from the water recovery to date and for the scenarios requiring additional water recovery. The effects on St George from the 390 GL water recovery scenario are quite large (9% reduction in total employment) and are expected to be even greater for Dirranbandi (18% reduction in total employment).
Job estimates alone can understate the pressures these communities face in adapting to multiple drivers of change, including the Basin Plan. Other qualitative data describing the trends of change in social and economic conditions in each community when combined with the modelling results help the MDBA to understand the extent of these pressures.
For the communities most adversely affected by the proposed recovery of water targeted structural adjustment assistance may be needed to help those communities adapt to the changes.
Aside from the environmental improvements associated with water recovery, other types of benefits are important to recognise. Some communities have benefited from the short-term stimulus provided when water is recovered in exchange for investing in new on-farm and off-farm irrigation infrastructure.
For floodplain graziers there is the potential for increased environmental flows generated by the water recovery to return around one-third of the production and profits lost as a consequence of up-stream irrigation development. However, it is noted that while these benefits may be significant to the floodplain graziers, they are relatively small compared to the production value of cotton from a similar volume of water.
From the broader social and cultural perspective, Aboriginal people confirmed the value they placed on additional environmental flows. In particular, the increasing volume of water recovery should lead to social and cultural improvements which will be reflected in community wellbeing.
The analysis highlights how the social and economic benefits for floodplain grazing communities around the Lower Balonne floodplain can be influenced by the volume of upstream water recovery and the types of entitlements recovered. Acquiring overland flow entitlements may provide the greatest benefits to floodplain production. More broadly, enhanced low flows would also be expected to contribute to improved wellbeing for northern aboriginal communities and farmers depending on the reliability of those flows to provide stock and domestic water.
The combined results from the community-level modelling, floodplain grazing modelling and the Aboriginal social and cultural survey will inform the Authority’s triple bottom line consideration of the sustainable diversion limits for the northern basin catchments.
Page 3

Northern Basin Review - Technical overview of the socioeconomic analysis – interim report
ContentsSummary.........................................................................................................................................2Contents..........................................................................................................................................4
Introduction......................................................................................................................................6The scale for examining social and economic change................................................................6
Indicators and approach to measuring change............................................................................8Approach to social and economic modelling.................................................................................11
The intent of the approach.........................................................................................................11Overview of models and data....................................................................................................12
Communities, industries and water availability in the northern basin............................................22Understanding northern basin communities..............................................................................22
Identifying the drivers of change in communities.......................................................................23Scenario descriptions....................................................................................................................26
Water in the northern basin...........................................................................................................28Findings from the analysis.............................................................................................................34
Communities unaffected by Basin Plan water recovery............................................................35Communities affected by water recovery...................................................................................36
Communities most affected by water recovery..........................................................................38Community-specific results........................................................................................................39
Sensitivity analysis.....................................................................................................................44Interpreting the modelling results...............................................................................................48
Potential indirect benefits of water recovery for floodplain grazing...............................................51Approach to modelling potential outcomes for floodplain graziers............................................51
Results.......................................................................................................................................52Water recovery and floodplain grazing......................................................................................56
The importance of environmental water to Aboriginal people.......................................................57Summary of results....................................................................................................................58
NBAN’s interpretation of results.................................................................................................60Implications................................................................................................................................60
Incorporating the social and economic analysis in decision-making.............................................62Conclusion.....................................................................................................................................63
References....................................................................................................................................65Appendix A: Social and economic conditions and results by community......................................66
Appendix B1: Bingara....................................................................................................................67Appendix B2: Boggabri..................................................................................................................69
Appendix B3: Bourke.....................................................................................................................73Appendix B5: Chinchilla.................................................................................................................77
Page 4

Northern Basin Review - Technical overview of the socioeconomic analysis – interim report
Appendix B6: Collarenebri.............................................................................................................79
Appendix B7: Coonabarabran.......................................................................................................83Appendix B8: Dirranbandi – Hebel................................................................................................85
Appendix B9: Gilgandra.................................................................................................................90Appendix B4: Brewarrina...............................................................................................................92
Appendix B10: Goondiwindi..........................................................................................................95Appendix B11: Gunnedah...........................................................................................................100
Appendix B12: Moree..................................................................................................................104Appendix B13: Mungindi..............................................................................................................110
Appendix B14: Narrabri...............................................................................................................115Appendix B15: Narromine...........................................................................................................119
Appendix B16: Nyngan................................................................................................................123Appendix B17: St George............................................................................................................125
Appendix B18: Trangie................................................................................................................131Appendix B19: Walgett................................................................................................................136
Appendix B20: Warren................................................................................................................140Appendix B21: Wee Waa............................................................................................................145
Appendix C: Commonwealth infrastructure investment in northern basin catchments...............151
Page 5

Northern Basin Review - Technical overview of the socioeconomic analysis – interim report
IntroductionThe Murray–Darling Basin Authority (MDBA) is undertaking a review of the sustainable diversion limits in the northern basin. At the time the Basin Plan was set, the Authority recognised the information which informed the decisions regarding the sustainable diversion limits in the northern basin was not as extensive as in the southern basin.
The investigative phase of the Northern Basin Review comprises three elements designed to improve the Authority's knowledge of the effects of water recovery on the environment and local communities and industries. These elements are:
- an environmental science program to better understand the needs of birds, fish and plants in the Barwon–Darling and Condamine–Balonne river systems
- water recovery modelling to better understand how often environmental water needs might be met under different Basin Plan settings
- a more detailed social and economic assessment to improve the MDBA understanding of how water recovery decisions have and may further affect northern basin communities and industries.
The analysis focuses on the impacts of recovering water for the environment as the change in water availability works its way through the individual communities. It also considers some of the benefits likely to be derived from the recovered water. New information on the potential environmental benefits from the recovered water will be presented alongside the findings from the social and economic analysis. All this information will be used by the Authority to make a judgement-based recommendation on the most appropriate level of water recovery.
A benefit-cost analysis might be considered the most effect way of supporting such a decision-making process. However, as observed when preparing the Basin Plan, there is very limited information available to transform the complex array of material into monetary terms. Beyond that limitation, attempting to monetize all of the outcomes is likely to obscure the relationships between the economic and social conditions and outcomes which are pivotal to understanding how the changes in water availability might work their way through the individual communities.
The scale for examining social and economic changeWater recovery scenarios examined during the preparation of the Basin Plan estimated the social and economic effects at a regional level and for three local government areas in the northern basin. The scale of that analysis did not reflect the potential for considerable variability in impacts across communities. In particular, how the effects are likely to be influenced by the:
volume, timing and method of water recovery underlying social and economic conditions and trends in each community at the time of
water recovery relative importance of irrigated agriculture and mix of non-irrigation agricultural
enterprises associated with each community, or other factors such as growth in some sectors (for example, mining or government
services) of the local economies.
To account for this variability, this social and economic assessment considers the impacts of water recovery in the context of the prevailing social and economic conditions in 21 communities (Figure 1). These communities provide a range of sizes, dependency on irrigated agriculture, differing social and economic complexity and potentially different levels of water recovery.
Page 6

Northern Basin Review - Technical overview of the socioeconomic analysis – interim report
Figure 1: Catchments and towns in the northern basin
While it is possible to differentiate these communities in many different ways, one approach is to distinguish these communities on the basis of their population and area of irrigation (Table 1). Six of the communities have very limited irrigated agricultural production, but provide important information on the influence of other drivers of change in rural communities. The selection of the 21 communities for this study was not meant to exclude other places, but is regarded as being representative of the different rural communities in the northern basin.
Page 7

Northern Basin Review - Technical overview of the socioeconomic analysis – interim report
Table 1: Summary of community populations and sizes of irrigated area
Area Irrigated Population (2011)<1,250
Population (2011)1,251-3,500
Population (2011)>3,500
< 1,000 ha average Brewarrina Bingara,Nyngan
Chinchilla, Coonabarabran, Gilgandra
Up to 20,000 max Collarenebri, Trangie
Boggabri, Bourke, Walgett
Gunnedah,Narrabri, Narromine
>20,000 ha max Dirranbandi-Hebel, Mungindi
St George, Warren, Wee Waa
Goondiwindi, Moree
Indicators and approach to measuring change
The community-level modelling links annual estimates of regulated and unregulated water diversions with the area of irrigated agriculture production. In each water recovery scenario examined, the modelling estimates the change in irrigated area across the period 1999-2000 to 2013-14. The changes in irrigated area are then followed separately through each community to indicate potential changes to employment for the agriculture sector and other sectors of the local economies. The modelled results for changes in irrigated area and employment provide one input to the assessment of social and economic effects from the recovery of water.
A more common approach to the analysis of economic outcomes might rely on changes in the volume and value of production, profits, and the wages paid to workers across the sectors in each community where water is recovered for the environment. Underpinning the agricultural production is the mix of factor inputs – land, capital, labour, materials and services, and water. At the community level information is readily available on the land area developed for irrigation, water diverted for irrigation purposes, and some of the irrigation crop yields. However, insufficient data is available for estimating the other parameters. Continuing to pursue this more detailed approach would have required making many contestable assumptions with the limited data that is available. In particular, how the mix of factor inputs as well as wages and profits are changing year on year.
As an alternative, this study seeks to make maximum use of the information that can be accessed to examine the effects of water recovery. Total employment and changes to employment across the sectors of the local economies describes the economic structure of each community and how they are changing across time. The number of jobs in each sector is a function of the scope of business enterprises (economic diversity), their profits, changes they need to make to remain viable, and the influence of external drivers such as mechanisation and the climate. Employment structure has links to, and is influenced by, the social structure and condition within each community. Using this approach extends the findings of other studies which describe employment as a contributing factor for rural social well-being (Wilkinson, 1991) and a means for examining the economic resilience of communities responding to major shocks (Han and Goetz, 2015).
Page 8

Northern Basin Review - Technical overview of the socioeconomic analysis – interim report
Using employment as a key indicator of the effects of recovering water for the environment is consistent with the feedback received at the community consultations. The MDBA was clearly told jobs and the employment outlook were vital measures of how well the communities were faring. Residents had generally identified a close relationship between employment and the social conditions within their respective communities. These views extended beyond just the number of jobs to include a reflection upon the changing types of jobs. The local information is a mix of peoples view, perceptions and knowledge. In many cases, people were willing to share information about their operations in order to help the MDBA understand the pressures they face.
The broader link between employment and social condition has many elements. A change to one or more drivers of irrigated production (such as drought, commodity prices, mechanisation, technological innovations or water reforms) can influence the demands for inputs such as labour. Conversely, changes to the social structure within many rural communities over the last 15 years appears to have influenced the local supply of labour.
As a consequence, there has been a significant transformation in the size and configuration of local labour markets. Farm and town businesses explained to the MDBA that up to 2001 there was a sizeable pool of local labour they could utilise as the demands for workers rose and fell. Since that time, the supply of local labour has diminished. These businesses now place a much greater emphasis on retaining their employees in dry periods in order to support increased business activity during wetter periods. This has led to an increasing dependence on seasonal workers, with temporary workers having very different requirements in terms of the mix of goods and services obtained from the local economies.
This analysis takes into account the community-specific differences in labour supply and demands. To fully understand the changes in local labour markets, it was necessary to model the demands for seasonal workers. Outputs of the modelling provide an estimate of local effects on employment. In communities where there are potentially large volumes of water recovery, the flow-on effects from a change in employment to a change in the local population would provide an indication of the long-term effects of recovering water. However, it was not possible to model these relationships at this time. Those possible changes are described in qualitative terms, taking into account the social and economic conditions and the timing and method of water recovery.
Developing the modelling capability required to assess the social and economic effects of water recovery required several discrete pieces of work. Some of that work focussed on the costs or impacts of water recovery. Other parts concentrated on the social and economic benefits of water recovery. A separate set of work estimated the environmental benefits of water recovery. Benefits of the water recovery include the indirect outcomes for potential increases in floodplain production, social and cultural benefits to Aboriginal people, and the short-term stimulus provided the Commonwealth investment to install new irrigation infrastructure.
All the outputs from the social and economic work program designed to inform the Northern Basin Review are drawn together in this technical report. Inputs for estimating the impacts of water recovery included:
Landuse-hydrology models for each community relating water diversions to the area of irrigated agriculture;
The MDBA and the University of Canberra compiling social and economic condition profiles for the 21 communities examined, comprising demographic, employment, area of agricultural production, water entitlements owned and water recovery to date;
Narrative reports describing people’s views about the changes in their respective communities, based on material collected during consultations across the period 2014-16;
The MDBA, University of Canberra and KPMG profiling of industry employment across time for the communities; and
Page 9

Northern Basin Review - Technical overview of the socioeconomic analysis – interim report
KPMG modelling of community and sector-level changes in employment (KPMG, 2016) with all of the other information collected used to help interpret the modelling results.
On the benefits side, further work was undertaken to examine the potential production outcomes for floodplain graziers from the recovery of water for the environment. A study on floodplain production in the Lower Balonne catchment between Dirranbandi and Brewarrina considered the potential for regaining some of the production foregone as a consequence of upstream development of the water resource. The effects of water recovery were modelled changes to carrying capacity and earnings for the graziers in that area. Further consideration is given to the potential flow-on effects for Brewarrina. While that analysis concentrated on the Lower Balonne floodplain, the MDBA recognises similar benefits might arise for floodplain graziers in other parts of the northern basin.
Previous submissions to the MDBA from Aboriginal people and groups, such as NBAN and MLDRIN, described the importance of water for the environment in terms of its social, cultural and spiritual significance. A survey was undertaken through the MDBA to quantify the importance of improved environmental outcomes to Aboriginal people. The results from that survey contribute to the social and economic analysis of the proposed water recovery scenarios.
The local economic stimulus from infrastructure investment may lead to immediate employment benefits and the potential for longer-term gains to farmers. In the short term, the employment of contractors in the region to undertake the infrastructure upgrade works and local businesses supplying some of the equipment and materials necessary for the upgrades. This improvement in irrigation infrastructure has provided a short-term flow-on effect in the respective communities.
Infrastructure upgrades have provided irrigators with more efficient irrigation systems that will enable them to maximise crop production and minimise water losses now and into the future. In some cases, the irrigators have retained a share of the water savings. This may help to sustain local irrigation businesses. In the longer term, the infrastructure upgrades enable irrigators to crop in low allocation years, produce more crops through greater reliability of access to irrigation water than was possible before the infrastructure upgrades, reduce maintenance requirements, produce labour savings and enable greater flexibility when it comes to crop management. Each of these benefits are considered in terms of the ways in which they influence employment in local economies. A number of communities have benefitted from Commonwealth investment in off and on-farm water delivery infrastructure under the Basin Plan. Each community which has accessed the infrastructure funding has utilised a different mix of the programs available (described at catchment level in Appendix C).
These multiple lines of evidence are drawn together in this report to describe social and economic costs and benefits for different scenarios of water recovery. New datasets and models were required to support this overall approach. An independent reviewer was commissioned by the MDBA to examine the overall modelling approach, the suitability of the economic and social datasets, and the relevance, suitability and limitations of the modelling approach. The findings and recommendations of the independent reviewer (Blackwell et al, 2016) are addressed in this report.
This report provides an outline of the modelling approach and the steps taken to demonstrate the validity, reliability and limitations of the approach. It then presents the results of water recovery in different communities and potential benefits of water recovery to floodplain graziers in the Lower Balonne and the social and cultural benefits to Aboriginal people. A concluding section draws together the results of the studies undertaken to inform the social and economic analysis. Readers seeking more detail on the models developed, the underlying datasets, technical reports and the community-specific profiles and narratives are directed to www.mdba.gov.au/xx.
Page 10

Northern Basin Review - Technical overview of the socioeconomic analysis – interim report
Approach to social and economic modelling
The intent of the approach
The approach taken to the social and economic analysis for the Northern Basin Review represents a significant advance which builds upon the analyses undertaken for the Basin Plan. The intent of this approach is to capture the diversity of impacts from recovering water for the environment, including the influence of water recovery interacting with other drivers of change at the community-level.
Each community in the northern basin has unique characteristics, defined by its natural assets, development history, and social and economic conditions. The MDBA has analysed the role of water and water recovery in 21 communities of the northern basin (Figure 1). The area modelled for each community includes the town as well as the farming area serviced by the town. To maintain analytical consistency across these communities, the approach had to be flexible enough to capture differences between communities arising from variations in the water available for irrigation, their social and economic structures, and the particular drivers of long-term change.
In selecting the 21 communities, we considered a mix of sizes and towns with differing reliance on irrigated agriculture and agriculture more broadly. These communities also differ in terms of the share and type of non-agricultural economic activities including mining and government services, the drivers and timing of multiple changes affecting them, and potential water recovery. For example, Gunnedah, one of the more populous of the communities, has a diverse economy with people employed across retail trade, healthcare, social assistance, mining and agriculture. In contrast, Collarenebri, the community with the smallest population, has 55% of its workforce employed in the agriculture sector.
The 21 communities, while being representative of different towns, were not selected to exclude other communities but provide a platform to understand the range of likely impacts of water recovery. All the communities most likely to be affected by water recovery are included in the analysis. Six of these communities, Bingara, Brewarrina, Coonabarabran, Chinchilla, Gilgandra and Nyngan, have low reliance on irrigated-agriculture and as such the effect of water recovery on these communities has not been modelled. However, they have been included to help us understand other drivers, apart from water availability, affecting northern basin communities and provide a point of comparison to communities with a greater reliance on irrigated production.
The general approach used by the MDBA has been to construct a baseline of irrigated production and employment in each of the 21 communities for the period 1999-2000 to 2013-14. Developing the social and economic baseline requires an understanding of the role of irrigation water in each community and how the use of that water works its way through the respective communities. Critical pieces of information required to construct the baseline data set include:
- the irrigation water entitlements held in the community
- water diversions against those entitlements
- timing and volume of water recovery to date to allow its exclusion from the baseline
- the area irrigated
- the scale of the irrigation activities relative to the other types of community-specific agricultural production
- the size and structure of the non-agricultural sectors (e.g. manufacturing, mining, government services, retail, accommodation, construction)
Page 11
Northern Basin Review - Technical overview of the socioeconomic analysis – interim report
- how changes in water availability work their way through this economic and social structure.
- how other drivers of change are influencing these communities, including water and non-water policy settings.
Key indicators of change to be considered as outputs of the analysis include:
o Employment by sector;
o Maximum hectares irrigated; and
o In areas of large changes in irrigated agriculture arising from the recovery of water, a qualitative discussion of the potential effects on the population.
By establishing the baseline, it will then be possible to examine the effects of water recovery in each community. The water recovery scenarios are modelled as if it had occurred prior to the modelling period. Information describing the economic and social conditions in each community is used to interpret the outputs of the landuse and community modelling.
Overview of models and data
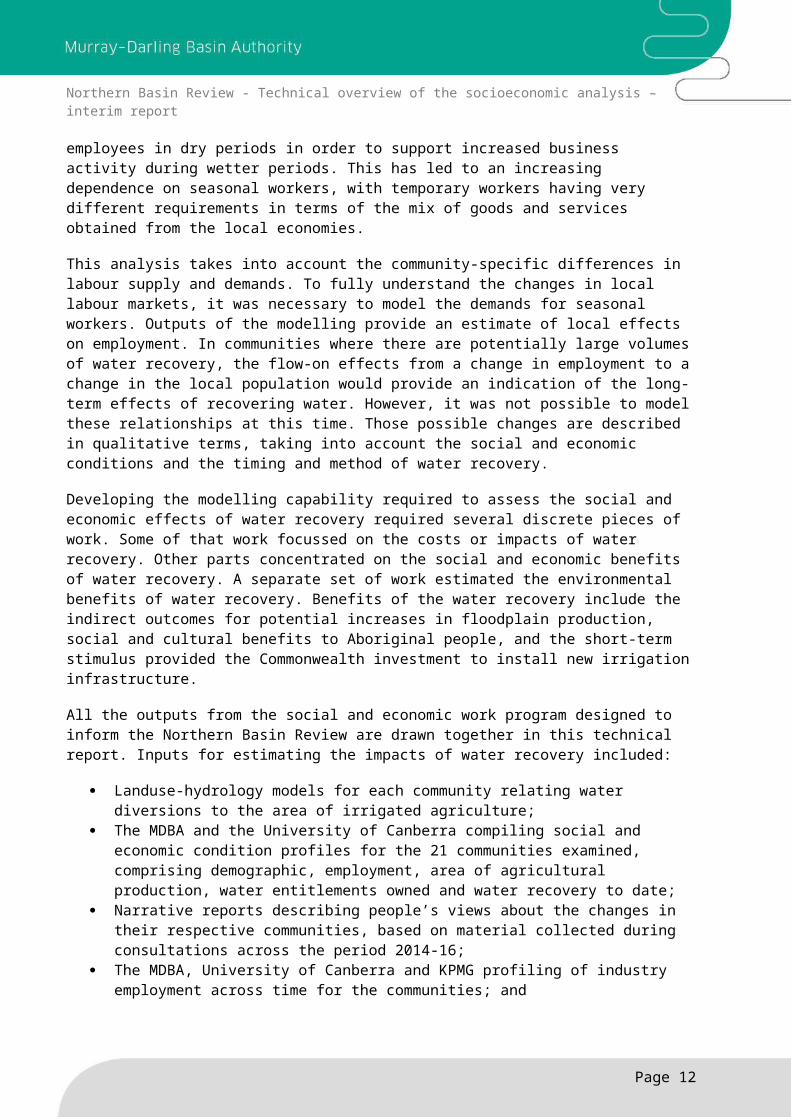
The approach draws together quantitative modelling techniques together with extensive data collection at the local community level, and statistics describing the economic and social conditions in each community.
Figure 2 is a high level schematic of the modelling approach and associated data. It shows the relationships between the hydrological, land use and community-level modelling. The community model represents the changes in employment across time for each local economy.
Figure 2: Overview of analytical approach
Page 12

Northern Basin Review - Technical overview of the socioeconomic analysis – interim report
The findings from the community modelling will be combined with other information to describe the expected social and economic changes across the northern basin:
- Aboriginal sociocultural survey findings
- Results from the floodplain grazing study
- Social and economic conditions across time (link to and economic condition reports)
- Narratives presenting a summary of the qualitative information collected during the community consultations.
Landuse modellingThe hydrological modelling is the foundation stone for understanding how the recovery of water would influence environmental, social and economic outcomes across the northern basin. The landuse model is the first component of the socioeconomic analysis. It uses linear regression modelling to relate water availability and diversions to historical planting rates, and is referred to as the landuse-hydrology model.
Each community is modelled independently, based on the types of water available and the scale of irrigation activity. Through this approach, it is possible to examine the effects of recovering particular types of water entitlements. In developing the landuse-hydrology models for each community, local irrigators helped to address some of the anomalies between the modelled and real world outcomes. For example, our initial model of Dirranbandi-Hebel landuse showed considerably lower planting than actually occurred in 2000-01. Local irrigators explained that early season rain lead to overly optimistic planting decisions. This and similar anomalies have now been addressed in the models.
Page 13

Northern Basin Review - Technical overview of the socioeconomic analysis – interim report
Inputs to the landuse-hydrology modellingIn developing the landuse-hydrology models, it was necessary to define those river reaches providing water for irrigation in each community. For some places, the differentiation of entitlements was straight forward. In Dirranbandi, irrigated production relied on water entitlements in the Lower Balonne between bifurcation B1 and the New South Wales- Queensland border. For other places, the identification of water entitlements was more complex. Mungindi irrigators, for example, depend on water entitlements along the Queensland and New South Wales Border Rivers, some Gwydir water, and Barwon-Darling water from below Mungindi weir. In some communities, there was a requirement to include groundwater use in relation to the irrigated production. For communities such as Wee Waa, Gunnedah, Moree and Narromine, groundwater is an important part of their total water source.
Where possible, the landuse-hydrology modelling seeks to have the different types of water entitlements represented as individual, independent variables. The main reason for this approach is the relatively small volume of regulated water entitlements held in most Northern Basin catchments and the high degree of variability in diversion against the unregulated entitlements.
Having identified the mix of entitlements associated with each community, it was then necessary to extract estimates of the monthly water diversions from the hydrology models available to the MDBA. Diversion estimates were represented by entitlement type for the period between January 1998 and June 2014 in all catchments except the Macquarie, where the current condition model continues until June 2013.
Monthly rainfall data for each of the communities for this same period was derived from the Bureau of Meteorology ‘Monthly Rainfall Maps’ for Australia. This local rainfall data had an explicit role in modelling irrigation production in some communities. For other locations, this information helped to explain why particular production decisions were taken in certain years.
Landuse and production data for the 21 communities examined was critical to the modelling. Australian Bureau of Statistics data from the 2001, 2006 and 2011 censuses provided the area irrigated by crop type and for 2006 and 2011, the irrigation water applied to these crops. Although the ABS data is provided at a different geographical scale to the community boundaries used by the MDBA, it clearly indicated that most irrigation water use in the Northern Basin was applied to cotton (Table 2). Accessing good information on annual irrigated cotton production was therefore essential. Industry data provided to the MDBA made it possible to collate the annual area of irrigated production for each community.
Table 2: Percentage of irrigated water applied to cotton per catchment
Catchment % Irrigated water applied to cotton
Lower Balonne 97
Queensland Border Rivers 90
New South Wales Border Rivers 96
Gwydir 97
Lower Namoi 95
Lower Macquarie-Castlereagh 81
Barwon-Darling 92Source: ABS census 2006, 2011
Page 14

Northern Basin Review - Technical overview of the socioeconomic analysis – interim report
Prior to modelling the land use-hydrology relationships for each community, it was necessary to identify the timing of water recovery, the volume recovered, the types of entitlements recovered, and whether the recovery was through buyback or savings from infrastructure investment. The timing, volume and approach to water recovery all affect the area irrigated. In some cases, the purchase of water from large farms at a point in time has a flow-on effect to the local community which is greater than the effect of a reduction in irrigated hectares. The Department of Agriculture and Water Resources assisted the MDBA to collate this data at the community level.
The timeframe of the landuse-hydrology modellingIn general, modelling of the landuse-hydrology relationships for each community covered the period 1999-2000 to 2013-14. However, in those areas where there had been significant water recovery before the end of the modelling period, the model development was restricted to the period prior to that recovery. For example, the Moree model applies to the period 1999-2000 to 2010-11.
Even though the landuse-hydrology modelling period is relatively short, it does contain a mix of very wet, very dry and some moderate climate years. A key assumption for this period is that the land was developed to support a maximum level of irrigated cotton production in 1999-2000. Similarly, the irrigation infrastructure to deliver and extract water was largely fixed by 1999-2000. Therefore, changes in irrigated cotton production across this period are primarily a function of water availability to utilize the installed capital and then other economic parameters. This assumption was informed and confirmed through the community consultation. One of the reasons for the limit on the area of irrigation is the cost of further development relative to the risks of irrigation water being available to fully utilise that investment.
One of the questions raised by the independent reviewer was whether the annual area irrigated represented a time series, where the area planted in one year is serially correlated to the area irrigated in previous years. That is, the data is auto correlated. Diagnostic testing on the landuse-hydrology modelling data indicated no autocorrelation within the data. The data used to model the landuse-hydrology relationships is a set of discrete production outcomes rather than a time series with an underlying rising or falling trend in each community for the irrigated area (Figure 3). If the MDBA were to undertake this analysis over a longer period of time, it would be necessary to treat the production data as a time series which takes into account the changes to the maximum area developed. Such analysis would have a quite different focus, particularly in relation to changes in the maximum potential area.
Page 15

Northern Basin Review - Technical overview of the socioeconomic analysis – interim report
Figure 3: Relationship between water availability and hectares irrigated in Moree
Statistical validity of the landuse-hydrology modelsSeparate documentation is available to describe the landuse-hydrology models developed for each community. In most cases, the relationship between water availability (diversions) and irrigated cotton production is quite strong. While this might indicate some problems to consider in the modelling approach, it should be noted that with a fixed area of development, the production decision-making of farmers is expected to be closely related to irrigation water availability. In considering the landuse-hydrology models developed by the MDBA, the independent reviewer suggested a number of tests which should be undertaken to demonstrate the statistical validity of the modelled relationships.
With the landuse-hydrology modelling, three diagnostic tests were applied to each landuse-hydrology model. An adjusted R2 took into account the number of variables used to model the community-level relationship. The T-test was applied to determine the significance of each coefficient on the explanatory variables. An F-test was used to determine whether the relationship between landuse and hydrology might have occurred by chance.
The results of the adjusted R2, T-statistic and F-test provided confidence in the models. Further diagnostic testing was requested by the independent reviewers to determine whether potential biases might be influencing the models. Biased modelling could lead to the modelled results differing quite significantly from the actual results. A reasonable possibility is an omitted variable bias. This occurs when an independent variable that should be in the model is not included. In this case, from an economic perspective, the effect of not including cotton prices in the production area decisions could lead to an omitted variable bias.
Two diagnostic tests were undertaken to examine whether a potential bias existed in the landuse-hydrology models. When considering the average cotton price across the analysis period and the area planted each year in total for the northern basin communities, the correlation is quite low: R2=0.37. That is, while the cotton price is important for farmers, it is not a significant determinant of the irrigated area planted. When examined at the community level, similarly low levels of correlation were observed (R2= 0.22 in Bourke, R2= 0.18 in Mungindi, R2= 0.29 in Narromine, R2= 0.35 in Wee Waa).
Page 16
Northern Basin Review - Technical overview of the socioeconomic analysis – interim report
A further test for omitted variable bias is whether the error term for each of the landuse-hydrology models is correlated with the omitted variable. Where this was examined for Bourke and Moree, there was no correlation observable. In both cases, the correlation was less than R2= 0.2. This analysis does not preclude the possibility that other omitted variables might be important to the landuse-hydrology modelling.
Further diagnostic testing was undertaken to determine whether the explanatory variables in each landuse-hydrology model are correlated with the error term. This problem can arise when something that is related to both the independent variable and an explanatory variable in the model has not been included in the model and is referred to as endogeneity. In the cases examined for Bourke and Moree, there was either no correlation or at most a weak correlation between water availability for irrigation and the error terms, indicating a low likelihood of there being a problem with endogeneity.
Overall, the diagnostic testing of the landuse-hydrology modelling confirms their validity and suitability for the proposed modelling of water recovery effects. Part of the reason the potential biases and other problems are not apparent from the ordinary least squares regression was a requirement to transform some of the hydrology (diversion) data before it could be used. In the land use-hydrology modelling for St George, Dirranbandi, Bourke, Mungindi and Goondiwindi, it was not possible to directly model the area of production as a function of the monthly diversion data from the hydrology models. For those cases, it was necessary to build a water balance to account for water use in one year, influenced by the prevailing climatic conditions, as the basis for determining how much water would be held over from that year to the following year to be combined with diversions arising between the date the previous summer crop watering is completed and the final planting date for the following summer crops.
For Warren, Narromine and Trangie, a different modelling approach was required. With these communities, the area of irrigated production was a function of the water allocations across the two previous years.
Further evidence the landuse-hydrology models effectively represent the decision-making of farmers is indicated by the degree of consistency in the modelling approach used for multipled communities within each catchment. For example, while similar modelling approaches were suited to St George and Dirranbandi in the Lower Balonne, the same approach would not work for Goondiwindi and Mungindi or any of the other communities. The consistency of the models within catchments is most likely a consequence of the types of entitlements held by irrigators.
Confirmation the land use-hydrology models are representative of irrigator decision-making was provided during the community consultation processes. Where anomalies between water availability and the area irrigated remained in the models, participants were generally able to advise the MDBA on why they existed and how they might be accounted for in the models. In particular, specific reference to changes in decision-making related to variations in the timing of local rainfall and or timing of irrigation water availability. This information was incorporated into the landuse–hydrology models following those meetings.
Limitations of the landuse-hydrology modellingGiven the information used in the landuse–hydrology modelling and the particular assumption regarding the fixed maximum area of production, these models are not designed for use as a forecasting tool. They are designed to represent the relationship between water availability and irrigated production for a particular period of time. From this baseline information, it is possible to examine how the recovery of water for the environment influences the area of irrigation across the period 1999-2000 to 2013-14. That information is then used to consider how changes in irrigation work their way through the respective communities.
Page 17

Northern Basin Review - Technical overview of the socioeconomic analysis – interim report
As indicated previously, for areas with significant water recovery prior to 2013-2014, such as Warren, Collarenebri and Moree, the models have been developed for up to the time of that recovery. Baseline data for the remainder of the modelling period is then a function of expected water availability and farmer decision-making as if there had been no water recovery. Care is therefore required when using the model outputs. Given these limitations and the questions raised by the independent reviewers, the use of the models should be confined to assessing the potential effects of water recovery on the area of irrigated production for the modelling period. That is, to support a sensitivity analysis of the effects of different water recovery scenarios.
How will the land use-hydrology model outputs be used?
The land use hydrology models provide a baseline of irrigated production across time for each community. Scenarios of water recovery are applied to those models to estimate changes to the annual area of irrigation. Those scenarios take into account the water recovered to date by volume, entitlement type and whether the recovery is through buyback or infrastructure investment. Additional water recovery, if required at the catchment level, was spread across the different types of surface water entitlements and assumed to occur through buyback. The effects may be less than modelled results indicate if some of any remaining, unallocated infrastructure funding are used to recover water through additional infrastructure investment.
Three outputs will be used from the landuse-hydrology models:
1. Changes to the annual area irrigated – estimates for the period 1999-2000 to 2013-2014 at the community level for each water recovery scenario (an input to the community modelling);
2. Expected changes to the maximum area irrigated – town businesses indicated changes to the maximum area that could be irrigated had the potential to affect their business operations and viability;
3. Expected changes to the minimum area irrigated – town businesses indicated that a significant change in the minimum area of irrigated production would affect their business turnover and capacity to retain staff during low water availability years.
Community-level modelling of employment
The annual area of irrigation and changes to the irrigated area are inputs to the community-level modelling of employment. Estimating the community effects requires information on the relative size of the irrigated agriculture sector, of irrigated agriculture as part of the overall farming enterprise mix and of the agriculture sector as a whole. For this analysis, the agriculture sector is referred to as the farm and farm-related sector. It includes farmers, seed and chemical suppliers, other farm input suppliers, transport workers, farming consultants and equipment suppliers. It differs from the agriculture sector workforce as defined from the ABS census data as the farm and farm related sector includes all the seasonal workers not accounted for in the ABS data.
In areas where irrigated agriculture is relatively large, for example the Wee Waa community has 14% of its farm land area under irrigation, the farming enterprises have a particular structural relationship with the rest of the farm and farm-related sector compared to communities with little irrigated agriculture. In the latter communities, agricultural production is focused on different mixes of cropping and grazing. These differences form the basis for examining the effects of water recovery in the individual communities. In each community the farm and farm-related sector has a very specific relationship with the other sectors. In particular, the other private business sector which supports the farm and farm-related sector, mining, manufacturing and government jobs in each community.
Page 18

Northern Basin Review - Technical overview of the socioeconomic analysis – interim report
By using the period 1999-2000 to 2013-14, this approach makes it possible to understand how these relationships in the individual communities are changing across time and their relative dependence on agriculture. To undertake the community modelling it was necessary to separate out the mining and manufacturing jobs which, together with the farm and farm-related sector and government services jobs, define the changes in employment for what is termed the other private business sector.
The outputs of the community modelling take account of the underlying changes in employment. This allows the MDBA to separate out an estimate of the effects most directly attributable to the recovery of water from the changes in jobs as a response to the other drivers of change. These outputs are combined with other economic and social information for each community to help contextualise the estimated changes to employment in the farm and farm-related and other private business sectors. Where those effects are quite large, consideration is given to the potential impacts on the population. Further modelling work, outside of this analysis, would be required to describe how changes in employment might translate into a shift in the rate of population change for each community.
By focusing on employment and the linkages defining how water availability leads to changes in the individual communities, the independent reviewers noted the potential for over-estimating the employment impacts. While the MDBA recognises this possibility, and the reasons for it, there is also the potential to under-estimate employment changes arising from the recovery of water. For example, a large volume of water recovery in a very short period of time can have an immediate and quite significant impact on businesses, particularly in the farm-related sector, than the same volume of water recovered over a longer period of time. These impacts generally take two to five years to fully play out in terms of the employment changes. However, consultations indicate significant short-run effects where large volumes of water are recovered over very short periods of time. Further, if the timing of water recovery coincides with other significant events, for example the droughts of 2014 and 2015, the effects of water recovery might be greater than those modelled.
Another reason that the employment changes may be underestimated is the flow-on effects of water recovery from one community to another, for example from Collarenebri to Moree and Dirranbandi to St George, are not included in the initial employment results for the individual communities. The possible transfer of effects between communities will be considered as part of the sensitivity analysis in this report.
Recognising these limitations indicates why the modelling results cannot be used on their own to describe the likely social and economic effects of recovering water for the environment. Given the way the community employment models are constructed, they are also unable to account for the prevailing social and economic conditions, or the rates of change in those conditions in each community. It is therefore essential that additional information from each community is used to interpret the modelling results. For each community, this profiling information is provided in the appendices to the report and is supported by additional information collected during the consultations.
It has been suggested that other sources of information could help to interpret the modelling results. For example, changes in house prices and differences in wages across the sectors of the local economies. The particular area of interest raised by the independent reviewers was the effect of mining wages on the demands for goods and services, and the flow-on effect to other sectors of the local economies. While it is recognised mining wages are on average considerably higher than farm wages for example, the modelling indirectly considers the effects of additional mining income in each community. More specifically, where increased mining jobs and income might lead to growth in employment for the non-farm related sectors of the local economies. With regards to changes in house prices, many confounding local and external factors affect the way house prices move. Further work would be required in order to separate out the effects of water
Page 19

Northern Basin Review - Technical overview of the socioeconomic analysis – interim report
recovery on the changes in house prices from all the other local and external factors affecting those prices.
Community modelling structureEmployment is one of several potential measures of community outcomes the MDBA could have chosen to assess impacts. Its advantages include being readily understood and that all parts of the economy are examined using a common metric. A key factor in deciding on the employment metric is data availability. The ABS reports employment data at small scales enabling us to have confidence in the modelling and results. Data on wages and profits are less readily available and more subject to variability across time and between communities. Further, the employment data is separated into 720 job classifications, making it possible to construct the industry sector jobs with a reasonable degree of reliability.
Consultation with the community clearly indicated economic and social structures, and changes to those structures, are best reflected in employment. The importance of understanding changes to employment as an indicator of economic and social condition was demonstrated to the MDBA when collecting the information to construct a representation of the local economy. Employment was the primary matter through which people were observing their personal and community wellbeing. When considering the relationships between water, irrigated production and economic activity in the farm and farm-related sector, the relationship between the area planted and employment became increasingly evident.
Building the employment dataset for the 21 communities required two key steps:
1. Constructing the census employment data to represent the sectoral representation of jobs in each community for 2001, 2006 and 2011
2. Using a pooled cross-sectional regression approach to estimate the internal structure of each community in the census years and then construct a baseline of annual employment.
To utilise the census employment, it was necessary to align the postal area data, available from the Australian Bureau of Statistics, with the community area boundaries employed by the MDBA. In the cases of Dirranbandi and St George, those community areas are the same as the postal areas. Full-time and part-time employment statistics were converted to full-time employment equivalents (FTEs) across all the industry classifications. The 720 industry classifications of employment in the 2006 and 2011 censuses, and over 300 industry classifications in the 2001 census, were allocated to one of 10 industry sectors. The sectors are agricultural support services, ginning and other irrigation processing, government services, mining etc. This task was undertaken jointly by the MDBA, University of Canberra and KPMG (University of Canberra 2016). The census data, aggregated at the sectoral level, was then used to calibrate models represent annual changes in employment for the period 1999-00 to 2013-14.
For the irrigation-dependent communities, the explanatory variables for employment are:
- Irrigated production
- Grazing activity
- Cropping activity
- Employment in the farm and farm-related, manufacturing, mining and government services sectors which influence employment in the other private business sector (which includes retailing, accommodation and food services)
Employment in irrigated production is a function of the water diversions. For cropping and grazing, employment is a function of the local rainfall. For the non-irrigation dependent
Page 20

Northern Basin Review - Technical overview of the socioeconomic analysis – interim report
communities, the latter three explanatory variables were used to develop the models of community employment.
The pooled cross-sectional regression approach employed by KMPG defines the community-specific internal economic relationships for the census years using the following sectors:
- Irrigation farming
- Non-irrigation farming
- Ginning
- Agriculture supply
- Mining
- Manufacturing
- Government services
- Other (non-agriculture) private business
The census data and relationships between these sectors in the census years were critical for estimating these internal economic relationships in the non-census years. Various modelling approaches were tried by KPMG to create the baseline data series of sectoral employment in each community. The preferred models were selected on the basis of performing well across most communities; performing well in the census years; being least complex; exhibiting a variation in modelled outputs that is plausible in terms of the variation of the explanatory variables and the size of the model errors in census years; and exhibiting plausible simulation properties. That is, model responses are commensurate with the scale of water recovery.
As a consequence of the approach taken to develop the community models and assess the effects of water recovery, the results do not represent a time series analysis. It does not rely on the use of time series data to develop a baseline for each community. Rather, it is a simulation model which relies on community-specific economic drivers, such as climatic conditions or growth in mining, to explain changes in employment. While building the baseline employment dataset was a challenging task, the approach taken avoids the general concerns of the independent reviewers about time series data being used to assess the effects of policy changes. Further evidence that the employment baselines and models provide a reasonable representation of changes in communities across time came from the community consultations. Where the data was presented for each community, there was no suggestion the baseline data was incorrect or invalid.
Details on the development and parameterisation of these models can be found in KMPG (2016). That report also details the statistical robustness of the community employment models.
Data sourcesThis study required detailed analysis of population and employment profiles, land use, the agriculture sector and socioeconomic characteristics to support the development of the social and economic condition reports and modelling tasks. Table 3 outlines the source of each data class. In some cases, the information is provided for the whole community while in other cases the data related to the main town in the respective community. For example, it is helpful to distinguish whether population changes occur in the main town or in the farming area of the communities.
Page 21

Northern Basin Review - Technical overview of the socioeconomic analysis – interim report
Table 3: Data sources used in the modelling
Data type Source ScaleEmployment Census 2001, 2006 and 2011 Community
Unemployment Census 2011 Town
Rainfall Bureau of Meteorology Community
Land use ACLUMP 2016 Community
Population Census 2001, 2006 and 2011 Community/Town
SEIFA Census 2001, 2006 and 2011 Town
Water recovery DAWR/MDBA Community
Age profile Census 2001, 2006 and 2011 Town
Proportion of indigenous Census 2011 Town
Education Census 2001, 2006 and 2011 Town
Area irrigated Census 2001, 2006, 2011, Industry
Community
The approach for transferring the ABS data to match the community boundaries is described separately (University of Canberra, 2016). The MDBA used the ABS and industry data to estimate the annual area of irrigation for each community. The primary sources for the employment data are the 2001, 2006 and 2011 ABS censuses. KPMG have documented their model for generating employment data for inter census years in KPMG (2016).
Page 22

Northern Basin Review - Technical overview of the socioeconomic analysis – interim report
Communities, industries and water availability in the northern basinThe northern basin represents more than half of the Murray–Darling Basin — it extends north of Chinchilla in Queensland, east to Toowoomba, west of Bourke and south beyond Dubbo in central NSW. While irrigated agriculture and agriculture more broadly are important drivers of the region's economy, the role of agriculture is not uniform across communities. It was therefore essential for the MDBA to examine a range of communities, each experiencing their own particular drivers of change and varying levels of water recovery under the Basin Plan. The 21 communities included in this study (Figure 1) help the MDBA to recognise how individual communities might be affected by the recovery of water.
Understanding northern basin communities
To understand the changing economic and social conditions, the MDBA has used a range of statistical information and relies heavily on the experiences of people to interpret that data. How changes, many being the consequence of long-term processes, influence change within communities only really became evident when comparing the pace of change, timing of change and whether the changes are positive or negative across these 21 communities. This information is needed to develop the modelling capability for estimating the effects of water recovery and interpreting the modelling results.
Collarenebri, Dirranbandi and Mungindi are small communities relying heavily on agriculture for employment. Over 60% of the workers in these communities were employed in farming or in businesses directly supporting farming in 2011. The three communities had a significant share of land allocated to irrigated agriculture. Trangie, Warren and Wee Waa are also highly-dependent on agriculture, with between 50 and 60% of workers employed in the agriculture sectors, and a relatively high proportion of land under irrigation. Where they differ from Collarenebri, Dirranbandi and Mungindi is in the size of the communities and in the rate of change in their respective economic and social characteristics.
Bingara, Brewarrina and Walgett have a heavy reliance on dryland farming and grazing with the overall agriculture sector providing more than half the total private sector jobs. Understanding what is happening in these towns provides useful context for understanding the changes in the more irrigation-dependent communities.
The recent expansion of coal mining in Boggabri and Gunnedah, copper in Nyngan, and coal seam gas in Chinchilla has led to significant recent growth in these communities. While this has influenced changes in other sectors of those local economies, between 20 and 30% of workers were engaged in farm and farm-related jobs in 2011.
The remaining eight towns are larger and generally have more diverse economies. They act as regional service centres for their residents and those of surrounding communities. The types of services they provide include a wider range of retail, food and accommodation and government services than is available in the smaller communities. Moree and Goondiwindi for example, have a high proportion of workers employed in jobs in both the farm and farm-related and the other private business sector.
We did not attempt to include the large towns of the northern basin, such as Tamworth, Dubbo or Toowoomba, in the analysis. They are not likely to be directly affected by water recovery and even if water recovery was to occur in those communities, the size and economic diversity of the towns would mean water recovery is unlikely to have a measurable impact on their economies.
Page 23

Northern Basin Review - Technical overview of the socioeconomic analysis – interim report
The key pieces of information on the social and economic conditions in each of the communities are provided in the appendices to this report, the social and economic conditions reports and narratives describing people’s views and perceptions of the changes occurring.
Regional wellbeing surveyThe Regional Wellbeing Survey (RWS) conducted by the University of Canberra examines the wellbeing of people and how this is influenced by a diversity of social, economic and environmental conditions (University of Canberra 2014). Wellbeing is a measure of how satisfied people are with their standard of living; their health; what they are currently achieving in life; their personal relationships; their safety; feeling part of their community; and their future security.
The survey provides information on the wellbeing of individuals and wellbeing of the community. Individual wellbeing is a measure of people’s quality of life and ability to cope with the normal challenges people might expect to experience. Community wellbeing is a measure of a community’s liveability. That is, whether it is a positive place to live and its ability to retain existing residents as well as attract new residents.
2014 survey respondents in the northern basin indicated similar levels of individual and community wellbeing as respondents across the whole basin. More detailed analysis undertaken using local government areas indicated some differences in the perceived wellbeing of particular communities. For example, respondents in the Lower Macquarie (Warren and Narromine LGAs) indicated a similar level of personal wellbeing to respondents throughout the basin. However, the measure of community wellbeing was lower.
Respondents were asked to provide their perceptions on how the Basin Plan might affect the number of people, economic activity and the future of their community as well as the perceived effects on employment. In the Balonne-Maranoa, Barwon-Darling, Gwydir and Lower Macquarie, there was an increase in the proportion of respondents who perceived the Basin Plan would have a negative effect on the employment and economic activity, the population and the future of their community, relative to the views on these matters held by people across the basin. These findings were evident in the 2015 RWS results. However, given the same respondents reported similar levels of wellbeing as respondents across the basin, the survey results suggest the Basin Plan is not the most influential driver of wellbeing.
The survey results indicate the importance of considering how all the drivers of change might be influencing individual or community wellbeing. It is further evidence supporting the time-scale community-level approach taken by the MDBA for the Northern Basin Review.
Identifying the drivers of change in communitiesSome of the indicators used by the MDBA to describe social and economic change include the rate of change in the population, changes in the number of people over 45 and under 45, the number of jobs, and the general social and economic conditions of people in the community (indicated by their levels of wealth, extent of training, and proportion of people who are disadvantaged). This information is considered together with prevailing climatic conditions, pace and types of technology change, growth in particular industries and the mix of agricultural enterprises associated with each community. Further insights are provided by taking account of the broader economic or policy changes, including past and current water reforms.
Page 24

Northern Basin Review - Technical overview of the socioeconomic analysis – interim report
Changes in population
Information used by the MDBA includes total changes to the population, the rates of change between 2001 and 2006 and 2006 to 2011, and whether the population is changing in the towns or farming areas around the towns of each community. The rates of population change for people aged either over or under 45 provides further insights into how the demographic structure of the communities are changing. When looking at changes in population, it is important to consider which people are leaving or moving to a community. For most communities, the number of persons aged above 45 years is increasing whilst the number of people aged below 45 years is decreasing. Exceptions to this are the towns of Moree, Bourke, Gilgandra, Collarenebri and Mungindi in which both groups decreased and Boggabri and Chinchilla in which both groups increased.
Changes to local labour marketsDroughts and increasing mechanisation, such as investment in farm machinery, have contributed to a significant shift in local labour markets. Town and farm businesses reflected upon the rapid change in the local supply of labour. In 2001, the labour market in each community provided an abundant supply of workers. Since that time, the labour supply has reduced leading to businesses placing a greater reliance on itinerant temporary workers.
Advances in technology
Technological advancement has been an important contributor to change in these communities since 1999-2000. Sudden shifts in technology such as the introduction of 'Roundup Ready' cotton and introduction of round-bailing, led to significant and rapid changes in the demand for labour and the structure of the local labour markets. These technology improvements have contributed to a reduction in the demand for seasonal workers from around 3.5 FTE per thousand hectares to 0.9 FTE per thousand hectares from 1999-2000 to 2012-13.
Growth in particular industry sectorsSince 2001, some northern basin communities have benefited from significant growth in particular sectors of their local economies.
Some towns have seen direct benefits from the mining boom. Gunnedah and Chinchilla, for example, have seen population growth occur with the expansion in the number of people employed locally in mining. Many other local industry sectors have benefited from this growth. In Nyngan and Narrabri, the growth in mining has helped to offset the decline in other industry sectors.
The number of people employed in government services across the northern basin has increased since 2001. The increase in this sector occurred in all the 21 communities except Collarenebri. The government services sector now accounts for a greater share of total employment in all communities except Chinchilla than in 2001. Employment in government services across all 21 northern Basin communities increased by 23% between 2001 and 2011. The biggest percentage increase occurred in Bingara. Growth in health and education services is consistent with the growth in all government services. Employment in the aged care sector increased by more than 26% between 2006 and 2011 across the 21 communities. Brewarrina is the community with the largest government services sector, representing 52% of the workforce in 2011.
General economic conditions, including commodity prices, exchange rates Commodity prices and exchange rates can influence farmer decisions regarding the types of crops grown and the profitability of their enterprises. As indicated previously, the area of cotton grown is only weekly correlated with the international price for cotton. Other factors contributing to cotton being the dominant irrigated crop in the northern basin communities include the capital
Page 25
Northern Basin Review - Technical overview of the socioeconomic analysis – interim report
investment of farmers into the development of their properties to support cotton production. However, prices for other commodities such as chickpeas and fava beans are likely to influence the area of other crops being grown.
Drought and flooding Communities in the northern basin often experience drought and flood conditions. Many again faced drought in the last few seasons. Following the changes to local labour markets, farm and town businesses seek to hoard their workers in order to support a rapid expansion in economic activity when it turns to wetter conditions.
Socio-economic indices for areasABS’ socio-economic indices provide an indication of the level of advantage and disadvantage within a community. A more disadvantaged area is likely to have less capacity to adapt than a less disadvantaged area.
Page 26

Northern Basin Review - Technical overview of the socioeconomic analysis – interim report
Scenario descriptionsUnder the current Basin Plan settings, the water recovery target for the northern basin is 390 GL out of an overall recovery target of 2,750 GL for the whole basin. We have simulated water recovery scenarios ranging from 278 GL (current water recovery) to 415 GL (Table 4). The breadth of scenarios enables the Authority to understand the hydrological, environmental, social and economic impacts across a range of potential recovery options. In addition to the volume of water recovery, the Authority considers the locations of where the remaining recovery might occur. Both the volume of water recovered and the location of recovery can affect the social, economic and environmental outcomes, which may be further influenced by the entitlement types recovered.
Table 4: Water recovery scenario description
Scenario Name Scenario description Why?Baseline The best estimate of water
management operations prior to the Basin Plan; represents entitlements, water allocation policies, water sharing rules, operating rules and infrastructure as of June 2009. This scenario is the scenario from which changes in environmental, economic and social indicators have been calculated and is not a scenario that the Authority is considering as part of their recommendation
278 GL - water recovery
Represents the amount of water that had been recovered by the Commonwealth in the northern basin to date, based on current planning assumptions and an estimate of 10 GL of expected future infrastructure-related recovery.
To understand what outcomes are possible with water that has already been recovered since 2009.
320 GL A - water recovery less than Basin Plan
Represents water recovery to date (278 GL) supplemented with a further 42 GL recovered from the Condamine–Balonne, Border Rivers and Namoi catchments.
To understand what outcomes are possible with some continued water recovery in certain catchments that have not met many of the outcomes.
320 GL B – default water recovery less than Basin Plan (pro rata)
Represents a 320 GL recovery volume that is based primarily on achieving an equitable recovery strategy.
To test the performance of different recovery strategies (i.e. looking at how outcomes are influenced by where and how much water is recovered for each catchment)
320 GL C – refined Another variation of a 320 GL scenario. Represents a pattern of recovery based on the
To try and meet environmental outcomes (based on prioritising
Page 27

Northern Basin Review - Technical overview of the socioeconomic analysis – interim report
Scenario Name Scenario description Why?environmental, social and economic results from all other model scenarios. Recovery is focused in the Condamine−Balonne (115 GL), Moonie and Border Rivers (which are well-connected to the Barwon−Darling in order to boost Barwon-Darling outcomes) and reduced below current recovery in the Macquarie to reduce impacts on Warren.
outcomes in the Barwon−Darling and Condamine−Balonne catchments) with less water recovery. This was to limit social and economic impacts, while also retaining equity in the state shares of the shared recovery target.
345 GL – refined This option was designed based on the results from previous scenarios. There is an adjustment to the pattern of catchment water recovery to achieve outcomes in an efficient way.
To test if the Basin Plan (390 GL) scenario environmental outcomes can be achieved by combining less water recovery with a refined recovery pattern.
350 GL - targeted recovery
Represents Basin Plan recovery strategy, but includes a highly targeted recovery strategy in the Condamine-Balonne. In particular targeting in-channel water recovery in the Narran River over overland flow licenses.
To understand if outcomes can be improved if water recovery is targeted for particular areas, volumes and entitlement types.
390 GL A - fully implemented Basin Plan
Represents the fully implemented Basin Plan as currently legislated.
This scenario is the primary comparison scenario for the Northern Basin Review.
415 GL - water recovery more than Basin Plan
Represents a similar water recovery approach to the fully implemented Basin Plan, but with a 25 GL increase to the volume of water recovered.
To understand what additional environmental outcomes might be possible with more water recovery.
Page 28

Northern Basin Review - Technical overview of the socioeconomic analysis – interim report
Water in the northern basin
In the northern basin, both surface and groundwater is used for irrigated production. There are a number of dams supplying regulated water with considerable surface water sourced from unregulated supplies. Only limited water trading occurs. Importantly for the social and economic analysis for the Northern Basin Review, each community has their own particular mix of groundwater, regulated and unregulated surface water, and trading of temporary water.
The volume of water available for irrigation is a function of current and recent climatic conditions, water carryover held within dams and on-farm storages from the previous season, storage and other infrastructure, state and federal government regulations, upstream development, total volume of water entitlements, allocations against the entitlements and trade. Water recovered through purchase will reduce the water available for irrigation. However, government and private investment in infrastructure may increase agricultural production potential while still providing more water for the environment.
There has been significant water reform by the New South Wales and Queensland governments prior to the Basin Plan, such as changes to the reliability of general security water licenses in the Gwydir and the restriction of supplementary water access in the Macquarie. Basin Plan water reform is additional and subsequent to these prior reforms. The current process for reducing the sustainable diversion limits for groundwater in NSW will conclude in 2017. Communities affected by the reduction in groundwater entitlements are Boggabri, Gunnedah, Moree, Narrabri, Narromine, Trangie and Wee Waa.
The Basin Plan currently sets 3,468 GL as the limit of water that can be extracted across the northern basin on average per year (including interception). 390 GL is around 10% of the amount that could have been taken before the Basin Plan.
Table 5 describes the proposed surface water recovery volume for each of the scenarios modelled to inform the Northern Basin Review.
Page 29

Northern Basin Review - Technical overview of the socioeconomic analysis – interim report
Table 5: Total water recovery by catchment
Catchment Baseline Surface water entitlements
Ground water entitlements
Current water recovery
320 B 320 A 320 C 345 350 390 415
Name GL GL % % % % % % % %Namoi 187 185 7 11 11 11 13 13 13 15
Barwon-Darling 180 0 17 7 17 20 20 16 16 16
Gwydir 296 33 16 17 16 16 16 19 19 20
Macquarie 226 58 37 34 37 24 33 37 37 39
NSW Border Rivers 213 0 1 6 3 3 3 8 8 8
QLD Border Rivers 175 0 9 12 12 12 20 14 13 14
NSW Warrego/Intersecting streams
10 0 81 81 81 81 81 81 81 81
Condamine-Balonne 434 0 15 26 21 26 23 23 33 35
Table 6 breaks down the catchment level recovery to the 15 communities where the average area of irrigation exceeds 1,000 hectares. Water trading is important, yet limited in the northern basin. As such, the effects of water purchase from a particular community will reduce the water available in that community.
Page 30

Northern Basin Review - Technical overview of the socioeconomic analysis – interim report
Table 6: Total water recovery by scenario and community
Community Ground water
entitlements(GL)
Baseline Surface water
entitlements(GL)
278 (% recovery of surface
water entitlements
)
320 B(% recovery of surface
water entitlements
)
320 A(% recovery of surface
water entitlements
)
320 C(% recovery of surface
water entitlements
)
345(% recovery of surface
water entitlements
)
350(% recovery of surface
water entitlements
)
390(% recovery of surface
water entitlements
)
415(% recovery of surface
water entitlements
)Boggabri 0 4 1 5 5 5 7 7 7 9
Bourke 18 100 17 7 17 20 20 15 15 15
Collarenebri 0 46 66 66 66 66 66 66 66 66
Dirranbandi 0 218 20 31 24 36 30 35 42 45
Goondiwindi 0 306 3 7 6 6 8 9 8 9
Gunnedah 66 5 1 5 5 5 7 7 7 9
Moree 33 217 10 11 10 10 10 13 13 14
Mungindi 0 150 5 6 7 7 10 9 9 9
Narrabri 15 20 0 2 1 1 2 4 4 6
Narromine 51 40 32 29 32 19 28 32 32 34
St George 0 216 9 15 12 15 13 9 21 21
Trangie 8 48 34 32 34 22 30 34 34 36
Walgett 0 46 0 1 1 1 2 2 2 3
Warren 0 139 32 29 32 19 28 32 32 34
Wee Waa 86 158 4 8 8 8 10 10 10 12
Page 31

Northern Basin Review - Technical overview of the socioeconomic analysis – interim report
Table 7 shows the net water recovery by scenario and community. These figures differ to the total water recovery numbers for Goondiwindi, Moree, Mungindi, Narromine, St George, Trangie Warren and Wee Waa. The net water recovery takes into account the Commonwealth purchase of entitlements, the water recovered through infrastructure investment and the water savings from the infrastructure investment retained by farmers
Page 32

Northern Basin Review - Technical overview of the socioeconomic analysis – interim report
Table 7: Net reduction in surface water available to irrigators by scenario and community
Community Baseline Surface water entitlements
(GL)
278(% recovery
against surface water)
320 Pro B(% recovery
against surface water)
320 A(% recovery
against surface water)
320 C(% recovery
against surface water)
345(% recovery
against surface water)
350(% recovery
against surface water)
390(% recovery
against surface water)
415(% recovery
against surface water)
Boggabri 4 1 5 5 5 7 7 7 9
Bourke 100 17 7 17 20 20 15 15 15
Collarenebri 46 66 66 66 66 66 66 66 66
Dirranbandi 218 20 31 24 36 30 35 42 45
Goondiwindi 306 -3 1 -1 -1 2 3 2 3
Gunnedah 5 1 5 5 5 7 7 7 9
Moree 217 8 9 8 8 8 11 11 12
Mungindi 150 -1 0 1 1 4 3 3 3
Narrabri 20 0 2 1 1 2 4 4 6
Narromine 40 20 17 20 7 16 20 20 22
St George 216 7 13 10 13 11 7 19 19
Trangie 48 20 18 20 8 16 20 20 22
Walgett 46 0 1 1 1 2 2 2 3
Warren 139 30 27 30 17 26 30 30 32
Wee Waa 158 2 6 6 6 8 8 8 10
Note: A negative number reflects an increase in water availability arising from infrastructure investment.
Page 33

Northern Basin Review - Technical overview of the socioeconomic analysis – interim report
Further information on changes to water availability across time for each community, including the effects of past water reforms, is provided in the social and economic conditions reports.
Page 34

Northern Basin Review - Technical overview of the socioeconomic analysis – interim report
Findings from the analysisThe community-level modelling improved the MDBA capacity to understand how water recovery intersects with the changing economic and social conditions in each locality. While it might generally be recognised that every community is different in its make-up and how they are responding to multiple drivers of change, the community level modelling made it possible to quantify those differences as community-specific outcomes. In the first instance, those outcomes were presented as a baseline of change as if there were no Basin Plan water recovery. By understanding the drivers of change in each community and how their economic structure has changed over time, it was possible to quantify the expected effects of water recovery. To finalise the results from this section of the work, the model outputs are presented in the context of social and economic change impacting on the individual communities.
After analysis the modelling results for the 21 communities, they have been grouped as unaffected and affected. The unaffected communities are those with limited irrigation activity (averaging less than 1,000 hectares per annum) and no expectation of Basin Plan water recovery. Communities with an average irrigated area above 1,000 hectares and potential for water to be recovered represent the affected grouping. Brewarrina is included in the affected group given the potential benefits to graziers from recovery in the Lower Balonne. The unaffected grouping provides critical information about the capability of the modelling approach. Results for these communities provide confidence in the modelling approach. They demonstrate how the multiple drivers of change operating across all communities have been effectively employed to build the individual community models.
Understanding the scale of changeTo help interpret the outputs of the community-level modelling, some reference point is required to understand what might be considered as modest, discernible or significant effects from water recovery. For example, in 2002-03, employment in the farming sector across Australia fell by 16%. The level of employment in that sector has continued to fall. This change to farm labour requirements (also associated with increased mechanisation and other technological improvements) worked its way through the rural communities at quite different rates. On the whole it was observed as a significant change to many (but not all) agriculture-dependent communities.
More specific examples to help interpret the scale of the potential changes in employment are provided from some of the communities examined in this analysis. For example, the expansion in the mining sector has resulted in mining jobs as a proportion of the total workforce increasing between 2001 and 2011 in five of the communities (Table 8). In each of these communities, the growth in mining represents a significant, positive change which flows through to other sectors of the local economies.
Table 8: Growth in mining jobs
Community Mining jobs as a % of total jobs in 2001
Mining jobs as a % of total jobs in 2011
Chinchilla 1 11Gunnedah 1 8Nyngan 2 14Boggabri 0 18
Page 35

Northern Basin Review - Technical overview of the socioeconomic analysis – interim report
Community Mining jobs as a % of total jobs in 2001
Mining jobs as a % of total jobs in 2011
Narrabri 0 4
Similarly, the general trend of increasing government services has occurred at different rates across the 21 communities examined (except for Collarenebri). In the five communities with the largest government services sectors, the growth in employment as a proportion of the total workforce is between 7% (in Coonabarabran) and 13% (in Bourke) (Table 9).
Table 9: Growth in government services jobs
Community Government services as a % of total jobs in 2001
Government services jobs as a % of total jobs in 2011
Bingara 21 32Bourke 31 44Brewarrina 41 52Coonabarabran 26 33Walgett 30 37
Communities unaffected by Basin Plan water recoveryOur social and economic analysis in the northern basin includes unaffected communities. More detailed modelling results for the unaffected communities are provided in the appendices to this report. This grouping includes Bingara (Appendix B1), Chinchilla (Appendix B5), Coonabarabran (Appendix B7), Gilgandra (Appendix B9) and Nyngan (Appendix B16).
Each of the unaffected communities have their own particular mix of drivers of change. Climate and different landuses influence the local farm and farm-related sector. Employment in the farm and farm-related, mining, manufacturing and government services sectors all influence employment in the other private business sector. The modelling results demonstrate that it is the different combinations and strengths of the drivers which effectively lead to the community-specific estimates of employment and changes in employment across time. While not modelled directly, these parameters are reflected in the complexity of these communities, which is also a consequence of their size. The unaffected communities range in size from 1,800 to 6,850 people.
Findings from modelling the unaffected communities include: In Bingara, the high dependence on grazing and age structure of the community is relevant to
the limited changes in employment in the farm and farm-related sector. This stability in employment combined with growth in tourism and increasing government services jobs influenced the rate of growth in the other private business sector.
In Chinchilla, growth in mining and manufacturing supported growth in the other private business sector at a same time when a small decline in farm and farm-related sector jobs would have had an opposing effect.
While there are similar influences over the economy in Coonabarabran as observed in Bingara, the modelling was able to pick up the timing and differing rate of change, which is consistent with the findings from census data.
Page 36

Northern Basin Review - Technical overview of the socioeconomic analysis – interim report
For Gilgandra, the modelling picks up the small decrease in farm and farm-related sector employment and growth in the other private business sector, which appears to be influenced by its proximity to Dubbo.
In Nyngan, the modelling reflected the decline in farm and farm-related employment and growth in mining jobs as key influences of the rate of change in the other private business sector.
The results for the unaffected communities provides confidence the cross-sectional modelling approach can effectively use the multiple drivers of change to estimate baselines of employment in the farm and farm-related sector and the other private business sector. When borrowing information from other communities, this additional information does not appear to unduly influence the local drivers of change. To the contrary, it appears the borrowed information helps to better explain the relative strengths of the drivers of change in each community. With some reasonable certainty, it is then possible to consider the modelled results for each affected community in the context of the other social and economic information collected to inform this analysis.
Communities affected by water recovery
The effects of water recovery were considered through the changes in agricultural production (namely the maximum area of irrigation for 15 of the communities and dryland grazing for Brewarrina) and how changes in the farm and farm-related sector affected employment in other sectors of the respective communities. These outcomes are considered along a continuum from the least to most affected communities, given the range of proposed water recovery scenarios. In those communities likely to be most affected by water recovery a qualitative description is given for potential changes to the population.
In considering the results of this analysis, it is important to note multiple factors are determining the effects on individual communities. While the total volume of the northern Basin water recovery ranged from 278GL (recovery to date) up to 415GL in the scenarios considered, not all communities are assumed to have a commensurate increase in the volume of water recovered. As the total volume of water recovery was increased, there were instances for some communities where the water recovery volume decreased. Beyond the water recovery volume proposed for each community, the outcomes were influenced by the:
maximum possible area of irrigation, method of water recovery, mix of cropping and grazing, size and structure of the farm supply (farm-related) sector, size and structure of the other private business sector, and size of other sectors (manufacturing, mining, government services).
Of the 16 communities likely to be affected by water recovery in the northern basin, the changes work their way through 15 of those communities by starting at the impact on irrigated agriculture. The outcomes for Brewarrina will be discussed in conjunction with the effects of water recovery on floodplain graziers in the Lower Balonne.
For 6 of the affected communities, the effects of water recovery were identified across all recovery scenarios as being quite small. Changes on this scale would be difficult to distinguish relative to the other changes impacting upon those communities. Given the small changes estimated for all the water recovery scenarios, the effects are presented for the largest water recovery volume proposed in each community (Table 10). For five of these communities, the largest effects were associated with the 415GL recovery scenario, while for Mungindi the maximum potential effects were associated with the 345GL recovery scenario. Results for all scenarios in each of these communities are provided in the appendices to this report.
Page 37
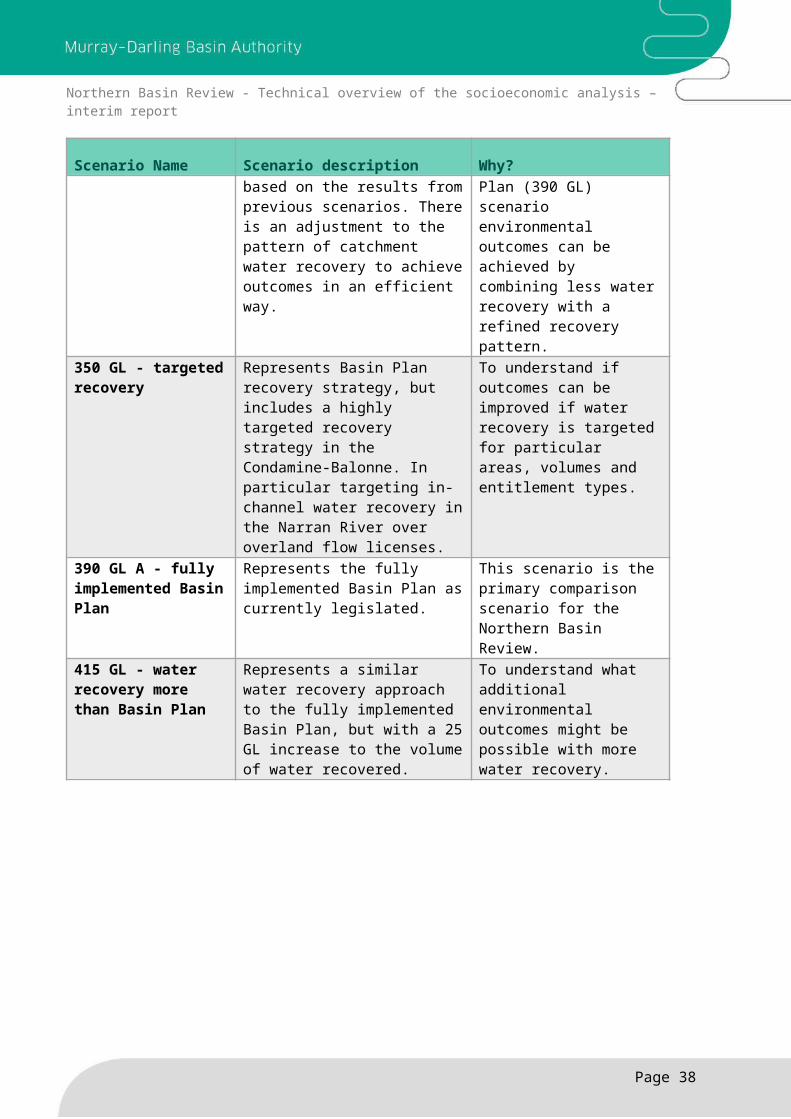
Northern Basin Review - Technical overview of the socioeconomic analysis – interim report
Table 10: Six communities with small effects of water recovery
Community Reduction in maximum
hectares (%)
Fall in farm, farm-related
jobs (%)
Fall in other private
business jobs (%)
Fall in total jobs (%)
Boggabri 6 1.1 0.6 0.6
Gunnedah 9 1.3 0.6 0.5
Narrabri 4 1.4 0.8 0.7
Goondiwindi 3 1.2 0.5 0.7
Mungindi 4 2.0 1.7 1.6
Walgett 6 0.5 0.2 0.2
Across the Boggabri, Narrabri and Walgett communities, the area irrigated is up to 4,000, 15,000 and 5,000 hectares, respectively. After taking into account the small proposed volumes of water recovery in these communities, the modelling results indicate a decrease in farm and farm-related jobs of less than 1.5% and total employment of less than 1%.
The maximum area of irrigation in the Goondiwindi and Mungindi communities is significantly greater (up to 61,000 hectares and 25,000 hectares, respectively). One of the primary reasons for the limited effect of water recovery in these two communities under the scenarios modelled is the dependence of water recovery on infrastructure investment and the creation of water savings which are shared with irrigators. With the current water recovery (278 GL recovery scenario) there is an increase in the total potential water available for production arising from the water savings being greater than the volume of water recovered through the purchase of entitlements. It is assumed that further water recovery in each of the other scenarios will be obtained through the purchase of entitlements. As the volume of entitlements increases, there is estimated to be a reduction in the maximum area of irrigation. However, the potential change in the maximum irrigated area and flow-on effects to employment are quite small.
A further piece of analysis was to examine the effects of transferring Border Rivers water recovery between the Mungindi and Goondiwindi community areas. If 10GL of the remaining Border Rivers water recovery was transferred from the Goondiwindi to the Mungindi community area, the estimated effect is a potential reduction in Mungindi’s maximum irrigated area of 11% (or around 2,800 hectares). Given the current structure of the Mungindi community is so heavily dependent on the farm and farm-related sector and the general social and economic conditions in the community, the transfer of water recovery from Goondiwindi to Mungindi might lead to a 3-fold increase in the employment effects observed for the 345GL recovery scenario. That is a reduction in total employment of 4.5-5%. This would have a significant effect on the Mungindi community.
Page 38

Northern Basin Review - Technical overview of the socioeconomic analysis – interim report
If 10GL of the remaining water recovery were transferred from the Mungindi community to the Goondiwindi community, the effect on the maximum area irrigated is a decrease of around 6%. The smaller percentage impact on the area is a function of the larger total area irrigated in the Goondiwindi area. The estimated flow-on effect to employment would still remain relatively small. This would be a consequence of the diversified structure of the community together with the prevailing positive social and economic conditions in the Goondiwindi community.
Communities most affected by water recoveryThe modelling indicated communities expected to be most affected by water recovery are Bourke, Collarenebri, Dirranbandi, Narromine, Trangie, Warren, St George, Moree and Wee Waa. The effects will differ with the water recovery scenarios being examined when assessed using changes to the maximum area of production (Table 11) and to total employment (Table 12). With regards to changes in the maximum area of irrigation, effects are likely to be increasingly apparent as the decrease increases 15%. Table 11 indicates which of the communities are expected to exceed that threshold under the different recovery scenarios.
Table 11: Effects of water recovery on maximum area irrigated
Scenario < 15% reduction > 15% reduction278 GL St George, Wee Waa,
MoreeBourke, Collarenebri, Dirranbandi, Narromine, Trangie, Warren
320 GL B Bourke, Wee Waa, Moree Narromine, Trangie
Collarenebri, Dirranbandi, St George, Warren
320 GL A St George, Wee Waa, Moree
Bourke, Collarenebri, Dirranbandi, Narromine, Trangie, Warren
320 GL C Wee Waa, Moree, Narromine, Trangie
Bourke, Collarenebri, Dirranbandi, St George, Warren
345 GL St George, Wee Waa, Moree, Narromine, Trangie
Bourke, Collarenebri, Dirranbandi, Warren
350 GL St George, Wee Waa, Moree
Bourke, Collarenebri, Dirranbandi, Narromine, Trangie, Warren
390 GL Wee Waa, Moree Bourke, Collarenebri, Dirranbandi, Narromine, St George, Trangie, Warren
415 GL Wee Waa, Moree Bourke, Collarenebri, Dirranbandi, Narromine, St George, Trangie, Warren
Source: MDBA modelling
The reduction in irrigated hectares due to water recovery has a subsequent effect on employment in the farm and farm-related sector. The size of this effect varies depending on the diversity of each community’s agriculture sector and the relative importance of irrigated agriculture. In the case of employment, the differentiation of communities is on the basis of the fall in farm and farm-related sector employment being greater than or less than 8% across these
Page 39

Northern Basin Review - Technical overview of the socioeconomic analysis – interim report
same nine communities. Further information is provided in the text below and in the appendices on the expected changes in employment as the effects of water recovery work their way through the affected communities. That is, the flow-on effect expected for employment in the other private business sector and for estimated changes to total employment.
Table 12: Effects of water recovery on farm and farm-related jobs in maximum production years
Scenarios < 8% Reduction > 8% Reduction278 GL Bourke, Narromine, Moree,
Trangie, St George, Wee Waa
Collarenebri, Dirranbandi, Warren
320 GL B Bourke, Narromine, Moree, Trangie, St George, Wee Waa
Collarenebri, Dirranbandi, Warren
320 GL A Bourke, Narromine, Moree, Trangie, St George, Wee Waa
Collarenebri, Dirranbandi, Warren
320 GL C Narromine, Moree, Trangie, St George, Wee Waa, Warren
Bourke, Collarenebri, Dirranbandi
345 GL Narromine, Moree, Trangie, St George, Wee Waa
Bourke, Collarenebri, Dirranbandi, Warren
350 GL Bourke, Narromine, Moree, Trangie, St George, Wee Waa
Collarenebri, Dirranbandi, Warren
390 GL Bourke, Narromine, Moree, Trangie, Wee Waa
Collarenebri, Dirranbandi, Warren, St George
415 GL Bourke, Narromine, Moree, Trangie, Wee Waa
Collarenebri, Dirranbandi, Warren, St George
Source: MDBA modelling
While Table 11 and Table 12 present a coarse approach to distinguishing communities into those with very large effects from those where the effects are likely to be discernible from other existing processes of change, it is insufficient to articulate the scale and the extent of change arising from the recovery of water. Community-specific results are also reported to provide greater details of the expected effects from the different water recovery scenarios. Some further sensitivity analysis follows to describe the interaction between the surface and groundwater recovery processes in Wee Waa and the potential flow-on effects of water recovery from Dirranbandi and Collarenebri respectively on the St George and Moree communities.
Community-specific results
BourkeCurrent water recovery in the Bourke community area has reduced the maximum area of irrigation by around 13%. This level of change has had a discernible effect on employment in the farm and farm-related sector of around 6-10% (15-22 FTE). The effect on employment in the other private business sector is estimated to be around 2-3.5% (<10 FTE) and approximately 3.3% (30 FTE) across the local economy. These changes are within the context of a significant, unrelated and pre-Basin Plan, reduction in irrigated horticulture and grape production, which
Page 40

Northern Basin Review - Technical overview of the socioeconomic analysis – interim report
together with drought and other factors, contributed to underlying (non-Basin Plan) changes in employment of more than 30% since 2001 in the farm and farm-related sector and around 15% in the local economy. Further water recovery under the 320 GL C and 345GL scenarios, if obtained through the purchase of water entitlements is expected to lead to small additional decreases in jobs for the farm and farm-related and other private business sector of 0.5-1%.
MoreeFor the Moree community, water recovery to date has involved the purchase of water entitlements, investment in delivering stock and domestic water through the Basin Pipes program and investment in irrigation infrastructure. While the recovered volume of water represents around 14% of the entitlements owned in the Moree community, the combined effects of the recovery approaches on water available for production is a reduction of around 8% and on the maximum area irrigated, approximately 5%. Part of the discrepancy between the reduction in water available for production and the maximum area of irrigation is due to some growers relying on groundwater and part of the Moree recovery being a consequence of water recovery in the Collarenebri community.
From the reduction in irrigated area associated with current water recovery, the estimated reduction in jobs for the farm and farm-related sector is around 2.4% (47 FTE) and up to 1.5% (27 FTE) for the other private business sector. The reduced employment of 75 FTE represents approximately 1.4% of the workforce. Under the 390GL water recovery scenario, the estimated reductions are 8% in the maximum area irrigated, 3.2% (65 FTE) in the farm and farm-related sector employment and 2% (37 FTE) of the jobs in the other private business sector. Overall effect on the local economy is a fall in employment of 2% (102 FTE). The estimated effects of the 415 GL water recovery scenario are slightly greater than for the 390 GL water recovery scenario.
Outcomes from the water recovery should be considered in the context of the broader social and economic conditions in the Moree community and previous water recovery processes. The Moree community has some challenging economic and social conditions. A 15% decline in the population between 2001 and 2011 (which is different to most other rural communities of more than 12,000 people), a 13% reduction in employment (850 FTE without including the Basin Plan water recovery) and decline in the general social and economic conditions suggest considerable challenges in adapting to further changes, such as the recovery of water. These impacts of water recovery are likely to be further exacerbated by the transfer of some of the Collarenebri water recovery back through to Moree businesses. The potential flow-on effects from the Collarenebri community to Moree are considered as part of the sensitivity analysis.
Wee WaaCurrent water recovery in Wee Waa is a mix of purchased water entitlements and investment in infrastructure. The net effect is estimated to be a reduction in water entitlements owned of 4%, net reduction in on-farm water available for irrigation of 2% and a decrease in the maximum irrigation area of 2%. Flow-on effects to employment are a decline in jobs of around 1% in the farm and farm-related sector and 0.7% in the other private business sector.
Under the 390 GL water recovery scenario, the estimated effects are an 8% decrease in water available for irrigation, a 6% decrease in the maximum area irrigated, a 3.4% (25 FTE) decrease in farm and farm-related jobs and 2.8% (8 FTE) decrease in other private business sector employment. The overall effect on the local economy is estimated to a reduction in employment of 2.7% (35 FTE). For the 415GL scenario, the additional effects on employment in the farm and farm-related sector, other private business sector and the local economy are less than 1% above the reductions associated with the 390GL scenario.
Page 41
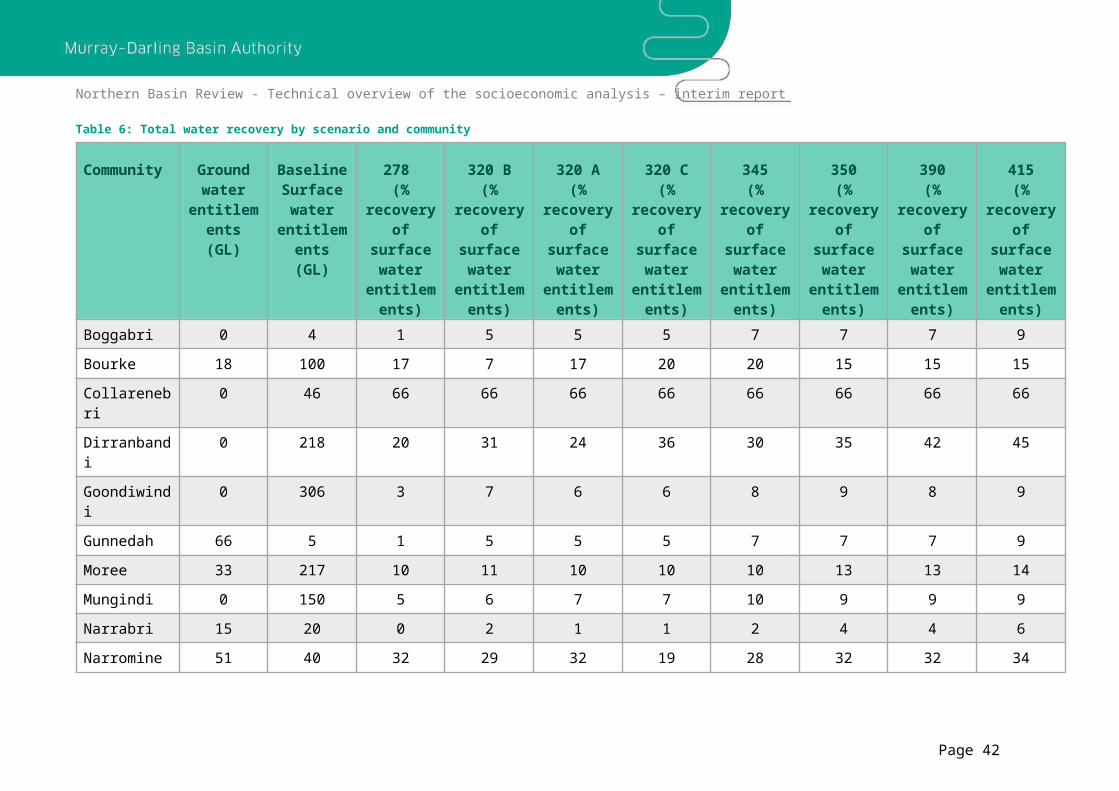
Northern Basin Review - Technical overview of the socioeconomic analysis – interim report
The modelled water recovery effects for the Wee Waa community should be considered in the context of the underlying social and economic trends. Changes to the population, employment and general economic and social conditions indicates the significant pressures on the community in the absence of the Basin Plan. Sensitivity analysis indicates potential additional effects arising from the combined effects of the groundwater recovery process and the Basin Plan surface water recovery. Consideration is also given to the possibility all remaining water recovery in the Namoi catchment being achieved from the Wee Waa community.
CollarenebriWater recovery in the agriculture-dependent community of Collarenebri during 2009-11 had a significant impact on the maximum area irrigated (down over 80%), employment in the farm and farm-related sector (down 10% in dry years, up to 38% in wet years) and the other private business sector (down 9% in dry years, 28% in wet years). This water was recovered from a community challenged by severe drought, population decline, underlying employment decline (around 40% in the farm and farm-related sector and other private business sector since 2001), and quite difficult social and economic conditions in general.
The rapid recovery of water from the largest irrigation farm in this community added to these challenges, making it very difficult for those remaining in the community to adapt to the multiple drivers of change. The modelled estimates of water recovery need to be considered in the context of these pressures. Given the economic relationships between Collarenebri production and Moree-based businesses, some of the effects of the Collarenebri water recovery are also likely to be felt by the Moree community. The potential transfer of effects between these two communities is considered as part of the sensitivity analysis.
NarromineThe net effect of water recovery through infrastructure investment and purchase to date is an estimated reduction in the maximum area irrigated of 18%. The consequences of these changes are a relatively smaller impact on the farm and farm-related sector (employment down 5-7%, partly due to the farm sector’s reliance on dryland cropping) and reduced employment in the other private business sector of 3-6%. Overall effects on the Narromine community were estimated as a reduction in employment of approximately 3.3% (50-60 FTE). Further small changes to the maximum area irrigated and employment are anticipated for the 415 GL water recovery scenario.
The benefit of Narromine’s proximity to Dubbo is countering some of the effects of water recovery. Narromine has a growing population and there are increasing numbers of people holding jobs in the local community (and possibly working in Dubbo). For Narromine, the other private business sector is larger than the farm and farm-related sector, providing considerable economic complexity, and the general social and economic conditions are quite sound for a small, rural community.
As a consequence of the investment in infrastructure, Narromine irrigated production is expected to be higher in all but the zero allocation and maximum production years. Under the 320GL B, 320 GL C and 345GL water recovery scenarios. The water recovery volume is lower than the current volume of recovery. It is anticipated the maximum irrigation area would be reduced by 11%, 7% or 15%, respectively under these scenarios. The estimated decrease in farm and farm-related employment from these scenarios is 4.4%, 2.0% and 4.3%. As a consequence, the flow-on effects to employment in the other private business sector are expected to be smaller than the reductions under the 278 GL scenario.
TrangieWater recovery through purchase and infrastructure investment to date is estimated to reduce the maximum area of irrigation in the Trangie community by 16%. The estimated effect of that
Page 42
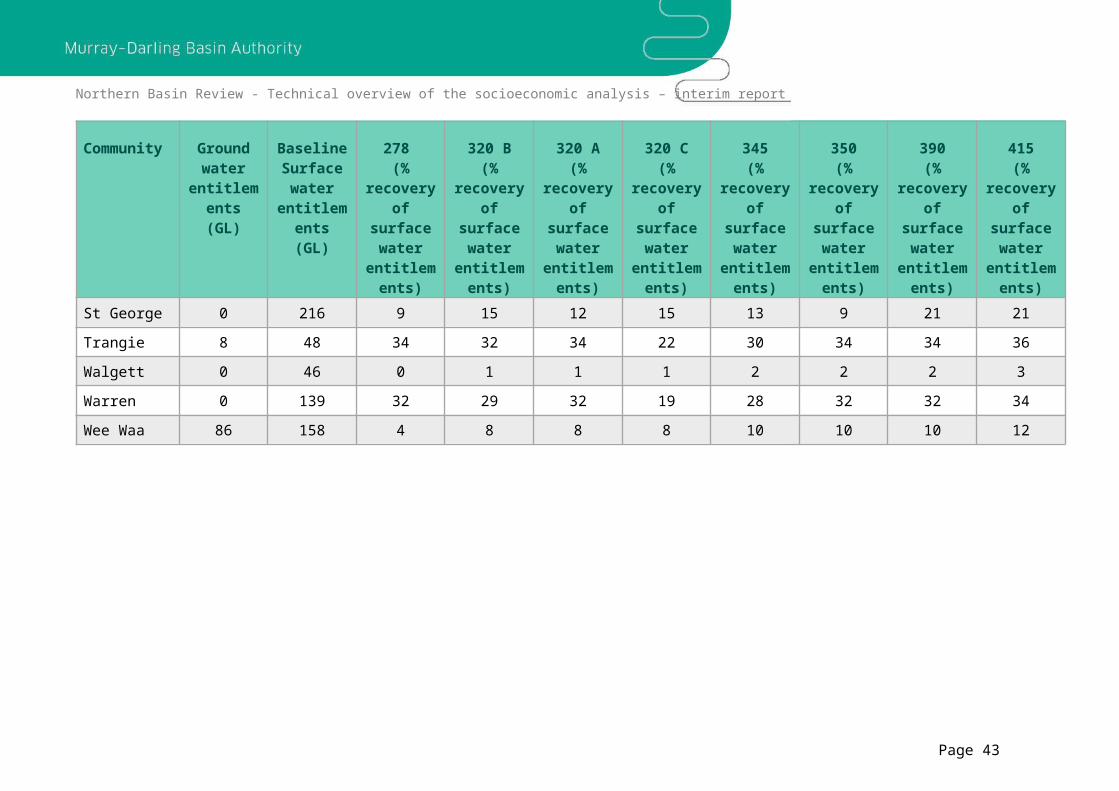
Northern Basin Review - Technical overview of the socioeconomic analysis – interim report
water recovery is a reduction in employment of 4.6% (13 FTE) in the farm and farm-related sector and 6.2% (6 FTE) in the other private business sector. The smaller proportional effect on the farm and farm-related sector arises from the high existing level of cropping and opportunities to convert some previously irrigated fields to dryland cropping in the Trangie community. Conversely, the larger flow through effect in the other private business sector is due to the very small size of that sector.
These estimated changes for Trangie are in the context of a 18% decline in the population and 9% decline in employment since 2001 arising from pressures other than the Basin Plan. The overall challenging social and economic conditions in the Trangie community present difficulties with adapting to large changes.
Trangie irrigation production is expected to be higher in all but zero allocation and maximum allocation years as a consequence of the recent infrastructure investment. Under the 320 GL B, 320 GL C and 345 GL water recovery scenarios, it is proposed that some water is returned to the consumptive pool. In those scenarios, the reduction in the maximum irrigation area is estimated to be 14%, 6% and 13%, respectively. The flow-on effect to employment in the farm and farm-related sector from these scenarios is estimated to be 4.0%, 1.8% and 3.7%, with reduced effects on the other private business sector.
WarrenThe Warren community is affected by water recovery to date, most of which occurred prior to 2011. That recovery included the purchase of entitlements off the largest irrigation farm in the community. Some of the effects of the purchase of water entitlements have been off-set by Commonwealth recovery of some water through investment in irrigation infrastructure in this community. However, water recovery is estimated to have reduced the maximum area irrigated by 35%, employment in the farm and farm-related sector by 15% (87 FTE) and other private business sector employment by 11% (27 FTE). The overall effect on the local economy is estimated to be a reduction in employment of approximately 11% (114 FTE). In the context of positive employment outcomes for communities benefiting from mining, this estimated change to employment is quite large.
This water recovery occurred in a community which had moderate population decline (9% since 2001), a decline in employment of 12% in the absence of the Basin Plan, and challenging overall social and economic conditions. The pace and scale of water recovery in the Warren community suggests the modelled outcomes from the recovery of water should be considered in the context of the underlying social and economic conditions. This scale of change in the community might be expected to add to the rate of population decline in Warren.
While the effects of water recovery are still working their way through the Warren community, it is anticipated the water recovery approach in Trangie and Narromine will further impact the Warren community. Prior to the infrastructure improvements in Narromine and Trangie, the schemes did not operate in low water allocation years and water would be sold on a temporary basis to other users. In particular, users in the Warren community. Improvements to the schemes in the Narromine and Trangie communities will allow them to operate during some of the lower allocation years, potentially leading to less water being available for trade. This transfer of production from Warren to the Narromine community might impact further on irrigated production in Warren during those years.
Some water recovery scenarios considered the social and economic effects of a smaller water recovery volume in the Warren community. Under the 320GL B, 320 GL C and 345GL water recovery scenarios, if some water were returned to the consumptive pool, the reduction to the maximum area irrigated was estimated to be 32%, 19% and 30%, respectively. The smaller water recovery volumes would be expected to reduce the pressures on the local economy and
Page 43

Northern Basin Review - Technical overview of the socioeconomic analysis – interim report
community, currently in the processes of dealing with multiple long-term drivers of change, including the drought conditions of 2014-16.
St GeorgeCurrent water recovery in the St George community is estimated to reduce the area irrigated by 8% leading to a fall in employment for the farm and farm-related sector of around 3.3% (23 FTE) and approximately 2.3% (11 FTE) in the other private business sector. With further water recovery, as proposed under the 390GL scenario, the estimated effects include a 23% decline in the area irrigated, a 9.5% (64 FTE) fall in farm and farm-related sector jobs and a 6.5% (31 FTE) drop in employment for the other private business sector. The total fall in employment for the St George community under the 390 GL water recovery scenario is estimated to be around 6.3% (95 FTE). Relative to the employment change associated with positive economic stimuli in other communities, these changes are quite large. They are likely to be further increased when the flow-on effects from water recovery in the Dirranbandi community are taken into consideration.A number of other water recovery were examined as part of this analysis. Those scenarios were proposed to examine the possibility of reducing the social and economic effects in the St George (and Dirranbandi) community while attempting to maximise the potential environmental benefits. The different water recovery volumes for St George and the potential impacts on the maximum area irrigated are presented in Figure B67. Essentially these other water recovery options were estimated to reduce the maximum area of irrigation in the St George community to 12-15% below the level prior to any water recovery. The flow-on employment effects are in the middle of the estimates for the 278 GL and 390 GL water recovery scenarios.
Dirranbandi-HebelWater recovery to date (approximately 20% of the water entitlements) has the effect of reducing the maximum area of irrigation by around 27%. This disproportionate effect is a function of the entitlements recovered and the climate sequence in the modelling period. The flow-on effect from the smaller area of irrigation to the farm and farm-related sector was estimated to reduce employment by 11.8% (27 FTE) and jobs in the other private business sector employment by 9.5% (6 FTE). The current recovery of water included the purchase of all the water entitlements off one of the larger irrigation farms in this community. Dirranbandi and Hebel businesses provided the MDBA with evidence of how such a large, rapid change in the demands for their goods and services placed increased pressure on them to adjust and remain viable.
Additional water recovery under the 390GL scenario is estimated to reduce the maximum irrigated area by 50%, farm and farm-related jobs by 23% (63 FTE) and other private business sector jobs by 18.5% (11 FTE). Across the local economy of Dirranbandi, the potential reduction in jobs during the maximum production periods is estimated to be around 18% (64 FTE). These changes are quite large, particularly when considered in the context of the scale of the employment changes associated with positive economic stimuli, such as from mining in some of the communities examined.
This small, agriculture-dependent community was already challenged by the effects of drought (including the 2014 and 2015 drought) and prevailing economic and social conditions, making it difficult to adjust to significant and quite rapid changes. Underlying (non-Basin Plan) declines in employment were around 11% (30 FTE) in the farm and farm-related sector and 17% (12 FTE) in the other private sector since 2001. These underlying social and economic conditions, combined with the purchase of water entitlements to date should be taken into account when interpreting the community-level modelling results. Given the scale of the effects on the Dirranbandi-Hebel community, the changes in employment would be expected to add to the underlying rate of population decline.
The 320 GL C and 345GL water recovery scenarios propose a smaller volume of additional water recovery. For the 345GL water recovery scenario, the maximum irrigated area would be reduced
Page 44

Northern Basin Review - Technical overview of the socioeconomic analysis – interim report
by 38%, farm and farm-related sector employment by 17% (39 FTE) and other private business sector employment by 13.8% (8 FTE). Under the 320 GL C scenario, the maximum area irrigated is estimated to fall by 43%, farm and farm-related employment by 19.9% (46 FTE), other private business sector employment by 16.1% (9 FTE). However, these changes are still quite large and the flow-on effects to the local community remain significant. For each scenario, some of the impacts of water recovery in the Dirranbandi area are likely to have flow-on effects to the St George community. The potential effects on the St George community are explored further in the sensitivity analysis.
Sensitivity analysis
Groundwater reduction in Wee WaaIrrigated production in Wee Waa is reliant on both surface and groundwater resources. The New South Wales groundwater recovery process finishes in 2017. The reduction in access to groundwater through that process coincides with the surface water recovery process for the Basin Plan, which includes both purchase of water entitlements and the recovery of water as savings arising from infrastructure investment. Across the range of infrastructure projects in the Wee Waa area, farmers are able to retain an average of 30% of the water savings.
From the surface water recovery processes alone, the maximum area of irrigated production is expected to fall by around 6%. Wee Waa residents raised concerns that given the importance of groundwater to maintaining production in dry (low or zero allocation) years, the MDBA should consider the potential effects of the combined changes to surface and groundwater availability. It is estimated the area of irrigated production would be reduced by 20-30% in dry years due to the reduction in groundwater and to surface water under the 390 GL Basin Plan scenario. This is estimated to result in reduced employment in the farm and farm-related sector as indicated by the differences between the yellow line (surface water recovery alone) and black line (surface water recovery plus groundwater recovery; Figure 4). As a consequence, the flow-on effects to employment in the farm and farm-related sector in dry years is a further reduction from 2.5-3% up to 4.5% (Figure 4) and from 2% to 3.5% for the other private business sector (Figure 5).
Figure 4: Impact of 390 GL water recovery scenario on farm and farm-related jobs in Wee Waa
Page 45

Northern Basin Review - Technical overview of the socioeconomic analysis – interim report
Figure 5: Impact of 390 GL water recovery scenario on other private business sector jobs in Wee Waa
All Namoi catchment water recovery from the Wee Waa communityIn examining the water recovery scenarios, it was possible to assign the current water recovery to the communities where the recovery had occurred. For any water recovery scenario where the volume of proposed water recovery exceeded this volume, it was assumed the additional recovery would be spread across the communities of each catchment in proportion to the entitlements held by irrigators. In the Namoi catchment, the additional water recovery beyond the existing purchase of entitlements and investment in infrastructure was assigned on a proportional basis to Gunnedah, Boggabri, Narrabri, Wee Waa and Walgett.
During the consultations, the Wee Waa community requested an examination of the potential effects if all the proposed remaining water recovery in the Namoi catchment was derived from just the Wee Waa community. Using the 390 GL water recovery scenario, it was estimated there would be a 6% decrease in the maximum area of irrigation with recovery spread proportionally across the Namoi communities. If the remaining recovery is all from Wee Waa, the estimated effect is a 7% reduction in the maximum area irrigated for that community.
Effect of Collarenebri water recovery on the Moree community
With the 390 GL water recovery scenario, the expected impact on the Moree community is an 8% reduction in the maximum area irrigated. This is a discernible level of impact with estimated effects on employment of 3-4% in the farm and farm-related sector and 1.5-2.5% in the other private business sector. The relatively small transfer of impact from irrigated production to the farm and farm-related sector is a consequence of the community’s high dependence on dryland cropping.
When the effect of water recovery in the Moree community is considered on its own, the modelling most likely under-estimates the impacts on the farm and farm-related and other private business sector. At least some of the people identified as being employed in Moree would have had their jobs tied to irrigated production in Collarenebri. To address the potential under-estimation of employment impacts in Moree when considering only changes in the area irrigated in Moree, some of the impact of the decreased area of production in Collarenebri is transferred to the Moree community. For this sensitivity analysis, the effects of transferring either 30% or 60% of the reduced irrigation area in Collarenebri to the Moree community was examined.
Page 46

Northern Basin Review - Technical overview of the socioeconomic analysis – interim report
In the case where 30% of the reduced irrigation area in Collarenebri is transferred to the Moree community, the estimated effect on employment is a reduction in farm and farm-related employment of 4-5.5% using the 390GL water recovery scenario (75-105 FTE; Figure 6). In the other private business sector, the potential reduction is around 3% (55-65 FTE) in employment (Figure 7). The total effect on the economy is a decline in employment of around 3% (130-170 FTE). This is up from 75-95 FTE as the estimated impact of the 390GL water recovery in Moree on its own.
For the case of transferring the employment effects from 60% of the reduced irrigation area in Collarenebri to Moree, there is estimated to be a 5-7% (90-130 FTE) impact on the farm and farm-related sector, and 5% (75-95 FTE) impact on the other private business sector. The estimated effect on total employment is around a 4-4.5% reduction in the Moree community workforce. Given the prevailing economic and social conditions, the results suggest the overall effects of water recovery in the Gwydir catchment are likely to have an identifiable effect on the Moree community.
Figure 6: Impact of 390 GL water recovery scenario on farm and farm-related jobs in Moree
Figure 7: Impact of 390 GL water recovery scenario on other private business sector jobs in Moree
Page 47

Northern Basin Review - Technical overview of the socioeconomic analysis – interim report
Effect of Dirranbandi water recovery on St GeorgeSt George businesses, particularly those businesses providing direct inputs to agriculture, described their relationships with the irrigation sector in Dirranbandi during the community consultation processes. As a consequence, water recovery in Dirranbandi is expected to have a flow-on effect to some St George businesses.
A sensitivity analysis was undertaken to indicate how the potential effects of the water recovery process in Dirranbandi might be impacting on businesses and employment in the St George community. The sensitivity analysis considered the effects of transferring 20% and 40% of the water recovery in Dirranbandi-Hebel through to the St George community.
Using the 390GL water recovery scenario, if one-fifth of the reduction in Dirranbandi irrigation flows through to the supporting businesses in St George, it is estimated the effects on employment in the farm and farm-related sector in St George might be reduced by 10-16% (70-100 FTE; Figure 8). For the other private business sector, the estimated impact on employment is around 9% (35-43 FTE; Figure 9). Across the community, the estimated effect is a fall in total jobs of around 9% (105-145 FTE). These estimated changes are quite large.
These estimates should be considered relative to the effects of the 390GL water recovery for St George (without the flow-on effects from Dirranbandi) of 9.5% (50-70 FTE) for the farm and farm-related sector, 6.5% (25-33 FTE) for the other private business sector and 6.3% (around 100 FTE) for total employment. If more of the Dirranbandi-Hebel water recovery flows through to the St George businesses, the potential effects on employment would be significant.
Figure 8 Impact of 390 GL water recovery scenario on farm and farm-related jobs in St George
Page 48

Northern Basin Review - Technical overview of the socioeconomic analysis – interim report
Figure 9 Impact of 390 GL water recovery scenario on other private business sector jobs in St George
Effect of on-farm irrigation infrastructure investment on employmentWhile it was recognised water recovery through on-farm irrigation infrastructure investment might bring forward the long-term investment decisions of irrigators and improve landholder flexibility with respect to the types and frequency of crops grown, there may be other consequences to consider. In particular, modern water delivery systems might reduce the labour requirements associated with the pre-investment watering practices.
Assuming 5% of a community’s water is recovered through infrastructure investment and the community has a maximum area irrigated of 60,000 hectares with 40 people employed full-time for 18 weeks to water the crops, the expected change in employment is likely to be quite small. For the properties where the new water delivery is installed, experience to date indicates the requirements for watering labour might fall by 75%. The effect might be significantly greater if all operators were to adopt the more efficient delivery system.
Interpreting the modelling resultsThe modelling of changes to the maximum area irrigated and employment provided a consistent way of identifying the effects of water recovery across the communities examined. In particular, the jobs modelling was able to distinguish the different structure within each local economy. By delineating the local economic structure, it was possible to prepare a baseline of change for the period 1999-2000 to 2013-14 as if there were no Basin Plan and then estimate the effect of the Basin Plan water recovery, noting the water recovery interacts with all the other drivers of change across the period.
While the baseline of employment change is important for communities not affected by the Basin Plan and those with smaller effects of water recovery, it is essential for helping to interpret the modelling results for the more adversely affected communities. That is using information on the underlying changes in employment (Table 13) together with the social and economic trend data plus the method, volume and pace of water recovery to interpret the model outputs.
In Moree, the underlying changes to employment are estimated to be five times greater than the effects of the Basin Plan water recovery. That is not to say the water recovery effects are not
Page 49

Northern Basin Review - Technical overview of the socioeconomic analysis – interim report
significant. Rather, they are occurring in a community under considerable pressure from other long-term drivers of change. Conversely, for Dirranbandi-Hebel, the underlying re-structure of the local economy had led to considerable change. The Basin Plan effects are estimated to be twice the size of those previous effects. For Warren, the effects of water recovery and the underlying changes are both significant and of similar magnitude. For the other communities, Bourke and Wee Waa are similar to Moree, where effects from the Basin Plan are a proportion of underlying changes. Collarenebri, St George and Trangie are estimated to have similar levels of effect from the Basin Plan and the other drivers of change. For Narromine, the positive effects on employment from the other drivers of change are approximately three times greater than the effects of water recovery.
The general social and economic conditions indicate the challenges for communities in adapting to the aggregate set of changes. These pressures and effects have been further influenced by the pace and scale of recovery. For Warren, Collarenebri, Dirranbandi-Hebel and to some extent Moree, a considerable volume of the recovery occurred over a short period of time. For businesses in the farm-related and other private business sector, there was a significant and immediate effect on their operations. Businesses were able to demonstrate these immediate effects on their turnover, margins and staffing. Businesses further indicated why it would take them two to five years to adapt to large changes in the demands for their goods and services.
Page 50

Northern Basin Review - Technical overview of the socioeconomic analysis – interim report
Table 13 Changes to total employment with and without the Basin Plan
Community Change in FTE jobs (no BP)
Change in FTE jobs due to BP (390 GL scenario)
Bourke -135 -15% -26 -3.0%Collarenebri -90 -36% -54 -20.8%Dirranbandi-Hebel -33 -9% -64 -18.0%Moree* -850 -15% -151 -2.9%Narromine +220 +14% -56 -3.3%St George** -120 -7% -137 -10.9%Trangie -30 -12% -18 -3.8%Warren -138 -12% -114 -10.9%Wee Waa -250 -18% -33 -2.7%
*Moree effects include transfer of part of the water recovery from Collarenebri**St George effects include transfer of part of the water recovery from Dirranbandi
Page 51

Northern Basin Review - Technical overview of the socioeconomic analysis – interim report
Potential indirect benefits of water recovery for floodplain grazingPasture growth and the profitability of floodplain grazing systems depend on local rainfall. Those outcomes can be dramatically enhanced by periodic overbank flows. With supplementary rain, a single flood event can sustain pasture and production for between one and two years. As a consequence, the recovery of water and regaining of some of the lost overbank flows has the capacity to benefit the environment and some floodplain graziers.
As part of the social and economic analysis for the Northern Basin Review, the MDBA has examined the potential benefits of different water recovery scenarios on the graziers of the Lower Balonne floodplain.
The Lower Balonne Floodplain is the area south of Dirranbandi around the Narran, Bokhara, Birrie and Culgoa Rivers (Figure 10).
Figure 10: Lower Balonne floodplain
In the past three decades, the frequency and size of overbank flows in this area has declined because of unfavourable weather conditions and upstream development leading to increased diversions by irrigation entitlement holders.
Page 52

Northern Basin Review - Technical overview of the socioeconomic analysis – interim report
Approach to modelling potential outcomes for floodplain graziersThrough consultation with farmers from the Lower Balonne floodplain, the MDBA developed a simulation model linking seasonal water availability, from rainfall and overbank flows, to the number of sheep and cattle grazing on the floodplains and the profits earned from farming. The data and information underlying the model has been drawn from historical measurements of rainfall, gauged and modelled stream flows, stock numbers, and on-going consultation with landholders.
To reflect the diversity and complexity of floodplain grazing systems including the different management decisions of graziers, a number of farm enterprise models were developed. This approach was necessary given the paucity of information on the areas inundated from previous flooding events and on the pasture response to flooding. Consultation with the graziers highlighted differences in their responses to changes in water availability with the assumptions underpinning the simulation being guided by local expert opinions.
The differences in management decisions had important implications for the modelling. For example, as water availability declines some graziers may destock all livestock while others may reduce stock and increase their supplementary feeding. Similarly, as water availability increases graziers may choose to increase stock levels through breeding, re-stocking or agistment. Essentially when examining the effects of water recovery, the simulation model uses the climate sequence to estimate the production and profit outcomes for the different types of enterprises when combined with outputs from the hydrology models which indicate the size, timing, frequency and duration of flow events. In using the simulation model, the aim is to develop a baseline of production and profitability then estimate the potential benefits from the water recovery.
ResultsResults are presented as carrying capacity (stock numbers per hectare) and earnings per hectare for a 'with development' (or baseline) scenario, the water recovery scenarios and a 'without development' scenario. Stock numbers are given as Dry Sheep Equivalents (DSE) per hectare.1 Results for the 'without development' scenario (earnings and DSE estimates) assume no diversions by irrigators around St George and Dirranbandi.
Farm enterprise and resultsResults presented are based on a combination of farm enterprises with differences in supplementary feeding, stock mix and soil mix. Assumptions underpinning these results include equal numbers of supplementary and non-supplementary feeding farms, equal mix of stock type, and a soil mix that represents the floodplain as a whole. However, different combinations of soil types and management decisions are likely to influence the production and profitability estimates. For instance stock mix is a more determinant factor on properties that use supplementary feed than on those without. As a general trend, the properties that have the greatest differences are generally twice the average effect of the average result. The minimum difference properties will have zero difference between scenarios as they are not flood affected.As an example the model with settings of half red soil, half cattle and half agistment, that does not use supplementary feed will increase average annual stock from 0.377 DSE per hectare in baseline scenario to 0.402 DSE per hectare in the 390GL scenario. In contrast, a property with 90% black soil, with only sheep, that uses supplementary feed will increase average annual stock from 0.466 to 0.481 DSE per hectare over the same scenarios.
1 The Dry Sheep Equivalent (DSE) is a standard unit used to compare the feed requirements of different classes of stock or to assess the carrying capacity and potential productivity of a given farm or area of grazing land.
Page 53

Northern Basin Review - Technical overview of the socioeconomic analysis – interim report
Annual variability in carrying capacityThe results are presented as outcomes averaged over 100 years.2 However, as Figure 11 shows, the difference in carrying capacity between the baseline and without development scenarios varies significantly year to year depending on the climatic conditions. During periods of drought and years when rainfall is the only source of water, upstream development generally makes little difference to carrying capacity. In contrast, in years when graziers rely on overbank flows, carrying capacity under the baseline scenario may be half that estimated under the without development scenario.
19821983
19841985
19871988
19891990
19911992
19941995
19961997
19981999
20012002
20032004
20052006
20082009
0.0
0.2
0.4
0.6
0.8
1.0
1.2
1.4
1.6
Without Development Baseline
DSE/
ha
Figure 11: Carrying capacity with and without development
Effects of reduced water on floodplain grazingThe 100 year climate sequence until 2009 has three periods. The first 50 years were extremely dry, the second period until the mid-1960s which was much wetter than average, followed by a period from 1965 which was a mix of wet and dry which was generally between the dryer and wetter sequences. Using a shorter period – the 27 years up to June, 2009 – better represents the experiences of existing graziers and the local community. Some points on the floodplain lost more than half of all flow from without development to baseline conditions while other locations lost almost no flow. The 27 year model suggests that there would be an average annual increase in stock numbers from 0.434 DSE per hectare under baseline conditions to 0.509 DSE per hectare under without development (17.31% increase). It also suggests an average annual increase in earnings per hectare from $24.11 to $27.83 (15.436% increase). The model, however, suggests that some farm enterprises will have experienced differences as much as 32.99% per year for stock and earnings over the 27 year model.
Effects of water recoveryThe results of the 100-year model suggest that generally both average carrying capacity and average earnings increase with the volume of water recovered as indicated in Figure 12 and
2 The 100 year period to 2009 represents the longest period for which we have good records of rainfall and gauge data as well as hydrology model results
Page 54

Northern Basin Review - Technical overview of the socioeconomic analysis – interim report
Figure 13. Over the 100-year model current water recovery is expected to raise stock numbers from 0.422 DSE per hectare to 0.430 DSE per hectare (1.97% increase). In comparison, the 320 GL pro-rata and 390 GL scenarios increases stock numbers to 0.437 and 0.440 DSE per hectare respectively. These figures show the effects of water recovery in the Condamine-Balonne catchment against stock numbers and earnings results. While this is the average impact across the floodplain, analysis suggests some properties receive benefits up to twice the average. Generally, the model suggests those properties with more agistment, with more black soil and that do not use supplementary feeding to cope with less water will have the greatest relative benefits from water recovery. Those properties which are entirely red soil will not receive any benefits from additional flooding.
0 20 40 60 80 100 120 140 160 1800.39
0.4
0.41
0.42
0.43
0.44
0.45
0.46
0.47
0.48
0.49
Baseline
Without Developement
Current water recovery320GL
345GL350GL
320GL pro-rata321GL
390GL415GL
Water Recovery (GL)
DSE/
ha
Figure 12: Water recovery in the Condamine-Balonne and DSE per hectare (100-year model)
Page 55

Northern Basin Review - Technical overview of the socioeconomic analysis – interim report
0 20 40 60 80 100 120 140 160 180 $21.50
$22.00
$22.50
$23.00
$23.50
$24.00
$24.50
$25.00
$25.50
$26.00
$26.50
Without Development
BaselineCurrent water recovery
320GL345GL350GL
320GL pro-rata321GL390GL
415GL
Water Recovery (GL)
earn
ing/
ha
Figure 13: Water Recovery in the Condamine-Balonne and earnings per hectare (100-year model)
SensitivitiesFarm management is highly varied across the floodplain. Some graziers operate an 'agistment only' model while others may not agist animals at all. Graziers also run different proportions of sheep and cattle. Similarly, some owners are more likely to implement supplementary feeding than others during dry periods. Further, the different proportions of red and black soils on floodplain grazing properties affect the ability of graziers to benefit from overbank flows. In summary:
changing the assumptions does not change the broad conclusion that returning water to the Lower Balonne floodplain will generally provide modest benefits across the whole floodplain area in terms of carrying capacity and earnings
depending on soil type and management styles some properties are estimated to relatively benefit up to twice as much as other properties
the decision to provide supplementary feeding increases the carrying capacity under all water recovery scenarios but does not necessarily materially affect earnings
decisions around agistment and mix of sheep and cattle do not affect carrying capacity but do affect earnings under all scenarios.
Page 56

Northern Basin Review - Technical overview of the socioeconomic analysis – interim report
Water recovery and floodplain grazingOver a relatively short period, some points on the Lower Balonne Floodplain lost up to half of all flows, greatly affecting floodplain grazing in the area and the local economy. The floodplain grazing model suggests that over the 27 year period to 2009, stock numbers have been reduced by an average of a fifth and similarly earnings have been affected by an average of 15%. However some properties have experienced reduction in stock and earnings of up to a third. These results estimate the effects of flows over the floodplain as a whole. However decisions regarding the location and the types of entitlement recovered have additional effects on the distribution of benefits. For instance recovery of low-flow licences will benefit the lower floodplain which experiences longer periods without stock and domestic water. Alternatively overland flow and floodplain harvesting licences will extend periods of inundation.By affecting grazing enterprises, changes in flow have also affected local economies. Through the consultations graziers indicated that they source inputs from Brewarrina, Goodooga, Dirranbandi and Lightning Ridge, and will go to Bourke for larger purchases. They engage seasonal workers from the surrounding communities of Goodooga, Brewarrina and Weilmoringle. Because of reduced flows to the floodplain there is less cash flow in these communities, less households on the floodplain itself, a partial shift from permanent to opportunistic grazing, and less seasonal work opportunities; most significantly in the Brewarrina community. Hence, water recovery – only a portion of production lost – will also benefit local communities.The floodplain grazing model developed by the MDBA suggests the Northern Basin Review scenarios can return up to a third of lost stock numbers and earnings. However it also suggests that although more water recovery volume generally produces better results, the type and location of water recovery can also have as a significant impact. For a full description of the results see MDBA, 2016c.
Page 57

Northern Basin Review - Technical overview of the socioeconomic analysis – interim report
The importance of environmental water to Aboriginal people
In 2015-16, the MDBA and the Northern Basin Aboriginal Nations (NBAN) collaborated to conduct research into the importance of environmental water to Aboriginal peoples living in the northern Basin (MDBA 2016d). NBAN is made up of representatives from Northern Basin Nations. The overarching question the research addressed was — how important is environmental watering to your life? To address this question the survey brought together a combination of qualitative and quantitative measures (MDBA 2016d). The framework used for the research enables the importance of environmental water to be considered in relation to six high level categories of Aboriginal life: natural, human, social, physical, financial and cultural capitals (Table 14).
Table 14: The Basin's Aboriginal Capital Assets Framework
Capitals Sayer et al.’s (2007) Original inclusions
Culturally adapted Assets
Water-dependent and culturally sensitive indicators
Natural Biodiversity, ecosystems
Country Seasonal flows of clean water in Country supporting biodiversity
Human Health, education, skills
Wellbeing The condition of the waterways affects mental health and wellbeing
Social Institutional arrangements
Participation Meaningful participation in waterways governance benefits ecology and society
Physical Infrastructure Everyday life Access to healthy waterways in everyday life
Financial Money and funds Livelihoods Customary and other water dependent livelihood and income sources
Cultural Absent Contributions to culture
Active contributions to culture, including participation in ceremony and cultural teaching
Source: MDBA (2016d)
This survey uses a framework comprised of the six “capitals”, (adapted from Sayer et al. 2007), to assess the value of environmental water to Aboriginal people. The Sayer capitals framework (based on five capitals) was modified to include the sixth capital, “cultural capital”. When adapted to reflect Aboriginal life in the Basin, the modified Sayer framework serves as a credible tool for cross-cultural communication between Aboriginal survey respondents and non-Aboriginal audiences including decision-makers.
The capitals interact to define the importance of watering sites which are culturally valued by Traditional Owners. A healthier environment and improved access to and involvement with
Page 58

Northern Basin Review - Technical overview of the socioeconomic analysis – interim report
watering sites by Aboriginal people resulting from environmental water benefits individual and community health and wellbeing. As such, the capitals are a determinant of culturally strong socioeconomic development. (Figure 14).
Figure 14: Environmental watering as the basis for Aboriginal socioeconomic development
The survey was conducted in Dirranbandi, St George and Brewarrina, with respondents representing between 15-30% of the Aboriginal people over age 15 in those communities. 79% of respondents indicated Cultural Authority for the waterway they were referring to in the survey with respect to the importance of environmental water (MDBA 2016d). Having Cultural Authority means they have recognised cultural responsibility and knowledge to make the judgements the survey explored about their Country and their people.
Summary of results
The survey results suggest that a majority of respondents strongly agree environmental water provides value across all Capitals (MDBA 2016d). However, individual communities differ in how they prioritise the capitals most strongly linked to environmental water. The survey showed a very high level of agreement across the communities for the importance of waterways in providing financial capital (through food, medicine or income) and natural capital (the health of native fish, birds and medicine plants). The value of environmental water to Human Capital (health and wellbeing) is also relatively high in all communities. These differences are useful when considering water resource planning priorities, and evaluation and monitoring for sociocultural benefits at community scales.
A large proportion of Aboriginal people in Dirranbandi and St George placed a high degree of importance on the health of local waterways. The proportion increased in Brewarrina, where many people are located within close proximity of the river. There, the Fish Traps continue to be highly valued for Culture and Country and related health and wellbeing, driving a higher valuing of environmental watering across the board.
In Brewarrina and Dirranbandi, respondents placed a high value on environmental water for the biodiversity benefits it can provide (Natural Capital) and its meaning to healthy Country. Social Capital (participation in Aboriginal organisations) had the lowest value rating.
Page 59

Northern Basin Review - Technical overview of the socioeconomic analysis – interim report
Respondents in St George attach a different value to environmental water than Aboriginal people in Brewarrina and Dirranbandi, valuing environmental watering for Financial Capital (through food, medicine and income) most highly.
The survey results clearly show a direct relationship between environmental watering and Aboriginal peoples’ health and wellbeing, which in turn is foundational to culturally appropriate socio-economic development led by Aboriginal people. Such development is essential for its potential contribution to the reduction of poverty, and the social and physical health issues associated with poverty and marginalisation. The Commonwealth Government confirms the association between health and wellbeing and socioeconomic development in both its most recent Commonwealth of Australia, Closing the Gap Report, 2016 (p.47):
“Evidence shows community-led solutions are the most effective. Cultural connections are known to be a key protective factor for robust social and emotional wellbeing. Connections to land, sea, country, family, community and spirituality are key. We need to work together nationally on this but each community will have its own response that will work best for them.”
The Aboriginal sociocultural survey is an important new contribution to understanding Aboriginal peoples’ view that environmental water can improve the health and wellbeing of Aboriginal people in the northern Basin:
… as a pastor I've seen mental health, suicide, cancer with our people. This is a direct result of the state of the water/river. I'm talking about, if you want to bridge the gap you must listen to us.
Survey respondent’s responses to open-ended question 52
The foundational importance of environmental watering to achieving Aboriginal environmental outcomes is its capacity to fuel the flourishing of the other capitals, leading to improved health and wellbeing as a basis for culturally strong and safe socioeconomic development as determined by Aboriginal communities.
When these six categories are considered together, they make a compelling case for the argument that maximising environmental watering in the northern Basin addresses more than environmental concerns and is a positive measure of health and wellbeing for Aboriginal people. Increased volume and improved use of environmental water through complimentary measures may lead to socio-cultural benefits for Aboriginal people.
With respect to the final version of the survey and the final report that this overview summarises, Dr Brenda Dyack (Canberra University) concluded:
Of particular note is that beyond the intention of understanding Aboriginal values attached to environmental watering for planning purposes, this work informs an understanding of the link between environmental watering, improvement of the Capitals and ultimately the improvement of socioeconomic interests. Furthermore, it does this in a way that differentiates what is important in different local communities. This link between environmental watering and overall wellbeing is not surprising given the attachment to Country and the holistic Aboriginal cultural view. The bottom line is that environmental watering makes Aboriginal people better off and they are better off in the ways – the Capitals - indicated by this survey. This is not a small feat given the challenges of ‘Closing the Gap’.
Page 60

Northern Basin Review - Technical overview of the socioeconomic analysis – interim report
NBAN’s interpretation of results
NBAN provided their perspectives on the survey findings:
the survey provides evidence of the ongoing and regular interaction of the surveyed Nations on their valued waterways (mostly rivers) for recreational, cultural, social, spiritual and economic purposes
there is evidence of the essential relationship between environmental watering, natural flows, and cultural and spiritual life
the survey showed that the multiple dimensions of culture include pre-colonial as well as ongoing ways of life − bush tucker, cultural education about concepts such as song lines, story and cultural practices (for example, ‘calling fish’ and walking in Ancestors’ footsteps)
all these elements of cultural life, which are significantly affected by the availability of environmental water for the health of waterways, affirm for Traditional Owners a shared philosophy which includes waterways and all of life
the relationship between water and philosophy of life (or meaning of existence) is essential to Traditional Owners’ sense of belonging, which in the context of structured intergenerational dispossession is fundamental to individual and social health and wellbeing
environmental water has the potential to enable totemic obligations to be carried out, which benefits the environment as well as strengthens social systems including inter-generational continuities of family and inherited kinship responsibilities
when natural flows are interfered with or missing, Country dies and with it Aboriginal culture. In other words, destruction of the waterways through mismanagement results in cultural destruction of a people. Environmental allocations are therefore considered important to help redress this situation and enhance the sociocultural value of waterways to Traditional Owners
while each community is unique, the responses of the communities that were surveyed are illustrative of Aboriginal attitudes across the northern Basin.
ImplicationsAlthough the survey was undertaken in 3 northern basin communities, the findings are a compelling indication of the value of environmental water to Aboriginal people in general. As the results indicate, Aboriginal people across the 3 communities prioritise the capitals quite differently. Yet the key common finding is the level of importance placed on environmental water. Given Aboriginal people make up 20% of the population in the northern basin, the survey results are relevant to understanding the social and cultural benefits of recovering water for the environment.
Prior to undertaking the survey, the MDBA understood that environmental water and healthy ecosystems are important to Aboriginal people. The overall survey findings provide clarity on just how important and which things are of highest priority in the communities surveyed. As NBAN indicated, the health of the river is deeply connected to the health and wellbeing of Aboriginal people.
While this survey is unable to contribute to understanding the differences in the benefits that might be associated with each water recovery scenario, the overall message from Aboriginal people in the northern Basin is that environmental watering is important for their cultural, spiritual and socioeconomic life.
Page 61

Northern Basin Review - Technical overview of the socioeconomic analysis – interim report
Where the health of rivers in the northern Basin is improved by environmental water, there will be benefits for the health and wellbeing of Aboriginal people, which underpins successful socioeconomic development as led by Aboriginal people. Increased volumes of water recovery above 278 GL are expected to lead to improved socio-cultural benefits for Aboriginal people: the greater the volume of water recovery, the greater the socio-cultural benefits. NBAN believes the environmental water allocation for the northern Basin should be 390 GL or higher.
Page 62

Northern Basin Review - Technical overview of the socioeconomic analysis – interim report
Incorporating the social and economic analysis in decision-making
The Authority will use a Triple Bottom Line (TBL) framework for its decision-making in the Northern Basin Review. Results from the community modelling, the floodplain grazing and the Aboriginal sociocultural study all form part of the TBL framework together with environmental indicators. MDBA (2016e) describes the Authority's decision-making process and the components of the TBL framework.
While the Authority had access to all the social and economic analysis during the decision-making process, we derived a number of key indicators to summarise the vast amount of information. The indicators of social and economic outcomes are as follows:
community modelling - average irrigated hectares in dry years and average irrigated hectares in
wet years, expressed as % difference from the baseline scenario- average total jobs in dry years and average total jobs in wet years,
expressed as % difference from the baseline scenario- average farm and farm-related jobs in dry years and average farm and
farm-related jobs in wet years, expressed as % difference from the baseline scenario
- employment in the other private business sector- total employment.
floodplain grazing- average stocking rates and profits per hectare, expressed as a %
difference from the baseline.
Aboriginal sociocultural significance of environmental water- narrative on the social and cultural benefits of different volumes of water
recovery
Page 63

Northern Basin Review - Technical overview of the socioeconomic analysis – interim report
ConclusionThe community-level social and economic analysis presented in this report provides considerable new information to guide the Authority’s recommendation on sustainable diversion limits in the Northern Basin Review. In addition, more detailed information is available for guiding the volume of water recovery in each catchment (which entitlements and where) and the apportionment of the shared water recovery between the states.
On the benefits side, a short-term stimulus has been (and is still being) provided to some communities through the Commonwealth investment in new irrigation infrastructure, as part of the overall water recovery approach. For floodplain graziers, there is the potential for increased environmental flows generated by the water recovery to return around one-third of the production and profits lost as a consequence of up-stream irrigation development. Based on which types of entitlements are recovered in the Lower Balonne, there may be increased reliability of stock and domestic water supplies towards the southern end of that catchment. From the broader social and cultural perspective, Aboriginal people confirmed the value they placed on additional environmental flows. In particular, the increased recovery of water, with a preference of 390 GL or more to be recovered, would lead to social and cultural improvements that would be reflected in community wellbeing.
With respect to the costs of water recovery, the MDBA concentrated on changes in the maximum area of irrigation and employment. In five communities, there was little irrigation and no expected water recovery. However, understanding the economic structure and drivers of change in these communities was fundamental to developing the modelling capability for estimating the effects of water recovery in other communities where irrigation is more important. For the communities with a greater reliance on irrigated agriculture, the modelling capability provided the MDBA with the means for examining the sensitivity of each community to changes in the water recovery volume. That is, to water recovery volumes above and below the 390 GL recovery total or for a re-distribution of water recovery between the catchments.
Seven communities demonstrated quite small effects from water recovery. For Boggabri, Gunnedah, Goondiwindi, Mungindi, Narrabri and Walgett, the effects of water recovery would be difficult to distinguish from the other processes of change affecting those communities. In Brewarrina, it is expected that some benefits would accrue to the community through the expected gains to floodplain graziers in the Lower Balonne.
Across the remaining nine communities, the expected effects of water recovery range from being modest to quite large changes. In Bourke, Moree, Narromine, Trangie and Wee Waa, the effects of water recovery are likely to be modest yet identifiable in the context of all the other changes occurring. For Warren and Collarenebri, the recovery of water occurred some time ago. Although the effects of that recovery are still working their way through those communities, the effects are large and add to substantive changes already occurring for other reasons.
In St George and Dirranbandi, it was possible to describe the effects for the recovery to date and for the scenarios requiring additional water recovery. The effects on St George are quite large and are expected to be even greater for Dirranbandi.
While the modelling approach to support this analysis focuses largely on changes in employment, further information was used to help interpret the modelling results. Job estimates
Page 64

Northern Basin Review - Technical overview of the socioeconomic analysis – interim report
alone would most probably understate the pressures communities face in adapting to multiple drivers of change, including the Basin Plan. The other quantitative data describing the trends of change in social and economic conditions combined with the qualitative information provided by many individuals in the northern basin was essential for interpreting the modelling results.
Page 65

Northern Basin Review - Technical overview of the socioeconomic analysis – interim report
ReferencesAshton, D., Oliver, M. and Norrie, D. 2016, Cotton farms in the Murray-Darling Basin, ABARES
Research Report 16.3, July.
Blackwell, B., McFarlane, J, and Stayner, J. (2016) An independent review of the social and economic modelling inputs to the northern basin review. University of New England, Armidale.
Commonwealth of Australia (2016) Closing the gap: Prime Minister’s Report – 2016.
Cotton Australia 2016, Biotechnology and Cotton in Australia, available at http://cottonaustralia.com.au/cotton-library/fact-sheets/cotton-fact-file-biotechnology viewed 23 August 2016.
Dockery, M (2011) ‘Do traditional culture and identity promote the wellbeing of Indigenous Australians? Evidence from the 2008 NATSISS’. In Boyd Hunter and Nicholas Biddle (Eds), Survey Analysis for Indigenous Policy in Australia: Social Science Perspectives, ANU Press, Canberra
Han, Y and Goetz, S. J. (2015) ‘The economic resilience of U.S. counties during the Great Recession’ in The Review of Regional Studies, Vol. 15 (45), 131-149
KPMG (2016) Northern Basin Community Modelling: Economic assessment of water recovery scenarios [DRAFT]. KPMG, Canberra
KPMG (2011) Review of the MDBA’s socio-economic impact modelling. Report prepared for the Murray-Darling Basin Authority. KPMG, Canberra http://www.mdba.gov.au/kid/files/1719-ReviewOfTheMDBAsSocioEconomicImpactModelling.pdf
MDBA (2016a) Hydrological modelling
MDBA (2016b) The landuse model
MDBA (2016c) Lower Balonne floodplain grazing model report. MDBA, Canberra
MDBA (2016d) Our water, our life – An Aboriginal study in the northern basin, available at http://www.mdba.gov.au/publications/mdba-reports/aboriginal-study-northern-basin .
MDBA (2016e) The Triple Bottom Line framework
Prout, S. (2012) ‘Indigenous wellbeing frameworks in Australia and the quest for quantification’. Social Indicator Research, Vol 109: 317-336
Sayer, J.A., Campbell, B., Petheram, L., Aldrich, M., Perez, M., Endamana, D., Dongmo, Z-L., Defo, L. Mariki, S., Doggart, N. & Burgess, N. (2007) “Assessing environment and development outcomes in conservation landscapes.” Biodiversity and Conservation. DOI 10.1007/s10531-‐006-‐9079-‐9.
Tanton, R. and Vidyattama, Y. (2016) MDBA Community Profiles data extraction. NATSEM, University of Canberra, Canberra.
University of Canberra 2014, Overview of the Regional Wellbeing Survey, http://www.canberra.edu.au/research/collaborations/murray-darling-crn/attachments/pdf/RWS-overview-June-2014.pdf viewed at 14 August 2016
Vinson, T and Rawsthorne, M with Adrian Beavis and Matthew Erison (2015) Dropping off the Edge 2015: Persistent communal disadvantage in Australia. Jesuit Social Services and Catholic Social Services Australia. http://k46cs13u1432b9asz49wnhcx.wpengine.netdna-cdn.com/wp-content/uploads/0001_dote_2015.pdf
Wilkinson, K. P (1991) The community in rural America. Greenwood Press, Westport, Conneticut
Page 66

Northern Basin Review - Technical overview of the socioeconomic analysis – interim report
Page 67

Northern Basin Review - Technical overview of the socioeconomic analysis – interim report
Appendix A: Social and economic conditions and results by communityThis appendix presents community-level results describing expected outcomes for the water recovery scenarios examined by the MDBA. For each community, there is a description of the social and economic conditions across time, a summary of those conditions and the reasons behind the observable changes. Modelling outputs are provided as estimates of change in irrigated area, employment in the farm and farm-related sector and employment in the other private business sector of the communities. These modelling outputs are then considered in the context of the prevailing social and economic conditions in each community.
The social and economic contextual information most relevant for interpreting the modelling results includes:
Changes in population (absolute numbers and percentages) in the communities and major towns of the community areas;
Changes to the structure of the population for people under 45 and over 45 as an indicator of internal pressures on the social structure of communities;
Socioeconomic indices for areas (SEIFA) describe particular elements of social and economic conditions. While care is required when examining SEIFA scores across time, the information is used here to consider where communities are situated relative to other communities in 2006 and 2011;
Total employment and changes in employment by industry; Economic structure in terms of employment in the agriculture sector, government services
and all other sectors; The mix of land use (irrigation, grazing and farming) in each community as an indication
of demands for goods and services from the local economy.
All this information has been used to present a description of community condition. The current conditions of communities will be determined by how they responded to the 2002-03, 2006-09 and 2014-15 droughts combined with other drivers of change (eg. mechanisation, growth in mining, short-term government stimulus, other policy reforms, or particular social and economic changes).
The timing of changes to these social and economic conditions helps to explain the stage of community response to different drivers. These responses and the changing structure of the sectors within each local economy also relates to the changing demands for goods and services within the communities and the changes which are observed.
When considering the potential effects of water recovery in each community, the model outputs will be considered alongside options regarding the volume, timing and type (purchase or invest in infrastructure) of water recovery. These three parameters can influence the economic and social outcomes. In those cases where the water recovery scenarios indicate the likelihood for a large change in irrigated production and employment, the outcomes will consider the potential flow-on effects for long-term changes to the population.
More detailed information on the social and economic conditions in each community is provided in the social and economic condition profiles (and accompanying guide for using the profiles) and the community narratives (provide links).
For information on data sources, see UC data extraction report. Including manufacturing and mining.
Page 68

Northern Basin Review - Technical overview of the socioeconomic analysis – interim report
Appendix B1: BingaraBingara is a small rural centre. In recent times, the tourism industry has become an increasingly important contributor to the local economy. Despite its proximity to the Gwydir, Bingara is surrounded by dryland farms with very little irrigation.
Trends in socio-economic conditions Area population: increased from 1,695 to 1,779 persons (5%) between 2001 and 2011
o Mostly between 2006 and 2011 Town population: varied around 1,100 people between 2001 and 2011 65% of the town population was over 45 in 2011
o 58% in 2001o 5% increase in people aged 45 years or overo 22% decrease in people under 45
Total area workforce: increased from 436 to 510 FTEs (17%) between 2001 and 2011o Mostly between 2001 and 2006.
Agricultural workforce: relatively stable over time (around 195 FTE) Non-agriculture private workforce: decreased 7% (11 FTE) between 2001 and 2011 Government services workforce: increased steadily between 2001 and 2011
o Increased by 81% (74 FTE) Economic structure:
o 2001: 43% agriculture, 37% non-agriculture private, 21% government serviceso 2011: 38% agriculture, 30% non-agriculture private, 32% government services
Unemployment in the town: 7% in 2011 SEIFA for town:
o 2011: decile 2 for economic resources, disadvantage, advantage and disadvantage; 3 for education and occupation
o 2006: decile 1 for advantage and disadvantage
Grazing is the dominant form of agriculture for the community with a small area of irrigation (Figure B1).
Figure B1: Land use in Bingara
Source: ACLUMP data
Summary of social and economic conditionFor a small rural community, Bingara has recently experienced positive changes in relation to the population and employment, both of which have increased since 2001. Part of the changes, particularly since 2006, have been a broadening of the local economy with growth in government services and tourism. The proportion of people in the community and type of landuse in the area are likely to contribute to the rates of change observed for Bingara. Challenges for the community adapting to changes in the longer term are indicated by the decile scores for the general measure of economic and social condition.
Page 69

Northern Basin Review - Technical overview of the socioeconomic analysis – interim report
Modelling resultsThe baseline community modelling for Bingara suggests almost no change in the farm and farm-related sector for the period out to 2013-14. The number of jobs in the farm and farm-related sector is estimated to decrease by 3% (5 FTE). For the other private business sector, the number of jobs is estimated to increase by 9% (12 FTE) (Figure B2).
Figure B2: Modelled baseline for employment in Bingara
ImplicationsThe model results suggest that farm and farm-related employment is stabilised by the high degree of dependence on grazing. This is consistent with the observed data from the census years. The relatively large proportion of the population over 45 and growing employment in government services are important contributors to the changes observed for the other private business sector. Diversification within the local economy, through increased government services and tourism, has slightly reduced the dependence on agriculture. The changes observed in Bingara are not a common observation for small rural communities.
Page 70
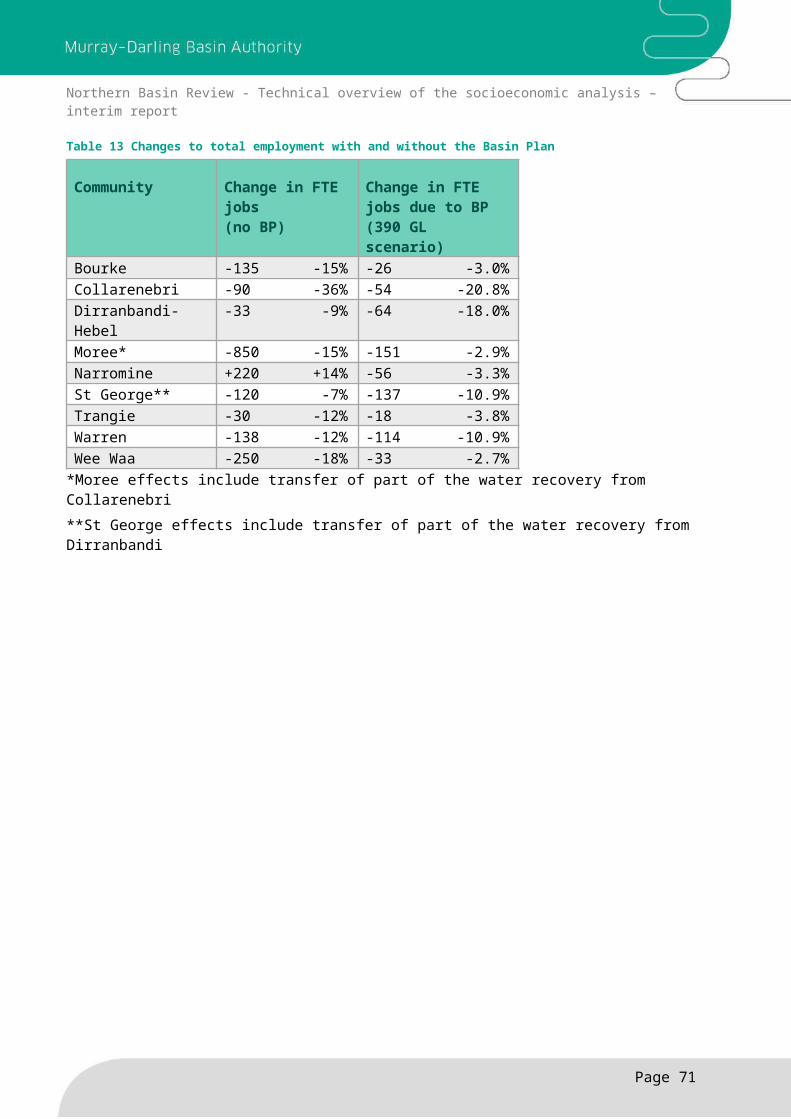
Northern Basin Review - Technical overview of the socioeconomic analysis – interim report
Appendix B2: BoggabriBoggabri is a small town between Gunnedah and Narrabri servicing agriculture and mining.
Trends in socio-economic conditions Area population: decreased from 1,524 to 1,398 persons (12%) between 2001 and 2011
o Mostly between 2006 and 2011. Town population: fluctuated around 850 people between 2001 and 2011 45% of the town population was over 45 years in 2011
o 43% in 2001o 12% increase in people aged 45 years or oldero 4% increase in the people under 45
Total area workforce: fairly stable (about 420 FTE) between 2001 and 2011 Agricultural workforce: decreased by 54% (73 FTE) between 2001 and 2011
o Mostly between 2006 and 2011 Non-agriculture private workforce: increased by 55% (124 FTE) between 2001 and 2011
o mostly between 2006 and 2011o 72 FTE in mining for 2011, up from 25 FTE in 2006
Government services workforce: increased by 54% (30 FTE) between 2001 and 2011 Economic structure:
o 2001: 55% agriculture, 31% non-agriculture private, 13% government serviceso 2011: 28% agriculture, 51% non-agriculture private, 21% government services
Unemployment in the town: 14% in 2011 SEIFA for town:
o 2011: decile 2 for economic resources, disadvantage, advantage and disadvantage, education and occupation
o 2006: decile 1 for disadvantage and advantage and disadvantage
Land around Boggabri supports a mix of dryland farming, grazing and irrigated production (Figure B3). The maximum potential area for irrigation is 7% of the total land used for agriculture, relying on both surface and groundwater. Cotton is the dominant irrigated crop, with small areas of pasture, cereals and other broadacre crops.
Figure B3: Land use around Boggabri
Source: ACLUMP data
Summary of social and economic conditionLarge structural changes occurred in the community and economy of Boggabri mostly between 2006 and 2011. The decline in population outside the township of Boggabri coincided with major job losses in the agriculture sector. These losses were offset by jobs growth in the non-agriculture private sector and government services sector. In the absence of those positive off-setting improvements in the local economy, the general social and economic conditions indicate
Page 71

Northern Basin Review - Technical overview of the socioeconomic analysis – interim report
the Boggabri community would have been challenged to adapt to major changes. Interpretation of the modelling results (changes to employment) may need to be reviewed, depending upon the level and pace of water recovery and the underlying trends in social and economic condition.
Water recovery scenariosPrior to water recovery, irrigators around Boggabri had access to 4 GL and 18 GL of groundwater of surface water. With water recovery to date, irrigators around Boggabri have sold around 1% of their entitlements under the Basin Plan. Other scenarios see up to a 9% reduction in water available to irrigators in the area (Table B1). None of the water recovery scenarios includes investment in infrastructure.
Table B1: Water recovery scenarios examined for the Boggabri community
Scenario Reduction in surface water available to irrigators 278 1%320 A 5%320 B 5%320 C 5%345 7%350 7%390 7%415 9%
Modelling resultsThe landuse modelling for Boggabri takes into account general security on and off-allocation surface water diversions and groundwater use. The decline in surface water availability is estimated to have modest effects on the total area irrigated from surface and groundwater (Figure B4). Under the 415 GL scenario, the largest water recovery scenario modelled, the area irrigated is estimated to fall by around 6% in high production years. Irrigated hectares in the 278 GL scenario are up to 1% lower than baseline levels across all years.
Figure B4: Irrigated hectares under water recovery scenarios in Boggabri
Page 72

Northern Basin Review - Technical overview of the socioeconomic analysis – interim report
The baseline community modelling for Boggabri estimates a decline in employment for the farm and farm-related sector (including seasonal workers) is around 30% (70 FTE) in the absence of the Basin Plan. For the other private business sector there is an increase in jobs of around 6% (7 FTE).
Figure B5: Modelled baseline employment in Boggabri
The flow through effect on employment in the farm and farm-related and other private business sectors from the water recovery scenarios examined are quite small (figures B6 and B7). That is around 2 FTE in the farm and farm related sector, approximately 1 FTE in the other private business sector. Note: the employment effects are greatest in wetter years (where there is a significant reliance on seasonal workers). In total, the effects of water recovery under the 415 GL scenario total less than 5 FTE (out of a total workforce of approximately 500 FTE).
Figure B6: Farm-related employment under water recovery scenarios in Boggabri
Page 73

Northern Basin Review - Technical overview of the socioeconomic analysis – interim report
Figure B7: Other private business employment under water recovery scenarios in Boggabri
Largest effect: 415 GL scenario – 6% reduction in maximum area, 1.2% reduction in farm and farm-related jobs, 0.6% decrease in other private business jobs, 0.6% decrease in total jobs.
ImplicationsIf water recovery in the Boggabri community does not exceed the scenarios modelled, the effects on the community are expected to remain quite small and difficult to detect. If a significantly higher level of water recovery is considered, it would be necessary to consider the volume, timing and method of water recovery in the context of the challenging underlying social and economic conditions.
Page 74

Northern Basin Review - Technical overview of the socioeconomic analysis – interim report
Appendix B3: BourkeBourke is a service centre for a large grazing area in northwest NSW.
Trends in socio-economic conditions Area population: decreased from 2,920 to 2,262 persons (23%) between 2001 and 2011
o Mostly between 2001 and 2006 Town population: decreased from 2,556 to 2,046 persons (20%) between 2001 and 2011
o Mostly between 2001 and 2006 35% of the town population was over 45 in 2011
o 28% in 2001o 2% decrease in people aged 45 years and overo 27% decrease in people under 45
Total area workforce: decreased from 941 to 777 FTE (17%) between 2001 and 2011o Mostly between 2001 and 2006
Agricultural workforce: declined by 40% (126 FTE) between 2001 and 2011o Mostly between 2001 and 2006
Non-agriculture private workforce: decreased by 23% (69 FTE) between 2001 and 2011o Mostly between 2001 and 2006o 20 FTE in mining plus manufacturing
Government services workforce: increased by 17% (49 FTE) between 2001 and 2011 Economic structure:
o 2001: 37% agriculture, 32% non-agriculture private, 31% government serviceso 2011: 26% agriculture, 30% non-agriculture private, 44% government services
Unemployment in the town: 7% in 2011 SEIFA for town:
o 2011: decile 8 for education and occupation; 4 for advantage and disadvantage; 3 for disadvantage; 2 for economic resources
o 2006: decile 7 for education and occupation; 5 for advantage and disadvantage; 2 for disadvantage; 1 for economic resources
Grazing dominates Bourke's economy (Figure B8). 3% of agricultural land is used for irrigation. Cotton is the dominant irrigated crop. However in the early 2000s, Bourke’s irrigated production included grapes, horticulture, vegetables and cereals.
Figure B8: Land use in Bourke
Source: ACLUMP data
Summary of social and economic conditionSignificant changes to the Bourke economy and community arose in the period 2001-06, coinciding with the 2002-03 drought and initial period of significantly reduced flows associated with new upstream irrigation developments. There has been relative stability in the population
Page 75

Northern Basin Review - Technical overview of the socioeconomic analysis – interim report
and employment since that time. The overall social and economic conditions in the community and the internal processes for promoting development (described in the narrative) indicate the estimates of change provided from the community modelling might best represent the potential changes in employment arising from the recovery of water. However, it will be important to take account of the timing, scale and method of existing and further water recovery when considering the modelling results.
Water recovery scenariosPrior to the Basin Plan, irrigators around Bourke had access to 100 GL of water. To date, 17% of Bourke's water has been purchased by the Australian Government (Table B2). Other scenarios see up to a 20% reduction in water available to irrigators in the area. Water recovery is less under the 320 B, 350 GL, 390 GL and 415 GL scenarios than recovery to date, as water recovery in these scenarios is distributed differently across the other catchments.
Table B2: Water recovery scenarios examined in the Bourke community
Scenario Reduction in water available to irrigators 278 17%320 A 17%320 B 7%320 C 20%345 20%350 15%390 15%415 15%
Modelling resultsLanduse modelling for Bourke is based on diversions from unregulated flows in the Barwon-Darling. The decline in water availability is estimated to have a substantive impact on the maximum area of irrigation in the Bourke community (Figure B9). With the current water recovery, the estimated decline in the maximum area of irrigation is around 13%.If the water recovery volume is reduced relative to recovery to date (as in the 350 GL, 390 GL and 415 GL water recovery scenarios) the impact on the maximum area of irrigation is expected to be smaller. For two scenarios (320 GL C and 345 GL) the water recovery may be increased. If that increased water recovery volume (relative to current recovery) is through infrastructure investment, the estimated effects on the maximum area of irrigation remain around 13%. Should the additional water recovery be through the purchase of entitlements, it is estimated the maximum area of irrigation would be reduced by approximately 15%.
Page 76

Northern Basin Review - Technical overview of the socioeconomic analysis – interim report
Figure B9: Irrigated hectares under water recovery scenarios in Bourke
The baseline community modelling for Bourke estimates a decline in the farm and farm-related sector in the absence of the Basin Plan of around 37% (220 FTE) across the period since 2000-01. For the other private business sector, the underlying employment change is around 22% (60 FTE).
Figure B10: Modelled baseline employment in Bourke
The flow-through effect on employment in the farm and farm-related is estimated to be between 6-10% for the 278 GL scenario (Figure B11). The large percentage effect in the latter years of the modelling period is a function of the water recovery and the scale of reduced employment in this sector. The effect on the number of jobs ranges from approximately 15-22 FTE across the period. Under each of the other water recovery scenarios examined (except the 320 GL B scenario), the effect on employment is a small variation around the results for the 278 GL scenario. With a reduced level of water recovery, as proposed in the 320 GL B scenario, the effect on employment in the farm and farm-related sector is reduced to approximately 2-3%.
Page 77

Northern Basin Review - Technical overview of the socioeconomic analysis – interim report
Figure B11: Farm-related employment under water recovery scenarios in Bourke
For the other private business sector, the effect on employment is considerably smaller than the estimated changes in the farm and farm-related sector (Figure B12). This is partly a function of the small size of the irrigation sector and of the farm and farm-related sector as a whole in the local economy. Under the 278 GL scenario, the effect on employment in this sector is around 2-3.5% (less than 10 FTE).
Figure B12: Other private business employment under water recovery scenarios in Bourke
Largest effect: 320 GL C scenario – 15% reduction in maximum area, 1.1% reduction in farm and farm-related jobs, 0.6% decrease in other private business jobs, 0.6% decrease in total jobs.
ImplicationsWhile the water recovery scenarios examined (apart from the 320 GL B scenario) will have an identifiable effect on the maximum area irrigated and employment in the farm and farm-related sector, the overall effect on the local economy is not likely to be readily identifiable relative to other changes which are occurring, even given the current social and economic conditions.
Page 78

Northern Basin Review - Technical overview of the socioeconomic analysis – interim report
Appendix B5: ChinchillaChinchilla is a service centre for agriculture and mining.
Trends in socio-economic conditions Area population: increased from 4,889 to 6,841 persons (40%) between 2001 and 2011
o Mostly between 2006 and 2011. Town population: increased from 3,366 to 4,779 persons (42%) between 2001 and 2011
o Mostly between 2006 and 2011. 37% of the town population over 45 in 2011
o 41% in 2001o 29% increase in people aged 45 years or over o 51% increase in people under 45
Total area workforce: increased from 1,618 to 2,748 FTEs (70%) between 2001 and 2011o Mostly between 2006 and 2011
Agricultural workforce: decreased by 7% (41 FTE) between 2001 and 2011o Mostly between 2001 and 2006
Non-agriculture private workforce: increased 267% (1,099 FTE) between 2001 and 2011o Mostly between 2006 and 2011o Manufacturing jobs stable around 100 FTE, mining jobs increased from 17 FTE in
2001 to 303 FTE in 2011 Government services workforce: increased by 21% (72 FTE) between 2001 and 2011
o Mostly between 2006 and 2011 Economic structure:
o 2001: 39% agriculture, 41% non-agriculture private, 21% government serviceso 2011: 21% agriculture, 64% non-agriculture private, 15% government services
Unemployment in the town: 4% in 2011 SEIFA for town:
2011: decile 5 for education and occupation; 7 for economic resources; 8 for disadvantage, and advantage and disadvantage
2006: decile 6 for disadvantage and advantage and disadvantage
Chinchilla's farm sector is diverse with significant dryland farming and grazing as well as some irrigated agriculture (Figure B15). Irrigation includes some small and quite variable areas of horticulture, irrigated pasture, cereals and irrigated cotton (average area was around 1,200 hectares with a range of 200-3,000 hectares).
Figure B15: Land use in Chinchilla
Source: ACLUMP data
Summary of social and economic conditionSignificant growth in the town and community population of Chinchilla was associated with the growth in the mining sector. The positive effects are further indicated by the change in the age structure of the population and substantial growth in the non-agriculture private sector. These
Page 79

Northern Basin Review - Technical overview of the socioeconomic analysis – interim report
changes together with the low unemployment rate and high decile scores across the four SEIFA measures suggest strong social and economic conditions, and reasonable capacity for adapting to change.
Modelling resultsThe baseline community modelling for Chinchilla estimates a decline in employment for the farm and farm-related sector of around 15% (100 FTE) across the period from 2000-01 (Figure B16). In the other private business sector (which excludes the mining and manufacturing jobs) employment grew by approximately 50% (400 FTE).
Figure B16: Modelled baseline of employment in Chinchilla
The modelling results indicate changes in farm and farm-related employment consistent with climatic conditions and the general change for this sector. However, the change for the farm and farm-related sector in Chinchilla is not as large a decline as has been observed in other communities. There is expected to have been an additional decline in farm and farm-related jobs during the drought of 2014 and 2015. However, the growth of mining in the area, particularly post 2006, coincided with growth in other parts of the economy. This represented a dominant off-setting influence on employment in the other private business sector.
ImplicationsChinchilla is an example of a northern Basin community where growth of the mining sector has dominated the changes in social and economic conditions. The 2016 census data will provide further information for describing the rate of change across the period from 2011, particularly the slowdown in economic activity during the last two years, as described in the narrative.
Page 80

Northern Basin Review - Technical overview of the socioeconomic analysis – interim report
Appendix B6: CollarenebriCollarenebri is a very small agriculture-dependent community in northwest NSW.
Trends in socio-economic conditions Area population: decreased from 852 to 542 persons (36%) between 2001 and 2011
o Mostly between 2006 and 2011. Town population: decreased from 520 to 387 persons (26%) between 2001 and 2011
o Mostly between 2006 and 2011. 42% of the town population was over 45 in 2011
o 36% in 2001o 13% decrease in people aged 45 years or overo 33% decrease in people under 45
Total area workforce: decreased by 37% (120 FTE) between 2001 and 2011o Mostly between 2001 and 2006.
Agricultural workforce: declined by 42% (81 FTE) between 2001 and 2011 Non-agriculture private workforce: declined by 68% (50 FTE) between 2001 and 2011
o Mostly between 2001 and 2006 Government services workforce: stable across 2001 to 2011 (55 FTE) Economic structure:
o 2001: 60% agriculture, 23% non-agriculture private, 18% government serviceso 2011: 62% agriculture, 11% non-agriculture-private, 26% government services
Unemployment in the town: 13% in 2011 SEIFA for town:
o 2011: decile 1 for economic resources, disadvantage, advantage and disadvantage; 4 for education and occupation
o 2006: decile 2 for advantage and disadvantage; 3 for education and occupation Collarenebri's agriculture economy was centred on dryland farming and irrigated crops (Figure B17). Cotton was the dominant irrigated crop, with some cereals and summer crops.
Figure B17: Land use in Collarenebri
Summary of social and economic conditionChanges in employment preceded the significant reduction in population for Collarenebri, noting the majority of people leaving the community were from outside the town of Collarenebri. The estimates of general social and economic conditions, including the population decline for those both over and under 45, indicate a limited capacity for the community to respond and adapt to the pace and scale of change associated with the recovery of water. Interpretation of the modelled estimates of changes on employment will need to take into account the underlying social and economic conditions as well as the volume and timing of the water recovery.
Page 81
Northern Basin Review - Technical overview of the socioeconomic analysis – interim report
Water recovery scenariosPrior to water recovery, irrigators around Collarenebri held entitlements to 46 GL of surface water from the Barwon-Darling and the Gwydir. To date, the Commonwealth has purchased 66% of the water entitlements held by the Collarenebri community (Table B3). None of the scenarios modelled have proposed further water recovery from this community.
Table B3: Water recovery scenarios examined for the Collarenebri community
Scenario Reduction in water available to irrigators278 66%320 A 66%320 B 66%320 C 66%345 66%350 66%390 66%415 66%
Modelling resultsThe landuse modelling for Collarenebri takes into account the general security on and off-allocation entitlements held by irrigators and all sources of unregulated water in the community area. Most of the current water recovery occurred across the period 2009-2011. The effect of that recovery is estimated to have reduced the maximum area of irrigation by around 83% (Figure B18).
Figure B18: Irrigated hectares under water recovery scenarios in Collarenebri
The baseline community modelling for Collarenebri estimates a decline in employment for the farm and farm-related sector in the absence of the Basin Plan of approximately 40% (105 FTE;
Page 82

Northern Basin Review - Technical overview of the socioeconomic analysis – interim report
Figure B19). Underlying decline in jobs for the other private business sector is estimated to be around 43% (20 FTE).
Figure B19: Modelled baseline employment in Collarenebri
The flow-through effect on employment from the recovery of water in Collarenebri area is quite large. For the farm and farm-related sector, the effects of water recovery range from 10% (15-20 FTE) in dry years, where there are few seasonal workers employed, up to a 35% decline in the maximum production years (Figure B20). Given the underlying changes in employment, this represents approximately 85 FTE in 2000-01 and 50 FTE in 2012-14.
Figure B20: Change in farm-related employment under water recovery scenarios in Collarenebri
In the other private business sector, the effects of the 278 GL scenario are estimated to reduce employment by between 7% and 27% (Figure B21). The strong flow through effect is a consequence of the relative importance of irrigated production to the Collarenebri community and the small size of the other private business sector, with around 30 FTE in 2013-14.
Page 83

Northern Basin Review - Technical overview of the socioeconomic analysis – interim report
Figure B21: Other private business employment under water recovery scenarios in Collarenebri
Largest effect: 83% reduction in maximum area, >28% reduction in farm and farm-related jobs, >21% decrease in other private business jobs, >21% decrease in total jobs.
ImplicationsThe large effects of water recovery in Collarenebri occurred as other substantive underlying social and economic changes affected the farming area and township. Overall social and economic conditions indicate the size of the challenge for the community adapting to the significant impact of water recovery over a very short period of time. Even though the modelled estimates of the impact on employment are large, it is possible given the underlying social and economic conditions, that the model estimates of impact may be under-stated.
Page 84

Northern Basin Review - Technical overview of the socioeconomic analysis – interim report
Appendix B7: CoonabarabranCoonabarabran is a small yet diverse rural economy, located on the Newell Highway in close proximity to Warrumbungle National Park.
Trends in socio-economic conditions Area population: decreased from 4,915 to 4,583 persons (7%) between 2001 and 2011
o Decrease of 8% between 2001-06, small increase 2006-11 Town population: decreased from 2,753 to 2,577 (6%) between 2001 and 2011
o Mostly between 2001 and 2006 51% of the town population was over 45 in 2011
o 46% in 2001o 4% increase in people aged 45 years or oldero 14% decrease in people under 45
Total area workforce: fairly stable between 2001 and 2011 Agricultural workforce: declined by 6% (24 FTE) between 2001 and 2011
o Decline of 12% for 2001-06, increase of 6% 2006-11 Non-agriculture private workforce: declined by 6% (33 FTE) between 2001 and 2011
o Decreased by 8% (42 FTE) between 2001-06, increased by 2% 2006-11o Small number of manufacturing jobs (average 43 FTE)
Government services workforce: increased by 27% (95 FTE) between 2001 and 2011o Mostly between 2001 and 2006
Economic structure:o 2001: 32% agriculture, 42% non-agriculture private, 26% government serviceso 2011: 29% agriculture, 38% non-agriculture private, 33% government services
Unemployment in the town: 8% in 2011 SEIFA for town:
o 2011: decile 2 for economic resources, disadvantage, advantage and disadvantage; 5 for economic and resources
o 2006: decile 3 for advantage and disadvantage
Grazing is the dominant form of agriculture for the community, representing 85% of agricultural land use (Figure B22). Irrigation is variable and includes small areas of horticulture, pasture, hay, cereals and other crops.
Figure B22: Land use in Coonabarabran
Source: ACLUMP data
Summary of social and economic conditionCoonabarabran is a fairly stable, predominantly grazing community with a relatively large non-agriculture private sector and growing services employment contributing to a diverse local economy. The large proportion of people over 45 and challenging social and economic conditions indicated potential challenges for the community adapting to large changes.
Page 85
Northern Basin Review - Technical overview of the socioeconomic analysis – interim report
Modelling resultsThe community modelling for Coonabarabran indicates the relatively stable nature of employment in the community across the period of analysis (Figure B23). Farm and farm-related sector remained around 400 FTEs while employment in the other private business sector was around 480 FTEs. The small decreases through to 2006 then increases in sector employment across the period until 2013-14 are consistent with the ABS employment trends.
Figure B23: Modelled baseline of employment in Coonabarabran
ImplicationsThrough most indicators, Coonabarabran is a relatively stable economy and community. The community narrative for this area noted the effects of the 2013 bushfires on the farm and farm-related sector and broader economy. The long-term flow on effects of this natural disaster, which might have affected economic stability as indicated in the narrative report, are not represented in the modelling.
Page 86

Northern Basin Review - Technical overview of the socioeconomic analysis – interim report
Appendix B8: Dirranbandi – HebelDirranbandi-Hebel is a small agriculture-dependent community.
Trends in socio-economic conditions Area population: decreased from 762 to 596 persons (22%) between 2001 and 2011
o Mostly between 2001 and 2006. Town population: decreased from 516 to 446 persons (14%) between 2001 and 2011
o Mostly between 2001 and 2006, small increase between 2006 and 2011 42% of the town population was over 45 in 2011
o 28% in 2001o 29% increase in people aged 45 years or overo 30% decrease in people under 45
Total area workforce: decreased by 23% (79 FTE) between 2001 and 2011o Mostly between 2001 and 2006
Agricultural workforce: decreased by 14% (26 FTE) between 2001 and 2011o Mostly between 2001 and 2006
Non-agriculture private workforce: declined 65% (61 FTE) between 2001 and 2011o Consistent rate of change from 2001 to 2011
Government services sector: relatively stable between 2001 and 2011 (53 FTE) Economic structure:
o 2001: 58% agriculture, 27% non-agriculture private, 15% government serviceso 2011: 66% agriculture, 12% non-agriculture private, 22% government services
Unemployment in the town: 5% in 2011 SEIFA for town:
o 2011: decile 2 for education and occupation, disadvantage, advantage and disadvantage; 3 for economic resources
o 2006: decile 3 for education and occupation, disadvantage, advantage disadvantage, economic resources
Grazing dominates agricultural land use in the Dirranbandi-Hebel area (Figure B24). Cotton is the main irrigated crop. Other irrigated crops include wheat and summer crops.
Figure B24: Land use in Dirranbandi - Hebel
Source: ACLUMP data
Summary of social and economic conditionSignificant changes to the Dirranbandi population and structure of the economy occurred between 2001 and 2006, noting a large proportion of the decline in population related to the community outside the town of Dirranbandi. The population and employment trends continued at a slower pace between 2006 and 2011, with the major changes being to the non-agriculture private sector. The general social and economic conditions indicate major challenges for the
Page 87

Northern Basin Review - Technical overview of the socioeconomic analysis – interim report
Dirranbandi community adapting to further change. These economic and social conditions, and further changes since 2011 (described in the community narrative), should be considered when interpreting the estimated employment impacts from the recovery of water.
Water recovery scenariosPrior to water recovery, irrigators around Dirranbandi held entitlements to 218 GL of surface water. Australian Government water purchases to date have reduced water availability by 20% (Table B4). Under the 390 GL water recovery scenario the proportion of water recovered is estimated to be around 42% of entitlements and up to 45% of entitlements under the 415 GL scenario. Other scenarios examined propose water recovery volumes representing between 24% and 36% of the entitlements held in that area.
For this analysis, the water recovery is assumed to occur through the purchase of entitlements. However, at the present time, a small amount of water recovery is being delivered through infrastructure investment and the sharing of water savings between the Commonwealth and irrigators. Water recovery through this combined approach would be expected to have smaller social and economic impacts than the purchase of water entitlements alone. In the absence of information on the water recovered through the infrastructure investment, the analysis is undertaken on the basis of all water being recovered through purchase.
Table B4: Water recovery scenarios examined for the Dirranbandi community
Scenario Reduction in water available to irrigators278 GL 20%320 A 24%320 B 31%320 C 36%345 30%350 35%390 42%415 45%
Modelling resultsLanduse modelling for the Dirranbandi-Hebel area takes into account diversions against the unsupplemented (water harvesting) and overland flow entitlements. The impact of water recovery to date is estimated to be a 27% reduction in the maximum area of irrigation (Figure B25). For the 390 GL water recovery scenario, it is estimated the maximum area of irrigation would be reduced by approximately 50%.
Page 88

Northern Basin Review - Technical overview of the socioeconomic analysis – interim report
Figure B25: Irrigated hectares under water recovery scenarios in Dirranbandi
Other water recovery scenarios examined (apart from the 415 GL scenario) have a lesser impact on the maximum area of irrigation. However, caution is required when interpreting the data. It is critical to understand the relationship between the total water recovery volume and the volume of recovery in the Dirranbandi-Hebel area. For example, the 320 GL C water recovery scenario suggests a reduction in Dirranbandi-Hebel entitlements of 36% (and maximum area irrigated reduced by 43%). For the 345 GL water recovery scenario, it is proposed to recover 30% of the Dirranbandi-Hebel entitlements with an estimated 38% reduction in the maximum area irrigated. Figure B26 describes the relationship between the water recovery scenarios (named on the basis of the total water recovery in the northern basin, the volume of water recovered in the Dirranbandi-Hebel area and the percentage change in the maximum area of irrigation.
Figure B26: Percentage reduction in maximum area under water recovery scenarios in Dirranbandi
The baseline community modelling for Dirranbandi estimates a decline in employment in the absence of the Basin Plan. For the farm and farm-related sector (which includes the seasonal workers) it is estimated employment fell by 11% (30 FTE) across the period between 2000-01 and 2013-14 (Figure B27). Part of that baseline includes the increase in irrigated production for
Page 89
Northern Basin Review - Technical overview of the socioeconomic analysis – interim report
the period from 2009-10, where the area is significantly greater than it was in 2000-01. In the other private business sector, employment fell by 17% (12 FTE) across the period of analysis.
Figure B27: Modelled baseline of employment in Dirranbandi
The flow-through effect on employment in the farm and farm-related sector is estimated to be a reduction of between 7% (12-15 FTE) in zero production years up to 15% (35 FTE) in maximum irrigated production years under the 278 GL scenario (Figure B28). With the 390 GL scenario, the reduction in employment in the farm and farm-related sector ranges varies between 15% (27-30 FTE) and 25% (55-60 FTE). For the 415 GL water recovery scenario, the impacts on employment are slightly larger. With the remaining water recovery scenarios, the impact on employment are between those for 278 GL and the 390 GL scenario.
Figure B28: Farm-related employment under water recovery scenarios in Dirranbandi
Given the structure of the Dirranbandi community (concentration of employment in the agriculture sector and a relatively small other private business sector) a significant proportion of the water
Page 90

Northern Basin Review - Technical overview of the socioeconomic analysis – interim report
recovery effect flows through to the other private business sector. With the 278 GL scenario, the estimated impacts on employment in this sector range between 6% (less than 5 FTE) and 12% (5-7 FTE). With the 390 GL water recovery scenario, the reduction in employment for the other private business sector is between 14% (5-7 FTE) in dry years and 21% (11-13 FTE) in maximum production years. The impact on employment varies between the 278 GL and 390 GL water recovery scenario (except for the 415 GL scenario, where the effects is greater).
Figure B29: Other private business sector employment under water recovery scenarios in Dirranbandi
Largest effect: 415 GL scenario – 53% reduction in maximum area, >25% reduction in farm and farm-related jobs, >20% decrease in other private business jobs, >19% decrease in total jobs.
ImplicationsFor the water recovery scenarios examined, it is expected there will be substantive effects flowing through the Dirranbandi-Hebel economy. With the 278 GL scenario it is estimated the impacts on the local economy (and community) will be a reduction in total jobs of around 15-20 FTE (5-7%) in dry years and 40 FTE (12%) in maximum production years. With the 390 GL water recovery scenario, the estimated effects on total employment are approximately 30-35 FTE (11-12%) in dry years up to 65-90 FTE (19-26%) in maximum irrigation production years.
Given the underlying social and economic conditions in Dirranbandi, the modelled estimates of employment impact may underestimate the overall effects on the economy and community. This scale of change in employment is anticipated to have an effect on the rate of population change within the Dirranbandi-Hebel community, assuming nothing else changes.
Page 91

Northern Basin Review - Technical overview of the socioeconomic analysis – interim report
Appendix B9: GilgandraGilgandra is dryland farming community in close proximity to Dubbo.
Trends in socio-economic conditions Area population: fairly stable (around 3,800 people) since 2001 Town population: fairly stable (around 2,700 people) since 2001 48% of the town population was over 45 in 2011
o 44% in 2001o 7% increase in people aged 45 years and over o 9% decrease in people under 45
Total area workforce: fluctuate around 1,200 FTE between 2001 and 2011 Agricultural workforce: declined by 21% (103 FTE) between 2001 and 2011
o Mostly between 2006 and 2011 Non-agriculture private workforce: increased by 14% (58 FTE) between 2001 and 2011
o Mostly between 2001 and 2006 Government services workforce: increased by 44% (113 FTE) between 2001 and 2011
o Mostly between 2001 and 2006 Economic structure:
o 2001: 43% agriculture, 35% non-agriculture private, 22% government serviceso 2011: 32% agriculture, 38% non-agriculture private, 30% government services
Unemployment in the town: 9% in 2011 SEIFA for town:
o 2011: decile 2 for economic resources, disadvantage, advantage and disadvantage; 3 for education and occupation
o 2006: decile 1 for economic resources
Grazing and dryland farming dominates Gilgandra’s agricultural land use (Figure B30). Irrigation includes very small areas of vegetables, horticulture, pasture and other crops.
Figure B30: Land use in Gilgandra
Page 92
Northern Basin Review - Technical overview of the socioeconomic analysis – interim report
Source: ACLUMP data
Summary of social and economic conditionGilgandra has a fairly stable economy and community across the period between 2001 and 2011. Growth in the non-agriculture private sector and government services sector between 2001 and 2006 were largely offset by the reduction in agriculture sector jobs between 2006 and 2011. It is possible some of these positive changes for the Gilgandra community are determined by its close proximity to Dubbo. The large proportion of the population over the age of 45 and scores for the measures of general social and economic condition indicate potential challenges for adapting to large changes.
Modelling resultsThe baseline community modelling for Gilgandra estimates a decline in farm and farm-related sector employment of around 16% (75 FTE) for the period from 2000-01 to 2013-14 (Figure B31). Over the same period, employment in the other private business sector increased by approximately 10% (40 FTE).
Figure B31: Modelled baseline employment in Gilgandra
ImplicationsThe modelling results are consistent with the observed data for Gilgandra. Decline in the farm and farm-related sector employment is estimated to occur at an increasing rate after 2006. Employment in the other private business sector increased more rapidly up to 2006 then slowed at a time when the decrease in the farm sector employment and government services job increases were largely off-setting each other. The proximity of Gilgandra to Dubbo is likely to be influencing the outcomes observed from the modelling.
Page 93

Northern Basin Review - Technical overview of the socioeconomic analysis – interim report
Appendix B4: BrewarrinaBrewarrina is a small service centre for a large area of grazing in northwest NSW. The area includes graziers on the Lower Balonne floodplain, who also use Lightning Ridge, Dirranbandi, Bourke and Walgett as service centres.
Trends in socio-economic conditions Area population: decreased from 1,332 to 1,066 persons (20%) between 2001 and 2011
o Mostly between 2006 and 2011. Town population: decreased from 1,200 to 924 persons (23%) between 2001 and 2011
o Mostly between 2006 and 2011. 35% of the town population was over 45 in 2011
o 23% in 2001o 15% increase in people aged 45 years or oldero 35% decrease in people under 45
Total area workforce: decreased from 398 to 297 FTEs (25%) between 2001 and 2011o Mostly between 2001 and 2006.
Agricultural workforce: decreased by 38% (48 FTE) between 2001 and 2011 Non-agriculture private workforce: decreased by 46% (44 FTE) between 2001 and 2011
o Mostly between 2001 and 2006 Government services workforce: remained fairly constant (varying around 150 FTE) Economic structure:
o 2001: 32% agriculture, 27% non-agriculture private, 41% government serviceso 2011: 26% agriculture, 22% non-agriculture private, 52% government services
Unemployment in the town: 13% in 2011 SEIFA for town in 2006 and 2011: decile 1 for advantage and disadvantage,
disadvantage, education and occupation, economic resources
Grazing is the dominant form of agriculture for the community (Figure B13). There is little irrigation, noting in 2001 there were a mix of small irrigation enterprises around Brewarrina.
Figure B13: Land use in Brewarrina
Source: ACLUMP data
Summary of social and economic conditionIn the grazing community of Brewarrina, the substantive decline in employment between 2001 and 2006 for the agriculture and non-agriculture private sector preceded the decline in the town and farming population across 2006 to 2011. Changes within the population (decline in the number and proportion of people under 45) combined with high unemployment and the general indicators of social and economic condition suggest considerable challenges for the community in responding to change.
Page 94

Northern Basin Review - Technical overview of the socioeconomic analysis – interim report
Modelling resultsThe baseline community modelling for Brewarrina estimates a decline for employment in the farm and farm-related sector of around 48% (60 FTE) since 2000-01 (Figure B14). For the other private business sector, employment fell by a similar percentage (equal to approximately 40 FTE).
Figure B14: Modelled baseline of employment in Brewarrina
ImplicationsThe modelling results are indicative of a small community dealing with considerable change. The decline in farm and farm-related and other private business sector employment coincides with difficult climatic conditions. Corresponding with the drought of 2012 and 2013, the modelling indicates further reductions in employment post-2011. This view is supported by findings from the consultations, as presented in the narrative for Brewarrina. Further, the narrative suggests that Brewarrina’s population may have continued to decrease since 2011, which could have long-term flow-on effects on employment in the other private business sector. Brewarrina’s challenging social and economic conditions suggest limited capacity to adapt to changes. In the absence of water recovery, it is anticipated the population and employment trends would continue.
Floodplain grazing in the Lower Balonne has been a long-term contributor to the Brewarrina, Lightning Ridge and Walgett economies, in terms of cash flow and seasonal worker opportunities. The effects of drought on production in the Lower Balonne floodplain was exacerbated by irrigation development upstream, with reduced in-stream and overbank flows. From these combined events, across the floodplain production levels since 1980 have fallen by around one fifth (flows are down by around half) and profits have been reduced by around 15%. However some properties will have lost up to a third of production. In response to these conditions, some farmers have been forced to alter their farming practices, affecting their profitability.
The recovery of water for the environment is expected to result in the Brewarrina community being affected in a positive way. The indirect benefits for floodplain graziers from the recovery of
Page 95

Northern Basin Review - Technical overview of the socioeconomic analysis – interim report
water are estimate to provide improvements in production and earnings. Those improvements represent up to one third of foregone production from the up-stream development of water for irrigation. As raised during consultations, regaining some of the foregone production and flows to people on the floodplain is important. While an increase in production is not expected to lead to an increase in employment, it might help to retain some of the people on farms who might have otherwise left the area. The potential flow-on effects for the town and community might be a slowing of the rate of population and employment change.
Page 96

Northern Basin Review - Technical overview of the socioeconomic analysis – interim report
Appendix B10: GoondiwindiGoondiwindi is a service centre for neighbouring communities at the juncture of six highways. Dryland and irrigated agriculture are significant components of the local economy, supplemented by transport, tourism, communications and an emerging manufacturing sector.
Trends in socio-economic conditions Area population: increased from 9,611 to 10,086 persons (5%) between 2001 and 2011
o Small decrease (1%) between 2001 and 2006 Town population: fairly stable at around 5,500 people 37% of the town population was over 45 in 2011
o 32% in 2001o 15% increase in people aged 45 years or overo 6% decrease in people under 45
Total area workforce: increased by 7% (234 FTE) between 2001 and 2011o Decreased by 4% between 2001-06, increased by 11% between 2006-11
Agricultural workforce: increased by 4% (58 FTE) between 2001 and 2011o Declined by 7% between 2001-06, increased by 11% between 2006-11o Ginning and further processing jobs increased from 25 to 52 FTE
Non-agricultural private workforce: around 1,400 FTE in 2001 and 2011o Declined by 6% (95 FTE) between 2001-06, increased by 6% between 2006-11o 30 mining and 170 manufacturing jobs in 2011
Government services workforce: Increased 24% between 2001 and 2011 Economic structure:
o 2001: 41% agriculture, 42% non-agriculture private, 17% government serviceso 2011: 39% agriculture, 40% non-agriculture private, 19% government services
Unemployment in the town: 3% in 2011 SEIFA for town:
o 2011: decile 7 for economic resources, disadvantage, advantage and disadvantage; 6 for education and occupation
o 2006: decile 8 for economic resources; 7 for education and occupation
Grazing dominates agricultural land use in the Goondiwindi area with 11% of agricultural land used for irrigation. Cotton is the main irrigated crop (Figure B32). Other irrigated land uses include vegetables, pasture, horticulture and cereals.
Figure B32: Land use in Goondiwindi
Source: ACLUMP data
Summary of social and economic conditionWhile the population and employment have both increased between 2001 and 2011, it has been the growth after 2006 which more than offset the small negative changes between 2001 and 2006 and have contributed to the positive social and economic conditions in the Goondiwindi community. This is further reflected in the complexity of the local economy, low unemployment
Page 97

Northern Basin Review - Technical overview of the socioeconomic analysis – interim report
and changes to the population aged above and below 45. These underlying social and economic conditions and trends for Goondiwindi should be considered when interpreting the modelled estimates of the potential impacts from water recovery on the community.
Water recovery scenariosIrrigators in the Goondiwindi area access surface water from the Border Rivers and Gwydir catchments. Prior to water recovery, irrigators around Goondiwindi held approximately 306 GL of surface water entitlements. To date, irrigators in the Goondiwindi community have transferred just under 3% of their entitlements to the Australian Government (Table B5). Around one quarter of the water recovery has been through the purchase of entitlements. The remaining water recovery represents a share of the water savings from investment in infrastructure. Any water recovery beyond the current water recovery is assumed to be through the purchase of entitlements. Under the 415 GL water recovery scenarios, it is estimated the reduction in water entitlements held by irrigators would be approximately 9% of the total water entitlements held by irrigators. After accounting for the water savings available to farmers from investing in infrastructure, the net change in water available for irrigation would represent around 3% of the water held by irrigators.
Table B5: Water recovery in Goondiwindi
Scenario Total reduction in water available to irrigators
Net reduction in water available to irrigators
278 3% -3%320 A 6% -1%320 B 7% 1%320 C 6% -1%345 8% 2%350 9% 3%390 8% 2%415 9% 3%
*A negative number reflects an increase in water availability arising from infrastructure investment.
Modelling resultsThe landuse modelling for Goondiwindi takes into account diversions against medium security, unsupplemented and overland flow licences in the Queensland Border Rivers catchment and general security on and off allocation water and floodplain harvesting sourced from NSW Border Rivers and Gwydir River catchments. With water recovery to date being mostly through infrastructure investment, the potential area of production is expected to be slightly higher than the baseline level of production (Figure B33). With the largest reduction in water entitlements associated with the 415 GL water recovery scenario, it is estimated the maximum area irrigated would be reduced by approximately 3%.
One option for recovering water in the Border Rivers might be to transfer part of the water recovery from Mungindi to Goondiwindi. For example, to transfer the remaining 6.5 GL of water recovery from the Mungindi community. In this case, the additional water recovery from the Goondiwindi community is estimated to reduce the maximum area of irrigation by 5% (data not shown).
Page 98

Northern Basin Review - Technical overview of the socioeconomic analysis – interim report
Figure B33: Irrigated hectares under water recovery scenarios in Goondiwindi
The baseline community modelling for Goondiwindi estimates a decline in employment for the farm and farm-related sectors of around 13% (approximately 230 FTE) in the absence of the Basin Plan across the period from 2000-01. For the other private business sector, the baseline employment is fairly constant, noting the decline of around 120 FTE between 2000 and 2006 is offset by the increase between 2007 and 2013.
Figure B34: Modelled baseline employment in Goondiwindi
The flow-through effect of the water recovery scenarios on employment in the farm and farm-related estimated changes ranging between an increase of 1% for the 278 GL scenario down to a decline of 1-1.5% (15-20 FTE) under the 415 GL scenario (Figure B35).
Page 99
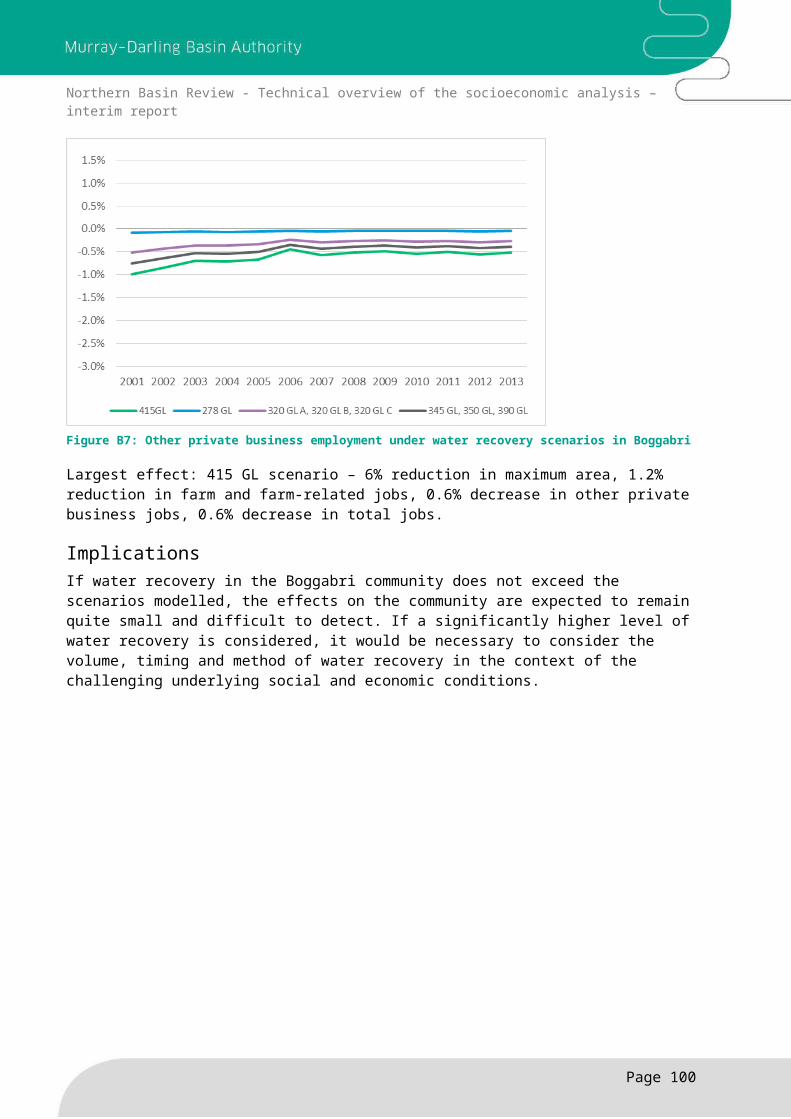
Northern Basin Review - Technical overview of the socioeconomic analysis – interim report
Figure B35: Farm-related employment under water recovery scenarios in Goondiwindi
For the other private business sector, the effects of the water recovery scenarios range between an increase of 0.5% with the 278 GL scenario to a decrease of 0.5% (less than 10 FTE) under the 415 GL water recovery scenario.
Figure B36: Other private business employment under water recovery scenarios in Goondiwindi
Largest effect: 415 GL scenario – 3% reduction in maximum area, 1.2% reduction in farm and farm-related jobs, 0.5% decrease in other private business jobs, 0.7% decrease in total jobs.
ImplicationsIf water recovery in the Goondiwindi area does not exceed the volumes proposed in the scenarios examined, the effects are likely to be small and difficult to differentiate from the underlying changes experienced by the community. In the example where water recovery in the Goondiwindi area was increased from 30.5 GL to 37 GL (with a transfer of water recovery from Mungindi to Goondiwindi) the effect was a 5% decline in the maximum area irrigated, relative to a
Page 100

Northern Basin Review - Technical overview of the socioeconomic analysis – interim report
3% decline under the 415 GL water recovery scenario. The employment changes from the increased volume of water recovery would be difficult to distinguish in the Goondiwindi economy.
Page 101

Northern Basin Review - Technical overview of the socioeconomic analysis – interim report
Appendix B11: GunnedahGunnedah is a large service centre for agriculture and mining.
Trends in socio-economic conditions Area population: increased to 12,974 persons (up 7%) between 2001 and 2011
o Mostly between 2006 and 2011. Town population: fairly stable around 7,850 people across 2001 to 2011
o Down 4% between 2001-06, up 4% between 2006-11 44% of the town population was over 45 in 2011
o 40% in 2001o 11% increase in people aged 45 years or overo 6% decrease in people under 45
Total area workforce: increased by 19% (708 FTE) between 2001 and 2011o Mostly between 2006 and 2011.
Agricultural workforce: small, gradual decline of 4% (41 FTE) between 2001 and 2011 Non-agriculture private workforce: increased by 52% (561 FTE) between 2001 and 2011
o Mostly between 2006 and 2011o Mining jobs increased from 110 FTE in 2006 to 370 FTE in 2011o Increase in manufacturing by 29% (to 300 FTE) mostly 2006-11
Government services workforce: increased by 23% (187 FTE) between 2001 and 2011 Economic structure:
o 2001: 32% agriculture, 47% non-agriculture private, 21% government serviceso 2011: 26% agriculture, 52% non-agriculture private, 22% government services
Unemployment in the town: 7% in 2011 SEIFA for town:
o 2011: deciles 3 for education and occupation and economic resources;4 for disadvantage, advantage and disadvantage
o 2006: decile 2 for education and occupation; 4 for economic resources; 3 for disadvantage
Gunnedah has a diverse agriculture sector including a large area of dryland farming and some irrigated agriculture (supported largely by groundwater use) (Figure B37). The main irrigated crop is cotton. Other irrigated crops include cereals, horticulture and vegetables.
Figure B37: Land use in Gunnedah
Page 102

Northern Basin Review - Technical overview of the socioeconomic analysis – interim report
Summary of social and economic conditionGunnedah is a diverse, growing economy and community. Over the period since 2001, there has been a relatively small decline in agriculture sector employment, with substantive growth in the non-agriculture private sector jobs, especially since 2006. Growth in government sector jobs, the changes to people under and over 45 within the population together with the general estimates of social and economic conditions indicate a reasonable capacity to adapt to change. Given these underlying social and economic trends, it is anticipated the modelling results will not require further interpretation.
Water recovery scenariosPrior to water recovery, irrigators around Gunnedah held approximately 5 GL of surface water and 66 GL of groundwater entitlements. With recovery to date, around 1% of the surface water entitlements have been recovered from irrigators in the Gunnedah region (Table B6). In the 415 GL water recovery scenario, it is estimated 9% of the water entitlements would be recovered from irrigators.
Table B6: Water recovery scenarios examined for the Gunnedah community
Scenario Reduction in surface water available to irrigators278 1%320 A 5%320 B 5%320 C 5%345 7%350 7%390 7%415 9%
Modelling resultsThe landuse modelling for Gunnedah takes into account diversions against general security on and off-allocation surface water entitlements and groundwater use. In this area, it appears surface water is used to supplement irrigated production based primarily on groundwater. As such, irrigated production is not significantly affected by surface water availability. It is anticipated surface water recovery will have a limited effect on irrigated production in Gunnedah.
The baseline community modelling for Gunnedah estimates a decline in employment for the farm and farm-related sector (including seasonal workers) of around 12% (150 FTE) across the period modelled (Figure B38). For the other private business sector, the increase in employment in the absence of the Basin Plan is estimated to be around 10% (also 150 FTE).
Page 103

Northern Basin Review - Technical overview of the socioeconomic analysis – interim report
Figure B38: Modelled baseline employment in Gunnedah
The flow-through effect on employment in the farm and farm-related sector from the water recovery scenarios is estimated to be close to zero with the 278 GL scenario and up to 1.5% for the 415 GL water recovery scenario (Figure B39). These effects are quite small and will be hard to separate from the other drivers of change affecting the community.
Figure B39: Farm-related employment under water recover scenarios in Gunnedah
With the other private business sector, the water recovery scenarios estimated to have an impact of less than 1% on employment (Figure B40), making it quite difficult to identify such a change in the Gunnedah economy.
Page 104

Northern Basin Review - Technical overview of the socioeconomic analysis – interim report
Figure B40: Other private business employment under water recovery scenarios in Gunnedah
Largest effect: 415 GL scenario – 9% reduction in maximum area, 1.3% reduction in farm and farm-related jobs, 0.6% decrease in other private business jobs, 0.5% decrease in total jobs.
ImplicationsGiven the underlying social and economic conditions, the small volume of water recovery and limited effect on employment in the farm and farm-related sector as well as the other private business sector, the effects of any water recovery will be difficult to identify relative to the other changes affecting the Gunnedah community.
Page 105
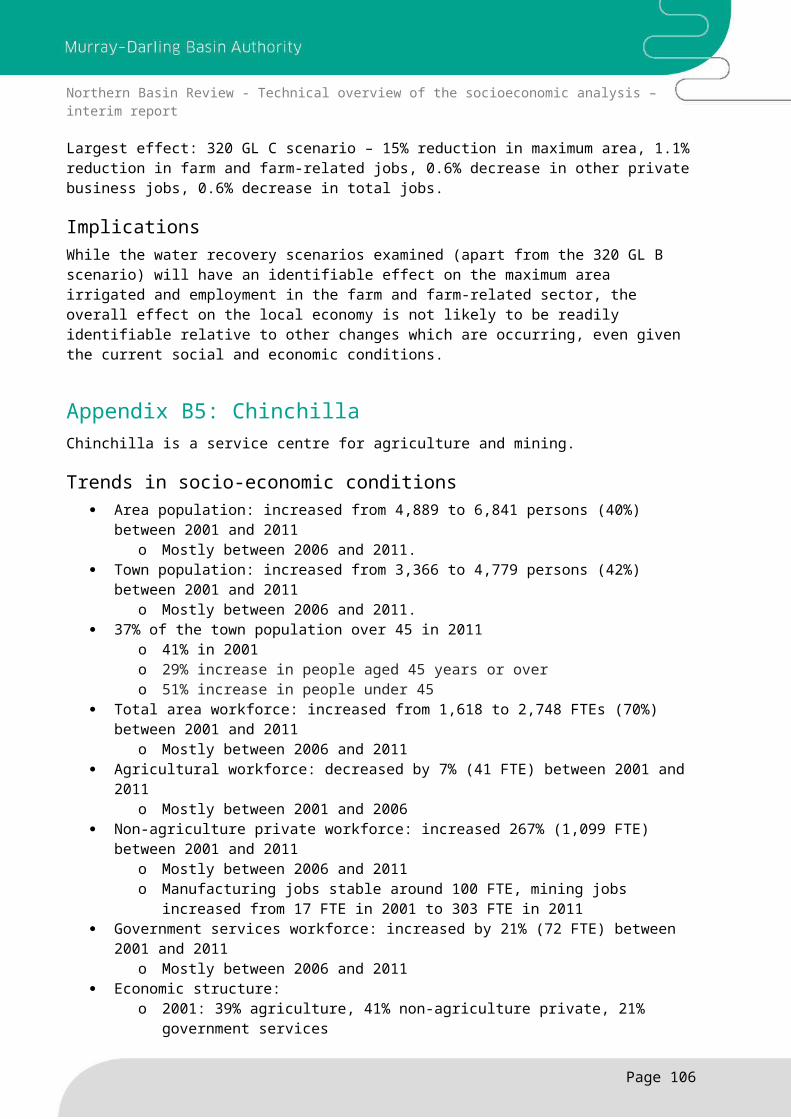
Northern Basin Review - Technical overview of the socioeconomic analysis – interim report
Appendix B12: MoreeMoree is a large service centre for agriculture in northern NSW.
Trends in socio-economic conditions Area population: decreased from 15,513 to 13,292 persons (14%) between 2001 to 2011
o Mostly between 2001 and 2006 Town population: decreased from 9,249 to 7,722 persons (17%) between 2001 and 2011
o Mostly between 2001 and 2006 37% of the town population was over 45 in 2011
o 32% in 2001o 3% decrease in people aged 45 years or overo 23% decrease in people under 45
Total area workforce: decreased by 13% (694 FTE) between 2001 and 2011o Mostly between 2001 and 2006.
Agricultural workforce: decreased by 19% (405 FTE) between 2001 and 2011 Non-agriculture private workforce: decreased by 18% (425 FTE) between 2001 and 2011
o Mostly between 2001 and 2006o Virtually no mining jobs, around 60 FTE in ginning and further processing, around
200 FTE in manufacturing (down 17% or 40 FTE between 2001 and 2011) Government services workforce: increased by 16% (155 FTE) between 2001 and 2011
o Mostly between 2001 and 2006 Economic structure:
o 2001: 39% agriculture, 43% non-agriculture private, 18% government serviceso 2011: 36% agriculture, 40% non-agriculture private, 23% government services
Unemployment in the town: 5% in 2011 SEIFA for town:
o 2011: decile 3 for education and occupation, disadvantage, advantage and disadvantage; 2 for economic resources
o 2006: decile 5 for education and occupation; 5 for advantage and disadvantage; 4 for economic resources
The structure of the local economy is strongly related to the mix of irrigation (8% of the land area), cropping (54% of the land area) and grazing (Figure B41). Irrigation enterprises include cotton, horticulture (citrus, pecans), cereals, hay and pasture.
Figure B41: Land use in the Moree area
Summary of social and economic conditionsSignificant changes to the population and structure of the community and economy occurred between 2001 and 2006, with much of the change associated with the town. The changes continued at a slower rate through to 2011. From the community consultations, it is apparent that these pressures continue. The scale and rate of change in this large rural community combined
Page 106

Northern Basin Review - Technical overview of the socioeconomic analysis – interim report
with the estimates of overall social and economic conditions present a quite challenging environment for the community to adapt to change. These conditions should be taken into account when interpreting the model estimates of the effects from water recovery.
Water recovery scenariosPrior to water recovery, irrigators around Moree had access to 217 GL of surface water and 33 GL of groundwater. With water recovery to date, irrigators in the Moree community area have transferred approximately 10% of their entitlements to the Commonwealth (Table B7). A small part of the water recovery has been through infrastructure investment. Some of the infrastructure investment created water savings with part of those savings retained by irrigators. As a consequence, the net reduction in water available for production is slightly less than the volume of water acquired by the Commonwealth. Across the water recovery scenarios, the maximum net reduction in water availability is 12% under the 415 GL scenario.
Table B7: Water recovery scenarios examined for the Moree community
Scenario Total reduction in surface water available to irrigators
Net reduction in surface water available to irrigators
278 10% 8%320 A 10% 8%320 B 11% 9%320 C 10% 8%345 10% 8%350 13% 11%390 13% 11%415 14% 12%
Note: These estimates of water recovery represent the change in surface water availability. They do not take into account groundwater availability or the effects of the groundwater recovery process in the Moree community area (which concludes in 2017).
Modelling resultsThe landuse modelling of irrigated area takes into account diversions against high security, general security on and off-allocation, and floodplain harvesting entitlements as well as the use of groundwater. For the 278 GL scenario, it is estimated the maximum area of irrigated production in the Moree community area will be reduced by around 5% (Figure B42). Under the 415 GL scenario, the estimated reduction in the maximum irrigation area is estimated to decline by 9%, which might be expected to have an identifiable impact on the community.
Page 107

Northern Basin Review - Technical overview of the socioeconomic analysis – interim report
Figure B42: Irrigated hectares under water recovery scenarios in Moree
The baseline community modelling for Moree estimates the change in employment for the farm and farm-related sector and the other private business sector in the absence of the Basin Plan water recovery. This analysis indicates a significant decline in employment for both sectors across the period from 2001. In the farm and farm-related sector, employment is estimated to have fallen by around 22% (520 FTE). For the other private business sector, the underlying change in employment is approximately 21% (460 FTE). Note the modelled change in total employment for the whole economy is around 15% (850 FTE) after allowing for jobs growth in the government services sector.
Figure B43: Modelled baseline employment in Moree
The reduction in farm and farm-related employment under the water recovery scenarios varies from 2% (40-50 FTE) with the 278 GL scenario up to 4% (75-95 FTE) under the 415 GL water recovery scenario (Figure B44). The effect on jobs is greatest in high irrigation production years, when the requirement for seasonal workers is at its greatest.
Page 108

Northern Basin Review - Technical overview of the socioeconomic analysis – interim report
Figure B44: Farm and farm-related employment under water recovery scenarios in Moree
Changes to farm and farm-related employment are expected to flow on to the other private business sector. The estimated effects on the other private business sector range up to 2% (35-45 FTE) with the 278 GL scenario and 3% (50-65 FTE) under the 415 GL water recovery scenario (Figure B45). The effects of the 390 GL and 415 GL water recovery scenarios are expected to be observable changes.
Figure B45: Other private business employment under water recovery scenarios in Moree
Flow-on effects of Collarenebri water recoveryInformation collected during the community consultations described the important role Moree businesses played in supporting irrigated production in the Collarenebri area. As a consequence of water recovery in the Collarenebri area there is likely to be a significant effect on employment for Moree-based businesses that needs to be considered in the analysis. As there is no definitive information about these business and employment relationships, a sensitivity analysis is used to estimate the potential scale of the effects. The two cases examined are where either 30% or 60%
Page 109

Northern Basin Review - Technical overview of the socioeconomic analysis – interim report
of the decline in Collarenebri irrigated area is transferred back to the Moree community. Where 30% of the reduction in Collarenebri’s irrigated area is transferred to Moree, the effect on jobs in the farm and farm-related sector is estimated to be 4-5.5% (75-105 FTE) under the 390 GL water recovery scenario (Figure B46). That is, an increase of one-half on top of the effect described when examining changes associated with the recovery of water in Moree alone. For the other private business sector, the decrease in employment is around 3% (55-65 FTE) in Moree when considering the additional influences from the water recovery in the Collarenebri area. In total the estimated loss of 130-170 FTE is just over 3% of the workforce.
Figure B46: Impact of 390 GL water recovery scenario on farm and farm-related jobs in Moree
Figure B47: Impact of 390 GL water recovery scenario on other private business sector jobs in Moree
ImplicationsThe effects of water recovery in the Moree community are expected to be identifiable when considered in the context of the underlying social and economic conditions and when taking into account the flow-on effects of water recovery in the Collarenebri community. Given these conditions, including the decline in jobs of around 850 FTE without the Basin Plan, the social and
Page 110

Northern Basin Review - Technical overview of the socioeconomic analysis – interim report
economic consequences of water recovery are likely to be larger than the modelled estimates of job losses might indicate.
Page 111

Northern Basin Review - Technical overview of the socioeconomic analysis – interim report
Appendix B13: MungindiMungindi is a small agriculture-dependent community.
Trends in socio-economic conditions Area population: decreased from 1,441 to 1,193 persons (17%) between 2001 and 2011
o Mostly between 2001 and 2006. Town population: decreased from 645 to 486 persons (25%) between 2001 and 2011
o Mostly between 2001 and 2006. 36% of the town population was over 45 in 2011
o 32% in 2001o 13% decrease in people aged 45 years and overo 30% decrease in people under 45
Total area workforce: decreased 13% (133 FTE) between 2001 and 2011 Mostly between 2001 and 2006
Agricultural workforce: decreased 7% (23 FTE) between 2001 and 2011o Ginning jobs (excluding seasonal employment) represent around 15 FTE
Non-agriculture private workforce: decreased 46% (58 FTE) between 2001 and 2011 o Mostly between 2001 and 2006o There were no mining jobs, around 10 FTE in manufacturing
Government services workforce: increased by 15% (11 FTE) between 2001 and 2011o Mostly between 2006 and 2011
Economic structure:o 2001: 63% agriculture, 24% non-agriculture private, 14% government serviceso 2011: 67% agriculture, 15% non-agriculture private, 18% government services
Unemployment in the town: 6% in 2011 SEIFA for town:
2011: decile 7 for education and occupation; 3 for advantage and disadvantage; 2 for economic resources and disadvantage
2006: decile 5 for education and occupation
Land use in Mungindi indicates a diverse agricultural sector, with significant areas of grazing, dryland farming and irrigated cropping (Figure B48). Cotton is the dominant irrigated crop.
Figure B48: Land use in Mungindi
Summary of social and economic conditionMuch of the long-term change for the Mungindi community is based around changes to the population and economic structure of Mungindi town between 2001 and 2006, with little change for the farming part of the community. The changes continued but at a much slower rate between 2006 and 2011. While the education and occupation levels of people in town remain relatively high, the other social and economic conditions indicate the challenges the community might have in adapting to change. These social and economic conditions, particularly the growing
Page 112

Northern Basin Review - Technical overview of the socioeconomic analysis – interim report
dependence on agricultural employment within the economic structure, should be taken into account when considering the modelling results.
Water recovery scenariosPrior to water recovery, irrigators in the Mungindi community held 150 GL of surface water entitlements. Recovery to date has largely been through infrastructure investment and this has led to a small net increase in water available on-farm for irrigation. For any water recovery above the current recovery, it is assumed the water is purchased. The proposed level of water recovery in all scenarios is relatively small after taking account of the infrastructure investment to date.The largest estimated decrease in irrigation water availability for Mungindi is under the 345 GL water recovery scenario (estimated decrease of 4%, Table B8).The water recovery estimates are based on the recovery of water being spread on a pro-rata basis across the entitlements held in the Mungindi community. There is a possibility of a different spread of water recovery for the Border Rivers catchment across the Mungindi and Goondiwindi communities. A sensitivity analysis is used to indicate the potential effects on the area irrigated if a larger proportion of the 390 GL water recovery scenario is from the Mungindi community (and less from the Goondiwindi community).
Table B8: Water recovery scenarios examined for the Mungindi community
Scenario Total reduction in water available to irrigators
Net reduction in water available to irrigators*
278 5% -1%320 A 7% 1%320 B 6% 0%320 C 7% 1%
345 10% 4%350 9% 3%390 9% 3%415 9% 3%
*A negative number reflects an increase in on-farm water availability after accounting for infrastructure investment.
Modelling resultsThe landuse modelling for Mungindi takes into account potential water diversions from the Border Rivers, Gwydir and Barwon-Darling catchments. The estimated decline in water availability for each of the scenarios modelled from Table B8 are expected to have a small but identifiable effect on the area irrigated (Figure B49). Under the 390 GL water recovery scenario, the area irrigated is estimated to fall by 3% in the maximum production years. From the current water recovery, there is small increase in the potential area irrigated.
For the sensitivity analysis using the 390 GL water recovery scenario, if 5 GL of the remaining Border Rivers water recovery were to occur in the Mungindi community area (with 5 GL less recovery in the Goondiwindi area), the estimated effect on the maximum area irrigated in Mungindi is a reduction of approximately 8%. Increasing the additional recovery in the Mungindi area by 10 GL is estimated to reduce the maximum area of irrigation by around 12%.
Page 113

Northern Basin Review - Technical overview of the socioeconomic analysis – interim report
Figure B49: Irrigated hectares under water recovery scenarios in Mungindi
The baseline community modelling for Mungindi estimates a decline in employment for the farm and farm-related sector (including seasonal workers) of around 33% (170 FTE) with a 36% decline for the other private business sector since 2000-01.
Figure B50: Employment baseline for Mungindi
With water recovery to date focused on infrastructure investment (over the purchase of water entitlements) there is a small positive benefit working through to the farm and farm-related sector (and other private business sector) of Mungindi. Under the 390 GL water recovery scenario the reduction in irrigated hectares has a flow-on reduction of 1-1.5% in employment for the farm and farm-related sector (Figure B51). With the 345 GL water recovery scenario, the effect is for employment in the farm and farm-related sector to fall by 1.5-2.5%.
Page 114

Northern Basin Review - Technical overview of the socioeconomic analysis – interim report
Figure B51: Farm-related employment under water recovery scenarios in Mungindi
The flow-on effect for the other private business sector suggests a further fall in employment of 1-1.5% with the 390 GL water recovery scenario and 1-2% for the 345 GL water recovery scenario.
Figure B52: Other private business employment under water recovery scenarios in Mungindi
Largest effect: 415 GL scenario – 3% reduction in maximum area, 1.5% reduction in farm and farm-related jobs, 1.3% decrease in other private business jobs, 1.2% decrease in total jobs.
ImplicationsUnder the water recovery scenarios examined, the effects on the Mungindi community are expected to be small and quite difficult to distinguish from the underlying trends of change. This conclusion is constrained by the assumptions regarding the spread of water recovery in the Border Rivers catchment. If a significant proportion of the remaining water recovery were to come from the Mungindi area (an extra 5 GL or 10 GL of water recovery shifted from the Goondiwindi to the Mungindi community) the effect on irrigated production would be significant. Given the
Page 115

Northern Basin Review - Technical overview of the socioeconomic analysis – interim report
current social and economic conditions and structure of the Mungindi community (and depending on the timing, volume and type of water recovery) the implications are likely to substantive.
Page 116

Northern Basin Review - Technical overview of the socioeconomic analysis – interim report
Appendix B14: NarrabriNarrabri is a diverse community, supported by agriculture, tourism and mining.
Trends in socio-economic conditions Area population: decreased from 8,957 to 8,414 persons (6%) between 2001 and 2011
o Down 8% between 2001 and 2006, up 2% between 2006 and 2011 Town population: decreased from 6,236 to 5,889 persons (6%) between 2001 and 2011
o Mostly between 2006 and 2011 41% of the town population was over 45 in 2011
o 37% in 2001o 5% increase in people aged 45 years or overo 12% decrease in people under 45
Total area workforce: decreased 7% (242 FTE) between 2001 and 2011 Mostly between 2001 and 2006
Agricultural workforce: decreased 25% (289 FTE) between 2001 and 2011o Mostly between 2001 and 2006
Non-agriculture private workforce: decreased by 3% (55 FTE) between 2001 and 2011o Decreased 16% (253 FTE) between 2001 and 2006o Increased 13% (202 FTE) between 2006 and 2011o Significant growth in mining jobs (128 FTE) between 2006 and 2011o Manufacturing jobs down 30% (63 FTE) 2001-06, up 14% (30 FTE) 2006-11
Government services workforce: increased by 16% (93 FTE) between 2001 and 2011o Mostly between 2006 and 2011
Economic structure:o 2001: 35% agriculture, 48% non-agriculture private, 17% government serviceso 2011: 29% agriculture, 50% non-agriculture private, 22% government services
Unemployment in the town: 5% in 2011 SEIFA for town:
2011: decile 5 for education and occupation, disadvantage, advantage and disadvantage; 4 for economic resources
2006: decile 4 for disadvantage; 3 for economic resources
Narrabri has a diverse agricultural sector, with grazing, dryland farming and irrigated cropping (Figure B53). Cotton is the dominant irrigated crop plus cereals and pasture.
Figure B53: Land use in Narrabri
Summary of social and economic conditionNarrabri is a reasonably stable community in terms of its population and employment. Declines in the agriculture sector between 2001 and 2006 have been overcome by jobs growth in the non-agriculture and government sectors between 2006 and 2011. Long-term changes in the structure of the local economy and the estimates of general economic and social condition indicate a
Page 117
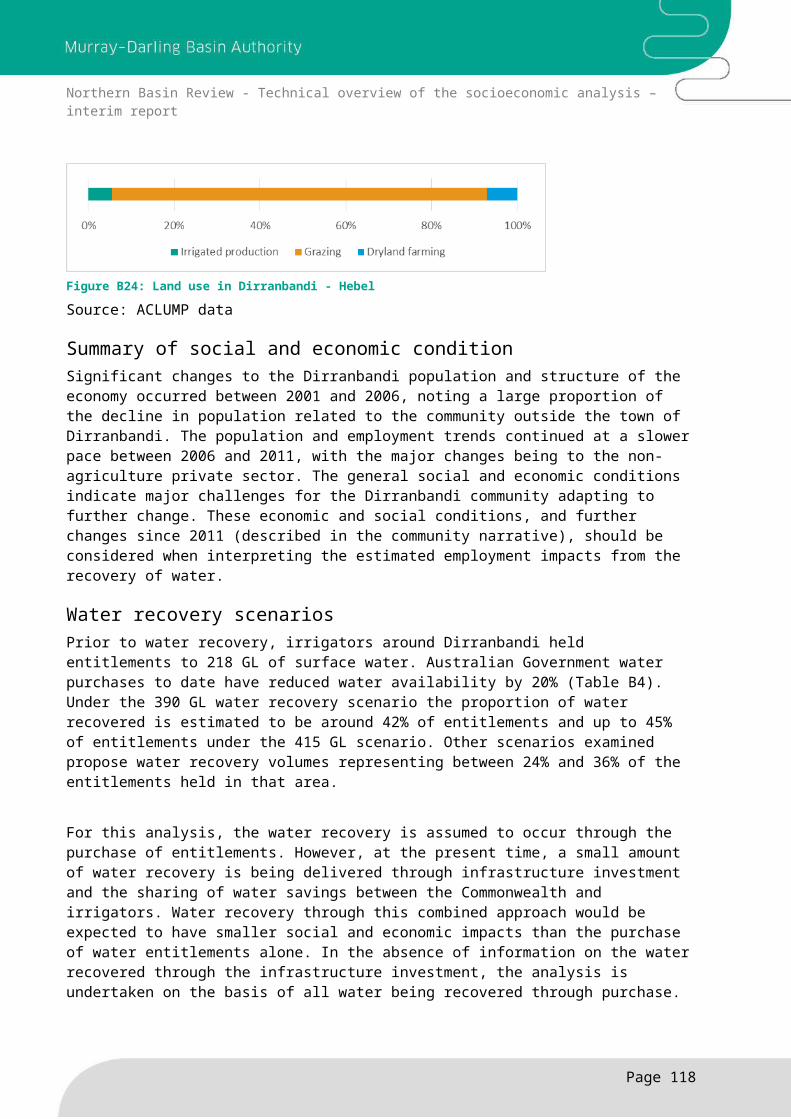
Northern Basin Review - Technical overview of the socioeconomic analysis – interim report
reasonable capacity for adapting to change. This social and economic data indicates the community modelling of employment change is not likely to require any further interpretation.
Water recovery scenariosPrior to the Basin Plan water recovery, irrigators around Narrabri had access to 20 GL of surface water and 15 GL of groundwater. Surface water availability for the Narrabri community is estimated to decrease by up to 6% under the 415 GL water recovery scenario (Table B9). The changes in surface water entitlements do not take into account groundwater availability and the reduction in groundwater entitlements under the groundwater recovery process in New South Wales (which finishes in 2017).
Table B9: Water recovery in Narrabri
Scenario Reduction in surface water available to irrigators278 0%320 A 1%320 B 2%320 C 1%345 2%350 4%390 4%415 6%
Modelling resultsLanduse modelling for the Narrabri community takes into account water diversions against the general security on and off-allocation and floodplain harvesting entitlements, and the use of groundwater. The landuse modelling estimates water recovery under the 415 GL scenario reduces the maximum potential area of irrigation by up 4% (Figure B54).
Figure B54: Irrigated hectares under water recovery scenarios in Narrabri
Page 118

Northern Basin Review - Technical overview of the socioeconomic analysis – interim report
The baseline community modelling for Narrabri estimates a decline in employment for the farm and farm-related sector (including seasonal workers) of around 17% (210 FTE) without the Basin Plan. For the other private business sector, the net affect across the period from 2001 is an 8-9% decline in employment (approximately 110 FTE), noting first a reduction in the period up to 2006 followed by growth in the sector from that time point.
Figure B55: Employment in Narrabri
The flow-through effect on employment in the farm and farm-related sector and the other private business sector from the water recovery scenarios are modest (Figures B56 and B57). It is estimated the effects on employment from the 415 GL water recovery scenario are a reduction in the farm and farm-related sector of around 1.5% and less than 1% in the other private business sector.
Figure B56: Farm-related employment under water recovery scenarios in Narrabri
Page 119

Northern Basin Review - Technical overview of the socioeconomic analysis – interim report
Figure B57: Other private business employment under water recovery scenarios in Narrabri
Largest effect: 415 GL scenario – 4% reduction in maximum area, 1.4% reduction in farm and farm-related jobs, 0.8% decrease in other private business jobs, 0.7% decrease in total jobs.
ImplicationsIf water recovery in the Narrabri community does not exceed the scenarios modelled, the effects on the community are expected to remain quite small. If a significantly higher level of water recovery is proposed, it would be necessary to consider the volume, timing and method of water recovery in the context of the underlying social and economic conditions of the Narrabri community.
Page 120

Northern Basin Review - Technical overview of the socioeconomic analysis – interim report
Appendix B15: NarromineAgriculture and close proximity to Dubbo are significant influences on the Narromine community.
Trends in socio-economic conditions Area population: increased from 4,580 to 5,196 persons (13%) between 2001 and 2011
o Mostly between 2001 and 2006 Town population: increased from 3,545 to 3,788 persons (7%) between 2001 and 2011
o Mostly between 2006 and 2011 42% of the town population was over 45 in 2011
o 36% in 2001o 25% increase in people aged 45 years or overo 4% decrease in people under 45
Total area workforce: increased by 19% (291 FTE) between 2001 and 2011 Mostly between 2001 and 2006
Agricultural workforce: declined by 11% (70 FTE) between 2001 and 2011o Mostly since 2006
Non-agriculture private workforce: increased 26% (155 FTE) between 2001 and 2011 o Mostly between 2001 and 2006o Very few mining jobs, small manufacturing sector (70 FTE)
Government services workforce: increased 68% (192 FTE) between 2001 and 2011o Mostly between 2001 and 2006
Economic structure: o 2001: 39% agriculture, 42% non-agriculture private, 19% government serviceso 2011: 29% agriculture, 44% non-agriculture private, 27% government services
Unemployment in the town: 8% in 2011 SEIFA for town:
2011: decile 4 for education and occupation; 3 for economic resources, disadvantage, advantage and disadvantage
2006: decile 4 for advantage and disadvantage
Narromine's agricultural production is a mix of grazing, dryland farming and irrigation (Figure B58). Cotton is the dominant irrigated crop, with irrigation of some cereals, pasture, horticulture and other broadacre crops.
Figure B58: Land use in Narromine
Summary of social and economic conditionPopulation and employment growth in the Narromine community was strongest during 2001-06 and possibly influenced by its close proximity to Dubbo. In terms of employment, strong jobs growth in the non-agriculture private and government services sectors more than offset job losses in the agriculture sector. The general social and economic conditions of the Narromine community suggest a reasonable capacity for adapting to change. Given these social and
Page 121

Northern Basin Review - Technical overview of the socioeconomic analysis – interim report
economic conditions, the modelling results should not require any additional interpretation of the social and economic effects of water recovery.
Water recovery scenariosPrior to water recovery, irrigators around Narromine had access to 40 GL of surface water and 51 GL of groundwater. With the water recovery to date, irrigators have transferred approximately 32% of their surface water entitlements to government. After accounting for the recovery of water through purchase and as water savings derived from investment in infrastructure, the estimated net effect is a 20% reduction in the volume of surface water available for irrigation (Table B10). Only under the 415 GL scenario does water recovery in Narromine increase above this level. Water recovery in Narromine is lower under the 320 B, 320 C and 345 scenarios than under the 278 GL scenario. These figures do not take into account groundwater use across time nor the effects of the groundwater recovery process in New South Wales, the latter finishing in 2017.
Table B10: Water recovery scenarios examined for the Narromine community
Scenario Total reduction in surface water available to irrigators
Net reduction in surface water available to irrigators
278 32% 20%320 A 32% 20%320 B 29% 17%320 C 19% 7%345 28% 16%350 32% 20%390 32% 20%415 34% 22%
Modelling resultsThe landuse modelling for Narromine takes into account high security and general security on and off-allocation diversions and use of groundwater when estimating the area of irrigated production. For the 278 GL scenario, it is anticipated the maximum area of irrigation is likely to be reduced by approximately 18% (Figure B59). If the volume of water recovery is reduced (320 GL B, 320 GL C and 345 GL water recovery scenarios) the impact on the maximum area of irrigation is also likely to be smaller.
Page 122

Northern Basin Review - Technical overview of the socioeconomic analysis – interim report
Figure B59: Irrigated hectares under water recovery scenarios in Narromine
The baseline community modelling for Narromine estimates a decline in employment for the farm and farm-related sector (including seasonal workers) in the absence of the Basin Plan of around 18% (116 FTE). For the other private business sector, it is estimated employment has increased across the period 2000-01 to 2012-13 by approximately 18% (101 FTE).
2001 2002 2003 2004 2005 2006 2007 2008 2009 2010 2011 2012 20130
100
200
300
400
500
600
700
800
Farm and farm-related Other private business
Year
FTE
Jobs
Figure B60: Modelled baseline of employment in Narromine
The flow-through effect on employment in the farm and farm-related sector with the current water recovery is estimated to be around 5-6% (27-40 FTE) in maximum irrigation years and around 4% in lower production years (Figure B61). This level of change is substantive. The impact on employment is likely to be smaller if the water recovery volume is reduced (as indicated for the 320 GL B, 345 GL and 320 GL C water recovery scenarios.
Page 123

Northern Basin Review - Technical overview of the socioeconomic analysis – interim report
Figure B61: Farm-related employment under water recovery scenarios in Narromine
For the other private business sector, the effects of a reduction in irrigated area and farm and farm-related employment were estimated as being a fall in employment of around 3-5% (20-30 FTE) in the maximum production years and 3% in the low production years.
Figure B62: Other private business employment under water recovery scenarios in Narromine
Largest effect: 415 GL scenario – 19% reduction in maximum area, 5.8% reduction in farm and farm-related jobs, 4.4% decrease in other private business jobs, 3.6% decrease in total jobs.
ImplicationsThe effects of water recovery and the associated reduction in irrigated area are expected to have an identifiable effect on the local economy and community of Narromine. If the water recovery volume is reduced as indicated in Table B10 for the 320 GL C scenario, it will be difficult to distinguish the effects of water recovery from all the other changes affecting the Narromine community. These modelling results describe the expected long-term effects on employment. In
Page 124

Northern Basin Review - Technical overview of the socioeconomic analysis – interim report
the Narromine economy and community, there was a short-term stimulus from recovering part of the water through infrastructure investment.
Page 125

Northern Basin Review - Technical overview of the socioeconomic analysis – interim report
Appendix B16: NynganNyngan is a service centre for agriculture and mining.
Trends in socio-economic conditions Area population: decreased from 2,494 to 2,326 persons (7%) between 2001 and 2011
o Mostly between 2001 and 2006 Town population: fairly stable between 2001 and 2011
o 4% decrease between 2001-06, 4% increase between 2006-11 40% of the town population was over 45 in 2011
o 40% in 2001o No change in proportion of people over or under 45 years of age
Total area workforce: decreased 5% (41 FTE) between 2001 and 2011 Mostly between 2006 and 2011
Agricultural workforce: decreased 31% (113 FTE) between 2001 and 2011 Non-agriculture private workforce: increased 15% (46 FTE) between 2001 and 2011
o Few manufacturing jobs, mining jobs increased from 19 to 114 FTE Government services workforce: increased 15% (25 FTE) between 2001 and 2011
o 21% increase between 2001-06, 6% decrease 2006-11 Economic structure:
o 2001: 43% agriculture, 37% non-agriculture private, 19% government serviceso 2011: 31% agriculture, 45% non-agriculture private, 24% government services
Unemployment in the town: 6% in 2011 SEIFA for town:
2011: decile 4 for education and occupation, disadvantage, advantage and disadvantage; 3 for economic resources
2006: decile 3 for education and occupation, disadvantage, advantage and disadvantage
Grazing and dryland farming are the main land uses in Nyngan (Figure B63). Irrigated agriculture is mostly cotton, ranging up to 500 hectares per annum.
Figure B63: Land use in Nyngan
Source: ACLUMP data
Summary of social and economic conditionEven though the declines in the area population and workforce were relatively small, there was a significant change in Nyngan’s economic structure between 2001 and 2011. As the size of the agricultural workforce decreased, the non-agriculture private sector and government services sector employment increased. The general social and economic conditions in Nyngan indicate the community is likely to have a reasonable capacity for adapting to change.
Page 126

Northern Basin Review - Technical overview of the socioeconomic analysis – interim report
Modelling resultsThe baseline community modelling for Nyngan estimates a decline in employment for the farm and farm-related sector of around 16% (55 FTE, Figure B64) between 2000-01 and 2013-14. Employment in the other private business sector is estimated to have been fairly stable with around 240-250 FTE.
Figure B64: Modelled baseline of employment in Nyngan
ImplicationsWhile the farm and farm-related sector employment declined between 2001-06, growth in the mining sector provided an employment stimulus in the Nyngan community during 2006-11. It is this growth together with the increase in government services jobs which helped retain some stability in the other private business sector. The stable population and demographic structure and general social and economic conditions combined with internal changes to the Nyngan economy indicate a reasonable capacity for adapting to changes.
Page 127

Northern Basin Review - Technical overview of the socioeconomic analysis – interim report
Appendix B17: St GeorgeSt George is a service centre for a number of small rural communities, including Dirranbandi.
Trends in socio-economic conditions Area population: decreased from 3,238 to 3,009 persons (7%) between 2001 and 2011
o Decreased 16% between 2001-06, increased 9% between 2006-11 Town population: decreased from 2,778 to 2,647 persons (5%) between 2001 and 2011
o Decreased 13% between 2001-06, increased 8% between 2006-11 35% of the town population was over 45 in 2011
o 31% in 2001o 8% increase in people aged 45 years and overo 10% decrease in people under 45
Total area workforce: decreased 19% (291 FTE) between 2001 and 2011 Decreased by 22% between 2001-06, increased 3% between 2006-11
Agricultural workforce: declined 32% (207 FTE ) between 2001 and 2011o Decreased by 34% between 2001-06; increased by 2% between 2006-11
Non-agriculture private workforce: declined 19% (117 FTE) between 2001 and 2011o Mostly between 2001 and 2006o Few jobs in mining, 2% of jobs in manufacturing, small ginning sector
Government services workforce: relatively constant between 2001 and 2011 (290 FTE)o Decreased by 9% (26 FTE) between 2001-06, increased 12% between 2006-11
Economic structure:o 2001: 42% agriculture, 39% non-agriculture private, 19% government serviceso 2011: 37% agriculture, 39% non-agriculture private, 24% government services
Unemployment in the town: 6% in 2011 SEIFA for town:
2011: decile 6 for education and occupation; 5 for disadvantage, advantage and disadvantage; 4 for economic resources
2006: decile 6 for advantage and disadvantage, economic resources
Land predominantly used for grazing with some dryland farming. 9% of total agricultural land is used for irrigation (Figure B65). Cotton is the dominant irrigated crop. Other irrigated crops include table and wine grapes, vegetables, pasture, cereals, hay and broadacre summer crops.
Figure B65: Land use in the St George area
Source: ACLUMP data
Summary of social and economic conditionThe St George community is one where there is considerable variability within the population against an underlying trend of overall decline. A similar pattern of change and decline, although larger than for the population, is observed for employment. While the 2011 SEIFA are a positive indication of general social and economic conditions in the community, the underlying population
Page 128

Northern Basin Review - Technical overview of the socioeconomic analysis – interim report
and employment trends, combined with challenges for the community in 2014 and 2015 from drought and the flood recovery activities finishing, suggest there are considerable pressures on the local economy and community. The modelled estimates of change in employment from water recovery for St George should be interpreted in the context of this information and after taking into account the flow-on effects from water recovery in Dirranbandi.
Water recovery scenariosPrior to water recovery, irrigators in the St George community held 216 GL of surface water entitlement. Water recovery in St George to date has reduced the entitlements held by 9%. After taking into account the sharing of water savings from Commonwealth infrastructure investment, the net reduction in water available for production is around 7% (Table B11). Across the water recovery scenarios examined, the maximum reduction in water availability is 19% under the 390 GL and 415 GL scenarios.
Table B11: Water recovery scenarios examined for the St George community
Scenario Total reduction in water available to irrigators
Net reduction in water available to irrigators
278 9% 7%320 A 12% 10%320 B 15% 13%320 C 15% 13%345 13% 11%350 9% 7%390 21% 19%415 21% 19%
Modelling resultsThe landuse modelling for St George takes into account diversions against supplemented, unsupplemented and overland flow entitlements. The decline in surface water availability from the water recovery to date is estimated to have a demonstrable reduction of around 8% on the maximum area of irrigation (Figure B66). In the 415 GL and 390 GL scenarios, the estimated reduction in water availability is estimated to reduce the maximum area of irrigation by around 23%.In each of the scenarios examined, there is an estimate of potential water recovery from the areas upstream of St George. In the 278 GL scenario, 7 GL of water recovery occurs above St George, while in the 320 GL B scenario, water recovery above St George is estimated to be 18.5 GL. Variations to water recovery upstream of St George together with the split of water recovery between St George and Dirranbandi will impact on the estimated changes to the maximum area of irrigation. The different levels of assumed water recovery in St George and the impacts on the expected maximum area of production for the scenarios are provided in Figure B67. For the St George community, water recovery has an effect of reducing the maximum area irrigated by at least 15% in the 320 GL B, 345 GL, 390 GL and 415 GL water recovery scenarios.
Page 129

Northern Basin Review - Technical overview of the socioeconomic analysis – interim report
Figure B66: Irrigated hectares under water recovery scenarios in St George
Figure B67 Reduction in maximum area under water recovery scenarios in St George
The baseline community modelling for St George estimates a decline in employment for the farm and farm-related sectors of around 6% (45 FTE) in the absence of the Basin Plan across the period from 2000-01. In the other private business sector, employment fell by around 14% (75 FTE). Note however, the considerable variability in employment for the farm and farm-related sector.
Page 130

Northern Basin Review - Technical overview of the socioeconomic analysis – interim report
Figure B68: Modelled baseline employment in St George
The flow-through effect of water recovery on employment in the farm and farm-related sector indicates a further decline of approximately 2.5-4% (15-30 FTE) under the 278 GL scenario (Figure B69). For the 320 GL A, 345 GL, 320 GL B and 320 GL C water recovery scenarios, the decline in farm and farm-related sector employment is estimated at 4-7% (30-50 FTE). These changes will be identifiable against the other changes occurring in the region. Under the 390 GL and 415 GL scenarios, there is estimated to be a larger impact on employment in the farm and farm-related sector, with a decline of 7-11% (50-75 FTE), noting the largest effects are in the wetter years where the change in employment is contributed to by the reduction in demand for seasonal workers.
Figure B69: Farm-related employment under water recovery scenarios in St George
Changes in the farm and farm-related sector employment are expected to impact on employment in the other private business sector in St George (Figure B70). The estimated changes would be discernible from the other changes affecting the community. With the 278 GL scenario, the reduction in employment in the other private business sector is estimated to be around 2% (10
Page 131
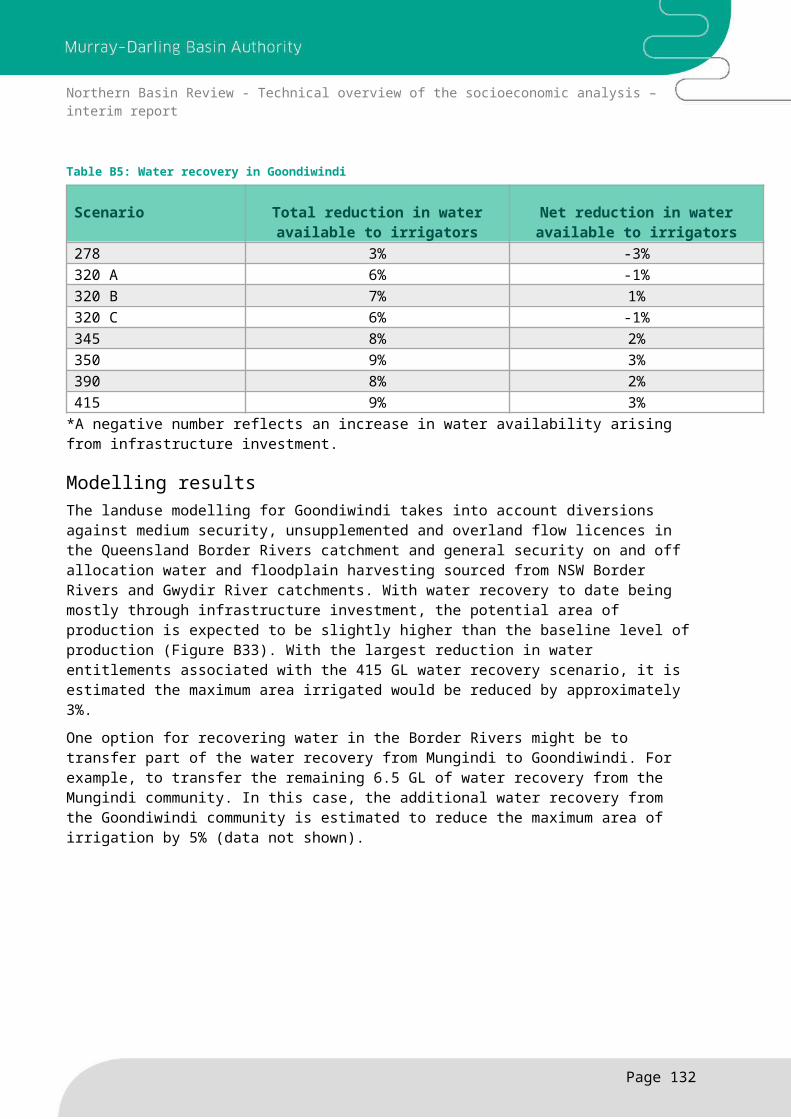
Northern Basin Review - Technical overview of the socioeconomic analysis – interim report
FTE). This is estimated to increase to around 5-7% (20-33 FTE) under the 390 GL and 415 GL water recovery scenarios.
Figure B70: Other private business employment under water recover scenarios in St George
Flow-on effects of Dirranbandi water recoverySt George businesses, particularly those businesses providing direct inputs to agriculture, described their relationships with the irrigation sector in Dirranbandi. As a consequence, water recovery in Dirranbandi is expected to have a flow-on effect to some St George businesses. Using the 390 GL water recovery scenario, if one-fifth of the reduction in Dirranbandi businesses flows through to the supporting businesses in St George, it is estimated the effects on employment in the farm and farm-related sector in St George would fall by 10-16% (70-100 FTE; Figure B71). For the other private business sector, the estimated impact on employment is around 8-10% (35-43 FTE; Figure B70), noting the estimated reduction was around 5-7% (20-30 FTE) without the flow-on effects from the Dirranbandi water recovery.
Figure B71 Impact of 390 GL water recovery scenario on farm and farm-related jobs in St George
Page 132

Northern Basin Review - Technical overview of the socioeconomic analysis – interim report
Figure B72 Impact of 390 GL water recovery scenario on other private business sector jobs in St George
ImplicationsThe effects of water recovery on employment in the St George community will add to the job losses (120 FTE, or 7.6% of the labour force) which occurred in the absence of the Basin Plan. With the current water recovery, the total estimated impact on employment is around 25-40 FTE in the St George workforce. That is around 1.8-2.7% of total jobs.
Larger impacts are expected for the economy and community under the 390 GL and 415 GL water recovery scenarios. Estimated changes from water recovery in St George are estimated to be 75-98 FTE (5-6.5% of the total workforce). It will be considerably challenging for the community to adapt to the estimated changes arising from the 390 GL water recovery scenario. When taking into account the flow-on effects from water recovery in Dirranbandi plus the underlying social and economic conditions in St George, the effects on the community are expected to increase further. Using the 390 GL water recovery scenario, the combined effects working their way through the St George community are estimated to around 90-130 FTE (6.4-8.7% of the total workforce).
The effects in St George, given the underlying social and economic conditions, are large enough to have implications for changes to the population in the longer term.
Page 133

Northern Basin Review - Technical overview of the socioeconomic analysis – interim report
Appendix B18: TrangieTrangie is a small agriculture-dependent community.
Trends in socio-economic conditions Area population: decreased from 1,517 to 1,219 persons (20%) between 2001 and 2011
o 28% decrease between 2001-06, 8% increase between 2006-11 Town population: decreased from 945 to 850 persons (10%) between 2001 and 2011
o Mostly between 2001 and 2006 48% of the town population was over 45 in 2011
o 36% in 2001o 20% increase in people aged 45 years or oldero 27% decrease in people under 45
Total area workforce: decreased 22% (115 FTE) between 2001 and 2011 35% decrease between 2001-06, 13% increase between 2006 and 2011
Agricultural workforce: decreased 22% (64 FTE) between 2001 and 2011o 34% decrease between 2001-06, 12% increase between 2006-11
Non-agriculture private workforce: decreased 44% between 2001 and 2011o 57% decrease between 2001-06, 13% increase between 2006-11o Very small manufacturing sector, no mining jobs
Government services workforce: increased 14% (11 FTE) between 2001 and 2011o Mostly between 2006 and 2011
Economic structure:o 2001: 57% agriculture, 28% non-agriculture private, 15% government serviceso 2011: 58% agriculture, 20% non-agriculture private, 22% government services
Unemployment in the town: 9% in 2011 SEIFA for town:
2011: decile 3 for education and occupation; 1 for economic resources, disadvantage, advantage and disadvantage
2006: decile 2 for advantage and disadvantage
Trangie has a diverse agricultural sector with grazing, dryland farming and irrigated cropping (Figure B73). Cotton is the dominant irrigated crop, together with some cereals and pasture.
Figure B73: Land use in Trangie
Summary of social and economic conditionMuch of the changes in population for the Trangie community are associated with a sharp decline in the size of the farming community, particularly between 2001 and 2006. A small recovery in the community population for 2006 to 2011 is consistent with the general trend in employment. The pattern of population and employment change coincides with a 7-year period of very limited irrigation production and falling diversity in the local economy. The general social and economic
Page 134

Northern Basin Review - Technical overview of the socioeconomic analysis – interim report
conditions for Trangie, confirmed during the community consultations and discussed in the narrative, should be considered when interpreting the modelling results.
Water recovery scenariosPrior to water recovery, irrigators around Trangie had access to 48 GL of surface water and 8 GL of groundwater. Water recovery to date in Trangie is a combination of State water entitlement purchases, Commonwealth entitlement purchase and infrastructure investment. While the surface water entitlements purchased represent 34% of the 48 GL of water owned by irrigators prior to recovery, the net effect on the irrigation water available to irrigators is a reduction of approximately 18% (Table B12). Under the 415 GL scenario water recovery in Trangie increases to 22% of the entitlements held by irrigators. Estimated water recovery for the Trangie community is lower under the 320 B, 320 C and 345 scenario than under the 278 GL scenario. The estimated changes in surface water availability do not take into account groundwater availability (and use) nor the gradual reduction in groundwater entitlements proceeding as part of the State government groundwater recovery process.
Table B12: Water recovery scenarios examined for the Trangie community
Scenario Total reduction in surface water available to irrigators
Net reduction in surface water available to irrigators
278 34% 20%320 A 34% 20%320 B 32% 18%320 C 22% 8%345 30% 16%350 34% 20%390 34% 20%415 36% 22%
Modelling resultsThe landuse modelling for Trangie takes into account general security on and off-allocation diversions and groundwater use. The net change in surface water availability under the 278 GL scenario is estimated to reduce the maximum area irrigated in the Trangie area by around 16% (Figure B74). Under the 415 GL water recovery scenario, the maximum area irrigated is expected to be reduced by around 18%. For the scenarios where water recovery is less than the current volume of recovery, the change in the maximum area of irrigation is around 6% for the 320 GL C scenario, 13% for the 345 GL scenario and 14% for the 320 GL B scenario.
Page 135

Northern Basin Review - Technical overview of the socioeconomic analysis – interim report
Figure B74: Irrigated hectares under water recovery scenarios in Trangie
The baseline community modelling for Trangie estimates a decline in employment for the farm and farm-related sector for the period 2000-01 to 2004-05 and a slow increase across the period out to 2012-13 (Figure B75). While the net effect (in the absence of the Basin Plan) is estimated to be a reduction in employment of around 9% (30 FTE), the reduction between 2000-01 and 2004-5 is approximately 28% (85 FTE) preceding the 19% recovery in employment for that sector over the following 7 years. In the other private business sector, there is an underlying decrease in employment between 2000-01 and 2012-13 of approximately 18% (20 FTE). That is a reduction in employment for that sector of 45% (50 FTE) followed by an increase of 27% (30 FTE) over the subsequent 7 years.
Figure B75: Modelled baseline employment in Trangie
The flow-through effect of water recovery for the farm and farm-related sector indicates a potential impact on employment of approximately 3.5-5% with the 278 GL scenario (Figure B76). That is, a reduction in employment of around 10-15 FTE. For the 415 GL water recovery
Page 136

Northern Basin Review - Technical overview of the socioeconomic analysis – interim report
scenario, the effects would be slightly larger while being relatively smaller under the 345 GL, 320 GL B and 320 GL C scenarios.
Figure B76: Farm-related employment under water recovery scenarios in Trangie
For the other private business sector, the effects on employment are slightly larger than for the changes in the farm and farm-related sector (Figures B76 and B77). This greater percentage effect is a function of the very small size of the other private business sector in Trangie and the relatively large requirement for seasonal workers to support the irrigation sector. With the 278 GL scenario, the estimated effect is a reduction in employment of around 4-7%. That is, around 5-7 FTE.
Figure B77: Other private business employment under water recovery scenarios in Trangie
Page 137

Northern Basin Review - Technical overview of the socioeconomic analysis – interim report
Largest effect: 415 GL scenario – 18% reduction in maximum area, 5.1% reduction in farm and farm-related jobs, 6.8% decrease in other private business jobs, 4.2% decrease in total jobs.
ImplicationsThe effects of water recovery in the Trangie community have been influenced by the method of water recovery, with significant recovery derived from water savings in the infrastructure program. However, the potential impact on the maximum area irrigated is still estimated to be a reduction of between 14-18%. The subsequent effect on employment, although estimated to be quite modest (around 15-22 FTE out of a total of 465 FTE in 2012-13), it should be noted the change is occurring in a community with quite challenging economic and social conditions.
Page 138

Northern Basin Review - Technical overview of the socioeconomic analysis – interim report
Appendix B19: WalgettWalgett is a small rural community supporting mostly grazing and dryland farming.
Trends in socio-economic conditions Area population: decreased from 2,582 to 2,242 persons (13%) between 2001 and 2011
o Mostly between 2001 and 2006. Town population: decreased from 1,812 to 1,626 persons (10%) between 2001 and 2011 33% of the town population was over 45 in (2006 and) 2011
o 29% in 2001o 2% increase in people aged 45 years or oldero 15% decrease in people under 45
Total area workforce: decreased by 3% (26 FTE) between 2001 and 2011 Agricultural workforce: decreased by 7% (20 FTE) between 2001 and 2011 Non-agriculture private workforce: decreased by 21% (52 FTE) between 2001 and 2011
o Mostly between 2001 and 2006o 30 FTE jobs in mining plus manufacturing in 2011
Government services workforce: increased 19% (42 FTE) between 2001 and 2011o Mostly between 2001 and 2006
Economic structure:o 2001: 37% agriculture, 33% non-agriculture private, 30% government serviceso 2011: 36% agriculture, 27% non-agriculture private, 37% government services
Unemployment in the town: 7% in 2011 SEIFA for town:
2011: decile 7 for education and occupation; 1 for economic resources; 2 for disadvantage, advantage and disadvantage
2006: decile 6 for education and occupation; 3 for disadvantage and advantage; 1 for disadvantage
Agricultural land use in Walgett is primarily focused on grazing and dryland farming with only a small area of potential irrigated production (Figure B78). Cotton is the dominant irrigated crop, with some irrigation of pasture and cereals.
Figure B78: Land use in Walgett
Summary of social and economic conditionChanges to the population and local economy for the Walgett community occurred mostly between 2001 and 2006. While there were smaller changes between 2006 and 2011, discussions during the consultations brought attention to the additional effects the 2014 and 2015 drought has had on the community. The general social and economic conditions indicate the difficulties the community is likely to have adapting to change.
Page 139

Northern Basin Review - Technical overview of the socioeconomic analysis – interim report
Water recovery scenariosPrior to water recovery, irrigators in the Walgett community held entitlements to approximately 46 GL of surface water. To date, there has not been any water recovery from the Walgett community. Under our modelled water recovery scenarios, the maximum reduction in water entitlements held by irrigators is assumed to be around 3% under the 415 GL scenario (Table B13).
Table B13: Water recovery scenarios examined for the Walgett community
Scenario Reduction in water available to irrigators278 0%320 A 1%320 B 1%320 C 1%345 2%350 2%390 2%415 3%
Modelling resultsThe landuse modelling for the Walgett community takes into account diversions against general security on and off-allocations for the Namoi catchment and diversions of Barwon-Darling water. Water recovery in the Walgett community is estimated to have modest effects on the maximum area of irrigation (Figure B79). Under the 415 GL scenario, the maximum area of irrigation is estimated to fall by around 6%.
Figure B79: Irrigated hectares under water recovery scenarios in Walgett
Page 140

Northern Basin Review - Technical overview of the socioeconomic analysis – interim report
The baseline community modelling for Walgett estimates a decline in farm and farm-related sector employment in the absence of the Basin Plan is around 20% (60 FTE) for the period since 2000-01 (Figure B80). For the other private business sector, the underlying change in employment is also estimated to be around 20% (40 FTE).
Figure B80: Employment in Walgett
The flow-through effect on employment from the proposed water recovery scenarios is quite small for the farm and farm-related sector, being less than 1% for all scenarios examined (Figure B81). Potential impacts on employment in the other private business sector are estimated to be less than 0.5% for all the scenarios examined (Figure B82).
Figure B81: Farm-related employment under water recovery scenarios in Walgett
Page 141

Northern Basin Review - Technical overview of the socioeconomic analysis – interim report
Figure B82: Other private business employment under water recovery scenarios in Walgett
Largest effect: 415 GL scenario – 6% reduction in maximum area, 0.5% reduction in farm and farm-related jobs, 0.2% decrease in other private business jobs, 0.2% decrease in total jobs.
ImplicationsIf water recovery in the Walgett community does not exceed the scenarios modelled, the effects on the community are expected to remain quite small and difficult to distinguish from the underlying trends of change in the community. If a significantly higher level of water recovery is considered, it would be necessary to assess how the volume, timing and method of additional water recovery might impact on the community.
Page 142

Northern Basin Review - Technical overview of the socioeconomic analysis – interim report
Appendix B20: WarrenWarren is a small community with high dependence on agriculture.
Trends in socio-economic conditions Area population: decreased from 2,690 to 2,456 persons (9%) between 2001 and 2011
o Mostly between 2001 and 2006 Town population: decreased at a constant rate from 1,784 to 1,520 persons (15%)
between 2001 and 2011 48% of the town population was over 45 in 2001
o 36% in 2001o 13% increase in people aged 45 years or overo 30% decrease in people under 45
Total area workforce: decreased 12% (124 FTE) between 2001 and 2011o Nearly all between 2001 and 2006
Agricultural workforce: decreased 20% (110 FTE) between 2001 and 2011o Nearly all between 2001 and 2006
Non-agriculture private workforce: decreased 21% (63 FTE) between 2001 and 2011o Nearly all between 2001 and 2006.o Very few mining or manufacturing jobs (30 FTE in 2011)
Government services workforce: increased 26% (43 FTE) between 2001 and 2011o Mostly between 2001 and 2006.
Economic structure:o 2001: 54% agriculture, 30% non-agriculture private, 16% government serviceso 2011: 50% agriculture, 27% non-agriculture private, 23% government services
Unemployment in the town: 9% in 2011 SEIFA for town:
o 2011: decile 4 for education and occupation; 2 for disadvantage, advantage and disadvantage; 1 for economic resources
o 2006: decile 2 for economic resources Warren has a diverse agricultural sector, with significant areas of grazing, dryland farming and irrigated cropping (Figure B83). Cotton is the dominant irrigated crop, with some irrigated pasture and cereals.
Figure B83: Land use in Warren
Summary of social and economic conditionMajor changes to the population and economy in Warren arose between 2001 and 2006. Most of those changes have been felt more in the town of Warren than in the farming community. There was some further decline in the population and employment between 2006 and 2011. The general measures of social and economic conditions indicate the challenging circumstances likely to affect how the community adapts to change. These pressures continued into 2014 and
Page 143

Northern Basin Review - Technical overview of the socioeconomic analysis – interim report
2015, as verified during the community consultations. These social and economic conditions, together with the volume and pace of water recovery, should be taken into account when interpreting the community modelling outputs.
Water recovery scenariosPrior to water recovery, irrigators around Warren held entitlements to 139 GL of surface water. Water recovery through the State water recovery process, the Commonwealth purchase of entitlements and infrastructure investment have reduced the volume of entitlements irrigators hold by around 32%. After accounting for the water savings shared between irrigators and the Commonwealth from the infrastructure investment, the effect is a net reduction in water available to irrigators of around 30% under the 278 GL scenario (Table B14). Under the 415 GL scenario the level of water recovery in Warren increases to give a net reduction in irrigation water availability of around 32%. With the 320 B, 320 C and 345 GL scenarios there is estimated to be a smaller volume of water recovered from irrigators. In considering the effect of water recovery, it is important to note with the 278 GL scenario that around 90% of the water was recovered in 2009-2011.
Table B14: Water recovery scenarios examined for the Warren community
Scenario Total reduction in water available to irrigators
Net reduction in water available to irrigators
278 GL 32% 30%320 A 32% 30%320 B 29% 27%320 C 19% 17%345 28% 26%350 32% 30%390 32% 30%415 34% 32%
Modelling resultsThe landuse modelling for Warren takes into account diversions against general security on and off allocation entitlements. For the 278 GL water recovery scenario, the reduction in water availability is expected to reduce the maximum area of production by approximately 35% (Figure B84). The 415 GL water recovery scenario has a modest additional effect on the maximum area irrigated. With the 320 GL B and 345 GL water recovery scenarios, the effect is a reduction in the maximum area of 32% and 30%, respectively. The largest change is with the 320 GL C water recovery scenario. In this case the estimated effect on the maximum area of production is around 19%.
Page 144

Northern Basin Review - Technical overview of the socioeconomic analysis – interim report
Figure B84: Irrigated hectares under water recovery scenarios in Warren
The baseline community modelling for Warren estimates a decline in employment for the farm and farm-related sector in the absence of the Basin of around 19% (130 FTE; Figure B85). Note the decline between 2000-01 and 2008-09 is approximately 37% (185 FTE). The improvement over the last three years examined is the increase in water allocations and greater labour demands (particularly seasonal workers). For the other private business sector, the underlying trend is a fall in employment of around 20% (55 FTE).
Figure B85: Modelled baseline of employment in Warren
The large effect on farm and farm-related employment under all water recovery scenarios reflects the large estimated change in irrigated area and structure (agriculture-dependence) of the local economy (Figure B86). With the 278 GL scenario, the estimated effect is a reduction in employment of around 8% (35-40 FTE) in dry years and 15% (80-100 FTE) in years where the maximum area is irrigated (and hence a greater reliance on seasonal workers). There are small changes to these estimates for the 415 GL, 345 GL and 320 GL B scenarios. With the 320 GL C scenario the effects on employment in the farm and farm-related sector are halved.
Page 145

Northern Basin Review - Technical overview of the socioeconomic analysis – interim report
Figure B86: Farm-related employment under water recovery scenarios in Warren
Due to the structure of the local economy being so agriculture-dependent, the effects of a change in the irrigation sector have strong flow-through effects to the other private business sector. For this sector, the effect of water recovery to date is an estimated reduction in employment of between 6.5% (12-15 FTE) and 12% (26-32 FTE) (Figure B87). For the 415 GL, 320 GL B and 345 GL water recovery scenarios, there are small differences to these estimates. With the 320 GL C water recovery scenario, the effect on employment in the other private business sector is estimated to lead to around half the reduction in employment expected for the 278 GL scenario.
Figure B87: Other private business employment under water recovery scenarios in Warren
Largest effect: 415 GL scenario – 38% reduction in maximum area, >16% reduction in farm and farm-related jobs, >12% decrease in other private business jobs, >11.7% decrease in total jobs.
ImplicationsWater recovery in the Warren community so far is estimated to have had a significant impact on the maximum area of production and employment in the farm and farm-related and other private
Page 146

Northern Basin Review - Technical overview of the socioeconomic analysis – interim report
business sectors. With this scenario, the total estimated reduction in employment is around 47-55 FTE in dry years and 106-132 FTE in the years of maximum irrigated production. Relative to the whole economy, these estimates represent approximately 5-6% of total employment in dry years, and 10-12% of total employment in the maximum irrigation years. Given the underlying social and economic condition of the Warren community and economy, it is highly likely the effects of this level of water recovery (and the pace of that recovery) would lead to larger impacts than that provided by the modelled employment impacts. The magnitude of the changes would suggest the potential for population decline to continue, all other things remaining constant.
The 415 GL, 320 GL B and 345 GL water recovery scenarios propose relatively small changes to the estimates of effect on the Warren community. With the 320 GL C water recovery scenarios, the reduction in the maximum area irrigated and employment would be around half of the estimated changes for water recovery to date. For this scenario, it is assumed the reduced recovery volume would allow some environmental water entitlements to be sold back into the consumptive pool of entitlements.
Page 147

Northern Basin Review - Technical overview of the socioeconomic analysis – interim report
Appendix B21: Wee WaaWee Waa is small agriculture-dependent community.
Trends in socio-economic conditions Area population: decreased from 3,175 to 3,032 persons (4%) between 2001 and 2011
o 11% increase between 2001-06, 15% decrease between 2006-11 Town population: decreased from 1,819 to 1,656 persons (9%) between 2001 and 2011
o Mostly between 2001 and 2006 39% of the town population was over 45 in 2011
o 30% in 2001o 18% increase in people aged 45 years or overo 21% decrease in people under 45
Total area workforce: decreased by 13% (162 FTE) between 2001 and 2011o Mostly between 2006 and 2011
Agricultural workforce: decreased by 15% (105 FTE) between 2001 and 2011o Mostly between 2006 and 2011
Non-agriculture private workforce: decreased by 32% (124 FTE) between 2001 and 2011o Mostly between 2006 and 2011o No mining jobso Manufacturing jobs fell from 82 in 2001 to 25 in 2011
Government services workforce: increased 31% (43 FTE) between 2001 and 2011o Mostly between 2001 and 2006
Economic structure:o 2001: 58% agriculture, 31% non-agriculture private, 11% government serviceso 2011: 59% agriculture, 24% non-agriculture private, 16% government services
Unemployment in the town: 7% in 2011 SEIFA for town:
o 2011: decile 3 for education and occupation, disadvantage, advantage and disadvantage; 2 for economic resources
o 2006: decile 6 for education and occupation; 5 for advantage and disadvantage; 3 for economic resources
Wee Waa landuse is a mix of grazing, dryland farming and irrigated cropping (Figure B86). Of the communities examined, Wee Waa has the largest concentration of irrigation (14% of land use). Irrigated crops grown include cotton, pasture, vegetables, cereals and other broadacre crops.
Figure B88: Land use in Wee Waa
Summary of social and economic conditionWhile the town of Wee Waa had a significant decline in population between 2001 and 2006, a larger change in the population occurred in the farming areas of the community between 2006 and 2011. This large change in the farming community of Wee Waa is expected to have had a
Page 148

Northern Basin Review - Technical overview of the socioeconomic analysis – interim report
significant flow-on effects for the town businesses, noting the significant decline in agriculture and non-agriculture private sector employment for the 2006-11 period, whereas the growth in government service jobs largely occurred between 2001 and 2006. The decline in jobs during 2006-11 coincides with changes to the general social and economic conditions for the town of Wee Waa and reduced complexity of the economy. These quite challenging, underlying economic and social conditions should be taken into account when interpreting the modelled effects of water recovery on employment. That interpretation should consider the volume, timing and method of water recovery beyond the level of water recovery to date.
Water recovery scenariosPrior to water recovery, irrigators around Wee Waa had access to 158 GL of surface water and 86 GL of groundwater. Water recovery through buyback to date in Wee Waa (the 278 GL scenario) has reduced water available to irrigators by 4%, whilst saving from the infrastructure investment effectively increased water availability by 2%. The net reduction is a reduction of 2% in the water available for production. The reduction in water availability is up to 10% in the 415 GL scenario (Table B15). These changes in surface water availability do not take into account groundwater use by irrigators nor the gradual reduction in groundwater availability, proceeding through the State groundwater recovery process (which finishes in 2017). When considering the total water resource (244 GL) a 10% recovery of surface water (16 GL) represents approximately 6.5% of the total water resource held by the Wee Waa community. Some analysis is provided to indicate the potential effects on production when the ground and surface water recovery processes are considered together.
Table B15: Water recovery in Wee Waa
Scenario Total reduction in surface water available to irrigators
Net reduction in surface water available to irrigators
278 4% 2%320 A 8% 6%320 B 8% 6%320 C 8% 6%345 10% 8%350 10% 8%390 10% 8%415 12% 10%
Modelling resultsThe landuse modelling for Wee Waa takes into account general security on and off-allocation surface water diversions and groundwater use. The decline in surface water availability is estimated to have modest effects on the area irrigated (Figure B87). With water recovery to date, and after taking into account the investment in infrastructure, the estimated decline in the maximum area of production is approximately 2%. Under the 415 GL scenario, the decline in the maximum area irrigated is around 8% (approximately 3,000 hectares).
Page 149

Northern Basin Review - Technical overview of the socioeconomic analysis – interim report
Figure B89: Irrigated hectares under water recover scenarios in Wee Waa
The results in Figure B87 represent the change in area of production, assuming no change in the pattern of groundwater use across the period modelled. It is assumed the groundwater recovery process, when completed in 2017, will reduce groundwater availability in the Wee Waa area to a maximum of 86 GL. As a consequence, groundwater use will be restricted below previous levels of use in years of low surface water allocations. The effect of the surface and groundwater recovery is a further decline in area planted in the drier years. This reduction is estimated to be up to 30% of the baseline area (Figure B88). For example, in 2006-07 the joint effect of the surface and groundwater recovery processes is a reduction in area planted from 8,400 to 5,800 hectares. The farm-related businesses in Wee Waa indicated such a change, while appearing relatively small, was important in the drier years as turnover is expected to be further reduced at a time when they are struggling to cover the costs of running their businesses.
Figure B90: Irrigated hectares under 415 GL scenario with groundwater recovery
Page 150

Northern Basin Review - Technical overview of the socioeconomic analysis – interim report
The baseline community modelling for Wee Waa estimates a decline in employment for the farm and farm-related sector (including seasonal workers) in the absence of the Basin Plan around 20% (165 FTE) across the period from 2000-01. For the other private business sector, the estimated fall in employment is estimated to be around 25% (80 FTE).
Figure B89: Modelled baseline of employment in Wee Waa
The discernible effect on farm and farm-related employment in all water recovery scenarios (Figure B90) reflects the estimated changes in irrigated area. From the recovery to date through a combination of purchase and infrastructure investment, the number of jobs is estimated to fall by around 1%. Under the 415 GL water recovery scenario the estimated change in employment is around 3.5-5% (20-40 FTE).
Figure B92: Farm-related employment under water recovery scenarios in Wee Waa
Employment changes in the other private business sector arising from the surface water recovery is estimated to be modest under all scenarios. The effects range from less than a 1% change in
Page 151

Northern Basin Review - Technical overview of the socioeconomic analysis – interim report
employment for the 278 GL scenario up to fall of around 3-4% for the 415 GL water recovery scenario.
Figure B93: Other private business employment under water recovery scenarios in Wee Waa
When the changes from both the surface and groundwater recovery processes were considered, additional employment effects were identified for the drier years in particular. While the effects on employment remain modest, there is estimated to be a further reduction in employment from around 2.5-3% up to around 4.5% for the farm and farm-related sector (Figure B94, see results for 2006-07 and 2007-08).
Figure B94: Impact of 390 GL water recovery scenario and groundwater recovery process on farm and farm-related jobs in Wee Waa
In the other private business sector, the effects of the surface and groundwater recovery processes are estimated to reduce employment in the drier years by a further 1.5% relative to the effects from surface water recovery alone (Figure B95).
Page 152

Northern Basin Review - Technical overview of the socioeconomic analysis – interim report
Figure B95: Impact of 390 GL water recovery scenario and groundwater recovery process on other private business sector jobs in Wee Waa
Largest effect: 415 GL scenario – 8% reduction in maximum area, 4.4% reduction in farm and farm-related jobs, 3.5% decrease in other private business jobs, 3.4% decrease in total jobs.
ImplicationsIf water recovery in the Wee Waa does not exceed the changes described in the scenarios modelled, the effects on the community are expected to remain quite modest yet identifiable for the 390 GL and 415 GL water recovery scenarios. These estimates of employment change are a function of the proportion of water recovered through infrastructure investment and the purchase of entitlements.If a significantly higher level of water recovery is considered, it would be necessary to review how the volume, timing and method of water recovery might affect Wee Waa given the quite challenging social and economic conditions already impacting on the community.One request from the industry in Wee Waa was to examine the effect of having all the remaining Namoi water recovery coming the Wee Waa community. For the 390 GL water recovery scenario, this represents around 12.5 GL of water recovery of which 10.5 GL is already assumed would be recovered from Wee Waa. It is estimated the maximum area of production in the Wee Waa community from having all remaining water recovery provided by that community would be a decrease of around 7%. This compares to a 6% reduction in the maximum area irrigated if the water recovery is spread across the Namoi communities on the basis of the surface water entitlements held in each locality.
Page 153

Northern Basin Review - Technical overview of the socioeconomic analysis – interim report
Appendix C: Commonwealth infrastructure investment in northern basin catchments
Condamine-Balonne
SDL Resource Unit
Overall Investment
($m)
Water Recovery contracted as at 31 July 2016
(GL LTAAY) Water registered to
the CEWH
(GL LTAAY)Total
(GL LTAAY)Infrastructure(GL LTAAY)
Purchase (GL
LTAAY)
Other(GL
LTAAY)
State Recoveries(GL LTAAY)
Condamine- Balonne
33 60.1 7.4 52.7 - - 57.1
Project Project DescriptionFunding
($m)
Queensland Healthy HeadWaters Water Use Efficiency Project – State Priority Project
The $155 million Queensland Healthy HeadWaters Water Use Efficiency Project supports on farm irrigation modernisation, with a share of water savings coming to the Commonwealth for environmental use. The Queensland Department of Natural Resources and Mines is the State agency responsible for implementing the project.
31
Completed Projects
Strengthening Basin Communities Program
The $64 million Strengthening Basin Communities program was a grants program for local municipalities in the MDB to assist in planning for a future with less water and associated local water savings initiatives that improved water security by reducing demand on potable water supplies.
1
Irrigation Modernisation Planning Assistance program
The $6 million Irrigation Modernisation Planning Assistance program provided funding to irrigation water providers to develop modernisation plans for their districts that outline how to achieve long term improvements in irrigation water use efficiency and assess options to adapt to a future with less water.
0.5
Notes1. Allow for minor rounding2. All water recoveries figures are expressed in long term average annual yield (LTAAY) terms. Surface water average annual yields are calculated using the current long-
term diversion limit equivalent factors (v2.05) agreed to by Ministerial Council in November 2011. All Overland Flow water recoveries have their factors individually modelled by the Murray-Darling Basin Authority.
3. Water recovery is reported at the point at which water savings or purchase have been received, estimated or agreed in signed contracts. Until water transfer contracts have been exchanged however, these figures may be subject to change over time.
Page 154

Northern Basin Review - Technical overview of the socioeconomic analysis – interim report
Moonie
SDL Resource Unit
Overall Investment
($m)
Water Recovery contracted as at 31 July 2016
(GL LTAAY) Water registered to
the CEWH
(GL LTAAY)Total
(GL LTAAY)Infrastructure(GL LTAAY)
Purchase (GL
LTAAY)
Other(GL
LTAAY)
State Recoveries(GL LTAAY)
Moonie 5 2.5 1.4 - 1.1 - 1.10
Project Project DescriptionFunding
($m)
Queensland Healthy HeadWaters Water Use Efficiency Project – State Priority Project
The $155 million Queensland Healthy HeadWaters Water Use Efficiency Project supports on farm irrigation modernisation, with a share of water savings coming to the Commonwealth for environmental use. The Queensland Department of Natural Resources and Mines is the State agency responsible for implementing the project.
5
Notes1. Allow for minor rounding.2. All water recoveries figures are expressed in long term average annual yield (LTAAY) terms. Surface water average annual yields are calculated using the current
long-term diversion limit equivalent factors (v2.05) agreed to by Ministerial Council in November 2011. All Overland Flow water recoveries have their factors individually modelled by the Murray-Darling Basin Authority.
3. Water recovery is reported at the point at which water savings or purchase have been received, estimated or agreed in signed contracts. Until water transfer contracts have been exchanged however, these figures may be subject to change over time.
Page 155
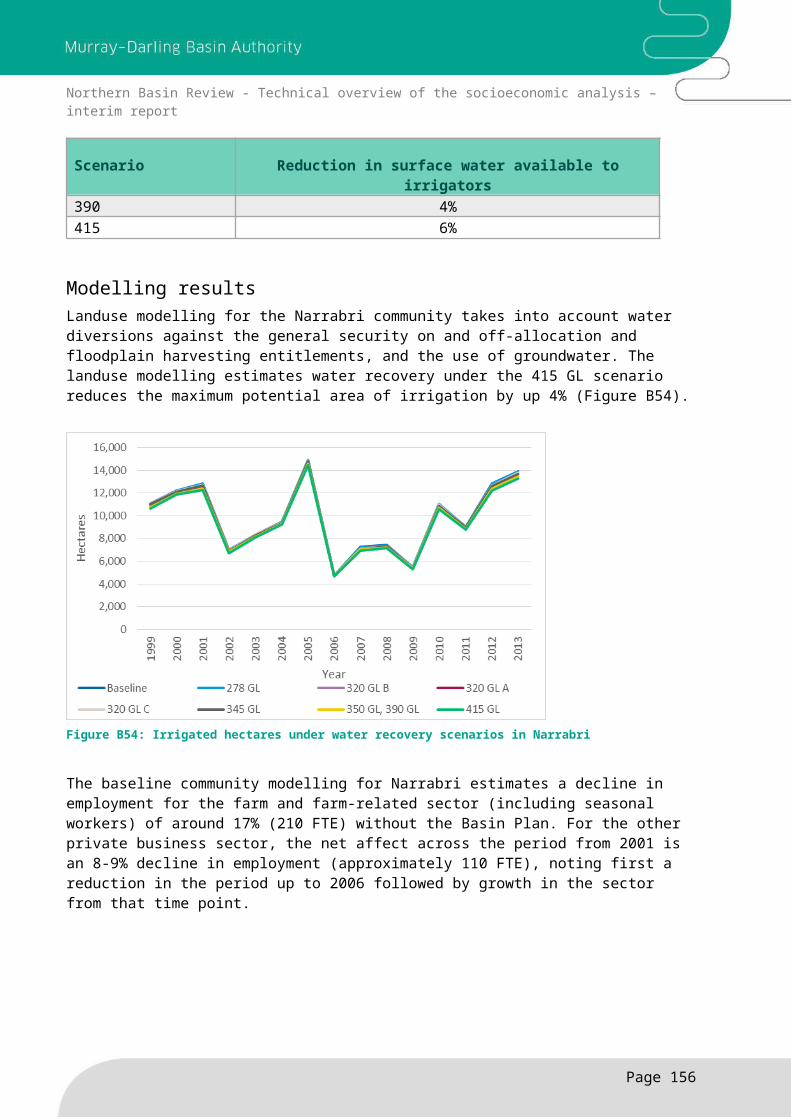
Northern Basin Review - Technical overview of the socioeconomic analysis – interim report
Border Rivers Qld
SDL Resource Unit
Overall Investment
($m)
Water Recovery contracted as at 31 July 2016
(GL LTAAY) Water registered to
the CEWH
(GL LTAAY)Total
(GL LTAAY)Infrastructure(GL LTAAY)
Purchase (GL
LTAAY)
Other(GL
LTAAY)
State Recoveries(GL LTAAY)
Border Rivers Qld
70 15.6 11.3 3.8 0.5 - 12.0
Project Project DescriptionFunding
($m)
Queensland Healthy HeadWaters Water Use Efficiency Project
The $155 million Queensland Healthy HeadWaters Water Use Efficiency Project supports on farm irrigation modernisation, with a share of water savings coming to the Commonwealth for environmental use. The Queensland Department of Natural Resources and Mines is the State agency responsible for implementing the project.
69
Completed Projects
Strengthening Basin Communities Program
The $64 million Strengthening Basin Communities program was a grants program for local municipalities in the MDB to assist in planning for a future with less water and associated local water savings initiatives that improved water security by reducing demand on potable water supplies.
0.4
Notes1. Allow for minor rounding.2. All water recoveries figures are expressed in long term average annual yield (LTAAY) terms. Surface water average annual yields are calculated using the current
long-term diversion limit equivalent factors (v2.05) agreed to by Ministerial Council in November 2011. All Overland Flow water recoveries have their factors individually modelled by the Murray-Darling Basin Authority.
3. Water recovery is reported at the point at which water savings or purchase have been received, estimated or agreed in signed contracts. Until water transfer contracts have been exchanged however, these figures may be subject to change over time.
Page 156

Northern Basin Review - Technical overview of the socioeconomic analysis – interim report
Barwon-Darling
SDL Resource Unit
Overall Investment
($m)
Water Recovery contracted as at 31 July 2016
(GL LTAAY) Water registered to
the CEWH
(GL LTAAY)Total
(GL LTAAY)Infrastructure(GL LTAAY)
Purchase (GL
LTAAY)
Other(GL
LTAAY)
State Recoveries(GL LTAAY)
Barwon-Darling
41 32.6 6.2 24.9 - 1.5 24.9
Project Project DescriptionFunding
($m)
NSW Irrigated Farm Modernisation – State Priority Project
The $120 million Irrigated Farm Modernisation project provides investment in on-farm works and measures that lead to improved water use efficiency, assisting irrigation farmers to do more with less water.
29
NSW Healthy Floodplains – State Priority Project
The $50 million Healthy Floodplains project involves licensing and controlling floodplain extractions and improving watering of key environmental assets across NSW.
10
NSW Shepherding project Funding of $5 million was provided for water Shepherding arrangements in NSW to improve the use of water entitlements purchased by the Commonwealth for the environment in unregulated streams, providing the capacity to deliver water to high priority environmental assets downstream without impacting on the reliability of supply to existing water users.
2
Toorale decommissioning project
The Toorale Decommissioning Project involves structural works for the purpose of achieving environmental flows.
0.2
Notes1. Allow for minor rounding.2. All water recoveries figures are expressed in long term average annual yield (LTAAY) terms. Surface water average annual yields are calculated using the current
long-term diversion limit equivalent factors (v2.05) agreed to by Ministerial Council in November 2011. All Overland Flow water recoveries have their factors individually modelled by the Murray-Darling Basin Authority.
3. Water recovery is reported at the point at which water savings or purchase have been received, estimated or agreed in signed contracts. Until water transfer
contracts have been exchanged however, these figures may be subject to change over time. 4.
Page 157

Northern Basin Review - Technical overview of the socioeconomic analysis – interim report
Gwydir
SDL Resource Unit
Overall Investment
($m)
Water Recovery contracted as at 31 July 2016
(GL LTAAY) Water registered to
the CEWH
(GL LTAAY)Total
(GL LTAAY)Infrastructure(GL LTAAY)
Purchase (GL
LTAAY)
Other(GL
LTAAY)
State Recoveries(GL LTAAY)
Gwydir 48 46.9 5.1 35.5 - 6.2 40.6
Project Project DescriptionFunding
($m)
NSW Basin Pipes – State Priority Project
The $137 million Basin Pipes project involves upgrading stock and domestic schemes to improve efficiency of water use
30
NSW Irrigated Farm Modernisation – State Priority Project
The $120 million Irrigated Farm Modernisation project provides investment in on-farm works and measures that lead to improved water use efficiency, assisting irrigation farmers to do more with less water.
5
NSW Healthy Floodplains – State Priority Project
The $50 million Healthy Floodplains project involves licensing and controlling floodplain extractions and improving watering of key environmental assets across NSW.
10
Completed Projects
Strengthening Basin Communities Program
The $64 million Strengthening Basin Communities program was a grants program for local municipalities in the MDB to assist in planning for a future with less water and associated local water savings initiatives that improved water security by reducing demand on potable water supplies.
0.2
On-Farm Irrigation Efficiency Program – Pilot(Gwydir CMA Pilot)
A pilot programme ahead of the On Farm Irrigation Efficiency Program involving modernisation of on-farm irrigation infrastructure and returning water savings to the environment.
3
Notes1. Allow for minor rounding.2. All water recoveries figures are expressed in long term average annual yield (LTAAY) terms. Surface water average annual yields are calculated using the current
long-term diversion limit equivalent factors (v2.05) agreed to by Ministerial Council in November 2011. All Overland Flow water recoveries have their factors individually modelled by the Murray-Darling Basin Authority.
3. Water recovery is reported at the point at which water savings or purchase have been received, estimated or agreed in signed contracts. Until water transfer contracts have been exchanged however, these figures may be subject to change over time.
Page 158

Northern Basin Review - Technical overview of the socioeconomic analysis – interim report
Macquarie-Castlereagh
SDL Resource Unit
Overall Investment
($m)
Water Recovery contracted as at 31 July 2016
(GL LTAAY) Water registered to
the CEWH
(GL LTAAY)Total
(GL LTAAY)Infrastructure(GL LTAAY)
Purchase (GL
LTAAY)
Other(GL
LTAAY)
State Recoveries(GL LTAAY)
Macquarie-Castlereagh
320 82.5 37.3 24.6 - 20.6 54.76
Project Project DescriptionFunding
($m)
NSW Private Irrigation Infrastructure Operators Program
The NSW Private Irrigation Infrastructure Operators Program is an $892 million Commonwealth-led grants program which aims to improve the efficiency and productivity of water use and management, both off and on-farm to help secure a sustainable future for irrigation communities.
222
NSW Basin Pipes – State Priority Project
The $137 million Basin Pipes project involves upgrading stock and domestic schemes to improve efficiency of water use. 42
NSW Irrigated Farm Modernisation – State Priority Project
The $120 million Irrigated Farm Modernisation project provides investment in on-farm works and measures that lead to improved water use efficiency, assisting irrigation farmers to do more with less water.
16
NSW Healthy Floodplains – State Priority Project
The $50 million Healthy Floodplains project involves licensing and controlling floodplain extractions and improving watering of key environmental assets across NSW.
10
Completed projects
Strengthening Basin Communities Program
The $64 million Strengthening Basin Communities program was a grants program for local municipalities in the MDB to assist in planning for a future with less water and associated local water savings initiatives that improved water security by reducing demand on potable water supplies.
4
Orange Pipeline Project The $20 million project involved construction of a pipeline between Orange and the Macquarie River. The pipeline provided Orange with a secure water supply by connecting the city's existing water infrastructure to more reliable drinking water from the Macquarie River.
20
Irrigation Modernisation Planning Assistance program
The $6 million Irrigation Modernisation Planning Assistance program provided funding to irrigation water providers to develop modernisation plans for their districts that outline how to achieve long term improvements in irrigation water use efficiency and assess options to adapt to a future with less
0.8
Page 159

Northern Basin Review - Technical overview of the socioeconomic analysis – interim report
Project Project DescriptionFunding
($m)water.
Irrigation Hotspots Assessment project
The $2 million Irrigation Hotspots Assessment project used a science-based approach to identify the nature, location and amount of water loss (known as hotspots) in existing channel and piped irrigation delivery systems across Australia.
0.3
Lithgow-Clarence Colliery Water transfer project
The $4 million Lithgow-Clarence Colliery project involved upgrading the Clarence Water Transfer System, allowing the increased use of excess water from Clarence Colliery. The project improved the security of Lithgow’s water supply by supplementing its potable water supplies and offsetting water that would ordinarily be drawn from Oberon Dam.
4
Notes1. Allow for minor rounding.2. All water recoveries figures are expressed in long term average annual yield (LTAAY) terms. Surface water average annual yields are calculated using the current
long-term diversion limit equivalent factors (v2.05) agreed to by Ministerial Council in November 2011. All Overland Flow water recoveries have their factors individually modelled by the Murray-Darling Basin Authority.
3. Water recovery is reported at the point at which water savings or purchase have been received, estimated or agreed in signed contracts. Until water transfer contracts have been exchanged however, these figures may be subject to change over time.
Page 160

Northern Basin Review - Technical overview of the socioeconomic analysis – interim report
Namoi
SDL Resource Unit
Overall Investment
($m)
Water Recovery contracted as at 31 July 2016
(GL LTAAY) Water registered to
the CEWH
(GL LTAAY)Total
(GL LTAAY)Infrastructure(GL LTAAY)
Purchase (GL
LTAAY)
Other(GL
LTAAY)
State Recoveries(GL LTAAY)
Namoi 63 11.5 6.8 4.8 - - 7.0
Project Project DescriptionFunding
($m)
NSW Basin Pipes – State Priority Project
The $137 million Basin Pipes project involves upgrading stock and domestic schemes to improve efficiency of water use
1
NSW Irrigated Farm Modernisation – State Priority Project
The $120 million Irrigated Farm Modernisation project provides investment in on-farm works and measures that lead to improved water use efficiency, assisting irrigation farmers to do more with less water.
51
NSW Healthy Floodplains – State Priority Project
The $50 million Healthy Floodplains project involves licensing and controlling floodplain extractions and improving watering of key environmental assets across NSW.
10
Completed Projects
Strengthening Basin Communities Program
The $64 million Strengthening Basin Communities program was a grants program for local municipalities in the MDB to assist in planning for a future with less water and associated local water savings initiatives that improved water security by reducing demand on potable water supplies.
1
Liverpool Plains Shire Council project
Funding of $400,000 was provided to the Liverpool Plains Shire Council to undertake a design and scoping study, building on the work undertaken under the Strengthening Basin Communities program.
0.4
Notes1. Allow for minor rounding.2. All water recoveries figures are expressed in long term average annual yield (LTAAY) terms. Surface water average annual yields are calculated using the current
long-term diversion limit equivalent factors (v2.05) agreed to by Ministerial Council in November 2011. All Overland Flow water recoveries have their factors individually modelled by the Murray-Darling Basin Authority.
3. Water recovery is reported at the point at which water savings or purchase have been received, estimated or agreed in signed contracts. Until water transfer contracts have been exchanged however, these figures may be subject to change over time.
Page 161

Northern Basin Review - Technical overview of the socioeconomic analysis – interim report
Border Rivers NSW
SDL Resource Unit
Overall Investment
($m)
Water Recovery contracted as at 31 July 2016
(GL LTAAY) Water registered to
the CEWH
(GL LTAAY)Total
(GL LTAAY)Infrastructure(GL LTAAY)
Purchase (GL
LTAAY)
Other(GL
LTAAY)
State Recoveries(GL LTAAY)
Border Rivers NSW
33 3.3 3.3 - - - 0.17
Project Project DescriptionFunding
($m)
NSW Basin Pipes – State Priority Project
The $137 million Basin Pipes project involves upgrading stock and domestic schemes to improve efficiency of water use
6
NSW Irrigated Farm Modernisation – State Priority Project
The $120 million Irrigated Farm Modernisation project provides investment in on-farm works and measures that lead to improved water use efficiency, assisting irrigation farmers to do more with less water.
17.2
NSW Healthy Floodplains – State Priority Project
The $50 million Healthy Floodplains project involves licensing and controlling floodplain extractions and improving watering of key environmental assets across NSW.
10
Notes1. Allow for minor rounding.2. All water recoveries figures are expressed in long term average annual yield (LTAAY) terms. Surface water average annual yields are calculated using the current
long-term diversion limit equivalent factors (v2.05) agreed to by Ministerial Council in November 2011. All Overland Flow water recoveries have their factors individually modelled by the Murray-Darling Basin Authority.
3. Water recovery is reported at the point at which water savings or purchase have been received, estimated or agreed in signed contracts. Until water transfer contracts have been exchanged however, these figures may be subject to change over time.
Page 162

Northern Basin Review - Technical overview of the socioeconomic analysis – interim report
Queensland Statewide
SDL Resource Unit
Overall Investment
($m)
Water Recovery contracted as at 31 July 2016
(GL LTAAY) Water registered to
the CEWH
(GL LTAAY)Total
(GL LTAAY)Infrastructure(GL LTAAY)
Purchase (GL
LTAAY)
Other(GL
LTAAY)
State Recoveries(GL LTAAY)
Queensland Statewide
7 Non water recovery projects
Project Project DescriptionFunding
($m)
Completed Projects
Environmental works and measures feasibility project
The $10 million Environmental Works and Measures feasibility program to identified, developed and tested the feasibility of environmental works and measures.
2
Coal Seam Gas Water StudyThe $5 million Coal Seam Gas Water Study project was a feasibility study aimed at undertaking a detailed analysis of the use of Coal Seam Gas water in the Qld Murray-Darling Basin
5
NSW Statewide
SDL Resource Unit
Overall Investment
($m)
Water Recovery contracted as at 31 July 2016
(GL LTAAY) Water registered to
the CEWH
(GL LTAAY)Total
(GL LTAAY)Infrastructure(GL LTAAY)
Purchase (GL
LTAAY)
Other(GL
LTAAY)
State Recoveries(GL LTAAY)
NSW Statewide
3 Non water recovery project
Project Project DescriptionFunding
($m)
Completed Projects
Environmental works and measures feasibility project
The $10 million Environmental Works and Measures feasibility program to identified, developed and tested the feasibility of environmental works and measures.
3
Page 163