draft performance audit report on storage management and...
TRANSCRIPT

1
Draft Performance Audit Report on Storage Management and Movement of Foodgrains in Food Corporation of India
Chapter 1 – Introduction
1.1 The Food Corporation of India (FCI) was created under the Food Corporation Act, 1964
(Act) of Parliament with the primary functions to undertake purchase, storage, movement,
transportation, distribution and sale of foodgrains on behalf of the Government of India (GOI).
It is a main agency under the overall administrative supervision and control of Ministry of
Consumer Affairs, Food and Public Distribution (Administrative Ministry) which is primarily
responsible for implementation of national food security policy. The functions of FCI also aims
at fulfilling the following objectives:
(i) providing price support operations through procurement for safeguarding the interests
of the farmers;
(ii) movement and distribution of foodgrains throughout the country to make foodgrains
accessible at reasonable price to weaker and vulnerable sections of society through
Targeted Public Distribution System (TPDS)1 and other government schemes; and
(iii) maintaining satisfactory level of operational and buffer stocks of foodgrains to ensure
national food security and to carry out price stabilisation operations.
1.2 Organizational setup
The affairs of FCI are managed by Board of Directors headed by Chairman and Managing
Director along with one Director each representing Ministry of Consumer Affairs, Food and
Public Distribution, Ministry of Agriculture, Ministry of Finance, one ex-officio Director
(Managing Director of Central Warehousing Corporation) and one non-official Director. All the
Directors are appointed by Central Government. Contrary to the provisions of the Act of having
12 Directors in the board, the present FCI Board consists of only 6 Directors. Its functions are
managed through country-wide network of offices with headquarters at New Delhi, 5 Zonal
offices, 24 Regional Offices, 169 District Offices and one Port Office.
1.3 Production and procurement of foodgrains
1 PDS is a food security system in India through which subsidies for food and non food items are distributed to the poor. PDS
functions through a network of 4.89 lakh Fair Price shops established in several States across the Country. Till 1992, PDS was
covering all consumers without specific target which was re-launched in 1997 as Targeted Public Distribution System (TPDS)
with focus on the poor.

2
With a view to achieve the overall food security objectives of GOI, FCI along with State
Governments and their agencies procure wheat and paddy for the Central Pool under the price
support scheme and statutory levy scheme. GOI undertakes open-ended procurement of
wheat and paddy of prescribed specification offered on sale by the farmers at the Minimum
Support Price (MSP) fixed by the GOI during each Rabi/Kharif Marketing Season (RMS/KMS).
Under statutory levy imposed on rice millers and rice dealers in the States/UTs as per the
Essential Commodities Act 1955, a percentage of levy rice is fixed by State Governments with
the approval of Central Government after taking into account requirements for the Central
Pool, domestic consumption and marketable surplus. The rice so procured is handed over to
FCI at State wise levy rice prices fixed by GOI. In addition to direct procurement of foodgrains,
FCI also takes over from State Governments/Agencies wheat and rice obtained out of paddy
(Custom Milled Rice) on behalf of GOI.
In addition to above, under Decentralised Procurement Scheme (DCP), State Governments
(presently in operation in 10 states) undertake direct purchase, store and distribute foodgrains
including levy rice for TPDS and other welfare schemes (OWS). Surplus stocks are taken into
Central Pool by FCI and in case of any shortfall in procurement against allocation made by GOI
for distribution to TPDS, FCI meets the deficit out of the Central Pool.
1.4 Minimum Support Price (MSP), Central Issue Price (CIP) and Market price of
foodgrains
1.4.1 Minimum Support Price
MSP is fixed by GOI on the rates recommended by Commission for Agricultural Costs and Prices
(CACP) which takes into consideration the cost of cultivation and remunerative prices to the
farmers for their produce with a view to encouraging higher investment and production. While
determining MSP, CACP considers the overall needs of the economy as well as the interest of
farmers and consumers and also other relevant factors such as cost of production, domestic
and international market situation, increase in the prices of urea/fertilisers/petrol/electricity,
subsidies, stock position, changes in agricultural terms of trade, prices of competing crops, etc.
and prices fixed in previous years. The prices recommended by CACP are considered by the
Cabinet Committee for Economic Affairs (CCEA) for approval.
1.4.2 Central Issue Price under TPDS
Foodgrains from the Central Pool are issued to States at CIPs for distribution under TPDS to
serve families Below Poverty Line (BPL), Above Poverty Line (APL) and Antyodaya Anna Yojna
(AAY) at rates fixed by Government of India. The scale of issue under APL, BPL, AAY was revised
to 35 kg per family per month since 1.4.2002.

3
The CIP of AAY has been kept constant at ` 3 per Kg for rice and ` 2 per Kg for wheat since
December 2000. For BPL, the CIP was ` 5.65 per Kg and ` 4.15 per Kg for rice and wheat
respectively since July 2000. In respect of APL, the CIP for rice was ` 7.95 common, ` 8.30 Grade
‘A’ per Kg and ` 6.10 per Kg for wheat since July 2002.
1.5 Allocation and Distribution of foodgrains
Allocation of foodgrains from the Central Pool for distribution to BPL, AAY and APL families
under PDS is made by GOI on the basis of 1993-94 poverty estimates of the Planning
Commission. The allocation based on 1993-94 poverty estimates had been further revised
upwards and based on the population projection as on 1 April 2000, monthly allocation to the
State Governments have been increased. The overall allocation of foodgrains to the States/UTs
was normally on the basis of average consumption in the past i.e. average annual off-take of
food grains under the PDS during the past ten years.
1.5.1 Based on this estimates, the allocation of foodgrains for AAY and BPL categories are
made @ 35 Kg per family per month for 6.52 crore BPL families in the country since December
2000 as against 5.96 crore families originally estimated when TPDS was introduced in June
1997. However, allocation for APL category is made depending upon the availability of stocks
of foodgrains in the Central Pool.
1.5.2 Distribution of foodgrains is carried out through TPDS with a network of around 4.89
lakh Fair Price Shops (FPS) throughout the country. The State Governments are responsible for
identification of beneficiaries, issue of ration cards and distribution of foodgrains to the
beneficiaries. Apart from above, foodgrains from Central Pool are also released for different
welfare schemes. The Open Market Sale Scheme (OMSS) for wheat was introduced with effect
from October 1993 and rice from January 1994 in domestic market with a view to containing
inflationary tendencies in the economy and to generate storage space in the surplus states.
1.5.3 New initiative by GOI - National Food Security Bill (NFSB)
With a view to provide statutory basis which will entitle every family below the poverty line to
certain quantity of foodgrains at subsidised prices, the GOI introduced NFSB in the Parliament
on 23 December 2011. The Bill seeks to provide legal foodgrains entitlement to (i) 75 percent of
total population in rural areas, with atleast 46 percent population belonging to priority
households, and (ii) 50 percent of the total population in urban areas with atleast 28 percent
population belonging to priority households. For priority households, foodgrains entitlement is
proposed to be 7 Kg per person per month with a CIP not exceeding ` 3, ` 2 and ` 1 per Kg for

4
rice, wheat and coarsegrains respectively. In respect of general households, 3 Kg per person per
month with a CIP not exceeding 50 percent of MSP for wheat and coarse grains, and derived
minimum support price for rice. In case of short supply of foodgrains, the Central Government
will provide a food security allowance, to be disbursed through State Governments.
1.6 Food Subsidy
The subsidy is provided to FCI, which is the main instrument of the GOI for procurement and
distribution of wheat and rice under TPDS and other welfare schemes and for maintaining the
buffer stock of foodgrains as a measure of food security.
The difference between the economic cost (acquisition cost including incidental expenses,
administrative overheads, handlings, shortages, carryover charge paid to State Agencies, etc.)
and their sales realisation at CIP under PDS and OWS is reimbursed to FCI and DCP States as
food subsidy by GOI. In addition, GOI procures foodgrain for meeting the requirement of buffer
stock. Hence, part of food subsidy goes towards meeting the carrying cost of buffer stock
maintained by FCI. The buffer subsidy also includes carry over charges paid to State
Government Agencies (SGAs) for stocks held by them beyond the prescribed timeframe. Table 1: Food subsidy budgeted and released during 2006-07 to 2010-11
(` in crore)
Year Budgeted Subsidy released
FCI States Total
2006-07 23,986 20,786 3,042 23,828
2007-08 25,425 27,760 3,500 31,260
2008-09 32,400 36,744 6,924 43,668
2009-10 52,145 46,867 11,375 58,242
2010-11 55,211 50,730 12,200 62,930
Source: Ministry Annual Report 2010-11 and Demands for grants
1.7 Food stock in Central Pool and Buffer Stock Norms
Buffer stock of food grains in the Central Pool are maintained by GOI (i) to meet the prescribed
minimum buffer stock norms for food security, (ii) for monthly release of foodgrains for supply
through TPDS/OWS, (iii) to meet emergency situations arising out of unexpected crop failure,
natural disasters etc., and (iv) for price stabilization or market intervention to augment supply
so as to help moderate the open market prices. Foodgrains stock in the Central Pool consists of
stock held by FCI, State Governments in case of DCP States and the SGAs. It takes care of both
buffer and operational requirements. While four months requirement of foodgrains for issue
under TPDS and OWS are earmarked as operational stocks, the surplus over that is treated as
buffer stock and physically both buffer and operational stocks are merged into one and are not
distinguishable. In March 2008, GOI created food security reserve of 50 LMT which includes 30
LMT of wheat w.e.f. July 1, 2008 and 20 LMT of rice w.e.f. February 1, 2009 over the existing
buffer norms.

5
1.8 Storage of foodgrains
The storage capacity available with Government agencies both at the Central and the State
level are primarily used for keeping central stock of foodgrains for the PDS and OWS. Storage
management primarily aims at meeting:
(i) the storage requirement for holding operational and buffer stocks;
(ii) requirements of PDS, including various programmes taken up by the Government which
require distribution of foodgrains.
Thus, the storage function is an important link in the whole system of procurement, marketing
and consumption of foodgrains. The total storage capacity with FCI, Central Warehousing
Corporation (CWC) and State Warehousing Corporations (SWC) was as given below:
Table 2: Total capacity available with FCI, CWC and SWCs (Figures in LMT)
Year FCI (Owned covered and
CAP)
CWC SWC Total Storage Capacity
2006-07 152.30 102.20 191.86 446.36
2007-08 151.25 98.78 187.32 437.35
2008-09 151.40 105.25 196.82 453.47
2009-10 154.80 105.98 209.26 470.04
2010-11 156.10 102.47 214.41 472.98
Source: MPR of FCI, Annual reports of CWC
1.9 Movement of foodgrains
Movement of foodgrains from procuring States to deficit States are carried out by FCI with a
view to evacuate excess stock on procurement, effect optimum utilization of storage capacity
and to meet the operational stock requirement of TPDS and OWS with a view to making
foodgrains available to all the people, especially the poor. Foodgrains so procured are
transported upto the designated Principal Distribution Centres (PDCs) of the FCI by GOI. The
operational responsibilities for lifting of the allocated foodgrains from the PDCs and distribution
through TPDS are that of the State Governments. The overall movement during the last five
years was as under: Table 3: Movement of foodgrains by Rail/Road, Inter/Intra region during 2006-07 to 2010-11
(Figures in LMT)
Particulars 2006-07 2007-08 2008-09 2009-10 2010-11
Overall Movement
Rail 253.79 240.03 231.39 282.41 295.49
Road 14.01 23.84 25.49 29.85 26.30
Total 267.80 263.87 256.88 312.26 321.79
Inter 245.41 235.06 229.49 283.38 294.89
Intra 22.39 28.80 27.39 28.88 26.90
Total 267.80 263.86 256.88 312.26 321.79
Movement
Rail 167.95 163.51 151.91 192.25 212.86
Road 13.82 19.74 20.95 26.35 24.98
Total 181.77 183.25 172.86 218.60 237.84

6
Ex-North Inter 179.83 180.77 170.72 217.79 236.08
Intra 1.94 2.48 2.14 0.81 1.76
Total 181.77 183.25 172.86 218.60 237.84
Source: Annual Reports of the Ministry
Chapter 2 – Audit Approach and Methodology
2.1 Rationale and Scope of Audit
The FCI is the main agency responsible for execution of food policies of the Central Government
engaging in purchase, storage, movement, transportation, distribution and sale of foodgrains.
There has been a general trend of increase in procurement of foodgrains for the past few years.
This increased quantum of foodgrains requires augmentation in storage space and enlargement
in movement mechanism.
Out of total 24 regional offices, 8 regional offices namely Punjab, Haryana, Andhra Pradesh,
Kerala, Chhattisgarh, West Bengal, Bihar and Assam along with their 23 district offices and 51
depots were selected for detailed examination. In addition, storage of foodgrains in 49
godowns in 4 State Government Agencies (SGAs), (2 each from Punjab and Haryana) and 40
godowns of CWC were selected for detailed examination. Audit reviewed the records of the FCI
Headquarters, Regional offices and district offices pertaining to period 2006-07 to 2010-11.
2.2 Audit objectives
Performance audit was conducted to:
(i) Analyse the system of procurement price support operation, buffer stocking, storage
and delivery arrangement, and their adequacy to ensure efficient management of
foodgrains for food security in the country.
(ii) Assess movement activities of foodgrain in FCI and whether foodgrains are moved in the
most efficient manner.
(iii) Examine storage management and utilization of storage capacity.
(iv) Analysis whether GOI/FCI has created/augmented storage capacity commensurate with
the envisaged and long term requirement for storage of foodgrains.
(v) Examine adequacy of internal control arrangement in FCI.
2.3 Audit Criteria
The performance was assessed against the following criteria:
Policies/norms prescribed by the administrative ministry/FCI Hqrs for procurement
pricing, buffer stocking and subsidy claim.
Operational manual for storage movement, quality control and internal audit.

7
Orders/instructions issued by GOI/FCI for storage management and capacity utilization,
storage and transit losses, movement of foodgrains.
Administrative Ministry/ headquarters policies construction/augmentation of storage
capacity.
Performance budget/ financial and operational targets set for FCI.
2.4 Audit Methodology
After a preliminary study and collection of background information, entry conference with FCI
management was held on June 2, 2011 wherein scope, objective and methodology of audit
were discussed and the criteria were agreed upon. Field audit was conducted during June 7,
2011 to 15 November, 2011. Audit examined the relevant records at selected Regional/District
offices and depots of FCI along with the selected depots of CWC/SWC and State Governments
Agencies of Punjab and Haryana. The methodology includes issue of queries and observations
to the auditee units/GOI to draw the audit conclusions which are discussed in subsequent
chapters.
2.5 Past audit coverage
The issues relating to the performance audit were earlier reviewed in various C & AG’s audit
reports. The audit observations and action taken their against are indicated below:
Sl. No.
Para no & year of the report
Name of the Zone
Brief of the Para Current status/Action taken
1 Para no 6.1 of report no 16/2006 (Civil)
WZ Avoidable expenditure of ` 3.31
crore was incurred during 2003-05 at Manmad and Nagpur (Maharashtra) on rebooking of foodgrains rakes to alternative destinations, as adequate vacant space was not available in the godowns at the original destinations. This could have been avoided through a proper assessment of vacant godown space and drawal of foodgrains by the States.
The similar instances of rebooking of rakes were noticed during review of records in District offices in Manmad & Nagpur and also at Borivali in Maharashtra Region. Expenditure on rebooking
increased from ` 2.38 crore in
2006-07 to ` 10.48 crore in
2010-11 indicating lack of planning and coordination with State Govt. and railways.
2 Para no 6.2 of report no 16/2006 (Civil)
Hqrs. As of March 2005, FCI’s pending claims against the Railways
amounted to ` 796.45 crore. This
included 7583 cases of claims for
Claims are pending with the Railways for long time which are being pursued by FCI regularly. Some claims are not settled due to want of record.

8
refund of freight amounting to `
37.41 crore, which had been Pending for period ranging from 12 to 27 years. Railways rejected the claims and FCI did not pursue such claims further.
As on 31 March 2011, 9510 cases of claims for refund of
fright amounting to ` 54.02
crore is pending.
3 Para no 6.3 of report no 16/2006 (Civil)
Hqrs. During the period 2000-2005, FCI
paid total demurrage of ` 51.57
crore, despite paying overtime allowance (OTA) and incentive of
` 70.81 crore and ` 599.91 crore
respectively to the departmental labour. In fact, the average annual incentive paid per
labourer increased from ` 10,221
to ` 27,193 over this period.
An amount of ` 257.43 crore was
paid on account of demurrage/ wharfage during the period 2006-11. The average expenditure due to demurrage
was ` 51.49 crore per year.
Payment of demurrage charges showed an increasing trend over
the period from ` 22.73 crore
(2006-07) to ` 85.80 crore (2010-
11). Despite this, FCI incurred `
751.60 crore, ` 215.50 crore and
` 93.06 crore on incentives, OTA
and idle labour charges respectively during the period.
4 Para no 6.4.2 of report no 16/2006 (Civil)
SZ Incurrence of Avoidable
expenditure on H&T due to hiring
of godowns located beyond 8
KMs.
i) Avoidable Expenditure of `
30.51 lakh on transportation of
stocks from Vizianagaram to
Cheepurupalli SWC depot.
ii) Avoidable Expenditure of `
116.85 lakhs on transportation of foodgrain stocks from SWC Kotabommali.
i) The movement of stocks Ex.North to SWC Cheepurupalli was resorted only during 2002-05. On the basis of observation of audit, the stocks to SWC Cheepurupalli was made by diverting the mill levy stocks of neighbouring DO FCI Srikakulam along with own procurement of the district (DO FCI Vizag). The mill levy stocks were directly delivered from mill premises in to the depot. The transport charges were restricted to least of railway freight or actual road transport charges which ever was least. Thus there was no extra

9
expenditure like moving the stocks from rail-head or vice-versa.
ii) No stocks were received into the depot. Rice mills tagged to the depot were delivering levy rice and once the godowns are full, the balance stock is diverted to neighbouring DO FCI Vizag for direct delivery. No rail movement of stocks was resorted into or out of the depot. However during Jan 2010 to March 2010 Boiled Rice Stocks accepted under levy was moved from depot to distant railhead (8086.298 MTs) on which transportation charges of
` 11.38 lakh (8086.298 MTs x `
134/- PMT + 5 percent Supervision Charges) were incurred.
5 Para no 6.4.3 of report no 16/2006 (Civil)
SZ Avoidable Expenditure of ` 1.43
crore between December 2002 and March 2005 due to injudicious selection of SYGS godown at Jadcherla over the CWC godown at the Mahboobnagar, which was locationally more advantageous.
CWC Mahaboobnagar was taken over from June 2005 and it was observed that boiled rice stocks were accepted at SWC Jadcherla during the period 2005-06 to 2010-11 and was moved to distant rail head ignoring the cost advantage in accepting the levy boiled rice stocks at CWC Mahaboobnagar. The Extra expenditure incurred
in this was ` 87.84 lakh.
6
Para no 6.4.4 of report no 16/2006 (Civil)
SZ
The FCI Manual for Movement
and Storage stipulated that
godowns with a capacity of
25000 MT or higher should have
their own railway siding facilities.
Failure to consider this aspect at
the time of hiring 25 godowns
Almost all the depots under SYG were continued after the expiry of the guarantee period. From the test check of records of the selected district offices it was observed that from the stocks at these non-siding depots was made for local PDS.

10
under the SYGS resulted in
avoidable Expenditure of `
13.884.85 crore till December
2004 on account of handling of
stocks at Railway goods shed.
The rail movement of stocks from these non-siding depots for the period 2005-06 to end of expiry of guarantee period
(2008-09) FCI incurred ` 68.14
crore towards handling (` 44.01
crore) and Transportation (`
24.13 crore). This expenditure could have been avoided had there been railway Siding at these depots under SYG.
7 Para no 6.4.5 of report no 16/2006 (Civil)
SZ Additional Expenditure of ` 1.53
crore was incurred on transportation since two warehouses at Renigunta and Janakampet were hired from APSWC and taken over before completion of railway siding facility.
FCI is releasing the storage charges only to extent of 60 percent of the rate. DO FCI has incurred additional expenditure
of ` 18.86 lakh on movement of
stocks from SWC Jankampet during the period Sept. 2005 to April 2009. As against this the storage charges recovered (40
percent) was ` 18.90 lakh and
thus FCI has recovered the additional cost in full.
8 Para no 6.5.1.1 of report no 16/2006 (Civil)
Hqrs. During 2004-05 FCI incurred total
of ` 556.88 crore on account of
Transit Shortages of 6.37 LMT of foodgrains. The factor responsible for transit loss in foodgrains were pilferage and theft en route , driage , multiple handling ,different modes of weightment, weak texture of gunnies and brushing bags etc.
FCI could not succeeded in curtailing transit losses as per MOU signed by FCI with GOI during 2006-07, 2007-08, 2009-10 and 2010-11 which resulted in occurrence of excess transit
loss to the extent of ` 95.16
crores.
11
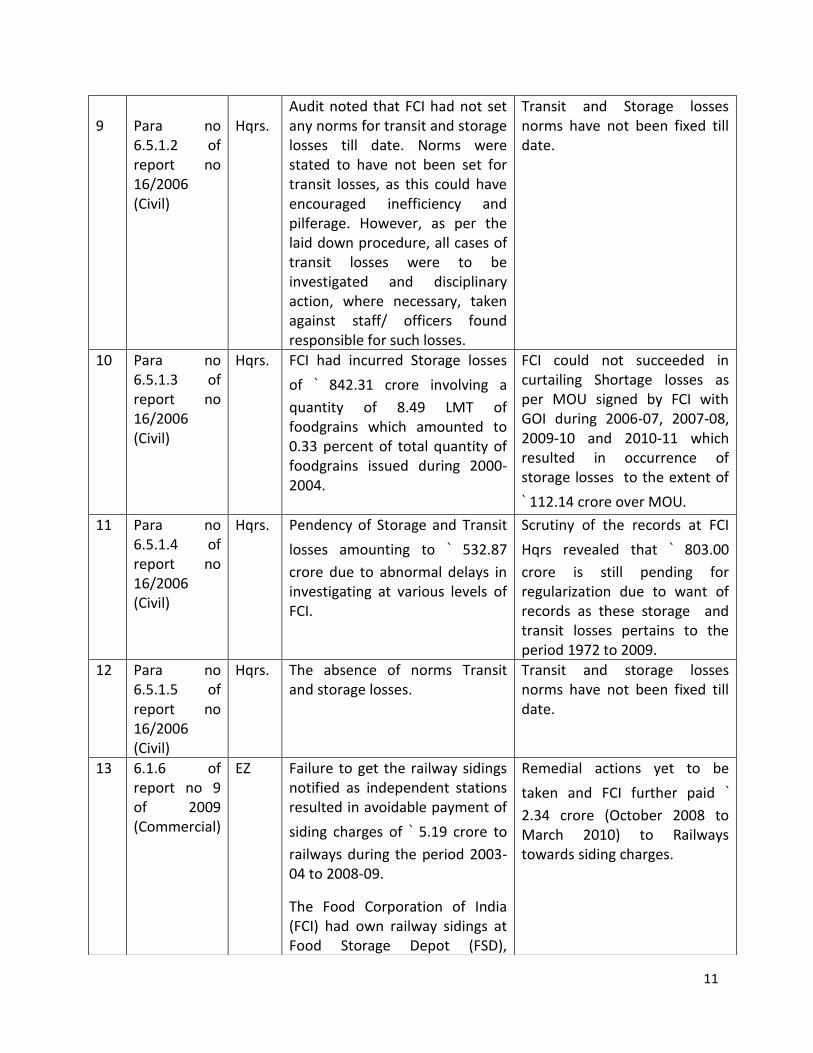
9
Para no 6.5.1.2 of report no 16/2006 (Civil)
Hqrs.
Audit noted that FCI had not set any norms for transit and storage losses till date. Norms were stated to have not been set for transit losses, as this could have encouraged inefficiency and pilferage. However, as per the laid down procedure, all cases of transit losses were to be investigated and disciplinary action, where necessary, taken against staff/ officers found responsible for such losses.
Transit and Storage losses norms have not been fixed till date.
10 Para no 6.5.1.3 of report no 16/2006 (Civil)
Hqrs. FCI had incurred Storage losses
of ` 842.31 crore involving a
quantity of 8.49 LMT of foodgrains which amounted to 0.33 percent of total quantity of foodgrains issued during 2000-2004.
FCI could not succeeded in curtailing Shortage losses as per MOU signed by FCI with GOI during 2006-07, 2007-08, 2009-10 and 2010-11 which resulted in occurrence of storage losses to the extent of
` 112.14 crore over MOU.
11 Para no 6.5.1.4 of report no 16/2006 (Civil)
Hqrs. Pendency of Storage and Transit
losses amounting to ` 532.87
crore due to abnormal delays in investigating at various levels of FCI.
Scrutiny of the records at FCI
Hqrs revealed that ` 803.00
crore is still pending for regularization due to want of records as these storage and transit losses pertains to the period 1972 to 2009.
12 Para no 6.5.1.5 of report no 16/2006 (Civil)
Hqrs. The absence of norms Transit and storage losses.
Transit and storage losses norms have not been fixed till date.
13 6.1.6 of report no 9 of 2009 (Commercial)
EZ Failure to get the railway sidings notified as independent stations resulted in avoidable payment of
siding charges of ` 5.19 crore to
railways during the period 2003-04 to 2008-09.
The Food Corporation of India (FCI) had own railway sidings at Food Storage Depot (FSD),
Remedial actions yet to be
taken and FCI further paid `
2.34 crore (October 2008 to March 2010) to Railways towards siding charges.

12
Kalyani and Orient Jute Mill (OJM), Budge Budge under District Office, Non Port Depot (West Bengal Region). As per ‘Northern Railways Through Rates Circular No. 7 of 2002’, both these sidings could handle train load traffic. Consignment of foodgrains could be booked directly to both the sidings on through basis up to the ultimate point, i.e., buffer point at siding and payment of siding charges could be avoided by getting the sidings notified as independent stations.
14 5.2.8 Report of 24/2009-10 (Commercial)
WZ FCI incurred wasteful
expenditure of ` 1.66 crore due
to hiring of private godown when sufficient space was available in their own godown.
No further cases of hiring of private godowns when sufficient space was available has been noticed.
15 7.2.7 of 11/2007 (commercial)
EZ Rebooking of rakes at New Bongaigaon resulted in avoidable
expenditure of ` 3.73 crore
After the issue was highlighted by audit FCI lodged claim with the railways for refund. However, railways repudiated the refund claims on the ground that prior to November 15, 2006 there was no provision for allowing telescopic rate benefit and the claims were time barred.
16 6.1.2 of Report no 9 of 2009
Chg. Storage loss account in Punjab region had revealed that the average Storage loss in rice during the period 2003-04 to 2007-08 was 1.02 percent whereas in Haryana region where climatic condition was similar the average storage loss in rice was observed as 0.33 percent only. When compared to Haryana region excess storage
A review of storage loss account in Punjab region had revealed that the average storage loss in rice during the period 2008-09 to 2010-11 was 1 percent whereas in Haryana region where climatic condition was similar the average storage loss in rice was 0.59 percent only. As compared to Haryana region excess storage losses of

13
2.6 Audit Findings
losses of 3.23 LMT valuing `
450.65 crore was observed during the period 2003-04 to 2007-08 in Punjab region. No reasons were available on record for this wide variation in percentage of storage loss in the two neighboring regions. Misappropriation of stocks Cannot be ruled out in high percentage of storage loss.
0.83 LMT valuing ` 153.75 crore
was observed during the period 2008-09 to 2010-11 in Punjab region.
17 7.2.2 of 11/2007
Chg. While fixing final rates for Custom Milled Rice, transportation charges were allowed to rice millers without considering the element of transportation charges paid along with provisional rates
resulting in excess payment of `
406.21 crore to State Governments and their agencies during 1998-99 to 2002-03.
The rates fixed by the GOI for CMR delivered by State Govt./agencies of Punjab and
Haryana in Central Pool from
the year 2003-04 onwards provide only for transportation charges on actual basis of paddy and rice for distance beyond eight KM subject to the maximum of rates fixed by District Magistrate. No separate transportation charges for transportation of paddy or rice upto eight kilometer being allowed. Thus, no further.
18
5.2.2 of Report no 24 of 2009-10
Chg.
The transportation charges for
delivery of rice beyond eight
kilometers were paid at higher
rates in Punjab and Haryana
regions of the Food Corporation
of India in violation of the
Government of India instructions
resulting in excess
reimbursement of ` 7.65 crore
during 2004-05 and 2005-06.
It was noticed that no payment
for transportation of paddy
beyond eight kilometers by
State Govt./ agencies was being
made by FCI. As regards,
payments for transportation of
rice beyond eight kilometers,
the payments, wherever
claimed by millers, were being
made at the rates fixed by FCI,
being lower than the DC rate.
Thus no further comment.

14
Audit findings are discussed in four chapters as detailed below:
Chapter 3: includes the analysis of policies/ operational framework of foodgrain management.
Chapter 4: deals with storage management, augmentation and utilization of storage capacity.
Chapter 5: discusses issues relating to planning and movement of foodgrains for timely and
efficient delivery to consumers.
Chapter 6: highlights inadequacy of internal control arrangement.
2.7 Acknowledgement
Audit acknowledges the cooperation and assistance extended by the Administrative Ministry
and the Management at various stages of performance audit.

15
Chapter 3 - Operational framework of Foodgrain Management
3.1 Foodgrain Management
The activities of FCI in storage management and movement of foodgrains from procuring and
surplus states to deficit and consuming states for ultimate delivery to the consumer is an
important aspect of national food security system. The above activities of FCI are operated
under the existing policy/operational framework which governed the foodgrain management
strategy of the country. This involves procurement of foodgrains through price support
operations, maintenance of buffer stock, food subsidy regime and ensuring availability of
foodgrains to weaker and vulnerable sections of society at reasonable prices. Thus in order to
have a holistic view, audit has examined the existing operational framework to highlight to
what extent it ensures efficient management of foodgrains.
3.1.1 Production and Procurement
Position of production, mandi arrival and procurement of foodgrains (wheat and rice) during
2006-07 to 2010-11 was as given below: Table 4: Production, Mandi arrival and Procurement of wheat and rice during 2006-07 to 2010-11
Wheat (Figures in Lakh MT)
Crop year
Production
Mandi
arrival
Procurement Percent of mandi
arrival to
Production
FCI State Government Agencies Total
Non DCP States DCP States
2006-07 758.10 137.01 13.43 78.39 0.49 92.31 18
2007-08 785.70 154.30 15.41 89.88 5.99 111.28 20
2008-09 806.80 244.13 52.88 126.29 47.72 226.89 30
2009-10 808.00 268.58 47.88 148.78 57.16 253.82 33
2010-11 859.30 259.47 34.19 157.18 33.76 225.13 30
Total 4017.90 1063.49 163.79 600.52 145.12 909.43 --------------
Paddy (in terms of rice) (Figures in Lakh MT)
Crop year
Production
Mandi
arrival
Procurement Percent of
mandi arrival
to Production
FCI
State Government Agencies
Levy
Total
Non DCP States DCP States
2006-07 933.50 301.05 18.51 91.52 48.71 92.32 251.06 32
2007-08 966.90 311.42 18.45 88.00 58.79 122.13 287.37 32
2008-09 991.80 382.32 18.51 105.37 80.60 136.56 341.04 39
2009-10 890.90 346.24 9.88 114.91 82.91 112.64 320.34 39
2010-11 953.20 363.80* 13.07 132.05 80.94 115.78 341.84 38
Total 4736.30 1704.83 78.42 531.85 351.95 579.43 1541.65 --------------
Source: FCI Procurement Division *as on 09.12.2011

16
The total average production of wheat and rice in the country was 804 LMT and 947 LMT
respectively during the last five years. However, the actual average mandi arrival of wheat and
rice ranged from 212.69 LMT and 340.96 LMT of the total production respectively constituting
around 26 percent in case of wheat and 36 percent for rice during the same period. Mandi
arrival of wheat and rice went up significantly from 244.13 LMT and 382.32 LMT in 2008-09 to
259.47 LMT and 363.80 LMT in 2010-11 respectively mainly due to sharp increase in MSP of
wheat and paddy. The total average procurement of foodgrains (570 LMT) from 2006-07 to
2010-11 constituted only 32 percent of the average production (1770 LMT). The total
procurement was 343 LMT in 2006-07 which increased to 568 LMT in 2008-09. This further
increased to 574 LMT and remained at 567 LMT during 2009-10 and 2010-11 due to sharp
increase in MSP of wheat and paddy.
3.1.2 Procurement Target and Achievement
3.1.2.1 Actual procurement of wheat was more than the targets during the year 2008-09 and
2009-10. It fell short by 37.53 LMT during the year 2010-11. This was due to very low
procurement in UP during the year 2010-11 when the State was removed from the
Decentralised Procurement Scheme. In case of rice, actual procurement in all the three years
from 2008-09 to 2010-11 was more than the targets.
Table 5: Targets and Actual Procurement of Foodgrains during 2008-09 to 2010-11
Wheat Quantity in Lakh MT
Year Targets Actual Procurement Difference Shortage (-)/Excess (+)
2008-09 202.00 226.89 (+) 24.89
2009-10 244.20 253.82 (+) 9.62
2010-11 262.66 225.13 (-) 37.53
Rice Quantity in Lakh MT
Year Targets Actual Procurement Difference Shortage (-)/Excess (+)
2008-09 276.65 341.04 (+) 64.39
2009-10 293.72 320.34 (+) 26.62
2010-11 327.52 341.84 (+) 14.32
3.1.2.2 In order to take care of paramount concern of the GOI to ensure food security at
national level and with the assessed increase in requirement of foodgrains at 720 LMT, growth
in foodgrain production has been a central policy focus. However, foodgrain account for less
than 25 percent of the value of output in agriculture and allied sectors. Against the expected
increase of 4 percent of GDP per annum from the farm sector in the Tenth Plan, the actual
achievement was only 2.3 percent per annum. Thus there is a need for increase in production

17
of foodgrain from the current level of 804 LMT for wheat and 947 LMT for rice to meet the
anticipated increase in requirement under TPDS.
Further, procurement of rice and wheat was 90.43 percent and 85.51 percent of the mandi
arrival during 2006-07 to 2010-11 respectively. Within the current scale of production, unless
increase in mandi arrival of foodgrains is ensured, procurement level may not go up
significantly from the current level of 32 percent of the average production.
3.1.3 Procurement level of foodgrains by FCI and other agencies
3.1.3.1 In case of wheat, SGA procured about 76 percent to 86 percent of the total
procurement for the Central Pool during the last five years and FCI played a limited role
(Annexure-I). There is already a limited scope for SGAs to procure more (76 percent to 86
percent) and the old stocks (crop year 1984-85 onwards) are also not fully taken over by FCI
even after the end of financial years. Under the circumstances, FCI has to increase its direct
procurement and at the same time takeover of all the old stock to accommodate the new crops
every year and to create more vacant space in the procuring States.
3.1.3.2 In respect of rice procurement also, levy rice constitutes about 33 percent to 43
percent whereas CMR procured and supplied by SGAs was 51 percent to 62 percent during the
last five years. FCI’s role in procurement of rice was also limited ranging between 9.88 LMT
(3percent) to 19 LMT (7 percent) only. This indicates a need for larger role of FCI in direct
procurement to maintain under its custody stock of foodgrains upto a minimum buffer stock
level and increase the share of levy rice procurement from the millers.
3.1.3.3 Management stated that the major responsibility for procurement is undertaken by
the State Governments and the number of procurement centres operated by FCI is much less
then the procurement centres opened by State Government mainly due to inadequate staff to
operate procurement centres. Though State governments have regularly been requesting to
build sufficient infrastructure and to open adequate number of procurement centres, so that
the procurement to the Central Pool can be enhanced, FCI does not have the needed
resources. Thus, GOI has already issued directions to State Governments to make all
arrangements for procurement and opening of centres.
3.1.3.4 However, Audit observed that in order to meet the increasing requirements of
foodgrains, procurement level has to significantly go up to meet the shortfall to the extent of
150 LMT. This task cannot be left only to the State procurement agencies, but FCI has to start
playing a larger role in the procurement effort. GOI/FCI has to increase its procurement

18
network and intensify MSP reaches to farmers in different producing States to create incentive
to produce more foodgrains and ensure subsequent mandi arrivals.
3.1.3.5 In case of DCP States, the procurement was only between 0.49 LMT to 47.72 LMT
during the last five years. In case of rice, the procurement was between 48.71 LMT to 80.94
LMT during the last five years. It was between 19.40 percent in 2006-07 and 26 percent in
2009-10 of the total procurement. Ten DCP States contributed only 21.57 percent of the total
allocation under TPDS during the last three years. As a result the major contribution towards
TPDS and OWS requirements has been from FCI stocks.
3.1.3.6 In reply, management stated that there has been constant effort from Ministry for
increasing the number of States in the DCP mode of procurement since 1999-2000 and the
need to augment procurement under DCP States was constantly being addressed by the
GOI/FCI.
3.1.3.7 However, the fact remains that the DCP States contributed only 21.57 percent of the
total allocation under TPDS during the last three years. There was no significant increase in
their procurement level since 2008-09. Thus, there is a need to augment procurement under
DCP States. This would require identification of reasons for specific gaps/constraints between
potential and actual procurement for the Central Pool in 10 DCP States to assess the real
position on the ground level.
3.1.4 Food stock in Central Pool
3.1.4.1 In respect of wheat, FCI/GOI failed to maintain minimum buffer norms during
quarters from April 2006 to January 2008. The shortfall was between 4.88 LMT to 88.93 LMT.
For the quarter from April 2007 to June 2007, there was 7.03 LMT of wheat above the
minimum norm. The shortfall was due to low procurement of wheat during RMS 2006-07
which declined to 92.31 LMT from 147.87 LMT procured during 2005-06. Since 1 April 2008,
wheat lying in Central Pool started mounting ranging between 18.03 LMT to 144.57 LMT till
the quarter of 1 January, 2011 mainly due to increase in procurement of wheat.
3.1.4.2 The position of rice in Central Pool remained surplus in all quarters during 2006-07
to 2010-11 ranging between 1.77 LMT and 125.13 LMT. But only in 1 January, 2008 to 31
March 2008 there was short fall of 3.25 LMT in respect of rice due to increase in off-take by
State Governments (Annexure - II ).

19
Stock position of foodgrains in the Central Pool vis-vis minimum buffer norms
(Figures in lakh MT)
3.1.5 Allocation and offtake under TPDS
The allocation and offtake under TPDS, OWS and OMSS for the period 2006-07 to 2010-11 was
as under:
Table 6: Scheme wise Allotment (A) and Offtake (O) under TPDS, OWS and OMSS
Rice (Quantity in LMT)
Year
2006-07 2007-08 2008-09 2009-10 2010-11
A O A O A O A O A O
BPL 125.01 94.7 123.35 104.5 114.94 100.31 113.89 104.33 116.58 114.35
AAY 62.62 58.32 66.97 62.58 67.21 63.26 67.015 64.42 68.37 65.66
APL 244.74 58.15 82.82 57.89 59.16 57.1 67.14 65.37 75.94 65.98
Total TPDS 432.37 211.17 273.14 224.97 241.31 220.67 248.04 234.12 260.89 245.99
OWS 42.37 38.52 32.4 29.13 36.54 25.61 64.25 39.66 77.5 34.9
OMSS(D) 0 0.01 0 0.08 0 0.09 10.28 5.17 20.02 1.68
Sub.TOTAL 474.74 249.7 305.54 254.18 277.85 246.37 322.57 278.95 358.41 282.57

20
Wheat
Year
2006-07 2007-08 2008-09 2009-10 2010-11
A O A O A O A O A O
BPL 55.03 47.69 50.3 47.24 59.11 56.24 60.24 61.13 57.8 60.05
AAY 31.07 28.3 33.99 31.8 34.75 31.99 34.8 33.53 33.92 31.29
APL 58.08 26.53 35.34 29.33 52.6 37.1 132.8 95.26 122.66 97.41
Total TPDS 144.18 102.52 119.63 108.37 146.46 125.33 227.84 189.92 214.38 188.75
OWS 15.85 13.32 16.31 14.13 14.1 11.19 52.41 17.21 45.41 24.97
OMSS(D) 3.9 1.02 0 0.09 23.78 12.34 46.52 16.41 52.7 11.55
Sub Total 163.93 116.86 135.94 122.59 184.34 148.86 326.77 223.54 312.49 225.27
TPDS Total (rice + wheat) 576.55 313.69 392.77 333.34 387.77 346.00 475.88 424.04 475.27 434.74
Grand Total (rice +wheat) 638.67 366.56 441.48 376.77 462.19 395.23 649.34 502.49 670.9 507.84
3.1.5.1 Allocation of rice for TPDS, OWS and OMSS during 2006-07 and 2007-08 was 474.74
LMT and 305.54 LMT respectively. But it went down to 277.85 LMT in 2008-09 and increased to
322.57 LMT in 2009-10 and 358.41 LMT in 2010-11. The offtake against the above allocation
was between 246.37 LMT and 282.57 LMT during 2008-09 to 2010-11 at 53 percent to 89
percent.
3.1.5.2 In the case of wheat, allocation under TPDS, OWS and OMSS increased by 140 percent
from 135.94 LMT to 326.77 LMT during the last five years. The offtake increased consistently
from 116.86 LMT in 2006-07 to 225.27 LMT in 2010-11 ranging between 68 percent and 90
percent.
3.1.5.3 Though the allotment in OWS increased from 58 LMT in 2006-07 to 123 LMT in 2010-
11, but the corresponding offtake remained between 36 LMT and 59 LMT only. Under OMSS,
against allocation of 55.8 LMT and 72.72 LMT during 2009-10 and 2010-11, the offtake was only
21.58 LMT and 13.23 LMT respectively.
3.1.5.4 The total allocation of foodgrains for TPDS, OWS and OMSS increased substantially
from 2009-10 onwards reaching a level upto 649.34 LMT. This was further increased to 670.90
LMT in 2010-11. The allocation level was at 441.48 LMT and 462.19 LMT during 2007-08 and
2008-09 respectively. The offtake has been between 366.57 LMT to 507.84 LMT during 2006-07
to 2010-11 constituting an average of 75 percent.

21
Audit observed that the allocation during the last two years (2009-10 and 2010-11) was
increased substantially mainly to liquidate the mounting foodgains stock level. The enhanced
allocation for TPDS and OWS had greater impact on offtake of wheat than that of rice.
3.1.6 Assessment of foodgrains requirement for TPDS and OWS
3.1.6.1 The average allocation of foodgrains during the last five years was 572.37 LMT which
was higher than the average procurement of 490.21 LMT for the same period. Hence, the
present procurement level was found to be insufficient to sustain the existing level of allocation
of foodgrains. Moreover, during the last two years 2009-10 and 2010-11, the offtake was
500.28 LMT and 530.34 LMT as against 574.15 LMT and 566.97 LMT procured respectively. But
allocation of foodgrains had reached 620.07 LMT and 697.35 LMT during the same period. This
indicates that the gap between offtake and procurement of foodgrains has reduced
substantially. At the same procurement level, it would not be possible to meet the increasing
requirement of allocation for TPDS and OWS. With the increasing allocation and offtake under
TPDS and OWS, the procurement level of foodgrains would have to be increased significantly to
maintain and ensure availability of foodgrains.
3.1.6.2 Even at the peak procurement level of 566 LMT to 574 LMT during the last three years
(2008-2011), it would not be possible to match the allocation level of 670 LMT of 2010-11 in the
near future, more so with the enhanced estimated requirement of 720 LMT under NFSB. The
increasing food stock position above minimum buffer norms from 361.89 LMT, 476.95 LMT and
472.19 LMT as on 1 January 2009, 2010 and 2011 respectively was only a temporary situation.
The food stock would be completely liquated in subsequent months/years at the current
offtake and procurement level. Thus, shortfall in procurement of foodgrains against
requirement and the need to urgently augment the stock level needs serious consideration.
3.1.6.3 Management stated that as per its estimate the total requirement of foodgrains under
NFSB would be 527.4 LMT which FCI would be able to meet at the current level of procurement.
However, GOI has not intimated the criteria of selection of priority and general household and
therefore it was not possible to accurately assess the requirement of foodgrains.
3.1.6.4 However, Audit observed that as per the information received from Ministry
(November 2011), the total foodgrains requirement estimated under NFSB was between 670
LMT to 720 LMT. While the level of allocation during the last two years (2009-2011) had already
reached 650 LMT to 670 LMT and against which the offtake was 500 LMT and 530 LMT
respectively, but the procurement level was still in the order of 574 LMT and 567 LMT. This
indicates that procurement will have to go up by 17 percent to 27 percent which would be
about 40 percent of the total production in the country from the current level of 32 percent.
Moreover, offtake of foodgrains is expected to reach a maximum level considering the kind of

22
reforms envisaged under new dispensation such as doorstep delivery of foodgrains, cash
transfers, food coupons, etc.
3.1.6.5 Considering the current trend of procurement and mandi arrival of foodgrains, it is
expected that domestic produce should adequately meet the operational requirement of PDS
of 670 LMT to 720 LMT under NFSB. However, for additional requirement of foodgrains to
maintain minimum buffer stock norm presently prescribed (212 LMT to 319 LMT) for ensuring
food security, a one time special measure to augment foodgrains stock would be necessary.
3.1.6.6 In response, management stated that FCI had already given suggestion regarding
limitations of FCI in undertaking further direct procurement and thus actions need to be taken
by the GOI and State Governments for increasing procurement to meet requirement of
foodgrains under NFSB.
3.1.6.7 Audit further observed that if procurement from within the domestic market can not
be adequately enhanced, GOI/FCI may be compelled to import foodgrains from other countries
at higher prices. Until the number of both priority and general households to be covered in
rural and urban areas is estimated under the NFSB, it would not be possible to accurately assess
the requirement of foodgrains for PDS. The eligibility criteria for identifying the households
have not been defined in the Bill.
Thus, against the total average production of the wheat and rice in the country (804 LMT and
947 LMT respectively) during the last five years, the procurement has been to the extent of 32
percent. Considering the average allocation (572.37 LMT) of foodgrains under TPDS during the
last five years, the procurement level (490.21 LMT) would soon become inadequate to meet
the requirement. The role of FCI in procurement of wheat and rice has been limited to that
extent of 9.88 LMT to 19 LMT and 13.43 LMT to 52.88 LMT in case of rice and wheat
respectively.
FCI/ GOI did not maintain minimum buffer stock norms from April 2006 to April 2008 due to
low procurement in case of wheat. In case of rice, the required stock level was maintained
except during the quarter ending March 2008. Even the peak procurement level of 566 LMT to
574 LMT during the last three years (2008-2011) could not match the allocation level of 670
LMT in 2010-11. Thus, the increasing food stock position above buffer norms during 2009-11
was temporary and would remain completely liquidated in subsequent months/years. As the
requirement of foodgrains has been estimated to go up from 670 LMT to 720 LMT under NFSB,
it would be necessary to significantly enhance the procurement level of all agencies.
Recommendations:

23
(i) There is an immediate need for GOI/FCI to review its procurement policy in order to
ensure enhancement in mandi arrival to facilitate increase in direct procurement by
FCI and SGAs as well as DCP States in view of increasing requirement under current
TPDS/NSFB.
(ii) GOI will require to initiate special measures in the field of agriculture and irrigation to
enhance production of foodgrains in view of the enhanced requirement envisaged
under NFSB.
3.2 Minimum Support Price
3.2.1 MSP set as a floor price for foodgrains
One of the objectives of the food security system is providing price support through
procurement of foodgrains for safeguarding the interests of the farmers. This is operationalised
by way of Minimum Support Price (MSP). For increase of foodgrain production, ensuring
remunerative rates and stable prices through MSP operation remains an important element of
the food security strategy. MSP sets floor prices in the existing system, which is fixed by CACP
for purchase of foodgrains offered by farmers. The role of MSP as a floor price has been
however disturbed by statutory levies imposed by various States on the purchase of foodgrains
and its persistent increase had the potential of effecting prices in the market.
3.2.2 Fixation of MSP higher than the cost of production
It has been pointed (HLC, 2002) that MSP for paddy and wheat had been fixed with higher
margin over the cost of production. This has caused distortion in relation to market realities and
disturbed inter-crop parities favoring rice and wheat over other crops and a few regions over
the others. MSP has become increasingly more of a procurement price rather than being a
support price to increase production. All India weighted average cost of production for 2011-12
estimated by the CACP including all the input costs was ` 742 per quintal for paddy and ` 826
per quintal for wheat for 2010-11. However, MSP for wheat and rice per quintal for 2011-12
was fixed at ` 1,120 and ` 1,657 respectively. Besides, GOI has been paying bonus over and
above the MSP pushing up the acquisition cost of foodgrains.
3.2.3 Effect of MSP on acquisition cost of foodgrains
3.2.3.1 MSP increased by 72.31 percent for wheat and 91.34 percent for rice during 2006-07
to 2011-12. This has contributed to rise in acquisition cost of foodgrains and a widening gap
between the prevailing MSP and the issue price. Procurement operations through MSP regime
could cause fiscal stress by way of increasing food subsidy bill which may not be sustainable in
future. The increase in MSP also has a bearing on statutory/obligatory charges levied on

24
purchase of foodgrains by different State Government as these charges are fixed as a
percentage of the MSP. Increasing statutory charges have inflated the acquisition cost of
foodgrains. Rapid rise in MSP, payment of bonus and statutory levies imposed by State
Governments have contributed to high economic cost of foodgrains.
3.2.3.2 Though increase in MSP over the years is attributed to have contributed towards
increase in procurement of foodgrains but whether incentivizing farmers in such a manner have
a resultant effect on their production and productivity needs assessment. It is noteworthy that
production of wheat and rice during the last five years has remained more or less the same.
Agriculture sector GDP has been stagnating during the last three years from 2007-08 to 2009-
10. To achieve the critical level of productivity and to overcome stagnating productivity levels,
massive capital investments would be required in the agriculture inputs, irrigation and research
and development. While enhancing the returns farmers get on their produce is essential for
incentivizing them to produce more, it is equally necessary to ensure extension of price support
to areas where MSP have not been effectively enforced so that farmers of these areas do not
abandon wheat and rice in favor of other crops.
3.2.4 Inadequate Procurement network of FCI and lack of enforcement of MSP
MSP have been pegged at very high level, but farmers in different regions remained
unprotected against the price fluctuation. A large number of small and marginal farmers have
no direct access to market and increase in MSP would not actually benefit such farmers.
Greater effort need to be made to include greater number of States under price support
operations by increasing procurement network of FCI. As at present FCI operates only in few
selected States, farmers in other States such as Bihar, Assam, Orissa and UP often get prices
lower than MSP. This would not only provide incentives to farmer to produce more foodgrains
but facilitate increase in mandi arrival of foodgrains. In order to further streamline the MSP
system, recommendation of HLC to make CACP an empowered statutory body and giving MSP
statutory status deserves serious consideration. At present, in the implementation of MSP, no
agency is under any obligation to open procurement centres or extend support operations even
if prices of foodgrains fall below the prescribed MSP.
From above it is evident that meaningful reduction in acquisition cost of foodgrains can takes
place only if MSP, payment of bonus over and above MSP and statutory levies imposed by state
governments are rationalized. Thus, there is a need for concerted efforts to check rapid
increase in subsidy bills of GOI through reforms in the cost structure.
Recommendations:

25
(i) GOI/FCI may consider giving statutory status to MSP to facilitate its enforcement and
greater efforts should be made to increase procurement network of FCI that ensures
MSP in different parts of the country.
(ii) GOI should formulate plan for rationalization of cost structure with a view to check
rapid increase in food subsidy bills of GOI.
3.3 Procurement Incidentals
The expenses incurred for procurement of foodgrains upto the stage of receipt in the first
storage point are classified as the procurement incidental charges. This charge comprises
statutory charges and non statutory charges. Statutory charges include mandi charges (market
fee/ dami/Arhatia Commission/ Rural Development Cess/ Auction fee), purchase/ trade tax and
gunny costs. Non-statutory charges include mandi labour, transportation costs, driage losses,
custody and maintenance charges, interest and milling charges for paddy, etc.
3.3.1 Statutory charges
The statutory/obligatory charges are fixed as a percentage of the MSP by the respective State
Governments (Annexure-III).
3.3.1.1 High incidence of statutory charges in main procuring States.
Statutory charges in respect of wheat show wide variation amongst different States. Higher
incidence of such charges was noticed in Punjab, Haryana and Uttar Pradesh which are the
main procuring States in comparison to the other States. During the last five years 2006-07 to
2010-11, the average statutory charges of wheat in respect of Punjab (` 12.10 per quintal) are
approximately three times of statutory charges of Rajasthan (` 3.68 per quintal) as well as of
Madhya Pradesh (` 3.76 per quintal) and statutory charges of Haryana (` 10.50 per quintal) are
approximately 2.5 times that of Rajasthan and Madhya Pradesh.
Similarly, statutory charges in respect of paddy show wide variation amongst different States.
Higher incidence of such charges was noticed in Punjab, Haryana and Andhra Pradesh which are
the main procuring States in comparison to the other States. During the last five years 2006-07
to 2010-11, the average statutory charges of paddy in respect of Punjab (` 12.10 per quintal) are
approximately three times of statutory charges of Madhya Pradesh (` 4.00 per quintal).
Statutory charges of Haryana (` 10.50 per quintal) are approximately 2.5 times that of Madhya
Pradesh.

26
3.3.1.2 Statutory charges remained in the range of 12.03 percent to 15.07 percent for wheat
and 11.13 percent to 14.33 percent for rice of the total acquisition costs of respective
commodities during the period 2006-07 to 2010-11. The financial impact of this was that the
acquisition costs rose from ` 908.42 per quintal in case of wheat in 2006-07 to ` 1,310.49 per
quintal in 2010-11 accounting for 44.26 percent. In case of rice, the acquisition cost was `
1,101.60 per quintal in 2006-07 and increased to ` 1,784.88 per quintal in 2010-11 constituting
62.03 percent. The total statutory charges increased from ` 4,228.92 crore approximately
(2006-07) to ` 9,909.27 crore approximately (2010-11) which account for 134.32 percent rise
(Annexure-IV).
3.3.2 Recommendations for fixation of procurement incidental yet to be accepted by States
HLC (2002) had recommended for a procurement price inclusive of a uniform maximum
allowance limit for state levies. This also was pointed by audit in its report No 16 of 2006, Union
Government (Civil) Performance Audit and discussed by the PAC. On its action taken report, the
administrative ministry informed that a study on principles to be adopted for fixation of PICs
was conducted by the Chief Adviser (Cost), Ministry of Finance (December 2008) which
recommended that the GOI may continue to pursue the issue of reduction in statutory charges
with the respective State Governments for reduction of such taxes/levies. The
recommendations based on the study have been sent to State governments for their comments
which are awaited.
3.3.2 Lack of uniformity in non-statutory charges
3.3.2.1 Non-statutory charges in respect of wheat show wide variation amongst different
States. Higher incidence of such charges was again noticed in Punjab, Haryana and Andhra
Pradesh.
3.3.2.2 Mandi labour charges range from ` 9.47 per quintal to ` 13.24 per quintal in respect of
wheat in major procuring States (Punjab, Haryana, UP and MP) during 2006-07 to 2010-11.
Whereas these charges ranged from ` 4.69 per quintal to ` 7.40 per quintal in respect of
Rajasthan during the same period.
3.3.2.3 Transportation and handling charges ranged from ` 11.83 per quintal to ` 25.56 per
quintal in respect of wheat in major procuring States (Punjab, Haryana, UP and MP) during

27
2006-07 to 2010-11. Whereas these charges ranged from ` 11.56 per quintal to ` 17.76 per
quintal in respect of Rajasthan during the same period.
3.3.2.4 In Punjab region there are no administrative charges for wheat during the last four
years. It ranged between ` 16.25 per quintal to ` 27.50 per quintal in respect of Haryana, Uttar
Pradesh, Rajasthan and Madhya Pradesh. In respect of rice, there are no administrative charges
for the States of Haryana, Uttar Pradesh, Andhra Pradesh and Madhya Pradesh. However, the
same ranged between ` 16.88 per quintal to ` 25.75 per quintal in respect of only Punjab region.
3.3.2.5 The non-statutory charges also remained in the range of 3.09 percent to 6.31 percent
for wheat and 5.02 percent to 5.71 percent for rice of the total acquisition costs from 2006-07
to 2010-11 (Annexure–V). The total non-statutory charges increased from ` 1,948 crore (2006-
07) to ` 3,047 crore (2010-11). This rise in acquisition costs was also significantly contributed by
increase in non statutory charges levied by the State governments which increased by 56.42
percent during 2006-07 to 2010-11.
In response, management stated that some amount of variation in the various element of cost
incidentals is inevitable due to different practices viz. geographic spread, different labour and
transportation rates, etc., and recommended to GOI that the significant variations across the
States need to be kept in view before finalizing the costing sheet for wheat, rice and coarse
grains.
Further, GOI stated that non statutory charges vary from State to State depending upon the
quantum of procurement, quantum of foodgrains transported within the State, location of
procurement centres, location of storage godowns, location of rice mills and actual storage
time for which foodgrains were stored in the State.
However, the fact remains that wide inter-State variations both in statutory and non statutory
charges are being charged by State Governments which have large impact on the quantum of
food subsidy pay out. Meaningful reduction in acquisition cost of foodgrains can take place only
if increasing economic cost due to high statutory and non-statutory charges can be rationalized.
3.4 Buffer stocking policy
3.4.1 Minimum buffer norms
As per the policy, buffer stock is meant basically to serve as food security for emergency
situations, uninterrupted supply during inter-seasonal scarcity and price stabilization in the
market which should be maintained at all times. The GOI prescribes minimum buffer norms
for stocking of foodgrains (wheat & rice separately) in the Central Pool at the beginning of

28
each quarter. Stock over and above the minimum buffer stock requirement are to be used for
allocation to meet the requirements of TPDS, welfare scheme, strategic reserves, export, etc.
3.4.2 Delay in review of buffer norms
Ministry of Consumer Affairs, Food & Public Distribution fixes the buffer norms for each Five
year plan to meet the prescribed minimum buffer stock for food security. Buffer stock norms
for the Tenth Five year plan (April 2002 to March 2007) were fixed based on Fifth Technical
Group’s Report from April 1, 2005. As for revision of buffer norms for 11th Five year plan (April
2007 to March 2012), a study was entrusted (April 2006) to the 6th Technical Group under the
Chairmanship of Secretary (Food and Public Distribution).
This Group further assigned (April 2007) the study to the National Centre for Agricultural
Economics and Policy Research (NCAP) which submitted (March 2009) its final report.
However, neither the recommendations of the NCAP were implemented by the Technical
Group nor has the Group fixed (June 2011) any buffer norms for 11th Five year plan though
due from 1.4.2007. The Ministry stated (November 2011) NCAP has been asked to revise its
recommendations in the context of NFSB and the revised recommendations were awaited.
3.4.3 Mismanagement of food stock
During 2002-04 GOI allowed high stock to be piled up and subsequently liquidated the same
through export at the rate below the BPL issue price leading to low stock below the buffer
norms. The stock had to be augmented by importing at higher rate than the prevailing MSP.
Audit observed that during 2002-04 when the stock of foodgrains accumulated above the
minimum norms (157 LMT tones as on October 1, 2002 against the norm of 65 and to 52
against 65 as on 1 October 2003), GOI liquidated the same through exports of wheat (197.1
LMT) and rice (135.3 LMT) from November 2000 till February 2004 going by the prescribed
minimum norms.
In the meanwhile, the stock of rice as on October 1, 2003 went down to 52.41 LMT as against
the minimum norm of 65 LMT and wheat was at 106.60 LMT in December 2004 against buffer
norms of 116 LMT. The stock further decreased to 73.05 LMT in February 2005 and 57.50 LMT
in March 2005 against minimum buffer norm of 84 LMT resulting in depletion of food stock
position. Buffer stock of foodgrains was augmented through imports of wheat from early
2006 to April 2008 to the tune of 72.23 LMT till the stock went up to 58.03 LMT as against
minimum buffer stock level of 40 LMT on 1 April 2008. Such situation arose due to improper
assessment of buffer stock position under the existing buffer stocking framework.
3.4.4 Non-depiction of food security components in the minimum buffer norms
The present buffer stocking norms do not clearly specify what elements of food security (e.g.
emergency, price stabilisation, food security reserve, TPDS/OWS) constitute minimum buffer

29
stock. It also does not prescribe the appropriate level of each element for which buffer stock
should be maintained at all times.
3.4.5 Ambiguity in minimum buffer norms
The norms neither indicate the operational stock level nor the optimum and comfortable level
of stock to be maintained by GOI/FCI. The minimum norms for each quarter are measured
against the total food stock available in the Central Pool managed by FCI, State Governments
and their agencies for the whole country. Thus, the minimum buffer norms are taken to be all
inclusive. The food stock over and above the minimum norms were normally treated as excess
stock and were liquidated through exports, open market sales or additional allocations to States
from time to time.
But at the same time, GOI stated that stocks over and above the minimum buffer stock
requirement are for allocation to meet requirement of TPDS, welfare schemes, strategic
reserve, exports, etc., as per the policy in force without specifying the level of such operational
stock level. Thus, there is no clarity or transparency in the existing buffer norms.
Non-segregation of operational stock requirement from the minimum buffer norms is the
reason for such ambiguity in the existing buffer policy. Besides, as per the existing food policy,
about 73 percent to 90 percent of the total allocation out of the Central Pool is meant for
meeting the requirements of TPDS and 9 percent to 17 percent of OWS. Allocation and lifting of
foodgrains for PDS is carried out on a monthly basis and the food stock held for such purposes
in the Central Pool also keeps fluctuating depending upon actual off-take by States/UTs and
procurement patterns. Thus, for the requirement of TPDS/OWS, operational stock and
minimum level should be prescribed separately.
There is a need for clarity on the minimum buffer norms and the elements which are included,
indicating the optimal and manageable level of stock to be maintained in the Central Pool. This
would bring in greater certainty in the management of storage capacity and procurement
activities.
3.4.6 Lack of single point accountability for maintenance of minimum buffer of foodgrains
For purpose of measuring the stock level or the adequacy of stock of rice and wheat for TPDS
and OWS on the basis of the existing minimum norms, the total stock of foodgrains in the
Central Pool is taken and accordingly surplus or deficit stocks are determined. Central Pool
includes stock held by FCI, State Governments and their agencies. It may be pointed out that
the stock held by State governments and their agencies in case of DCP States are already
earmarked for TDPS and OWS and are no longer available for other purposes, though they are
part of Central Pool. The Pool also includes wheat stock lying with the State agencies not yet
taken over by FCI. Though stock position of rice and wheat is assessed based on buffer norms

30
for the total Central Pool, but in practice the entire actual stock in the Pool may not be available
to FCI for distribution.
The existing buffer stocking policy simply specifies quarterly stock position of foodgrains
available in the Central Pool and the minimum stock level as prescribed by GOI. This is relevant
for providing notional information on the availability of foodgrains in the Central Pool. But for
practical purposes, this does not identify the minimum stock level held by each agency and
which agency is primarily responsible for maintaining minimum buffer stock level is also not
specified. The food stock available under the custody of FCI during different quarters from April
1, 2006 to January 1, 2011 was below the minimum norms prescribed by GOI except in April 1,
2010 and October 1, 2010.
Thus, under the existing framework there is ample scope for discretion and manipulation of
information as data flow on stock balance in the Central Pool across the States is not yet
integrated. The responsibility for maintaining the mandatory minimum level norms for food
security should be entrusted to a nodal agency for ensuring better accountability and
transparency in the management of foodgrains stock of the country. For other activities such as
market intervention, emergency situation, import and export of foodgrains is already entrusted
with single nodal agency, i.e. FCI.
3.4.7 Lack of online information system for foodstock position
FCI undertook a project of Integrated Information System for Foodgrain Management (IISFM)
in 2003 for effective management of foodgrains stock in the country. This envisaged provision
of online stock position of any depot at any time given point of time. This would enable FCI to
review the buffer stock norms on a monthly basis instead of existing quarterly review system.
In this connection, COPU in their 35th Report (14th Lok Sabha) on FCI, recommended that FCI
headquarters and the regional offices should be computerised and connected to each other
to enable them to know at which level the minimum buffer stock norms may be fixed and
carry out a realistic assessment of possible procurement for ensuring optimum and
comfortable levels of stock for purpose of ensuring food security of the country.
However, updated position in any depot on any given day (instead of any given point of time)
was available only in respect of 112 depots out of 1643 depots (March 2010) and 186 depots
out of 1643 depots in July 2010. Besides, stock position of foodgrains with the State
Government agencies in the Central Pool was being collected manually by District Offices of
FCI and fortnightly reports were sent to FCI headquarters. The project was not fully
operational and did not serve its purpose of online real time information of stock, movement,
etc. As on March 31, 2011, 1549 depots out of total 1694 active depots reported up to date
stock data through this module.
Recommendations:

31
(i) The responsibility of maintaining minimum buffer norms and the actual stock should
be entrusted to a single nodal agency for ensuring accountability and transparency in
management of food stocks of the country.
(ii) There is a need for clarity on the minimum buffer norms and the elements included.
Maximum buffer stock norms indicating the optimal and manageable level of stock to
be maintained in the Central Pool after assessment of foodgrains requirement for all
purposes should be prescribed in the buffer norms.
(iii) On line information system should be operationalised in all the depots as well as in all
the State Government agencies and DCP States at the earliest to enable FCI to review
the position of the stock available at any point of time.
3.5 Financial impact on Food Subsidy
FCI purchases foodgrains for Central Pool at MSP which are issued to States for TPDS to serve
BPL and APL families and OWS at CIP fixed by Government. For this purpose, GOI provides food
subsidy to FCI for procurement, distribution of foodgrains and for maintaining buffer stock as a
measure of food security. In addition, GOI also passes on food subsidy to the States under DCP
which undertake direct purchases and distribution of foodgrains for TPDS on behalf of GOI.
Total food subsidy released during 2006-07 to 2010-11 was as under:-
Table 7: Total food subsidy released by GOI (` in crore)
Year FCI States Total Annual Growth (percent)
2006-07 20,786 3,042 23,828 -
2007-08 27,760 3,500 31,260 31.19
2008-09 36,744 6,924 43,668 39.69
2009-10 46,867 11,375 58,242 33.37
2010-11 50,730 12,200 62,930 8.05
Source: Annual Report of Department of Food & Public Distribution 2010-11
3.5.1 Audit observed that the amount of food subsidy released increased from ` 23,071 crore
in 2006-07 to ` 58,242 crore in 2010-11 i.e. by 252.45 percent during the last five years. This
was due to substantial increase in economic cost of foodgrains from ` 1,177.78 per quintal for
wheat in 2006-07 to ` 1,513.04 per quintal in 2010-11. In case of rice, the economic cost rose
from ` 1,391.18 per quintal in 2006-07 to ` 1,918.03 per quintal in 2010-11. However, CIP of
foodgrains remained unchanged since July 2002.
3.5.2 Food subsidy claims of FCI to the tune of ` 8,068.49 crore were pending from GOI at the
end of 2009-10. The claims include unregularised storage and transit shortages of ` 184.52 crore

32
(1980-2010), normal food subsidy of ` 5,770.00 crore, foodgrains issued free of cost ` 352.80
crore to various schemes and differential payments for State TPDS operations of ` 1,761.17
crore.
Management stated that all subsidy claims upto 2003-04 have been raised and released except
the unregularised shortages of ` 184.52 crore of past years. However, subsidy claims of `
8068.49 crore were still pending (March 2010) as per annual accounts of FCI. The reply of the
management is not acceptable as the outstanding subsidy claim on account of unregularised
shortages of ` 184.52 crore is part of the total outstanding subsidy claims of ` 8,068.49 crore
since 1980-81. Details of claims realised thereafter were not furnished for confirmation in audit.
3.5.3 Quantum of subsidy as a percentage of GDP
Out of the total subsidies expenditure of the GOI, food subsidies constitute 33.73 percent to
44.17 percent during the last five years. The percentage of food subsidy to the GDP was
between 0.5 percent and 0.77 percent. But under NFSB, food subsidy has been estimated at `
94,987 crore which would amount to 1.06 percent of Gross Domestic Product (GDP) if other
things remained constant from subsequent years. The total subsidy to GDP increased from 1.33
percent to 2.08 percent during the period 2006-07 to 2010-11 as shown below:
Table 8: Food subsidy, total subsidy and Gross Domestic Product (` in crore)
Particulars Year
2006-07 2007-08 2008-09 2009-10 2010-11 (RE) 2011-12 (BE)
Food subsidy 24,014 31,328 43,751 58,443 60,600 60,573
Other Subsidies 33,111 39,598 85,957 82,908 1,03,553 82,997
Total subsidy 57,125 70,926 1,29,708 1,41,351 1,64,153 1,43,570
Gross Domestic Product (GDP)
42,93,672 49,86,426 55,82,623 65,50,271 78,75,627 89,80,860
Percent of food subsidy to GDP
0.56 0.63 0.78 0.89 0.77 0.67
Percent of total subsidy to GDP
1.33 1.42 2.32 2.16 2.08 1.60
Source: Expenditure Budget Vol. I, 2011-12
3.5.4 Food subsidy components of FCI
Food subsidy bill of GOI has two components, namely, (i) consumer subsidy and, (ii) buffer
subsidy. Consumer subsidy is calculated by taking total economic cost minus sales realization
from PDS and OWS. Economic cost comprises acquisition cost and distribution cost. The

33
acquisition cost consists of procurement cost, States taxes, handling, transportation and
storage charges. Buffer subsidy on the other hand includes carrying cost of buffer and carryover
charges paid to SGAs by FCI for foodgrains kept by them beyond a prescribed date. The table
below indicates details of consumer subsidy and buffer subsidy claims:
Table 9: Details of consumer and buffer subsidy claims (` in crore)
Items 2006-07 2007-08 2008-09 2009-10 2010-11 (RE)
(1)Acquisition cost of Sales 32,681 38,279 40,215 52,904 67,410
(2)Distribution cost 8,945 9,000 8,051 7,019 8,781
Economic Cost (1+2) 41,626 47,279 48,266 59,923 76,191
(3) Less: Sales realization 18,207 17,930 17,024 22,902 26,365
(A)Consumer subsidy 23,419 29,359 31,242 37,021 49,826
4) Carrying cost of buffer 434 449 3,019 4,186 5,685
5) Carryover charges paid to SGAs 175 243 527 1,666 2,414
(B) Buffer subsidy (4+5) 609 692 3,546 5,852 8,099
(C) Unregularised losses for the year
0 0 58 98 NA
(D) Earlier years’ losses regularized
88 17 21 66 NA
Total food subsidy (A+B-C+D) 24,116 30,068 34,751 42,841 57,925
Source: FCI Accounts
3.5.4.1 Consumer subsidy
Audit observed that consumer subsidy increased from ` 23,419 crore in 2006-07 to ` 49,826
crore in 2010-11 i.e.by 112.76 percent increase. The percentage of consumer subsidy to the
total food subsidy remained between 97.10 percent and 86 percent during the period 2006-07
to 2010-11. This was despite the fact that sales realization showed an increasing trend from `
18,207 crore in 2006-07 to ` 26,365 crore in 2010-11. Sales realisation could cover only between
33 percent to 44 percent of the economic cost as offtake by the States for PDS was at 75
percent during the last five years.
As sales realisation depends on the offtake from FCI’s depots and has a direct bearing on the
consumer subsidy, it is essential to ensure optimum offtake by State Governments with
reference to allocated quantity and within GOI prescribed time schedule. Further, as the role of
FCI is linked ultimately to making foodgrains accessible to the poor through TPDS, optimal
distribution of foodgrains into the supply chain from FCI warehouses to PDS is essential to not
only bring down consumer subsidy but also provide reasonable predictability for procurement
target and help in better storage management. Hence, FCI’s responsibility does not stop at
movement of foodgrains to distribution centres in the States, but it should also play an active
role in ensuring regular and timely flow of foodgrains in coordination with the State
Governments.
3.5.4.2 Economic cost
34
3.5.4.2.1 Acquisition cost
The acquisition cost of sales increased from ` 32,681 crore in 2006-07 to ` 67,410 crore in 2010-
11 constituting increase of 206.27 percent over a period of five years. This was largely
attributed to consistent increase in MSP of wheat and rice, corresponding increase in statutory/
non-statutory charges and payment of bonus over and above the MSP. Detailed analysis of core
components under the acquisition cost revealed the following position:
(i) The MSP (including bonus) for wheat had risen from ` 700 per quintal in 2006-07 to `
1100 per quintal in 2010-11. Whereas MSP for rice rose from ` 925 per quintal in 2006-
07 to ` 1,493 per quintal in 2010-11.
(ii) Additional amount of 1,229.79 crore was incurred due to payment of bonus over and
above the MSP during the period 2006-07 to 2009-10 (Annexure - VI).
(iii) Statutory charges increased from ` 4,228.92 crore (2006-07) to ` 9,909.27 crore
(2010-11) which accounts for 134.32 percent increase (Annexure - IV). As a result,
acquisition cost of wheat rose from ` 902.42 crore per quintal in 2006-07 to ` 1,310.49
per quintal in 2010-11 accounting for 44.26 percent increase.
(iv) The total non-statutory charges remained in the range of 3.09 percent and 6.31 percent
for wheat and 5.02 percent and 5.71 percent for rice of the total acquisition cost from
2006-07 to 2010-11 (Annexure - V). The total non-statutory charges increased by 56.42
percent from ` 1,948 crore (2006-07) to ` 3,047 crore (2010-11) pushing up the cost of
acquisition of foodgrains during the last five years. The acquisition cost of rice was `
1,101.60 per quintal in 2006-07 increased to ` 1,784.88 per quintal in 2010-11
constituting 62.03 percent.
Acquisition cost: statutory/non-statutory charges, bonus, (in crore of `) during 2006-07 to 2010-11

35
194.29 539.46 255.78 240.26 0.000.00
10000.00
20000.00
30000.00
40000.00
50000.00
60000.00
70000.00
80000.00
2006-07 2007-08 2008-09 2009-10 2010-11
Acquisition cost
Statutory charges
Non-statutory charges
Bonus
3.5.4.2.2 Distribution cost
The distribution cost ranged from ` 7,019 crore to ` 9,000 crore during the last five years.
Decrease in the distribution cost from 2007-08 to 2009-10 was mainly due to reduction of
interest cost. The distribution cost constituted 21 percent of the economic cost in 2006-07
which further reduced to 12 percent in 2010-11. The distribution cost consists of freight and
handling charges, storage and interest charges, and shortages and the position during 2006-07
to 2010-11 was as shown below:
Table 10: Components of Distribution cost (` in crore)
Sl. No. Particulars 2006-07 2007-08 2008-09 2009-10 2010-11
1 Freight 2,778.71 3,043.48 2,121.51 2,617.33 2,799
2 Handling 1,248.40 1,281.45 1,579.57 1,545.35 2,118
3 Storage charges 947.46 897.58 994.53 898.81 1,500
4 Interest 3,084.80 2,845.05 2,222.30 947.51 671
5 Transit shortage 73.60 65.93 73.15 115.06 155
6 Storage shortages 92.62 124.62 3.80 48.10 127
7 Administrative Charges 719.66 741.70 1,055.78 847.04 1,411
Total 8,945.25 8,999.81 8,050.64 7,019.20 8,781
Source: Annual accounts of FCI
Components of distribution cost (average of five year) during 2006-07 to 2010-11

36
Analysis of distribution cost components revealed the following position:
(i) Freight and handling constituted major portion of the distribution costs upto 45 percent
to 59 percent respectively. The average freight charges were ` 2,672 crore during the last
five years. Of this, ` 15.88 crore were incurred on rebooking of wagons/rakes and ` 37.48
crore on demurrage and wharfage charges due to inefficiencies in movement activities.
(ii) Expenses on handling alone constituted 13 percent to 24 percent of the distribution cost.
The average handling cost per year was ` 1,555 crore due to various weaknesses in the
system. Though the volume of operation increased only by 25 percent from 2006-07 to
2010-11, but the handling expenses increased by 100 percent due to reductions in
working norms resulting in higher incentives, non-merger of gangs of labour and payment
of bonus and over time allowances. Despite this, FCI incurred ` 751.60 crore, ` 215.50
crore and ` 93.06 crore on incentives, OTA and idle labour charges respectively during the
period.
(iii) While payment of incentives/OTA to labour increased substantially, payment of idle
wages was also showing an increasing trend. Cost comparison of three types of labours
(Departmental labour (DL), Direct payment labour (DPS) and Contract labour) engaged by
FCI indicates that the labour cost of DL was higher by 468 percent compared to contract
labour. Similarly, cost of DPS labour was also higher by 210 percent in comparison to
contract labour. Cost savings on handling expenses could be achieved only if more
proportion of contract labours are engaged instead of DL or /DPS labour and at the same

37
time their deployment in various depots is rationalised to achieve optimal output in
handling activities.
In response, management stated that in depots recently notified under the provisions of
Contract Labour (R&A) Act, 1970, no work no pay system has been introduced instead of DL and
DPL which is comparatively much cheaper.
However, the fact remains that despite the introduction of contract labour, expenditure on
account of OTA, incentives, idle wages, demurrage charges, etc., was showing an increasing
trend during the last five years which indicates that the measures taken in this regard are yet to
have the intended impact on the cost of handling expenses incurred by FCI.
(iv) Interest charges substantially reduced to ` 947.51 crore and ` 671 crore during 2009-10
and 2010-11 from a high of ` 2,222.30 crore to ` 3,084.80 crore in the previous three years
(2008-11). Administrative charges constituted between 8.04 percent and 16.06 percent of
the distribution cost.
(v) Transit and storage shortages were between ` 76.95 crore to ` 282 crore i.e.1 percent to
3.2 percent of the distribution cost. In addition, an amount of ` 17 crores to ` 88 crores on
account of transit and storage losses regularised were claimed as subsidy. Unregularised
losses yet to be claimed were ` 156 crore.
(vi) Increase in economic cost has been attributed to rise in MSP with the corresponding
increase in post procurement expenses. Acquisition cost increased rapidly from 2008-09
to 2010-11 constituting 83 percent to 88 percent of the economic cost. Whereas, the
distribution cost remains within 12 percent to 17 percent of the economic cost during the
same period.

38
Economic Cost: - share of acquisition and distribution costs (` in crore) during 2006-07 to
2010-11
3.5.4.3 Buffer subsidy
Buffer subsidy includes carrying of buffer stock of FCI and carry over charges paid to SGAs.
Buffer subsidy increased from ` 609 crore in 2006-07 and ` 692 crore in 2007-08 to ` 3,546 crore
in 2008-09, ` 5,852 crore in 2009-10 and ` 8,099 crore in 2010-11 mainly due to mounting stock
of food grains. The percentage of buffer subsidy to the total food subsidy was 2.52 percent in
2006-07 which increased to 13.98 percent in 2010-11.
3.5.4.3.1 Carrying cost of buffer stock
The carrying cost incurred by FCI for maintaining buffer stock showed an increasing trend from
just ` 434 crore in 2006-07 to ` 5,685 crore in 2010-11 mainly due to high level of food stock
balance from 2008-09 onwards. The percentage of carrying cost incurred by FCI to total food
subsidy increased from a mere 1.80 percent in 2006-07 to 9.81 percent in 2010-11. The
increase from 2006-07 to 2010-11 was 13.10 times.
3.5.4.3.2 Carry over charges paid to SGAs
Carry over charges formed part of subsidy which are being reimbursed to State Government
Agencies (SGAs) by FCI. From ` 175 crore in 2006-07, the carry over charges paid to SGAs

39
increased to ` 2,414 crore in 2010-11 i.e by 1,279.42 percent mainly due to storage constraints
of FCI. The balance stock with SGAs at the close of financial years rose from 8.49 LMT in 2006-
07 to 83.58 LMT in 2009-10.
FCI owned storage capacity remained between 152.30 LMT to 156.10 LMT during the entire
period of five years. But the percentage of hired capacity of storage (Covered and CAP) to
owned storage capacity (Covered and CAP) shows an increasing trend from 65.48 percent in
2006-07 to 102.54 percent in 2010-11 resulting in increasing carrying cost of buffer. If increase
in hiring charges of storage capacity and carryover charges paid to SGAs remains unchecked,
buffer subsidy charges would soon exceed the distribution cost incurred by FCI.
Total food subsidy: share of consumer and buffer subsidies (carrying cost of buffer and
carryover charges paid to SGAs) in (` in crore) during 2006-07 to 2010-11
3.5.5 Thus, audit observed that increase of MSP from year to year, announcement of bonus
and steep rise in carrying cost of food stock pushed the food subsidy to ` 57,925 crore in 2010-
11, which was ` 34,751 crore in 2008-09. This is expected to go up further to ` 67,742 (BE) by
end of 2011-12 due to hike in MSP to ` 1,120 plus ` 50 per quintal as incentive bonus over and
above the MSP from ` 1100 per quintal for wheat, and in case of rice to ` 1,657 per quintal from
` 1,493 per quintal fixed for 2010-11. In the wake of the new food security bill, food subsidy bill
of GOI is expected to exceed the estimated cost of ` 94,987 crore. Besides, inefficiencies of

40
operations in FCI have also contributed to high level of distribution cost and carrying cost of
food stock mainly due to increase in hiring charges. On the whole, the cost borne by FCI on
wheat delivered through the PDS was ` 14.16 per kg while the subsidy on wheat was ` 8.31 per
kg and the cost on rice was ` 18.27 per kg while subsidy was ` 11.65 per kg. Since all costs of FCI
are automatically reimbursed, there is little incentive to raise efficiency level and reduce cost.
In order to enforce efficiency, the reimbursement of costs to FCI should be considered on
normative unit costs basis vis-à-vis actual quantity involved and instead of reimbursement of all
costs incurred by the organization for benchmarking performance in different divisions.
3.6 Distribution of foodgrains to PDS
One of the primary objectives of food security policy was making foodgrains accessible at
reasonable prices, especially to the weaker and vulnerable sections of the society, which is
carried out through TPDS with a network of FPSs throughout the country. In this regard, audit
reviewed whether increasing allocation and offtake truly indicate better reach of PDS and the
food subsidy reaches the intended beneficiaries. Delivery mechanism suffered from deficiencies
such as high exclusion and inclusion errors and leakages and illegal diversion as discussed in the
following paragraphs.
3.6.1 Anomalies in allocation of foodgrains to beneficiaries
Allocation of foodgrains from the Central Pool for distribution to BPL, AAY and APL families
under TPDS is made by GOI on the basis of 1993-94 poverty estimates of the Planning
Commission. Based on this estimates, the allocation of foodgrains for AAY and BPL categories
are made @ 35 kg per family per month for 6.52 crore BPL families in the country since
December 2000 as against 5.96 crore families originally estimated when TPDS was introduced in
June 1997.
As per official poverty ratio criterion, only 28 percent of the population is eligible under PDS at
all India level. However, food insecure households may be much higher than the official poverty
ratios. It has been observed that against the total ceiling of 6.52 crore BPL households including
2.50 crore AAY families, more than 8 crore BPL ration cards have been issued (2008)2 which
further increased to 11.04 crore in June 2010. Against the figure of 18.03 crore households, the
total number of ration cards issued was 22.32 crore. As a consequence, there are large errors of
exclusion and inclusion and ghost rations cards in most States3.
3.6.2 Leakage/diversion of foodgrains in the delivery chain
2 XI Plan document, Planning Commission
3 Programme Evaluation Organisation’s (PEO) Study, 2005
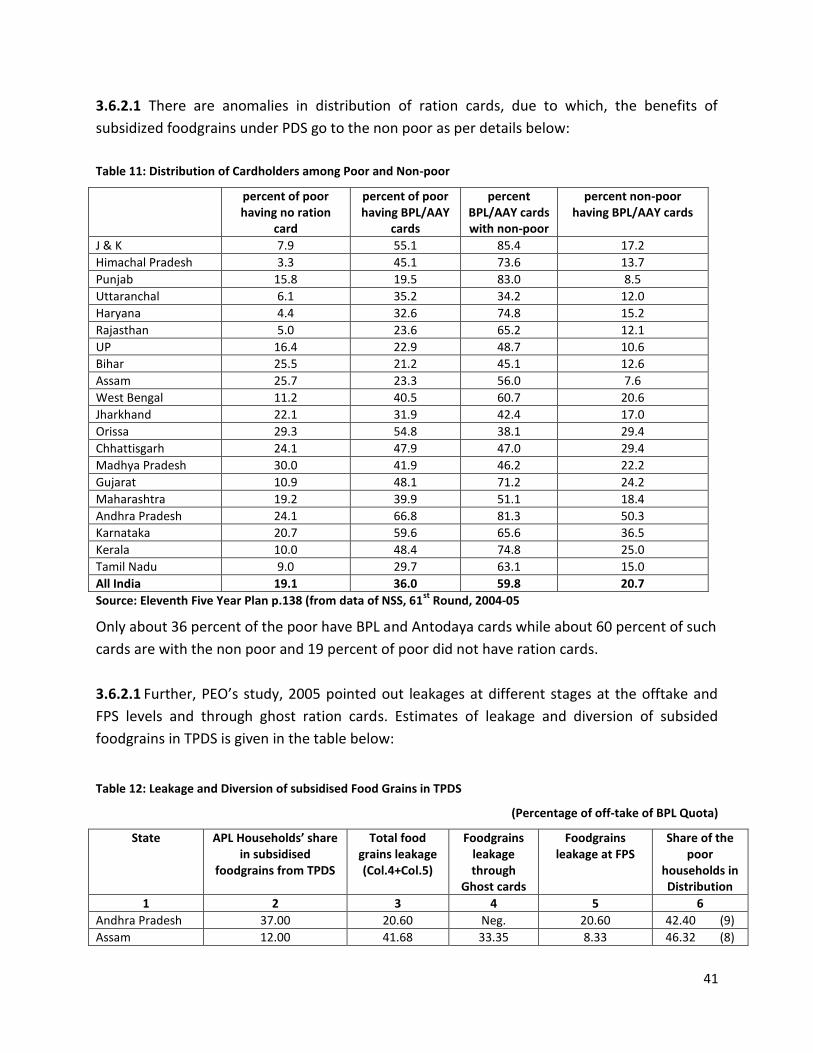
41
3.6.2.1 There are anomalies in distribution of ration cards, due to which, the benefits of
subsidized foodgrains under PDS go to the non poor as per details below:
Table 11: Distribution of Cardholders among Poor and Non-poor
percent of poor having no ration
card
percent of poor having BPL/AAY
cards
percent BPL/AAY cards with non-poor
percent non-poor having BPL/AAY cards
J & K 7.9 55.1 85.4 17.2
Himachal Pradesh 3.3 45.1 73.6 13.7
Punjab 15.8 19.5 83.0 8.5
Uttaranchal 6.1 35.2 34.2 12.0
Haryana 4.4 32.6 74.8 15.2
Rajasthan 5.0 23.6 65.2 12.1
UP 16.4 22.9 48.7 10.6
Bihar 25.5 21.2 45.1 12.6
Assam 25.7 23.3 56.0 7.6
West Bengal 11.2 40.5 60.7 20.6
Jharkhand 22.1 31.9 42.4 17.0
Orissa 29.3 54.8 38.1 29.4
Chhattisgarh 24.1 47.9 47.0 29.4
Madhya Pradesh 30.0 41.9 46.2 22.2
Gujarat 10.9 48.1 71.2 24.2
Maharashtra 19.2 39.9 51.1 18.4
Andhra Pradesh 24.1 66.8 81.3 50.3
Karnataka 20.7 59.6 65.6 36.5
Kerala 10.0 48.4 74.8 25.0
Tamil Nadu 9.0 29.7 63.1 15.0
All India 19.1 36.0 59.8 20.7
Source: Eleventh Five Year Plan p.138 (from data of NSS, 61st
Round, 2004-05
Only about 36 percent of the poor have BPL and Antodaya cards while about 60 percent of such
cards are with the non poor and 19 percent of poor did not have ration cards.
3.6.2.1 Further, PEO’s study, 2005 pointed out leakages at different stages at the offtake and
FPS levels and through ghost ration cards. Estimates of leakage and diversion of subsided
foodgrains in TPDS is given in the table below:
Table 12: Leakage and Diversion of subsidised Food Grains in TPDS
(Percentage of off-take of BPL Quota)
State APL Households’ share in subsidised
foodgrains from TPDS
Total food grains leakage (Col.4+Col.5)
Foodgrains leakage through
Ghost cards
Foodgrains leakage at FPS
Share of the poor
households in Distribution
1 2 3 4 5 6
Andhra Pradesh 37.00 20.60 Neg. 20.60 42.40 (9)
Assam 12.00 41.68 33.35 8.33 46.32 (8)

42
Bihar 9.60 81.54 26.13 55.41 8.86 (16)
Gujarat 5.02 42.06 28.29 13.77 52.92 (7)
Haryana 11.00 55.65 Neg. 55.65 33.35 (12)
Himachal Pradesh 14.48 31.44 31.03 0.41 54.07 (6)
Karnataka 27.50 43.40 25.67 17.73 29.10 (14)
Kerala 17.30 21.71 3.91 17.80 60.99 (5)
Madhya Pradesh 3.64 62.42 54.48 7.94 33.93 (11)
Maharashtra 8.03 26.53 10.78 15.75 65.44 (2)
Orissa 12.98 23.39 13.49 9.90 63.64 (4)
Punjab 13.00 76.50 Neg. 76.50 10.50 (15)
Rajasthan 3.00 31.95 Neg. 31.95 65.05 (3)
Tamil Nadu 49.91 15.66 9.26 6.40 34.44 (10)
Uttar Pradesh 6.22 61.27 22.30 38.97 32.52 (13)
West Bengal 7.75 19.15 13.85 5.30 73.10 (1)
All India 21.45 36.38 16.67 19.71 42.17
Source: Programme Evaluation Organisation, Planning Commission study, 2005
3.6.2.1.1 Substantial part of the foodgrains meant for the poor does not reach the target
groups indicating ineffective targeting of the poor under the existing TPDS. Mistargetting has
resulted in high exclusion and inclusion errors, Weaknesses in the delivery mechanism led to a
large scale leakage (36.38 percent), diversion (21.45 percent) of subsidised foodgrains to
unintended beneficiaries. Besides, the offtake of foodgrains by States from FCI does not match
with the estimates of PDS consumption of the same grains. The difference indicates the extent
of leakage of foodgrains. As per NSSO estimates of 2006, the extent of leakage and diversion of
grains shows an upward trend. The leakage was 28 percent in 1993-04 which had risen to 55
percent by 2004-05. The aggregate leakage for rice was 40 percent and expectedly diversion are
greatest from AAY allocations and least for APL allocations. The aggregate leakage for wheat
was 73 percent and the diversions were high for all the categories4.
3.6.2.1.2 As per PEO’ Study, during 2003-04, out of 14.07 million tonnes of food grains
issued to 16 States at BPL issue prices from the Central Pool, only around 5.93 million tonnes
was delivered to the poor families. From the remaining 8.14 million tonnes, 5.12 million tonnes
leaked out from the supply chain (FCI godowns to retail outlets) because of corruption in the
delivery system and 3.02 million tonnes was delivered to unintended beneficiaries (APL
households).
3.6.2.1.3 Recent studies (2009-10)5 also show large scale diversion/leakage of foodgrains
through supply chain in different States. Such diversion took place due to nexus between the
transporters, whole sellers/agencies and fair price shops owners and officials. This would 4 ADB Economic Working Paper Series No. 221 September 2010 by Shikha Jha and Bharat Ramaswami.
5 Wadhwa Committee Reports on PDS in various States ( Jharkhand, Rajasthan, Andhra Pradesh, Kerala, Tamil Nadu, Madhya
Pradesh and Uttrakhand.

43
require specific reform measures through participation of the people in the delivery process at
the field level.
3.6.3 Thus, due to identification errors, non-transparent operations and unethical practice in
the implementation of TPDS, about 58 percent subsidised foodgrains issued from the Central
Pool do not reach the BPL families (PEO’s Study 2005). There does not seem to have much of an
improvement since then. GOI/FCI has not conducted (November 2010) any study on impact of
subsidy on poverty/food security. In the absence of any recent study, it has not been possible
to review any improvement in the functioning of PDS. Leakage through the supply chain
indicates fiscal subsidy outflow to the non-poor under the food security policy framework.
3.6.4 Need for reforms: some issues
3.6.4.1 Experience with the targeted TPDS indicated that it is difficult to identify the poors and
nearly half of whom has been excluded and many non poor are included in the process. Even
under the national food security bill regime, identification of targeted beneficiaries would
continue to be a major implementation challenge. The bill aims at providing legal foodgrain
entitlement and envisaged “priority and general group” in the rural and urban area which
would cover 63.5 percent of the total population from the present coverage of 18.03 crore
families. The criteria to characterise and identify the poor are yet to be evolved. Failure to
formulate proper criteria would lead to failure to meet the basic objective of ensuring food to
the poor at affordable prices. It would also again result in large scale inclusion and exclusion
errors as the coverage will go up under the new bill. In the absence of proper criteria for
identifying the groups, it would not be feasible to implement the new provision as intended
with the possibility that few among the poor actually benefiting from the scheme. Till such time
the target beneficiaries are identified as envisaged, the present card holder system of TPDS
would have to continue with all its ineffective targeting/mistargeting of the poor.
3.6.4.2 Differential pricing, rate of entitlement of foodgrains, complex targeting of beneficiaries
with administrative complexity had been attributed to various leakages and diversion of
foodgrains in the present system. The same complexities and mistargeting of beneficiaries with
a consequential effect of diversion and leakage may continue in the new dispensation unless
determination of the entitlement of households/groups is carried out most scientifically.
3.6.4.3 New food security bill envisaged notable reform measures such as end to end
computerisation to ensure transparency of transactions of TPDS, cash transfer, food coupon to
targeted beneficiaries in lieu of their foodgrain entitlements. Food coupon/food stamps may be
more effective than the present system for achieving objective of income redistribution by
providing food cheaper to the poor than to the non-poor. Hence, the primary issue to be

44
addressed in this regard is how efficiently/effectively the subsidy delivery mechanism is able to
reach the intended beneficiaries.
3.6.4.4 TPDS can be further strengthened by means of effective use of IT including introduction
of a unique ID-based smart card system to plug leakages.6 In the state of Chhattisgarh, an end
to end computerisation of foodgrain supply chain from farmers, its storage, milling and
distribution of rice to ration card holders including movement of foodgrains from warehouses
to retail outlets implemented during 2007-08 was reported to have improved transparency in
the delivery system resulting in reduction of diversion and leakage in the delivery mechanism.7
3.6.4.5 It has been pointed out that diversions and leakage do not arise in a food coupon
system and would eliminate the need for dual retail marketing mechanism. Though food
coupon system has the potential to improve targeting efficiency by improving economic access
as consumer can use these coupons in any retail outlets, but the process involves the possibility
of counterfeiting and erosion of its value including high administrative cost. If TPDS is primarily
seen as an instrument for income redistribution, cash transfers in lieu of foodgrains could be
used as alternative to food subsidies. A number of States8 have proposed for disbursement of
food subsidy in cash to BPL families. The draft scheme has been prepared by GOI and the
feasibility of the alternate mode of transfer of food subsidy under TPDS was under examination
(2008). However, in-kind transfer is regarded as more appropriate if the objective is to meet
specific target of food intake.
3.6.4.6 Assessments of NSS 61st Round also suggest that in more self-selecting schemes such as
MDM, ICDS, and Food For Work, where the total number of beneficiaries is similar to the
number currently benefiting from a BPL or AAY status, are somewhat better reaching the poor
than the assignment of BPL cards.
3.6.4.7 The above alternative options of food coupon and cash transfer may be used to meet
possible gaps in supply of foodgrains from Central Pool by FCI due to substantial increase in
projected foodgrains requirement under NFSB. However, total replacement of TPDS by cash
transfer/food coupon system may largely depend upon successful implementation of the
scheme undertaken on pilot basis in various States.
Recommendations:
6 XI Plan document
7 Dhan VK, D K Srivastav, A K Somasekhar and Rajeev Jaiswal, 2009- Computerization of paddy procurement and Public
Distribution system in Chhattisgarh.
8 Delhi, Uttar Pradesh, Haryana and Bihar.

45
(i) GOI should intensify various reform measures initiated on pilot basis in different States
for reducing leakages and diversions such as cash transfers, bar-coded food coupons,
food stamps, biometrically coded ration cards etc., so as to utilise the lessons learnt
from these measures in other States within specific time frame.
(ii) GOI may strengthen TPDS through end to end computerisation and the existing supply
chain should be streamlined for making its governance more transparent and
participative.
(iii) GOI may urgently formulate the criteria for determining eligibility and entitlement of
foodgrains for different groups/areas under new the dispensation which ensures a
more effective targeting of the poor.

46
Chapter 4: Storage Management
4.1 Introduction
The primary policy objective of GOI is to ensure food security in the country through timely and
efficient procurement and distribution of foodgrains. This involves procurement of foodgrains,
building up and maintenance of food stocks, their storage, movement and delivery to
distributing agencies. Thus, the storage management is an important link in the whole system
from procurement to distribution of foodgrains to the consumers.
The storage capacity available with Government agencies both at the Central and the State
levels are primarily used for keeping Central stock of foodgrains for the PDS and other
Government schemes. The position of storage space available with Food Corporation of India
(FCI), Central Warehousing Corporation (CWC) and State Warehousing Corporations (SWCs) as
on March 31, of 2007 to 2011 and stock of foodgrains in Central Pool as on 1 June of the
respective years were as under: Table 13: Total storage capacity available with FCI, CWC, SWCs and stock of foodgains in Central Pool
(Figures in LMT)
As on 31st
March
FCI (Owned covered and CAP)
CWC SWC Total Storage Capacity
Stock of total foodgrains lying in Central Pool as on 1
st June
2007 152.30 102.20 191.86 446.36 259.27
2008 151.25 98.78 187.32 437.35 363.67
2009 151.40 105.25 196.82 453.47 549.26
2010 154.80 105.98 209.26 470.04 608.79
2011 156.10 102.47 214.41 472.98 655.95
Source: FCI – Monthly Performance Reports, CWC and SWC – Annual reports of CWC
From 2008-09, there was a sharp increase in procurement of foodgrains by Government
agencies and which resulted in severe strain on available storage capacity. As against the total
capacity of 453.47 LMT to 472.98 LMT during 2008-09 to 2010-11, the total stock of foodgrains
as on June 1 of the respective years was 549.26 LMT, 608.79 LMT and 655.95 LMT. Thus,
storage gap between storage capacity and stock of foodgrains during 2008-09 to 2010-11was
between 95.79 LMT to 182.97 LMT. Further, in keeping with the requirement of foodgrains
under NFSB estimated to be between 670 LMT to 720 LMT, GOI/FCI has to arrange additional
storage capacity of 247 LMT (720 LMT minus 473 LMT).
Total storage capacity available with FCI (including hired space) was 316.10 LMT as on 31 March
2011 constituting 67 percent of the total storage space available with all Government agencies.
The storage capacity available with FCI was concentrated in procurement oriented States (54
percent) like Punjab, Haryana, Andhra Pradesh, Uttar Pradesh and Chhattisgarh. Consuming
States like Rajasthan and Maharashtra have 11 percent of the total capacity and the rest 35

47
percent is shared by remaining States. Even the space available with FCI in 19 States/UTs was
not sufficient to hold 4 month operational stock of foodgrains. However, the capacity utilisation
by FCI during 2010-11 ranged from 70 percent to 91 percent. In 11 States, utilization of annual
storage capacity as compared with annual offtake of foodgrains was only 3.53 percent to 40.23
percent during 2006-11.
Insufficiency of storage space with FCI resulted in substantial increase in hiring charges (221
percent) during last five years. Substantial quantity of wheat could not be taken over from SGAs
and payment of carry over charges rose 13 times. Due to non adherence to FIFO method in
issuance of foodgrains, 0.82 LMT of wheat amounting to ` 82.51 crore lying in the custody of
SGAs was declared non-issuable during 2010-11.
In order to augment the storage capacity, GOI formulated various programmes/schemes viz., (i)
augmentation of storage capacity by way of construction, (ii) national policy on handling,
storage and transportation of foodgrains, (iii) construction of godowns through private
entrepreneurs (PEG), and (iv) augmentation of storage capacity in the North East. A total of
164.12 LMT storage capacity was envisaged during the last five years. However, 8.04 LMT was
actually constructed upto 31 March 2011.
Audit findings are given in subsequent paragraphs.
4.2 Audit findings
4.2.1 Total storage capacity available with FCI, CWC and SWC and assessment of
requirement
Storage capacity available with FCI and all the government agencies was sufficient for the stock
of foodgrains in Central Pool upto 2007-08. However, with the sharp increase in procurement
of foodgrains to 567.93 LMT during 2008-09 from 398.65 LMT in 2007-08 which further rose to
574.16 LMT in 2009-10 and 566.97 LMT in 2010-11, the total storage capacity could no longer
accommodate the balance stock of foodgrains available in the Central Pool.
As against the total capacity of 453.47 LMT to 472.98 LMT during 2008-09 to 2010-11, the total
stock of foodrains as on 1 June of the respective years was 549.26 LMT, 608.79 LMT and 655.95
LMT resulting in shortage in storage capacity from 95.79 LMT to 182.97 LMT. Though the total
foodgrains lying in Central Pool increased to the extent of 396.68 LMT between 2006-07 and
2010-11, capacity addition was only to the extent of 26.62 LMT. Capacity addition was not
commensurate with the increase in foodgrain stock level. Further, with the increase in
requirement of foodgrains under NFSB (670 LMT to 720 LMT,) an additional capacity of 247
LMT (720 LMT minus 473 LMT) would be required to accommodate the likely increase in food
stock.

48
In response, management stated that the total capacity available in the country was 645.44
LMT out of which 169.38 LMT is in the form of CAP capacity. An additional capacity upto152.97
LMT (March 2011) has been approved by HLC. However, storage capacity to the extent of 182
LMT will be met when additional capacity of 30.99 LMT (MP – 19.52 LMT, Chhattisgarh – 3.30
LMT and Andhra Pradesh – 8.17 LMT) would be approved.
Audit observed that the total storage capacity of 472.98 LMT available with FCI, CWC and SWC
constitutes 73 percent of the total storage capacity of 645.44 LMT available for storage of
foodgrains in the country. Out of which, total capacity with FCI at the end of 2010-11 was
316.10 LMT (67 percent of 472.98 LMT). Unless additional storage capacity that can actually be
hired and made available for storing of foodgrains from the remaining capacity of 329.34 LMT
(645.44 LMT – 316.10 LMT) is identified, FCI would not be able to correctly assess the storage
capacity that can be made available when needed. Even if FCI manages to increase its capacity
to the extent of 472.98 LMT, the fact remains that the shortage of storage capacity would
remain to the extent between 182.97 LMT to 247 LMT. Even after considering the anticipated
capacity addition under various programmes to the extent of 164.12 LMT, the shortfall in
storage capacity will still persist.
4.2.2 Storage Capacity with FCI The total storage capacity with FCI ranged from 252.07 LMT to 316.10 LMT as on 31 March of 2007 to 2011 as under:
Table 14: Storage capacity available with FCI (including hired) during the last five years
(Figures in LMT)
Year Covered CAP Grand Total Owned Hired Total Owned Hired Total
2006-07 129.41 93.42 222.83 22.92 6.32 29.24 252.07
2007-08 129.48 87.13 216.61 22.06 0.27 22.33 238.94
2008-09 129.67 101.24 230.91 21.73 0.15 21.88 252.79
2009-10 129.69 128.90 258.59 25.08 4.69 29.77 288.36
2010-11 129.91 154.59 284.50 26.16 5.44 31.60 316.10
Source: Monthly Performance Reports
4.2.2.1 Inadequacy of total storage capacity with FCI
The owned (CAP and covered) storage capacity with FCI ranged from 151.40 LMT to 156.07 LMT
during 2006-07 to 2010-11. It was showing a decreasing trend as against the total storage
capacity available with FCI. This was not even enough to accommodate minimum buffer stock
of 162 LMT to 319 LMT. During the last three years, the average own storage capacity was 54
percent of the total capacity available with FCI.
Due to shortage of own storage capacity, FCI had to go for hiring increasingly. As a
consequence, the hiring charges went up by 221 percent from ` 321.51 crore in 2006-07 to `

49
1032.80 crore in 2010-11. The shortage of storage space has also resulted in increase in
payment of carry over charges to SGAs from ` 175 crore in 2006-07 to ` 2,414 crore in 2010-11.
Thus, instead of constructing own godowns, FCI adopted an approach for hiring of more and
more storage capacity and become heavily dependent on outside agencies.
In response, the management stated that the hire capacity is more flexible and can be hire/de-
hire as per requirement. It is prudent to rely on hire capacity alongwith the creation of own
capacity. Though FCI had identified a gap of 89.42 LMT for own construction and a requirement
of ` 4000 crore was estimated under Eleventh five year plan (2007-12). However, Ministry
earmarked only ` 125 crore against which 1.39 LMT was envisaged and 0.34 LMT had been
completed upto March 2011.
Management further stated that FCI recognised the fact that own godown become valuable
assets because it is easier to make long term strategic planning, effect changes in this
infrastructure with the changing requirements, administrative convenience and flexibility in
managing them and the benefits of value appreciation with passage of time, yet in view of
reduced allocation of funds in the Eleventh Five year plan, it was necessary to look for
alternative resources to create such a huge capacity.
Audit observed that despite inadequate own storage capacity which was not even sufficient to
accommodate stock of foodgrains as per buffer norms during the last five years, GOI/FCI
planned own construction only for 5.02 LMT during Tenth to Eleventh Five years plans (2002-
12). In order to meet the gap, GOI/FCI adopted an approach in favour of hiring than
constructing its own capacity and incurred hiring charges to the tune of ` 6,879 crore (including
carry over charges paid to SGAs) during the last three years. Thus, the approach needs review.
4.2.2.2 Inadequacy of storage capacity under Regional offices
(i) In Punjab region, the total storage capacity (own 29.55 LMT and hired 53.68 LMT) was
83.23 LMT. Due to high foodgrain stock levels in the last three years, an additional 71.25
LMT storage capacity was to be created through private entrepreneurs, CWC and Punjab
State Warehousing Corporation (PSWC) in Punjab.
(ii) In Haryana region, own covered storage capacity was merely 33.70 percent to total
covered capacity available with FCI. Major portion of the storage capacity was taken on
hire. The hiring charges paid by the region increased from ` 28.55 crore in 2006-07 to `
100.63 crore in 2010-11.

50
The assessed peak storage of last three years was 85.94 LMT as against the available
capacity (covered for owned and state agencies godowns) of 42.14 LMT. Thus, during
2008, the shortage capacity was to the extent of 43.80 LMT. However, HLC approved
(August 2009) storage capacity of only 38.80 lakh LMT under PEG scheme. Even after a
lapse of three years, no storage capacity was added so far (July 2011).
RO Haryana stated (December 2011) that due to lengthy procedure and frequent revision
in the capacity requirement and the guarantee period, the scheme could not be actually
implemented. However, the fact remains that there was considerable delays in the
scheme and the objective of capacity addition remains unfulfilled even after three years
of its approval.
(iii) In Assam region, the total storage capacity available was 2.72 LMT (own: 2.01 LMT and
hired: 0.71 LMT) as on March 2011 as against the assessed requirement of 9.52 LMT.
(iv) In West Bengal region, the storage capacity with FCI was 10.49 LMT (own: 8.49 LMT and
hired: 2.00 LMT) at the end of March 2011. But only 1.27 LMT and 0.15 LMT were planned
to be constructed under PEG and Eleventh Five year plan (2007-12) respectively.
However, no capacity was added till March 2011.
(v) In Bihar region, total storage capacity was 6.66 LMT (owned: 4.34 LMT and hired: 2.32
LMT) at the end of March 2011. The average stock held in the region was less than 1
month allocation in 2006-08. The available storage capacity did not still exceed 2 months
allocations in upto 2011. One godown (25000 MT) was planned to be constructed at
Mohania (DO Gaya) during Eleventh five year plan at a cost of ` 7.25 crore. Land for the
same could not be acquired so far (March 2011).
(vi) Andhra Pradesh region has a storage capacity of 31.37 LMT as against the assessed
capacity of 20.73 LMT. However, at the district level and in some procurement districts,
storage crunch was observed during the period.
(vii) In respect of Kerala Region, FCI has own storage capacity of 5.37 LMT (covered 5.17 LMT
and open 0.20 LMT) and no storage space was hired from either CWC/SWC or private
parties. The utilization was also low between 47 percent and 30 percent.
4.2.3 Inadequacy of covered storage capacity with SGAs in Punjab and Haryana regions

51
(i) In Punjab region, FCI and five SGAs procured about 67.80 LMT to 107.35 LMT of wheat
during 2006-07 to 2010-11. Punjab State Civil Supply Corporation (PUNSUP) procured 22-
23 percent of the total procurement (15.21 LMT to 23.17 LMT).
PUNSUP Sangrur/Barnala stored wheat between 1.20 LMT to 2.46 LMT (81 percent to 92
percent of stocks available at the end of the procurement season) in open/CAP while
vacant covered spaces still available with the agency was 0.05 LMT to 0.38 LMT. PUNSUP
Ferozepur stored 0.43 LMT to 2.42 LMT of wheat (91 percent to 99 percent of wheat stock
available at the end of the procurement season) in open/CAP.
PUNSUP Ludhiana stored 0.50 LMT to 1.42 LMT of wheat (61 percent to 89 percent of
wheat stock available at the end of the procurement season) in open/CAP and vacant
covered space available was 0.04 LMT to 0.44 LMT. In PUNSUP Amritsar/TarnTaran, wheat
of 1.10 LMT to 2.32 LMT (82 percent to 95 percent of wheat stock available at the end of
the procurement season) was stored in open/CAP. Hence, substantial foodgrains were
stored in the CAP due to insufficient covered storage in the districts selected.
(ii) In Haryana region, all 5 SGAs and FCI procured wheat ranging between 22.30 LMT and
63.47 LMT during the last five years. The total storage capacity (after hiring out to FCI for
foodgrains) in respect of 5 SGAs was 68.64 LMT (covered 23.56 lakh MT and CAP 45.08
lakh MT) as on 31 March 2011. The total wheat stock with SGAs was 26.01 LMT (covered
7.50 LMT and CAP 18.51 LMT) as on 31 March 2011. Hence, most of wheat stock was held
in CAP godowns.
4.2.4 Insufficient covered storage space with FCI and its adverse impact
FCI’s own covered storage capacity remained constant throughout 2006-07 to 2010-11. FCI’s
own covered capacity to total covered capacity in fact decreased from 58.07 percent to 45.66
percent whereas hired covered capacity to total covered capacity increased from 41.93 percent
in 2006-07 to 54.34 percent in 2010-11. Due to insufficiency of covered space for storage of
foodgrains and due to progressive increase of foodgrain stocks, considerable amount of
foodgrains had to be stored under CAP (66.43 LMT and 50.87 LMT as on 31 March 2010 and
2011 respectively) and exposing them to fast deterioration of its quality.
4.2.4.1 In Haryana region, due to insufficiency of covered space, 0.34 LMT to 25.85 LMT of
wheat had to be stored under CAP during 2006-2011. In Karnal District office, 9997 MT of
wheat stock was placed in open at Nariangarh while FCI had storage space of 2162 MT in
covered godown at Nariaingarh during April 2010 (hired from CWC on 7 year guarantee
scheme). Similarly, during April 2010, 900 MT of wheat stock was placed in open at Manakpur

52
whereas FCI had storage space of 5551 MT in covered godown (hired from CWC on 7 year
guarantee scheme) at the same place. As stock kept in open was prone to damage, pilferage,
etc., storing wheat stock of 3062 MT (2162 MT plus 900 MT) in open areas when covered space
was available was not prudent.
In reply, RO Haryana stated (December 2011) that the coverd space of 2162 MT at Naraingarh
and 5551 MT at Manakpur was kept reserved for CMR due to be received during April 2010.
The reply is not convincing as the CMR was actually not received in April 2010 and the vacant
covered space could have been utilised.
4.2.5 Poor condition of storage facilities with SGAs and its adverse impact
(i) Audit observed that in Punjab, PSWC failed to take remedial measures to maintain the
stock in proper health which resulted in wheat of 709.63 MT pertaining to crop years
2008-09 to 2010-11 being declared as damaged stock. Out the above stock, wheat of 44.4
MT at Mukerian and 138.53 MT at Moonak was damaged due to fire and flood
respectively. The failure of PSWC to take up the matter with FCI for early disposal of
above said wheat stock led to loss due to blockade of storage space besides loss of
interest on possible sale proceeds. The damaged stocks worth ` 0.84 crore have not been
disposed off till date (March 2011).
(ii) Similarly, in PUNSUP, due to failure to maintain the stock in proper health, wheat stock of
8930 MT relating to the years of 2008-09 to 2010-11 was damaged. The damaged food
stocks worth Rs. 8.95 crore were not disposed of till date. The Company got approval from
FCI for its disposal only in October 2011. Failure of the Company to take up the matter
with FCI for early disposal of wheat stock led to loss due to blockage of storage space
besides loss of interest on the possible sale proceeds and storage charges.
(iii) In Haryana region, wheat procured by HWC for Central Pool, valuing ` 9.01 crore, was
damaged and subsequently disposed of by way of public auction/inviting tenders. The
disposal of damaged wheat resulted in loss of ` 6.65 crore to HWC as given below:
Table 15: Details of wheat damaged and consequent loss
Name of Centre
Crop year
Quantity damaged (in MT)
Value (` in
lakh)
Amount fetched through auction/ tender
Loss suffered by
the Corp. (`
in lakh)
Reasons for damage
Tauru 2008-09 289.358 37.34 27.86 9.97 Unseasonal and continuous rains at the time of procurement in mandi and receipt of stocks at storage

53
point from 19.5.2008 to 26.5.08
Palwal Unit-II
2008-09 1260.000 173.47 143.09 30.38 -do-
Bani 2008-09 71.600 10.83 1.02 9.81 Occurrence of sudden and unprecedented flood due to several major breaches in Ghagger River
2009-10 2023.700 293.57 23.23 270.34
2010-11 3033.146 386.08 41.64 344.44
Total 6677.804 901.29 236.84 664.94 ------------
(iv) In F&SD Haryana, wheat stock worth ` 11.38 crore was damaged. The damage of wheat
occurred mainly due to storage of wheat on open plinths. After disposal of the damaged
stock the loss was ` 6.44 crore as given under:
Table 16: Details of wheat damaged and consequent loss
Distt. Total Quantity (in MT) /Crop year
Value
(` in Lakh)
Amount received through tender
Loss
(` in
lakh)
Reasons for damage
Kurukshetra (Ismailabad Centre)
1547.35/2010-11
223.39 37.85 185.54 Flood in July 2010
Sonipat 1467.00/2009-10
190.51 103.80 86.71 Heavy rain in Sept.2009
Palwal (Bhagola Centre)
4582.65/2008-09
724.27 352.15 372.12 Unprecedented rain in May 2008
Total 7597.0 1138.17 493.8 644.37 -----------------------------
(v) F&SD Haryana procured 12529 MT quantity of wheat at Babain centre (Kurukshetra
District) during RMS 2009. Out of which, 7845 MT was stored in open plinth of Shahbad
sugar mill and 4684 MT on open plinth of Om Rice Mill Babain. Wheat of 248.95 MT
(202.43 MT at Shahbad sugar mill and 46.52 MT at Om rice mill) wheat was damaged
(September 2009) due to stocking of the foodgrains at low lying area without drainage
system and delay in segregation of stock. The stock was declared damaged by Joint
Inspect Team of FCI and F&SD in May 2010 which reported that the open plinth was not
storage worthy. The F&SD Haryana suffered a loss of ` 0.38 crore due to damage of 249
MT wheat and the same was yet to be disposed of.
4.2.6 Storage of foodgrains in open space and non-utilization of covered storage by SGAs in
Punjab region
(i) PSWC has an average storage capacity of 53.02 LMT during 2006-11, of which 30.54 LMT
was hired by FCI. While covered capacity of 6.30 LMT was lying vacant during the period,
an average of 1.36 LMT of stock was kept in CAP. In June each year, wheat stock ranging
from 0.50 LMT to 3.49 LMT was stored in CAP when covered space ranging from 1.18 LMT

54
to 8.19 LMT was available. Audit observed that all the foodgrains stock during 2006-07 to
2008-09 could have been kept in covered godowns. Foodgrains stock upto 40 percent in
respect of 2009-10 & 2010-11 could have been stored in covered space.
(ii) PSWC, Sangrur/ Barnala had an average vacant covered capacity of 1.93 LMT during the
last five years. However, on an average, 6474 MT of foodgrain stock was kept in open
subjecting to damage. The same trend continued during each RMS from 2008 to 2011. As
a result, 164 MT of wheat crop was damaged in 2009-10 and 2010-11 causing a loss of `
0.25 crore.
(iii) In PSWC Amritsar, though an average vacant covered storage capacity of 31360 MT was
available, but an average of 23798 MT stock was kept in open during the period under
report. Except in 2008, there was consistent underutilization of covered capacity each
year. The Agency suffered a loss of ` 0.07 crore due to the damage of 49.2 MT stock in
July, 2009 and unscientific storage and non utilization of 51405 MT covered storage
capacity available.
(iv) In PUNSUP, average total storage capacity of the ranged from 19.55 LMT to 35.57 LMT
and average stock held was 6.86 LMT to 25.42 LMT. Most of these plinths were hired from
private parties. However, foodgrains stock was kept in open while covered capacity was
kept vacant. Audit observed that out of 14.48 LMT average stock stored in the open, 1.12
LMT of foodgrains could have been stored in covered godowns during the last five years.
(v) In PUNSUP Sangrur, out of 1.67 LMT average stock stored in the open, 0.25 LMT could
have been stored in covered godowns during 2006-11. 175 MT wheat of crop year 2009-
10 was damaged in district Sangrur due to unscientific storage.
(vi) At Barnala, PUNSUP owned CAP capacity of 19000 MT was kept vacant but more private
godowns were hired. This has resulted in a loss of ` 0.29 crore (at the average rate of `
0.25 per quintal per month paid to private parties) during 2006-07 to 2010-11.
(vii) PUNSUP Ferozepur stored 2.13 LMT average stock in CAP. 7708 MT wheat of crop year
2008-09 and 2440 MT of crop year 2009-10 was damaged due to unscientific storage and
non-availability of covered space.
(viii) In PUNSUP Ludhiana, out of the 0.56 LMT average stock stored in the open, 0.27 LMT
could have been stored in covered godowns. In PUNSUP Amritsar, out of the average

55
stock of 1.55 LMT stored in the open, 9911 MT could have been stored in covered
godowns.
4.2.7 Storage of foodgrains in open space and non-utilization of covered storage by SGAs in
Haryana region
Foodgrains stock was stored in open while vacant storage capacity in covered godowns was
available with Department of Food and Civil Supply (DSFSC). Audit was carried in DSFC
Kurukshetra, Kaithal and Karnal and audit observations are as given below:
(i) In DFSC Kurukshetra, stock of foodgrains ranging between 249 MT and 1368 MT was
stored in CAP though covered space ranging between 2359 MT and 18000 MT was
available in Kurukshetra during 30 June of each year from 2008-2011.
(ii) DFSC, Kaithal stored foodgrains stock ranging between 19981 MT and 32302 MT in CAP
though covered space ranging between 925 MT and 2208 MT was available in Kaithal
during June 30 of 2009-2011.
(iii) DFSC, Karnal also the stored stock ranging between 1220 MT and 1552 MT in CAP though
covered space ranging between 3 MT and 1882 MT was available in Karnal during June 30
of year 2009-2011.
(iv) Though sufficient covered space was available with HWC during 2008-10, 28714 MT stock
of foodgrains was kept in CA in Panipat and Karnal Districts.
4.2.8 De-hiring despite paucity of storage
During 2008-09, FCI de-hired 6.40 LMT storage capacity while there was an increasing trend of
foodgrains stock in Central Pool and when shortage of storage capacity to the extent of 95.79
LMT was there compared with the Central Pool stock of foodgrains as on June 1, 2008.
4.2.9 Short hiring of godowns from CWC
Audit observed that though CWC offered storage space for hiring in the range of 2.75 LMT to
11.36 LMT during May 2009 to February 2011 in various regions, but FCI hired storage space
only in the range of 0.10 LMT to 3.16 LMT. As such, FCI did not avail the opportunity to hire
substantial amount of space offered by CWC (including the regions where storage space paucity
was identified under the PEG Scheme – 2008) while at the same time, FCI hired storage capacity
from private parities.
In reply, management stated that the decision to hire the space is essentially taken in a
decentralised manner based on evaluation of felt need for storage in the field. In the present

56
context, the space shown for hiring by CWC was sometimes actually not found vacant when our
GM (Region) approached them for hiring. Detailed information has been called for from the
regions.
The fact remains with the increasing shortage of space during 2008-09 to 2010-11, substantial
capacity offered by CWC was not availed of by FCI in different regions. The management needs
to review the procedure of hiring storage space being followed in the regions.
4.2.9.1 Further scrutiny of records of CWC in Regional Offices revealed the following:
(i) In Punjab region, substantial portion of storage capacity of CWC was hired out to FCI on
guarantee basis. Year-wise range of vacant covered capacity of CWC (after hiring out to
FCI) during 2006-07 to 2010-11 ranged from 9 percent to 88 percent. As on March 31,
2011, out of a total of 7.03 LMT capacity of CWC, the balance available capacity of CWC
was 1.08 LMT of which vacant capacity was 0.38 LMT. All the capacity offered by CWC was
hired by FCI except in 2007-08 and 2008-09 (1.63 LMT hired from 3.17 LMT) and 2008-09
(1.95 LMT hired from 4.39 LMT).
(ii) In CWC selected warehouses, namely, Chandigarh, Abohar I, Abohar II, Fazilka, Amritsar
BD and Amritsar-I, the maximum storage capacity utilization was less than 75 percent
during 2006-11. During 2008-09 to 2010-11, utilization of storage capacity in CWC
warehouses in Abohar I, Abohar II and Fazilka (under DO Ferozpur) was only between 2
percent to 81 percent. This indicates that substantial vacant capacity was available in DO,
Ferozepur. The condition of selected godowns was found to be storage worthy.
(iii) In Haryana Region, CWC offered 1.44 LMT space to FCI of which 1.28 LMT was accepted
by FCI during 2006-11.
4.2.10 Idle capacity of owned Silos
A scrutiny of records revealed that FCI had constructed 4.62 LMT Silos storage capacity in
between 1960 and 1980. However, 3.52 LMT silos storage capacity was lying unused since 1982
to 2004 as detailed below: Table 17: Details of unused silos
Sl. No. Name of State/Centre Year of construction
Storage Capacity (MT)
Year since not in use
1 Delhi/Mayapuri 1970-71 21000 2003
2 UP/Khurja 1980 20000 2004
3 UP/Chandari (Kanpur) 1967 72000 1982
4 Maharashtra/Borivili 1960-64 104000 2004
5 Maharashtra/Manmad 1960-64 84000 2000
6 Bihar/Gaya 1976 32000 1987

57
7 West Bengal/Kolkata Port 1968 19000 1995
Total 352000 -----
An analysis of the above details revealed the following:
(i) The balance capacity of 1.10 LMT silos capacity were no longer utilised after 2004 due to
unavailability of staff retirements. However, FCI has neither assessed the staff
requirement nor taken adequate action to recruit manpower to operationalise the silos.
(ii) Out of 3.52 LMT, 3.12 LMT storage capacity of silos was stated to be unusable and beyond
economical repairs. However, no cost-benefit analysis has been conducted to assess the
actual conditions so as to put the silos to economic use.
(iii) Silo at Mayapuri, Delhi of 21000 MT capacity was lying unutilized due to non installation
of thermocouple and hygrometer since 2003.
(iv) In case of Silo of 19000 MT capacity at Kolkata Port, FCI had decided for dismantling and
handing over the silo land to the Kolkata Port Authority which is also yet to be completed.
Due to delay in dismantling and disposal, the Corporation incurred avoidable expenditure
of ` 4.23 crore by way of idle wages to labour (` 2.54 crore) and lease rent (` 1.65 crore)
and rent of office building (` 0.04 crore).
In response, management stated that the matter is under review and a final decision to make
use/revive old silos or to dispose of would be taken soon.
4.2.11 Imbalance and shortfall in storage capacity
4.2.11.1 As per storage policy of GOI, the available storage capacity should meet the storage
requirements for holding operational and buffer stock. However, a scrutiny of records revealed
that concentration of storage capacity always remained more in procurement oriented States
such as Punjab, Haryana, Andhra Pradesh, Uttar Pradesh and Chhattisgarh (171.26 LMT out of
total 316.10 LMT by end of 31st March 2011) viz., 54 percent of the total storage space available
with FCI. Consuming States such as Rajasthan and Maharashtra together have storage capacity
for 36.06 LMT (11 percent of the total capacity). The balance capacity (35 percent was being
shared by other remaining States.
4.2.11.2 Further analysis of the region wise operational stock requirement of foodgrains (4
month) and capacity available with FCI (Annexure-VII) revealed the following:
58
(i) Out of 31, only 12 States/UTs9 were having storage capacity to hold the required stock of
foodgrains for 120 days.
(ii) In the remaining 19 States/UTs, 4 States10 can hold stocks in the range of 51 to 112 days
only. 11 States11 can hold the stock in the range of 12 to 74 days and the rest 4 States12
could hold the stock at the required level at periodical intervals.
In response, management accepted the audit observations and stated that GOI has introduced
PEG – 2008 scheme for construction of godowns in procuring and consuming States to meet the
storage capacity gaps of 4 months requirement of foodgrains under TPDS/OWS in consuming
States.
4.2.12 Payment of huge carry over charges to SGAs
4.2.12.1 SGAs procure wheat for Central Pool which they have to deliver to FCI
immediately after procurement. FCI has to pay carry over charges in the shape of storage and
interest to SGSs on the quantity of wheat taken over after June 30 each year. Due to
shortage/non identification of vacant storage space, FCI paid State Governments and agencies
as much as ` 5,025 crore during the last five years. The above carry over charges paid to State
Government and agencies could have been minimized by optimal utilization of existing storage
space in wheat procuring and consuming States by taking over of wheat during wheat
procurement season within prescribed time frame.
4.2.12.1.1 In Punjab region, carry over charges paid went up from ` 131.82 crore in 2006-07 to `
1,263.37 crore in 2010-11. A total of ` 3,239.63 crore was paid during the last five years. In case
of Haryana region, the charges paid to SGAs went up from ` 32.20 crore in 2006-07 to ` 438.03
crore in 2009-10 with a total payment of ` 617.22 crore during four years. However, FCI had not
planned any construction of own storage godowns in Punjab and Haryana during the same
period.
4.2.13 Deficient planning in evacuation of surplus stock of wheat
4.2.13.1 A scrutiny of records revealed that SGAs of Punjab and Haryana had procured
wheat from 78.47 LMT to 150 LMT. Out of which, 12.08 LMT to 31.18 LMT was taken over
9 Delhi, Haryana, Punjab, Chandigarh, Rajasthan, Uttar Pradesh, Uttaranchal, Andhra Pradesh, Pondicherry, Gujarat,
Maharashtra and Chhattisgarh
10 Orissa, West Bengal, Sikkim, Tamil Nadu.
11 Bihar, Jharkhand, Assam, Arunachal Pradesh, Meghalaya, Mizoram, Tripura, Manipur, Nagaland, Himachal Pradesh,
Jammu and Kashmir can hold stock only for 12 to 60 days whereas Himachal Pradesh.
12 Kerala, Karnataka, Goa and Madhya Pradesh.

59
during procurement season 2006-07 to 2010-11, leaving a balance of 47.29 LMT to 135.98 LMT
with SGAs.
4.2.13.2 Audit further observed that no specific planning to utilize storage capacity
available with wheat consuming States for evacuation of old stocks (old crops and 2007-08 to
2010-11) was carried out by FCI. During April 2006 to July 2006, as much as 49.83 LMT to 90.72
LMT vacant storage capacity was available in Delhi, Maharashtra, Gujarat, UP, MP, Rajasthan
and Bihar. These vacant capacities could have been utilized to store 47.29 LMT wheat lying with
SGAs of Punjab and Haryana at the end of procurement season 2006-07 and reduced the carry
over charges paid during 2006-07. The effective utilisation of available storage capacity in
wheat consuming States was only between 19.17 percent to 50.05 percent during the same
period.
4.2.13.3 Thus, timely and systematic evacuation planning could minimise payment of
carry over charges to SGAs. Hiring and payment of carry over charges should be done only in
exceptional circumstances rather than a regular practice. Payment of carryover charges to SGAs
had increased substantially from a mere ` 175 crore in 2006-07 to ` 527 crore in 2008-09, ` 1,666
crore in 2009-10 and ` 2,414 crore in 2010-11 which is about 13 times over the last five years.
4.2.14 Short planning of direct delivery of wheat in procuring States
A scrutiny of the storage capacity utilization revealed that in wheat procuring States, namely,
Punjab and Haryana, there was vacant storage space to the extent of 6.07 LMT to 29.98 LMT at
the end of wheat procurement season 2006-07 to 2010-11. This storage capacity was available
with the regional offices after taking over 12.08 LMT to 31.17 LMT wheat during procurement
season i.e. till June 30 of each year. Due to short planning of direct delivery of wheat as against
the vacant storage space in the region, FCI incurred avoidable expenditure of carry over charges
reimbursed to SGAs to the tune of ` 354.37 crore.
Management accepted the facts and stated that there has not been a major increase in storage
capacity proportionate to procurement level. FCI could not take over entire stock procured by
the SGAs and had to incur carry over charges for much longer period. Further, the stocks
procured and stored in the States/agencies godowns is normally not taken over in FCI’s own
godowns of Punjab and Haryana due to infrastructural constraints and the fact that this will
cause double handling and additional transportation charges which may exceed the carry over
charges being paid to the agencies. Movement of foodgrains from surplus to deficit centre is
planned on the basis of offerings/demands given by the dispatching/recipient regions. It is not
possible to move any quantity of the foodgrains from just for the sake of movement.

60
Audit observed that while increasing carry over charges were incurred due to not taking over of
foodgrains from the SGAs and at the same time FCI incurred avoidable expenditure due to short
planning of direct delivery in procuring States. There was no concrete movement plan for
evacuation of the surplus stocks to the consuming States where vacant storage capacity was
available.
This indicates that systematic and timely evacuation plan were not carried out by FCI. The
contention of FCI that handling charges in movement of stock would cause double handling and
transportation charges consequently which may exceed carry over charges being paid to SGAs is
not tenable in the absence of any formal comparative analysis being carried out. It is pertinent
to mention that the carry over charges incurred by FCI during the last three years alone was `
4607 crore.
4.2.14.1 Short planning of direct delivery of wheat in selected regions/ districts and its
impact on payment of carry over charges to SGAs.
(i) In FCI regional office Punjab, there was vacant storage space to the extent of 4.97 LMT to
26.67 LMT at the end of wheat procurement season 2006-07 to 2010-11 after taking over
of 5.38 LMT to 14.17 LMT in April to June each year. The available storage capacity could
have been used by taking over more wheat from State Government Agencies. This
resulted into avoidable expenditure on carry over charges reimbursed to SGAs to the tune
of ` 285.78 crore.
(ii) DO Sangrur had vacant storage space to the extent of 0.17 LMT to 5.65 LMT at the end of
wheat procurement season 2006-07 to 2010-11. But wheat to the extent of only 0.13
LMT to 1.72 LMT was taken over. This resulted into avoidable expenditure on carry over
charges reimbursed to SGAs to the tune of ` 50.30 crore.
(iii) In DO Ferozepur, vacant storage space to the extent of 0.13 LMT to 1.77 LMT was
available after wheat of 0.28 LMT to 2.71 LMT was taken over. This resulted into
avoidable expenditure on carry over charges reimbursed to SGAs to the tune of ` 17.54
crore.
(iv) Under DO Ludhiana, after taking over of wheat 0.49 LMT to 1.80 LMT during procurement
season, vacant storage space to the extent of 0.03 LMT to 4.87 LMT was available during

61
2006-07 to 2010-11. Thus, avoidable expenditure of ` 41.07 crore was reimbursed to
SGAs as carry over charges.
(v) In DO Amritsar, as against vacant storage space available to the extent of 4.97 LMT to
26.67 LMT at the end of wheat procurement season 2006-07 to 2010-11, only upto 1.10
LMT wheat was taken over. The avoidable expenditure ` 1.88 crore was paid as carry over
charges.
(vi) In Haryana region, ` 617.22 crore was paid as carry over charges during 2006-07 to 2009-
10. Though there was 0.24 LMT to 7.28 LMT vacant space available with RO Haryana at
the end of procurement season during 2006-11, but due to short planning of direct
delivery of wheat, avoidable expenditure of ` 55.15 crore was paid as carry over charges.
(vii) In DO Kurukshetra, though vacant storage space available was 0.02 to 1.19 LMT at the end
of wheat procurement period i.e. June 30, but the quantity of wheat to the extent of 0.49
LMT to 7.90 LMT was left with SGAs. This resulted in avoidable expenditure of ` 5.50 crore
as carryover charges.
(viii) In DO Karnal, despite availability of vacant storage space available upto 2.97 LMT at the
end of wheat procurement period, avoidable expenditure of ` 3.70 crore was incurred as
carryover charges for wheat not taken over (0.09 LMT to 10.12 LMT) within the prescribed
date.
4.2.15 Storage of old crops leading to damage of foodgrains
4.2.15.1 Age wise analysis revealed that foodgrains upto crop year 2009-10 to the extent
of 106.21 LMT were lying in the custody of FCI and SGAs as on March 31, 2011. While a total of
325.88 LMT for the crop year 2010-11 was lying with FCI (150.86 LMT) and SGAs (175.02 LMT),
only 3.68 LMT wheat of crop year 2011-12 was lying with SGAs.
Further, during 2010-11, FCI and SGAs procured 225.13 LMT (FCI 34.19 LMT and SGAs 190.34
LMT). Out of which, 115.52 LMT wheat was issued at the end of 2010-11. Reasons for non–
issuing 106.21 LMT wheat up to crop year 2009-10, prior to crop year 2010-11 was not on
record. This is indicative of non adherence to FIFO principle by FCI.
Due to non adherence to FIFO method for issuance of foodgrains, 0.82 LMT out of 87.44 LMT of
wheat amounting to ` 82.51 crore lying in the custody of SGAs was declared non-

62
issuable/damage as on March 31, 2011. Non-issuable wheat in the custody of FCI was negligible
during 2006-07 to 2010-11.
Management accepted audit observations and stated that the main reason behind FIFO
violation was that stocks remained infested, pocket damaged, atta formed and upgradable
condition due to poor preservation of stocks by the agency and their failure to render the stock
despatch worthy.
4.2.15.3 Damage of old crop foodgrains in selected regions and its disposal
(i) Audit observed that in RO Punjab, foodgrains to the extent of 38.63 LMT upto crop year
2009-10 were lying in the custody of FCI and SGAs. A total of 149.40 LMT for crop year
2010-11 was also lying with FCI and SGAs out of total procurement of 175.61 LMT.
Consequently, wheat stock of 0.67 LMT was declared non-issuable as on March 31, 2011
involving ` 73.52 crore at acquisition cost.
(ii) Under RO Punjab, in selected districts namely, Ferozepur, Sangrur, Ludhiana and Amritsar,
0.21 LMT13 wheat was declared non-issuable. RO Punjab, in its reply has stated that SGAs
wheat could not be moved because it was not despatch-worthy and new crops had to be
moved because it was stored in un-storage worthy places and also to avoid glut in the
mandis. The reply is not relevant as FCI has not reported cases of stocks not dispatch-
worthy from Central Pool and no justification for deferment on movement of old rice was
on record.
(iii) In Punjab region, sub-standard rice consignment was accepted during KMS 2004-05. For
disposal, the categorization of the stock was to be done within 45 days, but the same was
completed after 4 years (December 2010). The space could have been used from April
2007 onwards. The avoidable expenditure on storage charges paid to SGAs for the space
occupied by the damaged stock of rice was ` 7.05 crore.
(iv) In Haryana region, non-issuing of wheat stock of earlier crops, especially when these were
stored in CAP resulted in down gradation of 0.15 LMT wheat involving ` 23.48 crore at the
acquisition cost. Wheat of 1742 MT valuing ` 2.79 crore lying with SGAs in DO Kurukshetra
was damaged. Further, 3495 MT (` 5.31 crore) and 74.50 MT (` 0.12 crore) of wheat
13 Ferozepur-10128 MT, Sangrur-753 MT, Ludhiana-2287 MT and Amritsar-7955 MT

63
quantities were downgraded by SGAs in DO Kurushetra and DO Karnal respectively
(March 2011).
4.2.16 Storage capacity utilization by FCI
4.2.16.1 Non fixation of standard norms for optimal capacity utilisation
Efficient storage management involves ensuring optimal level capacity utilisation of the
available capacity. Norms for optimal utilisation of storage capacity is essential for assessing the
level of utilisation in different depots and for providing inputs for performance evaluation.
However, FCI has not fixed norms for optimum capacity utilization. Instead, a number of
suggestive norms14 have been given by various agencies.
4.2.16.2 Position of overall storage capacity utilisation
Audit observed that storage capacity utilization ranged from 33 percent to 57 percent during
2006-07, 30 percent to 60 percent during 2007-08. But during 2008-09 to 2010-11 the
utilisation increased from 57 percent to 91 percent as can be seen in table given under: Table 18: Storage capacity utilization (monthly basis) by FCI during last five years
Year Storage capacity ranged (LMT)
Stock ranged (LMT)
Utilization in percentage
From To From To From To
2006-07 241.83 255.80 80.97 144.69 33 57
2007-08 238.69 247.54 72.90 163.06 30 66
2008-09 243.08 253.05 140.64 192.58 57 76
2009-10 265.33 288.36 204.13 242.66 73 88
2010-11 298.04 316.10 213.38 278.01 70 91
Source: Capacity Utilization statement of FCI
4.2.16.3 Low capacity utilisation
4.2.16.3.1 Audit has selected a sample of 12 out of 23 regional offices for detailed month
wise analysis to examine the storage capacity utilisation on the basis of monthly stock level
during 2006-07 to 2010-11. The analysis revealed the following position (Annexure-VIII).
(i) In Assam, Arunachal Pradesh, Meghalaya, Mizoram, Tripura Manipur, Nagaland, Punjab,
Rajasthan and Maharashtra, the storage capacity utilization was less than 50 percent in
15 to 40 months out of 60 months during last five years.
(ii) In eleven States, namely, Assam, Arunachal Pradesh, Meghalaya, Mizoram, Tripura,
Manipur, Nagaland, J & K, Punjab, Haryana and Maharashtra, utilisation was within 50
percent to 75 percent between 14 to 42 months out of 60 months.
14 The Buffer Stock Committee (85 percent); Bureau of Industrial Costs and Prices (75 percent) PEG - 2008 (80 percent)

64
(iii) In 8 States, namely, Assam, Meghalaya, Mizoram, Manipur, Nagaland, Jammu &
Kashmir, Punjab and Haryana, storage capacity utilisation was upto 80 percent to 85
percent for 1 to 7 months out of 60 months.
Thus, it is evident that in 12 states, the storage capacity utilization was less than 50 percent for
a maximum number of months out of 60 months taken for analysis.
4.2.16.3.2 To further analyse the position of storage capacity utilisation in the consuming
States, audit has selected a sample of 13 out of 23 regional offices and were examined on the
basis of annual off take of foodgrains during 2006-07 to 2010-11. The analysis revealed the
following position (Annexure-IX).
(i) In Pondicherry, the storage capacity utilization was less than 10 percent (3.53 percent to
7.68 percent) during 2006-07 to 2010-11.
(ii) Storage capacity utilization in Jharkhand was above 50 percent (58.40 percent to 74.25
percent) during 2006-07 to 2010-11.
(iii) In Manipur, the storage capacity utilisation was between 36.74 percent and 46.67 percent
in 2006-08 and between 60 percent and 34.92 percent in 2009-11.
(iv) In remaining 10 States, namely, Bihar, Gujarat, Goa, Arunachal Pradesh, Maharashtra,
West Bengal, Uttaranchal, Uttar Pradesh, Karnataka and Delhi the utilisation was between
13.68 percent to 40.23 percent of the capacity.
Thus, in 11 states, the utilization of annual storage capacity as compared with annual off take
was only 3.53 percent to 40.23 percent. In Jharkhand and Manipur it was between 58.40
percent to 74.25 percent and 34.92 percent to 118.33 percent respectively.
Management accepted the facts and explained that the capacity utilisation may go down due
to sudden unanticipated increase in offtake for a particular region. Similarly, the capacity
utilisation may also go down due to unanticipated decrease in procurement for a particular
region in a particular year. However, for the years 2008-09 to 2010-11, all the non NE States
with the exception of Maharashtra during the year 2008-09 have been able to achieve a
maximum capacity utilisation level which is more than BICP norm of 75 percent.
However, the facts remain that no standard norms for optimal capacity utilisation have been
fixed so far. Further, storage capacity utilisation upto 75 percent was not sustained during the

65
major period of the last five years and the utilisation based on turnover was 3.53 percent to
40.23 percent in 11 States out of 12 States analysed.
4.2.16.4 Capacity utilization in the selected regional/districs offices
(i) In Punjab region, in spite of shortage of storage capacity, the utilisation of storage spaces
ranged between 27 percent to 97 percent during 2006-07 to 2010-11. The status in
selected districts during the last five years was as under:
In FCI DO Sangrur, capacity utilisation was 22 percent to 103 percent. Utilization of
storage capacity was less than 50 percent in 14 months out of 60 months. In FCI DO
Ferozepur it was 34 percent to 102 percent. Out of 60 months, in 6 months, utilization of
storage capacity was less than 50 percent. In FCI DO Ludhiana, utilization was 11 percent
to 97 percent. In 19 months out of 60 months, utilization of storage capacity was less than
50 percent. The storage capacity utilization in FCI DO Amritsar was 41 percent to 103
percent. Out of 60 months, in 6 months utilization of storage capacity was less than 50
percent.
(ii) In Haryana region, despite shortage of space, the storage space was inefficiently used
during 2006-07 to 2010-11 as there was 0.24 LMT to 16.38 LMT vacant spaces available
with the FCI. In DO Kurukshetra, vacant storage capacity of 0.27 to 3.91 lakh MT was
available with the Corporation. In DO Karnal, inspite of shortage of space, vacant storage
space of 0.18 to 4.83 LMT was available with FCI.
(iii) In Assam region, capacity utilization of own godown was around 50 percent to 60 percent
on an average during all the years. Utilization in SWC godowns was generally around 100
percent. In DO Dibrugarh, the capacity utilization of own depot (Kharsang) was only
around 45 percent. While capacity utilization of hired godown at Laipuli was about 70
percent, but in other two hired godowns (Dikom & Gosala), it was around 50 percent only.
(iv) In West Bengal region, storage capacity utilization ranged 28 percent to 97 percent in FCI
own godowns during 2007-08 to 2010-11. In case of hired godowns, utilization was
between 23 percent to 100 percent in respect of CWC, 40 percent to 96 percent in case
godowns hired from private parties and 42 percent to 137 percent in State Government
godowns. In DO Bankura, despite space crunch (during 100 percent utilization) stock had
to be stored in alleyways and verandas resulting into violation of FIFO principle in issuing
of foodgrains. Under DO Midnapur, one Mini Shed (640 MT) was not utilised for storage of
foodgrains as it was filled with obsolete engineering materials.
In West Bengal region, a capacity of 51140 MT of CAP storage was created at a cost of `
2.25 crore during June to September 2009. Out of which, capacity of 15000 MT created in

66
FSD, Adra remained totally unutilized for security reason and capacity of 9100 MT created
under FSD, Midnapur was left abandoned and surrounded with wild vegetation.
(v) In Bihar region, average utilization of owned storage capacity ranged 44.30 percent to
75.63 percent during the last five years. The storage capacity was utilized less than 75
percent in 41 months out of 60 months during 2006-07 to 2010-11. FCI in Bihar region in
2009-11 constructed temporary plinth (CAP) of 59800 MT (57100+2700) storage capacity
at five own godowns15 at the cost of ` 3.28 crore. This was utilized upto 26.49 percent in
2009-10 and 9.16 percent in 2010-11. Thus, the construction of CAP for the sake of
creating new storage capacity at the cost of lacked justification. In DO Patna, average
utilization of owned storage capacity ranged 37.67 percent to 78.58 percent. Where as in
DO Muzaffarpur, average utilization of owned storage capacity ranged 46.02 percent to
86.87 percent.
(vi) In Chhattisgarh region, the storage capacity of 5.12 LMT available in all the 20 FCI’s own
godowns. During 2006-09, utilization of capacity was to the extent of 45 percent to 50
percent only. The position improved from 75 percent to 87 percent during 2009-11.
Despite the fact that its own godowns could not be used to the optimum level, the
Corporation incurred an expenditure of ` 24.43 crore on hiring of storage capacity. In DO
Raipur, capacity utilization of FCI’s own godowns was only 52.6 percent, 50.7 percent and
51.6 percent during the period from 2006-07 to 2008-09. The capacity utilization of one
SGA godown and one private godown was only 48.5 percent and 47.8 percent in 2006-07.
This was further increased to 63.5 percent to 94.3 percent in subsequent years.
(vii) In respect of Andhra Pradesh, the capacity space for 2006-07 and 2007-08 was below 75
percent of the capacity. However, with the increase in procurement levels during 2008-09
onwards upto 2010-11, the capacity utilization increased to 88 percent to 94 percent.
(viii) In Kerala region, utilization of storage capacity ranged between 30 percent and 84
percent. In selected two districts DO Kozhikode and DO Trivendram, it was very low upto
36 percent and 51 percent in 2006-07 and 2007-08 respectively. This was improved upto
90 percent and 91 percent in 2008-09 and 2009-10 respectively. In 2010-11, it remained
upto 85 percent.
4.2.17 Capacity utilization of selected SGAs in Punjab and Haryana region
15 Phulwarisharif, Dighaghat, Muzaffarpur, Buxar and Saharsa

67
(i) In Punjab, PSWC had average storage capacity of 53.02 LMT of which 30.54 LMT was hired
by FCI. The average utilisation of the balance capacity was 62 percent during 2006-11.
PUNSUP had an average total storage capacity of the ranging from 19.55 LMT to 35.57
LMT. The utilisation ranged between 32.79 percent to 77.99 percent during 2006-11.
(ii) In Haryana region, average yearly utilization by F&SD ranged between 14 percent and 86
percent and there was underutilization for three years from 2006-07. In HWC, utilization
of capacity ranged between 45 percent and 89 percent. The capacity was underutilized
during 2006-07 to 2008-09. Underutilization in peak season (June each year) was noticed
ranging between 16.20 percent and 47.74 percent during 2007-10 in Kurukshetra; 18.10
percent and 78.75 percent during 2006-11 in Kaithal; and 27.07 percent and 69.70 per
cent in Ambala (including Yamunanagar) during 2006-10.
(iii) In 16 selected warehouses of HWC, the average yearly capacity utilisation of warehouses
during 2006-11 was less than 25 percent in 7 cases, 25 percent to 50 percent in 16 cases,
50 percent to 75 percent in 24 cases, 75 percent to 90 percent in 21 cases and more than
90 percent in only 12 cases during last five years. During 2006-09, the capacity utilization
less than 50 percent in respect of Kurukshetra-I, Kurueshetra-II, Pehowa, Kaithal-I, Kaithal-
II, Siwan, Panipat-I & II, Saha, Yamunanagar and Radaur.
4.2.18 Thus, the total storage capacity of 472.98 LMT available presently in the country could
not accommodate the stock of foodgrains available in the entire Central Pool. The shortfall in
storage capacity was 182.97 LMT as against the stock of 655.95 LMT as on June 1, 2011. An
additional capacity of 247 LMT would be required to accommodate the likely increase in food
stock estimated under NFSB. The storage capacity available with FCI was between 252.07 LMT
to 316.10 LMT during 2006-07 to 2010-11 which was not adequate enough to accommodate
stock of 162 LMT to 319 LMT as prescribed in minimum buffer norms.
FCI has been resorting to hiring of godowns instead of constructing own godowns leading to
payment of huge hiring charges and did not plan the evacuation of stock to other States
effectively. While there was acute shortage of own storage capacity, 1.10 LMT silos storage
capacity could not be utilised after 2004 due to non-availability of staff. The storage capacity of
silos to the extent of 3.52 LMT has been unusable since 1982 to 2011.
The storage capacity are concentrated more in procurement oriented States. Consequently,
there are 19 States/UTs which can not even hold the required 4 months operational stock of
foodgrains. Shortage of storage space with FCI also resulted in payment of carry over charges of
` 5,025 crore to SGAs during the last five years. FCI incurred avoidable expenditure on carry

68
over charges to the tune of Rs. 354.37 crore during the wheat procument seasons of 2006-07 to
2010-11 due to short planning of direct delivery. Non adherence of FIFO method for issuance of
foodgrains resulted in down gradation of 0.82 LMT of wheat amounting to ` 82.51 crore lying in
the custody of SGAs.
FCI has not fixed norms for optimum capacity utilization. In the absence of which, performance
of storage capacity utilisation could not be suitably assessed. In 12 States, the storage capacity
utilization was less than 50% and reached upto 75% in a majority of months. In 11 States, the
utilization of annual storage capacity when compared to annual off take was only 3.53% to
40.23% during 2006-07 to 2010-11.
Recommendations:
(i) GOI/FCI should review its storage management and formulate plan for addition of own
storage capacity sufficient to accommodate foodgrains atleast up to the prescribed
minimum buffer stock level instead of heavily depending on outside agencies for such
requirements.
(ii) FCI should review and improve evacuation plan of foodgrains from procurement States
to deficient States to minimise the carry over charges payable to SGAs. FCI should
prescribe standard norms for evaluation of utilization of its storage capacity.
4.2.19 Augmentation of storage capacity
In order to augment the storage capacity, GOI of India formulated programmes/schemes from
time to time. Storage capacity envisaged and actually constructed since Ninth five year plan
(1997-2002) till March 2011 was as under:
Table 19: Details of schemes for augmenting storage capacity
(Figures in LMT)
Sl. No.
Name of the Scheme Storage capacity envisaged
Storage Capacity actually created upto 31.3.2011

69
1 Storage of own construction planned under Five year plans (i) Ninth five year plan (1997-2002) (ii) Tenth five year plan (2002-07) (iii) Eleventh five year plan (2007-12) (iv) Total storage space envisaged during 2006-07 to 2010-11 out of Tenth and Eleventh five year plans
Year Envisaged Actual
2006-07 0.21 0.20
2007-08 0.25 0.17
2008-09 0.33 0.03
2009-10 0.10 0.09
2010-11 0.08 0.05
Total 0.97 0.54
4.54 3.63 1.39
3.97 3.67 0.34
2 Total capacity envisaged under the five year plans 9.56 7.98
3 National Policy on Handling, Storage and Transportation of Foodgrains (June 2000) capacity was to created by June 2008
5.50 5.50
4 Scheme for construction of godowns through private entrepreneurs (PEG) dated 28th July, 2008
152.97 2
5 Augmentation of storage capacity in the North East [540280 MT - 72500 MT (capacity included in Eleventh Plan)]
4.68 0
Total storage capacity envisaged and achieved during last five years [Total of serial no. 3 to 5 with 1 (iv)]
164.12 8.04
Total (2 to 5) 172.71 15.48
4.2.19.1 Augmentation of storage capacity by way of construction
Audit observed that during the last fifteen years (1997-2012), only a total of 9.56 LMT was
envisaged under own construction programme and against which 7.98 LMT storage capacity
has been constructed till March 2011. Against the total requirement of storage capacity ranging
from 95.79 LMT to 182.97 LMT during last five years, FCI envisaged only upto 164.12 LMT for
capacity addition. Out of which only 8.04 LMT storage capacities under various programmes
was added upto March 2011.
Under the current Five year plan (Eleventh – 2007-12), a total of 1.39 LMT storage capacity was
envisaged, but only 0.34 LMT capacity was completed till March 2011 and the work for 0.50
LMT capacity was in progress. Out of the balance 0.55 LMT storage capacity, 0.15 LMT storage
capacity which was to be created in Jammu and Kashmir was included in PEG - 2008 scheme.
Work for capacity of 0.40 LMT in different regions16 could not be started due to non
identifying/acquiring of land (March 2011).
Management confirmed the above position.
16 Manipur, Sikkim, Bihar and Himachal Pradesh.

70
4.2.19.1.2 Status of storage capacity construction in regions
(i) In West Bengal and Sikkim under the Eleventh Plan Period (2007-12), 2 godowns were
sanctioned at Jalpaiguri (10000 MT) under DO Jalpaiguri and Jorethang (5000 MT) under
DO, Gangtak, Sikkim. The land in both cases could not be acquired so far (March 2011).
(ii) In Bihar region, storage capacity of 25000 MT was planned to be added under the Ninth
Five year plan (1997-2002). FCI incurred ` 54.61 lakh in purchasing and developing the
land. However, construction had not commenced (March 2011). Further, during Eleventh
Five year plan (2007-12) construction of own storage capacity for 0.25 LMT was planned.
Construction was yet to commence as the acquisition and survey of the land was in
progress.
4.2.19.1.3 Non construction of godowns on vacant land
FCI had vacant land which could accommodate to the extent of 7.11 LMT storage capacity in 14
States17. However, dates of acquisition of the above land and plan for construction were not
provided to audit. FCI could have saved godown rent to the extent of ` 158.80 crore18 by
constructing godowns on vacant land.
(i) DO Karnal have CAP plinths at Hemda (45000 MT), Taraori (30000 MT), Gharonda (40000
MT) and Panipat (6000/6440 MT) during 2006-11. Overall utilization of the owned CAP
capacity in these plinths ranged between 0.25 percent and 89.50 percent during 2006-11
indicating that the plinths were sparingly used by the FCI. But, no action was taken by the
FCI to convert the above plinths in covered storage.
RO Haryana stated (December 2011) that the lands at Hemda and Gharonda were
obtained on lease from Panchayat and FCI could not construct any structure on these
lands. However, the possibility of conversion of Taraori and Panipat plinths can be
explored and pursued, if feasible.
(ii) In RO Chhattisgarh, FCI acquired land of 101.03 acres from Ministry of Defence at a cost of
` 79.08 lakh in 1984 and 10.58 acres of land from Madhya Pradesh Government (which
was under lease by the Corporation from 1983 onwards) at a cost of ` 2.40 lakh in 1996 for
construction of food grains storage depot (FSD) at Raipur. But no concrete action for
construction of FSD was taken by FCI till date.
17 West Bengal, Bihar, Jharkhand, Andhra Pradesh, Gujarat, Jammu and Kashmir, Chhattisgarh, Karnataka, Madhya Pradesh,
Maharashtra, Tamil Nadu and Kerala.
18 (711100 x 35.80 x 12 x 4 plus 711100 x 42.90 x 12)
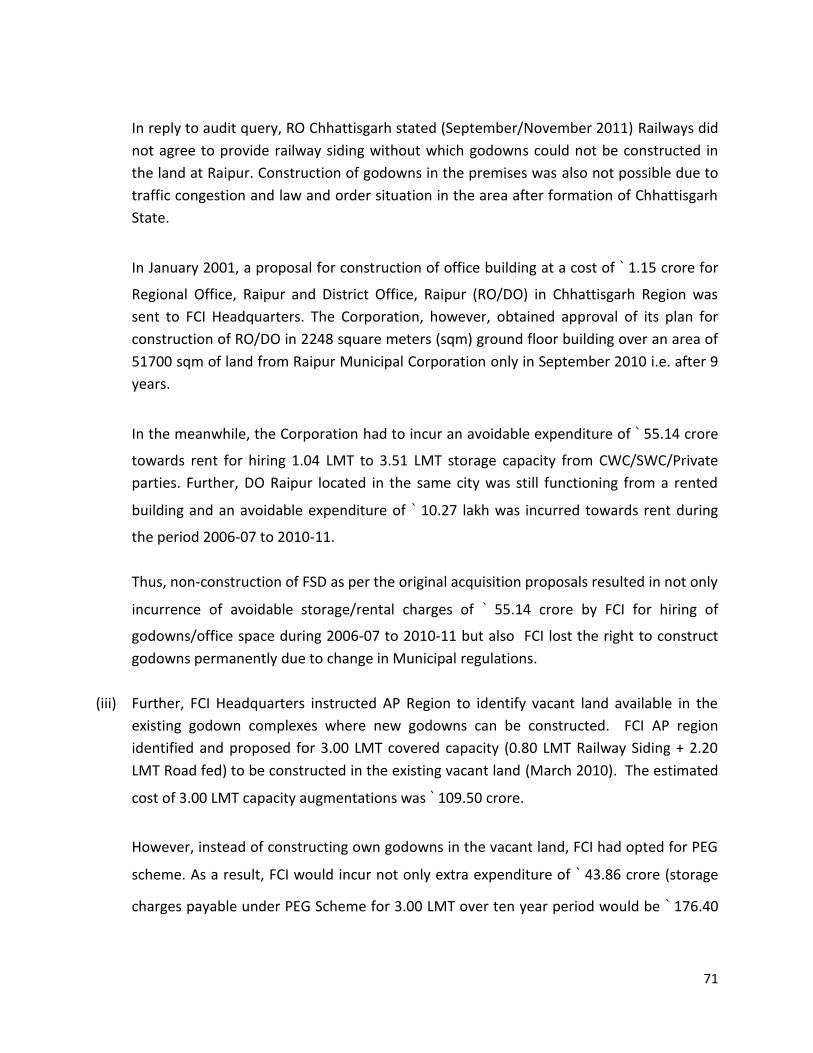
71
In reply to audit query, RO Chhattisgarh stated (September/November 2011) Railways did
not agree to provide railway siding without which godowns could not be constructed in
the land at Raipur. Construction of godowns in the premises was also not possible due to
traffic congestion and law and order situation in the area after formation of Chhattisgarh
State.
In January 2001, a proposal for construction of office building at a cost of ` 1.15 crore for
Regional Office, Raipur and District Office, Raipur (RO/DO) in Chhattisgarh Region was
sent to FCI Headquarters. The Corporation, however, obtained approval of its plan for
construction of RO/DO in 2248 square meters (sqm) ground floor building over an area of
51700 sqm of land from Raipur Municipal Corporation only in September 2010 i.e. after 9
years.
In the meanwhile, the Corporation had to incur an avoidable expenditure of ` 55.14 crore
towards rent for hiring 1.04 LMT to 3.51 LMT storage capacity from CWC/SWC/Private
parties. Further, DO Raipur located in the same city was still functioning from a rented
building and an avoidable expenditure of ` 10.27 lakh was incurred towards rent during
the period 2006-07 to 2010-11.
Thus, non-construction of FSD as per the original acquisition proposals resulted in not only
incurrence of avoidable storage/rental charges of ` 55.14 crore by FCI for hiring of
godowns/office space during 2006-07 to 2010-11 but also FCI lost the right to construct
godowns permanently due to change in Municipal regulations.
(iii) Further, FCI Headquarters instructed AP Region to identify vacant land available in the
existing godown complexes where new godowns can be constructed. FCI AP region
identified and proposed for 3.00 LMT covered capacity (0.80 LMT Railway Siding + 2.20
LMT Road fed) to be constructed in the existing vacant land (March 2010). The estimated
cost of 3.00 LMT capacity augmentations was ` 109.50 crore.
However, instead of constructing own godowns in the vacant land, FCI had opted for PEG
scheme. As a result, FCI would incur not only extra expenditure of ` 43.86 crore (storage
charges payable under PEG Scheme for 3.00 LMT over ten year period would be ` 176.40

72
crore minus capital cost of construction ` 109.50 crore) but deferred the opportunity of
having own capacity for long term basis.
4.2.19.2 National Policy on Handling, Storage and Transportation of Foodgrains
4.2.19.2.1 In 2000, GOI formulated National Policy on Handling, Storage and Transportation
of Foodgrains. Accordingly, a scheme for integrated bulk handling, storage and transportation
facilities for foodgrains especially wheat was finalised by FCI in June 2005 with M/s Adani Agri
Logistics Limited (the firm) on Build, Own, Operate basis which envisaged creation of storage
capacity of 5.5 LMT at the identified locations (Annexure-X).
Audit observed that construction of silos was completed as per schedule (June 2008) except in
one of the silos at Bangalore which was completed only in July 2010. Liquidated damages (LD)
on account of the delay to be recovered from the firm as per directions of Senior Level
Monitoring Committee (SLMC) was yet to be determined by FCI (March 2011).
As against the requirement of 400 wagons having capacity of 55 tonnes each as specified in the
service agreement, 260 wagons having capacity of 63 tonnes each were to be procured by the
firm. Out of which, 210 wagons have been supplied by the firm (February 2009) and remaining
50 wagons are yet to be procured by the firm (March 2011). Due to the above deviation in
number of wagons to be procured, an estimated capital cost savings of ` 25.85 crore accrued
was yet to be recovered by FCI from the firm (March 2011).
Management accepted the audit observations and stated that the matter is under consideration
for placing before SLMC for final decision.
4.2.19.2.3 Under utilization of 3 private Silos constructed under BOO arrangement
Under service agreement between FCI and M/s Adani Agri Logistics, Storage Cum Handling
Charges (SCHC) for Agreed Annual Guaranteed Tonnage of each depot was fixed at a rate of `
415 per MT on 66700 MT in respect of 3 field depots under Circuit I. The total turnover for
storage and handling was 200100 MT per year. However, the Company provided two rakes
consisting of 49 wagons which can carry 2995 MT each with a maximum of 155740 MT per year
resulting in shortfall against the envisaged volume of work. Further, FCI paid the company `
15.70 crore for the an agreed turnover of 421308 MT, but the actual receipt of stock was only
to the extent of 126396 MT during April 2009 to September 2009 in three centres Chennai,
Coimbatore and Bangalore. This resulted in infructuous expenditure to the extent of ` 11.43
crore as given below.

73
Table 20: Details of SCHC paid upto March 2011, their agreed turnover, actual utilisation and Infructious storage
charges incurred upto March 2011
Name of the depot
(a)
Commencement
(b)
Year
SCHC paid
(c)
AGT as per agreement
(d)
Actual receipt of in Depot
(e)
% of achievement
(f)
Infructious SCHC paid (g) = (100- Col f) x Col c
Chennai April 2009 2009-10 2,76,80,232 66,700 24,355 36% 1,77,15,348
2010-11 2,76,80,232 66,700 21,147 32% 1,89,05,598
Coimbatore Nov 2008 2008-09 1,09,18,314 48,900 24,334 49% 55,68,340
2009-10 2,76,80,232 66,700 0 0% 2,76,80,232
2010-11 2,76,80,232 66,700 11,339 17% 2,29,74,592
Bangalore Sept 2009 2009-10 87,01,321 38,908 24,012 62% 33,06,502
2010-11 2,67,07,901 66,700 21,209 32% 1,82,14,788
Total 15,70,48,464 11,43,65,400
73%
FCI ZO Chennai and RO Bangalore stated that the main contributing factor for the lower
turnover of the silos created was low offtake of wheat in southern states, resulting in under
utilisation of the silos which ranged between 0 percent to 62 percent during the period.
Moreover, silos are located in the extreme end of Tamil Nadu borders far from city limits and
State Government was reluctant to lift stocks. This also involved backward movement of stocks
at extra cost in case of secondary movement.
4.2.19.3 Private Entrepreneurs Guarantee scheme (PEG) - 2008 for construction of godowns
4.2.19.3.1 In order to create the storage capacity required for storing at least 4 months
requirements of PDS in consuming States, for storing procured foodgrains stock in procuring
States, GOI formulated a scheme for construction of godowns through private entrepreneur in
July 2008. Audit observations on the status of the scheme are as under:
(i) As on March 2011, HLC finalised 152.97 LMT storage capacity only after 9 months to 32
months (April 2009 to March 2011) after introduction of the scheme in July 2008 resulting
in delays in the implementation of the scheme (Annexure-XI).
(ii) Out of 152.97 LMT, 132.20 LMT capacity was to be created through private entrepreneurs
and the remaining 20.77 LMT storage capacity was sanctioned to CWC (5.29 LMT) and
SWCs (15.48 LMT). However, only 24.10 LMT storage capacity have been awarded to
private entrepreneurs from July 2010 to January 2011. The balance storage capacity has
not been awarded till March 2011 due to poor response from the private entrepreneurs.
No storage capacity has been added through private entrepreneurs as on March 2011
since its introduction in July 2008. In respect of CWC and SWCs, only 2 LMT only has been
added under the scheme as on March 2011.

74
Management in its reply stated that the PEG scheme was new and the calculation of storage
gap, technical evaluation and site inspection in States took a long time.
4.2.19.3.3 Construction of godowns under PEG scheme-2008 in selected regions
(i) In West Bengal region, creation of 1.27 LMT godown capacities was approved through
private entrepreneurs under PEG-2008. West Bengal Essential Commodities Supply
Corporation (WBECSC) was nominated as nodal agency to invite bids for creation of
storage capacity. The tenders for construction were issued by WBECSC only in May 2011.
No capacity was added till date (March 2011).
(ii) In Assam region, decision on 3.50 LMT under PEG-2008 was yet to be taken till March
2011.
(iii) In Bihar region, an additional capacity of 3.00 LMT was planned under PEG-2008.
However, no capacity was added till March 2011.
(iv) In AP region, total capacity sanctioned under PEG scheme was 5.56 LMT where in 0.30
LMT was with CWC, 1.11 LMT with SWC and 4.15 LMT with private parties. However, no
capacity was added till date though approval of the capacities was finalized between May
2009 and August 2010.
(v) In Kerala region, total capacity of 0.15 LMT was planned under PEG scheme (April 2009).
However, no capacity could be constructed upto March 2011.
4.2.19.4 Augmentation of storage capacity in the North East
4.2.19.4.1 To meet the storage gap in North East region i.e. storage of foodgrains for 4
months requirement, a special package plan was formulated (November 2010) for creation of
5.40 LMT storage capacity (including 72500 MT capacity taken under Eleventh five year plan)
with a financial outlay of ` 568.17 crore. The target date of completion of the projects under
this plan is March 2015. The State wise details of the capacities envisaged are given as under: Table 21: Details of storage capacity envisaged to be augmented in North East
(Figures in MT)
Sr. No. Name of State Storage Capacity proposed
1 Assam 345000
2 Arunachal Pradesh 20280
3 Manipur 45000
4 Meghalaya 35000
5 Mizoram 20000
6 Nagaland 15000

75
7 Sikkim 15000
8 Tripura 45000
Total 540280
Audit observed that out of the proposed 39 centres, construction could be commenced in one
centre only. Construction of storage capacity was not commenced in remaining 38 centres
mainly due to non identification of land (March 2011).
4.2.19.4.2 In Assam region, augmentation for a shortfall of 6.82 LMT was planned for under
various schemes since 2004 and a mere 0.05 LMT was completed during the last five years
largely due to land acquisition problem. Details are as given below: Table 22: Storage Capacity augmentation plan in Assam Region
a) 4 months TPDS off-take 7.61 lakh MT
(based on average of last 6
months)
b) Total capacity required at 80% utilization 9.52 lakh MT
c) Available storage capacity 2.70 lakh MT
d) Net storage capacity required 6.82 lakh MT
e) Storage capacity to be generated under shelf plan (by FCI) 3.25 lakh MT
f) Storage capacity to be constructed on available land of FCI 0.07 lakh MT
g) Storage capacity to be constructed under PEG-2008 by CWC 0.60 lakh MT
h) Storage capacity to be augmented under PEG-2008 2.90 lakh MT
4.2.20 Thus, there was heavy shortfall in storage capacity addition during the period under
report as against the storage gap identified by GOI/FCI. Against the total requirement of
storage capacity ranging from 95.79 LMT to 182.97 LMT, GOI/FCI envisaged augmentation of
storage capacity upto 164.12 LMT under various programmes during the last five years.
Under own construction plan, a mere 9.56 LMT for own storage capacity was planned for
augmentation during the last fifteen years (1997-98 to 2011-12). Out of which, 7.98 LMT has
been constructed till March 2011. Besides, though FCI had vacant land to the extent of 7.11
LMT storage capacity in 14 States, no plan for construction has been formulated. Under
National Policy on Handling, Storage and Transportation of Foodgrains, silos storage capacity of
5.5 LMT has been added (July 2010). However, utilization under circuit I was below the optimal
level.
Though 152.97 LMT storage capacity (March 2011) was envisaged to be constructed, only 24.10
LMT storage capacity have been awarded to private entrepreneurs from July 2010 to January
2011 under PEG - 2008. The balance storage capacity has not been awarded till March 2011 due
to poor response from the private entrepreneurs. No storage capacity has been added through

76
private entrepreneurs as on March 2011. Only 2 LMT was added through CWC and SWCs under
the scheme (March 2011).
Out of 39 centres proposed for construction in the North East region, construction in 38 centres
could not commence mainly due to acquisition of land (March 2011).
On the whole, only a total 15.48 LMT storage capacity has been augmented against the
envisaged requirement of 172.71 LMT under various programmes during the last fifteen years.
Out of the above, a total storage capacity of 164.12 LMT was envisaged during 2006-07 to
2010-11 and against which only 8.04 LMT was added through augmentation programmes
(March 2011).
Recommendation:
In view of dismal storage capacity addition during last five years, GOI/FCI should review the
augmentation plan under various programmes to overcome the bottlenecks/constraints faced
in various States and consider formulating viable schemes in consultation with State
Governments.

77
Chapter 5 - Movement of Foodgrains
5.1 Movement planning The basic objective for movement of foodgrains is to ensure (i) evacuation of foodgrain from
procurement/surplus regions to deficit states, (ii) availability of foodgrains for distribution
under TPDS and OWS, and (iii) to create buffer stocks as a measure of food security. This
constitute a very important role of FCI involving coordination and monitoring of activities with
railways authorities, transporters and State Governments and amongst different Zonal/Regional
Offices in different parts of the country. Audit findings are given in subsequent paragraphs.
5.1.1 Movement of foodgrains planned and actual achievement
Analysis of year wise inter-state movement of foodgrains carried out by FCI for the last five
years from major procuring regions to consuming states revealed that evacuation of stock from
the procuring States was short by 19 percent to 54 percent of the foodgrains procured. Though
actual movement of foodgrains was more or less meeting the offtake level, but there was
shortfall in planning as compared to the procurement. The table below indicates the position: Table 23: Year wise procurement, movement and offtake of foodgrains
(Figures in LMT)
Year Procurement Offtake Percent off-take to
Procurement
Movement
Planned Actual (+)/(-) Percent to Procurement
Percent to Offtake
2006-07 355.39 367.28 103 291.00 288.68 -2.32 81 116
2007-09 374.20 374.60 100 264.81 278.51 13.70 74 110
2008-09 557.98 395.60 71 239.36 261.37 22.01 46 106
2009-10 588.27 500.28 85 312.30 312.26 -0.04 53 113
2010-11 542.15 530.34 98 362.97 341.34 -21.63 63 114
Source: Annual Reports of Ministry/FCI, Monthly Bulletin and Statement from FCI Movement Branch
5.1.1.1 The total procurement of foodgrains during 2006-07 was 355.39 LMT and movement for
291.00 LMT was planned, and against which the actual movement was 288.68 LMT constituting
82 percent. The actual stock moved with reference to total procurement was 81 percent. In
2007-08, foodgrains of 374.20 LMT was procured and against which evacuation to the extent of
only 71 percent was planned. But, actual movement was 278.51 LMT only. As high as 557.98
LMT of foodgrains was procured in 2008-09 but evacuation was only to the extent of 46
percent. In 2009-10, procurement level was 588.27 LMT but stock of only 53 percent was
moved to the deficit regions. About 542.15 LMT of foodgrain was procured in 2010-11 and only
63 percent of the quantity was moved out from the procuring states.
5.1.1.2 In Punjab region, the evacuation of stock against total foodgrains available for
movement was between 47.60 percent and 64.72 percent. Short planning of movement led to
accumulation of stocks.

78
5.1.2 Position of supply of rakes by railway for movement of foodgrains:
Movement plan of foodgrains was prepared by FCI in terms of railways rakes to be dispatched
to various destinations. The plan includes monthly schedule indicating weekly requirement of
rakes for different centers. The position of rakes planned vis-a-vis actual dispatched during the
period 2006-07 to 2010-11 was as given below: Table 24: No. of rakes planned and actually dispatched (with deviation)
Year No. of Rakes planned
No. of Rakes despatched
Shortage of rakes Shortage of rakes in percent
2006-07 9938 8937 1001 10.07
2007-08 9778 9161 617 6.31
2008-09 9387 8830 557 5.93
2009-10 12247 10817 1430 11.68
2010-11 14234 11972 2262 15.89
Audit observed shortage of rakes with reference to planned which ranged from 5.93 percent to
15.89 percent during the period 2006-07 to 2010-11. Thus, on the whole supply of rakes by
railway as per movement plans showed minor deviation.
5.1.3 Detailed movement plan and deviations from the plan
5.1.3.1 In order to economize foodgrains movement, FCI had taken an initiative to plan
movement of foodgrains through a computer based model of Linear Programming (LP)
exclusively for ex-North movement since February 2006. This enables FCI to select the shortest
route between two centres involving minimum payment of railways freight based on the
Railways Rates Branch System (RBS). The position of rakes loaded by railway as against the LP
based plan during 2006-07 to 2010-11 was as given below: Table 25: No. of rakes loaded and rakes moved as per LP
Year Rakes loaded Rakes moved as per LP Percent compliance
2006-07 4214 2668 63
2007-08 4298 2750 64
2008-09 5301 2908 55
2009-10 6697 4177 62
2010-11 8021 3363 42
Total 28531 15866 55
5.1.3.2 Audit observed that compliance to LP based plan remained in the range of 42 percent to
64 percent during the period under review. Out of 28531 rakes supplied by railways, only 15866
rakes followed the routes indicated in the plan with a deviation up to 45 percent. This indicates
that 12665 rakes did not follow the most economical routes. Hence, payment of freight in
excess of the most economic/least cost as per RBS can not be ruled out.

79
In reply, management stated that due to limited railway tracks and voluminous railway traffic,
railway authorities have expressed their inability to comply with the LP linkages of rakes. It is
difficult to assess any excess freight for rakes moved without following LP model. The monthly
movement plan of FCI (based on LP linkages) was basically some sort of directions given to the
railways in the movement of rakes. Being a GOI department, railways claimed that for every
foodgrain rake moved least cost basis was followed.
The reply of management is not tenable as the movement plan prepared by using LP model was
taken up by FCI to economise movement cost of foodgrains linking centres with shortest
possible route with minimum railway freight based on rates branch system (RBS). Due to such
deviation from the plan, the objective of LP for economizing movement cost remained to be fully
achieved.
5.1.4 Deficiencies in planning and supply of rakes for movement of foodgrains:
5.1.4.1 On scrutiny of records, audit observed that FCI submits to the railways monthly
movement plans indicating station to station linkages along with date wise/weekly priorities.
However, due to operational constraints, railway could not supply rakes as per plan. In a
number of cases, FCI did not consider day wise requirement and operational constraints of their
own loading points in field offices. This resulted in (i) rebooking and diversion of rakes leading to
avoidable freight charges, and (ii) bunching/detention i.e. multiple loading/unloading of rakes
on same date leading to payment of demurrage and penal charges.
5.1.4.2 A test check of records on movement plan and implementation in selected centres
revealed the following deficiencies:
(i) In Punjab region, rakes were planned by FCI (March 2008) without considering the day
wise requirement for different centres leading to bunching of rakes at loading points. This
also has resulted in operational constraints at the loading points such as continuous
engagement of labour at loading point which involves high payment of incentive and long
absence of labour from depots hampering work at the depots leading to piling up of
consignment.
(ii) In Punjab region during 2009-10, 5327 rakes were planned initially. However, 6407 rakes
were actually requisitioned which included 331 rakes on demand but FCI withdrew 105
rakes subsequently. Out of which Railway could provide only 5552 rakes. Similarly, during
2010-11, as against 5788 rakes planned initially, 6710 rakes were actually requisitioned
which included 767 rakes on demand. Subsequently, FCI withdrew 35 rakes from the
requisitioned rakes. Railway could provide only 5770 rakes.

80
(iii) In Haryana region during 2009-10, a total of 1941 rakes including 246 rakes unplanned
demand were requisitioned. Against which railway provided only 1711 rakes. Similarly, in
2010-11, 2470 rakes including 255 rakes unplanned demand were requisitioned. Out of
which, 2399 rakes were provided by the railways. The above mismatch between plan and
actual supply of rakes and high number of unplanned demands made by FCI adversely
affected the weekly plant/dispatch of rakes.
(iv) In Maharashtra region (December 2010) unplanned and unscheduled supply of rakes by
railway resulted in a number of rebooking at Dhamangaon, Dondaicha and Wadsa centres.
Similarly, due to consecutive loadings at the dispatching centre there were bunching and
detention of rakes at Kolhapur, Kurudwadi and Turbhe centres.
(v) In Chhattisgarh region, the actual number of rakes moved to rakes planned ranged
between 87.57 percent and 97.80 percent. Movement plan could not be implemented
due to improper planning.
(a) In DO Raipur, the actual number of rakes planned and dispatched ranged from 69.26
percent to 87.1 percent. The shortfall between 12.80 percent and 30.73 percent was due
to coordination problem with the railways and amongst different centres.
(b) In DO Durg, the actual number of rakes moved to rakes planned was between 84.88
percent to 98.05 percent with a shortfall of 1.95 percent to 15.22 percent.
In response to audit observations, FCI informed that in order to resolve the issue of non
compliance of weekly priorities by railways, the matter has been taken up at the level of Railway
Board and Committee of Secretaries. However, no concrete results have emerged so far.
5.1.5 Thus, the deficiencies noticed in planning and non-supply of rakes by railway as per
monthly/weekly priorities indicate the urgent need for establish a formal mechanism involving
Ministry of railway and department of food/FCI to streamline the movement activities. Further,
under NFSB, greater priority would need to be given to movement of foodgrains for timely
delivery of foodgrains under TPDS. The existing operational constraints of railways in supply of
rakes as per the requirement of FCI should be addressed at the appropriate level for ensuring
timely movement of foodgrains from surplus to consuming/deficit regions.

81
5.2 Inefficiencies/deficiencies in movement of foodgrains
5.2.1 Avoidable expenditure on rebooking and diversions
An avoidable expenditure of ` 79.41 crore was incurred on rebooking and diversions during
2006-11. The average avoidable expenditure incurred on rebooking and diversion of rakes to
alternative destination was ` 15.88 crore. This was mainly due to non availability of storage
space at the original destinations and unplanned diversions of rakes to meet PDS requirement at
different centers. Cases of avoidable expenditure incurred on rebooking and diversion of rakes
in selected regions are given below:
(i) In Bihar region, ` 1.36 crore was incurred as re-booking expenses. On an average 40
numbers of rakes were subjected to rebooking annually. DO Muzaffarpur incurred ` 0.96
crore on rebooking during the period under report. Between August 2007 to May 2008,
11 cases of rebooking was observed under DO, Patna involving an amount of ` 0.49
crore.
(ii) Under West Bengal region, DO Bankura rebooked 3 rakes incurring an expenditure of `
0.27 crore in May 2007. DO Jalpaiguri rebooked rakes incurring an expenditure of ` 0.10
crore during 2009-12. In DO Midnapore, 3 rakes were rebooked and ` 0.18 crore was
spent during 2009-2011. But no rakes were rebooked under DO Burdwan and DO
Birbhum during the period.
(iii) In Assam Region, ` 106.9219 crore was incurred on rebooking of railway rakes during
2006-2010. Excess freight of ` 0.94 crore was paid to Railways against 22 rakes due to
non-availing of direct booking facilities. DO, Guwahati incurred ` 1.35 crore on rebooking
freight during the last five years. But no rake was rebooked under DO, Dibrugarh.
(iv) Jharkhand Region placed an indent of one rake of fine quality raw rice with FCI
headquarters in January 2007 for Defence forces at Nankom and Ramgarh. The rake was
originally booked from Barnala (Punjab) for Jeypore (Orissa). However, when the rake
reached Jeypore in 23 January, 2007, the stock was not unloaded by DO Jeypore
reportedly due to holding of undisposed stock. Consequently, the rake was detained at
Jeypore till 27 January, 2007 by incurring demurrage charges of ` 0.02 crore, and the rake
19 Figures taken from annual accounts, as normal consignments upto New Bongaigaon (NBQ) are on freight prepaid basis and
railway freight as taken in the accounts of Assam region has been considered as rebooking freight only.

82
was ultimately rebooked to Ranchi. Due to improper planning and inefficient movement,
an extra expenditure of ` 0.33 crore was incurred.
Further, ultimately, the Defence authorities rejected the foodgrain on the ground that it
was unfit for human consumption. Out of the total stock (crop year 2004-05) received at
D.O. Ranchi, a small portion (37 MT + 279 MT) could be issued to State Government
after much persuasion The balance quantity of 2022.96 MT alongwith 217 MT of Ex-
Tapa was finally disposed off after a lapse of more than four years in 2011 and only `
2.10 crore was realized. This resulted in loss of ` 2.69 crore being the difference between
economic costs of rice graded ‘A’ and value realized there against.
In response, management stated that the responsibility regarding unplanned rail movement and
dispatch of non-merchantable rice stock pertained to Punjab region who dispatched the C
category and issued under same category.
Reply of the management is not acceptable as FCI suffered a total loss of ` 3.04 crore20 due to
improper movement of non-merchantable stock of rice and subsequent delay in disposal.
5.2.2 Demurrage payments of ` 257.43 crore
5.2.2.1 Audit observed that an amount of ` 257.43 crore was paid on account of demmurage/
wharfage during the period 2006-11 due to unplanned/unscheduled movement and detention
of rakes at loading and unloading points. The average expenditure due to demurrage was `
51.49 crore per year. FCI could succeed in getting waiver from the railway only to the extent of `
70.04 crore and recovered ` 65.30 crore from H&T contractors during the last five years.
Payment of demurrage charges showed an increasing trend over the period from ` 22.73 crore
(2006-07) to ` 85.80 crore (2010-11).
In reply to audit observations, management stated that demurrage occurred due to non-
synchronization of working hours, less free time allowed by railway to load/ unload the rake and
periodical labor unrest /transport strike.
20 Loss due to tender sale of damaged foodgrain-Rs 268.67 lakh, +Rebooking expenditure-Rs 33.23 lakh + Demurrage charges
Rs 2.25 lakh-Total Rs 304.15 lakh

83
Audit observed that consistent occurrence of demurrage payment to Railways is indicative of
ineffective management of handling activities by FCI. Unless deployment of labour within the
organization is streamlined, expenditure on handling charges would continue to increase.
5.2.2.2 Cases of demurrage payment noticed in selected regions are elaborated below:
(i) In Assam region, out of a total ` 21.18 crore paid as demurrage during the last five years,
only a meager amount of ` 1.06 crore (5 percent) was recovered from the Handling
Transport Contractors HTC. Besides, punitive charges amounting to ` 0.24 crore was levied
by Railways on overloading.
(ii) District Office Dibrugarh paid demurrage charges of ` 1.89 crore and out of which ` 0.04
crore could only be recovered from contractors. Similarly, District Office Guwahati paid
demurrage charges of ` 0.70 crore but only ` 0.07 crore was recovered from contractors.
(iii) Under Haryana region, DO Kurukshetra paid demurrage to Railway amounting to ` 1.37
crore during the period under report. The demurrage paid per MT increased from ` 0.80
per MT in 2006-07 to ` 3.93 per MT in 2010-11.
DO Karnal incurred demurrage against stock of 37.92 lakh MT moved aggregated to ` 1.27
crore. This works out to ` 3.36 per MT and out of which ` 65.15 lakh (` 1.72 per MT) was on
FCI account (51 percent). The demurrage paid per MT increased from ` 0.91 per MT (FCI
bears ` 0.13 per MT) in 2006-07 to ` 5.40 per MT (FCI bears ` 3.00 per MT) in 2010-11.
While admitting the facts, RO Haryana stated (December 2011) demurrage incurred is
more economical than of OTA if otherwise paid to the departmental labour. However, the
fact remains that payment of demurrage paid per MT of foodgrains was showing an
increasing trend. FCI should rationalize the deployment of labour to ensure optimal
output.
(iv) In Chhattisgarh region, out of ` 848.25 crore paid against freight, demurrage to the extent
of ` 9.65 crore was incurred. This was despite payment of OTA and incentive to the extent

84
of ` 17.40 crore (` 2.11 crore to staff and ` 15.29 crore to labour) and ` 71.67 crore
respectively.
In response, RO Chhattisgarh stated (January 2012) that the operational difficulties
leading to delay in unloading of wagons were brought to the notice of Railway authorities
at various levels. Wherever demurrages were incurred due to the fault of H&T
contractors, the same has been recovered from them. Request for reversal of round the
clock working hours was also taken up with railways, but it did not yield any favorable
response. The reply is not acceptable as even after heavy expenditure towards OTA and
incentive to facilitate timely unloading wagons, FCI continued to incur high demurrages
charges.
Further, in DO Durg, out of ` 228.22 crore incurred as freight, demurrages incurred was to
the extent of ` 1.85 crore. DO Raipur paid freight to the extent of ` 456.09 crore and out of
which demurrage to the extent of ` 4.37 crore was paid. This was despite payment of `
29.24 crore towards OTA and incentives.
(v) In West Bengal region, a total of ` 10.41 crore was incurred as demurrage charges during
2006-11. Punitive charges of ` 14.59 lakh was also levied by railways for overloading.
Details of recovery of demurrage charges made from the contractor were not furnished to
audit.
DO Burdwan in West Bangal region paid ` 0.41 crore but no amount was recovered from
the contractors. DO Midnapur paid demurrage charges of ` 0.92 crore and out of which
only ` 0.14 crore was recovered from contractors. In DO Birbhum, payment of demurrage
charges was ` 0. 37 crore and no recovery was made from the contractors.
(vi) In Bihar region, out of the total of ` 10.77 crore paid as demurrage, only ` 2.27 crore (21
percent) was recovered from contractors.
(vii) In Kerala region, an avoidable expenditure of ` 10.56 crore on rebooking and demurrage
charges was incurred during 2009-11. This was due to framing of un-realistic and un-
workable movement plans owing to the mismatch between the requirements projected
by Kerala region and the allotment of foodgrains done by FCI headquarters.

85
5.2.3 Weak reconciliation mechanism on missing and unconnected wagons
5.2.3.1 Diversion of food grain wagons occurred both at the instance of FCI and due to certain
operational exigencies of the Railway. Such diversion of wagons at times resulted in
unconnected or missing wagons for the receiving depots. As per the reconciliation system
followed in FCI, claims are lodged with the railway in case of non delivery of the wagon, the
liability of which lies upon railway. Thereafter, a reconciliation of missing and unconnected
wagons is done by Zonal Claim Cell (ZCC) of FCI with the respective zonal railways. The un-
reconciled missing and unconnected wagons are then taken up by FCI Headquarters with the
railway board for match adjustment.
5.2.3.2 As per the match adjustment conducted, railway was liable to pay of ` 36.64 crore 21 to
FCI on account of missing/unconnected wagons for the period of 1967-68 to 1999-2000.
However, FCI failed to recover the adjustment amount from the railways till date. Moreover,
reconciliation for final match adjustment for the missing/unconnected wagons for the period
pertaining to 11 years from 2001 to 2011 has not been conducted with the railway Board. On
audit query, management stated that reconciliation with the railways at the zonal level are
being carried for the period from 2007-08 to 2010-11. It was observed that out of 13 railway
zones, reconciliation in respect of only 2 railways (Northern railway and Southern central
railway) have been completed till December 2011.
5.2.3.3 Audit further observed that the total missing wagons which was ` 5.08 crore in 2006-07
had increased to ` 21.96 crore in 2009-10. Similarly, unconnected wagon was ` 3.33 crore in
2006-07 and which has increased to ` 30.29 crore in 2009-10. The figures of missing/
unconnected wagons have not been furnished for the year 2010-11.
5.2.3.4 In West Bengal region, match adjustment of foodgrain rakes was not effected after
1985-86. As a consequence, liabilities for unconnected wagons was ` 135.04 crore and claims
for missing wagons was ` 140.10 crore respectively (March 2011).
From the above analysis, audit observed that the existing system of reconciliation with the
railways is weak and needs to be strengthened through regular and periodical reconciliation.
5.2.4 Non settlement of refund claims of freight
21 Phase -I 1967-68, phase –II and phase-III

86
5.2.4.1 Audit observed that the pendency of claims of freight was reduced from ` 65.88 crore in
March 2007 to ` 54.02 crore in March 2011 involving 9510 cases. In North Zone, pendency of
claims was ` 41.62 crore as on March 2007 which increased to ` 43.67 crore in March 2011. The
claims were pending settlement for 1 to 28 years. In West Zone, claims were of ` 9.14 crore in
March 2007 and which reduced to ` 6.38 crore in March 2011 involving pendency of claims of 1
to 32 years. In South Zone, claims of ` 2.08 crore were pending from 1 to 16 years as of March
2011.
5.2.4.2 Audit thus observed that refund claims of freight were slow as only to the extent of 18
percent of total claims were settled during last five years. Pendency of claims for such a long
duration indicates lack of effective monitoring of refund claims at the level of regional/ zonal
offices. Monitoring mechanism at the FCI headquarters need to be urgently strengthened.
5.2.4.3 In West Bengal region, at the end of March 2011 as many as 1569 cases of refund claims
amounting to ` 130.87 crore were pending settlement with the railways. The pendency of
claims of ` 27.64 crore as on March 31, 2007 increased to ` 31.53 crore on March 31, 2011
pertaining to 1982-83 onwards.
5.2.4.4 Under RO Punjab, in selected district offices, namely, Amritsar, Ferozepur, Ludhiana
and Sangrur, the pending railway refund claims was ` 1.70 crore, ` 2.82 crore, ` 2.81 crore and `
5.38 crore respectively and these claims pertained from 1982-83 onwards.
5.2.4.5 In Assam region, at the end of March 2011, as many as 2195 cases of refund claims
amounting to ` 52.42 crore were pending settlement with the railways.
5.2.4.6 Under RO Haryana, DO Kurukshetra had 239 refund claim cases of ` 1.76 crore pending
recovery from Railways as of March 2011. Since records in the railways upto the period 2004-05
were destroyed, the possibility of recovery of ` 126.32 lakh in 174 cases was remote. In DO
Karnal, 176 cases valuing ` 1.02 crore were pending for recovery from Railways as on March
2011. Railways records up to 2004-05 were destroyed. Hence, chances of recovery of ` 0.76
crore in 142 cases still pending up to 2004-05 become remote.

87
5.2.5 Excess payment of railway freight
(i) In West Bengal region, in 45 cases test checked during April 2008 to March 2010, the
route adopted for calculation of distances was much longer than the shortest route
provided in the Railway website. This resulted in payment of excess railway freight
amounting to ` 0.33 crore.
(ii) In AP region, railways up to December 2004 were charging freight on the basis of the
distance of transportation by multiple rounding off at each intermediate stage to the next
kilometre. In order to remove anomalies in the method of arriving at the chargeable
distance for fare and freight by different zonal railways it was decided to charge
transportation by rounding off the total distance to next higher km only once at
destination point w.e.f. January 2005.
Due to revised policy of the Railways, the distance slabs was reduced and FCI was entitled
to pay freight at lower rates. A test check of cases for the period 2006-07 to 2010-11
revealed that FCI continued to pay at higher slabs and this has resulted in payment of
excess freight to an extent of ` 3.47 crore for dispatches from Andhra Pradesh to various
destinations.
RO AP region stated that the distances were placed in website only during 2009. The reply
is not tenable as the changed policy was communicated through letter dated 27
December 2004. FCI could not get any refund as the time limit of 6 months from date of
booking for preferring claim has already been expired since April 2006.
Further, in DO Karimnagar, a test check of RRs for the years 2008-11 revealed that the
distances adopted for payment of freight were more than the distances indicated in
Railway Website effective from 1 January 2008. This resulted in excess payment of freight
by ` 2.46 crore (in 94 out of 2146 cases) to Railway due to adoption of incorrect distances
for various destinations by FCI. The prescribed time limit of six months from the date of
RR expired for all the bills and the Corporation did not have the opportunity to claim
refund.
In reply, RO AP stated (January 2012) that the actual route adopted and distance covered
is entirely at the discretion of railways and sometimes the rake movement is made in a
rationalized route due to operational problem of the railways.

88
The reply is not acceptable because freight has to be paid on the basis of the distance
shown in the Railway Website and citing of operational problem of railways as a reason
for overpayment is not valid.
5.2.6 Repudiation of claims by Railways - ` 1.72 crore
In Chhattisgarh region, Railways had repudiated the refund claims worth ` 1.72 crore preferred
during the period 2006-07 to 2010-11. In this regard following observations were made:
Railways repudiated the claims of FCI amounting to ` 0.73 crore without valid reasons. Claims
for ` 0.54 crore preferred on Railways indicated the lack of knowledge of Railway Regulations on
indenting/booking, approved destination points and distances by the officials of the
Corporation. Five claims for ` 0.15 crore were lodged with delays ranging between 6 and 16
months beyond the stipulated period of six months.
In response, management stated (January 2012) that the rates available in railway website and
FCI headquarter movement circulars have been communicated to field officers. But freight is
collected by railways staff as per circulars available with them.
Reply of the management is not tenable as the field staff of FCI should have taken steps to
ensure payments of freight as per prevailing rates.
5.2.7 Pendency of reimbursement of hill transport subsidy claims
Audit observed that a total of ` 46.33 crore was outstanding for reimbursement to States for hill
transport subsidy (HTS)22 claims during the period 2006-07 to 2009-10. Out of which ` 1.03
crore was due for reimbursement to Sikkim, ` 10.39 crore to Jammu & Kashmir, ` 2.66 crore to
Himachal Pradesh, ` 7.05 crore to Mizoram, ` 0.20 crore to Tripura and ` 25.00 crore to
Arunachal Pradesh. The outstanding details of HTS claims for the period 2010-11 were not
furnished by FCI headquarters.
Management stated that in most cases HTS bills could not be settled by FCI for want of
supporting documents as well as proof of payments from States.
22 HTS is meant for the States/UT which are predominantly hilly with little or no railway and poor road communication and the
cost of transportation for moving of stocks is reimbursed from base depot to designated PDCs. HTS is in operation since
August 1, 1975 presently applicable to 11 States viz. Arunachal Pradesh, Himachal Pradesh, Jammu & Kashmir, Manipur,
Meghalaya, Mizoram, Nagaland, Sikkim, Tripura, Andaman & Nicobar Islands and Lakshadweep.

89
The accumulation of HTS claims to the extent of ` 46.33 crore for long duration during the last
five years indicates weakness in the existing settlement procedure and undermined the very
objective of HTS.
GOI/ FCI should review the existing guidelines and consider devising a more efficient mechanism
for regular and timely settlement of claims between FCI and States.
5.2.8 Ad hoc payment of HTS without adjusting excess payment
Audit had pointed out in November 2005 (para no. 7.2.1 of report no. 12 of 2006) that an
amount of ` 185.76 crore was released to Government of Arunachal Pradesh (GoAP) in excess of
the permissible limit laid down by GOI instruction (November 1995) which resulted in interest
loss of ` 20.34 crore on the blockage of fund due to excess release of HTS upto 2004-05.
Subsequently, during a follow up audit exercise conducted in November 2011 audit observed
that after adjustment of admissible pending bills net excess amount paid to GoAP (upto 2004-
05) was ` 39.20 crore. While the earlier excess payment of ` 39.20 crore remained unadjusted,
ad hoc payment of ` 24.07 crore (September 2007) and ` 21.69 crore (September 2010) was
made by Regional Office Assam under orders of Ministry. Non adjustment of earlier excess
payment has also resulted in loss of interest to the tune of ` 27.91 crore.
Management has accepted the observation made by audit.
5.2.9 Unauthorized payment of Hill Transport Subsidy of ` 8.59 Crore on movement of sugar
to Andaman & Nicobar Islands
In violation of the conditions laid down in GOI instructions of October 2002 allowing
reimbursement of cost of transportation of wheat and rice under HTS, FCI D.O. Visakhapatnam
paid cost/ocean freight for movement of sugar to various PDCs in Andaman & Nicobar Islands.
This had resulted in unauthorised payment of HTS of ` 8.59 Crore for the period 2003-04 to
2010-11. However, the unauthorised payment was yet to be recovered by FCI (March 2011).

90
5.3 Other deficiencies in movement activities
5.3.1 Levy of Busy Season Surcharge of ` 347 crore without valid reasons
In Punjab region, audit observed that Ministry of Railways made arbitrary adjustment to class of
foodgrains for charging freight from FCI during 2006-07 to 2010-11. Railways charged 8 percent
to 10 percent (approx.) more freight from FCI with each change of class of foodgrains. Railways
in May 2006 had exempted foodgrains from the purview of Busy Season Surcharge (BSS).
However, railways again levied BSS surcharge on foodgrains without any valid reasons from
October 2006. FCI continued to pay BSS ranging from 5 percent to 7 percent during 2006-07 to
2010-11. Payment of ` 347.07 crore towards BSS out of total freight of ` 8,652 crore was not
found to be valid. Four selected districts, namely, Sangrur, Ferozepur, Ludhiana and Amritsar
paid ` 110.16 crore towards BSS out of total payment of ` 2746 crore on railway freight. Action
taken by FCI in this regards was not on record.
5.3.2 Undue delay in conversion of half rake siding facility into full rake siding facility -
avoidable expenditure of ` 4.81 crore
In Chattisgarh region, Audit observed that FSD Bilaspur with a storage capacity of 35120 MT
was provided with half rake railway siding (320 meter) facility and Railways were placing rakes
at this siding in two parts. Since November 1999, Railways started placing only half rake at FSD
Bilaspur and suggested to FCI to develop full rake facility. Since May 2004, Railways stopped
placing half rakes also at FSD Bilaspur stating that placing of half rakes was adversely affecting
turnover of rakes. Despite placement of half rakes during November 1999 to April 2004, the
siding facility at FSD Bilaspur was not augmented into full rake railway siding facility (October
2011). In the absence of full rake facility and due to refusal of Railways to place half rakes at
FSD Bilaspur, the receipt and dispatch of food grains was being carried out by FCI from Bilaspur
Railway head. The expenditure incurred on handling and transportation of foodgrains from FSD
Bilaspur to Bilaspur Rail head and vice versa during the years 2006-07 to 2010-11 was ` 4.81
crore. Despite approval (February 2009) for construction of additional siding at FSD Bilaspur, no
action has been initiated so far (August 2011).
Management stated that railways were requested to expedite inspection for ascertaining
fitness of track and feasibility of full rake conversion.
5.3.3 Injudicious movement of stock by rail instead of road at shorter distance - Avoidable
expenditure of ` 1.92 crore
In West Bengal region, DO Birbhum moved stocks from FSD Abdarpur to other depots under
same region by rail for distances ranging between 161 km to 338 km. Road transportation for

91
shorter distances was more economical and FCI incurred avoidable expenditure of ` 1.92 crore
on transportation of 1.12 LMT of foodgrains by rail during 2008-09 to 2010-11.
5.3.4 Non-movement of boiled rice stocks in time–Avoidable burden on storage and
payment of storage charges of ` 6.88 Crores
In AP region, DO FCI Kakinada was a heavy procurement district where both raw rice and boiled
rice were procured. Due to reduction in movement of boiled rice, stocks of 2.81 LMT was
retained at the end of 2009-10 as against the retention of only 0.78 LMT during 2008-09. The
effort of District office to obtain additional despatch instructions did not yield the desired
results. The accumulation of the boiled rice stocks in godowns resulted in avoidable payment of
storage charges of ` 6.88 crore.
5.3.5 Delay in clearance of boiled rice stocks in hired godowns resulted in avoidable
payment of over and above storage charges of ` 2.64 Crore.
During April 2006 to November 2007, FCI Andhra Pradesh did not exercise adequate check to
control payment of over and above storage charges for storing boiled rice as well as raw rice in
excess of hired capacity at four hired godowns of CWC Karimnagar, Bodhan, Sarangapur and
SWC Kamareddy. FCI Regional Office Hyderabad did not act on the requests (June 2006 and
September 2006) of District Office, Karimnagar for evacuation of stocks and allocation of more
despatch instructions (DIs). Thus, the excess storage continued till November 2007. The excess
boiled rice stocks could have been despatched to Kerala region by re-allocating additional DIs
for movement of boiled rice from these four godowns to other district offices/despatching
centres having vacant space. Delay in clearance of boiled rice stocks in godowns hired on GWT
basis resulted in avoidable payment of over and above storage charges of ` 2.64 crore.
5.3.6 Dispatch of foodgrains from non-siding depots-avoidable expenditure towards
transportation and double handling of ` 1.01 crore.
Under AP region, Audit observed that DO Tadepalligudem procured 1.17 LMT and despatched
0.98 LMT of rice from FSD Bhimavaram (non siding depot) during 2006-07 to 2010-11when
sufficient space was available at the nearby siding depot BSC Pennada which is 8 KM. Similarly,
in respect of FSD Tadepalligudem (non-siding depot), 1.04 LMT of rice was procured and 1.00
LMT was despatched through rail when sufficient storage space was available at the nearest
siding depot of SWC Nawabpalem. The despatches from non-siding depot involved three
operations and whereas despatches from siding depot involve only one operation. Due to

92
acceptance of levy stocks at non siding depots and resorting of movement of the same
subsequently, the District Office incurred avoidable expenditure of ` 1.01 crore.
In response, RO Andhra stated that the siding depots were constructed after the inception of
non-siding depots, and tagging of the mills for delivery of rice was made permanently based on
distance from mill point to depot.
The reply is not tenable as FCI should have considered cost aspects and re-tags the mills
appropriately.
5.3.7 Movement of Raw Rice at Adilabad from Ex-Andhra Pradesh region instead of from Ex-
North resulted in criss-cross movement and avoidable extra expenditure of ` 6.40
crore.
During the period from 2006-07 to 2010-11, FCI moved a total of 1.25 LMTs of raw rice to
Adilabad out of which 0.88 LMT were from Andhra Pradesh (DO FCI Vijaywada) and balance
0.37 LMT were from Ex-North. Audit observed that the present movement plan being followed
involves criss-cross movement. The movement of foodgrains from Ex-North to Southern States
would have covered Adilabad and a distance of 450 KM from Balharsha to Vijaywada (for
North stocks to South). There was no need for movement of rice from Vijaywada to Balharsha
covering 450 KM from Ex-Andhra Pradesh to Adilabad (Northern) which was redundant and
the freight paid for such criss-cross movement was avoidable. Hence, had FCI moved (0.88
LMT) of raw rice to Adilabad only from Ex-North via Balharsha, it would have avoided extra
expenditure of ` 6.40 crore approximately [0.88 LMT* Rs. 727 per MT (freight for the extra
distance)].
5.3.8 Avoidable payment of siding charges of ` 19.05 crore to railways
In Kerala region, a review of records revealed that though most of the FCI sidings meet the
criteria for being notified as independent sidings entailing benefit in freight payment, However,
FCI had not initiated any action to get its sidings notified as independent station. As a result, FCI
incurred siding charges ranging from ` 0.01 crore to 0.02 crore per special. In the absence of
notification for through booking, Railways charged freight upto the serving station and
collected siding charges for placement and removal of wagons at FCI depots. A test check of
such payments in respect of FCI unit offices revealed that FCI paid ` 19.05 crore which could
have been avoided had FCI got its siding notified as independent booking station for through
booking.

93
5.3.9 Avoidable expenditure of ` 2.63 crore on transportation of non-issuable stock
Audit observed that out of the total rice stock of 50886 MT Grade “A” rice received by six
District Offices of Assam Region during January to November 2005 ex-Punjab Region, almost 48
percent of the total stock was identified as feed category/ D category by DCC/ RCC/ ZCC. FCI
incurred as expenditure of ` 2.63 crore on transportation of the above quantity of stock and
suffered loss of ` 13.59 crore due to disposal of 10793 MT of feed category rice and 13454 MT
of D category Rice. In DO Dibrugarh, 2579 MT of rice ex Patiala was received in Railways siding
Tinsukia on May 20 and 21, 2010. Out of that 428 MT was identified as Feed I/II/III which was
yet to be disposed. FCI incurred freight of ` 0.07 crore (proportionate) for transportation of non-
issuable stock from Punjab region to Assam.
5.4 Occurrence of Transit and Storage shortages
5.4.1 Transit shortages
FCI incurred a total loss of ` 877.49 crore during 2006-11 on account of transit shortages of 6.81
LMT of foodgrains. The percentage of transit shortages to total quantity of foodgrains moved
ranged from 0.35 to 0.50 amounting to ` 117.42 crore to ` 257.42 crore. Transit shortage is the
difference between the weight dispatched by the consignor and the weight received by the
consignee which occurs due to multiple handlings of bags, driage during transit, pilferage, short
loading of wagons, spillages due to weak texture of gunnies etc.
There are no norms prescribed for transit loss in FCI. However, FCI entered into Memorandum
of Understanding (MOU) with GOI which prescribed an annual target for transit shortages.
Audit observed that FCI could succeed in curtailing transit losses as per the MOU only for one
year (2008-09) during the last five years. The financial impact on such occurrence of transit loss
above the target limit works out to ` 95.16 crore.23 The transit shortages observed on
movement of foodgrains by rail during 2006-07 to 2010-11 were as under: Table 26: Details of transit losses observed during last five years
(Quantity in LMT and value in crore `)
Year Quantity Moved
Quantity Received
Transit Loss observed
Value of Transit loss
Percent of Transit loss
Percentage of loss as per MOU signed by FCI with Ministry
2006-07 322.58 321.19 1.39 145.38 0.43 0.36
2007-08 312.03 310.82 1.21 123.95 0.39 0.36
2008-09 303.84 302.78 1.06 117.42 0.35 0.40
2009-10 346.56 345.01 1.55 233.32 0.45 0.40
2010-11 317.39 315.79 1.60 257.42 0.50 0.43
Total 1602.4 1595.59 6.81 877.49 0.42 ----------
23 ` 23.67 crore in 2006-07, ` 9.53 crore in 2007-08, ` 25.92 crore in 2009-10 and ` 36.04 crore in 2010-11.

94
5.4.1.1 Non adherence to instructions for recovery of transit shortages
As per revised procedure issued by FCI Headquarters in March 2002, the consignee (receiving)
districts would issue debit Inter Office General (IOG) at economic cost to the consignor
(despatching district). The consignor district would accept the IOG advice and recovery would
be effected immediately from Agencies/HTC/Employees. Audit observed that against Inter
Office General (IOG) for transit shortages issued by consignee district offices and accounted for
by the consigner districts as recoverable from staff during 2001-02 to 2005-06, an amount of `
316.54 crore remained outstanding for recovery upto 2009-10 and the management has not
taken any action in fixing the responsibility and effecting recovery from the delinquent
officers/officials.
In its reply, management stated that during the currency of the instructions (which have been
repealed), the responsibility for unjustified losses were fixed on delinquents only after proper
investigation and penalty as deemed fit was imposed by the respective disciplinary authorities
after following the prescribed procedure. However, details of the same are being sought from
the field offices for further action.
Thus, the fact remains that recovery of outstanding amount of ` 316.54 crore could not be
effected due to procedural delays in investigation and fixing of responsibility by FCI.
5.4.1.2 Analysis of transit losses in selected regional/district offices
(i) In Punjab, the transit loss was between 0.30 percent to 0.40 percent during 2006-07,
2008-09, 2009-10 and 2010-11. Position of transit shortages in district offices was as
under:
(a) In DO Sangrur, transit shortages of 0.38 LMT foodgrains occurred which was 0.33 percent
of total stock moved during the period involving a loss of ` 51.24 crore. Audit observed
that during August 2010 to March 2011 (i.e. after discontinuance of transit insurance), DO
had loaded 666 number of special rakes and dispatched 16.76 LMT foodgrains. Out of 666
rakes, transit shortages of 0.5 percent and above were noticed in 210 rakes (4851 MT).
But penal action was initiated in 2 cases only, whereas in 99 cases the consignee had not
submitted the unloading documents (March 2011). In remaining 109 cases, disciplinary
action was pending.
(b) DO Ferozepur incurred a total loss of ` 37.84 crore on account of transit loss of 0.31 LMT
foodgrains which was 0.42 percent of total stock moved. The DO had loaded 391 number

95
of special rakes and dispatched 9.87 LMT foodgrains during August 2010 to March 2011.
Out of 391, transit shortages of 0.5 percent and above were noticed in 67 rakes (1539 MT
shortage). In 65 cases the consignee had not submitted the unloading documents and
penal action was yet to be initiated.
(c) DO Ludhiana incurred transit loss of 0.31 LMT foodgrains involving Rs. 34.29 crore as
against 0.43 percent of total stock moved. During August 2010 to March 2011, DO
Ludhiana loaded 415 number of special rakes and dispatched 9.61 LMT foodgrains. Out of
415, transit shortages of 0.5 percent and above were noticed in 102 rakes (2621 MT). In 2
cases the consignee had not submitted the unloading documents. Disciplinary action on
the remaining 100 cases was pending (March 2011).
(d) In DO Amritsar, transit loss of 30817 MT foodgrains amounting to ` 5.52 crore was
incurred which was 0.61 percent of total stock moved. DO Amritsar loaded 300 special
rakes and dispatched 7.68 LMT foodgrains during August 2010 to March 2011. Out of 300
rakes, transit shortages of 0.5 percent and above were noticed in 155 rakes (43860 MT)
and penal action has been taken in 6 cases only whereas in 91 cases the consignee has
failed to prove shortages. In remaining 58 cases, disciplinary action is pending.
(ii) In Haryana region, FCI incurred transit shortages of 0.62 LMT foodgrains which was 0.32
percent of total stock moved, involving ` 59.17 crore during 2006-07 to 2010-11. The
percentage of transit loss occurrence was in the range of 0.30 percent to 0.33 percent
during the last five years. As on March 2011, transit losses of ` 29.51 crore were pending
mainly due to abnormal delays in investigation at the level of District offices. In RO
Haryana, the amount recoverable from staff on account of transit shortages during 2006-
07 to 2010-11 was between ` 29.51 crore and ` 36.76 crore. DO Kurukshetra incurred a
total loss of ` 24.99 crore on account of transit loss of 0.20 LMT foodgrains which accounts
for 0.38 percent of total stock moved during 2006-11. In DO Karnal, ` 21.20 crore on
account of transit loss of 0.14 LMT foodgrains was incurred which accounts for 0.40
percent of total stock moved.
(iii) In Assam region, transit loss was between 0.51 percent to 3.86 percent in rice and 0.27
percent to 2.11 percent during the last five years. Full bag shortages at Rangia trans-
shipment point during the period 2006-07 to 2010-11 amounted to ` 5.40 crore. Under
DO Guwahati, the transit loss was 0.27 percent to 0.70 percent involving a total of

96
8117.33 MT with a value of ` 9.23 crore. In DO Dibrugarh, transit loss was 0.43 percent to
0.99 percent involving a total of 78577.69 MT with a value of ` 9.30 crore.
(iv) In West Bengal region, transit loss was between 0.36 percent to 0.49 percent in wheat
and 0.47 percent to 0.81 percent in rice during 2006-07 to 2010-11. DO Bankura incurred
a total transit loss of 2677.63 MT foodgrains, 0.44 percent of stock moved amounting to `
2.24 crore. DO Birbhum incurred transit loss of 2106.46 MT foodgrains, 0.62 percent of
stock moved amounting to ` 2.27 crore. DO Jalpaiguri incurred transit loss of 3023.14 MT
foodgrains, 0.80 percent of stock moved amounting to ` 4.05 crore. DO Midnapore
incurred transit loss of 6196.83 MT foodgrains, 0.28 percent of stock moved amounting to
` 6.61 crore.
(v) In Bihar region, transit loss was between 0.19 percent to 0.43 percent in wheat and 0.40
percent to 0.53 percent in rice during the last five years. 5813 numbers of wheat bags and
5379 numbers of rice bags worth ` 76.12 lakh were found short in transit during the 2006-
11. However, no case of effecting recovery from officials/officers for full bag shortages
was noticed. Further, abnormal transit losses (` 0.39 crore) ranged 0.57 percent to 2.24
percent during the last five years. Out of 15 such cases, 5 cases were under Patna DO and
rest 10 cases were under DO Gaya.
(vi) In Chhattisgarh region, FCI incurred a total loss of ` 68.75 crore on account of storage loss
of 0.76 LMT of food grains which accounts for 0.67 percent of total stock moved during
2006-07 to 2010-11. In DO Durg, transit loss was between 0.42 percent to 0.68 percent
during the last five years with a value of ` 0.14 crore. In DO Raipur transit loss was
between 0.50 percent and 0.70 percent during the last with a value of ` 1.72 crore.
5.4.1.3 Non mitigation of transit loss under transit insurance policies
With a view to arrest and reduce transit losses by way of third party inspection and to cover the
risk towards unforeseen circumstances, FCI entered into agreement with Oriental Insurance
Company Limited (OICL) and United India Insurance Company Limited (UIICL) for transit
insurance policies effective from September 2005. The insurance of transit losses was in force
till August 2010 and, thereafter, FCI discontinued taking insurance policies as the effective
insurance premium offered by insurance companies was more than the losses suffered due to
transit shortages. Scrutiny of records revealed the following audit observations:

97
(i) In contrary to the advice of RITES and BIASL (July/August 2004) that without identifying
and defining measures to pluck operational efficiency in the existing control mechanism,
insurance cover alone would not solve the root problem of transit losses, FCI went (July
2005) ahead with insurance of transit losses. The end result was that the trend of transit
loss remained the same even during the insurance period (September 2005 to August
2010). Management admitted (January 2009 & November 2010) that there has not been
significant change in the occurrence of losses after introduction of transit insurance.
(ii) Under various transit insurance policies, FCI paid ` 319.45 crores to the insurance
companies towards insurance premium. Against a total value of transit losses of ` 763.07
crore, a claim to the extent of only ` 371.97 crore was lodged with the insurance
companies. Out of the which, FCI could realized only ` 304.70 crore.
(iii) The balance of ` 67.27 crore was still lying outstanding with the insurance companies due
to non/partial settlement. Of this, claims of ` 16.70 crore were outstanding with OICL for
the period pertaining to September 2005 to July 2007. However, a sum of ` 0.40 crore
only was confirmed by OICL as pending for payment at the end of March 2010. The
remaining ` 50.57 crore claims were pending from UIICL for the period August 2007 to
August 2010.
(iv) Further, as per the terms and conditions of the agreements, claims were to be lodged
only when a loss exceeds 0.25 percent of the value of goods moved in each rake, OICL and
UIICL were to settle the claims within 7 and 15 working days respectively otherwise
interest at the bank borrowing rates of FCI would be payable to FCI. FCI lodged claims for
interest of ` 10 crore for delay settlement of claims beyond 3 months to 45 months upto
2009-10. However, FCI has not lodged any claim on interest for the year 2010-11 so far.
5.4.2 Thus, it is evident that due to operational inefficiencies and lack of effective control
mechanism, FCI continues to suffer transit shortages on an average of ` 175.50 crore per annum
during the last five years. Further, due to inadequate pursuance on the part of FCI, an amount
of ` 77.27 crore (` 67.27 crore plus interest of ` 10 crore) remains unrecovered from the
insurance companies (March 2011).
Management in its reply stated that a committee of Executive Directors is examining the matter
about transit insurance considering the trend of transit losses in last one year when transit

98
insurance was not there and its report is awaited. Further, FCI has made protracted
correspondence and conducted series of meeting with the insurance companies for settlement
of pending transit insurance claims pending but no fruitful result could be achieved. A
conciliation committee has been constituted for amicable resolution of the dispute regarding
pending claims.
However, the fact remains that during the currency of insurance cover, there was no significant
change in occurrence of transit losses and even after discontinuance of transit insurance. FCI
could realise only ` 304.70 crore from the amount of ` 371.97 crore lodged with the insurance
companies. Hence, the amount realized by FCI did not even cover the total premium of ` 319.45
crore paid to insurance companies.
5.4.3 Transit insurance claims pending in selected regions
(i) In Assam region an amount of ` 31.02 crore was yet to be realized from insurance
company although the term of agreement had already been expired in August 2010.
(ii) In West Bengal under selected district offices, the position of pending transit insurance
claims was given below:
Table 27: Details of pending transit insurance claims
(` in crore)
District No. of Claim Value Claim
Reimbursed Still Pending
Bankura 114 1.55 0.1 1.45
Birbhum 39 0.44 0.2 0.24
Burdwan 80 0.61 0.48 0.13
Jalpaiguri 0 1.96 1.52 0.44
Midnapur 303 3.32 1.24 2.08
Total 536 7.88 3.54 4.34
(iii) In Bihar region transit insurance claims of ` 2.39 crore (Wheat – ` 0.64 crore & Rice – ` 1.75
crore) were pending with the insurance company.
5.4.4 Transit shortage observed during movement of foodgrains by road
M/s Dasmesh Trolla Service, Mukerian and M/s Punjab Goods Carrier, Mukerian were
appointed Road Transport Contractor (RTC) for transportation of foodgrains from Mukerian and
Dasuya, District Hoshiarpur to Kashmir valley (J&K) from January 13, 2009 to January 12, 2010

99
and from May 15, 2009 to May 14, 2010 for a period of one year respectively. Both the firms
were owned by Paramjot Singh S/o Gurdip Singh of Mukerian. There was suspected
misappropriation of foodgrains by the Road Transport Contractor (RTC) in respect of
undelivered quantity of 927.34 MT quintals valuing ` 2.65 crore of rice. Almost 2 years have
elapsed since detection of suspected misappropriation of stock by RTC, Regional Office
Punjab/District Office, Hoshiarpur failed to lodge the civil suit against the party for recovery of
loss.
Regional Office Punjab had imposed penalty on Managers (Depot) incharge Mukerian and
Dasuya for ` 2 lakh each and no disciplinary action against Manager (Movement) and Manager
(Finance) in the district office Hoshiarpur was taken.
5.4.5 Storage losses
5.4.5.1 FCI incurred a total loss of ` 958.77 crore during 2006-11 on account of storage
shortages of 6.18 LMT of foodgrains. The percentage of storage shortages to total quantity of
foodgrains issued ranged from 0.10 to 0.29 amounting to ` 101.31 crore to ` 292.91 crore. These
losses were mainly due to loss of moisture, insect infestation and sliding down of stock, fungus
infestation with deterioration of stocks, bird trouble, rodents bleeding/spillage of grin from
gunny bags and long period of storage. Storage loss is revealed as and when each stack is
completely issued or cleared and represents the difference between the stock balance as per
books and the physical stock balance.
FCI entered into Memorandum of Understanding (MOU) with GOI which prescribed an annual
target for a limit of transit shortages. Audit observed that FCI could succeed in curtailing
storage losses as per the MOU only in two years (2008-09 and 2009-10) during the last five
years. The financial impact on such occurrence of transit loss above the targeted limit works out
to ` 112.14 crore24. The storage shortages observed during last five years were as under:
Table 28: Details of storage losses observed during last five years
(Quantity in LMT and value in crore `)
Year Receipt Weight of stock issued
Issue weight Storage Loss observed
Value of storage loss
Percent of loss observed
Percentage of storage loss as per MOU signed by FCI with GOI
2006-07 654.89 653.55 1.34 153.76 0.20 0.18
2007-08 655.89 654.50 1.39 182.43 0.21 0.18
2008-09 620.17 619.59 0.58 101.31 0.10 0.18
2009-10 725.27 723.96 1.31 228.36 0.18 0.20
2010-11 530.77 529.21 1.56 292.91 0.29 0.22
24 ` 15.38 crore in 2006-07,`` 26.06 crore in 2007-08 and `` 70.70 crore in 2010-11.

100
Total 3186.99 3180.81 6.18 958.77 0.19 ------------
5.4.5.2 Region wise occurrence of storage losses and gains
A detailed analysis of storage loss/gain in respect of wheat and rice during the last five years
(2006-07 to 2010-11) was made in audit in order to highlight losses suffered amongst different
regional offices of FCI (Annexure-XII). Audit observations are as follows:
Wheat
(i) In 10 out of 23 regional offices, namely Punjab, Haryana, Uttar Pradesh, Uttarakhand,
Himachal Pradesh, Andhra Pradesh, Karnataka, Kerala and Tamil Nadu, there was storage
gain ranging from 0.04 percent to 1.13 percent.
(ii) Storage gain in Punjab region in comparison with Haryana region indicated short
accountal to the extent of ` 49.82 crore on the part of RO Punjab.
(iii) In 7 out of 23 regional offices, namely, Jammu & Kashmir, North East, Bihar, Jharkhand,
Madhya Pradesh, Maharashtra and Gujarat, storage shortages were beyond 0.22 percent
to 2.02 percent.
(iv) In the rest 6 regional offices, namely, Delhi, Assam, N&M, Orissa, West Bengal and
Chhattisgarh, storage shortages were upto 0.17 percent.
Rice
(i) In 14 out of 23 regional offices, namely, Delhi, Jammu and Kashmir, Himachal Pradesh,
Assam, NE, N&M, Bihar, Jharkhand, Orissa, Maharashtra, Andhra Pradesh, Karnataka,
Kerala and Tamil Nadu, storage shortages were upto 0.39 percent.
(ii) In 6 out of 23 regional offices, namely, Haryana, Rajasthan, West Bengal, Madhya
Pradesh, Chhattisgarh and Gujarat, storage shortages were between 0.20 percent and
0.92 percent.
(iii) In remaining 3 regional offices, namely, Punjab, Uttar Pradesh and Uttrakhand storage
shortages ranged from 0.34 percent to 1.43 percent.
Management accepted the facts and explained that high driage in moisture content takes place
due to agro climate conditions in the concerned regions. In Punjab and Haryana regions, rice
under value cut is procured at a moisture content of 15 percent under relaxed specifications.
Various scientific studies have indicated that storage loss in rice is higher when it is procured at
moisture level greater than 14 percent.

101
5.4.6 From the above, the audit observed that storage losses in respect of wheat were
abnormally high in 7 regional offices (Jammu & Kashmir, North East, Bihar, Jharkhand, Madhya
Pradesh, Maharashtra and Gujarat). Short accountal of storage gains continued to be high in
Punjab compared to Haryana. This was pointed out by audit in its Report no. 11 of 200825.
Ministry, in its reply to action taken note stated that temperature and climatic condition are not
same of all the areas of Punjab in comparison to Haryana. Further, quantum of purchase of
wheat in Punjab is much higher than Haryana. The storage of wheat in open and covered is not
the same in both the States (July 2011). Audit, after vetting reply of the Ministry did not agree
with the contention in the absence of supporting documents relating to temperature and
humidity which could establish that the climatic conditions are so varied in the above two
States. Further, audit pointed out that GOI fixed the identical storage gain norms for both the
States.
The issue regarding excess storage loss in Punjab region was pointed out by audit earlier26.
Ministry/FCI, in its reply to action taken note stated that average stock period of stored grains in
Punjab remained on higher side and the State made higher value cut recoveries indicating that
more quantity of rice is procured between moisture content of 14 percent to 15 percent thus
leading to higher storage loss. The matter of fixation of storage loss norms in FCI/CWC/SWCs
godowns was referred to the concerned Ministry and final decision in this regard is awaited. FCI
Board of Directors has approved handing over a comprehensive study on storage loss norms to
Indian Council for Agricultural Research (ICAR). (September 2011).
Audit, in the present context, observed that the actual loss due to driage in rice has not been
assessed by FCI as the losses indicated do not have the bifurcation between losses due driage
and operational inefficiencies. Moreover, norms for determining losses due to driage have not
been prescribed by GOI. The assessment of loss due to driage and operational inefficiencies for
the purpose of regularisation is being done on ad hoc basis. There is a need for adoption of
norms for losses due to driage to enable the FCI to make realistic assessment of the storage
losses for its regularisation.
5.4.7 Storage losses in selected regional/district offices
(i) In Punjab region, the storage loss was between 0.78 percent to 1.31 percent during the
last five years. The financial impact of excess storage loss over the percentage of storage
loss as per MOU signed by FCI with GOI (from 0.18 percent to 0.22 percent) during
25 Para No. 7.1.2 of Report No. 11 of 2008 – Commercial Union Government 26 Para No. 6.1.2 of Audit Report No. 9 of 2009-10 - Commercial Union Government

102
2006-11 works out to ` 371.59 crore27. FCI Regional Office, Punjab had recovered `
255.15 crore (` 45.11 in 2006-07, ` 45.95 crore in 2007-08, ` 58.21 crore in 2008-09, `
51.81 crore in 2009-10 and ` 54.06 crore in 2010-11) from rice millers as quality cut due
to rice received with moisture over 14 percent to 15 percent. An amount of ` 17.78
crore was also recovered from CWC and PSWC for unjustified storage losses occurred in
their godowns during 2009-11. The position of storage losses in selected districts was as
under:
(a) DO Sangrur incurred storage loss of 0.93 LMT foodgrains which accounts for 1.40
percent of total stock moved during 2006-11 involving of ` 127.75 crore. FCI district
office Sangrur recovered ` 71.77 crore from rice millers for moisture with full value cut
above 14 percent moisture upto 15 percent leaving a net storage loss of ` 55.98 crore.
The storage loss in hired godowns from PSWC was on hire side where 4127 MT storage
loss valuing ` 52.58 crore was regularized after making recovery of ` 12.91 crore for
unjustified storage loss. The District office had regularized 4127 MT storage loss valuing
` 52.58 crore occurred in PSWC godowns after making recovery of ` 12.91 crore from the
storage bills of PSWC for unjustified storage loss.
(b) In DO Ferozepur, storage loss of 0.27 LMT foodgrains involving ` 38.42 crore on 1.16
percent of total stock moved was noticed. However, FCI district office Ferozepur has
recovered ` 13.31 crore from rice millers in respect of moisture with full value cut above
14 percent moisture upto 15 percent leaving a net storage loss of ` 25.11 crore. District
office had regularized 13753 MT storage loss valuing ` 19.40 crore occurred in PSWC
godowns after making recovery of ` 6.64 crore from the storage bills for unjustified
storage loss.
(c) In respect of DO Ludhiana, a total loss of ` 50.37 crore was incurred on account of storage
loss of 38900 MT foodgrains accounting for 0.87 percent of total stock moved. FCI district
office Ludhiana recovered ` 32.14 crore from rice millers in respect of moisture with full
value cut above 14 percent moisture upto 15 percent leaving a net storage loss of ` 18.23
27 ` 46.76: 2006-07, ` 45.29 crore: 2007-08, ` 26.63 crore: 2008-09, ` 109.18 crore: 2009-10 and ` 143.74 crore: 2010-11
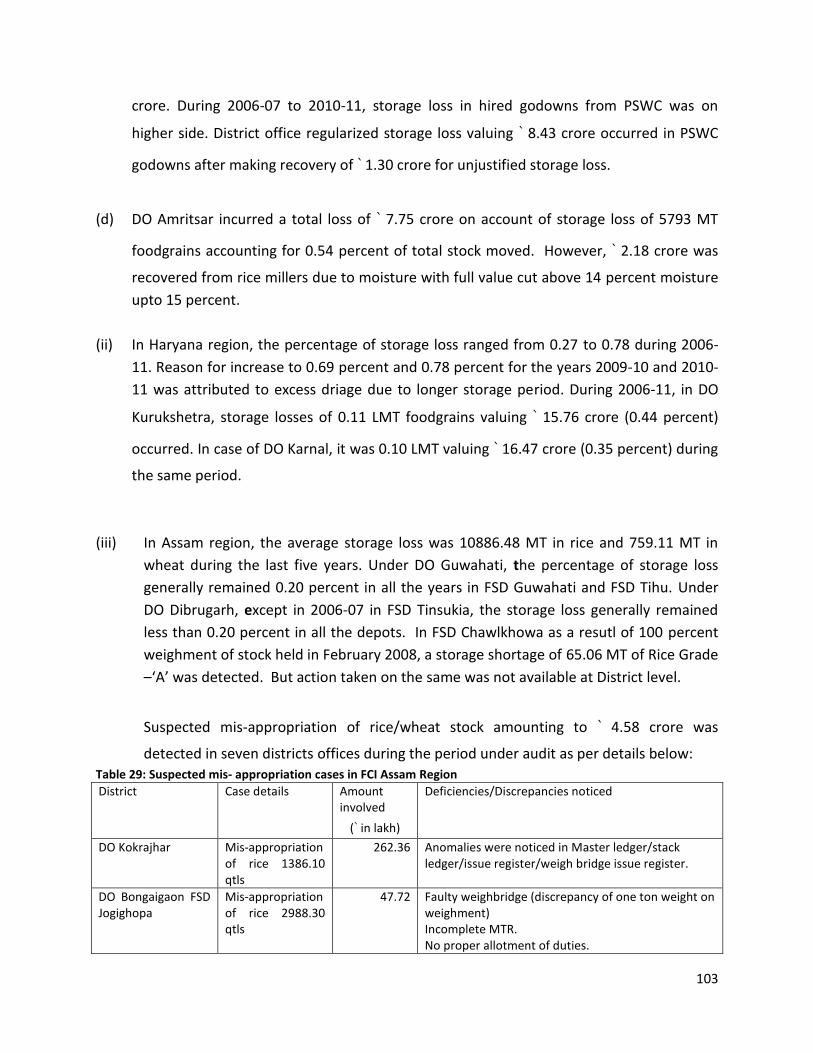
103
crore. During 2006-07 to 2010-11, storage loss in hired godowns from PSWC was on
higher side. District office regularized storage loss valuing ` 8.43 crore occurred in PSWC
godowns after making recovery of ` 1.30 crore for unjustified storage loss.
(d) DO Amritsar incurred a total loss of ` 7.75 crore on account of storage loss of 5793 MT
foodgrains accounting for 0.54 percent of total stock moved. However, ` 2.18 crore was
recovered from rice millers due to moisture with full value cut above 14 percent moisture
upto 15 percent.
(ii) In Haryana region, the percentage of storage loss ranged from 0.27 to 0.78 during 2006-
11. Reason for increase to 0.69 percent and 0.78 percent for the years 2009-10 and 2010-
11 was attributed to excess driage due to longer storage period. During 2006-11, in DO
Kurukshetra, storage losses of 0.11 LMT foodgrains valuing ` 15.76 crore (0.44 percent)
occurred. In case of DO Karnal, it was 0.10 LMT valuing ` 16.47 crore (0.35 percent) during
the same period.
(iii) In Assam region, the average storage loss was 10886.48 MT in rice and 759.11 MT in
wheat during the last five years. Under DO Guwahati, the percentage of storage loss
generally remained 0.20 percent in all the years in FSD Guwahati and FSD Tihu. Under
DO Dibrugarh, except in 2006-07 in FSD Tinsukia, the storage loss generally remained
less than 0.20 percent in all the depots. In FSD Chawlkhowa as a resutl of 100 percent
weighment of stock held in February 2008, a storage shortage of 65.06 MT of Rice Grade
–‘A’ was detected. But action taken on the same was not available at District level.
Suspected mis-appropriation of rice/wheat stock amounting to ` 4.58 crore was
detected in seven districts offices during the period under audit as per details below:
Table 29: Suspected mis- appropriation cases in FCI Assam Region
District Case details Amount involved
(` in lakh)
Deficiencies/Discrepancies noticed
DO Kokrajhar Mis-appropriation of rice 1386.10 qtls
262.36 Anomalies were noticed in Master ledger/stack ledger/issue register/weigh bridge issue register.
DO Bongaigaon FSD Jogighopa
Mis-appropriation of rice 2988.30 qtls
47.72 Faulty weighbridge (discrepancy of one ton weight on weighment) Incomplete MTR. No proper allotment of duties.

104
DO Jorhat FSD Cinnamara
Mis-appropriation of rice 448.75 qtls
7.70 FIFO procedure not maintained. Failure in supervisifon of offering inflow/outflow of foodgrains.
DO Dibrugarh FSD Chaulkhowa
Mis-appropriation of rice 649.07 qtls
11.13 Discrepancies in gate pass book were noticed. Anomalies were noticed in Master ledger/stack ledger/issue register/weigh bridge issue register.
DO Banderdeva Mis-appropriation of rice 4921.27 qtls
32.16 Anomalies were noticed in Master ledger/stack ledger. Security norms were not followed.
DO North Lakhimpur FSD Narayanpur
Mis-appropriation of rice 1589.87 qtls
36.53 Anomalies were noticed in Master ledger/stack ledger/issue register/weigh bridge issue register.
DO Silchar FSD Ramnagar
Mis-appropriation of rice 2021.10 qtls
44.73 Discrepancies in MTR/MIR. Shed in-charge was ignorant about depot operations. Lack of administrative supervision and guidance by officials to depot people.
DO Tejpur Mis-appropriation of 998.08 qtl. rice
15.94
Total 458.27
(iv) Under West Bengal region, in DO Burdwan, the percentage of storage loss observed
ranged from 0.05 percent to 0.11 percent (Wheat) and 0.23 percent to 0.96 percent
(rice) during 2008-11. In DO Birbhum, the percentage of storage loss observed ranged
from 0.02 to 0.52 (Wheat) and 0.20 to 1.47 (rice). In DO, Bankura, it ranged from 0.004
to 0.37 (Wheat) and 0.026 to 3.60 (rice). In DO, Midnapur, the percentage of storage
loss observed was from 0.06 to 0.16 (Wheat) and 0.14 to 0.66 (rice) during 2008-11.
During 2008-11, under DO, Jalpaiguri percentage of storage loss ranged from 0.010 to
1.27 (Wheat) and 0.11 to 1.97 (rice) during 2008-11.
In FSD Cossipore, storage losses detected was to the extent of ` 3.74 crore during the
period upto 2003-04. Since the godown was hired, FCI West Bengal region claimed
amount from State Government, but no amount could be realized so far (June 2010).
In DO Durgapur and Bankura, a quantity of 1624.761 MT rice and 2.01 MT wheat was
lying with the re-miiling agent even after contract was expired in September 1991. The
stock could not be physically verified after 1998. Absence of the stock valued at ` 0.90
crore was observed (March 2011).
(v) In Bihar region, storage loss was between 0.18 percent to 0.29 percent in wheat and
0.22 percent to 0.45 percent in rice during the last five years. Out of 29 high storage loss
making depots in the country, 12 depots were in Bihar region.

105
Suspected mis-appropriation of rice/wheat stock amounting to ` 52.90 crore was
detected Bihar region as per details below: Table 30: Suspected mis-appropriation cases in FCI Bihar Region
Sl. No.
Month and Year of detection
Name of Depot/ PPC centre
FCI, District
Stock found short in P.V. as compared to book balance
(in MT)
Total value of stock shortage
(` in lakh)
Wheat Rice Paddy
1 May 2011 FSD Katari hill DO Gaya 564.3 406.8 NIL 180.43
2 Do ARDC Phase-1 Bhagalpur
DO Bhagalpur 446.0 3300.10 NIL 791.98
3 Do FSD Saharsa DO Saharsa 888.3 1609.8 27.5 497.75
4 Do FSD Mokama DO Patna 507.5 377.7 NIL 165.00
5 Do FSD Begusarai DO Samastipur
0.1 NIL NIL 0.02
6 June 2011 FSD Phulwari sharif DO Patna 19.1 97.8 NIL 24.14
7 March 2011 PPC Dumraon DO Patna 295.7 52.9
3963.6 NIL 880.44
8 Do PPC Bihiya DO Patna 109.0 1014.4 NIL 235.77
9 Do PPC Chausa DO Patna 119.0 59.5 NIL 31.04
10 May 2011 FSD Buxar DO Patna 10.3 1026.1 1422.2 471.54
11 Do SWC Bihar sharif DO Patna 1121.6 4858.0 NIL 1246.26
12 Do SWC Bettiah Motihari NIL 114.0 NIL 25.08
13 February 2011 FSD NRPA Muzaffarpur 1018.6 1503.6 NIL 486.23 + 8.73(Cost of gunny shortage )
14 July 2011 PPC Koini Chapra NIL 1135.6 NIL 245.30
Total 5152.4 19467.0 1449.7 5289.80
Out of above 14 cases, 7 were in the depots under DO Patna.
5.5 Regularization of transit and storage losses
As per the existing procedure all the transit and storage losses need to be investigated and
losses to the extent considered justified/ beyond controllable factors regularized by writing-off
after fixing responsibility. In order to control transit and storage losses has been prescribed for
different levels of authorities. Wherever records are not traceable or accountability could not
be fixed due to superannuation/death/repatriation of the officers/officials found prima facie
responsible, the competent authority give the certificate that the records are not
available/traceable inspite of concerted efforts and there is no other alternative but to
regularize the transit and storage shortages. The financial powers delegated to various

106
authorities to write off the storage shortages are (i) Area Manager - ` 50,000, (ii) General
Manager Region – ` 100,000, (iii) Zonal Manager – ` 200,000 and (iv) CMD – full powers for
writing off all the shortages exceeding the powers of Zonal Managers.
5.5.1 Analysis of transit and storage losses occurred and regularized during the last five years
revealed the following position:
(i) Transit and storage losses to the extent of ` 933.05 crore were pending regularisation at
the beginning of 2006-07 which remained at ` 803.60 crore at the end the 2010-11. The
annual average occurrence of transit and storage losses was ` 355.23 crore and the
regularisation was ` 381.12. There was substantial increase in occurrence of losses to the
extent of 111 percent in 2009-10 over the previous year.
(ii) Regularisation of storage and transit losses was pending at different levels. Out of `
803.60 crore pending at the end of 2010-11, ` 603.09 crore (75 percent) was outstanding
at the level of General Manager (Regional heads) which was the highest amongst
different authorities. The pendency of regularisation was between ` 398.08 crore to `
468.42 crore during 2006-07 to 2009-10.
(iii) At the Headquarters level, transit and storage losses amounting to ` 54.11 crore were
pending regularization at the end of 2010-11 pertaining to the period ranged from 1972-
73 to 2009-10. Out of which losses to the extent of ` 12.37 crore in respect of 96 cases
were pending due to non availability of records relating to 1980-81 to 2001-02.
5.5.2 Though time frame for regularisation of transit and storage losses cases was prescribed,
the cases regularised at FCI Headquarters during the last five years pertained to the old period
of 1979-80 to 2006-07. Thus, process of investigation and writing off of transit and storage
losses was not carried out in a time bound manner. A consolidated position on age-wise
pendency of transit and storage losses was also not maintained at FCI Headquarters indicating
inadequacy in its follow up mechanism.
Management in its reply stated that delay in regularisation of transit and storage loss cases at
headquarters was mainly due to late receipt of regularisation proposals from the field offices to
headquarters. In some of the cases complete documents were not received for which

107
correspondence had to be made to field offices. In respect of non availability of records due to
old age cases, Zonal offices has been requested to constitute a committee to see if any action
can be taken at this stage.
The fact remains that the existing procedure for regularisation of transit and storage losses has
not shown any significant reduction in the pendency cases during the last five years indicating
lack of its effective implementation. Unless regularisation of losses is carried out in a time bound
manner by fixing responsibility, the accumulation of transit and storage loss cases would
continue to persist.
5.5.3 Regularisation of transit and storage losses in selected regional/district offices
(i) In Punjab region, storage losses amounting to ` 400.63 crore were regularized during the
period from 2006-07 to 2010-11 pertaining to the period from 1980-81 to 2010-11. Delay
in regularization of storage loss cases ranged from 1 year to 32 years which shows that
time frame fixed for regularization of transit and storage losses was not adhered to.
Storage losses of ` 0.46 crore were regularised without valid documents. The pendency at
Regional office level remained between ` 124.40 crore to ` 140.81 crore during 2006-07 to
2008-09. This sharply increased to ` 236.86 crore in 2010-11.
In selected district offices of Punjab region, namely, Amritsar, Ludhiana, Ferozepur and
Sangrur, pendency of storage losses (March 2011) was ` 3.60 crore, ` 25.05 crore, ` 30.58
crore and ` 15.01 crore respectively pertaining to period 1980-81 to 2010-11.
In RO Punjab, transit shortages amounting to ` 271.85 crore were recorded as recoverable
from staff in respect of IOGs received during 2001-02 to 2005-06. During 2009-10, transit
losses amounting to ` 4.25 crore in respect of IOGs upto 0.50 percent of loss in each case
was regularised without fixing responsibility. The balance recoverable from staff was `
267.60 crore, and RO Punjab failed to fix the responsibility though more than five years
have lapsed since the last IOG was received.
(ii) In Haryana region, storage losses aggregating 8297.61 MT involving ` 6.67 crore were still
pending regularization since 1995-96 onwards as on March 2011.

108
(iii) In West Bengal region, a total of storage and transit losses occurred was ` 702.14 crore.
Out of which losses to the extent of ` 567.68 crore were regularised and an amount of `
134.46 was pending regularisation (August 2011).
(iv) In Assam Region, regularization of storage and transit losses was achieved to the extent of
45 percent as against the target set during the last five years. As on March 31, 2011 transit
loss of 59401 LMT and storage loss of 21925 LMT valuing ` 28.07 crore and ` 9.05 crore
respectively were pending regularization. An amount of ` 59.83 crore of transit loss
pertaining to the years 1980-81 to 1990-91 was written off/regularized without valid
documents during 2006-07 to 2010-11. Storage loss amounting ` 6.43 crore pertaining to
the years 1980-81 to 1990-91 was also regularized without valid documents during the
same period. Storage losses amounting ` 7.81 crore were regularised without valid
documents pending investigation and fixation of responsibility in different DOs as under:
(a) In District Office Silchar, storage loss of ` 0.97 crore was pertaining to the year 1990-91 to
1995-96 were regularized by local management in July 2008.
(b) In District Office Jorhat, storage loss of ` 0.47 crore pertaining to the years 1980-81 to
1994-95 (wheat - ` 22.13 lakh + rice - ` 24.72 lakh) were regularized in September 2008.
(c) In District Office Guwahati, abnormal storage loss of ` 6.37 crore (1.52 percent to 2.53
percent) pertaining to the period 1980-81 to 1995-96 were regularized.
(v) In Bihar region, regularization of transit losses was achieved to the extent of 38 percent
against the target set during the five years. Cases involving of 3452.09 MT transit losses
valuing ` 18.32 crore were pending since 1980-81 to 2010-11. Out of which losses of ` 1.16
crore were pending for the want of records. Cases involving 0.23 LMT storage losses
valuing ` 10.16 crore were pending since 1980-81 to 2010-11 mainly due to abnormal
delay in investigation.
(vi) In Chhattisgarh region, out of the total loss of ` 68.75 crore, the Corporation has
regularized loss of ` 40.88 crore only till 2010-11. As on March 31, 2011, cases involving
storage losses of ` 27.87 crore were pending due to abnormal delays in investigation at
various levels. A review of write off/regularization of high storage losses revealed that in

109
30 cases involving loss of 3074 MT valued ` 2.73 crore, with loss percentages ranging
between 0.58 and 2.93 were regularized without conducting any investigation/taking any
disciplinary action against delinquent employees despite recommendation for
investigation/disciplinary action by the Regional Regularization Committee.
In DO Durg, a review of write off/regularization of high storage losses revealed that in 5
cases involving loss of 579 MT valued Rs 0.99 crore, with loss percentages ranging
between 0.58 and 1.14 were regularized without conducting any investigation/taking any
disciplinary action against delinquent employees.
In DO Raipur, a review of write off/regularization of high storage losses revealed that in
22 cases involving loss of 2344 MT valued ` 1.62 crore, with loss percentages ranging
between 0.619 and 2.930, were regularized without conducting any investigation/taking
any disciplinary action against delinquent employees.
Further, a review of write off/regularization of high storage losses relating to 20 paddy
cases and 3 rice cases involving loss of 7819.529 MT (paddy - 7309.701 MT plus rice
509.828 MT) valued ` 4.49 crore (paddy ` 4.47 crore plus rice ` 0.02 crore) with loss
percentage ranging between 0.657 and 6.740 were awaiting for investigation,
regularization, disciplinary action, write off etc.
In RO Raipur during 2006-07 to 2010-11, FCI incurred a loss of ` 4.85 crore on account of
transit loss of 0.046 LMT of food grains amounting to 0.56 percent of total stocks
received. As on March 31, 2011 cases involving loss of ` 3.23 crore were pending due to
abnormal delay in investigation at various levels.
Audit observed that Regional Office, Raipur had completely written off the transit
losses/shortages of ` 15.92 crore reported through IOGs by the end of 2009-10, on the
recommendations of district offices at Durg, Bilaspur and Raipur, without fixing
responsibility on delinquent officials.

110
Chapter 6: Internal Control
6.1 Internal audit and physical verification arrangement
6.1.1 Plan and actual internal audit conducted
6.1.1.1 An analysis of audit coverage revealed that on an average 529 units were selected per
year for internal audit during the last five years. Considering 1600 depots/169 district offices in
FCI, all the audits can be covered within a cycle of three years. However, the actual coverage
remained at an average of 403 units and showing a decreasing trend during 2009-11. While
audit coverage was in the range of 87 percent to 108 percent in the North Zone, in the East
Zone the coverage was only to the extent of 1.8 percent to 38 percent. This was followed by the
North East zone which recorded 17 percent to 60 percent. In West and South zones the audit
coverage ranged between 66 percent and 97 percent respectively (Annexure– XIII).
6.1.1.2 In respect of physical verification by internal audit, the coverage showed wide variation
amongst different zones. While in North zone, PV was done to the extent of 87 percent to 107
percent, it was only 0 percent to 34 percent in East zone and 17 percent to 60 percent in North
East zone. In South Zone, the coverage remained in the range of 66 percent to 97 percent and
in West Zone it was between 82 percent to 97 percent (Annexure–XIV).
6.1.2 Thus, on the whole the actual audit coverage as against the plan was between 68
percent and 86 percent during the last five years. In reply the management stated that due to
shortage of manpower the coverage against the planned targets have not been achieved and
the problems are being solved by recruiting new officers/officials.
6.1.3 Outstanding internal audit paras
The audit observed that 9102 numbers of internal audit paras having a value of ` 2,539.18 crore
were pending settlement as on 31 March 2011. The pendency of IA paras was high in North
Zone with minimum pendency in North East Zone. Outstanding paras of IA and money value
during the period 2006-07 to 2010-11 were as under:
Table 31: Outstanding paras of Internal Audit with money value
Zones/Region 2006-07 2007-08 2008-09 2009-10 2010-11
Total paras
Value
(` in
crore)
Total paras
Value
(` in
crore)
Total paras
Value
(` in
crore)
Total paras
Value
(` in
crore)
Total paras
Value
(` in
crore)
North Zone 6080 2619.98 4435 2567.12 3863 2106.70 4257 2138.99 4665 2178.10
East Zone 4676 621.83 3313 390.74 2496 287.88 2261 285.57 2337 282.79
North East Zone
2252 214.44 471 90.55 248 20.64 117 9.94 140 23.25
South Zone 1098 184.23 772 33.12 419 725.54 477 703.60 337 19.05
West Zone 1173 148.51 663 67.73 606 35.40 710 46.26 584 35.99

111
Hqrs 945 0 952 0 1004 0 1026 0.00 1039 0
Grand total 16224 3788.99 10606 3149.26 8636 3176.16 8866 3184.36 9102 2539.18
6.1.4 Outstanding paras on PV under IA
Audit observed that outstanding paras of PV with a value of ` 1,402 crore conducted by internal
audit were pending settlement at the end of 2010-11. The highest pendency of paras was in the
East Zone followed by North Zone as detailed below: Table 32: Zonal pendency of para
(` in crore)
Zones/Region 2006-07 2007-08 2008-09 2009-10 2010-11
North Zone 811 286 329 328 378
East Zone 1982 1395 959 881 876
North East Zone 617 20 15 4 10
South Zone 246 107 93 112 80
West Zone 341 60 61 55 58
Hqrs 0 0 0 0 0
Grand total 3997 1868 1457 1380 1402
Management stated that efforts are being made for settlement of PV paras by forming audit
committees.
6.1.5 Deficiencies were noticed in existing internal control in selected units as under:
(i) In Assam Region, out of 9 districts covering 41 depots, 11 depots were not selected for
PV for two to three years. Due to various systemic deficiencies, suspected mis-
appropriation of rice/wheat stock amounting to ` 3.88 crore was detected in seven
districts28 during the period under audit.
In DO Guwahati and DO Tihu, PV of the stock was done by the custodian himself, which
is in violation of the concept of “Custodian should not be verifier of stock” and the name
and designation of the PVO signing the report was not properly recorded which lacks
authenticity. As against 762 squad inspections planned, inspections were not conducted
in 89 depots. 60 vulnerable centres were identified and accordingly squads were
deputed in these centres.
(ii) In Bihar Region, except physical verification and internal audit done in Phulwarisharif
depot (DO Patna) during July/August 2009, no internal audit and physical verification of
stock was done during 2006-07 to 2010-11 in other depots of entire Bihar Region by the
28 DO Kokrajhar, DO Bongaigaon, DO Jorhat, DO Dibrugarh, DO Banderdeva, DO North Lakhimpur, DO Silchar, DO Tejpur.

112
IA&PV. Out of total 14 cases involving shortage of 26041.60 MT foodgrains worth ` 2.90
crore in Bihar region, 7 cases29 were in the depots under DO Patna. The identity of PVO
could not be ascertained from the PV reports of district office Muzzafarpur in 2009.
(iii) Out of 32 depots under West Bengal Region, internal audit wing did not conduct any
physical verification for last five years except in 4 depots in the year 2009-10. Further,
out of the total 20 district offices, 12 district offices were not audited for more than 4
years. The identity of PVO could not be ascertained from the APV report of district office
Burdwan for the year 2011. As against 788 squad inspections planned, inspections were
not conducted in 91 depots.
(iv) In Punjab Region, out of 629 depots planned for conducting internal audit, 117 depots
were not audited during the year 2006-11. Further, out of a total of 593 physical
inspections due of depots 151 inspections have not been carried out during the years
2006-07 to 2010-11. Further, a total of 74 number of shortages were detected, out of
which 64 cases have been investigated and the shortage has been written off
accordingly. As against 3110 squad inspections planned, inspections were not
conducted in 125 depots. 92 vulnerable centres were identified and accordingly squads
were deputed in these centres during the period under report.
(v) In Chhattisgarh Region, out of 113 internal audits (98 depots and 15 DOs) planned, 11
internal audits (8 depots and 3 DOs) were not conducted during the period 2006-11.
Further as against 98 depots planned during the period 2006-11, physical verification
was not conducted in 8 depots. In addition 103 paras of internal audit with a money
value of ` 3.24 crore were pending clearance as on 31 March 2011 as against the three
weeks period prescribed for furnishing the replies.
(vi) In Kerala Region, 121 paras of internal audit with a money value of ` 62.32 crore were
pending clearance as on 31 March 2011.
(vii) In Andhra Pradesh Region, out of 336 depots planned for conducting internal audit, 42
depots were not audited during the year 2006-11. Further, as against 171 depots
planned during the period 2006-11, physical verification was not conducted in 26
depots. In addition 79 paras of internal audit with money value of ` 0.88 crore were
pending clearance as on 31 March 2011 as against the three weeks period prescribed
29 FSD Mokama, FSD Phuwarisharif, PPC Dumraon, PPC Bihiya, PPC Chausa, FSD Buxar, SWC Bettiah

113
for furnishing the replies. 30 vulnerable centres were identified and accordingly squads
were deputed in these centres.
(viii) In Haryana Region, as against 2062 squad inspections planned, inspections were not
conducted in 13 depots.
6.1.6 PV under ISI method
In addition to PV conducted by IA& PV wing, FCI also conducted annual PV of stocks by 100
percent weighment of selected stacks of randomly selected depots by following the programme
developed by the Indian Statistical Institute (ISI). Under this method, PV is conducted in 10
percent of the FCI operated depots on annual basis and an average 78 depots out of 810 depots
and 354 stacks were covered under PV during the last five years. Moreover, FCI also conducted
PV quarterly and annual peripheral count of bags by an official other than the shed in-charge.
Audit observed that shortages noticed in respect of baby stacks and stacks in depots selected
by ISI method were accounted for. In the selected 8 regions30, the shortage in weighment and
bag shortages was 2030 MT and 1623 bags respectively during the last 3 years. However,
provision for shortages of bags noticed on peripheral count has not been made. In certain
cases, where the prescribed procedure count not be adhered to mainly on account of
operational constraints, book balances have been adopted as closing stock. The shortages were
accounted for at the time of killing of stacks.
6.1.7 Audit observed that the system of PV of stock followed by FCI was not commensurate
with size and nature of business as it did not ensure that all stock was physically verified over a
period of time and reconciled with the books of accounts. Moreover, PV under ISI method has
become more of a routine and an annual exercise with random selection rather than a surprise
check. The percentage of the stock physically verified to the total stock held in the entire FCI
depots was much lower than the coverage prescribed in the system of PV followed till May
2002.
Under the existing system, the role of FCI Headquarters was limited to selection of units on
random basis and there is no independent monitoring and follow up mechanism in the
implementation/execution of annual PV. There was inordinate delay in submission of PV
reports ranging from 2 days to 199 days from 18 regional offices out of 23 offices. Maximum
delays in submission of reports were from West Bengal, Uttarakhand, Punjab, Rajasthan,
Chhattisgarh, J&K and NEF Regions during the last three years.
6.2 Shortage of man power in internal audit wing
30 Chhattisgarh, Punjab, West Bengal, Bihar, Kerala, Assam, Haryana and Andhra Pradesh

114
Audit observed that there has been a shortfall of men power in the internal audit wings of FCI
to the extent of 63 percent in 2006-07 to 71 percent in 2010-11.There was an increasing
depletion of staff over the last five years as can be seen in the table below: Table 31: Men power position
Year Sanctioned strength Men-in-position Surplus/deficit
2006-07 398 148 250
2007-08 519 215 304
2008-09 493 163 330
2009-10 493 144 349
2010-11 451 131 320
6.2 From the above analysis, it is evident that functioning of internal control mechanism in
the form of internal audit and PV was largely inadequate. There has been persistent shortfall in
the audit coverage and follow up actions on large number of internal audit reports were
outstanding. A number of deficiencies were noticed in conduct of PV of stocks. While FCI
headquarters prepared audit plan for the whole zone/region, the actual implementation and
follow up action thereon was carried out at the regional and zonal level without direct
monitoring and supervision from the FCI headquarters.
Management stated that paras raised and settled were reviewed on a monthly basis region-
wise. Apart from that, gist of important paras was submitted by region on monthly basis to FCI
headquarters. Monitoring of observation made in IA&PV reports was done at zonal level.
However, audit observed that the role of FCI headquarters was limited to preparation of
tentative annual audit plan and it did not play any active role in the execution of the plan and its
follow up action was largely done at the Zonal/Regional level. Substantial shortfall in manpower
in internal audit wing has adversely affected the internal control system in FCI. Thus internal
audit activities on FCI lacked the required independence, required manpower and effective
follow up mechanism at the headquarter level.
Recommendation:
(i) FCI should review the internal control arrangement with a view to strengthen man
power shortages and to increase internal audit activities and coverage of PV stock.
(ii) FCI should consider strengthening supervision and control of FCI Headquarters over
internal audit and PV activities.

115
(John K. Sellate)
Principal Director of Commercial Audit &
ex-officio Member, Audit Board – IV, New Delhi

116
Annexure I
Statement showing Total procurement of wheat by FCI and State Government Agencies and taken over by FCI during the last five years
(Figures in LMT)
Particulars 2006-07 2007-08 2008-09 2009-10 2010-11
Foodgrains procured by
FCI
13.41 15.57 52.88 46.85 34.04
Foodgrains procured by
State Government
Agencies (SGAs)
78.88
(85
percent of
total)
95.88
(86 percent of
total)
174.01
(77 percent of
total)
206.97
(82 percent of
total)
191.11
(85 percent of
total)
Total 92.29 111.45 226.89 253.82 225.14
Stock taken over by FCI
from SGAs
72.19 78.45 97.75 141.58 174.68
Internal distribution 2.05 3.85 30.24 49.83 47.17
Balance stock with
State/Agencies
8.49 22.07 68.03 83.22 52.84
Source: FCI Budgets for the year 2008-09 to 2011-12

117
Annexure - II
As on Wheat Rice
Actual Minimum Surplus (+)/ Short (-)
Actual Minimum Surplus (+)/ Short (-)
1.4.2006 20.09 40.00 -19.91 136.75 122.00 14.75
1.7.2006 82.07 171.00 -88.93 111.43 98.00 13.43
1.10.2006 64.12 110.00 -45.88 59.70 52.00 7.70
1.1.2007 54.28 82.00 -27.72 119.77 118.00 1.77
1.4.2007 47.03 40.00 7.03 131.72 122.00 9.72
1.7.2007 129.26 171.00 -41.74 109.77 98.00 11.77
1.10.2007 101.21 110.00 -8.79 54.89 52.00 2.89
1.1.2008 77.12 82.00 -4.88 114.75 118.00 -3.25
1.4.2008 58.03 40.00 18.03 138.35 122.00 16.35
1.7.2008 249.12 201.00 48.12 112.49 98.00 14.49
1.10.2008 220.25 140.00 80.25 78.63 52.00 26.63
1.1.2009 182.12 112.00 70.12 175.76 138.00 37.76
1.4.2009 134.29 70.00 64.29 216.04 142.00 74.04
1.7.2009 329.22 201.00 128.22 196.16 118.00 78.16
1.10.2009 284.57 140.00 144.57 153.49 72.00 81.49
1.1.2010 230.92 112.00 118.92 243.53 138.00 105.53
1.4.2010 161.25 70.00 91.25 267.13 142.00 125.13
1.7.2010 335.84 201.00 134.84 242.66 118.00 124.66
1.10.2010 277.77 140.00 137.77 184.44 72.00 112.44
1.1.2011 215.40 112.00 103.40 255.80 138.00 117.80
As on Wheat Rice Wheat and rice actual
Wheat and rice minimum Actual Minimum Actual Minimum
1.4.2006 20.09 40.00 136.75 122.00 156.84 162
1.7.2006 82.07 171.00 111.43 98.00 193.5 269
1.10.2006 64.12 110.00 59.70 52.00 123.82 162
1.1.2007 54.28 82.00 119.77 118.00 174.05 200
1.4.2007 47.03 40.00 131.72 122.00 178.75 162
1.7.2007 129.26 171.00 109.77 98.00 239.03 269
1.10.2007 101.21 110.00 54.89 52.00 156.1 162
1.1.2008 77.12 82.00 114.75 118.00 191.87 200
1.4.2008 58.03 40.00 138.35 122.00 196.38 162
1.7.2008 249.12 201.00 112.49 98.00 361.61 299
1.10.2008 220.25 140.00 78.63 52.00 298.88 192
1.1.2009 182.12 112.00 175.76 138.00 357.88 250
1.4.2009 134.29 70.00 216.04 142.00 350.33 212
1.7.2009 329.22 201.00 196.16 118.00 525.38 319
1.10.2009 284.57 140.00 153.49 72.00 438.06 212
1.1.2010 230.92 112.00 243.53 138.00 474.45 250
1.4.2010 161.25 70.00 267.13 142.00 428.38 212
1.7.2010 335.84 201.00 242.66 118.00 578.5 319
1.10.2010 277.77 140.00 184.44 72.00 462.21 212
1.1.2011 215.40 112.00 255.80 138.00 471.2 250

118
Annexure – III
Total Statutory charges as percentage to MSP in different States
Wheat (`/quintal)
Year Punjab Haryana UP Rajasthan MP
2004-05 11.50 10.50 6.5 3.6 2.2
2005-06 11.50 10.50 6.5 3.6 2.2
2006-07 11.50 10.50 6.5 3.6 2.2
2007-08 11.50 10.50 9.00 3.5 4.52
2008-09 12.50 10.50 9.00 4.1 4.70
2009-10 12.50 10.50 7.50 3.60 3.20
2010-11 12.50 10.50 8.50 3.60 4.20
Paddy (`/quintal)
Year Punjab Haryana UP AP MP
2004-05 11.50 10.50 7.50 11.00 3.20
2005-06 11.50 10.50 7.50 11.00 3.20
2006-07 11.50 10.50 7.50 11.00 3.20
2007-08 11.50 10.50 8.00 11.50 3.70
2008-09 12.50 10.50 8.00 11.50 3.70
2009-10 12.50 10.50 9.00 12.50 4.70
2010-11 12.50 10.50 9.00 12.50 4.70
Source: Performance Budget FCI

119
Annexure IV
Statement showing the percentage of Statutory Charges to Acquisition cost during 2006-07 to 2010-11
Year Acquisition Cost
(` Per quintal)
Statutory Charges
(` Per quintal)
Percentage of Statutory Charges to Acquisition Cost
Average percent
Total Acquisition
cost (` in
crore)
Total Statutory
charges (` in
crore) Wheat Rice Wheat Rice Wheat Rice
2006-07 908.42 1101.60 122.81 136.17 13.52 12.36 12.94 32681.00 4228.92
2007-08 1067.32 1252.04 131.07 148.95 12.28 11.90 12.09 38279.00 4627.93
2008-09 1135.16 1459.97 136.52 162.47 12.03 11.13 11.58 40215.00 4656.90
2009-10 1224.24 1635.15 164.33 204.08 13.43 12.48 12.96 52904.00 6853.71
2010-11 1310.49 1784.88 197.55 255.78 15.07 14.33 14.70 67410.00 9909.27
Source: Annual Report FCI

120
Annexure - V
Non-statutory Charges to Acquisition cost during 2006-07 to 2010-11
Year Acquisition Cost
(` per quintal)
Non-statutory Charges
(` per quintal)
percentage of Non-statutory Charges to Acquisition Cost
Average percent
Total Acquisitio
n cost (` in
crore)
Total Non-statutory
charges (` in
crore)
Wheat Rice Wheat Rice Wheat Rice
2006-07 908.42 1101.60 57.34 61.65 6.31 5.60 5.96 32681 1948
2007-08 1067.32 1252.04 32.95 71.55 3.09 5.71 4.40 38279 1684
2008-09 1135.16 1459.97 43.10 73.26 3.80 5.02 4.41 40215 1773
2009-10 1224.24 1635.15 42.55 86.33 3.48 5.28 4.38 52904 2317
2010-11 1310.49 1784.88 49.92 93.17 3.81 5.22 4.52 67410 3047
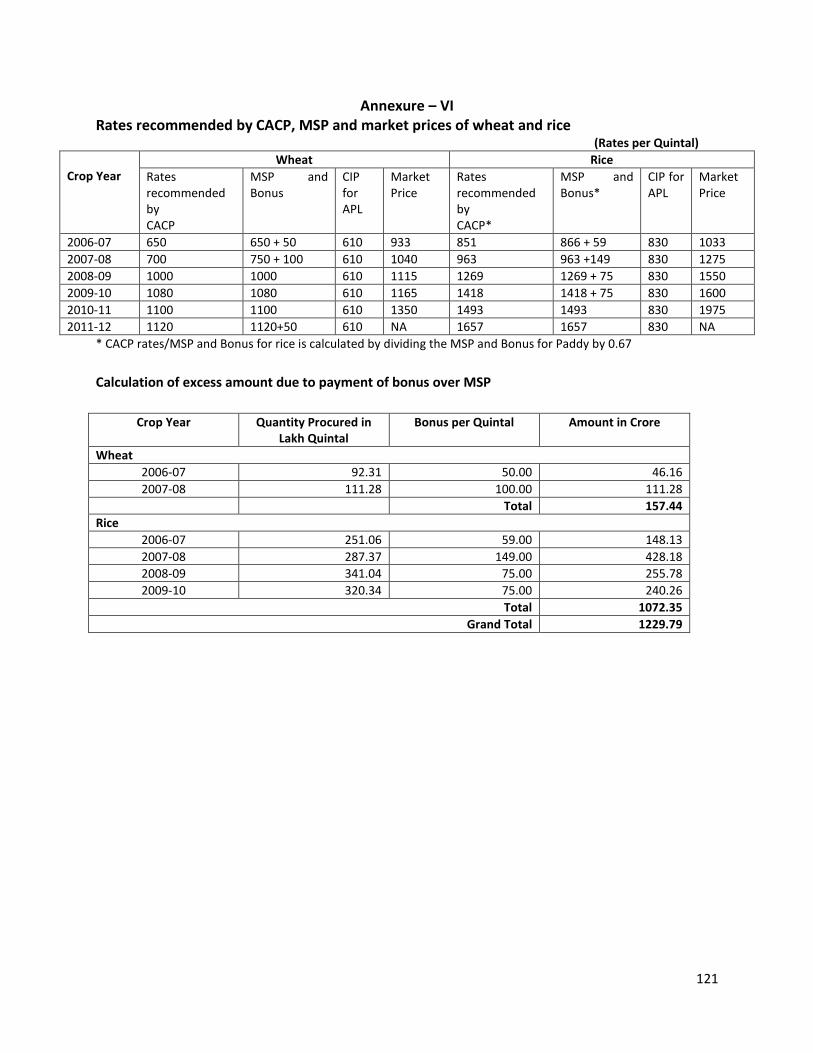
121
Annexure – VI Rates recommended by CACP, MSP and market prices of wheat and rice
(Rates per Quintal)
Crop Year
Wheat Rice
Rates recommended by CACP
MSP and Bonus
CIP for APL
Market Price
Rates recommended by CACP*
MSP and Bonus*
CIP for APL
Market Price
2006-07 650 650 + 50 610 933 851 866 + 59 830 1033
2007-08 700 750 + 100 610 1040 963 963 +149 830 1275
2008-09 1000 1000 610 1115 1269 1269 + 75 830 1550
2009-10 1080 1080 610 1165 1418 1418 + 75 830 1600
2010-11 1100 1100 610 1350 1493 1493 830 1975
2011-12 1120 1120+50 610 NA 1657 1657 830 NA
* CACP rates/MSP and Bonus for rice is calculated by dividing the MSP and Bonus for Paddy by 0.67
Calculation of excess amount due to payment of bonus over MSP
Crop Year Quantity Procured in Lakh Quintal
Bonus per Quintal Amount in Crore
Wheat
2006-07 92.31 50.00 46.16
2007-08 111.28 100.00 111.28
Total 157.44
Rice
2006-07 251.06 59.00 148.13
2007-08 287.37 149.00 428.18
2008-09 341.04 75.00 255.78
2009-10 320.34 75.00 240.26
Total 1072.35
Grand Total 1229.79

122
Annexure – VII
Capacity available against foodgrains requirement of 4 month
Sl. No.
State Capacity available to meet foodgrain requirement for number of days
2006-07 2007-08 2008-09 2009-10 2010-11
1 Bihar 42 56 57 51 54
2 Jharkand 33 38 36 28 25
3 Orissa 83 112 103 93 77
4 West Bengal 61 110 107 83 77
5 Sikkim 78 83 73 73 66
6 Assam 48 58 59 50 39
7 Arunachal Pradesh 57 51 63 53 61
8 Meghalaya 64 66 67 50 39
9 Mizoram 74 41 37 42 38
10 Tripura 37 47 46 47 45
11 Manipur 49 63 24 45 35
12 Nagaland 68 72 55 59 58
13 Delhi 155 173 196 147 128
14 Haryana 863 1469 1165 712 876
15 Himachal Pradesh 19 19 17 13 12
16 Jammu & Kashmir 48 52 54 45 40
17 Punjab 2638 6904 3032 1343 1955
18 Chandigarh 1210 6960 1368 1050 1480
19 Rajasthan 118 214 205 152 190
20 Uttar Pradesh 99 170 163 114 107
21 Uttaranchal 106 146 102 130 117
22 Andhra Pradesh 279 302 296 244 260
23 Kerala 81 150 144 111 94
24 Karnataka 63 72 83 111 94
25 Tamil Nadu 51 53 66 68 62
26 Pondicherry 207 283 405 259 272
27 Gujarat 82 163 162 113 101
28 Maharashtra 102 179 155 111 114
29 Goa 51 150 106 82 58
30 Madhya Pradesh 61 95 81 76 92
31 Chhattisgarh 250 472 213 168 184

123
Annexure VIII
Utilization of storage capacity (monthly basis) in selected 12 States
Sr. No. Name of State Utilization of Storage Capacity (range in percentage)
No. of months where Storage Capacity Utilization( in Percentage)
Up to 50 percent
50 percent
to 75 percent
75 percent
to 80 percent
80 percent
to 85 percent
85 percent
to 90 percent
90 percent or more
1 Assam 29.02 to 86.12 18 36 2 3 1 0
2 Arunachal Pradesh
11.11 to 80.00 35 22 3 0 0 0
3 Meghalaya 15.38 to 103.45 19 24 4 7 5 1
4 Mizoram 13.04 to 86.96 35 20 3 1 1 0
5 Tripura 22.50 to 93.88 22 27 9 0 0 2
6 Manipur 10.00 to 105 40 10 0 3 2 5
7 Nagaland 16.67 to 106.06 17 14 7 5 4 13
8 J&K 40.17 to 106.98 3 42 6 5 0 4
9 Punjab 25.63 to 97.16 15 21 10 5 2 7
10 Haryana 28.73 to 99.09 9 25 6 5 5 10
11 Rajasthan 22.76 to 111.04 25 9 3 0 3 20
12 Maharashtra 13.78 to 79.00 27 18 15 0 0 0

124
Annexure - IX
Utilisation of storage capacity on turnover basis (offtake of foodgrains)
Analysis of annual effective storage on the basis of annual off take during 2006-07 to 2010-11
2006-07
Sr. No. Name of Region
Storage Capacity (LMT)
Annual Storage capacity
Annual Off take (LMT)
Percentage of Annual offtake to Annual Storage Capacity
1 Pondicherry 0.52 6.24 0.22 3.53
2 Bihar 5.20 62.40 12.81 20.53
3 Gujarat 5.91 70.92 10.10 14.24
4 Goa 0.15 1.80 0.28 15.56
5 Arunachal Pradesh 0.18 2.16 0.63 29.17
6 Maharashtra 16.20 194.40 29.15 14.99
7 Jharkhand 1.23 14.76 8.62 58.40
8 West Bengal 10.01 120.12 26.90 22.39
9 Uttaranchal 1.60 19.20 3.42 17.81
10 Uttar Pradesh 25.21 302.52 47.32 15.64
11 Manipur 0.22 2.64 0.97 36.74
12 Karnataka 5.90 70.80 26.00 36.72
13 Delhi 3.70 44.40 6.33 14.26
2007-08
1 Pondicherry 0.54 6.48 0.24 3.70
2 Bihar 5.31 63.72 19.08 29.94
3 Gujarat 5.63 67.56 10.36 15.33
4 Goa 0.15 1.80 0.32 17.78
5 Arunachal Pradesh 0.20 2.40 0.87 36.25
6 Maharashtra 15.72 188.64 27.73 14.70
7 Jharkhand 1.20 14.40 9.07 62.99
8 West Bengal 10.01 120.12 27.12 22.58
9 Uttaranchal 1.28 15.36 3.47 22.59
10 Uttar Pradesh 25.05 300.60 47.05 15.65
11 Manipur 0.20 2.40 1.12 46.67
12 Karnataka 5.71 68.52 21.90 31.96
13 Delhi 3.70 44.40 7.27 16.37
2008-09
1 Pondicherry 0.54 6.48 0.28 4.32
2 Bihar 5.62 67.44 18.13 26.88
3 Gujarat 6.30 75.60 10.34 13.68
4 Goa 0.15 1.80 0.39 21.67
5 Arunachal Pradesh 0.20 2.40 0.92 38.33

125
6 Maharashtra 17.69 212.28 30.68 14.45
7 Jharkhand 1.18 14.16 9.63 68.01
8 West Bengal 10.28 123.36 29.50 23.91
9 Uttaranchal 2.10 25.20 3.79 15.04
10 Uttar Pradesh 26.13 313.56 47.77 15.23
11 Manipur 0.20 2.40 2.84 118.33
12 Karnataka 7.07 84.84 23.21 27.36
13 Delhi 3.70 44.40 7.80 17.57
2009-10
1 Pondicherry 0.59 7.08 0.37 5.23
2 Bihar 6.72 80.64 25.17 31.21
3 Gujarat 6.80 81.60 12.28 15.05
4 Goa 0.15 1.80 0.56 31.11
5 Arunachal Pradesh 0.22 2.64 1.00 37.88
6 Maharashtra 19.98 239.76 40.85 17.04
7 Jharkhand 1.19 14.28 11.42 79.97
8 West Bengal 11.06 132.72 36.69 27.64
9 Uttaranchal 2.37 28.44 5.28 18.57
10 Uttar Pradesh 26.87 322.44 70.33 21.81
11 Manipur 0.20 2.40 1.44 60.00
12 Karnataka 8.37 100.44 27.47 27.35
13 Delhi 3.67 44.04 8.92 20.25
2010-11
1 Pondicherry 0.64 7.68 0.59 7.68
2 Bihar 6.98 83.76 33.70 40.23
3 Gujarat 7.03 84.36 18.25 21.63
4 Goa 0.15 1.80 0.73 40.56
5 Arunachal Pradesh 0.23 2.76 0.99 35.87
6 Maharashtra 21.13 253.56 44.10 17.39
7 Jharkhand 1.34 16.08 11.94 74.25
8 West Bengal 11.10 133.20 39.95 29.99
9 Uttaranchal 2.36 28.32 5.03 17.76
10 Uttar Pradesh 37.44 449.28 74.56 16.60
11 Manipur 0.21 2.52 0.88 34.92
12 Karnataka 8.38 100.56 26.87 26.72
13 Delhi 3.67 44.04 9.58 21.75

126
Annexure – X
Capacity augmented through BOO
Circuit – I Circuit – II
Location Storage Size (MT)
Location Storage Size (MT)
Base depot Moga (Punjab) 2,00,000 Base depot Kaithal (Haryana) 2,00,000
Field depot Field depot
Chennai (Tamilnadu) 25,000 Navi Mumbai (Maharashtra) 50,000
Coimbatore (Tamilnadu) 25,000 Hooghly (West Bengal) 25,000
Bangalore (Karnataka) 25,000 ------ -------
Total 2,75,000 Total 2,75,000

127
Annexure – XI
Capacity finalized under PEG scheme with dates
S. No. Name Of State Storage capacity Finalized
Date Of Finalization
Actual Storage Capacity Added as on 31st March 2011
1 A.P 36,000 30.04.2009 1,91,000 26.07.2010
3,29,000 05.08.2010
2 Bihar 300000 22.05.2009
3
Chhattisgarh 217000 03.03.2011 5000
5000 22.05.2009
4 Gujarat 45000 22.05.2009
307000 22.05.2009
5 Haryana 3880000 12.06.2009 27500
6 Himachal Pradesh 142550 22.06.2009
7 Jammu & Kashmir 361690 22.06.2009
8 Jharkhand 175000 22.05.2009
9 Kerala 15000 30.04.2009
10 Karnataka 100000 30.04.2009
105000 22.01.2010
431000 14.09.2010
11 Madhya Pradesh 140000 24.09.2010
295000 14.09.2010
12 Maharashtra 99500 22.05.2009 27020
705000 30.08.2010
10000 06.09.2010
15000 03.03.2011
13 Odisha 300000 26.07.2010
14 Punjab 5125000 12.06.2009 140600
15 Rajasthan 260000 06.09.2010
16 Tamil Nadu 30000 12.06.2009
315000 25.05.2009
17 Uttar Pradesh 1533000 02.08.2010
1148000 06.09.2010
18 Uttarakhand 25000 01.06.2010
19 West Bengal 156000 26.07.2010
Total 16797340* 200120
*Out of 167.97 Lakh MT, 15 MT is not to be constructed. So 152.97 Lakh MT is the final space to be
constructed

128
Annexure - XII
Region wise storage loss occurred during 2006-07 to 2010-11
Commodity: Wheat
(Quantity in MT, Value ` in crore)
Sl No.
FCI Regions
Particulars Year
2006-07 2007-08 2008-09 2009-10 2010-11*
1 Punjab
Quantity Loss -11174 -12148 -20415 -17888 -11534
Percent of Loss -0.19 -0.21 -0.29 -0.17 -0.96
Value -10.39 -12.07 -23.16 -21.94 -15.12
2 Haryana
Quantity Loss -8883 -11885 -17353 -10483 -11808
Percent of Loss -0.41 -0.42 -0.53 -0.20 -1.13
Value -8.26 -11.67 -19.68 -12.86 -15.47
3 Uttar Pradesh
Quantity Loss -1207 -3302 -5936 -6351 -8013
Percent of Loss -0.08 -0.19 -0.43 -0.64 -0.66
Value -1.12 -3.24 -6.75 -7.79 -10.50
4 Uttarakhand
Quantity Loss -257 -177 -670 -478 -319
Percent of Loss -0.14 -0.11 -0.29 -0.20 -0.37
Value -0.24 -0.17 -0.76 -0.59 -0.42
5 Rajasthan
Quantity Loss -521 -2262 -6170 -2870 -5753
Percent of Loss -0.04 -0.13 -0.27 -0.10 -0.28
Value -0.48 -1.90 -6.94 -3.52 -7.54
6 Delhi
Quantity Loss -291 -345 -322 304 -547
Percent of Loss -0.06 -0.07 -0.05 0.04 -0.09
Value -0.27 -0.34 -0.37 0.37 -0.72
7 Jammu & Kashmir
Quantity Loss -41 -14 66 92 29
Percent of Loss -0.01 0.00 2.02 0.02 0.01
Value -0.04 -0.01 0.08 0.11 0.04
8 Himachal Pradesh
Quantity Loss -116 -137 -169 -112 -254
Percent of Loss -0.06 -0.06 -0.06 -0.04 -0.07
Value -0.11 -0.13 -0.19 -0.14 -0.33
9 Assam
Quantity Loss 75 74 74 140 236
Percent of Loss 0.03 0.03 0.02 0.04 0.09
Value 0.07 0.07 0.08 0.17 0.31
10 NE Region
Quantity Loss -30 -38 -1 16 3
Percent of Loss -0.07 -0.08 0.00 -0.02 0.27
Value -0.03 -0.04 0.00 -0.02 0.00
11 N&M Region
Quantity Loss -2 1 12 7 8
Percent of Loss 0.00 0.00 0.02 0.01 0.09
Value 0.00 0.00 0.01 0.01 0.01
12 Bihar
Quantity Loss 185 406 972 882 1613
Percent of Loss 0.03 0.05 0.10 0.08 0.28
Value 0.17 0.38 1.11 1.08 2.11
13 Jharkhand
Quantity Loss 254 268 246 372 354
Percent of Loss 0.08 0.09 0.08 0.10 0.27
Value 0.24 0.28 0.28 0.46 0.46

129
14 Orissa
Quantity Loss 16 42 143 367 439
Percent of Loss 0.01 0.02 0.05 0.06 0.11
Value 0.01 0.04 0.16 0.45 0.58
15 West Bengal
Quantity Loss 247 310 1232 2000 3417
Percent of Loss 0.02 0.02 0.06 0.08 0.17
Value 0.23 0.34 1.40 2.45 4.55
16 Madhya Pradesh
Quantity Loss 1419 5140 -592 106 456
Percent of Loss 0.07 0.25 -0.06 0.01 0.04
Value 1.32 6.57 -0.51 0.13 0.60
17 Chhattisgarh
Quantity Loss -172 15 -51 30 -131
Percent of Loss -0.16 0.04 -0.11 0.01 -0.07
Value -0.16 0.02 -0.06 0.04 -0.17
18 Maharashtra
Quantity Loss 1594 3520 1803 2780 3154
Percent of Loss 0.10 0.24 0.11 0.12 0.12
Value 1.48 4.27 2.06 3.41 4.13
19 Gujarat
Quantity Loss -890 1122 1272 2382 2246
Percent of Loss -0.02 0.05 0.15 0.27 0.15
Value -0.83 1.46 1.61 3.00 2.94
20 Andhra Pradesh
Quantity Loss -323 -196 -142 -85 -556
Percent of Loss -0.05 -0.13 -0.09 -0.05 -0.21
Value -0.30 -0.26 -0.16 -0.10 -0.73
21 Karnataka
Quantity Loss -399 -227 -989 -335 -791
Percent of Loss -0.12 -0.07 -0.22 -0.06 -0.15
Value -0.37 -0.24 -1.13 -0.41 -1.04
22 Kerala
Quantity Loss -957 -651 -1274 -1329 -1440
Percent of Loss -0.25 -0.21 -0.39 -0.39 -0.35
Value -0.89 -0.76 -1.46 -1.63 -1.89
23 Tamil Nadu
Quantity Loss -2855 -413 -310 -347 -287
Percent of Loss -0.32 -0.27 -0.10 -0.09 -0.09
Value -2.66 -0.52 -0.35 -0.43 -0.38
(-) figures indicate Storage Gain and positive figures indicate Storage Loss
*Provisional figures
Commodity: Rice
(Quantity in MT, Value ` in crore)
Sl No.
FCI Regions
Particulars Year
2006-07 2007-08 2008-09 2009-10 2010-11*
1 Punjab
Quantity Loss 70611 69401 41979 71999 91818
Percent of Loss 0.85 0.80 0.70 1.03 1.43
Value 78.59 87.89 59.49 119.89 163.88
2 Haryana
Quantity Loss 4806 5025 3736 8202 14109
Percent of Loss 0.24 0.29 0.28 0.66 0.79
Value 5.35 6.37 5.56 13.71 25.18
3 Uttar Pradesh
Quantity Loss 3533 4305 4571 3713 13750
Percent of Loss 0.51 0.34 0.42 1.22 1.42
Value 3.93 5.35 6.65 5.91 24.54
4 Uttarakhand Quantity Loss 553 821 808 2584 1861

130
Percent of Loss 0.42 0.53 0.63 1.35 0.76
Value 0.62 1.01 0.42 4.32 2.32
5 Rajasthan
Quantity Loss 726 619 419 379 297
Percent of Loss 0.44 0.29 0.51 0.69 0.35
Value 0.81 0.78 0.62 0.62 0.53
6 Delhi
Quantity Loss 641 635 325 384 314
Percent of Loss 0.39 0.28 0.21 0.24 0.21
Value 0.71 0.81 0.48 0.64 0.56
7 Jammu & Kashmir
Quantity Loss 188 71 80 114 77
Percent of Loss 0.02 0.01 0.01 0.01 0.01
Value 0.21 0.09 0.12 0.19 0.14
8 Himachal Pradesh
Quantity Loss 11 10 10 16 10
Percent of Loss 0.00 0.00 0.00 0.01 0.00
Value 0.01 0.01 0.01 0.03 0.02
9 Assam
Quantity Loss 3011 2172 2120 2041 1710
Percent of Loss 0.16 0.14 0.14 0.12 0.11
Value 3.35 2.74 3.08 3.39 3.05
10 NE Region
Quantity Loss 486 1256 664 550 438
Percent of Loss 0.08 0.20 0.10 0.08 0.17
Value 0.54 1.57 0.99 0.91 0.78
11 N&M Region
Quantity Loss 367 558 253 281 285
Percent of Loss 0.11 0.17 0.09 0.08 0.25
Value 0.41 0.69 0.38 0.47 0.51
12 Bihar
Quantity Loss 2368 1833 1361 2982 2269
Percent of Loss 0.21 0.11 0.08 0.14 0.29
Value 2.64 2.09 1.94 4.61 4.05
13 Jharkhand
Quantity Loss 588 427 959 1177 1427
Percent of Loss 0.10 0.07 0.14 0.15 0.24
Value 0.65 0.52 1.39 1.86 2.55
14 Orissa
Quantity Loss 4576 4497 4364 5476 3545
Percent of Loss 0.17 0.21 0.25 0.33 0.41
Value 5.09 5.34 6.07 8.49 6.33
15 West Bengal
Quantity Loss 3240 2719 3481 8397 5873
% of Loss 0.20 0.22 0.30 0.73 0.57
Value 3.61 3.37 4.96 13.11 10.48
16 Madhya Pradesh
Quantity Loss 2737 2769 2079 2731 1893
Percent of Loss 0.36 0.36 0.42 0.88 0.49
Value 3.05 3.47 3.08 4.31 3.38
17 Chhattisgarh
Quantity Loss 24416 28999 7175 11339 7026
Percent of Loss 0.78 0.92 0.36 0.51 0.36
Value 27.18 35.63 10.56 18.75 12.54
18 Maharashtra
Quantity Loss 5128 5900 6083 5266 5982
Percent of Loss 0.33 0.36 0.38 0.27 0.31
Value 5.71 7.44 9.04 8.60 10.68
19 Gujarat
Quantity Loss 3011 1843 2112 1573 1623
Percent of Loss 0.68 0.37 0.59 0.43 0.37
Value 3.35 2.33 3.12 2.62 2.90
20 Andhra Pradesh
Quantity Loss 15292 14041 14575 20577 19588
Percent of Loss 0.22 0.17 0.15 0.22 0.21
Value 17.02 17.61 21.78 33.72 34.96

131
21 Karnataka
Quantity Loss 4855 6121 3486 3816 3952
Percent of Loss 0.21 0.32 0.18 0.17 0.18
Value 5.40 7.74 5.11 6.33 7.05
22 Kerala
Quantity Loss 709 493 1751 1279 1388
Percent of Loss 0.10 0.06 0.21 0.15 0.12
Value 0.79 0.63 2.68 2.11 2.48
23 Tamil Nadu
Quantity Loss 6616 5458 5020 6972 5829
Percent of Loss 0.25 0.17 0.18 0.22 0.22
Value 7.36 6.88 7.43 11.51 10.40
*Provisional figures

132
ANNEXURE – XIII
Depots planned for internal audit vis-à-vis depots actually audited
Year 2006-07 2007-08 2008-09 2009-10 2010-11
Zone Plan Actual Percent Plan Actual Percent Plan Actual Percent Plan Actual Percent Plan Actual Percen
t
North 297 269 90 271 251 92 272 254 94 244 212 87 177 192 108
East 47 18 38 101 15 15 56 1 1.8 87 3 3.4 87 10 11
NE 20 12 60 18 3 17 28 7 25 29 6 21 31 11 35
South 93 84 90 90 87 97 95 76 80 89 67 75 105 69 66
West 83 81 96 82 77 94 80 75 94 79 69 87 82 68 83
Total 540 464 86 562 433 77 531 413 77 528 357 68 482 350 72
Source: (IA & PV division)

133
ANNEXURE - XIV
Physical Verification planned for internal audit vis-à-vis depots actually verified
zone 2006-07 2007-08 2008-09 2009-10 2010-11
Plan Actual Percent Plan Actual Percent Plan Actual Percent Plan Actual Percent Plan Actual Percent
north 294 266 90.48 269 250 92.94 269 251 93.31 243 211 86.83 177 190 107.34
east 47 16 34.04 101 15 14.85 56 0 0.00 87 7 8.05 87 10 11.49
NE 20 12 60.00 18 3 16.67 28 7 25.00 29 6 20.69 31 11 35.48
South 93 84 90.32 90 87 96.67 95 76 80.00 89 67 75.28 105 69 65.71
West 83 81 97.59 83 78 93.98 79 73 92.41 79 70 88.61 83 68 81.93
total 537 459 85.47 561 433 77.18 527 407 77.23 527 361 68.50 483 348 72.05
-