draft rhode island 2017 annual monitoring …dem.ri.gov/programs/air/documents/airnet17d.pdfdraft...
TRANSCRIPT

STATE OF RHODE ISLAND AND PROVIDENCE PLANTATIONS
DEPARTMENT OF ENVIRONMENTAL MANAGEMENT OFFICE OF AIR RESOURCES
Draft Rhode Island 2017 Annual Monitoring Network Plan
Posted for Public Review on June 1, 2017
Submitted to the EPA on July XX, 2017

3
Table of Contents
Section ____ Page Number Table of Contents.............................................................................................................................3 List of Tables ..................................................................................................................................3 Acronyms and Abbreviations..........................................................................................................4 Regulatory Background……………………..……….....................................................................5 Rhode Island Monitoring Network………......................................................................................5 Summary of Proposed Changes in Rhode Island Monitoring Network………………….....…….7 Network Evaluation………………………………..…….............................................................13
Ozone ................................................................................................................................13 Carbon monoxide...............................................................................................................15 Sulfur Dioxide ..................................................................................................................17 Nitrogen Dioxide...............................................................................................................19 Particular Matter................................................................................................................21
-PM10 ...................................................................................................................21 -PM2.5………………………………………………….......................................23
Speciation Monitoring.......................................................................................................25 Lead (Pb)……………………………………………………………………….………...25 Ozone Precursor Air Toxics Measurements…………………………………….……….27
-PAMS………………………………………………………………….………..27 - PAMS Monitoring Implementation Network Plan…………………………….29 -Air Toxics………………………………………………………………….…....33
National Core (NCore) Multi-pollutant Monitoring Stations Network………....……….34 Figure 1 – Air Quality Monitoring Network Continuous Gas Monitors Site Locations…….…..44 Figure 2 – PM10 Air Pollution Monitoring Network Site Locations……………………….…...45 Figure 3 – PM2.5 Air Pollution Monitoring Network Site Locations………………….………..46 Figure 4 – Air Toxics Air Pollution Monitoring Network Site Locations………………….…....47 Figure 5 – RI Monitoring Network……………………………………………………………....48
List of Tables Section Page Number Table 1-National Ambient Air Quality Standards (NAAQS)…...………………………………..8 Table 2-Monitoring Network Summary….……………………………………………………...10 Table 3- Monitoring Sites……………………………………………………………………..…11 Table 4-RI Ozone Monitoring Sites……………………………………………………………...13 Table 5-Ozone Design Values (ppb)……………………………………………………………..14 Table 6-Carbon Monoxide Monitoring Network………………………………………………...15 Table 7-Sulfur Dioxide Monitoring Network………………………………………………...….17 Table 8a-Nitrogen Dioxide Monitoring Network………………………………………………..19 Table 8b-2013 Nitrogen Dioxide Levels at Brown and East Providence Sites………………….20 Table 9-PM10 Monitoring Network……………………………………………………………..21 Table 10-PM2.5 Monitoring Network……………………………………………………….......23 Table 11-Lead Monitoring Network…………………………………………….……….............26 Table 12-PAMS Target Compound List……...…………………………………………...……..31 Table 13- Equipment Inventory East Providence for PAMS Plan………………………………32

4
Acronyms and Abbreviations
AIRS-AQS Aerometric Information Retrieval System - Air Quality System AQI Air Quality Index BAM Beta Attenuation Monitor CAA Clean Air Act CFR Code of Federal Regulations CO Carbon Monoxide DEM Department of Environmental Management (RI) DOH Department of Health (RI) EIS Emissions Inventory System EMP Enhanced Monitoring Plan EPA Environmental Protection Agency FEM Federal equivalent method FRM Federal reference method GC Gas chromatograph HAPs Hazardous air pollutants MADEP Massachusetts Department of Environmental Protection MDL Method detection limit MSA Metropolitan statistical area NAAQS National Ambient Air Quality Standards NAMS National Air Monitoring Station NATTS National Air Toxics Trends Station NCore National Core Multi-pollutant Monitoring Stations Networks NO2 Nitrogen dioxide NOx Nitrogen oxides OAQPS Office of Air Quality Planning and Standards ORD Office of Research and Development OTR Ozone Transport Region PAMS Photochemical Assessment Monitoring Stations PAH Polycyclic Aromatic Hydrocarbon PM10 Particulate matter < 10 microns PM2.5 Particulate matter < 2.5 microns QAPP Quality assurance project plan O3 Ozone SIPs State implementation plans SLAMS State and Local Air Monitoring Station SOP Standard operating procedure SO2 Sulfur dioxide STN Speciation Trends Network SVOC Semi-Volatile Compound TSA Technical system audit TSP Total suspended particulate VOC Volatile organic compound
5
Introduction and Regulatory Background This document will serve as Rhode Island’s 2017 Annual Monitoring Network Plan, prepared by the Rhode Island Department of Environmental Management, in accordance with Section 58.10(a) of Title 40 of the Code of Federal Regulations (40 CFR 58.10(a)) requires states to submit a monitoring network plan to the United States Environmental Protection Agency (EPA) in July of each year. The plan provides a description of the state’s current monitoring network, demonstrates that the network conforms to EPA requirements, and discusses any plans to remove or move a monitoring station in the 18 months following the plan submittal.
In addition, the recently revised monitoring rule (80 FR 65292; October 26, 2015) requires PAMS measurements June 1 through August 31 at NCore sites that are located in Core-Based Statistical Areas (CBSAs) with populations of 1,000,000 or more. The Providence, New Bedford, Fall River, RI-MA Statistical Area qualifies as one of those sites. RIDEM is required to develop an implementation plan for this monitoring rule. That implementation plan is detailed within this monitoring plan. The Annual Monitoring Network Plan must be posted for public comment 30 days prior to submittal to the EPA.
Rhode Island Monitoring Network The Rhode Island Department of Environmental Management (RI DEM), in conjunction with the Rhode Island Department of Health (RI DOH), operates a network of air monitoring stations to measure ambient concentrations of pollutants for which the EPA has established a National Ambient Air Quality Standard (NAAQS). Those pollutants, which are known as criteria pollutants, include ozone (O3), particulate matter smaller than 10 microns (PM10), particulate matter smaller than 2.5 microns (PM2.5), nitrogen dioxide (NO2), sulfur dioxide (SO2), carbon monoxide (CO) and lead. The criteria pollutant monitoring sites are part of the EPA’s State or Local Air Monitoring Stations network (SLAMS). In addition, RI DEM and RI DOH monitor ambient levels of toxic air pollutants and of ozone precursors, which are substances that react in the atmosphere to form ground-level ozone. The State operates one monitoring site that is part of the National Air Toxics Trends Sites (NATTS) network, one that is part of the Photochemical Assessment Monitoring Stations (PAMS) network, one that is part of the PM2.5 Speciation Trends Network (STN) and one that is part of the network of core multipollutant monitoring stations (NCore). Table 1 summarizes the NAAQS and Table 2 lists the locations of the eight air monitoring stations that operated in the State in 2016 or are currently operating, along with the parameters monitored and monitoring methods used at each of the sites. Table 3 lists the sites as well as the methods used. The locations of those sites are shown in Figures 1-4. All of these sites have been approved by EPA Region 1 as meeting applicable siting criteria, as specified in Subpart B of 40 CFR Part 58. All criteria pollutants are monitored, as required in the CFR, using Federal Reference Methods (FRMs) or Federal Equivalent Methods (FEMs) and monitors are operated according to the procedures specified in Quality Assurance Project Plans (QAPPs) that have been approved by EPA.1 All sites are located in the Providence-New Bedford-Fall River, RI-MA

6
Metropolitan Statistical Area (MSA), which encompasses all of Rhode Island as well as Bristol County in Massachusetts. _____________________________________ 1RI DEM and RI DOH, “QAPP for Criteria Pollutants Including Particulates and NCore Parameters, Revision 10.0,” approved by EPA December 5, 2012 and “QAPP: Air Toxics and PAMS Monitoring Programs, Revision 4.1,” approved by EPA December 5, 2012.

7
Summary of Proposed Changes in the Rhode Island Monitoring Network In summary, RI DEM plans to modify the current monitoring network as follows:
• When the Urban League building becomes unavailable, or sooner, RI DEM will move the PM2.5 FEM monitor and NATTS monitoring activities at that site to the proposed Community College of Rhode Island (CCRI) location.
• RIDEM will cease all monitoring at the Brown University site as of December 31, 2017.
• When necessitated by the progression of highway construction activity to the north side
of I-95, RI DEM will discontinue monitoring at the Near-Road site and will ask EPA’s approval of future Near-Road monitoring plans for Rhode Island. Work on the north side of the highway is currently scheduled to begin in spring of 2017 or later.
• At this time, we are requesting to modify the State’s PM10 network and discontinue operation of the Alton Jones site as of December 31, 2017, due to budgetary constraints and will seek EPA approval.
• RIDEM will continue to operate the PM2.5 FRM along with the PM2.5 FEM at the Alton Jones, West Greenwich site for information purposes, but will no longer designate it as a collocated monitor. The FEM will be the primary monitor. As of December 31, 2017, Rhode Island is requesting to discontinue the PM2.5 FRM at the Alton Jones West Greenwich site.
• Due to logistical limitations at the proposed CCRI site, RI is requesting discontinuation of FRM PM2.5 sampling at the Urban League site or its replacement site at CCRI. The FEM PM2.5 monitoring will be maintained and would serve as the only PM2.5 monitor at this, or the new location.
• RI DEM has purchased a continuous GC and will employ that instrument at the East Providence site for measuring one-hour speciated VOCs and plans to begin monitoring June 2017. This monitor will be used for the PAMS program.
• RI DEM will implement the revised PAMS requirements as promulgated in the final ozone NAAQS, including the possible expansion of carbonyl monitoring.
RI DEM understands that all network modifications that involve discontinuation or moving of any sites are subject to EPA approval, even if the remaining network meets EPA’s minimum requirements.

8
Table 1 National Ambient Air Quality Standards (NAAQS) POLLUTANT
(links to historical tables of
NAAQS reviews)
AVERAGING TIME PRIMARY STANDARD SECONDARY STANDARD
Sulfur Dioxide (SO2) 3-HourA None 0.5 ppm (1300 µg/m³)
1-HourB 0.075 ppm (75 ppb) None
Carbon Monoxide (CO) 8-HourA 9 ppm None
1-HourA 35 ppm None
Ozone (O3) 8-HourC 0.070 ppm (70 ppb) Same as Primary Standard
Nitrogen Dioxide (NO2) Annual Arithmetic Mean
0.053 ppm (53 ppb) Same as Primary Standard
1-HourD 100 ppb None
Particulate Matter < 10 micrometers
(PM10) 24-HourE 150 µg/m³ Same as Primary Standard
Particulate Matter < 2.5 micrometers
(PM2.5)
Annual Arithmetic MeanF 12.0 µg/m³ 15.0 µg/m³
24-HourG 35 µg/m³ Same as Primary Standard
Lead (Pb) Rolling 3-Month AverageH 0.15 µg/m³ Same as Primary Standard
Primary standards protect against adverse health effects. Secondary standards protect against welfare effects such as damage to crops, vegetation, and buildings. A Not to be exceeded more than once a year. BA rule revoking the annual and 24-hour SO2 NAAQS and promulgating a new 1-hour SO2 NAAQS was signed on June 2, 2010. To attain the 1-hour NAAQS, the 3-year average of the 99th percentile of the daily maximum 1-hour average SO2 level at each monitor must not exceed 75 ppb. C The ozone NAAQS is violated when the average of the 4th highest daily eight-hour concentration measured in 3 consecutive years exceeds 0.070 ppm (70 ppb). The 0.070 ppm NAAQS became effective December 28, 2015. D To attain the 1-hour NO2 NAAQS, effective January 22, 2010, the 3-year average of the 98th percentile of the daily maximum 1-hour average NO2 concentration at each monitor must not exceed 100 ppb.

9
E To attain the PM10 standard, the 24-hour concentration at each site must not exceed 150 µg/m³ more than once per year, on average over 3 years. F The primary annual average PM2.5 NAAQS was revised on December 10, 2012. The secondary NAAQS was not changed. To attain the PM2.5 annual standard, the 3-year average of the weighted annual means of the 24-hour concentrations must not exceed the NAAQS value. G To attain the PM2.5 24-hour standard, the 3-year average of the 98th percentile of 24-hour concentrations must not exceed 35 μg/m3.
H On October 15, 2008, the Pb NAAQS was changed to 0.15 μg/m3 as a rolling 3-month average, not to be exceeded in a 3-year period. µg/m³ = micrograms per cubic meter mg/m³ = milligrams per cubic meter ppb = parts per billion ppm = parts per million

10
Monitoring Site Information
The ambient air monitoring sites currently operated by DEM are listed in the Table 2 below. Detailed information for each monitoring site is provided in a later section of this plan. Table 2: Monitoring Network Summary
Town Site PM
2.5
(FR
M),
1:3
(E
xcep
t A
J 1
:6)
PM
2.5
(FR
M,
Co
llo
cate
d),
1:6
PM
2.5
(C
on
tin
uo
us
- FE
M)
PM
10
/P
M-
(FR
M),
1:6
PM
10
/P
M-
(FR
M,
Co
llo
cate
d),
1:6
PM
10
/P
M-C
oar
se,
1:3
Pol
ycyc
lic a
rom
atic
hyd
roca
rbon
s (P
AH
), 1
:6
Sp
ecia
tio
n,
PM
2.5
su
per
SA
SS
(C
SN
),
1:3
P
M2
.5 C
arb
on
(U
RG
) (C
SN
),1
:3
Ozo
ne
SO
2
CO
Dir
ect
NO
2
NO
/N
O2/
NO
x
NO
/N
Oy
VO
Cs
24
HR
Ca
nis
ter
( N
AT
TS
, S
tate
)
VO
Cs
Ho
url
y P
AM
S
Bla
ck C
arb
on
Bla
ck C
arb
on
, C
oll
oca
ted
C
arb
on
yls,
1:6
Car
bo
nyl
s C
oll
oca
ted
, 1
:12
Par
ticl
e C
ou
nte
r
Win
d S
pee
d
Win
d D
irec
tio
n
Tem
per
atu
re
Dew
Po
int
/ R
el.
Hu
mid
ity
Bar
om
etri
c P
ress
ure
So
lar
Rad
iati
on
UV
Rad
iati
on
Pre
cip
itat
ion
Pawtucket Vernon Street X X* X X
Providence Brown University T T
Narragansett USEPA Laboratory X S X X X
East Providence
Myron Francis School
X X X X X X X X X X X S X X X X X X X X X S S S
Providence Urban League T X+ X X X X X X X X X X X X X X
West Greenwich
Alton Jones Campus T X T S T X X X X S
Providence Near-Road Site X X X X X
Providence Johnson & Wales T
X = Exiting P= Planning new 2015/16 T= Proposed to terminate in 2016/2017 S= Seasonal (June 1-August 30, except ozone and NOX March1-Sep 30) * collocated PM2.5 FRM started 4/1/2016, 1:6 + collocated PM2.5 FRM terminated 3/31/2016 for site construction, 1:6 PM10 Lead was terminated June 30, 2016 from EP due to rule change.

11
Table 3: Monitoring Sites
Site AQS ID Latitude Longitude
Parameter Measured
Method Of Sampling
EPA Method Designation
Vernon Trailer Vernon Street Pawtucket
440070026 41.874675 -71.379953
PM2.5 Lo Vol Reference PM10 Hi Vol Reference VOC Canisters, GC/FID/MS Reference
Johnson & Wales 111 Dorrance Street Providence
440070027 41.822686 -71.411089
PM10
Hi Vol
Reference
Brown University 10 Prospect Street Providence
440070012 41.825556 -71.405278
Oxides of Nitrogen Chemiluminescence (low range)
Reference Nitrogen Dioxide
Sulfur dioxide Pulsed Fluorescence (low range)
Equivalent
USEPA Laboratory 27 Tarzwell Drive Narragansett
440090007 41.4950779 -71.4236587
Ozone U.V. Photometric Reference PM2.5 Beta Attenuation/Cont Equivalent
Wind Speed Anemometer N/A Wind Direction Wind Vane N/A
Temperature Spot Reading N/A Myron Francis School 64 Bourne Avenue E. Providence
440071010 41.840920 -71.36094
Oxides of Nitrogen Chemiluminescence (low range)
Reference Nitrogen Dioxide
NO/NOy Chemiluminescence (low range)
Reference
Carbon Monoxide
Gas Filter Correlation (low range)
Equivalent
Sulfur dioxide Pulsed Fluorescence (low range)
Equivalent
Ozone U.V. Photometric Reference PM2.5 Lo Vol Reference PM2.5 Beta Attenuation/Cont Equivalent
Speciated PM2.5 Speciation Monitor N/A Coarse PM (PM10-2.5) Lo Vols (PM10 & PM2.5) Reference
Black Carbon Aethalometer N/A VOC Canisters, GC/FID/MS Reference VOC Continuous GC
Carbonyls HPLC Cartridges Reference Wind Speed Anemometer N/A
Wind Direction Wind Vane N/A Barometric Pressure Barometer N/A
Temperature Spot Reading N/A Relative Humidity Plastic Film N/A
Solar Radiation Pyranometric N/A UV Radiation UV Photometric N/A Precipitation Bucket/Continuous N/A

12
Site AQS ID Latitude Longitude
Parameter Measured
Method Of Sampling
EPA Method Designation
Urban League 212 Prairie Avenue Providence
440070022 41.807949 -71.415103
PM2.5 Lo Vol Reference PM2.5 Beta Attenuation/Cont Equivalent
PM10/Metals Hi Vol Reference VOC Canisters, GC/FID/MS Reference
Carbonyls HPLC Cartridges Reference Black Carbon Aethalometer N/A Semi-volatiles PUF/XAD, GC/MS N/A Wind Speed Anemometer N/A
Wind Direction Wind Vane N/A Temperature Spot Reading N/A
Relative Humidity Plastic Film N/A Alton Jones Campus Victory Highway West Greenwich
440030002 41.615600 -71.719900
Ozone U.V. Photometric Reference Nitrogen Dioxide Chemiluminescence Reference
Oxides Of Nitrogen Chemiluminescence Reference VOC Canisters, GC/FID/MS Reference PM10 Hi Vol Reference PM2.5 Lo Vol Reference PM2.5 Beta Attenuation/Cont Equivalent
Wind Speed Anemometer N/A Wind Direction Wind Vane N/A
Barometric Pressure Barometer N/A Temperature Spot Reading N/A
Relative Humidity Plastic Film N/A Solar Radiation Pyranometric N/A
Near-Road Site Hayes and Park Sts. Providence
440070030 41.829495 -71.417457
Oxides of Nitrogen Chemiluminescence (low range)
Reference Nitrogen Dioxide
Carbon Monoxide
Gas Filter Correlation (low range)
Equivalent
PM2.5 Beta Attenuation/Cont Equivalent Black Carbon
Aethalometer N/A

13
Network Evaluation Following is a discussion, by pollutant, of: • The current monitoring network, • The NAAQS and a comparison of recent measurements with the NAAQS, • Whether that network meets EPA’s monitoring criteria, • Whether new sites are needed, • Whether any existing sites are no longer needed, and • Plans for modification of the network in the next 18 months. Ozone (O3) The sites in the current ozone monitoring network are listed in Table 4 and Figure 1: Table 4: Rhode Island Ozone Monitoring Sites
SITE MEASUREMENT SCALE
MONITORING OBJECTIVE
SCHEDULE
Alton Jones Campus Victory Highway West Greenwich
Regional
Upwind background Population exposure
Continuous Ozone Season
March-September
USEPA Laboratory 27 Tarzwell Drive Narragansett
Regional Population exposure Continuous Ozone Season
March-September
Myron Francis School 64 Bourne Avenue E. Providence
Neighborhood (PAMS, NCore)
Maximum precursor emissions impact
Population exposure
Continuous Year-Round
The NAAQS for ozone is 70 ppb. A site is in violation of that NAAQS when the average of the 4th highest daily eight-hour ozone concentration measured in 3 consecutive years (the design value) at that site exceeds 70 ppb. Ozone design values for all of the Rhode Island sites have decreased over time, but design values increased or remained constant in 2012 and 2013, as shown in Table 5. Based on 2009-2011 design values, EPA designated Rhode Island as unclassifiable/attainment for the 75 ppb NAAQS on April 30, 2012. Note, however, that the 2009-2011 design values were lower than normal, due to unusually cool temperatures in the summer of 2009. In the most recent three year period, 2014-2016, the design values for both the West Greenwich and Narragansett the sites met the 70 ppb NAAQS, while the design value for the E. Providence site was slightly lower than that standard.

14
Table 5: Ozone Design Values (ppb) W. Greenwich Narragansett E. Providence
2002 - 2004 87 90 84 2003 - 2005 84 89 82 2004 - 2006 83 85 81 2005 - 2007 86 84 84 2006 - 2008 80 81 82 2007 -2009 77 77 77 2008 - 2010 71 76 72 2009 –2011 73 73 71 2010 - 2012 74 78 75 2011 - 2013 74 78 76 2012 -2014 70 74 73 2013 - 2015 70 73 70 2014-2016 70 70 68
Since EPA’s rules require Rhode Island to operate at least two ozone monitors, the State has one more monitor than the minimum number required. Continued operation of all of the current monitors is important for the following reasons:
• Ground-level ozone levels have generally decreased in the past several years; however, ozone concentrations in the State continue to reach unhealthy levels on several days each summer. Note that 8-hour average ozone levels were above 70 ppb at one or more of the Rhode Island monitoring sites on 10 days in 2015 and 31 days with levels above 60 ppb. In 2016 there were 13 days above 70 ppb and 42 days with levels above 60 ppb.
• EPA has strengthened the ozone NAAQS to 70 ppb to protect public health effective December 28, 2015.
• The three sites represent three distinct geographical areas that are affected by different weather patterns and therefore experience very different ozone levels on some days.
• The availability of real-time ozone data from the three ozone sites enables RI DEM to issue area-specific health advisories as appropriate and to provide residents with real-time information about ozone concentrations and associated health risks in their neighborhoods.
The July 2009 Federal Register Notice also proposed an increase in the length of the ozone season in several states, including Massachusetts and Connecticut. EPA did not propose a change in Rhode Island’s ozone monitoring season, April – September. Although the final rule did not change Rhode Island’s ozone season, RI DEM has extended the period of operation of its ozone monitors to be consistent with monitoring in neighboring states. Beginning in 2011, the ozone monitors at the Narragansett and West Greenwich sites have been operated from March through October. In 2017 this will be changed to operate March –September to follow 40 CFR Part 58 Appendix D Table D-3 Ozone Season. Note also that, beginning in 2011, ozone is being measured year round at the East Providence site, consistent with NCore requirements.
No changes to the ozone monitoring network are planned for the next 18 months.

15
Carbon Monoxide (CO) The current CO monitoring network is as shown in Table 6 and on Figure 1: Table 6: Carbon Monoxide Monitoring Network
SITE MEASUREMENT SCALE
MONITORING OBJECTIVE
SCHEDULE
Myron Francis School 64 Bourne Avenue E. Providence
Neighborhood Maximum precursor emissions impact
Population exposure
Continuous Year-Round
Near-Road Site Hayes and Park Sts. Providence
Microscale Maximum emissions Near-road
(began operation in April 2014)
Continuous Year-Round
The NAAQS for CO are:
• 35 ppm as a 1 hour average, not to be exceeded more than once per year (design value is the highest annual 2nd maximum 1-hour concentration) and
• 9 ppm as an 8 hour average, not to be exceeded more than once per year (design value is the highest annual 2nd maximum non-overlapping 8-hour concentration)
The 2016 CO design values for Rhode Island are: Near Road:
• 3.0 ppm – 1 hour average, 8.6% of NAAQS • 1.8 ppm – 8 hour average, 20% of NAAQS
Francis School:
• 1.3ppm – 1 hour average, 3.7% of NAAQS • 0.9 ppm – 8 hour average, 10% of NAAQS
The CO NAAQS has not been exceeded in Rhode Island since 1984. Since 2001, all CO levels recorded in Rhode Island have been in the “Good” category of the EPA’s Air Quality Index (AQI). EPA’s regulations do not specify a minimum number of CO monitors that must be operated in a state, except that CO monitoring is required at NCore sites (40 CFR 58, Appendix D 3(b)). Since the East Providence site is both a PAMS site and the State’s NCore site, carbon monoxide monitoring will continue at that site using a low range monitor, consistent with NCore requirements.

16
On August 21, 2011, EPA issued a decision retaining the CO NAAQS at the current levels. The decision requires the operation of CO monitors at sites established to comply with the near-road monitoring requirements specified in the 2010 NO2 NAAQS. Near-road sites are required in all urban areas which, like the Providence-New Bedford-Fall River, RI-MA MSA, have a population of 1,000,000 or more. Near-road CO monitoring is not required until January 1, 2017; however, Rhode Island began operating a low-range CO monitor at a site adjacent to Interstate Route 95 that meets the above near-road specifications in April 2014.
No changes to the CO monitoring network are planned in the next 18 months.
_________________________ 2US EPA, “Review of National Ambient Air Quality Standards of Carbon Monoxide: Final Rule,” Federal Register 76 (169):54294, August 31, 2011. http://www.gpo.gov/fdsys/pkg/FR-2011-08-31/pdf/2011-21359.pdf

17
Sulfur Dioxide (SO2) The current SO2 monitoring network is as shown in Table 7 and on Figure 1: Table 7: Sulfur Dioxide Monitoring Network
SITE MEASUREMENT SCALE
MONITORING OBJECTIVE
SCHEDULE
Brown University 10 Prospect Street Providence
Neighborhood Population exposure
Continuous Year-Round
Myron Francis School 64 Bourne Avenue E. Providence
Neighborhood NCore Continuous Year-Round
The NAAQS for SO2 are:
• 75 ppb, 1-hour average (primary standard effective June 2, 2010). The design value is the average of the 99th percentile maximum daily hour measured in 3 consecutive years.
• 0.5 ppm (500 ppb), 3 hour average (secondary standard) not to be exceeded more than once per year.
The SO2 design values recorded in the last three years (2014 – 2016) in Rhode Island are:
• 7.33 ppb - 1 hour average, 9.8% of primary NAAQS - Brown monitor • 7 ppb – 1 hour average 9.3% of primary NAAQS – East Providence monitor
The SO2 NAAQS has never been exceeded in the State. One-hour design values for SO2 have been below 75 ppb, the one-hour NAAQS promulgated in 2010, since 1994. All measurements have been in the “Good” range of the AQI since 2007. SO2 levels measured at the Brown University monitor in Providence declined dramatically in 2013, probably due to the increased use of natural gas rather than fuel oil by nearby sources.
EPA’s 2006 amended monitoring regulation requires SO2 monitoring only at NCore sites. However, the 2010 SO2 NAAQS rule requires at least one SO2 monitor in the Providence-New Bedford-Fall River RI, MA MSA, which includes all of Rhode Island and Bristol County, Massachusetts. That SO2 monitor must be sited to meet one or more of the following objectives: (1) characterizing concentrations around emissions sources, (2) measuring the highest concentrations in an area, (3) determining population exposure, (4) establishing general background levels and (5) evaluating regional transport.
__________________________

18
3An EPA rule amending the SO2 NAAQS was signed on June 2, 2010. The rule revokes the previous annual and 24-hour NAAQS and sets a new one-hour average NAAQS at 0.075 ppm (75 ppb). Revisions of monitoring networks consistent with the requirements in the rule must be in place by January 1, 2013.
Rhode Island operates a SO2 monitor at Brown University in Providence and, to meet NCore requirements, began operating a low-range SO2 monitor at the East Providence site in January 2011.The Brown University SO2 monitor was updated to a low-range unit in January 2013. RI DEM believes that the Brown University and East Providence monitors appropriately characterize population exposure in the major urban areas in Rhode Island.
The State of Massachusetts also operates a SO2 monitor in the Providence Warwick RI-MA MSA. Since that monitor is located in Fall River, MA, approximately two miles southeast of the Brayton Point coal-fired power plant, the SO2 levels recorded at that site have historically been substantially higher than those at the Rhode Island sites; however, SO2 levels recorded at that site dropped in 2014, probably due to the decreased operation of the power plant. The 2014 one-hour design value for SO2 at the Fall River monitor was 47 ppb, 63% of the NAAQS and more than three times the highest Rhode Island design value. According to EPA’s Emissions Inventory System (EIS), in 2011 the Brayton Point facility emitted 18,648 tons of SO2, 50 times more than the highest emitting Rhode Island source, Central Landfill (352 tons). Therefore, the Fall River monitor is more appropriate than a Rhode Island location for characterizing maximum concentrations in the MSA. Given that the SO2 Population Weighted Emissions Index (PWEI) monitor located in Fall River appears to be more representative, RI DEM will reevaluate the placement of the maximum concentration monitor subsequent to the closure of the Brayton Point plant, which is scheduled for the summer of 2017.
RI DEM plans to discontinue monitoring at the Brown University site at the end of 2017. Note that, since a low-range SO2 monitor is now in use at the East Providence site, RI DEM does not plan to further update the technology used for measuring that pollutant at this time.
19
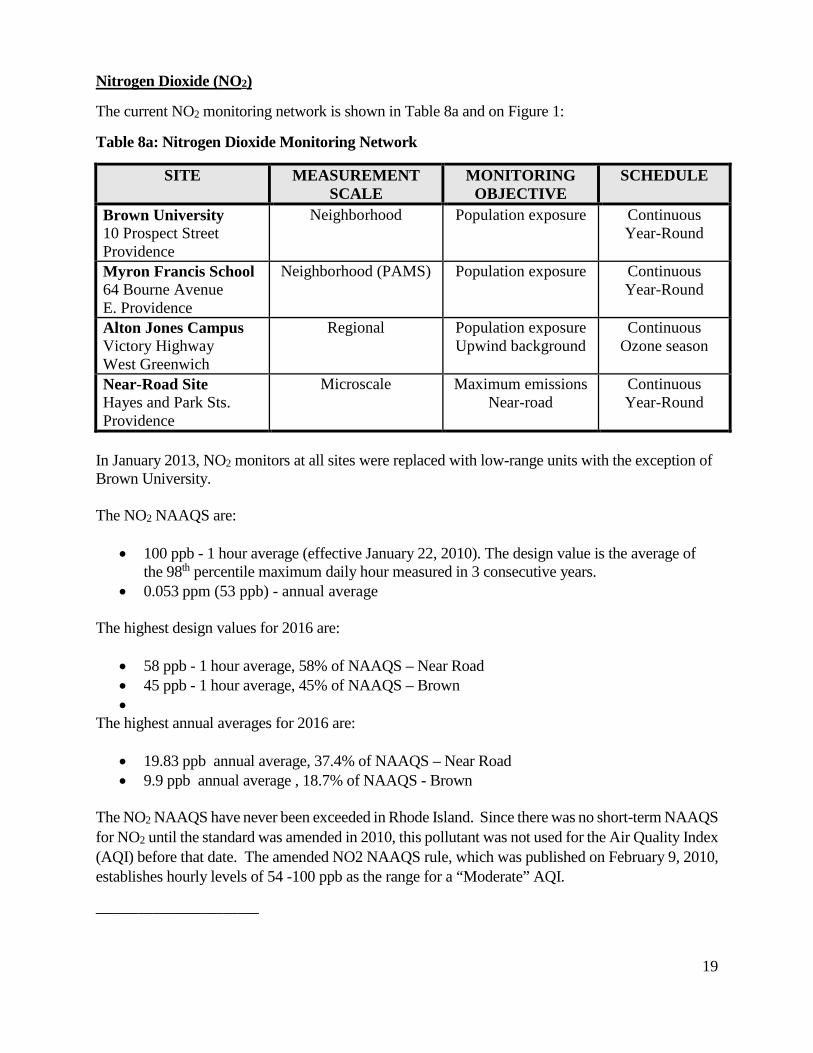
Nitrogen Dioxide (NO2)
The current NO2 monitoring network is shown in Table 8a and on Figure 1:
Table 8a: Nitrogen Dioxide Monitoring Network
SITE MEASUREMENT SCALE
MONITORING OBJECTIVE
SCHEDULE
Brown University 10 Prospect Street Providence
Neighborhood Population exposure Continuous Year-Round
Myron Francis School 64 Bourne Avenue E. Providence
Neighborhood (PAMS) Population exposure Continuous Year-Round
Alton Jones Campus Victory Highway West Greenwich
Regional Population exposure Upwind background
Continuous Ozone season
Near-Road Site Hayes and Park Sts. Providence
Microscale Maximum emissions Near-road
Continuous Year-Round
In January 2013, NO2 monitors at all sites were replaced with low-range units with the exception of Brown University. The NO2 NAAQS are:
• 100 ppb - 1 hour average (effective January 22, 2010). The design value is the average of the 98th percentile maximum daily hour measured in 3 consecutive years.
• 0.053 ppm (53 ppb) - annual average The highest design values for 2016 are:
• 58 ppb - 1 hour average, 58% of NAAQS – Near Road • 45 ppb - 1 hour average, 45% of NAAQS – Brown •
The highest annual averages for 2016 are:
• 19.83 ppb annual average, 37.4% of NAAQS – Near Road • 9.9 ppb annual average , 18.7% of NAAQS - Brown
The NO2 NAAQS have never been exceeded in Rhode Island. Since there was no short-term NAAQS for NO2 until the standard was amended in 2010, this pollutant was not used for the Air Quality Index (AQI) before that date. The amended NO2 NAAQS rule, which was published on February 9, 2010, establishes hourly levels of 54 -100 ppb as the range for a “Moderate” AQI.
_______________________

20
4USEPA, “Primary National Ambient Air Quality Standards for Nitrogen Dioxide: Final Rule, “FR 75(26):6474, 9 February 2010. http://www.epa.gov/ttn/naaqs/standards/nox/fr/20100209.pdf
In the 5 year period of 2011– 2015, there were a total of 4 days when NO2 levels recorded in Rhode Island were in that range. No levels in the “Unhealthy for Sensitive Populations” or more serious AQI categories were recorded in that period.
The 2010 amended NO2 NAAQS requires Rhode Island to operate two NO2 monitoring sites, one at “a location of expected highest NO2 concentrations representing the neighborhood or larger spatial scales” and a second monitor at a near-road location where maximum microscale- representative concentrations are expected, Rhode Island intends to use the current NO2/NOx site at Brown University in Providence to fulfill the requirement for a neighborhood scale site. NO2/NOx monitoring has been conducted at that site, which has been approved as neighborhood scale representative, since 1994; therefore, the data collected at that site can be used to track trends in NO2/NOx concentrations over time. Moreover, the site is in the area of the State with the largest NO2/NOx emitting sources and the highest density of NO2/NOx emissions. NO2 concentrations measured at the Brown University site are substantially lower than the NAAQS for that pollutant, including the 1-hour average standard.
After an evaluation of meteorology, traffic counts, diesel traffic and congestion, RI DEM and EPA agreed to locate the Rhode Island near-road site on the east side of the Interstate Route 95 near downtown Providence. Monitoring for NO2/NOx, as well as CO, PM2.5 and black carbon, began at that site in April 2014. It should be noted that the Rhode Island Department of Transportation is currently engaged in a large scale highway reconstruction/bridge repair project on the southbound side of I-95, just southwest of the monitoring site, and emissions from construction equipment and activities may have a measureable impact on monitored levels at the near-road site. In addition, construction is due to shift to the northbound lanes in two or three years, at which time the monitoring site will need to be relocated.
To fulfill PAMS requirements, NO2/NOx is also monitored at the East Providence year-round. Although not required under the new regulations West Greenwich is monitored during the ozone season. To determine how NO2/NOx levels at the East Providence site compare to those measured at the Brown University site, Rhode Island has operated the East Providence monitor continuously since March 2012.
Table 8b: 2016 Nitrogen Dioxide Levels at Brown and East Providence Sites (ppb)
Site Year 98th Percentile One-Hour
Annual Average
Brown University, Providence
2016
39
9.19
Myron Francis School, E. Providence
2016
36
6.63

21
It does not appear that operation of the East Providence monitor year-round has affected Rhode Island’s NO2 design values. However, NO2 levels were higher at the East Providence site than at the Brown University sites on some days. Given the above considerations, RI DEM will make changes in the State’s nitrogen dioxide monitoring network in the next 18 months. Since low-range NO2 monitors are currently in use at the East Providence, and Near-Road sites, RI DEM does not plan to further update the technology used for measuring that pollutant at this time. A low-range monitor that measures NO and NOy (total reactive nitrogen oxides) has also been operated at the East Providence site since January 2011, consistent with the NCore requirements. Under the circumstances RIDEM will terminate the site located at Brown University on December 31, 2017. The East Providence site will take the place of the Brown site as the area wide NO2 monitoring site. Particulate Matter Particles smaller than 10 microns (PM10) The current PM10 monitoring network is as shown in Table 9 and Figure 2: Table 9: PM10 Monitoring Network
SITE MEASUREMENT SCALE
MONITORING OBJECTIVE
SCHEDULE
Vernon Trailer Vernon Street Pawtucket
Middle Population exposure 24-hour 1 in 6 day
Johnson & Wales 111 Dorrance Street Providence
Neighborhood Population exposure 24-hour 1 in 6 day
Urban League 212 Prairie Avenue Providence
Neighborhood (NATTS)
Population exposure Highest concentration
24-hour 1 in 6 day
Co-located 1 in 6 day
Alton Jones Campus Victory Highway West Greenwich
Regional Upwind background 24-hour 1 in 6 day
Myron Francis School 64 Bourne Avenue E. Providence
Neighborhood (NCore)
Population exposure (Lead (discontinued
6/30/16) and PM10-2.5)
24-hour 1 in 6 day (Pb)
1 in 3 (PM 10-2.5)
The PM10 NAAQS is:
• 150 µg/m3 – 24-hour average, not to be exceeded more than once per year on average over 3 years (design value is 4th high value in a 3-year period)
The highest value for PM10 recorded at a Rhode Island site for 2016 is:
• 52 µg/m3 – 24-hour average, 34.7% of NAAQS, recorded at Vernon St.

22
The PM10 NAAQS has never been exceeded in Rhode Island. Since PM10 is measured using a filter-based method, results are not immediately available and cannot be used for Air Quality Index calculations. Levels tend to be highest at the Vernon Street site, which is adjacent to I-95, and higher at the two Providence sites than at the rural West Greenwich site. PM10 levels appear to have slightly decreased over the past decade. Since late 2011, PM10 has also been measured at the East Providence NCore site every sixth day using a lo-vol sampler. Those PM10 measurements are used, in conjunction with PM2.5 measurements at that site, for calculating PM10-2.5 levels. The lo-vol PM10 filters were also used for lead measurements. EPA’s monitoring regulations require areas like the Providence-New Bedford-Fall River, RI-MA Metropolitan Statistical Area (MSA), which has a population greater than 1,000,000 and measured PM10 concentrations below 80% of the NAAQS, to operate a minimum of 2-4 PM10 monitoring sites. Since Rhode Island is currently operating five sites and is not measuring levels close to the NAAQS at any of the sites, one or more sites could be discontinued without violating the minimum criteria.
As discussed above, PM10 measurements at the East Providence site are used for calculating PM10-2.5 levels and, since this measurement is required at NCore sites, PM10 sampling cannot be discontinued at that site. Similarly, PM10 samples collected at the Urban League site in Providence are analyzed for metals to fulfill NATTS requirements, so PM10 sampling at that location cannot be discontinued. The Vernon St., Pawtucket site, which is adjacent to I-95, tends to record the highest PM10 concentrations in the State. The rural Alton Jones, West Greenwich site provides information about background concentrations of PM10 in Rhode Island.
Since the Johnson & Wales site was approximately one mile from the Urban League location and the PM10 levels at the Johnson & Wales site correlated well with those at the Urban League (r2 = 0.81), RIDEM discontinued operation of the Johnson & Wales site as of September 30, 2016. Due to budgetary constraints RI DEM plans to discontinue operation of the PM10 monitor at the Alton Jones site on December 31, 2017.
RI DEM is planning to modify the State’s PM10 network in the next 18 months. Since three of the four PM10 monitors currently operating in the State are located in the Providence metropolitan area and one of those monitors is near a major roadway, the current PM10 measurements adequately characterize exposure of the sensitive populations in urban areas to that pollutant. There are no immediate plans to use new technology for measuring PM10 in Rhode Island. RIDEM is requesting to discontinue monitoring at the Alton Jones site as of December 31, 2017.

23
Fine Particulate Matter (Particulate Matter Smaller than 2.5 microns, or PM2.5) The Federal Reference Method/Federal Equivalent Method (FRM/FEM) PM2.5 monitoring network is shown in Table 10 and in Figure 3: Table 10: PM2.5 Monitoring Network
SITE MEASUREMENT SCALE
MONITORING OBJECTIVE
SCHEDULE
Vernon Trailer Vernon Street Pawtucket
Middle Population exposure 24-hour, 1 in 3 day FRM
Co –located FRM began operation 4/1/17
Urban League 212 Prairie Avenue Providence
Neighborhood Population exposure Highest concentration
24-hour, daily Continuous FEM
1 in 6 day co-located sampler FRM
2nd FRM Terminated 4/1/17 Myron Francis School 64 Bourne Avenue E. Providence
Urban Population exposure Highest concentration
24-hour, daily Continuous FEM
1 in 3 day FRM
Alton Jones Campus Victory Highway West Greenwich
Regional Population exposure General/Background Regional Transport
Continuous FEM 1 in 6 day co-located sampler
FRM USEPA Laboratory 27 Tarzwell Drive Narragansett
Regional Population exposure Continuous FEM
Near Road Site Hayes and Park Sts. Providence
Microscale Near-road Continuous FEM
Filter-based FRM PM2.5 units are operated as the primary sampler at the Vernon and FEM continuous PM2.5 monitors are used as the primary samplers at the West Greenwich, Narragansett East Providence and, as of April 2014, the Near-Road site in Providence. Co-located filter-based FRM samplers are operated at the Vernon and East Providence sites for quality assurance purposes. The PM2.5 NAAQS are:
• 35 µg/m3 – 24-hour average (design value is the 3-year average of the 98th percentile 24-hour concentration)
• 12 µg/m3- annual average (design value is calculated by averaging the daily concentrations from each quarter, averaging these quarterly averages to obtain an annual average, and then averaging the annual averages for three consecutive years)
____________________________________________

24
5In December 2012, EPA revised the PM NAAQS, reducing the annual average PM2.5 NAAQS from 15 to 12 µg/m3. The rule left the PM10 NAAQS and the 24-hour average PM2.5 NAAQS and the secondary annual average PM2.5 NAAQS unchanged.
The highest PM2.5 values for 2016 are:
• 24.5µg/m3 – 24-hour average, 70% of NAAQS, recorded at Near Road. • 9.3µg/m3 – annual average, 77.5% of NAAQS, recorded at Near Road.
Annual average levels are consistently highest at the Vernon Street site, which is adjacent to I-95, and higher at the East Providence and the two Providence sites than at the rural West Greenwich site. PM2.5 levels have decreased over the past decade, although the additional data obtained from the New Road site is higher than other sites, no conclusion can be made as to whether the levels have decreased over the past decade. EPA regulations require a minimum of two PM2.5 monitoring sites in Rhode Island. These sites must characterize the following:
• Community-wide air quality; • Background PM2.5 levels in the State; and • Regional transport of PM2.5.
Although Rhode Island operates more PM2.5 sites than required, each site fulfills a specific information need or EPA requirement. The West Greenwich site fulfills EPA’s requirements for measurement of background and regional transport concentrations of PM2.5. The 24-hour and annual PM2.5 design values for the Vernon Street, Pawtucket site, which is immediately adjacent to Interstate Rte. 95, tend to be higher than those at the other sites, so that is a maximum impact site. The East Providence monitor cannot be removed because PM2.5 monitoring is required at NCore sites, and the Urban League and Narragansett monitors fulfill the need for air quality data for urban and coastal areas of the State, respectively. As discussed above, PM2.5 monitoring at the Rhode Island near-road site began in April 2014 and will continue until such time that the site is no longer tenable, due to the progression of construction activity in the area. Note also that the long-term future of the Urban League building is questionable as the building is for sale, therefore arrangements are being made to move the site to an alternative location at the Community College of Rhode Island - Liston Campus (CCRI). RI DEM will request approval from the EPA for this location as soon as an agreement is reached with this facility. Since CCRI had difficulty accommodating all of the equipment from the Urban League site, the PM2.5 from that location was moved to Vernon Street for co-locating with the existing FRM on April 1, 2017. RI DEM is changing the FEM at the E. Providence site to be the primary PM2.5 monitor and use the FEM and FRM data from that site to evaluate FEM-FRM comparability at Rhode Island sites. The advantages of using the East Providence, rather than the West Greenwich site for this purpose include:
• PM2.5 levels at the East. Providence site, although still substantially below the NAAQS, tend to be higher than those at the West Greenwich site.

25
• Since the East Providence FRM runs 1 in 3 day, it generates more comparison data then
are generated at West Greenwich.
• Historical data has demonstrated that the E. Providence FEM and FRM measurements tend to be better correlated and have less bias than is observed at the W. Greenwich site.
Operation of the Near-Road site will be disrupted at some future date, due to the progression of construction activity in the area. RI DEM will notify EPA when it receives notice of that disruption to discuss future plans for near-road monitoring in the State. RIDEM changed the PM2.5 FRM sampling frequency from every day, to 1-in-3 at Francis School and Urban League beginning October 1, 2016. As of April 1, 2017 RIDEM moved the collocated FRM monitor from the Urban League site to Vernon Street. Due to budgetary considerations RIDEM will discontinue using the FRM at Alton Jones as of December 31, 2017. When RIDEM moves the monitoring station from Urban League to its new NATTS location at CCRI it plans to discontinue the FRM at this new location. No other changes to the PM2.5 network are anticipated in the next 18 months. Speciation Monitoring The EPA’s PM2.5 Speciation Trends Network (STN) is designed to characterize metal, ion and carbon constituents of PM2.5. RI DEM began operating PM2.5 speciation monitors at the Urban League and East Providence sites as a part of that network on a one in six-day schedule in June 2002. Operation of the East Providence speciation equipment was discontinued in May 2004 and, at that time, the monitoring frequency at the Urban League speciation site was increased to one in three days. In November 2008, the speciation equipment at the Urban League was replaced by a SASS speciation unit and, in March 2009, an URG carbon sampler began operation at that location as part of the speciation program. To conform to NCore requirements, the speciation equipment, including the carbon sampler, was moved to the East Providence NCore site in January 2011 and is now being operated there on a one-in-three day schedule. Speciation filters are analyzed by an EPA contractor. Lead (Pb)
On November 12, 2008, the EPA promulgated an amended NAAQS for lead (FR 73:66964). The new NAAQS is an order of magnitude more stringent than the previous standard. To determine whether an area is in compliance with the new standard, the rule requires two types of lead monitoring: source-specific monitoring in the vicinity of lead sources that emit 0.5 or more tons of lead per year and area-wide lead monitoring at urban NCore sites. Rhode Island has no sources emitting 0.5 tons or more of lead per year and, therefore, is not required to operate any source-specific monitors. To fulfill the requirement for area-wide monitoring, RI DEM and RI DOH began collecting lo-vol PM-10 samples to be analyzed for lead at the East Providence NCore site in June 2011. As specified in the lead NAAQS rule, sampling was conducted on a one-in-six day schedule.

26
The lead (Pb) monitoring network is as shown in Table 11 (discontinued 4/30/16): Table 11: Lead Monitoring Network
SITE MEASUREMENT SCALE
MONITORING OBJECTIVE
SCHEDULE
Myron Francis School 64 Bourne Avenue E. Providence
Neighborhood Population exposure (area-wide)
(NCore)
1 in 6 day Discontinued
6/30/2016
• The NAAQS for Pb is 0.15 μg/m3, as a rolling three month average, measured in total
suspended particulate matter (TSP) Rhode Island measured Pb in PM10, not in TSP. In the lead NAAQS rule, EPA allows states to use Pb- PM10 monitoring, without a scaling factor, as a surrogate for Pb-TSP NAAQS monitoring at area-wide monitoring sites, as long as the 3-month average Pb- PM10 concentrations at those sites remain below 0.10 μg/m3. Note that the highest 3-month average PM10 concentration that had been measured at the East Providence site is approximately 7% of that trigger level.
Rhode Island’s lead filters were analyzed by the State of Maine using EPA-approved XRF methodology. As specified in the lead NAAQS rule, sampling was conducted on a one-in-six day schedule. EPA deleted the requirement to monitor for non-source Pb at NCore sites from Appendix D of 40 CFR part 58.16 and to allow monitoring agencies to request permission to discontinue non-source monitoring following the collection of at least 3 years of data at urban NCore sites.
Since ambient lead monitoring was conducted in the State for more than 3 years and the lead levels were consistently considerably lower than the NAAQS since the inception of monitoring, RI DEM had asked for and received permission to discontinue monitoring as of June 30, 2016. Monitoring has been discontinued as of June 30, 2016.

27
Ozone Precursor and Air Toxics Measurements
Photochemical Assessment Monitoring Stations (PAMS)
The Clean Air Act Amendments of 1990 (CAAA) required serious, severe and extreme ozone nonattainment areas to establish enhanced monitoring networks to measure ozone and ozone precursors. In response to that mandate, the US EPA promulgated rules in 1993 that required the establishment of a network of Photochemical Assessment Monitoring Stations (PAMS) to measure ozone, NOx, volatile organic compounds (VOCs), carbonyls, and meteorological parameters in serious and above nonattainment areas. This network was designed to provide comprehensive data on trends in ambient concentrations of ozone and ozone precursors and to evaluate the spatial and diurnal variability of those pollutants in order to track the formation and transport of ozone across large areas and to evaluate the effectiveness of strategies implemented to reduce levels of that pollutant. The EPA rule identified four types of PAMS sites: • Type 1 sites, located on the upwind side of the nonattainment area and used to characterize
background and transported concentrations of ozone, NOx and VOC; • Type 2 sites, sited to measure the maximum impact of VOC and NOx emitted in the area; • Type 3 sites, sited to measure maximum ozone concentrations occurring downwind of the area,
and • Type 4 sites, sited to measure the concentration of ozone, NOx and VOC exiting the area. Two PAMS sites, including a Type 2 site, were required in each serious and above nonattainment area. Since Rhode Island was a serious nonattainment area for the one-hour average ozone NAAQS, the ozone standard that was in effect at the time the enhanced monitoring requirements were promulgated, a PAMS network was required in the State. The Alton Jones monitoring site in West Greenwich was designated as the State’s Type 1 PAMS site and the East Providence site as the Type 2 PAMS site. In addition, the Massachusetts Department of Environmental Protection (MA DEP) operated a site at the Blue Hills Observatory in Milton, Massachusetts (Site ID 25-021-3003) that served as the Type 1 (upwind) site for the Boston area and as the Type 3 (downwind) site for the Providence area.
28
The following PAMS pollutants have been monitored in the Rhode Island network: • 24-hour speciated VOC samples have been collected every sixth day year round at the Type
1 and Type 2 sites, VOC samples are collected daily during June, July and August at the Type 2 site. As of June, July and August of 2017, hourly VOC samples will be collected at the East Providence site using an Auto-GC.
• 24-hour carbonyl samples have been collected every sixth day year round at the East
Providence Type 2 site. Eight 3-hour carbonyl samples per day were collected every third day during June, July and August through 2011 at that site. Note that 3-hour carbonyl samples were required only in nonattainment areas classified as serious or above for the 8-hour ozone standard. Since Rhode Island has never had a nonattainment classification higher than “moderate” for that NAAQS, this requirement did not apply to the State.
• In 2016, NOx was measured continuously March through October at the Type 1 site in West Greenwich and year round at the Type 2 site in E. Providence and the MA DEP Type 3 site in Milton, MA.
• Rhode Island has measured reactive nitrogen oxides (NOy) at the Type 2 site since January
2011 to fulfill NCore requirements. EPA regulations require NOy measurements at one Type 3 or Type 1 PAMS site during the ozone season. Rhode Island currently monitors NOx, but not NOy, at its Type 1 site. Similarly, NOx, rather than NOy, is monitored at the Type 3 site in Milton, MA, although MA DEP has measured NOy at that site in the past. Rhode Island does not have any immediate plans to install NOy equipment at the Type 1 site.
• CO is measured year round at the Type 2 site. In 2010, the conventional CO monitor at that
site was replaced with a low-range (ppb) CO monitor, in fulfillment of both NCore and PAMS network requirements.
• Ozone is measured March through October at the West Greenwich and Narragansett sites, since 2011, and will be monitored March –September beginning in 2017, it has been measured year-round at the Type 2 site in East Providence to fulfill NCore requirements. Ozone has also been measured year-round at the Milton, MA site since February 2013.
• Surface meteorological parameters are measured at all three Rhode Island sites and at the Milton, MA site year-round.
• Rhode Island uses the upper air data collected at the Brookhaven, New York meteorological site to fulfill the PAMS requirements for those measurements. PAMS recently revised monitoring rule (80 FR 65292; October 26, 2015) requirements The recently revised monitoring rule (80 FR 65292; October 26, 2015) requires PAMS measurements June 1 through August 31 at NCore sites that are located in Core-Based Statistical Areas (CBSAs) with populations of 1,000,000 or more. The Providence, New Bedford, Fall River, RI-MA Statistical Area qualifies as one of those sites. RIDEM is

29
required to develop an implementation plan for this monitoring rule. PAMS Monitoring Implementation Network Plan RIDEM formerly operated two Photochemical Assessment Monitoring Stations (PAMS) sites in the air monitoring network in 2015, at the West Greenwich and East Providence sites. Network Decision The NCore site located at Francis School in East Providence will serve as the location of the required PAMS site and will measure the following parameters described below. An inventory of equipment used at the site is provided in Table 13. Auto GC Decision Volatile organic compounds (VOCs) – A complete list of the targeted compounds are found in Table 12. We will measure hourly speciated VOC measurements with an auto-gas chromatograph (GC) using Chromatotec GC 866 airmo VOC. Meteorology Measurements Decision RIDEM will measure wind direction, wind speed, temperature, humidity, atmospheric pressure, precipitation, solar radiation, ultraviolet radiation, and mixing height. We have elected to use the following instrumentation to measure the parameters described above: Wind speed- Met One 014A Wind direction – MetOne 6929 Temperature and Humidity all in one – Met One 083D Atmospheric pressure – Met One 091 Precipitation - Met One 370C Solar radiation – LI-COR LI-200SZ pyranometer sensor Ultraviolet radiation – EPLAB model TUVR RIDEM will use a yet to be purchased ceilometer for determining mixing height and plans to
purchase the Vaisala CL51
Other Required Measurements
Carbonyls - Carbonyl sampling at a frequency of three 8-hour samples on a one-in-three day basis (~90 samples per PAMS sampling season) will be accomplished using a yet to be purchased sampler however RIDEM plans on purchasing the ATEC 8000
A complete list of the target carbonyl compounds may be found in Table 12. The TO-11A test method, as used in the National Air Toxics Trends (NATTS) program1 will be used.
1 See NATTS Technical Assistance Document for TO-11A method.

30
Nitrogen Oxides – Will monitor for NO and NOy (total oxides of nitrogen) in addition to true NO2. The true NO2 is required to be measured with a direct reading NO2 analyzer, cavity attenuated phase shift (CAPS) spectroscopy or photolytic-converter NOx analyzer. We have not yet purchased a monitor for the true NO2 measurement but plan on purchasing the TAPI T500U (CAPS)
NO and NOy will be measured using a Thermo 42iY
PAMS Implementation Plan Waiver Requests and Rationale
Meteorological Waiver Request
We request a waiver to allow meteorological measurements, in particular mixing height using the ceilometer. We hope to the Vernon Street site which is approximately 2.5 miles from the NCORE site located at the Myron Francis School in East Providence. Rationale for Waiver
This request is precautionary since there may be problems depending on siting criteria associated with this instrument. There may not be sufficient space and may be permitting issues with the City of East Providence when trying to place this instrument at the East Providence site. The site at Vernon Street has sufficient space, is 2.5 miles away, and located on the same side of the river. Every effort will be made to place this instrument at the NCORE site, but this waiver is requested to insure that the meteorological data can be obtained nearby.
Table 12: PAMS Target Compound List
Priority Compounds Optional Compounds 1 1,2,3-trimethylbenzene a 19 n-hexane b 1 1,3,5-trimethylbenzene 19 m-diethlybenzene 2 1,2,4-trimethylbenzene a 20 n-pentane 2 1-pentene 20 methylcyclohexane 3 1-butene 21 o-ethyltoluene a 3 2,2-dimethylbutane 21 methylcyclopentane 4 2,2,4-trimethylpentane b 22 o-xylene a, b 4 2,3,4-trimethylpentane 22 n-decane 5 acetaldehyde b, c 23 p-ethyltoluene a 5 2,3-dimethylbutane 23 n-heptane 6 acetone c, d 24 Propane 6 2,3-dimethylpentane 24 n-nonane 7 benzene a ,b 25 propylene 7 2,4-dimethylpentane 25 n-octane 8 c-2-butene 26 styrene a, b 8 2-methylheptane 26 n-propylbenzene a 9 ethane d 27 toluene a ,b 9 2-methylhexane 27 n-undecane
10 ethylbenzene a ,b 28 t-2-butene 10 2-methylpentane 28 p-diethylbenzene 11 Ethylene 11 3-methylheptane 29 t-2-pentene 12 formaldehyde b,c 12 3-methylhexane 30 α/β-pinene 13 Isobutane 13 3-methylpentane 31 1,3 butadiene b 14 Isopentane 14 Acetylene 32 benzaldehyde c 15 Isoprene 15 c-2-pentene 33 carbon tetrachloride b 16 m&p-xylenes a ,b 16 cyclohexane 34 Ethanol 17 m-ethyltoluene a 17 cyclopentane 35 Tetrachloroethylene b
18 n-butane 18 isopropylbenzene b Source: Revisions to the Photochemical Assessment Monitoring Stations Compound Target List. U.S. EPA, November 20, 2013 a Important SOAP (Secondary Organic Aerosols Precursor) Compounds

31
b HAP (Hazardous Air Pollutant) Compounds c Carbonyl compounds d Non-reactive compounds, not considered to be VOC for regulatory purposes
Table 13: Inventory at East Providence Site
NAME Manufacturer Model Black Carbon-Aethalometer Teldyne M633 Black Carbon-Aethalometer Magee AE16-ER Carbonyl sampler Atec 2200 Carbonyl sampler Atec 2200 Wind direction sensor MetOne 590S (6929) Pure air generator aadco 737-R-12A Chemiluminescence NO-NO2-NOx Analyzer Thermo 42ITL Sulphur Dioxide analyzer Thermo 43ITLE Caron Monoxide analyzer Thermo TE48i Data logger Agilaire 8832 Hydrogen generator Packard H2PD-150NA Translator module MetOne 126 Translator module MetOne 2270 Barometric pressure sensor MetOne 091 Rain sensor MetOne 370-8" Relative Humidity/temp sensor MetOne 083D-1-35 Met Station Tower MetOne Ultraviolet radiation sensor EPLAB TUVR Wind Speed sensor MetOne 014A Solar Radiation pyranometer sensor LI-COR LI-200SZ Chemiluminescence NO-DIF-NOy Analyzer Thermo TE42iY Ozone analyzer Thermo TE49i PM2.5 Sampler MetOne 1020 PM2.5 Speciation MetOne SASS PM2.5 Partisol-Plus R&P 2025 PM2.5 Partisol-Plus R&P 2025 Standard Calibrator, API M700E Standard Calibrator Environics 6103 Standard-Zero Air Teledyne 701 VOC sampler Xontech 910A VOC sampler Xontech 910A Compac II AC units Marvair Compac II AC units Marvair GC custom Agilent 7890A Mass Spec Agilent 5973N Auto GC Chromtaotec 866 Ceilometer ** Vaisala CL51 Carbonyl Sampler ** Atec 8000 True No2** Teledyne T500U
** To be purchased

32
The EPA promulgated a new NAAQS for ozone effective December 28, 2015. As a result, the following changes to the PAMS program have occurred as a result of the new regulations.
• The network design change involved EPA requiring PAMS measurements minimally during
the PAMS (summer) sampling season, which is June 1 through August 31, at all NCore sites in Core-Based Statistical Areas (CBSAs) with a population of 1,000,000 people or more. Note that, since the Rhode Island Type 2 PAMS site is also the State’s NCore site, this requirement would not necessitate a relocation of that site. The second part of the network design requires states with moderate or above non-attainment areas and states in the Ozone Transport Region (OTR) to develop and implement Enhanced Monitoring Plans (EMPs). These EMPs are intended to provide monitoring organizations with flexibility to implement additional monitoring to suit the needs of their area.
• Since it is strongly suggested that all required PAMS sites take hourly speciated VOC
measurements with auto-gas chromatographs (GCs). RI DEM has purchased and will employ a continuous GC at the East Providence PAMS site for summer 2017.
• All required PAMS sites must monitor for NO and NOy (total oxides of nitrogen) in addition
to true NO2, where the latter must be measured with a direct reading NO2 analyzer, cavity attenuated phase shift (CAPS) spectroscopy analyzer, or photolytic-converter NOx analyzer. Rhode Island installed a FRM low-range NO2/NOx analyzer at the East Providence site in 2013 and operates that analyzer year-round. EPA’s preferences for a particular NO2/NOx monitoring technology will be considered when replacement of that equipment is necessary.
• All required PAMS sites must measure wind direction, wind speed, temperature, humidity,
atmospheric pressure, precipitation, solar radiation, ultraviolet radiation and mixing height. Although EPA is suggesting the use of ceilometers for mixing height, other types of meteorological equipment that provide for an indication of mixing height can be proposed. A waiver to allow meteorological measurements to be obtained from other nearby sites, such as National Oceanic and Atmospheric Administration Automated Surface Observing System sites. The required parameters are measured at the E. Providence site, and the location of mixing height measurements will be considered prior to the required implantation date.
As discussed above, Rhode Island has purchased and will employ a continuous GC for measuring one-hour average speciated VOCs at the East Providence PAMS site summer 2017. RI DEM will develop an Enhanced Monitoring Plan (EMP) for implementing additional applicable PAMS requirements, including a possible expansion of the carbonyl monitoring program.

33
Air Toxics Rhode Island operates one site that is part of the National Air Toxics Trends Stations (NATTS) network. The primary purposes of the NATTS network are to track trends in ambient air toxics levels, to characterize exposures, and to measure progress toward emission and risk reduction goals. The Rhode Island NATTS site is located on the roof of the Urban League building in an urban residential neighborhood on the south side of Providence, approximately ½ mile west of I-95. This site was chosen as the State’s NATTS site because it is not dominated by local sources and because levels of air toxics at this site appear to be representative of those in urban areas in the State. Note that, since the long-term future of the Urban League building is unknown at this time, RI DEM is working to identify nearby locations to which the NATTS site could be moved if necessary. RI DEM will request the EPA’s approval of the new proposed location at CCRI if we succeed in obtaining the necessary agreements with CCRI
In keeping with EPA requirements, the following pollutants, at a minimum, are measured at the Rhode Island NATTS site: Volatile Organic Compounds (VOC) Acrolein Perchloroethylene (tetrachloroethylene) Benzene Carbon tetrachloride Chloroform Trichloroethylene 1,3-butadiene Vinyl Chloride Carbonyls Formaldehyde Acetaldehyde Metals Nickel compounds (PM10) Arsenic compounds (PM10) Cadmium compounds (PM10) Manganese compounds (PM10) Beryllium (PM10) Hexavalent chromium (TSP) – Discontinued as of the end of June 2013 in accordance
with changing EPA priorities. Lead (Pb) – discontinued on 4/30/2016 Semi-Volatile Organic Compounds (SVOC) Benzo(a)pyrene Napthalene

34
VOC, carbonyls and PM10 metal samples are analyzed by RI DOH. Semi-Volatile Organic Compounds (SVOC) samples are analyzed by an EPA contractor. Note that, due to the redirection of EPA resources, monitoring for hexavalent chromium in Rhode Island was discontinued at the end of June 2013. Sampling at the NATTS site is conducted for all of the above parameters for 24-hour periods every sixth day. 24-hour VOC samples are also collected every sixth day at the West Greenwich site, East Providence site, and at the Vernon Street site, which is adjacent to I-95 in Pawtucket. 24-hour carbonyl samples are collected at the East Providence site on the same schedule.
In addition, RI DEM /RI DOH operates aethalometers, which measure black carbon, an indicator of diesel exhaust, at the Urban League NATTS site and the East Providence PAMS/NCore site and, as of April 2014, at the near-road site in Providence.
RI DEM has discontinued its lead monitoring at the East Providence site as of 6/30/2016. In addition the Rhode Island NATTS site may be moved from the Urban League Building to the roof of the Community College of Rhode Island which is very close by as soon as negotiations are finalized. No other changes are planned for the ozone precursor or air toxics monitoring sites in the next 18 months.
National Core (NCore) Multi-pollutant Monitoring Stations Network
As required in an October 17, 2006 Federal Register notice (FR 71:61236), Rhode Island began operating a site that is part of EPA’s network of core multipollutant monitoring (NCore) stations in January 2011. This network is designed to address the following monitoring objectives:
• Timely reporting of data to the public through AIRNow, air quality forecasting, and other public reporting mechanisms
• Supporting development of emission strategies through air quality model evaluation and other observational methods
• Accessing accountability of emission strategy progress through tracking long-term trends of criteria and non-criteria pollutants and their precursors
• Supporting long-term health assessments that contribute to ongoing reviews of the NAAQS
• Establishing nonattainment/attainment areas by comparison with the NAAQS • Supporting multiple disciplines of scientific research, including; public health,
atmospheric and ecological.
The East Providence site is operating as the State’s NCore site. Ozone, low-range NO2/NOx, reactive oxides of nitrogen (NOy), low-range CO, low range SO2, PM2.5 (FRM, continuous and speciated), coarse PM (PM10-2.5), VOCs, carbonyls, black carbon, lo-vol PM10 lead, and meteorological parameters are monitored at that site. PM10-2.5 is measured as the difference between lo-vol PM10 and lo-vol PM2.5 concentrations. Note that the conventional NO2/NOx monitor at this site was replaced by a low-range NO2/NOx monitor in January 2013 and is being operated year-round. EPA deleted the requirement to monitor for non-source lead at NCore sites from Appendix D of 40 CFR part 58.16 and to allow monitoring agencies to request permission to discontinue non-source monitoring following the collection of at least 3 years of data at urban NCore sites. Since ambient lead monitoring was conducted in the State for more than 3 years and

35
the lead levels were consistently considerably lower than the NAAQS since the inception of monitoring, RI DEM had asked for and received permission to discontinue monitoring as of June 30, 2016.

36
Detailed Site Information The following section presents detailed information for each monitoring site, such as: identification code, location, history, monitored parameters, monitoring objectives, history and descriptive information.
Town – Site: East Providence – Myron Francis School
County: Providence Latitude: 41.841039° Address: 64 Bourne Street Longitude: -71.36097° AQS Site ID: 440071010 Elevation: 62 ft.
Spatial Scale: Neighborhood/ Urban Year Established: 1993
Statistical Area: Providence, New Bedford, Fall River, RI-MA Metropolitan Statistical Area
PM
2.5
(FR
M),
1:3
(E
xcep
t A
J 1
:6)
PM
2.5
(FR
M,
Co
llo
cate
d),
1:6
PM
2.5
(C
on
tin
uo
us
- FE
M)
PM
10
/P
M-
(FR
M),
1:6
PM
10
/P
M-
(FR
M,
Co
llo
cate
d),
1:6
PM
10
/P
M-C
oar
se,
1:3
Pol
ycyc
lic a
rom
atic
hyd
roca
rbon
s (P
AH
), 1
:6
Sp
ecia
tio
n,
PM
2.5
su
per
SA
SS
(C
SN
),
1:3
P
M2
.5 C
arb
on
(U
RG
) (C
SN
),1
:3
Ozo
ne
SO
2
CO
Dir
ect
NO
2
NO
/N
O2/
NO
x
NO
/N
Oy
VO
Cs
24
HR
Ca
nis
ter
( N
AT
TS
, S
tate
)
VO
Cs
Ho
url
y P
AM
S
Bla
ck C
arb
on
Bla
ck C
arb
on
, C
oll
oca
ted
C
arb
on
yls,
1:6
Car
bo
nyl
s C
oll
oca
ted
, 1
:12
Par
ticl
e C
ou
nte
r
Win
d S
pee
d
Win
d D
irec
tio
n
Tem
per
atu
re
Dew
Po
int
/ R
el.
Hu
mid
ity
Bar
om
etri
c P
ress
ure
So
lar
Rad
iati
on
UV
Rad
iati
on
Pre
cip
itat
ion
X X X X X X X X X X X S X X X X X X X X X S S S
x=Existing P = Planned in 2015/16 T = Proposed to terminate in 2016/2017 S =Seasonal 6/1-8/30: O3 & NOX 3/1-9/30
Site Description: The Myron Francis School site is a neighborhood scale site located in a suburban area in north-eastern Rhode Island in the City of East Providence. This site is operated by RIDEM as part of the NCORE and PAMS network. Land use type: Playground/sports fields/Residential/Elementary School. It is located near Interstate RT 195 approximately 2 miles south, Pawtucket Ave. <1/2 mile to the north, North Broadway <1/2 mile to the south / east. This site is located behind an elementary school, on the backside of the school playground; it sits on city property, recreational park. It abuts residential property to the south. The trailer is approximately 12 X 23 feet with an attached shed housing liquid nitrogen. Monitoring Objectives: The Myron Francis School monitoring site objective is to collect air quality measurements to assess long-terms trends as part of the national NCORE and PAMS network. Planned changes for 2016-2017: None.

37
Town – Site: West Greenwich –Alton Jones Campus
County: Providence Latitude: 41.61537° Address: 401 Victory Highway Longitude: -71.72° AQS Site ID: 440030002 Elevation: 253 ft.
Spatial Scale: Regional Year Established: 1976
Statistical Area: Providence, New Bedford, Fall River, RI-MA Metropolitan Statistical Area
PM
2.5
(FR
M),
1:3
(E
xcep
t A
J 1
:6)
PM
2.5
(FR
M,
Co
llo
cate
d),
1:6
PM
2.5
(C
on
tin
uo
us
- FE
M)
PM
10
/P
M-
(FR
M),
1:6
PM
10
/P
M-
(FR
M,
Co
llo
cate
d),
1:6
PM
10
/P
M-C
oar
se,
1:3
Pol
ycyc
lic a
rom
atic
hyd
roca
rbon
s (P
AH
), 1
:6
S
pec
iati
on
, P
M2
.5 s
up
er S
AS
S (
CS
N),
1
3
PM
2.5
Car
bo
n (
UR
G)
(CS
N),
1:3
Ozo
ne
SO
2
CO
Dir
ect
NO
2
NO
/N
O2/
NO
x
NO
/N
Oy
VO
Cs
24
HR
Ca
nis
ter
( N
AT
TS
, S
tate
)
VO
Cs
Ho
url
y P
AM
S
Bla
ck C
arb
on
Bla
ck C
arb
on
, C
oll
oca
ted
C
arb
on
yls,
1:6
Car
bo
nyl
s C
oll
oca
ted
, 1
:12
Par
ticl
e C
ou
nte
r
Win
d S
pee
d
Win
d D
irec
tio
n
Tem
per
atu
re
Dew
Po
int
/ R
el.
Hu
mid
ity
Bar
om
etri
c P
ress
ure
So
lar
Rad
iati
on
UV
Rad
iati
on
Pre
cip
itat
ion
T X T S T X X X X X S x=Existing P = Planned in 2015/16 T = Proposed to terminate in 2016/2017 S = Seasonal 6/1-8/30: O3 & NOX 3/1-9/30
Site Description: The Alton Jones site is a regional scale site located in a meadow surrounded by trees in Rhode Island in the town of West Greenwich. This site is operated by RIDEM as part of the SLAMS and PAMS network. Land use type: Forest and recreation field. It is located near RT 102 approximately 2.5 miles east, and Interstate I-95, 5 miles south. The trailer approximately 12’X12’, with a pressure treated deck off to the east side of the trailer. A meteorological tower sits on the west side of the trailer. Monitoring Objectives: The Alton Jones monitoring site objective is to collect air quality measurements to assess long-terms trends as part of the SLAMS network. Planned changes for 2016-2017: We are terminating the PM2.5 FRM, the PM10 FRM, and the NO/NO2/NOx monitors on the December 31, 2017.

38
Town – Site: Providence – Rockefeller Library Brown Univ.
County: Providence Latitude: 41.82556° Address: 10 Prospect Street Longitude: -71.40528° AQS Site ID: 440070012 Elevation: 75 ft. Spatial Scale: Neighborhood Year Established: 1975
Statistical Area: Providence, New Bedford, Fall River, RI-MA Metropolitan Statistical Area
PM
2.5
(FR
M),
1:3
(E
xcep
t A
J 1
:6)
PM
2.5
(FR
M,
Co
llo
cate
d),
1:6
PM
2.5
(C
on
tin
uo
us
- FE
M)
PM
10
/P
M-
(FR
M),
1:6
PM
10
/P
M-
(FR
M,
Co
llo
cate
d),
1:6
PM
10
/P
M-C
oar
se,
1:3
Pol
ycyc
lic a
rom
atic
hyd
roca
rbon
s (P
AH
), 1
:6
Sp
ecia
tio
n,
PM
2.5
su
per
SA
SS
(C
SN
), 1
:3
PM
2.5
Car
bo
n (
UR
G)
(CS
N),
1:3
Ozo
ne
SO
2
CO
Dir
ect
NO
2
NO
/N
O2/
NO
x
NO
/N
Oy
VO
Cs
24
HR
Ca
nis
ter
( N
AT
TS
, S
tate
)
VO
Cs
Ho
url
y P
AM
S
Bla
ck C
arb
on
Bla
ck C
arb
on
, C
oll
oca
ted
C
arb
on
yls,
1:6
Car
bo
nyl
s C
oll
oca
ted
, 1
:12
Par
ticl
e C
ou
nte
r
Win
d S
pee
d
Win
d D
irec
tio
n
Tem
per
atu
re
Dew
Po
int
/ R
el.
Hu
mid
ity
Bar
om
etri
c P
ress
ure
So
lar
Rad
iati
on
UV
Rad
iati
on
Pre
cip
itat
ion
T T x=Existing P = Planned in 2015/16 T = Proposed to terminate in 2016/2017 S = Seasonal 6/1-8/30: O3 & NOX 3/1-9/30
Site Description: The Rockefeller Library site is an urban City Center commercial scale site located on the 5th floor of the Brown University Library; in a corner of the utility room in an urban area in the City of Providence. A glass manifold is extended about 1.5 meters out the side of (South East) of the building. This site is operated by RIDEM. Land use type: City It is located on the corner of Prospect and George St., Benefit Street is 344.5 ft. to the west, South Main St. is 652.6 ft. to the west, I-195 is 3,510.9 ft. to the south, I 95 is 3,676.9 ft. to the west. This site is located on 5th floor of the library overlooking the city. Street traffic is light to moderate. Monitoring Objectives: The Brown University monitoring site objective is to collect air quality measurements within an urban city setting. Planned changes for 2016-2017: Propose to terminate in 2017.

39
Town – Site: Narragansett – US EPA Laboratory
County: Washington Latitude: 41.495511° Address: 27 Tarzwell Drive Longitude: -71.423705° AQS Site ID: 440090007 Elevation: 19.69 ft. Spatial Scale: Regional Year Established: 1997
Statistical Area: Providence, New Bedford, Fall River, RI-MA Metropolitan Statistical Area
PM
2.5
(FR
M),
1:3
(E
xcep
t A
J 1
:6)
PM
2.5
(FR
M,
Co
llo
cate
d),
1:6
PM
2.5
(C
on
tin
uo
us
- FE
M)
PM
10
/P
M-
(FR
M),
1:6
PM
10
/P
M-
(FR
M,
Co
llo
cate
d),
1:6
PM
10
/P
M-C
oar
se,
1:3
Pol
ycyc
lic a
rom
atic
hyd
roca
rbon
s (P
AH
), 1
:6
S
pec
iati
on
, P
M2
.5 s
up
er S
AS
S (
CS
N),
1
3
PM
2.5
Car
bo
n (
UR
G)
(CS
N),
1:3
Ozo
ne
SO
2
CO
Dir
ect
NO
2
NO
/N
O2/
NO
x
NO
/N
Oy
VO
Cs
24
HR
Ca
nis
ter
( N
AT
TS
, S
tate
)
VO
Cs
Ho
url
y P
AM
S
Bla
ck C
arb
on
Bla
ck C
arb
on
, C
oll
oca
ted
C
arb
on
yls,
1:6
Car
bo
nyl
s C
oll
oca
ted
, 1
:12
Par
ticl
e C
ou
nte
r
Win
d S
pee
d
Win
d D
irec
tio
n
Tem
per
atu
re
Dew
Po
int
/ R
el.
Hu
mid
ity
Bar
om
etri
c P
ress
ure
So
lar
Rad
iati
on
UV
Rad
iati
on
Pre
cip
itat
ion
X S X X X X x=Existing P = Planned in 2015/16 T = Proposed to terminate in 2016/2017 S = Seasonal 6/1-8/30: O3 & NOX 3/1-9/30
Site Description: The Narragansett USEPA laboratory is a regional scale site located 425 feet from the bay in southern Rhode Island in the town of Narragansett. This site is operated by RIDEM as part of SLAMS network. Equipment is in a small office on the east side of the EPA building. A staircase in the back of the building leads to the roof where the continuous PM2.5 sampler is placed. A meteorological tower sits on the east side of the building. RT 1 is 1.7 miles south. Rhode Island sound is 425 ft. to the east and the building sits at the top of a hill. Monitoring Objectives: The Narragansett USEPA monitoring site objective is to collect air quality measurements to assess long-terms trends as part of the national SLAMS network. Planned changes for 2016-2017: None.

40
Town – Site: Providence – Urban League
County: Providence Latitude: 41.80776° Address: 212 Prairie Avenue Longitude: -71.415105° AQS Site ID: 440070022 Elevation: 75 ft. Spatial Scale: Neighborhood Year Established: 1999
Statistical Area: Providence, New Bedford, Fall River, RI-MA Metropolitan Statistical Area
PM
2.5
(FR
M),
1:3
(E
xcep
t A
J 1
:6)
PM
2.5
(FR
M,
Co
llo
cate
d),
1:6
PM
2.5
(C
on
tin
uo
us
- FE
M)
PM
10
/P
M-
(FR
M),
1:6
PM
10
/P
M-
(FR
M,
Co
llo
cate
d),
1:6
PM
10
/P
M-C
oar
se,
1:3
Po
lycy
clic
aro
ma
tic
hyd
roca
rbo
ns
(PA
H),
1:6
Sp
ecia
tio
n,
PM
2.5
su
per
SA
SS
(C
SN
),
1:3
P
M2
.5 C
arb
on
(U
RG
) (C
SN
),1
:3
Ozo
ne
SO
2
CO
Dir
ect
NO
2
NO
/N
O2/
NO
x
NO
/N
Oy
VO
Cs
24
HR
Ca
nis
ter
( N
AT
TS
, S
tate
)
VO
Cs
Ho
url
y P
AM
S
Bla
ck C
arb
on
Bla
ck C
arb
on
, C
oll
oca
ted
C
arb
on
yls,
1:6
Car
bo
nyl
s C
oll
oca
ted
, 1
:12
Par
ticl
e C
ou
nte
r
Win
d S
pee
d
Win
d D
irec
tio
n
Tem
per
atu
re
Dew
Po
int
/ R
el.
Hu
mid
ity
Bar
om
etri
c P
ress
ure
So
lar
Rad
iati
on
UV
Rad
iati
on
Pre
cip
itat
ion
T X+ X X X X X X X X X X X X x=Existing P = Planned in 2015/16 T = Proposed to terminate in 2016/2017 S = Seasonal 6/1-8/30: O3 & NOX 3/1-9/30
X+ Collocated PM2.5 FRM terminated 3/31/2016 for site construction, 1:6
Site Description: The Urban League site is a neighborhood scale site located in an urban area in north-eastern Rhode Island in the City of Providence. This site is operated by RIDEM as part of the SLAMS and toxics network. This site sits on the roof of a building approximately 18 feet off the ground. On the east side of this building is a 2 story school. There are some trees, residences and 2 story homes and buildings surrounding the location. It has street traffic from Prairie Ave, with Broad St. 2.8 miles west, and Elmwood Avenue 3.24 miles west. Interstate I-95 is 1.4 miles east with RI Hospital 2.23 miles away. Monitoring Objectives: The Urban League monitoring site objective is to collect air quality measurements to assess long-terms trends as part of the SLAMS and NATTS network. Planned changes for 2016-2017: Site will be moved to an alternative location nearby at the Community College of RI as soon as an agreement is finalized.

41
Town – Site: Pawtucket – Vernon Street
County: Providence Latitude: 41.874668° Address: Vernon Street Longitude: -71.379971° AQS Site ID: 440070026 Elevation: 36 ft.
Spatial Scale: Middle Year Established: 2001
Statistical Area: Providence, New Bedford, Fall River, RI-MA Metropolitan Statistical Area
PM
2.5
(FR
M),
1:3
(E
xcep
t A
J 1
:6)
PM
2.5
(FR
M,
Co
llo
cate
d),
1:6
PM
2.5
(C
on
tin
uo
us
- FE
M)
PM
10
/P
M-
(FR
M),
1:6
PM
10
/P
M-
(FR
M,
Co
llo
cate
d),
1:6
PM
10
/P
M-C
oar
se,
1:3
Po
lycy
clic
aro
ma
tic
hyd
roca
rbo
ns
(PA
H),
1:6
S
pec
iati
on
, P
M2
.5 s
up
er S
AS
S (
CS
N),
1
:3
PM
2.5
Car
bo
n (
UR
G)
(CS
N),
1:3
Ozo
ne
SO
2
CO
Dir
ect
NO
2
NO
/N
O2/
NO
x
NO
/N
Oy
VO
Cs
24
HR
Ca
nis
ter
( N
AT
TS
, S
tate
)
VO
Cs
Ho
url
y P
AM
S
Bla
ck C
arb
on
Bla
ck C
arb
on
, C
oll
oca
ted
C
arb
on
yls,
1:6
Car
bo
nyl
s C
oll
oca
ted
, 1
:12
Par
ticl
e C
ou
nte
r
Win
d S
pee
d
Win
d D
irec
tio
n
Tem
per
atu
re
Dew
Po
int
/ R
el.
Hu
mid
ity
Bar
om
etri
c P
ress
ure
So
lar
Rad
iati
on
UV
Rad
iati
on
Pre
cip
itat
ion
X X* X X x=Existing P = Planned in 2015/16 T = Proposed to terminate in 2016/2017 S = Seasonal 6/1-8/30: O3 & NOX 3/1-9/30
X* collocated FRM started 4/1/2-16, 1:6
Site Description: The Vernon Street site is a middle scale site located in a suburban area in north-eastern Rhode Island in the City of Pawtucket. This site is operated by RIDEM as part of the SLAMS and Toxics network. Land use type: Highway/ Residential. It is located at grass level adjacent to Interstate RT I-95 and sits midway on a hill near the on-ramp with houses on the east-south sides. This site is a small grassy median situated 22 meters from I-95 North and 7.6 meters to the ramp leading to the highway. The samplers are placed on a cement platform and pressure treated deck. The area is surrounded by a chain link fence. Monitoring Objectives: The Vernon Street monitoring site objective is to collect air quality measurements to assess long-terms trends as part of the national SLAMS and Toxics network. Planned changes for 2016-2017: None.
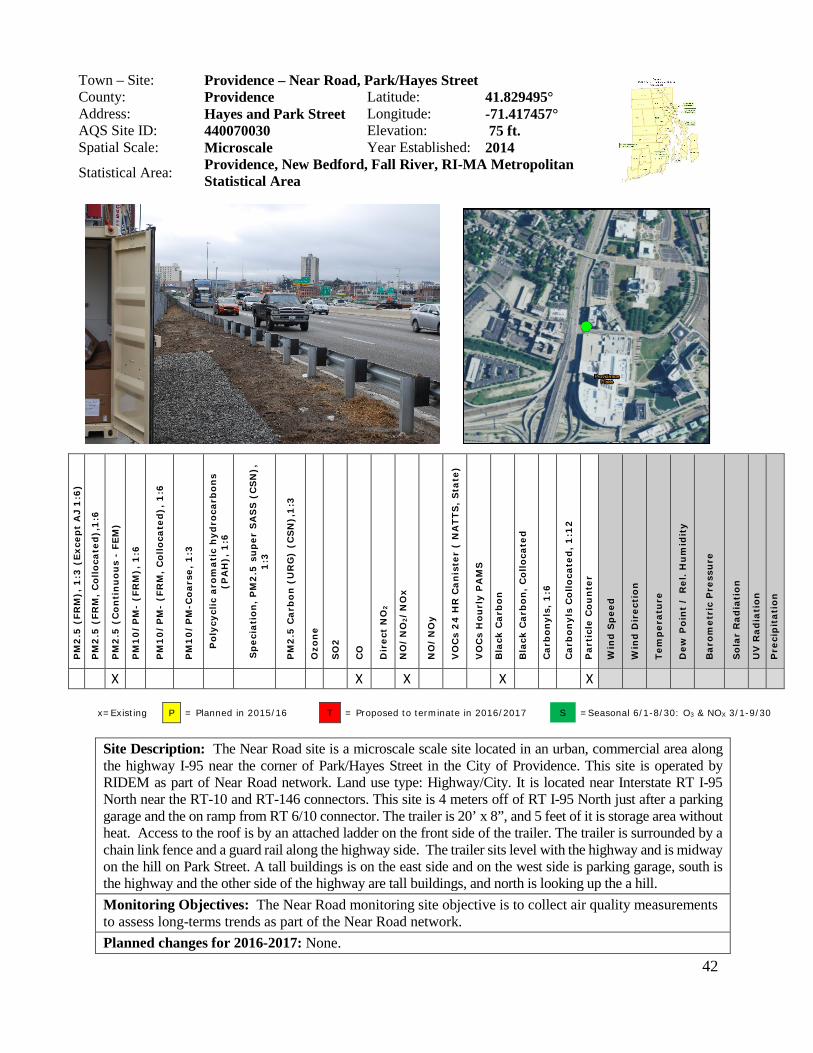
42
Town – Site: Providence – Near Road, Park/Hayes Street
County: Providence Latitude: 41.829495° Address: Hayes and Park Street Longitude: -71.417457° AQS Site ID: 440070030 Elevation: 75 ft. Spatial Scale: Microscale Year Established: 2014
Statistical Area: Providence, New Bedford, Fall River, RI-MA Metropolitan Statistical Area
PM
2.5
(FR
M),
1:3
(E
xcep
t A
J 1
:6)
PM
2.5
(FR
M,
Co
llo
cate
d),
1:6
PM
2.5
(C
on
tin
uo
us
- FE
M)
PM
10
/P
M-
(FR
M),
1:6
PM
10
/P
M-
(FR
M,
Co
llo
cate
d),
1:6
PM
10
/P
M-C
oar
se,
1:3
Po
lycy
clic
aro
ma
tic
hyd
roca
rbo
ns
(PA
H),
1:6
S
pec
iati
on
, P
M2
.5 s
up
er S
AS
S (
CS
N),
1
:3
PM
2.5
Car
bo
n (
UR
G)
(CS
N),
1:3
Ozo
ne
SO
2
CO
Dir
ect
NO
2
NO
/N
O2/
NO
x
NO
/N
Oy
VO
Cs
24
HR
Ca
nis
ter
( N
AT
TS
, S
tate
)
VO
Cs
Ho
url
y P
AM
S
Bla
ck C
arb
on
Bla
ck C
arb
on
, C
oll
oca
ted
C
arb
on
yls,
1:6
Car
bo
nyl
s C
oll
oca
ted
, 1
:12
Par
ticl
e C
ou
nte
r
Win
d S
pee
d
Win
d D
irec
tio
n
Tem
per
atu
re
Dew
Po
int
/ R
el.
Hu
mid
ity
Bar
om
etri
c P
ress
ure
So
lar
Rad
iati
on
UV
Rad
iati
on
Pre
cip
itat
ion
X X X X X x=Existing P = Planned in 2015/16 T = Proposed to terminate in 2016/2017 S =Seasonal 6/1-8/30: O3 & NOX 3/1-9/30
Site Description: The Near Road site is a microscale scale site located in an urban, commercial area along the highway I-95 near the corner of Park/Hayes Street in the City of Providence. This site is operated by RIDEM as part of Near Road network. Land use type: Highway/City. It is located near Interstate RT I-95 North near the RT-10 and RT-146 connectors. This site is 4 meters off of RT I-95 North just after a parking garage and the on ramp from RT 6/10 connector. The trailer is 20’ x 8”, and 5 feet of it is storage area without heat. Access to the roof is by an attached ladder on the front side of the trailer. The trailer is surrounded by a chain link fence and a guard rail along the highway side. The trailer sits level with the highway and is midway on the hill on Park Street. A tall buildings is on the east side and on the west side is parking garage, south is the highway and the other side of the highway are tall buildings, and north is looking up the a hill. Monitoring Objectives: The Near Road monitoring site objective is to collect air quality measurements to assess long-terms trends as part of the Near Road network. Planned changes for 2016-2017: None.

43
Town – Site: Providence – Johnson & Wales
County: Providence Latitude: 41.822499° Address: 111 Dorrance Street Longitude: -71.410659° AQS Site ID: 440070027 Elevation: 17 ft.
Spatial Scale: Neighborhood Year Established: 2004
Statistical Area: Providence, New Bedford, Fall River, RI-MA Metropolitan Statistical Area
PM
2.5
(FR
M),
1:3
(E
xcep
t A
J 1
:6)
PM
2.5
(FR
M,
Co
llo
cate
d),
1:6
PM
2.5
(C
on
tin
uo
us
- FE
M)
PM
10
/P
M-
(FR
M),
1:6
PM
10
/P
M-
(FR
M,
Co
llo
cate
d),
1:6
PM
10
/P
M-C
oar
se,
1:3
Pol
ycyc
lic a
rom
atic
hyd
roca
rbon
s (P
AH
), 1
:6
S
pec
iati
on
, P
M2
.5 s
up
er S
AS
S (
CS
N),
1
3
PM
2.5
Car
bo
n (
UR
G)
(CS
N),
1:3
Ozo
ne
SO
2
CO
Dir
ect
NO
2
NO
/N
O2/
NO
x
NO
/N
Oy
VO
Cs
24
HR
Ca
nis
ter
( N
AT
TS
, S
tate
)
VO
Cs
Ho
url
y P
AM
S
Bla
ck C
arb
on
Bla
ck C
arb
on
, C
oll
oca
ted
C
arb
on
yls,
1:6
Car
bo
nyl
s C
oll
oca
ted
, 1
:12
Par
ticl
e C
ou
nte
r
Win
d S
pee
d
Win
d D
irec
tio
n
Tem
per
atu
re
Dew
Po
int
/ R
el.
Hu
mid
ity
Bar
om
etri
c P
ress
ure
So
lar
Rad
iati
on
UV
Rad
iati
on
Pre
cip
itat
ion
T x=Existing P = Planned in 2015/16 T = Proposed to terminate in 2016/2017 S =Seasonal 6/1-8/30: O3 & NOX 3/1-9/30
Site Description: The Johnson & Wales site is a neighborhood scale site located in an urban area in downtown Providence, Rhode Island. This site is operated by RIDEM as part of the SLAMS network. Land use type: City. It is located on the roof of the Johnson & Wales University library in downtown Providence. It is four stories high and surrounded by buildings (many taller than the library). It is a busy traffic area of downtown with many tall building close together. RT–195 is 3,603 feet to the west and I-95 is 2,504 feet to the south. Monitoring Objectives: The Johnson & Wales monitoring site objective is to collect air quality measurements to assess long-terms trends as part of the national SLAMS network. This site was closed on: September 30, 2016

44

45

46

47

48
Figure 5
RI Air Quality Monitoring Network