draft risk evaluation for perchloroethylene, systematic
TRANSCRIPT
United States Office of Chemical Safety and Environmental Protection Agency Pollution Prevention
Final Risk Evaluation for Perchloroethylene
Systematic Review Supplemental File:
Consumer and General Population Exposure Monitoring Data Extraction Tables
CASRN: 127-18-4
December 2020

Monitoring Data Extracted for Percloroethylene for Indoor Air, Personal Breathing Zone, Surface Water, and Wastewater
Country State/City/Region Site Year
No. of
Samples
(Det.
Freq.)
Detection
Level
Concentration Reference (HERO ID)
Range Central
Tendency
Standard
Deviation HERO Citation
Data
Eval.
Score
Indoor Air (µg/m3)
US Michigan (south-
east)
Commercial/Publi
c Office area of
commercial
buildings (n=4),
including two art
museums, a
university building
and a tire
store/auto service.
Stationary samples
collected from breathing height.
2005-
2008
5 (0.8) 0.002 ND to 39.7 8.02 (mean);
0.1 (median)
0.91 2214330 (Jia et al., 2010) High
US Detroit, MI area Residential
Homes (n=126)
with children
with asthma
2009-
2010
126
(0.91)
0.09 ND to 13.7 0.71 (mean);
0.26 (median)
-- 2443355 (Chin et al., 2014) High
US California
(statewide) Commercial/Public
Furniture/hardware stores (n=8)
2011-
2013
58 (0.48) 0.32 0.32 to 22.2 5.6 (mean);
NR (median) -- 2535652 (Chan et al.,
2014) High
US California
(statewide)
Commercial/Public
Grocery stores (n=8)
2011-
2013
76 (0.32) 0.32 0.32 to 5.9 1 (mean); NR
(median)
-- 2535652 (Chan et al.,
2014)
High
US California
(statewide) Commercial/Public
Apparel stores (n=2)
2011-
2013
20 (0.3) 0.32 0.32 to NR 0.2 (mean);
NR (median)
-- 2535652 (Chan et al.,
2014)
High
US Baltimore, MD Commercial/Publi
c (Near Source:
photocopy shop)
Personal samples
from breathing
zone. One from
each of the three printing centers.
2000 4 (1) NR 0.678 to 3.39 2.04 (mean);
1.36 (median)
4.75 1953674 (Stefaniak et al.,
2000)
High
US Baltimore, MD Commercial/Publi
c (Near Source:
photocopy shop) Area samples from
2000 17 (0.94) NR ND to 21.7 2.04 (mean);
1.36 (median)
-- 1953674 (Stefaniak et al.,
2000)
High
1 of 33
Country State/City/Region Site Year
No. of
Samples
(Det.
Freq.)
Detection
Level
Concentration Reference (HERO ID)
Range Central
Tendency
Standard
Deviation HERO Citation
Data
Eval.
Score
different locations
within each of the
three printing centers.
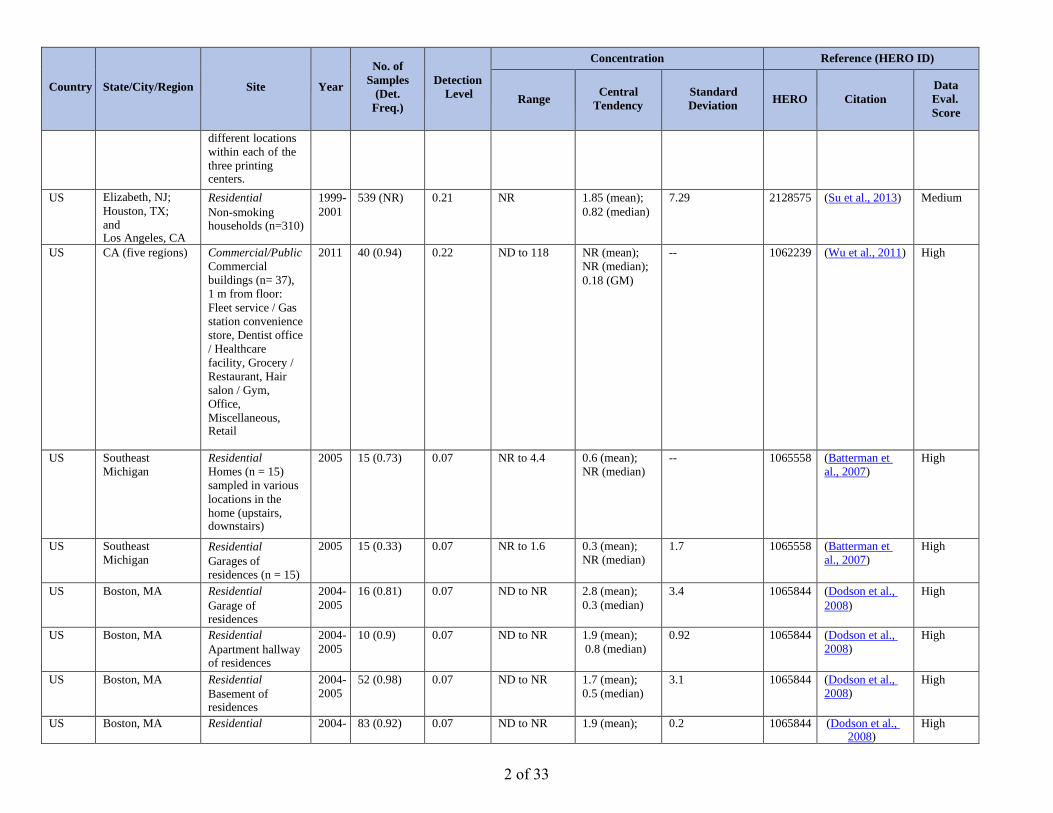
US Elizabeth, NJ;
Houston, TX;
and Los Angeles, CA
Residential
Non-smoking households (n=310)
1999-
2001
539 (NR) 0.21 NR 1.85 (mean);
0.82 (median)
7.29 2128575 (Su et al., 2013) Medium
US CA (five regions) Commercial/Public
Commercial
buildings (n= 37),
1 m from floor:
Fleet service / Gas
station convenience
store, Dentist office
/ Healthcare
facility, Grocery /
Restaurant, Hair
salon / Gym,
Office,
Miscellaneous, Retail
2011 40 (0.94) 0.22 ND to 118 NR (mean);
NR (median);
0.18 (GM)
-- 1062239 (Wu et al., 2011) High
US Southeast
Michigan
Residential
Homes (n = 15)
sampled in various
locations in the
home (upstairs, downstairs)
2005 15 (0.73) 0.07 NR to 4.4 0.6 (mean);
NR (median)
-- 1065558 (Batterman et
al., 2007)
High
US Southeast
Michigan Residential
Garages of residences (n = 15)
2005 15 (0.33) 0.07 NR to 1.6 0.3 (mean);
NR (median)
1.7 1065558 (Batterman et
al., 2007)
High
US Boston, MA Residential
Garage of residences
2004-
2005
16 (0.81) 0.07 ND to NR 2.8 (mean);
0.3 (median)
3.4 1065844 (Dodson et al.,
2008)
High
US Boston, MA Residential
Apartment hallway of residences
2004-
2005
10 (0.9) 0.07 ND to NR 1.9 (mean);
0.8 (median)
0.92 1065844 (Dodson et al.,
2008)
High
US Boston, MA Residential
Basement of residences
2004-
2005
52 (0.98) 0.07 ND to NR 1.7 (mean);
0.5 (median)
3.1 1065844 (Dodson et al.,
2008)
High
US Boston, MA Residential 2004- 83 (0.92) 0.07 ND to NR 1.9 (mean); 0.2 1065844 (Dodson et al., 2008)
High
2 of 33
Country State/City/Region Site Year
No. of
Samples
(Det.
Freq.)
Detection
Level
Concentration Reference (HERO ID)
Range Central
Tendency
Standard
Deviation HERO Citation
Data
Eval.
Score
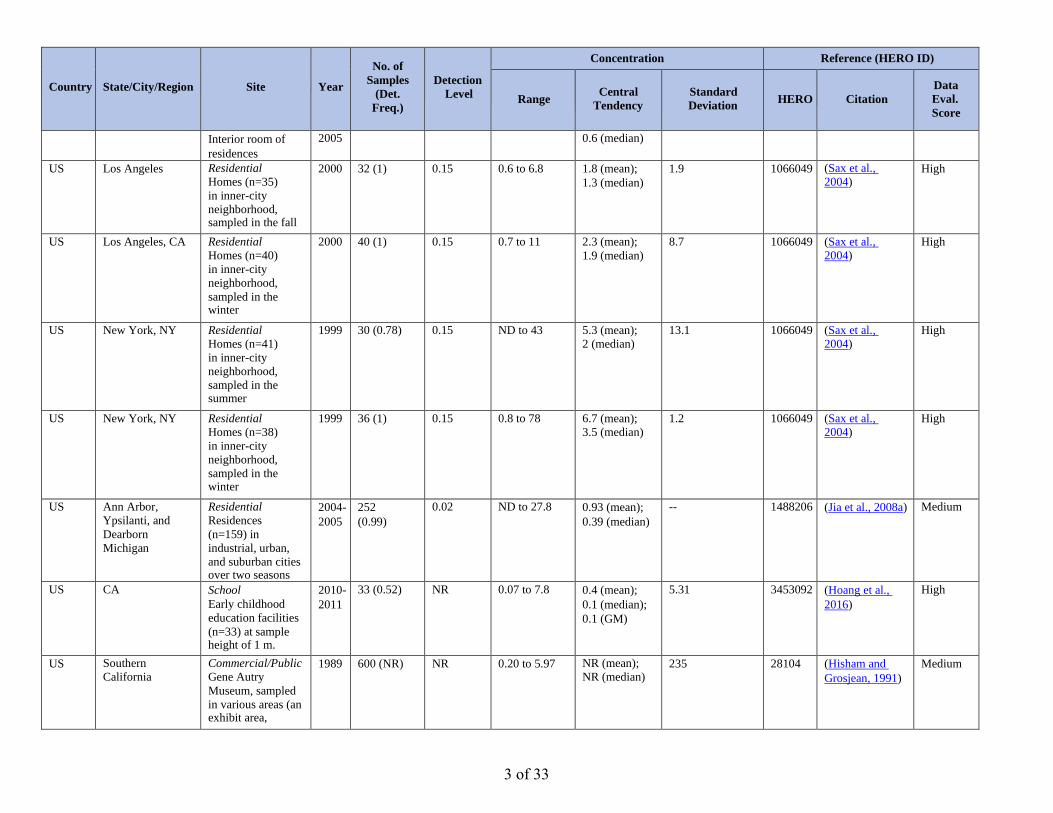
Interior room of
residences
2005 0.6 (median)
US Los Angeles Residential
Homes (n=35)
in inner-city
neighborhood, sampled in the fall
2000 32 (1) 0.15 0.6 to 6.8 1.8 (mean);
1.3 (median)
1.9 1066049 (Sax et al.,
2004) High
US Los Angeles, CA Residential
Homes (n=40)
in inner-city
neighborhood,
sampled in the winter
2000 40 (1) 0.15 0.7 to 11 2.3 (mean);
1.9 (median)
8.7 1066049 (Sax et al.,
2004)
High
US New York, NY Residential
Homes (n=41)
in inner-city
neighborhood,
sampled in the summer
1999 30 (0.78) 0.15 ND to 43 5.3 (mean);
2 (median)
13.1 1066049 (Sax et al.,
2004)
High
US New York, NY Residential
Homes (n=38)
in inner-city
neighborhood,
sampled in the winter
1999 36 (1) 0.15 0.8 to 78 6.7 (mean);
3.5 (median)
1.2 1066049 (Sax et al.,
2004)
High
US Ann Arbor,
Ypsilanti, and
Dearborn
Michigan
Residential
Residences
(n=159) in
industrial, urban,
and suburban cities over two seasons
2004-
2005
252
(0.99)
0.02 ND to 27.8 0.93 (mean);
0.39 (median)
-- 1488206 (Jia et al., 2008a) Medium
US CA School
Early childhood
education facilities
(n=33) at sample height of 1 m.
2010-
2011
33 (0.52) NR 0.07 to 7.8 0.4 (mean);
0.1 (median);
0.1 (GM)
5.31 3453092 (Hoang et al.,
2016)
High
US Southern
California
Commercial/Public
Gene Autry
Museum, sampled
in various areas (an exhibit area,
1989 600 (NR) NR 0.20 to 5.97 NR (mean);
NR (median) 235 28104 (Hisham and
Grosjean, 1991)
Medium
3 of 33
Country State/City/Region Site Year
No. of
Samples
(Det.
Freq.)
Detection
Level
Concentration Reference (HERO ID)
Range Central
Tendency
Standard
Deviation HERO Citation
Data
Eval.
Score
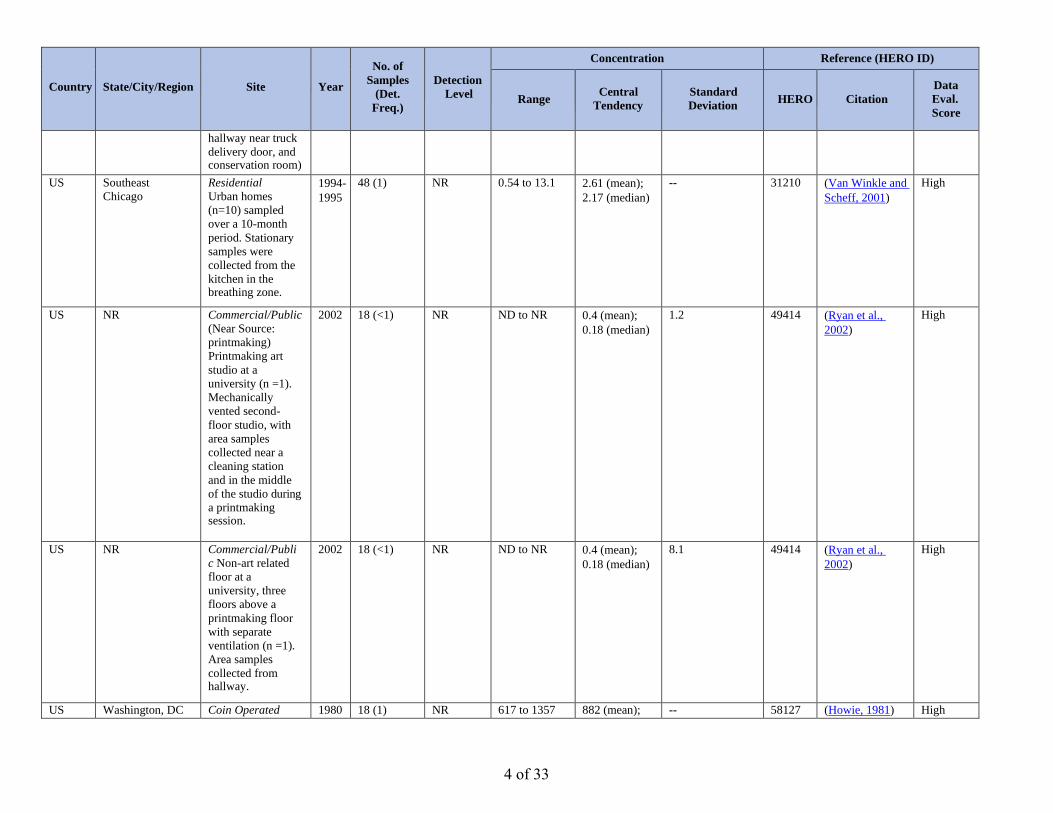
hallway near truck
delivery door, and conservation room)
US Southeast
Chicago
Residential
Urban homes
(n=10) sampled
over a 10-month
period. Stationary
samples were
collected from the
kitchen in the breathing zone.
1994-
1995
48 (1) NR 0.54 to 13.1 2.61 (mean);
2.17 (median)
-- 31210 (Van Winkle and
Scheff, 2001)
High
US NR Commercial/Public
(Near Source:
printmaking)
Printmaking art
studio at a
university (n =1).
Mechanically
vented second-
floor studio, with
area samples
collected near a
cleaning station
and in the middle
of the studio during
a printmaking session.
2002 18 (<1) NR ND to NR 0.4 (mean);
0.18 (median)
1.2 49414 (Ryan et al.,
2002)
High
US NR Commercial/Publi
c Non-art related
floor at a
university, three
floors above a
printmaking floor
with separate
ventilation (n =1).
Area samples
collected from hallway.
2002 18 (<1) NR ND to NR 0.4 (mean);
0.18 (median)
8.1 49414 (Ryan et al.,
2002)
High
US Washington, DC Coin Operated 1980 18 (1) NR 617 to 1357 882 (mean); -- 58127 (Howie, 1981) High
4 of 33

Country State/City/Region Site Year
No. of
Samples
(Det.
Freq.)
Detection
Level
Concentration Reference (HERO ID)
Range Central
Tendency
Standard
Deviation HERO Citation
Data
Eval.
Score
area Laundry with Dry
Cleaning Machines
Laundry facility
(Site A), sampled
at 6 to 7 ft above
floor at three
locations. Use of
dry cleaning
machine low, but
dry-cleaned clothes
stored on site.
Large facility. Good airflow.
NR (median)
US Washington, DC
area
Coin Operated
Laundry with Dry
Cleaning Machines
Laundry facility
(Site C), sampled at
6 to 7 ft above floor
at three locations.
Eight attendant
operated dry
cleaning machines
on-site. Good air
circulation because
of floor plan, front
door open at all times.
1980 18 (1) NR 1696 to
18318
8820 (mean);
NR (median)
-- 58127 (Howie, 1981) High
US Washington, DC
area
Coin Operated
Laundry with Dry
Cleaning Machines
Laundry facility
(Site B), sampled at
6 to 7 ft above floor
at three locations. 2
attendant operated
dry- cleaning
machines on-site.
Ventilation and
circulation good, front door
1980 18 (1) NR 509 to 4749 2171 (mean);
NR (median) -- 58127 (Howie, 1981) High
5 of 33
Country State/City/Region Site Year
No. of
Samples
(Det.
Freq.)
Detection
Level
Concentration Reference (HERO ID)
Range Central
Tendency
Standard
Deviation HERO Citation
Data
Eval.
Score
open regularly.
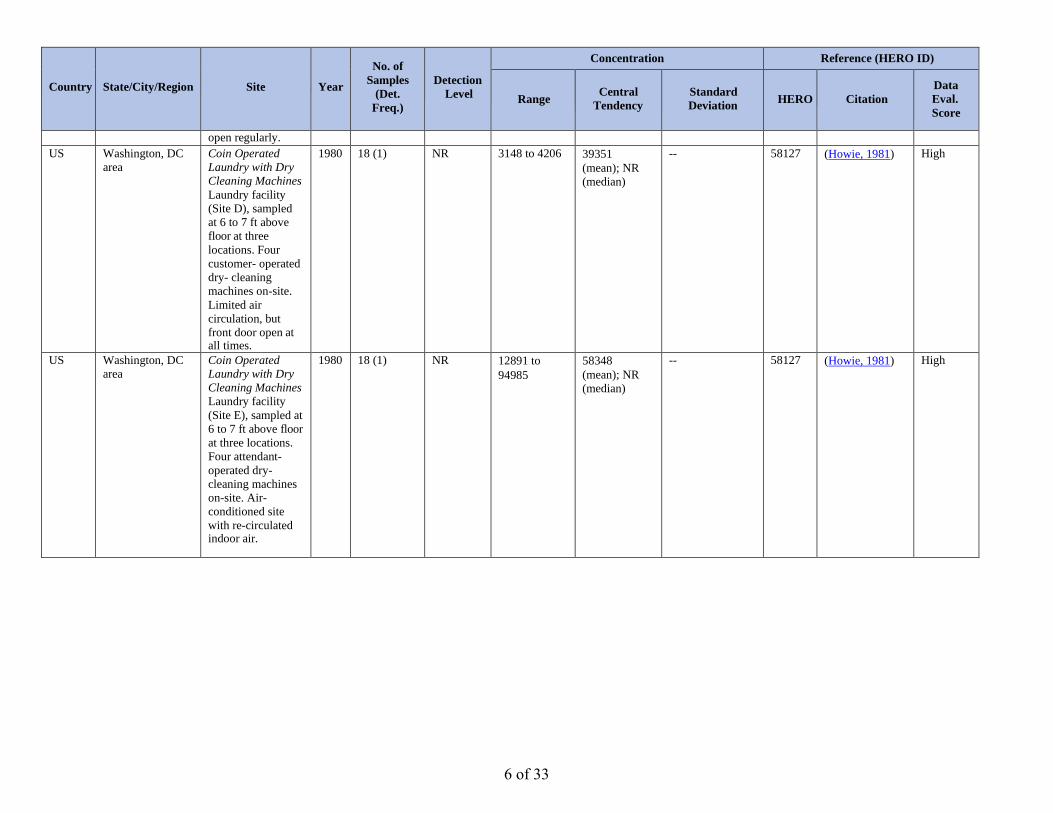
US Washington, DC
area
Coin Operated
Laundry with Dry
Cleaning Machines
Laundry facility
(Site D), sampled
at 6 to 7 ft above
floor at three
locations. Four
customer- operated
dry- cleaning
machines on-site.
Limited air
circulation, but
front door open at all times.
1980 18 (1) NR 3148 to 4206 39351
(mean); NR
(median)
-- 58127 (Howie, 1981) High
US Washington, DC
area
Coin Operated
Laundry with Dry
Cleaning Machines
Laundry facility
(Site E), sampled at
6 to 7 ft above floor
at three locations.
Four attendant-
operated dry-
cleaning machines
on-site. Air-
conditioned site
with re-circulated indoor air.
1980 18 (1) NR 12891 to
94985
58348
(mean); NR
(median)
-- 58127 (Howie, 1981) High
6 of 33
Country State/City/Region Site Year
No. of
Samples
(Det.
Freq.)
Detection
Level
Concentration Reference (HERO ID)
Range Central
Tendency
Standard
Deviation HERO Citation
Data
Eval.
Score
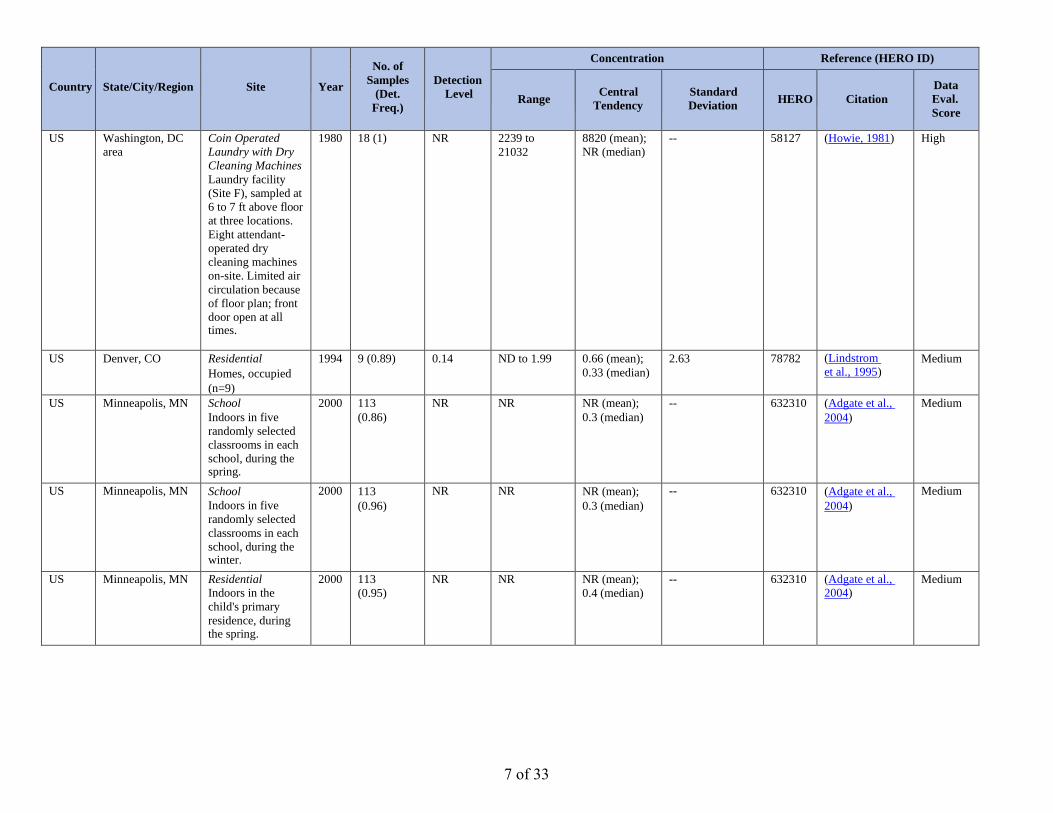
US Washington, DC
area
Coin Operated
Laundry with Dry
Cleaning Machines
Laundry facility
(Site F), sampled at
6 to 7 ft above floor
at three locations.
Eight attendant-
operated dry
cleaning machines
on-site. Limited air
circulation because
of floor plan; front
door open at all times.
1980 18 (1) NR 2239 to
21032
8820 (mean);
NR (median)
-- 58127 (Howie, 1981) High
US Denver, CO Residential
Homes, occupied
(n=9)
1994 9 (0.89) 0.14 ND to 1.99 0.66 (mean);
0.33 (median)
2.63 78782 (Lindstrom
et al., 1995) Medium
US Minneapolis, MN School
Indoors in five
randomly selected
classrooms in each
school, during the spring.
2000 113
(0.86)
NR NR NR (mean);
0.3 (median)
-- 632310 (Adgate et al.,
2004)
Medium
US Minneapolis, MN School
Indoors in five
randomly selected
classrooms in each
school, during the winter.
2000 113
(0.96)
NR NR NR (mean);
0.3 (median)
-- 632310 (Adgate et al.,
2004)
Medium
US Minneapolis, MN Residential
Indoors in the
child's primary
residence, during the spring.
2000 113
(0.95)
NR NR NR (mean);
0.4 (median)
-- 632310 (Adgate et al.,
2004)
Medium
7 of 33
Country State/City/Region Site Year
No. of
Samples
(Det.
Freq.)
Detection
Level
Concentration Reference (HERO ID)
Range Central
Tendency
Standard
Deviation HERO Citation
Data
Eval.
Score
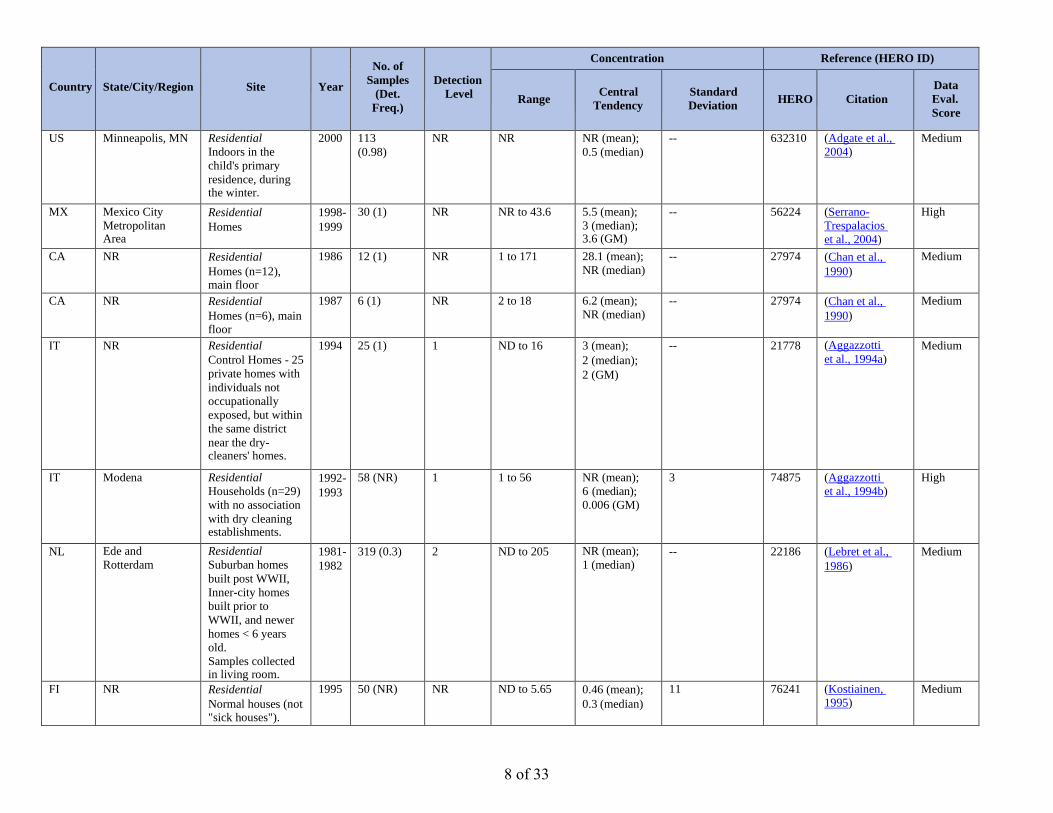
US Minneapolis, MN Residential
Indoors in the
child's primary
residence, during the winter.
2000 113
(0.98)
NR NR NR (mean);
0.5 (median)
-- 632310 (Adgate et al.,
2004)
Medium
MX Mexico City
Metropolitan Area
Residential
Homes
1998-
1999
30 (1) NR NR to 43.6 5.5 (mean);
3 (median); 3.6 (GM)
-- 56224 (Serrano-
Trespalacios
et al., 2004)
High
CA NR Residential
Homes (n=12), main floor
1986 12 (1) NR 1 to 171 28.1 (mean);
NR (median)
-- 27974 (Chan et al.,
1990)
Medium
CA NR Residential
Homes (n=6), main floor
1987 6 (1) NR 2 to 18 6.2 (mean);
NR (median)
-- 27974 (Chan et al.,
1990)
Medium
IT NR Residential
Control Homes - 25
private homes with
individuals not
occupationally
exposed, but within
the same district
near the dry- cleaners' homes.
1994 25 (1) 1 ND to 16 3 (mean);
2 (median);
2 (GM)
-- 21778 (Aggazzotti
et al., 1994a) Medium
IT Modena Residential
Households (n=29)
with no association
with dry cleaning establishments.
1992-
1993
58 (NR) 1 1 to 56 NR (mean);
6 (median);
0.006 (GM)
3 74875 (Aggazzotti
et al., 1994b)
High
NL Ede and
Rotterdam
Residential
Suburban homes
built post WWII,
Inner-city homes
built prior to
WWII, and newer
homes < 6 years
old.
Samples collected in living room.
1981-
1982
319 (0.3) 2 ND to 205 NR (mean);
1 (median) -- 22186 (Lebret et al.,
1986)
Medium
FI NR Residential
Normal houses (not "sick houses").
1995 50 (NR) NR ND to 5.65 0.46 (mean);
0.3 (median)
11 76241 (Kostiainen,
1995)
Medium
8 of 33

Country State/City/Region Site Year
No. of
Samples
(Det.
Freq.)
Detection
Level
Concentration Reference (HERO ID)
Range Central
Tendency
Standard
Deviation HERO Citation
Data
Eval.
Score
50 "Normal
houses" in this study.
FI NR Residential
"Sick houses" -
houses in which
people complained
about the odor or
they had
symptoms, which
resembled WHO's
Sick Building
Syndrome
(headache, nausea,
irritation of the
eyes, mucous
membranes, and
the respiratory
system,
drowsiness,
fatigue, and
general malaise.
38 "sick houses" in this study.
1995 7 (NR) NR 0.19 to 29.8 4.86 (mean);
0.73 (median)
0.66 76241 (Kostiainen,
1995) Medium
SG nation-wide School
Child-care centers
(n=104), sampled
from middle of the
classroom near the
breathing zone of
children
(approximately 0.5–0.7 m)
2007 84 (0.72) 0.6 ND to 8.5 NR (mean);
0.3 (median)
-- 632758 (Zuraimi and
Tham, 2008)
High
DE Hamburg area Vehicle
(Near
Source: dry-
cleaning)
Dry-cleaned down
jacket placed into a car.
1990 3 (1) NR 9300 to
24800
NR (mean);
NR (median) -- 713690 (Gulyas and
Hemmerling,
1990)
Medium
9 of 33
Country State/City/Region Site Year
No. of
Samples
(Det.
Freq.)
Detection
Level
Concentration Reference (HERO ID)
Range Central
Tendency
Standard
Deviation HERO Citation
Data
Eval.
Score
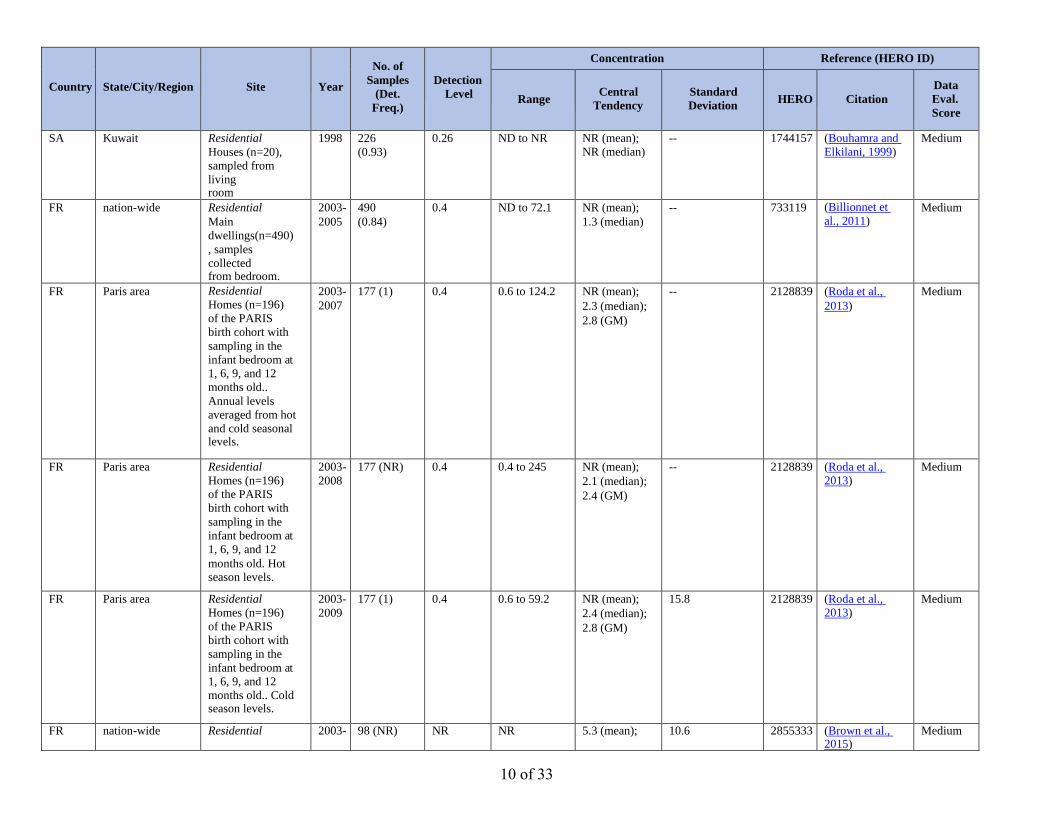
SA Kuwait Residential
Houses (n=20),
sampled from
living room
1998 226
(0.93)
0.26 ND to NR NR (mean);
NR (median)
-- 1744157 (Bouhamra and
Elkilani, 1999)
Medium
FR nation-wide Residential
Main
dwellings(n=490)
, samples
collected from bedroom.
2003-
2005
490
(0.84)
0.4 ND to 72.1 NR (mean);
1.3 (median)
-- 733119 (Billionnet et
al., 2011) Medium
FR Paris area Residential
Homes (n=196)
of the PARIS
birth cohort with
sampling in the
infant bedroom at
1, 6, 9, and 12
months old..
Annual levels
averaged from hot
and cold seasonal levels.
2003-
2007
177 (1) 0.4 0.6 to 124.2 NR (mean);
2.3 (median);
2.8 (GM)
-- 2128839 (Roda et al.,
2013)
Medium
FR Paris area Residential
Homes (n=196)
of the PARIS
birth cohort with
sampling in the
infant bedroom at
1, 6, 9, and 12
months old. Hot season levels.
2003-
2008
177 (NR) 0.4 0.4 to 245 NR (mean);
2.1 (median);
2.4 (GM)
-- 2128839 (Roda et al.,
2013)
Medium
FR Paris area Residential
Homes (n=196)
of the PARIS
birth cohort with
sampling in the
infant bedroom at
1, 6, 9, and 12
months old.. Cold season levels.
2003-
2009
177 (1) 0.4 0.6 to 59.2 NR (mean);
2.4 (median);
2.8 (GM)
15.8 2128839 (Roda et al.,
2013)
Medium
FR nation-wide Residential 2003- 98 (NR) NR NR 5.3 (mean); 10.6 2855333 (Brown et al., 2015)
Medium
10 of 33
Country State/City/Region Site Year
No. of
Samples
(Det.
Freq.)
Detection
Level
Concentration Reference (HERO ID)
Range Central
Tendency
Standard
Deviation HERO Citation
Data
Eval.
Score
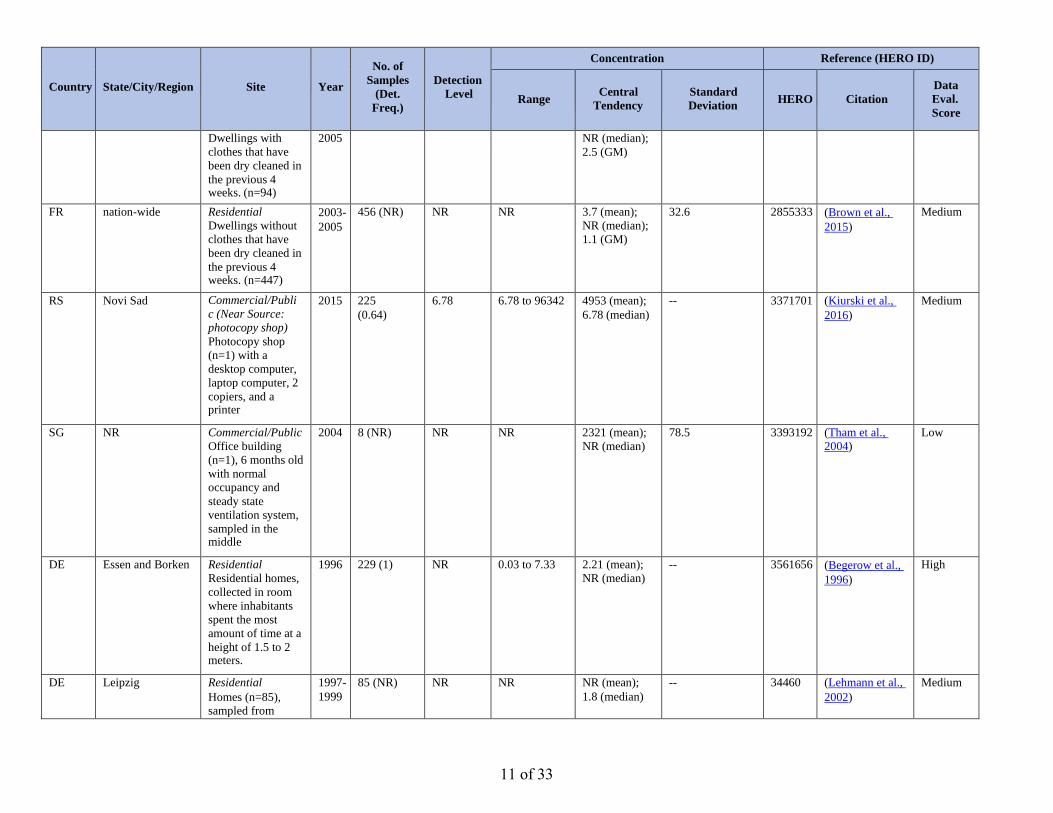
Dwellings with
clothes that have
been dry cleaned in
the previous 4 weeks. (n=94)
2005 NR (median);
2.5 (GM)
FR nation-wide Residential
Dwellings without
clothes that have
been dry cleaned in
the previous 4 weeks. (n=447)
2003-
2005
456 (NR) NR NR 3.7 (mean);
NR (median);
1.1 (GM)
32.6 2855333 (Brown et al.,
2015)
Medium
RS Novi Sad Commercial/Publi
c (Near Source:
photocopy shop)
Photocopy shop
(n=1) with a
desktop computer,
laptop computer, 2
copiers, and a printer
2015 225
(0.64)
6.78 6.78 to 96342 4953 (mean);
6.78 (median)
-- 3371701 (Kiurski et al.,
2016)
Medium
SG NR Commercial/Public
Office building
(n=1), 6 months old
with normal
occupancy and
steady state
ventilation system,
sampled in the middle
2004 8 (NR) NR NR 2321 (mean);
NR (median)
78.5 3393192 (Tham et al.,
2004)
Low
DE Essen and Borken Residential
Residential homes,
collected in room
where inhabitants
spent the most
amount of time at a
height of 1.5 to 2 meters.
1996 229 (1) NR 0.03 to 7.33 2.21 (mean);
NR (median)
-- 3561656 (Begerow et al.,
1996)
High
DE Leipzig Residential
Homes (n=85), sampled from
1997-
1999
85 (NR) NR NR NR (mean);
1.8 (median)
-- 34460 (Lehmann et al.,
2002)
Medium
11 of 33
Country State/City/Region Site Year
No. of
Samples
(Det.
Freq.)
Detection
Level
Concentration Reference (HERO ID)
Range Central
Tendency
Standard
Deviation HERO Citation
Data
Eval.
Score
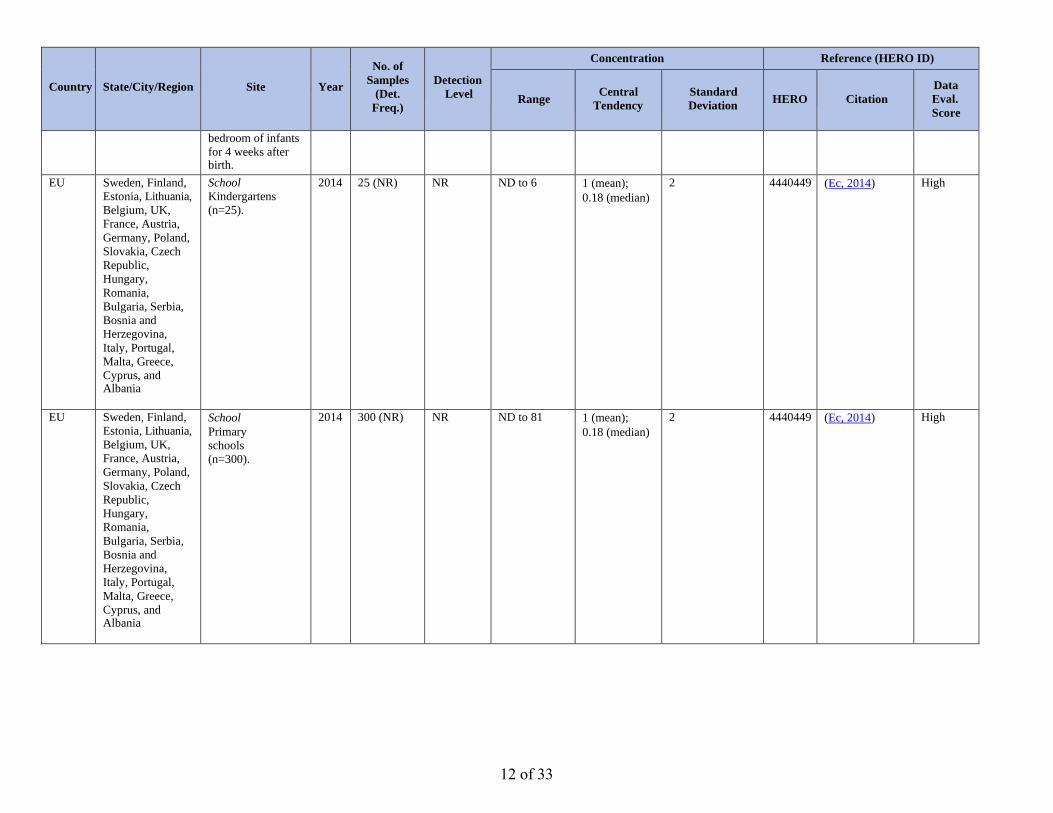
bedroom of infants
for 4 weeks after birth.
EU Sweden, Finland,
Estonia, Lithuania,
Belgium, UK,
France, Austria,
Germany, Poland,
Slovakia, Czech
Republic,
Hungary,
Romania,
Bulgaria, Serbia,
Bosnia and
Herzegovina,
Italy, Portugal,
Malta, Greece,
Cyprus, and Albania
School
Kindergartens
(n=25).
2014 25 (NR) NR ND to 6 1 (mean);
0.18 (median)
2 4440449 (Ec, 2014) High
EU Sweden, Finland,
Estonia, Lithuania,
Belgium, UK,
France, Austria,
Germany, Poland,
Slovakia, Czech
Republic,
Hungary,
Romania,
Bulgaria, Serbia,
Bosnia and
Herzegovina,
Italy, Portugal,
Malta, Greece,
Cyprus, and Albania
School
Primary
schools
(n=300).
2014 300 (NR) NR ND to 81 1 (mean);
0.18 (median)
2 4440449 (Ec, 2014) High
12 of 33
Country State/City/Region Site Year
No. of
Samples
(Det.
Freq.)
Detection
Level
Concentration Reference (HERO ID)
Range Central
Tendency
Standard
Deviation HERO Citation
Data
Eval.
Score
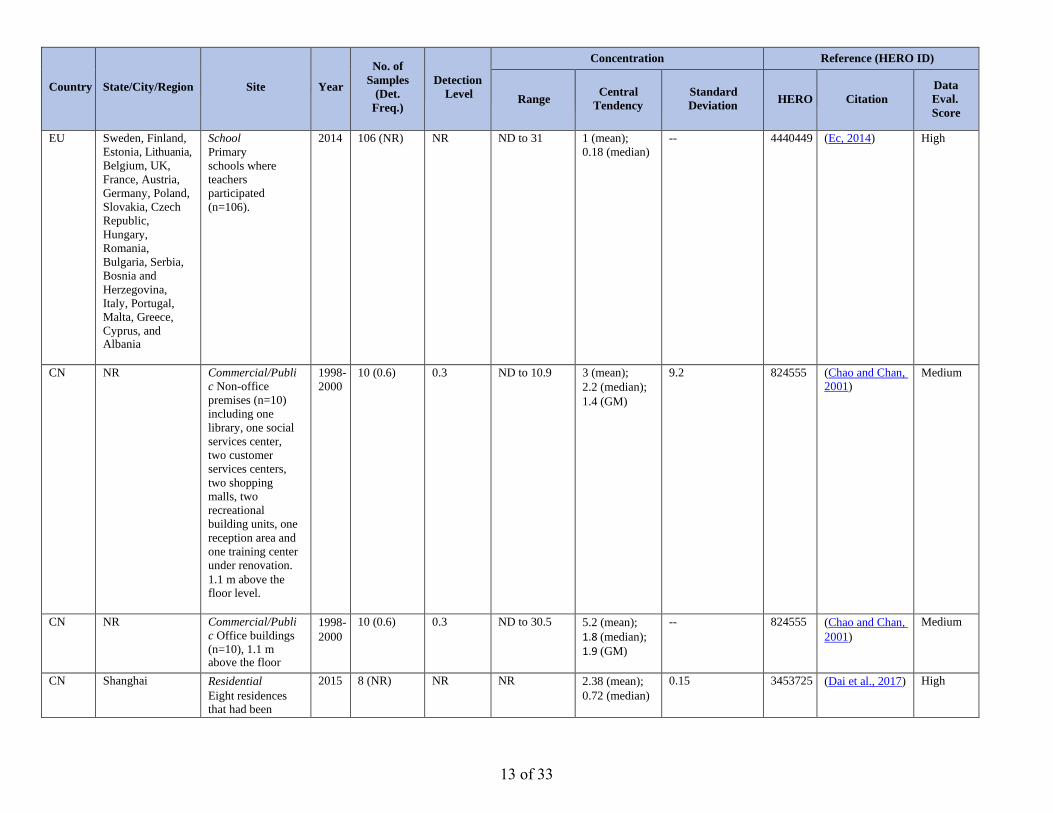
EU Sweden, Finland,
Estonia, Lithuania,
Belgium, UK,
France, Austria,
Germany, Poland,
Slovakia, Czech
Republic,
Hungary,
Romania,
Bulgaria, Serbia,
Bosnia and
Herzegovina,
Italy, Portugal,
Malta, Greece,
Cyprus, and Albania
School
Primary
schools where
teachers
participated
(n=106).
2014 106 (NR) NR ND to 31 1 (mean);
0.18 (median)
-- 4440449 (Ec, 2014) High
CN NR Commercial/Publi
c Non-office
premises (n=10)
including one
library, one social
services center,
two customer
services centers,
two shopping
malls, two
recreational
building units, one
reception area and
one training center
under renovation.
1.1 m above the floor level.
1998-
2000
10 (0.6) 0.3 ND to 10.9 3 (mean);
2.2 (median);
1.4 (GM)
9.2 824555 (Chao and Chan,
2001)
Medium
CN NR Commercial/Publi
c Office buildings
(n=10), 1.1 m above the floor
1998-
2000
10 (0.6) 0.3 ND to 30.5 5.2 (mean);
1.8 (median);
1.9 (GM)
-- 824555 (Chao and Chan,
2001)
Medium
CN Shanghai Residential
Eight residences that had been
2015 8 (NR) NR NR 2.38 (mean);
0.72 (median)
0.15 3453725 (Dai et al., 2017) High
13 of 33
Country State/City/Region Site Year
No. of
Samples
(Det.
Freq.)
Detection
Level
Concentration Reference (HERO ID)
Range Central
Tendency
Standard
Deviation HERO Citation
Data
Eval.
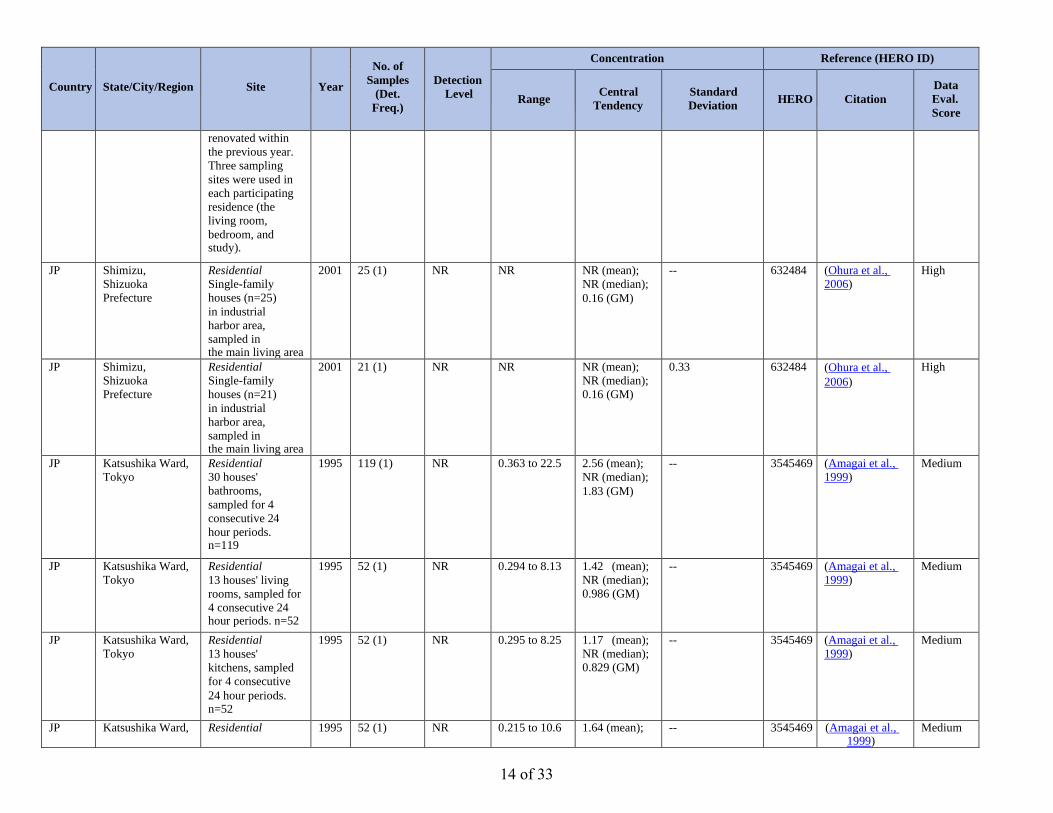
Score
renovated within
the previous year.
Three sampling
sites were used in
each participating
residence (the
living room,
bedroom, and study).
JP Shimizu,
Shizuoka
Prefecture
Residential
Single-family
houses (n=25)
in industrial
harbor area,
sampled in the main living area
2001 25 (1) NR NR NR (mean);
NR (median);
0.16 (GM)
-- 632484 (Ohura et al.,
2006)
High
JP Shimizu,
Shizuoka
Prefecture
Residential
Single-family
houses (n=21)
in industrial
harbor area,
sampled in the main living area
2001 21 (1) NR NR NR (mean);
NR (median);
0.16 (GM)
0.33 632484 (Ohura et al.,
2006)
High
JP Katsushika Ward,
Tokyo
Residential
30 houses'
bathrooms,
sampled for 4
consecutive 24
hour periods. n=119
1995 119 (1) NR 0.363 to 22.5 2.56 (mean);
NR (median);
1.83 (GM)
-- 3545469 (Amagai et al.,
1999)
Medium
JP Katsushika Ward,
Tokyo
Residential
13 houses' living
rooms, sampled for
4 consecutive 24 hour periods. n=52
1995 52 (1) NR 0.294 to 8.13 1.42 (mean);
NR (median);
0.986 (GM)
-- 3545469 (Amagai et al.,
1999)
Medium
JP Katsushika Ward,
Tokyo
Residential
13 houses'
kitchens, sampled
for 4 consecutive
24 hour periods. n=52
1995 52 (1) NR 0.295 to 8.25 1.17 (mean);
NR (median);
0.829 (GM)
-- 3545469 (Amagai et al.,
1999)
Medium
JP Katsushika Ward, Residential 1995 52 (1) NR 0.215 to 10.6 1.64 (mean); -- 3545469 (Amagai et al., 1999)
Medium
14 of 33

Country State/City/Region Site Year
No. of
Samples
(Det.
Freq.)
Detection
Level
Concentration Reference (HERO ID)
Range Central
Tendency
Standard
Deviation HER
O
Citation
Data
Eval.
Score
Tokyo 13 houses'
bedrooms, sampled
for 4 consecutive
24 hour periods. n=52
NR (median);
0.998 (GM)
JP Katsushika Ward,
Tokyo
Residential
13 houses'
bathrooms,
sampled for 4
consecutive 24 hour periods. n=52
1995 52 (1) NR 0.172 to 5.36 1.06 (mean);
NR (median);
0.774 (GM)
-- 354546
9 (Amagai et al.,
1999)
Medium
JP Katsushika Ward,
Tokyo Residential
30 houses' living
rooms, sampled for
4 consecutive 24
hour periods. n=238
1995 238 (1) NR 0.292 to 57 3.69 (mean);
NR (median);
2.36 (GM)
-- 354546
9
(Amagai et al.,
1999)
Medium
JP Katsushika Ward,
Tokyo Residential
30 houses'
kitchens, sampled
for 4 consecutive
24 hour periods.
n=119
1995 119 (1) NR 0.339 to 30.8 3.03 (mean);
NR (median);
2.02 (GM)
-- 354546
9 (Amagai et al.,
1999)
Medium
JP Katsushika Ward,
Tokyo Residential
30 houses'
bedrooms, sampled
for 4 consecutive
24 hour periods. n=238
1995 238 (1) NR 0.358 to 71 4.24 (mean);
NR (median);
2.42 (GM)
-- 354546
9
(Amagai et al.,
1999)
Medium
Personal Breathing Zone (µg/m3)
US IL, IN, OH, MI,
MN, WI (Great
Lakes Region)
Residential
Non-
institutionalized
persons residing in
households in six states
1995-
1997
386
(0.61)
NR ND to NR 31.9 (mean);
1.98 (median)
-- 14003 (Clayton et al.,
1999)
High
US Columbus, OH Residential
Non-smoking
women (n=24) with non-smoking
1991 24 (NR) NR ND to 5.13 1.24 (mean);
0.7 (median)
1.46 22045 (Heavner et al.,
1995)
Medium
15 of 33

Country State/City/Region Site Year
No. of
Samples
(Det.
Freq.)
Detection
Level
Concentration Reference (HERO ID)
Range Central
Tendency
Standard
Deviation HERO Citation
Data
Eval.
Score
husbands
US Columbus, OH Residential
Non-smoking
(n=25) women
with smoking husbands
1991 25 (NR) NR ND to 3.78 0.89 (mean);
0.68 (median)
0.96 22045 (Heavner et al.,
1995)
Medium
US NR Commercial/Publi
c (Near Source:
printmaking)
12 students and 1
faculty member in
university art
(printmaking)
studio.
Mechanically
ventilated second-
floor.
2002 90 (NR) NR ND to NR 0.7 (mean);
0.5 (median)
2.3 49414 (Ryan et al.,
2002)
High
16 of 33
Country State/City/Region Site Year
No. of
Samples
(Det.
Freq.)
Detection
Level
Concentration Reference (HERO ID)
Range Central
Tendency
Standard
Deviation HERO Citation
Data
Eval.
Score
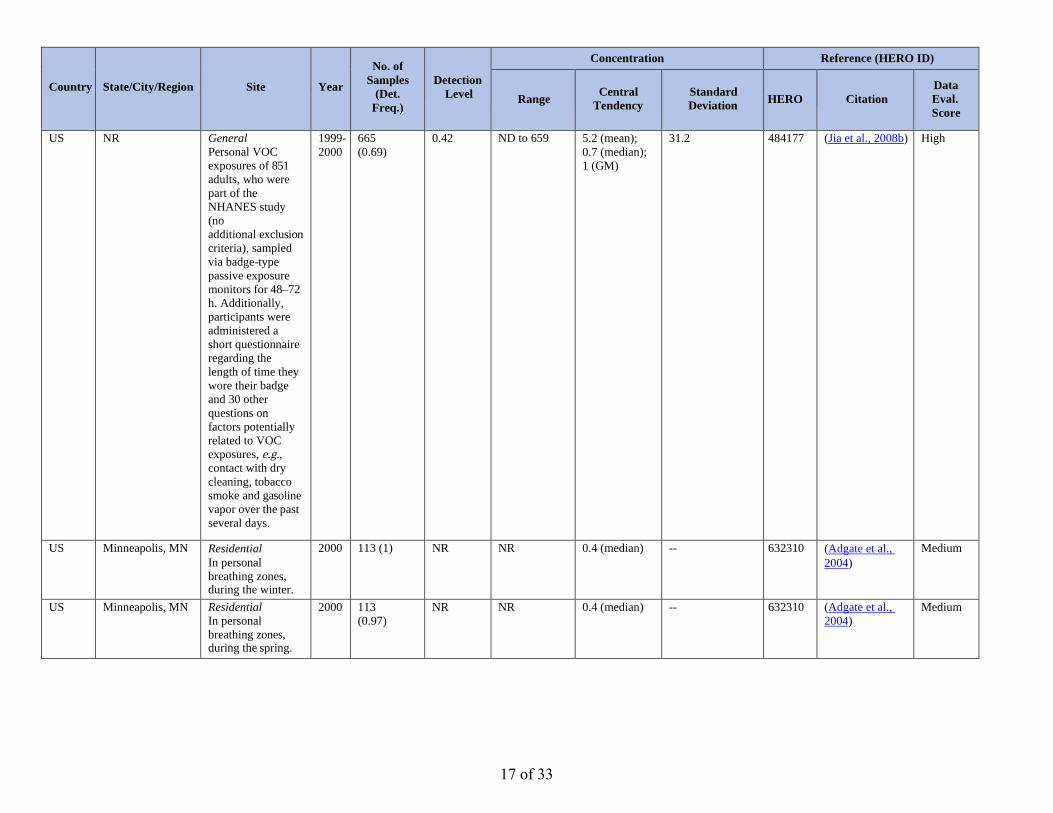
US NR General
Personal VOC
exposures of 851
adults, who were
part of the
NHANES study
(no
additional exclusion
criteria), sampled
via badge-type
passive exposure
monitors for 48–72
h. Additionally, participants were administered a short questionnaire regarding the length of time they wore their badge and 30 other questions on factors potentially related to VOC exposures, e.g., contact with dry cleaning, tobacco smoke and gasoline
vapor over the past several days.
1999-
2000
665
(0.69)
0.42 ND to 659 5.2 (mean);
0.7 (median);
1 (GM)
31.2 484177 (Jia et al., 2008b) High
US Minneapolis, MN Residential
In personal
breathing zones, during the winter.
2000 113 (1) NR NR 0.4 (median) -- 632310 (Adgate et al.,
2004)
Medium
US Minneapolis, MN Residential
In personal
breathing zones, during the spring.
2000 113
(0.97)
NR NR 0.4 (median) -- 632310 (Adgate et al.,
2004)
Medium
17 of 33
Country State/City/Region Site Year
No. of
Samples
(Det.
Freq.)
Detection
Level
Concentration Reference (HERO ID)
Range Central
Tendency
Standard
Deviation HERO Citation
Data
Eval.
Score
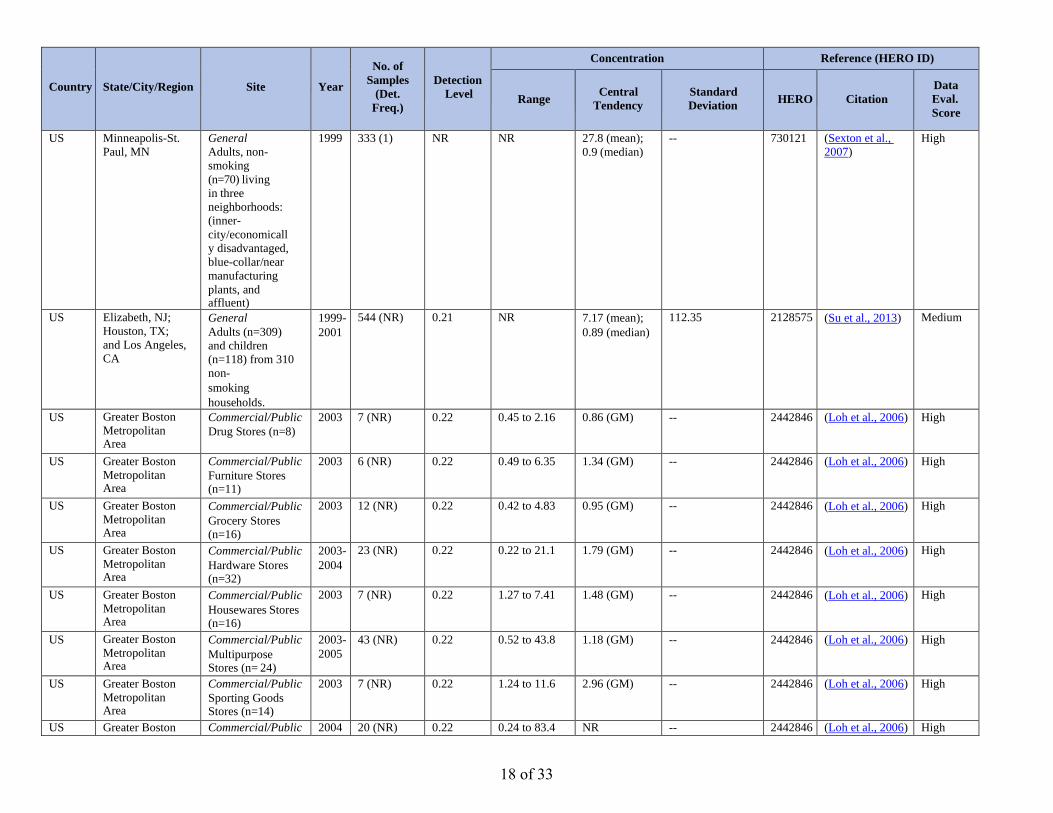
US Minneapolis-St.
Paul, MN
General
Adults, non-
smoking
(n=70) living
in three
neighborhoods:
(inner-
city/economicall
y disadvantaged,
blue-collar/near
manufacturing
plants, and affluent)
1999 333 (1) NR NR 27.8 (mean);
0.9 (median)
-- 730121 (Sexton et al.,
2007)
High
US Elizabeth, NJ;
Houston, TX;
and Los Angeles,
CA
General
Adults (n=309)
and children
(n=118) from 310
non-
smoking
households.
1999-
2001
544 (NR) 0.21 NR 7.17 (mean);
0.89 (median)
112.35 2128575 (Su et al., 2013) Medium
US Greater Boston
Metropolitan Area
Commercial/Public
Drug Stores (n=8)
2003 7 (NR) 0.22 0.45 to 2.16 0.86 (GM) -- 2442846 (Loh et al., 2006) High
US Greater Boston
Metropolitan Area
Commercial/Public
Furniture Stores (n=11)
2003 6 (NR) 0.22 0.49 to 6.35 1.34 (GM) -- 2442846 (Loh et al., 2006) High
US Greater Boston
Metropolitan Area
Commercial/Public
Grocery Stores (n=16)
2003 12 (NR) 0.22 0.42 to 4.83 0.95 (GM) -- 2442846 (Loh et al., 2006) High
US Greater Boston
Metropolitan Area
Commercial/Public
Hardware Stores (n=32)
2003-
2004
23 (NR) 0.22 0.22 to 21.1 1.79 (GM) -- 2442846 (Loh et al., 2006) High
US Greater Boston
Metropolitan Area
Commercial/Public
Housewares Stores (n=16)
2003 7 (NR) 0.22 1.27 to 7.41 1.48 (GM) -- 2442846 (Loh et al., 2006) High
US Greater Boston
Metropolitan Area
Commercial/Public
Multipurpose Stores (n= 24)
2003-
2005
43 (NR) 0.22 0.52 to 43.8 1.18 (GM) -- 2442846 (Loh et al., 2006) High
US Greater Boston
Metropolitan Area
Commercial/Public
Sporting Goods Stores (n=14)
2003 7 (NR) 0.22 1.24 to 11.6 2.96 (GM) -- 2442846 (Loh et al., 2006) High
US Greater Boston Commercial/Public 2004 20 (NR) 0.22 0.24 to 83.4 NR -- 2442846 (Loh et al., 2006) High
18 of 33

Country State/City/Region Site Year
No. of
Samples
(Det.
Freq.)
Detection
Level
Concentration Reference (HERO ID)
Range Central
Tendency
Standard
Deviation HERO Citation
Data
Eval.
Score
Metropolitan
Area
Dining
Stores
(n=20)
US Greater Boston
Metropolitan Area
Commercial/Public
Transportation Stores (n=5)
2003-
2004
21 (NR) 0.22 0.32 to 5.17 0.78 (GM) -- 2442846 (Loh et al., 2006) High
US Greater Boston
Metropolitan Area
Commercial/Public
Department Stores (n=10)
2004 5 (NR) 0.22 1.27 to 4.89 2.04 (GM) -- 2442846 (Loh et al., 2006) High
US Greater Boston
Metropolitan Area
Commercial/Public
Electronics Stores (n=9)
2004 7 (NR) 0.22 ND to 8.49 0.47 (GM) -- 2442846 (Loh et al., 2006) High
US CA and NJ General
Adults
conducting
normal daily activities
1981-
1984
772 (NR) 0 NR 5.6 to 45
(mean)
-- 23081 (Wallace, 1986) High
US NR Mixed Use
NHANES study
measured
exposures on
adults aged 20–59
years to TCE.
Participants wore
passive exposure
monitors.
Returned 2–3 days
later at which time
a short survey was
administered
regarding activities
potentially related to exposures.
1999-
2000
633
(0.686)
NR 0.1 to 659.1 0.7 (median);
1 (GM)
-- 2331366 (D'Souza et al.,
2009)
High
19 of 33
Country State/City/Region Site Year
No. of
Samples
(Det.
Freq.)
Detection
Level
Concentration Reference (HERO ID)
Range Central
Tendency
Standard
Deviation HERO Citation
Data
Eval.
Score
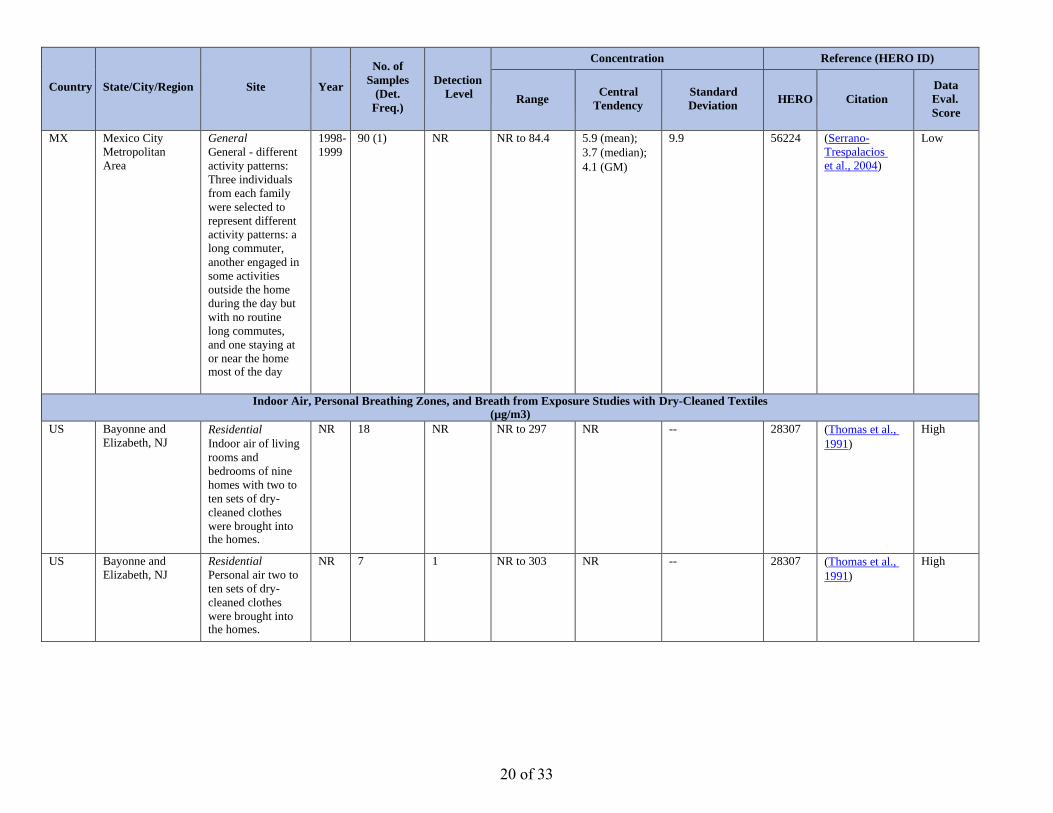
MX Mexico City
Metropolitan
Area
General
General - different
activity patterns:
Three individuals
from each family
were selected to
represent different
activity patterns: a
long commuter,
another engaged in
some activities
outside the home
during the day but
with no routine
long commutes,
and one staying at
or near the home most of the day
1998-
1999
90 (1) NR NR to 84.4 5.9 (mean);
3.7 (median);
4.1 (GM)
9.9 56224 (Serrano-
Trespalacios
et al., 2004)
Low
Indoor Air, Personal Breathing Zones, and Breath from Exposure Studies with Dry-Cleaned Textiles (µg/m3)
US Bayonne and
Elizabeth, NJ Residential
Indoor air of living
rooms and
bedrooms of nine
homes with two to
ten sets of dry-
cleaned clothes
were brought into the homes.
NR 18 NR NR to 297 NR -- 28307 (Thomas et al.,
1991)
High
US Bayonne and
Elizabeth, NJ
Residential
Personal air two to
ten sets of dry-
cleaned clothes
were brought into the homes.
NR 7 1 NR to 303 NR -- 28307 (Thomas et al.,
1991)
High
20 of 33
Country State/City/Region Site Year
No. of
Samples
(Det.
Freq.)
Detection
Level
Concentration Reference (HERO ID)
Range Central
Tendency
Standard
Deviation HER
O
Citation
Data
Eval.
Score
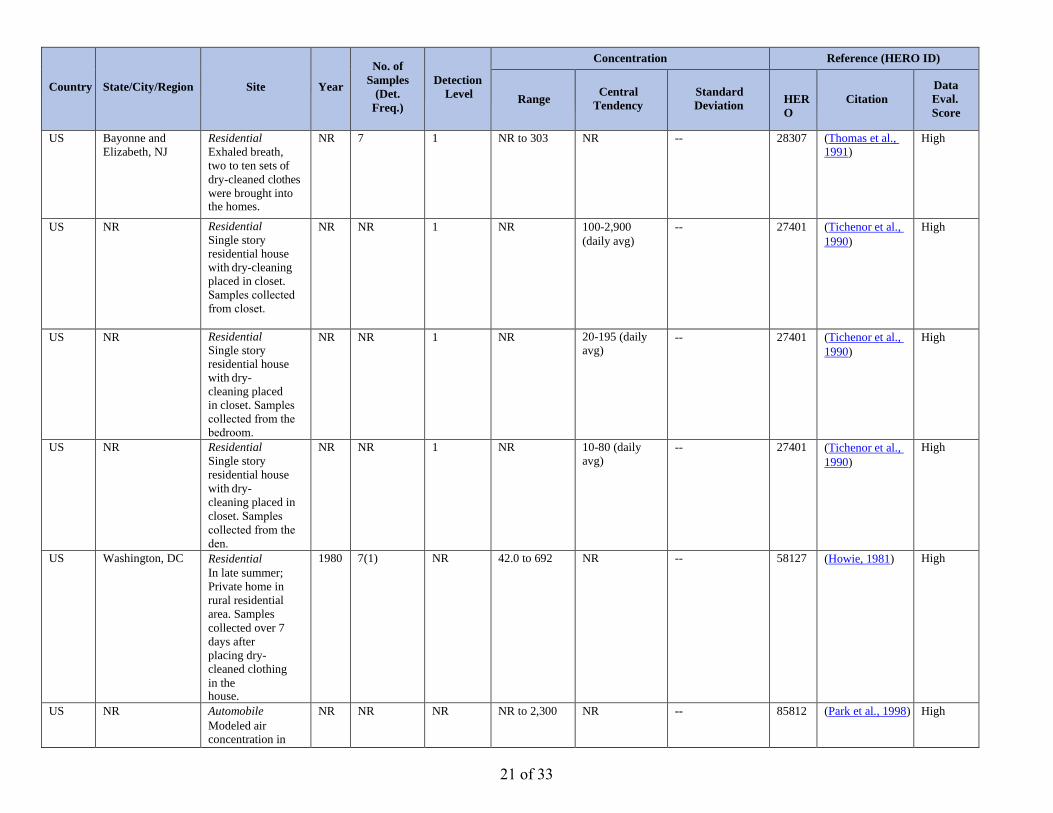
US Bayonne and
Elizabeth, NJ
Residential
Exhaled breath,
two to ten sets of
dry-cleaned clothes
were brought into the homes.
NR 7 1 NR to 303 NR -- 28307 (Thomas et al.,
1991)
High
US NR Residential
Single story
residential house
with dry-cleaning
placed in closet. Samples collected from closet.
NR NR 1 NR 100-2,900
(daily avg)
-- 27401 (Tichenor et al.,
1990)
High
US NR Residential
Single story
residential house
with dry-
cleaning placed
in closet. Samples collected from the bedroom.
NR NR 1 NR 20-195 (daily
avg) -- 27401 (Tichenor et al.,
1990)
High
US NR Residential
Single story
residential house
with dry-
cleaning placed in
closet. Samples collected from the den.
NR NR 1 NR 10-80 (daily
avg)
-- 27401 (Tichenor et al.,
1990)
High
US Washington, DC Residential
In late summer;
Private home in
rural residential
area. Samples
collected over 7
days after
placing dry-
cleaned clothing
in the house.
1980 7(1) NR 42.0 to 692 NR -- 58127 (Howie, 1981) High
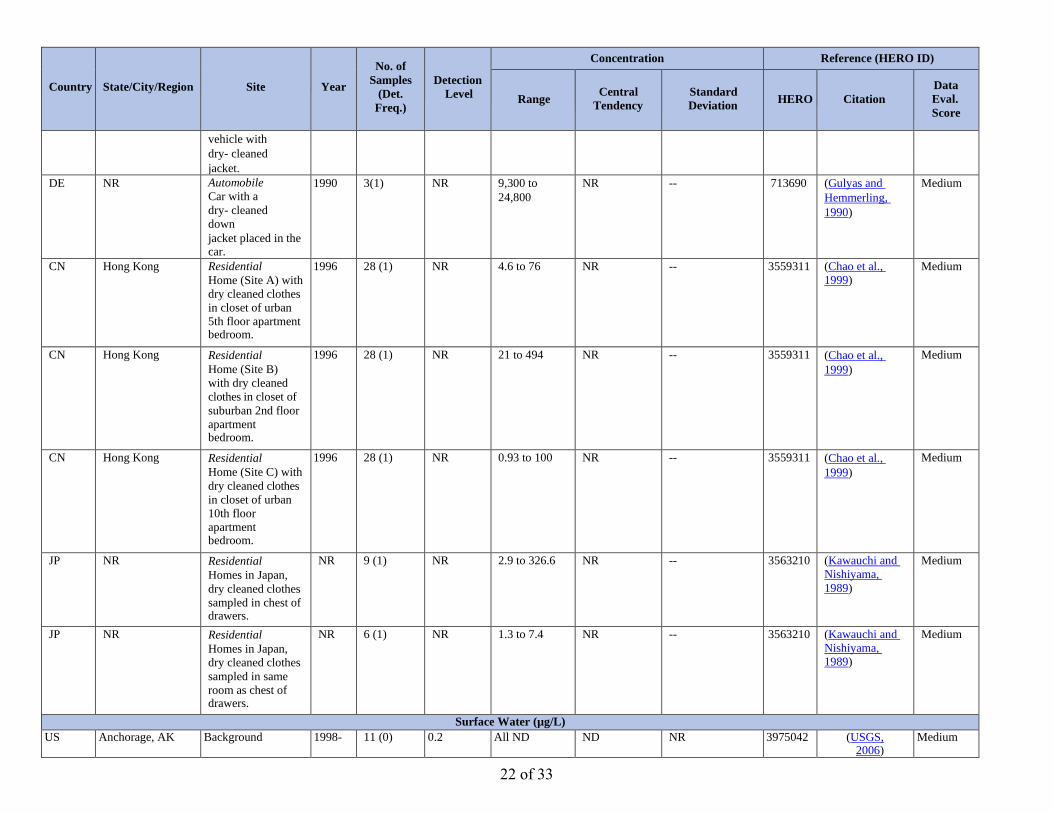
US NR Automobile
Modeled air concentration in
NR NR NR NR to 2,300 NR -- 85812 (Park et al., 1998) High
21 of 33
Country State/City/Region Site Year
No. of
Samples
(Det.
Freq.)
Detection
Level
Concentration Reference (HERO ID)
Range Central
Tendency
Standard
Deviation HERO Citation
Data
Eval.
Score
vehicle with
dry- cleaned
jacket.
DE NR Automobile
Car with a
dry- cleaned
down
jacket placed in the car.
1990 3(1) NR 9,300 to
24,800
NR -- 713690 (Gulyas and
Hemmerling,
1990)
Medium
CN Hong Kong Residential
Home (Site A) with
dry cleaned clothes
in closet of urban
5th floor apartment bedroom.
1996 28 (1) NR 4.6 to 76 NR -- 3559311 (Chao et al.,
1999)
Medium
CN Hong Kong Residential
Home (Site B)
with dry cleaned
clothes in closet of
suburban 2nd floor
apartment bedroom.
1996 28 (1) NR 21 to 494 NR -- 3559311 (Chao et al.,
1999)
Medium
CN Hong Kong Residential
Home (Site C) with
dry cleaned clothes
in closet of urban
10th floor
apartment bedroom.
1996 28 (1) NR 0.93 to 100 NR -- 3559311 (Chao et al.,
1999)
Medium
JP NR Residential
Homes in Japan,
dry cleaned clothes
sampled in chest of drawers.
NR 9 (1) NR 2.9 to 326.6 NR -- 3563210 (Kawauchi and
Nishiyama,
1989)
Medium
JP NR Residential
Homes in Japan,
dry cleaned clothes
sampled in same
room as chest of drawers.
NR 6 (1) NR 1.3 to 7.4 NR -- 3563210 (Kawauchi and
Nishiyama,
1989)
Medium
Surface Water (µg/L)
US Anchorage, AK Background 1998- 11 (0) 0.2 All ND ND NR 3975042 (USGS, 2006)
Medium
22 of 33

Country State/City/Region Site Year
No. of
Samples
(Det.
Freq.)
Detection
Level
Concentration Reference (HERO ID)
Range Central
Tendency
Standard
Deviation HERO Citation
Data
Eval.
Score
Chester Creek (6
urban sampling sites)
2001
US Nation-wide Background
Surface water for
drinking water
sources (rivers and reservoirs)
1999-
2000
375
(0.008)
0.2 ND to 5.5 NR NR 3975046 (USGS, 2003) Medium
US Nation-wide Surface water for
drinking water
sources (rivers and reservoirs)
1999-
2000
375
(0.0027)
0.2 ND to 2.6 NR NR 3975046 (USGS, 2003) Medium
US to CL NR Background
Eastern Pacific
Ocean (California,
US to Valparaiso, Chile)
1979-
1981
30 (0.90) 0.0001 ND to 0.0028 0.7 (mean);
0.0004
(median)
0.0007 29192 (Singh et al.,
1983)
Medium
US to CL NR Eastern Pacific
Ocean (California,
US to Valparaiso, Chile)
1979-
1981
30 (0.93) 0.0004 ND to 0.008 0.0031
(mean)
0.0032 29192 (Singh et al.,
1983)
Medium
BR NR Background
Santo Antonio da
Patrulha, Tres
Coroas, and Parobe
in the Sinos River
Basin; River
samples collected
from seven points on
the three main rivers
of the Sinos River Basin
2012-
2013
60
(0.083)
NR ND to 0.8 0.03 (mean) NR 3489827 (Bianchi et al.,
2017)
Medium
BR NR Santo Antonio da
Patrulha, Tres
Coroas, and Parobe
in the Sinos River
Basin; River
samples collected
from seven points on
the three main rivers
of the Sinos River Basin
2012-
2013
60 (0.72) NR ND to 0.0588 0.0019
(mean)
NR 3489827 (Bianchi et al.,
2017)
Medium
CN NR Background
Yellow Sea and East China Sea (53
2011 53 (1.0) NR 0.00022 to
0.0051
0.0019
(mean)
NR 2128010 (He et al., 2013a) High
23 of 33
Country State/City/Region Site Year
No. of
Samples
(Det.
Freq.)
Detection
Level
Concentration Reference (HERO ID)
Range Central
Tendency
Standard
Deviation HERO Citation
Data
Eval.
Score
stations)
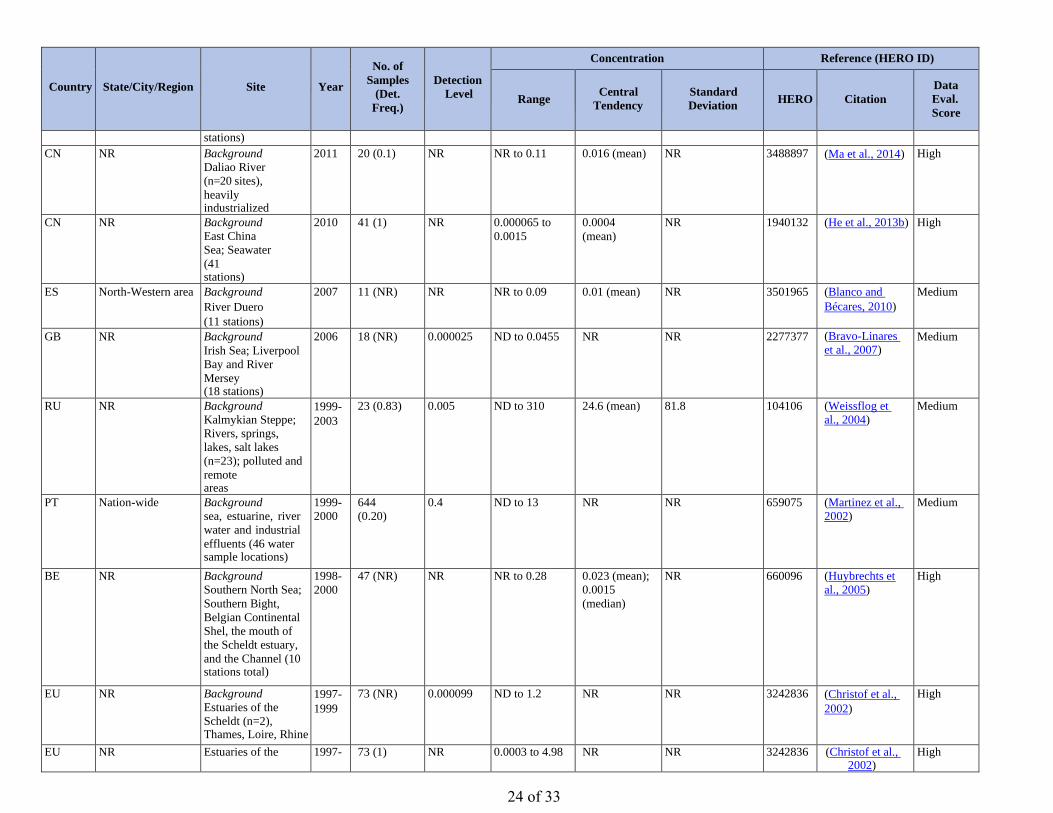
CN NR Background
Daliao River
(n=20 sites),
heavily industrialized
2011 20 (0.1) NR NR to 0.11 0.016 (mean) NR 3488897 (Ma et al., 2014) High
CN NR Background
East China
Sea; Seawater
(41 stations)
2010 41 (1) NR 0.000065 to
0.0015
0.0004
(mean)
NR 1940132 (He et al., 2013b) High
ES North-Western area Background
River Duero
(11 stations)
2007 11 (NR) NR NR to 0.09 0.01 (mean) NR 3501965 (Blanco and
Bécares, 2010)
Medium
GB NR Background
Irish Sea; Liverpool
Bay and River
Mersey (18 stations)
2006 18 (NR) 0.000025 ND to 0.0455 NR NR 2277377 (Bravo-Linares
et al., 2007) Medium
RU NR Background
Kalmykian Steppe;
Rivers, springs,
lakes, salt lakes
(n=23); polluted and
remote areas
1999-
2003
23 (0.83) 0.005 ND to 310 24.6 (mean) 81.8 104106 (Weissflog et
al., 2004)
Medium
PT Nation-wide Background
sea, estuarine, river
water and industrial
effluents (46 water sample locations)
1999-
2000
644
(0.20)
0.4 ND to 13 NR NR 659075 (Martinez et al.,
2002)
Medium
BE NR Background
Southern North Sea;
Southern Bight,
Belgian Continental
Shel, the mouth of
the Scheldt estuary,
and the Channel (10 stations total)
1998-
2000
47 (NR) NR NR to 0.28 0.023 (mean);
0.0015
(median)
NR 660096 (Huybrechts et
al., 2005)
High
EU NR Background
Estuaries of the
Scheldt (n=2), Thames, Loire, Rhine
1997-
1999
73 (NR) 0.000099 ND to 1.2 NR NR 3242836 (Christof et al.,
2002)
High
EU NR Estuaries of the 1997- 73 (1) NR 0.0003 to 4.98 NR NR 3242836 (Christof et al., 2002)
High
24 of 33
Country State/City/Region Site Year
No. of
Samples
(Det.
Freq.)
Detection
Level
Concentration Reference (HERO ID)
Range Central
Tendency
Standard
Deviation HERO Citation
Data
Eval.
Score
Scheldt (n=2),
Thames, Loire,
Rhine
1999
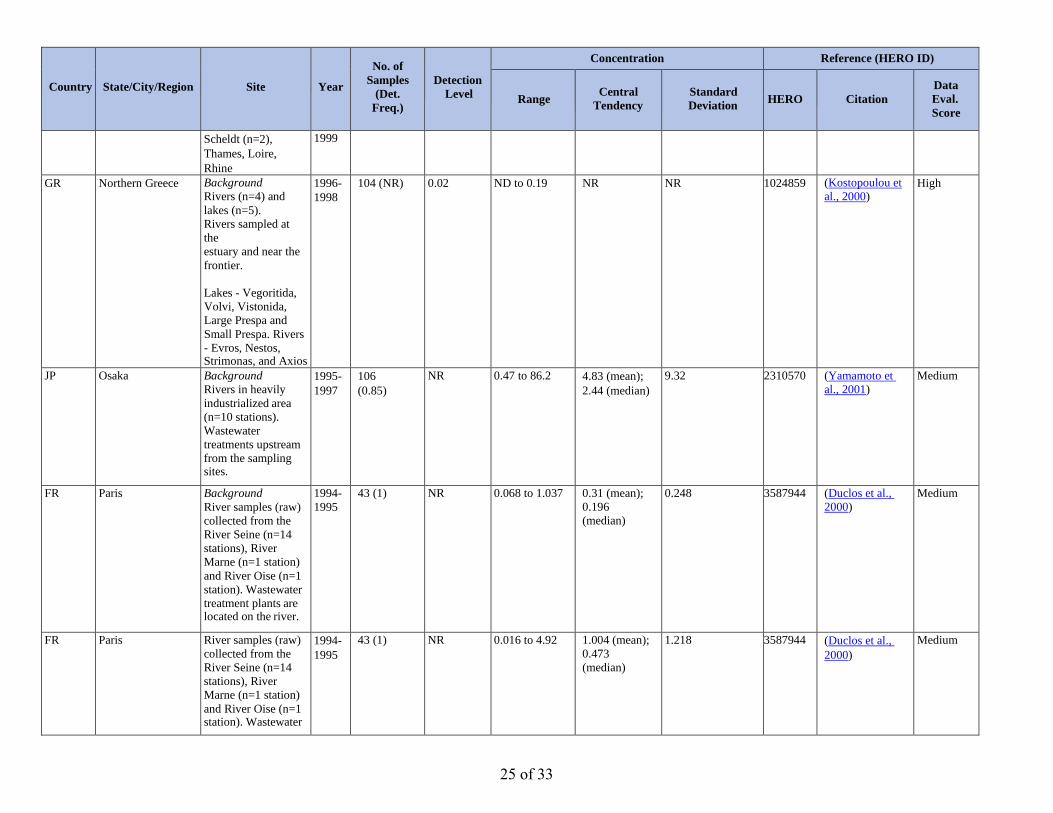
GR Northern Greece Background
Rivers (n=4) and
lakes (n=5).
Rivers sampled at
the
estuary and near the
frontier.
Lakes - Vegoritida,
Volvi, Vistonida,
Large Prespa and
Small Prespa. Rivers
- Evros, Nestos,Strimonas, and Axios
1996-
1998
104 (NR) 0.02 ND to 0.19 NR NR 1024859 (Kostopoulou et
al., 2000) High
JP Osaka Background
Rivers in heavily
industrialized area
(n=10 stations).
Wastewater
treatments upstream
from the sampling sites.
1995-
1997
106
(0.85)
NR 0.47 to 86.2 4.83 (mean);
2.44 (median)
9.32 2310570 (Yamamoto et
al., 2001)
Medium
FR Paris Background
River samples (raw)
collected from the
River Seine (n=14
stations), River
Marne (n=1 station)
and River Oise (n=1
station). Wastewater
treatment plants are located on the river.
1994-
1995
43 (1) NR 0.068 to 1.037 0.31 (mean);
0.196
(median)
0.248 3587944 (Duclos et al.,
2000)
Medium
FR Paris River samples (raw)
collected from the
River Seine (n=14
stations), River
Marne (n=1 station)
and River Oise (n=1 station). Wastewater
1994-
1995
43 (1) NR 0.016 to 4.92 1.004 (mean);
0.473
(median)
1.218 3587944 (Duclos et al.,
2000)
Medium
25 of 33
Country State/City/Region Site Year
No. of
Samples
(Det.
Freq.)
Detection
Level
Concentration Reference (HERO ID)
Range Central
Tendency
Standard
Deviation HERO Citation
Data
Eval.
Score
treatment plants are
located on the river.
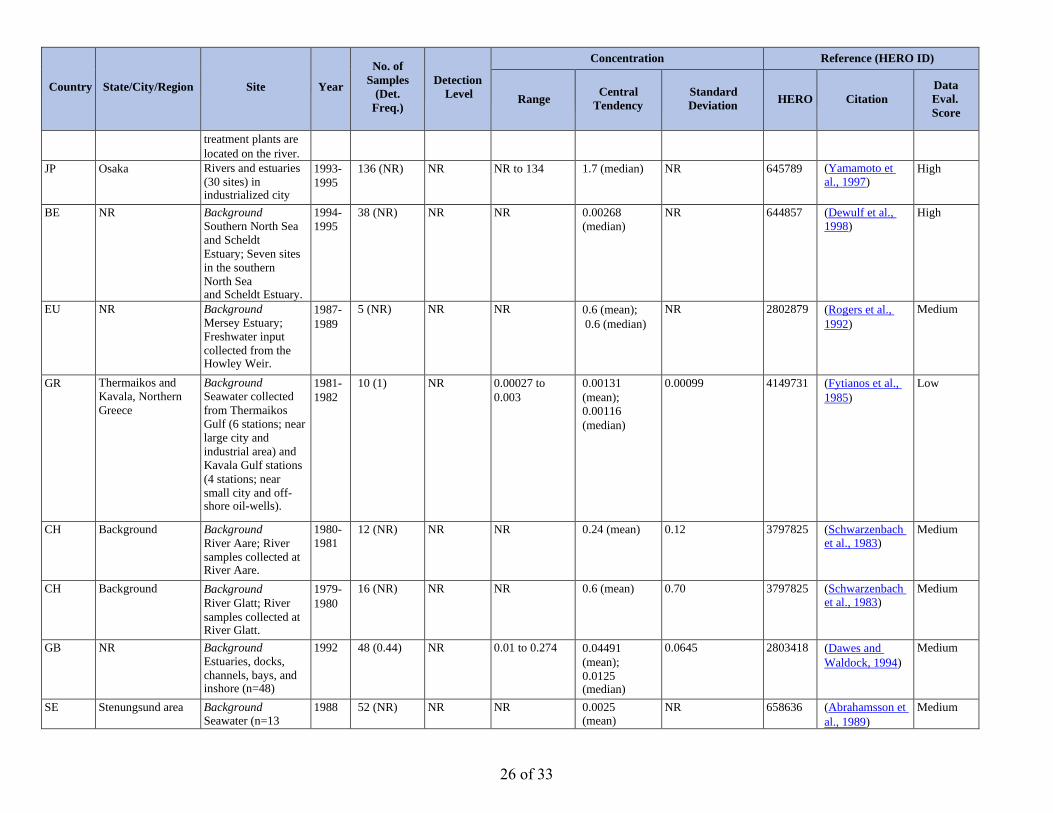
JP Osaka Rivers and estuaries
(30 sites) in industrialized city
1993-
1995
136 (NR) NR NR to 134 1.7 (median) NR 645789 (Yamamoto et
al., 1997) High
BE NR Background
Southern North Sea
and Scheldt
Estuary; Seven sites
in the southern
North Sea and Scheldt Estuary.
1994-
1995
38 (NR) NR NR 0.00268
(median)
NR 644857 (Dewulf et al.,
1998)
High
EU NR Background
Mersey Estuary;
Freshwater input
collected from the Howley Weir.
1987-
1989
5 (NR) NR NR 0.6 (mean);
0.6 (median)
NR 2802879 (Rogers et al.,
1992)
Medium
GR Thermaikos and
Kavala, Northern
Greece
Background
Seawater collected
from Thermaikos
Gulf (6 stations; near
large city and
industrial area) and
Kavala Gulf stations
(4 stations; near
small city and off- shore oil-wells).
1981-
1982
10 (1) NR 0.00027 to
0.003
0.00131
(mean);
0.00116
(median)
0.00099 4149731 (Fytianos et al.,
1985)
Low
CH Background Background
River Aare; River
samples collected at River Aare.
1980-
1981
12 (NR) NR NR 0.24 (mean) 0.12 3797825 (Schwarzenbach
et al., 1983)
Medium
CH Background Background
River Glatt; River
samples collected at River Glatt.
1979-
1980
16 (NR) NR NR 0.6 (mean) 0.70 3797825 (Schwarzenbach
et al., 1983)
Medium
GB NR Background
Estuaries, docks,
channels, bays, and inshore (n=48)
1992 48 (0.44) NR 0.01 to 0.274 0.04491
(mean);
0.0125 (median)
0.0645 2803418 (Dawes and
Waldock, 1994)
Medium
SE Stenungsund area Background Seawater (n=13
1988 52 (NR) NR NR 0.0025 (mean)
NR 658636 (Abrahamsson et
al., 1989)
Medium
26 of 33
Country State/City/Region Site Year
No. of
Samples
(Det.
Freq.)
Detection
Level
Concentration Reference (HERO ID)
Range Central
Tendency
Standard
Deviation HERO Citation
Data
Eval.
Score
stations), sampled on
two occasions
(depths of 1-10 m) in
area of petrochemical centre
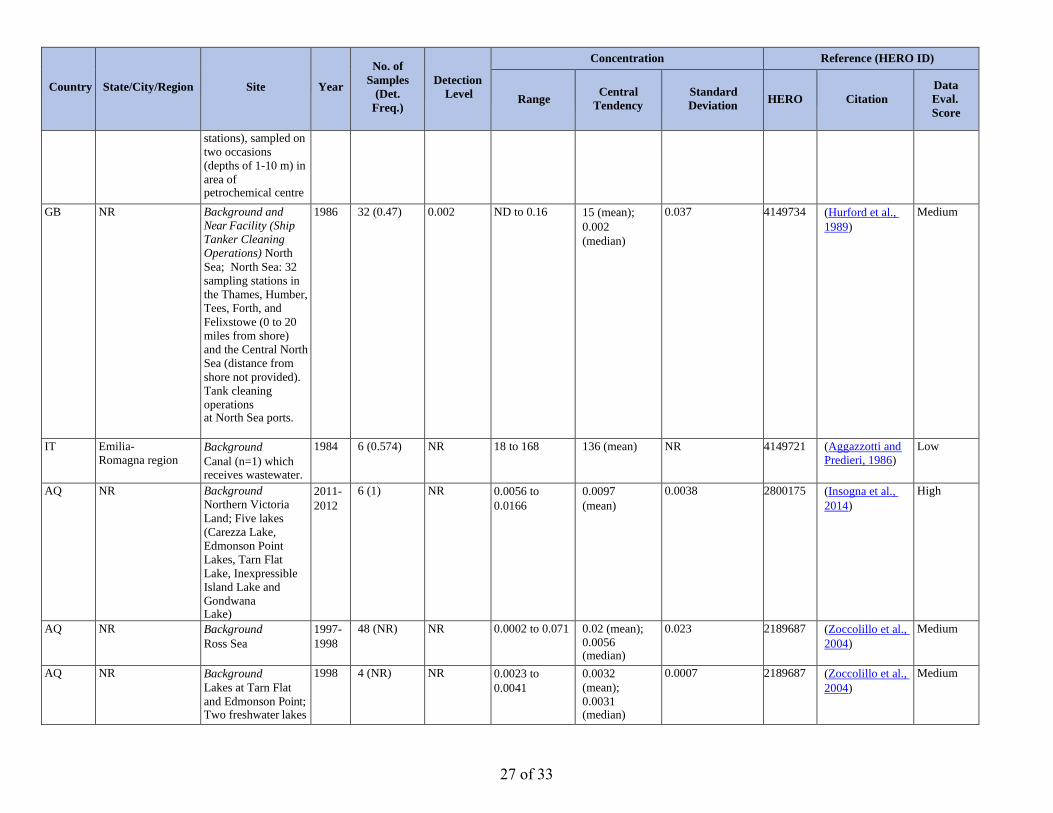
GB NR Background and
Near Facility (Ship
Tanker Cleaning
Operations) North
Sea; North Sea: 32
sampling stations in
the Thames, Humber,
Tees, Forth, and
Felixstowe (0 to 20
miles from shore)
and the Central North
Sea (distance from
shore not provided).
Tank cleaning
operations at North Sea ports.
1986 32 (0.47) 0.002 ND to 0.16 15 (mean);
0.002
(median)
0.037 4149734 (Hurford et al.,
1989)
Medium
IT Emilia-
Romagna region Background
Canal (n=1) which receives wastewater.
1984 6 (0.574) NR 18 to 168 136 (mean) NR 4149721 (Aggazzotti and
Predieri, 1986)
Low
AQ NR Background
Northern Victoria
Land; Five lakes
(Carezza Lake,
Edmonson Point
Lakes, Tarn Flat
Lake, Inexpressible
Island Lake and
Gondwana Lake)
2011-
2012
6 (1) NR 0.0056 to
0.0166
0.0097
(mean)
0.0038 2800175 (Insogna et al.,
2014)
High
AQ NR Background
Ross Sea
1997-
1998
48 (NR) NR 0.0002 to 0.071 0.02 (mean);
0.0056 (median)
0.023 2189687 (Zoccolillo et al.,
2004)
Medium
AQ NR Background
Lakes at Tarn Flat
and Edmonson Point; Two freshwater lakes
1998 4 (NR) NR 0.0023 to
0.0041
0.0032
(mean);
0.0031 (median)
0.0007 2189687 (Zoccolillo et al.,
2004)
Medium
27 of 33
Country State/City/Region Site Year
No. of
Samples
(Det.
Freq.)
Detection
Level
Concentration Reference (HERO ID)
Range Central
Tendency
Standard
Deviation HERO Citation
Data
Eval.
Score
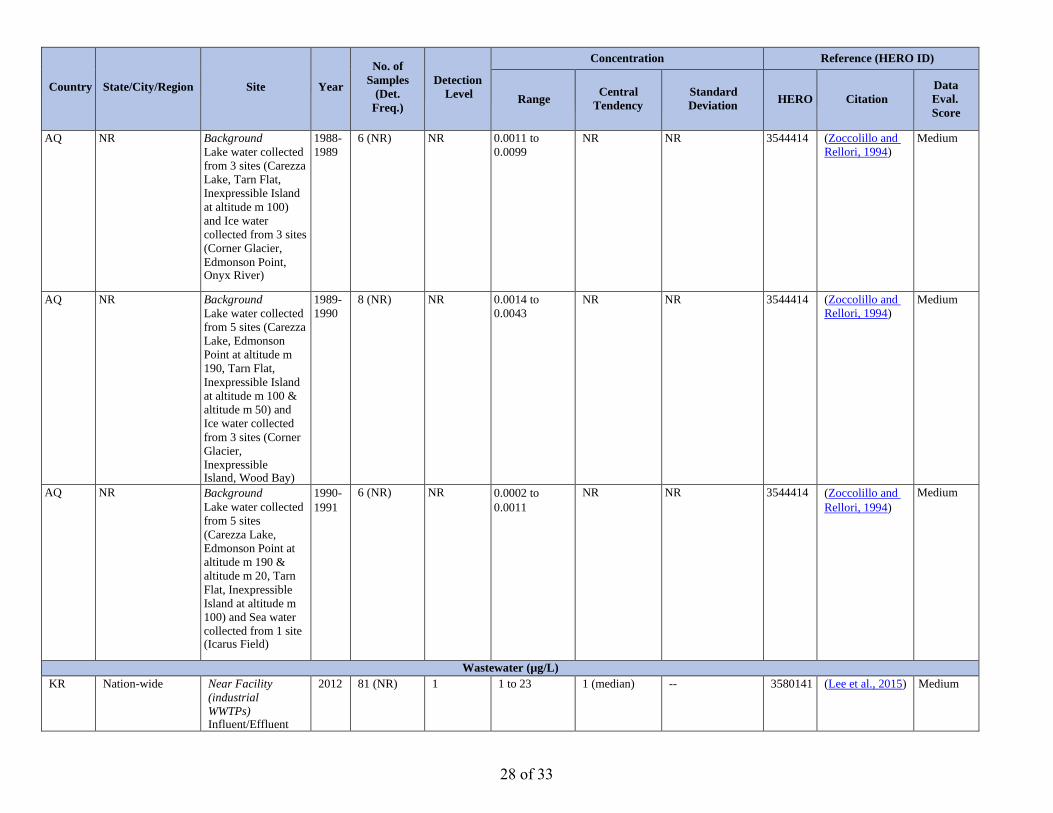
AQ NR Background
Lake water collected
from 3 sites (Carezza
Lake, Tarn Flat,
Inexpressible Island
at altitude m 100)
and Ice water
collected from 3 sites
(Corner Glacier,
Edmonson Point, Onyx River)
1988-
1989
6 (NR) NR 0.0011 to
0.0099
NR NR 3544414 (Zoccolillo and
Rellori, 1994)
Medium
AQ NR Background
Lake water collected
from 5 sites (Carezza
Lake, Edmonson
Point at altitude m
190, Tarn Flat,
Inexpressible Island
at altitude m 100 &
altitude m 50) and
Ice water collected
from 3 sites (Corner
Glacier,
Inexpressible Island, Wood Bay)
1989-
1990
8 (NR) NR 0.0014 to
0.0043
NR NR 3544414 (Zoccolillo and
Rellori, 1994)
Medium
AQ NR Background
Lake water collected
from 5 sites
(Carezza Lake,
Edmonson Point at
altitude m 190 &
altitude m 20, Tarn
Flat, Inexpressible
Island at altitude m
100) and Sea water
collected from 1 site(Icarus Field)
1990-
1991
6 (NR) NR 0.0002 to
0.0011
NR NR 3544414 (Zoccolillo and
Rellori, 1994)
Medium
Wastewater (µg/L)
KR Nation-wide Near Facility
(industrial
WWTPs) Influent/Effluent
2012 81 (NR) 1 1 to 23 1 (median) -- 3580141 (Lee et al., 2015) Medium
28 of 33
Country State/City/Region Site Year
No. of
Samples
(Det.
Freq.)
Detection
Level
Concentration Reference (HERO ID)
Range Central
Tendency
Standard
Deviation HERO Citation
Data
Eval.
Score
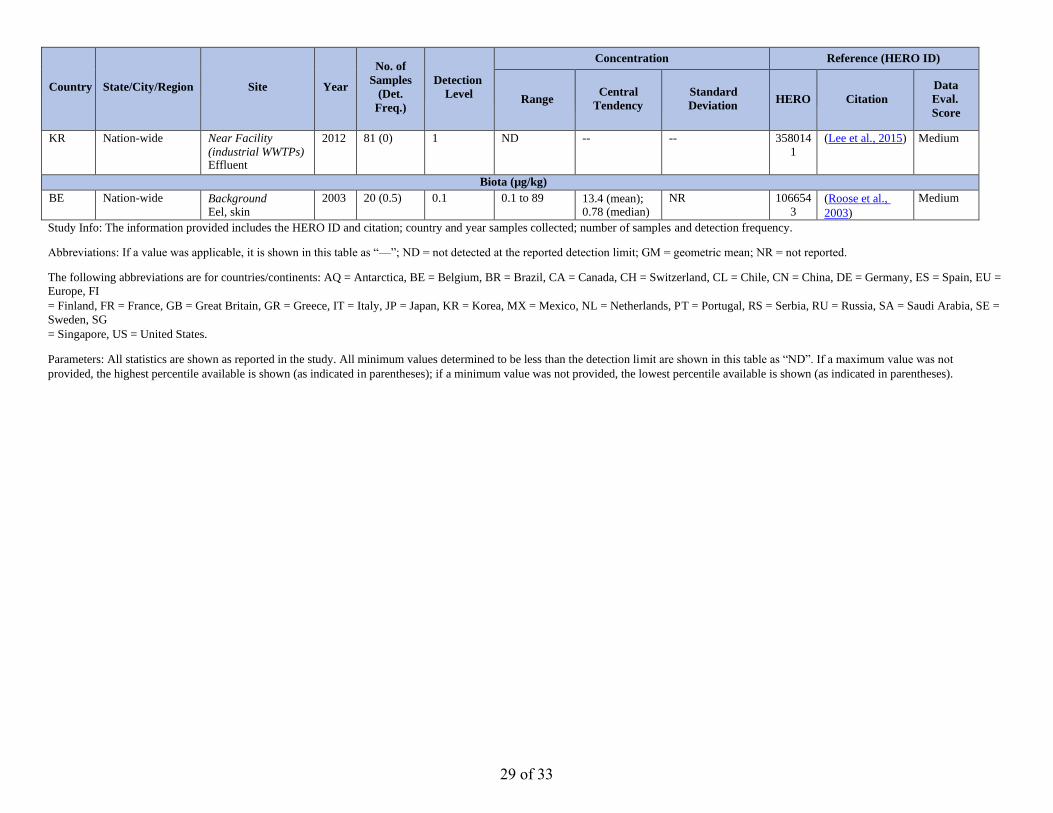
KR Nation-wide Near Facility
(industrial WWTPs) Effluent
2012 81 (0) 1 ND -- -- 358014
1
(Lee et al., 2015) Medium
Biota (µg/kg)
BE Nation-wide Background Eel, skin
2003 20 (0.5) 0.1 0.1 to 89 13.4 (mean); 0.78 (median)
NR 106654
3 (Roose et al.,
2003)
Medium
Study Info: The information provided includes the HERO ID and citation; country and year samples collected; number of samples and detection frequency.
Abbreviations: If a value was applicable, it is shown in this table as “—”; ND = not detected at the reported detection limit; GM = geometric mean; NR = not reported.
The following abbreviations are for countries/continents: AQ = Antarctica, BE = Belgium, BR = Brazil, CA = Canada, CH = Switzerland, CL = Chile, CN = China, DE = Germany, ES = Spain, EU =
Europe, FI
= Finland, FR = France, GB = Great Britain, GR = Greece, IT = Italy, JP = Japan, KR = Korea, MX = Mexico, NL = Netherlands, PT = Portugal, RS = Serbia, RU = Russia, SA = Saudi Arabia, SE =
Sweden, SG
= Singapore, US = United States.
Parameters: All statistics are shown as reported in the study. All minimum values determined to be less than the detection limit are shown in this table as “ND”. If a maximum value was not
provided, the highest percentile available is shown (as indicated in parentheses); if a minimum value was not provided, the lowest percentile available is shown (as indicated in parentheses).
29 of 33
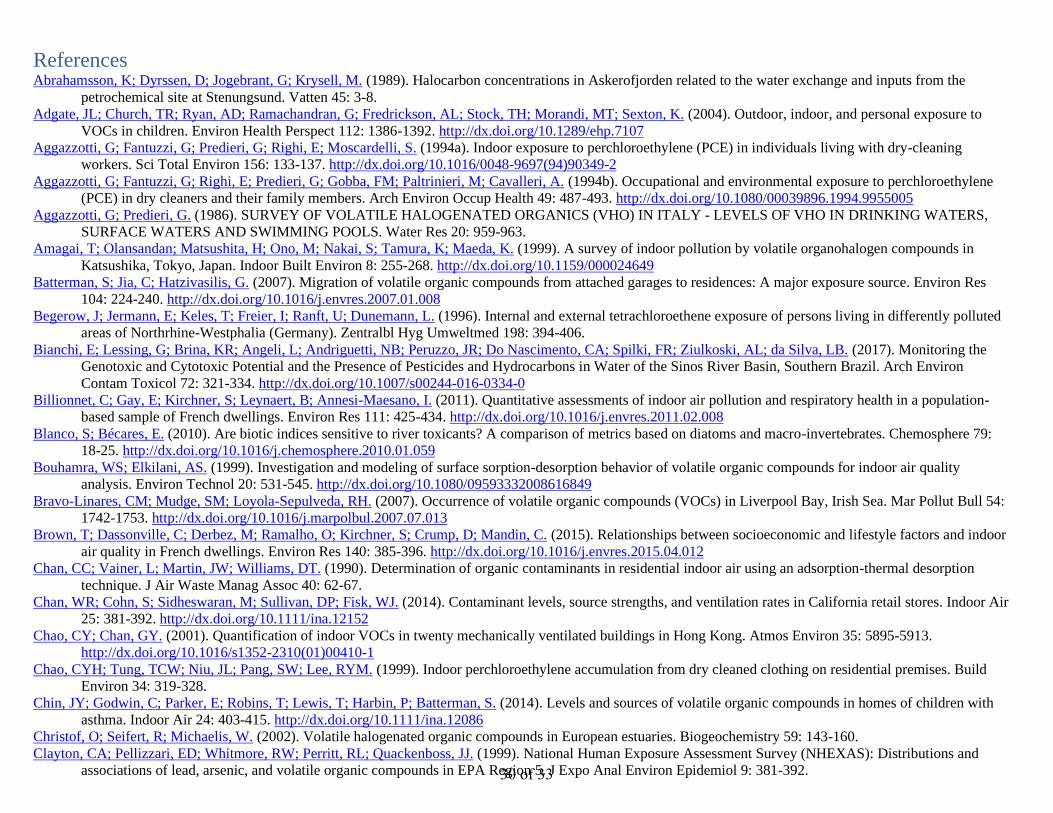
References Abrahamsson, K; Dyrssen, D; Jogebrant, G; Krysell, M. (1989). Halocarbon concentrations in Askerofjorden related to the water exchange and inputs from the
petrochemical site at Stenungsund. Vatten 45: 3-8.
Adgate, JL; Church, TR; Ryan, AD; Ramachandran, G; Fredrickson, AL; Stock, TH; Morandi, MT; Sexton, K. (2004). Outdoor, indoor, and personal exposure to
VOCs in children. Environ Health Perspect 112: 1386-1392. http://dx.doi.org/10.1289/ehp.7107
Aggazzotti, G; Fantuzzi, G; Predieri, G; Righi, E; Moscardelli, S. (1994a). Indoor exposure to perchloroethylene (PCE) in individuals living with dry-cleaning
workers. Sci Total Environ 156: 133-137. http://dx.doi.org/10.1016/0048-9697(94)90349-2
Aggazzotti, G; Fantuzzi, G; Righi, E; Predieri, G; Gobba, FM; Paltrinieri, M; Cavalleri, A. (1994b). Occupational and environmental exposure to perchloroethylene
(PCE) in dry cleaners and their family members. Arch Environ Occup Health 49: 487-493. http://dx.doi.org/10.1080/00039896.1994.9955005
Aggazzotti, G; Predieri, G. (1986). SURVEY OF VOLATILE HALOGENATED ORGANICS (VHO) IN ITALY - LEVELS OF VHO IN DRINKING WATERS,
SURFACE WATERS AND SWIMMING POOLS. Water Res 20: 959-963.
Amagai, T; Olansandan; Matsushita, H; Ono, M; Nakai, S; Tamura, K; Maeda, K. (1999). A survey of indoor pollution by volatile organohalogen compounds in
Katsushika, Tokyo, Japan. Indoor Built Environ 8: 255-268. http://dx.doi.org/10.1159/000024649
Batterman, S; Jia, C; Hatzivasilis, G. (2007). Migration of volatile organic compounds from attached garages to residences: A major exposure source. Environ Res
104: 224-240. http://dx.doi.org/10.1016/j.envres.2007.01.008
Begerow, J; Jermann, E; Keles, T; Freier, I; Ranft, U; Dunemann, L. (1996). Internal and external tetrachloroethene exposure of persons living in differently polluted
areas of Northrhine-Westphalia (Germany). Zentralbl Hyg Umweltmed 198: 394-406.
Bianchi, E; Lessing, G; Brina, KR; Angeli, L; Andriguetti, NB; Peruzzo, JR; Do Nascimento, CA; Spilki, FR; Ziulkoski, AL; da Silva, LB. (2017). Monitoring the
Genotoxic and Cytotoxic Potential and the Presence of Pesticides and Hydrocarbons in Water of the Sinos River Basin, Southern Brazil. Arch Environ
Contam Toxicol 72: 321-334. http://dx.doi.org/10.1007/s00244-016-0334-0
Billionnet, C; Gay, E; Kirchner, S; Leynaert, B; Annesi-Maesano, I. (2011). Quantitative assessments of indoor air pollution and respiratory health in a population-
based sample of French dwellings. Environ Res 111: 425-434. http://dx.doi.org/10.1016/j.envres.2011.02.008
Blanco, S; Bécares, E. (2010). Are biotic indices sensitive to river toxicants? A comparison of metrics based on diatoms and macro-invertebrates. Chemosphere 79:
18-25. http://dx.doi.org/10.1016/j.chemosphere.2010.01.059
Bouhamra, WS; Elkilani, AS. (1999). Investigation and modeling of surface sorption-desorption behavior of volatile organic compounds for indoor air quality
analysis. Environ Technol 20: 531-545. http://dx.doi.org/10.1080/09593332008616849
Bravo-Linares, CM; Mudge, SM; Loyola-Sepulveda, RH. (2007). Occurrence of volatile organic compounds (VOCs) in Liverpool Bay, Irish Sea. Mar Pollut Bull 54:
1742-1753. http://dx.doi.org/10.1016/j.marpolbul.2007.07.013
Brown, T; Dassonville, C; Derbez, M; Ramalho, O; Kirchner, S; Crump, D; Mandin, C. (2015). Relationships between socioeconomic and lifestyle factors and indoor
air quality in French dwellings. Environ Res 140: 385-396. http://dx.doi.org/10.1016/j.envres.2015.04.012
Chan, CC; Vainer, L; Martin, JW; Williams, DT. (1990). Determination of organic contaminants in residential indoor air using an adsorption-thermal desorption
technique. J Air Waste Manag Assoc 40: 62-67.
Chan, WR; Cohn, S; Sidheswaran, M; Sullivan, DP; Fisk, WJ. (2014). Contaminant levels, source strengths, and ventilation rates in California retail stores. Indoor Air
25: 381-392. http://dx.doi.org/10.1111/ina.12152
Chao, CY; Chan, GY. (2001). Quantification of indoor VOCs in twenty mechanically ventilated buildings in Hong Kong. Atmos Environ 35: 5895-5913.
http://dx.doi.org/10.1016/s1352-2310(01)00410-1
Chao, CYH; Tung, TCW; Niu, JL; Pang, SW; Lee, RYM. (1999). Indoor perchloroethylene accumulation from dry cleaned clothing on residential premises. Build
Environ 34: 319-328.
Chin, JY; Godwin, C; Parker, E; Robins, T; Lewis, T; Harbin, P; Batterman, S. (2014). Levels and sources of volatile organic compounds in homes of children with
asthma. Indoor Air 24: 403-415. http://dx.doi.org/10.1111/ina.12086
Christof, O; Seifert, R; Michaelis, W. (2002). Volatile halogenated organic compounds in European estuaries. Biogeochemistry 59: 143-160.
Clayton, CA; Pellizzari, ED; Whitmore, RW; Perritt, RL; Quackenboss, JJ. (1999). National Human Exposure Assessment Survey (NHEXAS): Distributions and
associations of lead, arsenic, and volatile organic compounds in EPA Region 5. J Expo Anal Environ Epidemiol 9: 381-392.30 of 33
http://dx.doi.org/10.1038/sj.jea.7500055
D'Souza, JC; Jia, C; Mukherjee, B; Batterman, S. (2009). Ethnicity, housing and personal factors as determinants of VOC exposures. Atmos Environ 43: 2884-2892.
http://dx.doi.org/10.1016/j.atmosenv.2009.03.017
Dai, H; Jing, S; Wang, H; Ma, Y; Li, L; Song, W; Kan, H. (2017). VOC characteristics and inhalation health risks in newly renovated residences in Shanghai, China.
Sci Total Environ 577: 73-83. http://dx.doi.org/10.1016/j.scitotenv.2016.10.071
Dawes, VJ; Waldock, MJ. (1994). Measurement of volatile organic compounds at UK national monitoring plan stations. Mar Pollut Bull 28: 291-298.
http://dx.doi.org/10.1016/0025-326X(94)90153-8
Dewulf, JP; Van Langenhove, HR; Van der Auwera, LF. (1998). Air/water exchange dynamics of 13 volatile chlorinated C1- and C2-hydrocarbons and monocyclic
aromatic hydrocarbons in the southern North Sea and the Scheldt estuary. Environ Sci Technol 32: 903-911. http://dx.doi.org/10.1021/es970765f
Dodson, RE; Levy, JI; Spengler, JD; Shine, JP; Bennett, DH. (2008). Influence of basements, garages, and common hallways on indoor residential volatile organic
compound concentrations. Atmos Environ 42: 1569-1581. http://dx.doi.org/10.1016/j.atmosenv.2007.10.088
Duclos, Y; Blanchard, M; Chesterikoff, A; Chevreuil, M. (2000). Impact of paris waste upon the chlorinated solvent concentrations of the river Seine (France). Water
Air Soil Pollut 117: 273-288. http://dx.doi.org/10.1023/A:1005165126290
Ec. (2014). SINPHONIE: Schools Indoor Pollution and Health Observatory Network in Europe. (JRC91160). Luxembourg: European Union.
http://dx.doi.org/10.2788/99220
Fytianos, K; Vasilikiotis, G; Weil, L. (1985). Identification and determination of some trace organic compounds in coastal seawater of Northern Greece. Bull Environ
Contam Toxicol 34: 390-395. http://dx.doi.org/10.1007/BF01609750
Gulyas, H; Hemmerling, L. (1990). Tetrachloroethene air pollution originating from coin-operated dry cleaning establishments. Environ Res 53: 90-99.
He, Z; Yang, G; Lu, X; Zhang, H. (2013a). Distributions and sea-to-air fluxes of chloroform, trichloroethylene, tetrachloroethylene, chlorodibromomethane and
bromoform in the Yellow Sea and the East China Sea during spring. Environ Pollut 177: 28-37. http://dx.doi.org/10.1016/j.envpol.2013.02.008
He, Z; Yang, GP; Lu, XL. (2013b). Distributions and sea-to-air fluxes of volatile halocarbons in the East China Sea in early winter. Chemosphere 90: 747-757.
http://dx.doi.org/10.1016/j.chemosphere.2012.09.067
Heavner, DL; Morgan, WT; Ogden, MW. (1995). Determination of volatile organic compounds and ETS apportionment in 49 homes. Environ Int 21: 3-21.
http://dx.doi.org/10.1016/0160-4120(94)00018-3
Hisham, MWM; Grosjean, D. (1991). Sulfur dioxide, hydrogen sulfide, total reduced sulfur, chlorinated hydrocarbons and photochemical oxidants in southern
California museums. Atmos Environ 25: 1497-1505. http://dx.doi.org/10.1016/0960-1686(91)90009-V
Hoang, T; Castorina, R; Gaspar, F; Maddalena, R; Jenkins, PL; Zhang, Q; McKone, TE; Benfenati, E; Shi, AY; Bradman, A. (2016). VOC exposures in California
early childhood education environments. Indoor Air 27: 609-621. http://dx.doi.org/10.1111/ina.12340
Howie, SJ. (1981). Ambient perchloroethylene levels inside coin-operated laundries with drycleaning machines on the premises. (EPA 600/4-82-032). Research
Triangle Park, NC: U.S. Environmental Protection Agency; Environmental Monitoring Systems Laboratory.
https://ntrl.ntis.gov/NTRL/dashboard/searchResults.xhtml?searchQuery=PB82230947
Hurford, N; Law, RJ; Payne, AP; Fileman, TW. (1989). Concentrations of chemicals in the North Sea arising from discharges from chemical tankers. 5: 391-410.
Huybrechts, T; Dewulf, J; Van Langenhove, H. (2005). Priority volatile organic compounds in surface waters of the southern North Sea. Environ Pollut 133: 255-264.
http://dx.doi.org/10.1016/j.envpol.2004.05.03
Insogna, S; Frison, S; Marconi, E; Bacaloni, A. (2014). Trends of volatile chlorinated hydrocarbons and trihalomethanes in Antarctica. Int J Environ Anal Chem 94:
1343-1359. http://dx.doi.org/10.1080/03067319.2014.974587
Jia, C; Batterman, S; Godwin, C. (2008a). VOCs in industrial, urban and suburban neighborhoods, Part 1: Indoor and outdoor concentrations, variation, and risk
drivers. Atmos Environ 42: 2083-2100. http://dx.doi.org/10.1016/j.atmosenv.2007.11.055
Jia, C; Batterman, S; Godwin, C; Charles, S; Chin, JY. (2010). Sources and migration of volatile organic compounds in mixed-use buildings. Indoor Air 20: 357-369.
http://dx.doi.org/10.1111/j.1600-0668.2010.00643.x
Jia, CR; D'Souza, J; Batterman, S. (2008b). Distributions of personal VOC exposures: A population-based analysis. Environ Int 34: 922-931.
http://dx.doi.org/10.1016/j.envint.2008.02.002
Kawauchi, T; Nishiyama, K. (1989). Residual tetrachloroethylene in dry-cleaned clothes. Environ Res 48: 296-301.
Kiurski, JS; Oros, IB; Kecic, VS; Kovacevic, IM; Aksentijevic, SM. (2016). The temporal variation of indoor pollutants in photocopying shop. Stoch Environ Res 31 of 33
Risk Assess 30: 1289-1300. http://dx.doi.org/10.1007/s00477-015-1107-4
Kostiainen, R. (1995). Volatile organic compounds in the indoor air of normal and sick houses. Atmos Environ 29: 693-702. http://dx.doi.org/10.1016/1352-
2310(94)00309-9
Kostopoulou, MN; Golfinopoulos, SK; Nikolaou, AD; Xilourgidis, NK; Lekkas, TD. (2000). Volatile organic compounds in the surface waters of northern Greece.
Chemosphere 40: 527-532.
Lebret, E; van de Wiel, HJ; Bos, HP; Noij, D; Boleij, JSM. (1986). Volatile organic compounds in Dutch homes. Environ Int 12: 323-332.
Lee, W; Park, SH; Kim, J; Jung, JY. (2015). Occurrence and removal of hazardous chemicals and toxic metals in 27 industrial wastewater treatment plants in Korea.
Desalination Water Treat 54: 1141-1149. http://dx.doi.org/10.1080/19443994.2014.935810
Lehmann, I; Thoelke, A; Rehwagen, M; Rolle-Kampczyk, U; Schlink, U; Schulz, R; Borte, M; Diez, U; Herbarth, O. (2002). The influence of maternal exposure to
volatile organic compounds on the cytokine secretion profile of neonatal T cells. Environ Toxicol 17: 203-210. http://dx.doi.org/10.1002/tox.10055
Lindstrom, AB; Proffitt, D; Fortune, CR. (1995). Effects of modified residential construction on indoor air quality. Indoor Air 5: 258-269.
http://dx.doi.org/10.1111/j.1600-0668.1995.00005.x
Loh, MM; Houseman, EA; Gray, GM; Levy, JI; Spengler, JD; Bennett, DH. (2006). Measured concentrations of VOCs in several non-residential microenvironments
in the United States. Environ Sci Technol 40: 6903-6911. http://dx.doi.org/10.1021/es060197g
Ma, H; Zhang, H; Wang, L; Wang, J; Chen, J. (2014). Comprehensive screening and priority ranking of volatile organic compounds in Daliao River, China. Environ
Monit Assess 186: 2813-2821. http://dx.doi.org/10.1007/s10661-013-3582-8
Martinez, E; Llobet, I; Lacorte, S; Viana, P; Barcelo, D. (2002). Patterns and levels of halogenated volatile compounds in Portuguese surface waters. J Environ Monit
4: 253-257. http://dx.doi.org/10.1039/b109623k
Ohura, T; Amagai, T; Senga, Y; Fusaya, M. (2006). Organic air pollutants inside and outside residences in Shimizu, Japan: Levels, sources and risks. Sci Total
Environ 366: 485-499. http://dx.doi.org/10.1016/j.scitotenv.2005.10.005
Park, JH; Spengler, JD; Yoon, DW; Dumyahn, T; Lee, K; Ozkaynak, H. (1998). Measurement of air exchange rate of stationary vehicles and estimation of in-vehicle
exposure. J Expo Anal Environ Epidemiol 8: 65-78.
Roda, C; Kousignian, I; Ramond, A; Momas, I. (2013). Indoor tetrachloroethylene levels and determinants in Paris dwellings. Environ Res 120: 1-6.
http://dx.doi.org/10.1016/j.envres.2012.09.005
Rogers, HR; Crathorne, B; Watts, CD. (1992). Sources and fate of organic contaminants in the Mersey estuary: Volatile organohalogen compounds. Mar Pollut Bull
24: 82-91. http://dx.doi.org/10.1016/0025-326X(92)90734-N
Roose, P; Van Thuyne, G; Belpaire, C; Raemaekers, M; Brinkman, UA. (2003). Determination of VOCs in yellow eel from various inland water bodies in Flanders
(Belgium). J Environ Monit 5: 876-884. http://dx.doi.org/10.1039/b307862k
Ryan, TJ; Hart, EM; Kappler, LL. (2002). VOC exposures in a mixed-use university art building. AIHA J 63: 703-708. http://dx.doi.org/10.1202/0002-
8894(2002)063<0703:VEIAMU>2.0.CO;2
Sax, SN; Bennett, DH; Chillrud, SN; Kinney, PL; Spengler, JD. (2004). Differences in source emission rates of volatile organic compounds in inner-city residences of
New York City and Los Angeles. J Expo Anal Environ Epidemiol 14: S95-109. http://dx.doi.org/10.1038/sj.jea.7500364
Schwarzenbach, RP; Giger, W; Hoehn, E; Schneider, JK. (1983). Behavior of organic compounds during infiltration of river water to groundwater. Field studies.
Environ Sci Technol 17: 472-479. http://dx.doi.org/10.1021/es00114a007
Serrano-Trespalacios, PI; Ryan, L; Spengler, JD. (2004). Ambient, indoor and personal exposure relationships of volatile organic compounds in Mexico City
metropolitan area. J Expo Anal Environ Epidemiol 14 Suppl 1: S118-S132. http://dx.doi.org/10.1038/sj.jea.7500366
Sexton, K; Mongin, SJ; Adgate, JL; Pratt, GC; Ramachandran, G; Stock, TH; Morandi, MT. (2007). Estimating volatile organic compound concentrations in selected
microenvironments using time-activity and personal exposure data. J Toxicol Environ Health A 70: 465-476. http://dx.doi.org/10.1080/15287390600870858
Singh, HB; Salas, LJ; Stiles, RE. (1983). Selected man-made halogenated chemicals in the air and oceanic environment. J Geophys Res 88: 3675-3683.
Stefaniak, AB; Breysse, PN; Murray, MPM; Rooney, BC; Schaefer, J. (2000). An evaluation of employee exposure to volatile organic compounds in three photocopy
centers. Environ Res 83: 162-173. http://dx.doi.org/10.1006/enrs.2000.4061
Su, FC; Mukherjee, B; Batterman, S. (2013). Determinants of personal, indoor and outdoor VOC concentrations: An analysis of the RIOPA data. Environ Res 126:
192-203. http://dx.doi.org/10.1016/j.envres.2013.08.005
Tham, KW; Zuraimi, MS; Sekhar, SC. (2004). Emission modelling and validation of VOCs' source strengths in air-conditioned office premises. Environ Int 30: 1075-32 of 33
1088. http://dx.doi.org/10.1016/j.envint.2004.06.001
Thomas, KW; Pellizzari, ED; Perritt, RL; Nelson, WC. (1991). Effect of dry-cleaned clothes on tetrachloroethylene levels in indoor air, personal air, and breath for
residents of several New Jersey homes. J Expo Anal Environ Epidemiol 1: 475-490.
Tichenor, BA; Sparks, LE; Jackson, MD; Guo, Z; Mason, MA; Plunket, CM; Rasor, SA. (1990). Emissions of perchloroethylene from dry cleaned fabrics. Atmos
Environ 24: 1219-1229. http://dx.doi.org/10.1016/0960-1686(90)90087-4
USGS. (2003). A national survey of methyl tert-butyl ether and other volatile organic compounds in drinking-water sources: Results of the random survey. Reston,
VA: U.S. Department of the Interior, U.S. Geological Survey. https://pubs.er.usgs.gov/publication/wri024079
USGS. (2006). Water-quality conditions of Chester Creek, Anchorage, Alaska, 1998-2001. Reston, VA: U.S. Department of the Interior, U.S. Geological Survey.
https://pubs.er.usgs.gov/publication/sir20065229
Van Winkle, MR; Scheff, PA. (2001). Volatile organic compounds, polycyclic aromatic hydrocarbons and elements in the air of ten urban homes. Indoor Air 11: 49-
64. http://dx.doi.org/10.1034/j.1600-0668.2001.011001049.x
Wallace, LA. (1986). Personal exposures, indoor and outdoor air concentrations, and exhaled breath concentrations of selected volatile organic compounds measured
for 600 residents of New Jersey, North Dakota, North Carolina, and California. Toxicol Environ Chem 12: 215-236.
http://dx.doi.org/10.1080/02772248609357160
Weissflog, L; Elansky, N; Putz, E; Krueger, G; Lange, CA; Lisitzina, L; Pfennigsdorff, A. (2004). Trichloroacetic acid in the vegetation of polluted and remote areas
of both hemispheres - Part II: Salt lakes as novel sources of natural chlorohydrocarbons. Atmos Environ 38: 4197-4204.
http://dx.doi.org/10.1016/j.atmosenv.2004.04.032
Wu, XM; Apte, MG; Maddalena, R; Bennett, DH. (2011). Volatile organic compounds in small- and medium-sized commercial buildings in California. Environ Sci
Technol 45: 9075-9083. http://dx.doi.org/10.1021/es202132u
Yamamoto, K; Fukushima, M; Kakutani, N; Kuroda, K. (1997). Volatile organic compounds in urban rivers and their estuaries in Osaka, Japan. Environ Pollut 95:
135-143. http://dx.doi.org/10.1016/S0269-7491(96)00100-5
Yamamoto, K; Fukushima, M; Kakutani, N; Tsuruho, K. (2001). Contamination of vinyl chloride in shallow urban rivers in Osaka, Japan. Water Res 35: 561-566.
http://dx.doi.org/10.1016/s0043-1354(00)00278-5
Zoccolillo, L; Abete, C; Amendola, L; Ruocco, R; Sbrilli, A; Termine, M. (2004). Halocarbons in aqueous matrices from the Rennick Glacier and the Ross Sea
(Antarctica). Int J Environ Anal Chem 84: 513-522. http://dx.doi.org/10.1080/03067310310001637676
Zoccolillo, L; Rellori, M. (1994). Halocarbons in Antarctic surface waters. Int J Environ Anal Chem 55: 27-32. http://dx.doi.org/10.1080/03067319408026206
Zuraimi, MS; Tham, KW. (2008). Effects of child care center ventilation strategies on volatile organic compounds of indoor and outdoor origins. Environ Sci Technol
42: 2054-2059. http://dx.doi.org/10.1021/es0714033
33 of 33