draft town of payson development fee study land use
TRANSCRIPT

TOWN OF PAYSON DEVELOPMENT FEE STUDY LAND USE ASSUMPTIONS,
INFRASTRUCTURE IMPROVEMENTS PLAN, AND DEVELOPMENT FEE REPORT
Prepared for: Town of Payson, Arizona
May 15, 2014
4701 Sangamore Road, Suite S240 Bethesda, MD 301.320.6900
www.tischlerbise.com

Development Fee Study Town of Payson, Arizona
[PAGE INTENTIONALLY LEFT BLANK]

Development Fee Study Town of Payson, Arizona
1
TABLE OF CONTENTS
EXECUTIVE SUMMARY .................................................................................................................................. 3
ARIZONA DEVELOPMENT FEE ENABLING LEGISLATION ......................................................................................... 3 NECESSARY PUBLIC SERVICES .................................................................................................................................. 3 INFRASTRUCTURE IMPROVEMENTS PLAN ................................................................................................................ 4 QUALIFIED PROFESSIONALS ..................................................................................................................................... 5
DEVELOPMENT FEE REPORT ........................................................................................................................ 7
CALCULATION METHODOLOGIES ............................................................................................................................ 7 MAXIMUM SUPPORTABLE DEVELOPMENT FEES ...................................................................................................... 8 COMPARISON TO CURRENT DEVELOPMENT FEES ................................................................................................... 9
PARKS AND RECREATIONAL FACILITIES INFRASTRUCTURE IMPROVEMENTS PLAN ............ 11
OVERVIEW ............................................................................................................................................................... 11 SERVICE AREA ........................................................................................................................................................ 11 PROPORTIONATE SHARE ........................................................................................................................................ 12 IIP FOR PARKS AND RECREATIONAL FACILITIES ................................................................................................... 13 ANALYSIS OF CAPACITY, USAGE, AND COSTS OF EXISTING PUBLIC SERVICES ..................................................... 13 RATIO OF SERVICE UNIT TO DEVELOPMENT UNIT ................................................................................................ 18 PROJECTED SERVICE UNITS AND FACILITIES DEMAND ......................................................................................... 18 MAXIMUM SUPPORTABLE PARKS AND RECREATIONAL FACILITIES DEVELOPMENT FEES ................................... 20 FORECAST OF REVENUES ........................................................................................................................................ 22
FIRE FACILITIES INFRASTRUCTURE IMPROVEMENTS PLAN ........................................................... 23
OVERVIEW ............................................................................................................................................................... 23 SERVICE AREA ........................................................................................................................................................ 23 PROPORTIONATE SHARE ........................................................................................................................................ 24 IIP FOR FIRE FACILITIES .......................................................................................................................................... 26 ANALYSIS OF CAPACITY, USAGE, AND COSTS OF EXISTING PUBLIC SERVICES ..................................................... 26 RATIO OF SERVICE UNIT TO DEVELOPMENT UNIT ................................................................................................ 30 PROJECTED SERVICE UNITS AND FACILITIES DEMAND ......................................................................................... 31 MAXIMUM SUPPORTABLE FIRE FACILITIES DEVELOPMENT FEES .......................................................................... 33 FORECAST OF REVENUES ........................................................................................................................................ 35
POLICE FACILITIES INFRASTRUCTURE IMPROVEMENTS PLAN ..................................................... 37
OVERVIEW ............................................................................................................................................................... 37 SERVICE AREA ........................................................................................................................................................ 37 PROPORTIONATE SHARE ........................................................................................................................................ 37 IIP FOR POLICE FACILITIES ..................................................................................................................................... 40 ANALYSIS OF CAPACITY, USAGE, AND COSTS OF EXISTING PUBLIC SERVICES ..................................................... 40 RATIO OF SERVICE UNIT TO DEVELOPMENT UNIT ................................................................................................ 45 PROJECTED SERVICE UNITS AND FACILITIES DEMAND ......................................................................................... 46 MAXIMUM SUPPORTABLE POLICE FACILITIES DEVELOPMENT FEES ..................................................................... 48 FORECAST OF REVENUES ........................................................................................................................................ 50

Development Fee Study Town of Payson, Arizona
2
STREET FACILITIES INFRASTRUCTURE IMPROVEMENTS PLAN ..................................................... 51
OVERVIEW ............................................................................................................................................................... 51 SERVICE AREA ........................................................................................................................................................ 51 PROPORTIONATE SHARE ........................................................................................................................................ 52 IIP FOR STREET FACILITIES ..................................................................................................................................... 52 ANALYSIS OF CAPACITY, USAGE, AND COSTS OF EXISTING PUBLIC SERVICES ..................................................... 52 LEVEL OF SERVICE AND RATIO OF SERVICE UNIT TO LAND USE .......................................................................... 59 PROJECTED SERVICE UNITS AND FACILITIES DEMAND ......................................................................................... 60 DESCRIPTION OF NECESSARY EXPANSIONS AND COSTS ATTRIBUTABLE TO DEVELOPMENT ............................... 62 MAXIMUM SUPPORTABLE STREET FACILITIES DEVELOPMENT FEES ..................................................................... 63 FORECAST OF REVENUES ........................................................................................................................................ 65
WATER FACILITIES INFRASTRUCTURE IMPROVEMENTS PLAN ..................................................... 67
OVERVIEW ............................................................................................................................................................... 67 SERVICE AREA ........................................................................................................................................................ 67 PROPORTIONATE SHARE ........................................................................................................................................ 68 IIP FOR WATER FACILITIES ..................................................................................................................................... 70 ANALYSIS OF COSTS, CAPACITY, AND USAGE OF EXISTING PUBLIC SERVICES ..................................................... 70 LEVEL OF SERVICE AND RATIO OF SERVICE UNIT TO LAND USE .......................................................................... 76 PROJECTED SERVICE UNITS AND FACILITIES DEMAND ......................................................................................... 77 MAXIMUM SUPPORTABLE WATER FACILITIES DEVELOPMENT FEES..................................................................... 79 FORECAST OF REVENUES ........................................................................................................................................ 81
APPENDIX A - COST OF PROFESSIONAL SERVICES ............................................................................. 83
APPENDIX B - FORECAST OF REVENUES OTHER THAN DEVELOPMENT FEES ............................ 84
REVENUE PROJECTIONS .......................................................................................................................................... 85
APPENDIX C – LAND USE ASSUMPTIONS .............................................................................................. 89
RESIDENTIAL DEVELOPMENT ................................................................................................................................. 91 NONRESIDENTIAL DEVELOPMENT ......................................................................................................................... 98 AVERAGE DAILY VEHICLE TRIPS ......................................................................................................................... 102 SUMMARY ............................................................................................................................................................. 105

Development Fee Study Town of Payson, Arizona
3
EXECUTIVE SUMMARY
The Town of Payson engaged TischlerBise to update its development fees for several categories of necessary public services pursuant to Arizona Revised Statutes 9-463.05. Municipalities in Arizona may assess development fees to offset infrastructure costs to a municipality associated with providing necessary public services to a development. The development fees must be based on an Infrastructure Improvements Plan. Development fees cannot be used for, among other things: projects not included in the Infrastructure Improvements Plan, projects related to existing development, or costs related to operations and maintenance.
This Infrastructure Improvements Plan and associated update of development fees include the following necessary public services:
Parks and Recreational Facilities Public Safety Facilities (Police and Fire) Streets Facilities Water Facilities
This plan includes all necessary elements required to comply with the Arizona Revised Statue 9-463.05.
ARIZONA DEVELOPMENT FEE ENABLING LEGISLATION
Arizona Revised Statutes 9-463.05 (hereafter referred to as “development fee enabling legislation”) governs how development fees are calculated for municipalities in Arizona. During the state legislative session of 2011, Senate Bill 1525 (SB 1525) was introduced which significantly amended the development fee enabling legislation. The changes included:
Amending existing development fee programs by January 1, 2012; Abandoning existing development fee programs by August 1, 2014; A new development fee program structure developed from a unified Land Use Assumptions
document and Infrastructure Improvements Plan; New adoption procedures for the Land Use Assumptions, Infrastructure Improvements Plan, and
development fees; New definitions, including “necessary public services” which defines what categories and types
of infrastructure may be funded with development fees; Time limitations in development fee collections and expenditures; and New requirements for credits, “grandfathering” rules, and refunds.
Governor Brewer signed SB 1525 into law on April 26, 2011. This update of the Town’s development fees will comply with all of the new requirements of SB 1525.
NECESSARY PUBLIC SERVICES
The Town of Payson currently collects development fees for the following infrastructure categories: Public Safety Parks Transportation Water

Development Fee Study Town of Payson, Arizona
4
Under the requirements of the new development fee enabling legislation, development fees may be used only for construction, acquisition or expansion of public facilities that are necessary public services. “Necessary public service” means any of the following categories of facilities that have a life expectancy of three or more years and that are owned and operated on behalf of the municipality:
Water Facilities Wastewater Facilities Storm Water, Drainage, and Flood Control Facilities Library Facilities Streets Facilities Fire and Police Facilities Neighborhood Parks and Recreational Facilities Any facility that was financed before June 1, 2011 and that meets the following requirements:
1. Development fees were pledged to repay debt service obligations related to the construction of the facility.
2. After August 1, 2014, any development fees collected are used solely for the payment of principal and interest on the portion of the bonds, notes, or other debt service obligations issued before June 1, 2011 to finance construction of the facility.
INFRASTRUCTURE IMPROVEMENTS PLAN
Development fees must be calculated pursuant to an Infrastructure Improvements Plan (hereafter referred to as the “IIP”). For each necessary public service that is the subject of a development fee, by law, the infrastructure improvements plan shall include the following seven elements:
Element #1: A description of the existing necessary public services in the service area and the costs to upgrade, update, improve, expand, correct or replace those necessary public services to meet existing needs and usage and stricter safety, efficiency, environmental or regulatory standards, which shall be prepared by qualified professionals licensed in this state, as applicable.
Element #2: An analysis of the total capacity, the level of current usage and commitments for usage of capacity of the existing necessary public services, which shall be prepared by qualified professionals licensed in this state, as applicable.
Element #3: A description of all or the parts of the necessary public services or facility expansions and their costs necessitated by and attributable to development in the service area based on the approved land use assumptions, including a forecast of the costs of infrastructure, improvements, real property, financing, engineering and architectural services, which shall be prepared by qualified professionals licensed in this state, as applicable.
Element #4: A table establishing the specific level or quantity of use, consumption, generation or discharge of a service unit for each category of necessary public services or facility expansions and an equivalency or conversion table establishing the ratio of a service unit to various types of land uses, including residential, commercial and industrial.
Development Fee Study Town of Payson, Arizona
5
Element #5: The total number of projected service units necessitated by and attributable to new development in the service area based on the approved land use assumptions and calculated pursuant to generally accepted engineering and planning criteria.
Element #6: The projected demand for necessary public services or facility expansions required by new service units for a period not to exceed ten years.
Element #7: A forecast of revenues generated by new service units other than development fees, which shall include estimated state-shared revenue, highway users revenue, federal revenue, ad valorem property taxes, construction contracting or similar excise taxes and the capital recovery portion of utility fees attributable to development based on the approved land use assumptions, and a plan to include these contributions in determining the extent of the burden imposed by the development.
QUALIFIED PROFESSIONALS
The IIP must be developed by qualified professionals using generally accepted engineering and planning practices. A qualified professional is defined as “a professional engineer, surveyor, financial analyst or planner providing services within the scope of the person’s license, education, or experience.”
TischlerBise is a fiscal, economic, and planning consulting firm specializing in the cost of growth services. Our services include development fees, fiscal impact analysis, infrastructure financing analyses, user fee/cost of service studies, capital improvement plans, and fiscal software. TischlerBise has prepared over 800 impact fee studies over the past 30 years for local governments across the United States.
Development Fee Study Town of Payson, Arizona
6
[PAGE INTENTIONALLY LEFT BLANK]

Development Fee Study: Development Fee Report Town of Payson, Arizona
7
DEVELOPMENT FEE REPORT
CALCULATION METHODOLOGIES
Development fees for the necessary public services generated by new development must be based on the same level of service provided to existing development in the service area. There are three basic methodologies used to calculate development fees. They examine the past, present, and future status of infrastructure. The objective of evaluating these different methodologies is to determine the best measure of the demand created by new development for additional infrastructure capacity.
Cost recovery (past) is used in instances when a community has oversized a facility or asset in anticipation of future development. This methodology is based on the rationale that new development is repaying the community for its share of the remaining unused capacity.
Incremental expansion (present) is used to document the current level of service for each type of public facility. The intent is to use revenue collected to expand or provide additional facilities, as needed to accommodate new development, based on the current cost to provide capital improvements.
Plan-based (future) utilizes a community’s capital improvement plan and/or other adopted plans or engineering studies to guide capital improvements needed to serve new development.
Figure 1 is a summary of the methodologies and components used to calculate the IIP.
Figure 1: Recommended Calculation Methodologies
Methodology Necessary
Public Service Cost Recovery
(Past) Incremental Expansion
(Present) Plan Based
(Future)
Parks and Recreational Not Applicable Park Improvements Multi-Use Trails
Parks & Recreation Master Plan Multi-Use Trails Master Plan
Fire Not Applicable Vehicles Communications Equipment Communications Infrastructure
Not Applicable
Police Not Applicable
Facilities Vehicles Communications Equipment Communications Infrastructure
Not Applicable
Streets Not Applicable Not Applicable Street Improvements
Water Not Applicable Not Applicable Surface Water Delivery Surface Water Treatment Surface Water Distribution
Reporting Results Calculations throughout this Study are based on analysis conducted using Excel software. Formulas and
results are discussed herein using one-and two-digit place (in most cases), which represent rounded
figures. However, the analysis itself uses figures carried to their ultimate decimal places; therefore the
sums and products generated in the analysis may not equal the sum or product if the reader replicates
the calculation with the factors shown in the Study (due to the rounding of figures shown, not in the
analysis.)

Development Fee Study: Development Fee Report Town of Payson, Arizona
8
MAXIMUM SUPPORTABLE DEVELOPMENT FEES
Based on the data, assumptions, and calculation methodologies in APPENDIX C – Land Use Assumptions document and Infrastructure Improvements Plans, the proposed development fees are listed in the figure below.
Maximum Supportable Development Fee Schedule
Figure 2: Maximum Supportable Town of Payson Development Fees
Source: TischlerBise
Future Debt Service
There is no debt service associated with necessary public services identified in the Parks and Recreational, Fire, Police, or Street Facilities Infrastructure Improvements Plans; therefore, no debt service consideration is necessary for any of these development fees.
Payson estimates it will retire the debt obligations for the Water Facilities improvements by year 2054. The future Water Facilities development fee revenue is dedicated to this obligation. Over the life of the bonds, development fee revenue is expected to pay approximately 88 percent of the total obligation. The Town expects to pay the portion of the obligation not recouped by development fees through grants and other financing options (non-rate revenue). Therefore, a credit for other revenues is not necessary, as there is no potential double payment for the growth-related cost. This situation will be reevaluated within five years, after the financing has been completed.
Parks & WaterLand Use Category Recreation Fire Police Street Resources Development Fee
Number of Residential Bedrooms ~~~~~~~~~~~~~~~~~ Per Housing Unit ~~~~~~~~~~~~~~~~~
2+ Unit Al l Sizes $507 $305 $307 $466 $4,944 $6,529
Single Unit 0-3 $593 $357 $359 $571 $5,801 $7,681
Single Unit 4+ $933 $563 $565 $830 $9,097 $11,988Single Unit Avg $673 $406 $407 $637 $6,592 $8,715
Nonresidential
$0.20 $0.65 $0.27 $0.96 $2.08
$0.33 $0.25 $0.10 $0.41 $1.09$0.23 $0.16 $0.06 $0.26 $0.71
Number of Residential Bedrooms
2+ Unit 0-2 $4,1532+ Unit 3+ $7,515
Nonresidential
$0.88
$2.20
$0.66$0.33
~~~ Unit ~~~
Hotel/Motel per Room $2,955Nurs ing Home per Bed $2,188
~~~~~~~~~ Per Unit ~~~~~~~~~~~~
~~~~~~~~~ Per Square Foot ~~~~~~~~~
Commercia l
OfficeIndustria l
Commercia l
Office/Insti tutional
Industria l - ManufacturingIndustria l - Warehouse Space
Specialized Water Resources Development Fee Land Uses
Water Resources
Development Fee
~~~~~~~~~ Per Unit ~~~~~~~~~~~~
~~~~ Per Square Foot of Floor Area ~~~~~~~~~~
Development Fee Study: Development Fee Report Town of Payson, Arizona
9
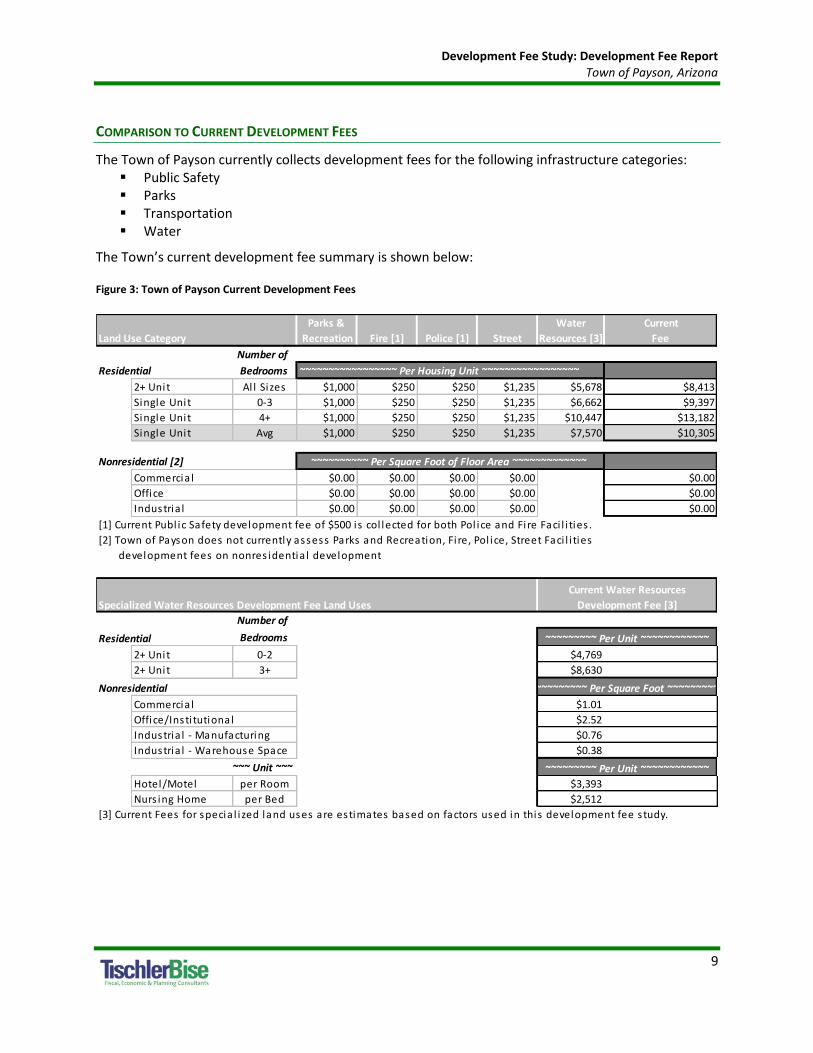
COMPARISON TO CURRENT DEVELOPMENT FEES
The Town of Payson currently collects development fees for the following infrastructure categories: Public Safety Parks Transportation Water
The Town’s current development fee summary is shown below:
Figure 3: Town of Payson Current Development Fees
Parks & Water Current
Land Use Category Recreation Fire [1] Police [1] Street Resources [3] Fee
Number of
Residential Bedrooms ~~~~~~~~~~~~~~~~~ Per Housing Unit ~~~~~~~~~~~~~~~~~
2+ Unit Al l Sizes $1,000 $250 $250 $1,235 $5,678 $8,413
Single Unit 0-3 $1,000 $250 $250 $1,235 $6,662 $9,397
Single Unit 4+ $1,000 $250 $250 $1,235 $10,447 $13,182
Single Unit Avg $1,000 $250 $250 $1,235 $7,570 $10,305
Nonresidential [2]
$0.00 $0.00 $0.00 $0.00 $0.00
$0.00 $0.00 $0.00 $0.00 $0.00
$0.00 $0.00 $0.00 $0.00 $0.00
[1] Current Publ ic Safety development fee of $500 is col lected for both Pol ice and Fi re Faci l i ties .
[2] Town of Payson does not currently assess Parks and Recreation, Fi re, Pol ice, Street Faci l i ties
development fees on nonres identia l development
Number of
Residential Bedrooms
2+ Unit 0-2 $4,769
2+ Unit 3+ $8,630
Nonresidential
$1.01
$2.52
$0.76
$0.38
~~~ Unit ~~~
Hotel/Motel per Room $3,393
Nurs ing Home per Bed $2,512
[3] Current Fees for specia l i zed land uses are estimates based on factors used in this development fee s tudy.
~~~~~~~~~~ Per Square Foot of Floor Area ~~~~~~~~~~~~~
Commercia l
~~~~~~~~~ Per Unit ~~~~~~~~~~~~
Office/Insti tutional
Industria l - Manufacturing
Industria l - Warehouse Space
Office
Industria l
~~~~~~~~~ Per Unit ~~~~~~~~~~~~
~~~~~~~~~ Per Square Foot ~~~~~~~~~
Specialized Water Resources Development Fee Land Uses
Current Water Resources
Development Fee [3]
Commercia l
Development Fee Study: Development Fee Report Town of Payson, Arizona
10
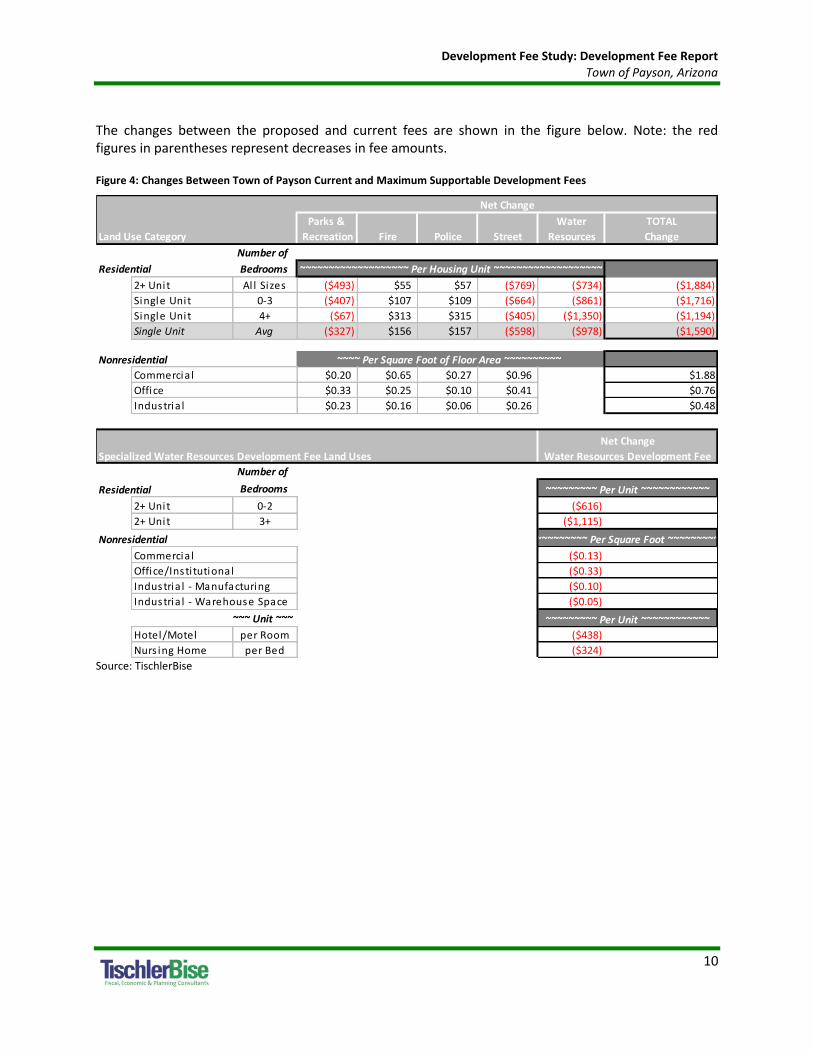
The changes between the proposed and current fees are shown in the figure below. Note: the red figures in parentheses represent decreases in fee amounts.
Figure 4: Changes Between Town of Payson Current and Maximum Supportable Development Fees
Source: TischlerBise
Parks & Water TOTAL
Land Use Category Recreation Fire Police Street Resources Change
Number of
Residential Bedrooms ~~~~~~~~~~~~~~~~~~~ Per Housing Unit ~~~~~~~~~~~~~~~~~~~
2+ Unit Al l Sizes ($493) $55 $57 ($769) ($734) ($1,884)
Single Unit 0-3 ($407) $107 $109 ($664) ($861) ($1,716)
Single Unit 4+ ($67) $313 $315 ($405) ($1,350) ($1,194)
Single Unit Avg ($327) $156 $157 ($598) ($978) ($1,590)
Nonresidential
$0.20 $0.65 $0.27 $0.96 $1.88
$0.33 $0.25 $0.10 $0.41 $0.76
$0.23 $0.16 $0.06 $0.26 $0.48
Number of
Residential Bedrooms
2+ Unit 0-2 ($616)
2+ Unit 3+ ($1,115)
Nonresidential
($0.13)
($0.33)
($0.10)
($0.05)
~~~ Unit ~~~
Hotel/Motel per Room ($438)
Nurs ing Home per Bed ($324)
Commercia l
Specialized Water Resources Development Fee Land Uses
Net Change
Water Resources Development Fee
~~~~~~~~~ Per Unit ~~~~~~~~~~~~
Office
Industria l
~~~~~~~~~ Per Unit ~~~~~~~~~~~~
~~~~~~~~~ Per Square Foot ~~~~~~~~~
Commercia l
Office/Insti tutional
Industria l - Manufacturing
Industria l - Warehouse Space
~~~~ Per Square Foot of Floor Area ~~~~~~~~~~
Net Change

Development Fee Study: Infrastructure Improvements Plan Town of Payson, Arizona
11
PARKS AND RECREATIONAL FACILITIES INFRASTRUCTURE IMPROVEMENTS PLAN
OVERVIEW
ARS 9-463.05 (T)(7)(g) defines the facilities and assets that can be included in the Parks and Recreational Facilities IIP:
“Neighborhood parks and recreational facilities on real property up to thirty acres in area, or parks and recreational facilities larger than thirty acres if the facilities provide a direct benefit to the development. Park and recreational facilities do not include vehicles, equipment or that portion of any facility that is used for amusement parks, aquariums, aquatic centers, auditoriums, arenas, arts and cultural facilities, bandstand and orchestra facilities, bathhouses, boathouses, clubhouses, community centers greater than three thousand square feet in floor area, environmental education centers, equestrian facilities, golf course facilities, greenhouses, lakes, museums, theme parks, water reclamation or riparian areas, wetlands, zoo facilities or similar recreational facilities, but may include swimming pools.”
The Parks and Recreational Facilities IIP includes components for park improvements, multi-use trails, a parks and recreation master plan, a multi-use trails master plan, and the cost of preparing the Parks and Recreational Facilities IIP and development fees. Park improvements, and multi-use trails are calculated using an incremental expansion methodology; the master plan calculations use a plan-based methodology.
SERVICE AREA
The Town of Payson plans to provide a uniform level of service for Parks and Recreational facilities throughout the Town. As a result, the service area for the Parks and Recreational Facilities IIP is Townwide.
Development Fee Study: Infrastructure Improvements Plan Town of Payson, Arizona
12
PROPORTIONATE SHARE
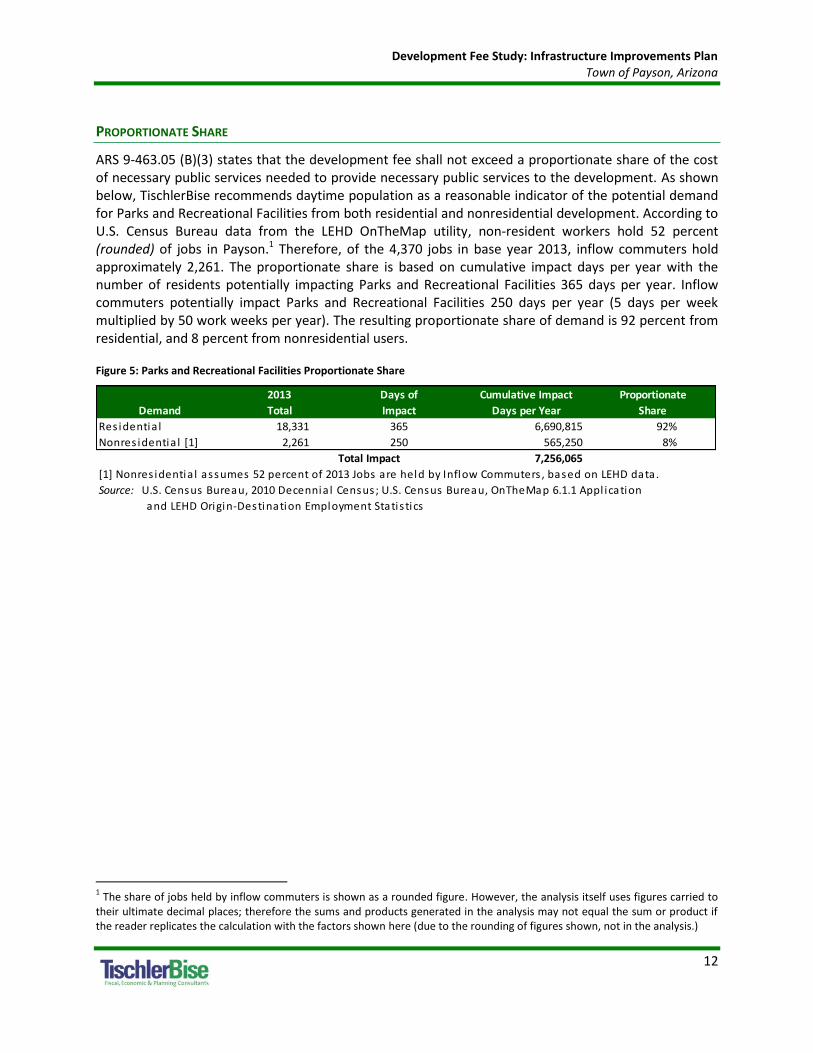
ARS 9-463.05 (B)(3) states that the development fee shall not exceed a proportionate share of the cost of necessary public services needed to provide necessary public services to the development. As shown below, TischlerBise recommends daytime population as a reasonable indicator of the potential demand for Parks and Recreational Facilities from both residential and nonresidential development. According to U.S. Census Bureau data from the LEHD OnTheMap utility, non-resident workers hold 52 percent (rounded) of jobs in Payson.1 Therefore, of the 4,370 jobs in base year 2013, inflow commuters hold approximately 2,261. The proportionate share is based on cumulative impact days per year with the number of residents potentially impacting Parks and Recreational Facilities 365 days per year. Inflow commuters potentially impact Parks and Recreational Facilities 250 days per year (5 days per week multiplied by 50 work weeks per year). The resulting proportionate share of demand is 92 percent from residential, and 8 percent from nonresidential users.
Figure 5: Parks and Recreational Facilities Proportionate Share
1 The share of jobs held by inflow commuters is shown as a rounded figure. However, the analysis itself uses figures carried to
their ultimate decimal places; therefore the sums and products generated in the analysis may not equal the sum or product if the reader replicates the calculation with the factors shown here (due to the rounding of figures shown, not in the analysis.)
2013 Days of Cumulative Impact Proportionate
Demand Total Impact Days per Year Share
Res identia l 18,331 365 6,690,815 92%
Nonres identia l [1] 2,261 250 565,250 8%
Total Impact 7,256,065
[1] Nonres identia l assumes 52 percent of 2013 Jobs are held by Inflow Commuters , based on LEHD data.
Source: U.S. Census Bureau, 2010 Decennia l Census; U.S. Census Bureau, OnTheMap 6.1.1 Appl ication
and LEHD Origin-Destination Employment Statis tics

Development Fee Study: Infrastructure Improvements Plan Town of Payson, Arizona
13
IIP FOR PARKS AND RECREATIONAL FACILITIES
For each necessary public service that is the subject of a development fee, ARS 9-463.05(E) requires the IIP to include seven elements. The sections below detail each of the required components of the Parks and Recreational Facilities IIP. (A forecast of new revenues generated by sources other than development fees can be found in Appendix B – Forecast of Revenues Other Than Development Fees.)
ANALYSIS OF CAPACITY, USAGE, AND COSTS OF EXISTING PUBLIC SERVICES
ARS 9-463.05(E)(1) requires:
“A description of the existing necessary public services in the service area and the costs to upgrade, update, improve, expand, correct or replace those necessary public services to meet existing needs and usage and stricter safety, efficiency, environmental or regulatory standards, which shall be prepared by qualified professionals licensed in this state, as applicable.”
ARS 9-463.05(E)(2) requires:
“An analysis of the total capacity, the level of current usage and commitments for usage of capacity of the existing necessary public services, which shall be prepared by qualified professionals licensed in this state, as applicable.”
The necessary public services included in the Parks and Recreational Facilities IIP are park improvements, multi-use trails, a parks and recreation master plan, and a multi-use trails master plan.
The Town maintains 24 acres of undeveloped parkland, and has no active plans to purchase additional acres for parkland. At present, there are 89 acres of developed parkland maintained by the Town. The Town prefers to negotiate with developers to provide future developed parkland for the direct benefit of new development. For these reasons, this Parks and Recreational Facilities IIP does not include a component for parkland.

Development Fee Study: Infrastructure Improvements Plan Town of Payson, Arizona
14
Park Improvements
The Town of Payson plans to maintain the level of service (LOS) for Park improvements that it provides to existing development. Thus, the incremental expansion methodology is used to calculate this component of the Parks and Recreational Facilities IIP and development fees. The Town currently has approximately 71.89 park improvements on the developed parkland within Town. Park improvements provided by the Town include amenities for passive and active recreation, picnic accommodations, and restrooms.
Based on the proportionate share analysis discussed above, residential development creates 92 percent of the demand for parks improvements, with nonresidential development accounting for 8 percent. Based 92 percent of the demand on an inventory of 71.89 units and a base year population of 18,331, the current LOS for Park improvements is calculated as follows: (71.89 units X 92 percent proportionate share)/(18,331 persons/1,000) = 3.6 improvements per 1,000 persons (rounded).
The cost per service unit is the product of LOS and the average cost per unit of Park improvements. The cost per service unit for residential development is calculated as follows: 3.6 LOS/1,000 X $81,670 average cost per improvement = $294.68 per capita. These calculations are repeated for nonresidential development resulting in an LOS of 1.3 per 1,000 jobs and a cost per job of $107.49.
Figure 6: Incremental Expansion – Park Improvements
Total Cost per Total
Park Improvements Units Unit Value
Ramadas 10.00 $43,030 $430,300
Park Benches 17.00 $1,000 $17,000
Horseshoe Pi ts 4.00 $9,000 $36,000
Playgrounds 2.00 $180,000 $360,000
Bal l Fields (Natura l Turf) 2.00 $129,000 $258,000
Bal l Fields (Arti ficia l Turf) 3.00 $350,000 $1,050,000
Athletic Fields (Lighting) 5.00 $250,000 $1,250,000
Tennis Courts 4.00 $112,000 $448,000
Basketbal l Courts 2.00 $40,000 $80,000
Vol leybal l Courts 2.00 $8,000 $16,000
Soccer Fields 2.00 $58,500 $117,000
Restrooms/Concess ion 2.00 $349,076 $698,152
Pool 1.00 $624,000 $624,000
Boating Access 1.00 $78,631 $78,631
Paved Parking (Acres) 6.89 $25,297 $174,347
Bleachers 8.00 $29,250 $234,000
TOTAL 71.89 $81,670 $5,871,430
Source: Town of Payson: Parks, Recreation, and Tourism Department
Proportionate Developed Acres Cost per
Land Use Share per 1,000 Service Units Service Unit
Res identia l 92% 18,331 Population 3.6 $294.68
Nonres identia l 8% 4,370 Jobs 1.3 $107.49
2013
Service Units

Development Fee Study: Infrastructure Improvements Plan Town of Payson, Arizona
15
Multi-Use Trails
The Town of Payson currently maintains a network of multi-use trails in the service area. The Town plans to incrementally expand the network to exceed 40 miles. According to preliminary estimates provided by the Town, it will cost $1,275,000 to build over 33 miles of planned trails, at a per mile cost of $38,349. It is assumed the current inventory of 8.7 miles has a value of $333,636. The current inventory is sufficient to meet current demand, therefore the incremental expansion methodology is used to calculate this component of the Parks and Recreational Facilities IIP and development fees.
Based on an inventory of 8.7 miles and a base year population of 18,331, which generates 92 percent of the demand for multi-use trails, the current LOS for multi-use trails is 0.4 miles per 1,000 persons (rounded). The nonresidential proportionate share for multi-use trails is 8 percent, which equates to a level of service of 0.2 per 1,000 jobs (rounded). The cost per service unit is the product of LOS and the average cost per mile of trail. The cost per service unit for multi-use trails is calculated as follows: 0.4 miles per person/1,000 X $38,349 average cost per unit = $16.74 cost per person. This calculation is repeated using the LOS for nonresidential development and results in a cost per job of $6.11.
Figure 7: Incremental Expansion – Multi-Use Trails
Total Cost per Total
Faci l i ty Mi les Mi le Value
PATS Tra i ls 8.7 $38,349 $333,636
Source: Town of Payson, Parks Department
Proportionate Miles Cost per
Land Use Share per 1,000 Service Units Service Unit
Res identia l 92% 18,331 Population 0.4 $16.74
Nonres identia l 8% 4,370 Jobs 0.2 $6.11
Service Units
2013

Development Fee Study: Infrastructure Improvements Plan Town of Payson, Arizona
16
Parks and Recreation Master Plan
Identified in the Town of Payson General Plan Update 2014-2024 are a set of guidelines for Parks and Recreational Facilities. The Open Space, Parks, and Recreation Element chapter identifies the need to develop a system-wide parks and recreation master plan for the Town. Project number 0910-41 in the Town of Payson five-year Capital Improvement Plan is a parks and recreation master plan, with an estimated cost of $130,000, to be spent in fiscal years 2014 and 2015. Such a plan will inventory current parkland, park improvements, and recreational facilities, establish levels of service for each, and identify strategies to meet the goals set forth by the Town for parks and recreational facilities over the next ten years.
Figure 8 displays the estimated cost of the ten-year plan. Because the Plan will benefit existing and new development over the next decade, only the share of the project attributable to growth in population and jobs is used to calculate a cost per service unit. To calculate the growth share the projected change in population and jobs (6,061) between 2013 and 2024 was divided by the projected 2024 population and jobs (28,762) resulting in a growth share of 21 percent (rounded). To calculate the cost per service unit, 21 percent of the project cost is multiplied by the proportionate share factors, and then divided by the increase in service units (3,168 persons and 2,893 jobs), to determine a parks and recreation master plan cost per capita of $7.96 and cost per job of $0.76.
Figure 8: Plan Based - Parks and Recreation Master Plan
Population and Jobs
Growth Share 21%
Parks and Recreation Master Plan $130,000 $27,395
Proportionate Share 92% 8%
Consultant Fee $27,395 $25,203 $2,192
Service Unit Person Job
Increase in Service Units [1] 2013-2024 3,168 2,893
Cost per Service Unit $7.96 $0.76
[1] TischlerBise. (2013). Development Fee Land Use Assmuptions

Development Fee Study: Infrastructure Improvements Plan Town of Payson, Arizona
17
Multi-Use Trail Master Plan
In addition to a parks and recreation master plan, the Town has identified a need for a separate multi-use trail master plan to help prioritize the incremental expansion of the Payson Area Trails System. The Town estimates such a plan would cost $120,000 and would serve as a 10-year plan. Such a plan will inventory current trails, establish desired levels of service, and identify strategies to meet the goals set forth by the Town for trail development over the next ten years.
The figure below displays the estimated cost of the ten-year multi-use trail master plan, slated for commission in 2015. Because the Plan will benefit existing and new development over the next decade, only the share of the project attributable to growth in population and jobs is used to calculate a cost per service unit. To calculate the growth share the projected change in population and jobs (6,742) between 2013 and 2025 was divided by the projected 2025 population and jobs (29,443) resulting in a growth share of 23 percent (rounded). To calculate the cost per service unit, 23 percent of the project cost is multiplied by the proportionate share factors, and then divided by the increase in service (3,504 persons and 3,238 jobs), to determine a Multi-Use Trails Master Plan cost per capita of $7.21 and cost per job of $0.68.
Figure 9: Plan Based – Multi-Use Trails Master Plan
Excluded Costs
Development fees in Payson exclude costs to upgrade, update, improve, expand, correct or replace those necessary public services to meet existing needs and usage and stricter safety, efficiency, environmental or regulatory standards. The Town of Payson Capital Improvement Plan includes the cost of these excluded items.
Current Use and Available Capacity
The current Parks and Recreational Facilities discussed above are fully utilized and there is no available capacity for future development.
Population and Jobs
Growth Share 23%
Multi -Use Tra i ls Master Plan $120,000 $27,478
Proportionate Share 92% 8%
Consultant Fee $27,478 $25,280 $2,198
Service Unit Person Job
Increase in Service Units [1] 2013-2025 3,504 3,238
Cost per Service Unit $7.21 $0.68
[1] TischlerBise. (2013). Development Fee Land Use Assmuptions

Development Fee Study: Infrastructure Improvements Plan Town of Payson, Arizona
18
RATIO OF SERVICE UNIT TO DEVELOPMENT UNIT
ARS 9-463.05(E)(4) requires:
“A table establishing the specific level or quantity of use, consumption, generation or discharge of a service unit for each category of necessary public services or facility expansions and an equivalency or conversion table establishing the ratio of a service unit to various types of land uses, including residential, commercial and industrial.”
The following table displays the Persons per Household factors and Jobs per 1,000 Square Feet of Nonresidential Development factors used to establish a ratio of service unit to residential land uses. Nonresidential factors are from the reference book Trip Generation published by the Institute of Transportation Engineers (ITE 9th Edition 2012).
Figure 10: Parks and Recreational Facilities - Ratio of Service Unit to Development Unit
PROJECTED SERVICE UNITS AND FACILITIES DEMAND
ARS 9-463.05(E)(3) requires:
“A description of all or the parts of the necessary public services or facility expansions and their costs necessitated by and attributable to development in the service area based on the approved land use assumptions, including a forecast of the costs of infrastructure, improvements, real property, financing, engineering and architectural services, which shall be prepared by qualified professionals licensed in this state, as applicable.”
ARS 9-463.05(E)(5) requires:
“The total number of projected service units necessitated by and attributable to new development in the service area based on the approved land use assumptions and calculated pursuant to generally accepted engineering and planning criteria.”
Land UsePersons per
Household1
Single Unit 2.35
2+ Unit 1.77
1. Development Fee Land Use Assumptions
Land UseJobs per
1,000 Square Feet2
Commercia l 2.00
Office/Insti tutional 3.32
Industria l/Flex 2.31
2. Insti tute of Transportation Engineers . (2012).
Trip Generation Manual
Res identia l Development
Nonres identia l Development

Development Fee Study: Infrastructure Improvements Plan Town of Payson, Arizona
19
ARS 9-463.05(E)(6) requires:
“The projected demand for necessary public services or facility expansions required by new service units for a period not to exceed ten years.”
The Land Use Assumptions project an additional 2,555 persons, and 2,564 jobs over the next ten years. To calculate the capital improvements necessary to accommodate growth, the projected annual increase in service units is multiplied by the current levels of service for the incremental expansion of park improvements and multi-use trails (see Figure 11 below). Incremental demand generated by the increase in population and Jobs results in a cumulative demand for 13 additional units of Park improvements over the next ten years. At an average cost of $81,670 per unit, growth will generate the need for over $1 million in park improvements. This calculation is repeated for the incremental expansion of the PATS multi-use trails network, equating to a necessary investment of $76,698.
Figure 11: Projected Demand for Parks and Recreational Facilities
Park Improvements Multi-Use Trails
(units) (miles)
Per 1,000 Persons 3.6081 0.4366
Per 1,000 Jobs 1.3161 0.1593
Average Cost per Component $81,670 $38,349
Park Improvements Multi -Use Tra i l s
Persons Jobs (units ) (mi les )
Base 2013 18,331 4,370 72 9
1 2014 18,406 4,576 72 9
2 2015 18,441 4,791 73 9
3 2016 18,532 5,018 73 9
4 2017 18,681 5,254 74 9
5 2018 18,887 5,502 75 9
6 2019 19,154 5,762 77 9
7 2020 19,485 6,034 78 9
8 2021 19,883 6,321 80 10
9 2022 20,346 6,620 82 10
10 2023 20,886 6,934 84 10
Ten Yr Total 2,555 2,564 13 2
Cost of Park Improvements $1,061,710
Cost of Multi -Use Tra i l s $76,698
Projected Service Units
Service Unit
Res LOS
Nonres LOS
Projected Demand (Rounded)

Development Fee Study: Infrastructure Improvements Plan Town of Payson, Arizona
20
Parks and Recreational Facilities Improvements Plan
As shown below, the Payson Parks, Recreation, and Tourism Department’s improvements program includes projects that are eligible for Parks and Recreational Facilities development fee funding. These projects cost a total of $7,115,000 in current dollars. As discussed in the sections above, Parks and Recreational Facilities development fees will help fund projects from the itemized list below that become necessary to respond to demands generated by growth.
Figure 12: Necessary Parks and Recreational Facilities Expansions
Source: Town of Payson
MAXIMUM SUPPORTABLE PARKS AND RECREATIONAL FACILITIES DEVELOPMENT FEES
The proposed development fees for Parks and Recreational Facilities are shown in Figure 13 on the following page. The development fee is calculated by multiplying the number of persons per household by the net capital cost per person for residential development, and the number of jobs per square foot by the net capital cost per job for nonresidential development.
Parks and Recreational Facilities IIP and Development Fee Study
Included in the Parks and Recreational Facilities per service unit cost is the cost to prepare the Parks and Recreational Facilities IIP and Development Fee Study. See Appendix A – Cost of Professional Services for the detailed calculations.
Revenue Credit
Included in the maximum supportable Parks and Recreational Facilities development fees is a Revenue Credit of 14 percent. The unadjusted Parks and Recreational Facilities development fees per development unit would generate more revenue over the next ten years, based on the approved APPENDIX C – Land Use Assumptions, than the identified growth-related necessary expenditures of $1,200,861 (necessary public services plus the IIP and Development Fee Study cost). To ensure that no more fee revenue is collected than the Town plans to spend, the potential gross cost per service unit is reduced by the revenue credit to calculate the net capital cost per service unit. Based on the gross capital costs per service unit, the projected development fee revenue would equal $1,387,208, which exceeds necessary expenditures by $186,347. The formula to calculate the Revenue Credit is as follows: ($1,387,208 – $1,200,861)/$1,387,208 = 14 percent (rounded).
Parks and Recreation
Infrastructure Improvements Plans
Improvements 10-Year
Projects Plan
Incremental Expans ion of Park Improvements
Kiwanis Bal l Field Lighting $500,000
Event Center Improvements $4,020,000
Green Val ley Ramadas $75,000
Rumsey Park Pedestrian Circulation $400,000
Rumsey Park Restrooms $145,000
Rumsey Park Playground & Ropes Course $150,000
Rumsey Park Ramadas $150,000
Amphitheater Lighting $150,000
Incremental Expans ion of Multi -Use Tra i l s (PATS Continuation) $1,275,000
Parks Master Plan $130,000
Multi -Use Tra i l s Master Plan $120,000
TOTAL $7,115,000

Development Fee Study: Infrastructure Improvements Plan Town of Payson, Arizona
21
Figure 13: Maximum Supportable Parks and Recreational Facilities Development Fees
Parks and Recreational Facilities Capital Costs Per Person
Park Improvements $294.68
Multi -Use Tra i l s $16.74
Parks and Recreation Master Plan $7.96
Multi -Use Tra i l s Master Plan $7.21
IIP and Development Fee Study $6.27
GROSS CAPITAL COST $332.86
Revenue Credit 14% ($46.60)
NET CAPITAL COST $286.26
Parks and Recreational Facilities Development Fee Schedule Development Fee per Housing Unit
2+ Unit Al l Sizes 1.77 $507 $1,000 ($493)
Single Unit 0-3 2.07 $593 $1,000 ($407)
Single Unit 4+ 3.26 $933 $1,000 ($67)
Single Unit Avg 2.35 $673 $1,000 ($327)
PUMA 0800 match the average va lue for Payson, derived from 2011 American Community Survey data, with
persons adjusted to the Townwide average of 2.35 persons per s ingle fami ly household.
[2] Town of Payson. (2007). Ordinance No. 710.
Parks and Recreational Facilities Capital Costs Per Job
Park Improvements $107.49
Multi -Use Tra i l s $6.11
Parks and Recreation Master Plan $0.76
Multi -Use Tra i l s Master Plan $0.68
IIP and Development Fee Study $0.27
GROSS CAPITAL COST $115.31
Revenue Credit 14% ($16.14)
NET CAPITAL COST $99.16
Parks and Recreational Facilities Development Fee Schedule Development Fee per Square Foot of Floor Area
(per 1,000 SF)
2.00 $0.20 $0.00 $0.20
3.32 $0.33 $0.00 $0.33
2.31 $0.23 $0.00 $0.23
[4] Town of Payson does not currently assess Parks and Recreational Faci l i ties
development fees on nonres identia l development.
Unit Type
Number of
Bedrooms
Persons per
Household [1] Proposed Fee Current Fee [2]
Increase
(Decrease)
[3] Insti tute of Transportation Engineers . (2012). Trip Generation Manual 9th Edition.
[1] Persons per Household recommended multipl iers are sca led to make the average va lue by type of hous ing
Nonresidential Land Use Jobs [3] Proposed Fee Current Fee [4]
Increase
(Decrease)
(Per Square Foot of Floor Area)
Commercia l
Office/Insti tutional
Industria l/Flex
Development Fee Study: Infrastructure Improvements Plan Town of Payson, Arizona
22
FORECAST OF REVENUES
Appendix B – Forecast of Revenues Other Than Development Fees contains a forecast of revenues other than development fees required by Arizona’s enabling legislation.
Parks and Recreational Facilities Cash Flow
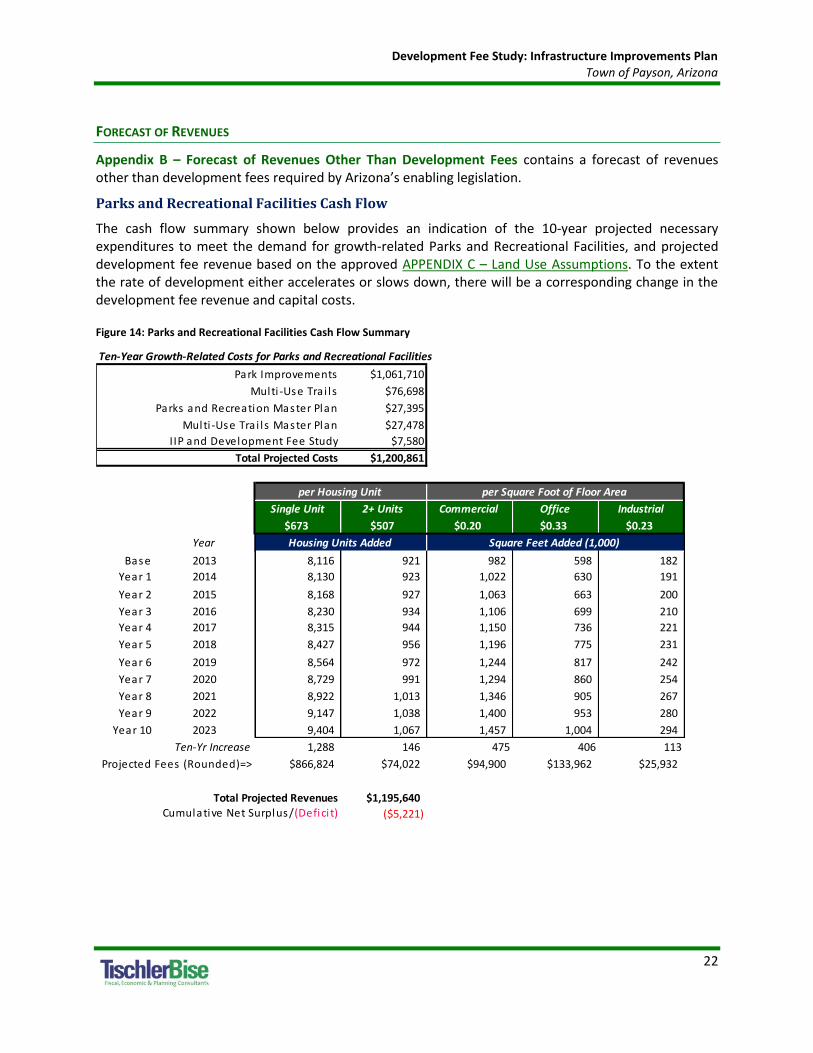
The cash flow summary shown below provides an indication of the 10-year projected necessary expenditures to meet the demand for growth-related Parks and Recreational Facilities, and projected development fee revenue based on the approved APPENDIX C – Land Use Assumptions. To the extent the rate of development either accelerates or slows down, there will be a corresponding change in the development fee revenue and capital costs.
Figure 14: Parks and Recreational Facilities Cash Flow Summary
Ten-Year Growth-Related Costs for Parks and Recreational Facilities
Park Improvements $1,061,710
Multi -Use Tra i l s $76,698
Parks and Recreation Master Plan $27,395
Multi -Use Tra i l s Master Plan $27,478
IIP and Development Fee Study $7,580
Total Projected Costs $1,200,861
Single Unit 2+ Units Commercial Office Industrial
$673 $507 $0.20 $0.33 $0.23
Year
Base 2013 8,116 921 982 598 182
Year 1 2014 8,130 923 1,022 630 191
Year 2 2015 8,168 927 1,063 663 200
Year 3 2016 8,230 934 1,106 699 210
Year 4 2017 8,315 944 1,150 736 221
Year 5 2018 8,427 956 1,196 775 231
Year 6 2019 8,564 972 1,244 817 242
Year 7 2020 8,729 991 1,294 860 254
Year 8 2021 8,922 1,013 1,346 905 267
Year 9 2022 9,147 1,038 1,400 953 280
Year 10 2023 9,404 1,067 1,457 1,004 294
Ten-Yr Increase 1,288 146 475 406 113
Projected Fees (Rounded)=> $866,824 $74,022 $94,900 $133,962 $25,932
Total Projected Revenues $1,195,640Cumulative Net Surplus/(Defici t) ($5,221)
per Housing Unit per Square Foot of Floor Area
Housing Units Added Square Feet Added (1,000)

Development Fee Study: Infrastructure Improvements Plan Town of Payson, Arizona
23
FIRE FACILITIES INFRASTRUCTURE IMPROVEMENTS PLAN
OVERVIEW
ARS 9-463.05 (T)(7)(f) defines the facilities and assets that can be included in a Public Safety Facilities IIP:
“Fire and police facilities, including all appurtenances, equipment and vehicles. Fire and police facilities do not include a facility or portion of a facility that is used to replace services that were once provided elsewhere in the municipality, vehicles and equipment used to provide administrative services, helicopters or airplanes or a facility that is used for training police and firefighters from more than one station or substation.”
The Fire Facilities IIP includes components for vehicles, communications equipment, communications infrastructure, and the cost of preparing the Fire Facilities IIP and development fees. Cost recovery is used to calculate the IIP for the Fire facilities. Incremental expansion is used to calculate the cost per service unit for the communications equipment and communications infrastructure elements of the Fire Facilities IIP.
SERVICE AREA
The Town of Payson Fire Department provides a uniform level of service to the entire Town. Therefore, the service area for the Fire Facilities IIP is Townwide.

Development Fee Study: Infrastructure Improvements Plan Town of Payson, Arizona
24
PROPORTIONATE SHARE
ARS 9-463.05 (B)(3) states that the development fee shall not exceed a proportionate share of the cost of necessary public services needed to accommodate new development. The Fire Facilities IIP uses a proportionate share concept to allocate the demand between residential and nonresidential development. The demand for Fire Facilities in the Town of Payson is measured by annual calls for service. Calls for service data from 2012 were used to determine the relative demand for service from residential and nonresidential development.
Service units
The Fire Facilities costs are allocated to both residential and nonresidential development based on an analysis of incident by land use data (calls for service). For residential development, fees are calculated on a per capita basis, and then converted to an appropriate amount by type of housing unit, based on Persons per Household factors.
For nonresidential development fees, TischlerBise recommends using Nonresidential Vehicle Trips as the demand indicator for Fire Facilities. Trip generation rates are used for nonresidential development because vehicle trips are highest for commercial developments, such as shopping centers, and lowest for industrial/flex development. Office and institutional trip rates fall between the other two categories. Because the Payson Fire Department responds to emergency medical service calls for service this ranking of trip rates is consistent with the relative demand for Fire services from nonresidential development.
Other possible nonresidential demand indicators, such as employment or floor area, would not accurately reflect the demand for service. For example, if employees per thousand square feet were used as the demand indicator, Fire development fees would be too high for office and institutional development because offices typically have more employees per 1,000 square feet than retail uses. If floor area were used as the demand indicator, Fire development fees would be too high for industrial development. More information regarding the calculation of nonresidential vehicle trips can be found in Figure 20: Fire Facilities - Ratio of Service Unit to Land Use.
Vehicle trips are estimated using average weekday vehicle trips ends from the reference book Trip Generation published by the Institute of Transportation Engineers (ITE 9th Edition 2012). A vehicle trip end represents a vehicle either entering or exiting a development (as if a traffic counter were placed across a driveway).
Trip generation rates are adjusted to avoid double counting each trip at both the origin and destination points. Therefore, the basic trip adjustment factor of 50 percent is applied to the office/institutional, and industrial/flex categories. The commercial/retail category has a trip factor of less than 50 percent because this type of development attracts vehicles as they pass-by on arterial and collector roads. For example, when someone stops at a convenience store on the way home from work, the convenience store is not the primary destination. For the average shopping center, the ITE data indicates that 34 percent of the vehicles that enter are passing by on their way to some other primary destination. The remaining 66 percent of attraction trips have the commercial site as their primary destination. Because attraction trips are half of all trips, the trip adjustment factor of 66 percent is multiplied by 50 percent to calculate a trip adjustment factor for commercial land use of 33 percent.

Development Fee Study: Infrastructure Improvements Plan Town of Payson, Arizona
25
Fire Calls for Service
Calls for service (CFS) data from 2012 were used to determine the relative demand for service from residential and nonresidential development. The Town of Payson Fire Department tracks calls for service by land use. In 2012, the Fire Department responded to 2,489 CFS within the Town, of which 2,338 calls were recorded as generated from a residential land use (1,842 CFS) or a nonresidential land use (496 CFS). This equates to a 79 percent residential and 21 percent nonresidential proportionate share distribution. Shown in Figure 15 are the calendar year 2012 calls for service received by the Payson Fire Department, and filtered by land use within the Town of Payson.
Road related calls, open land fires and other unassigned calls are omitted from proportionate share calculations because they cannot be allocated to residential or nonresidential development. This should not be interpreted as implying that these types of calls for service have no impact on the Fire Department.
Figure 15: Fire Proportionate Share
Service Area Inventory Adjustment
In addition to calls for service within the Town of Payson, the Payson Fire department responded to 191 CFS outside the Town limits, including to the Tonto Apache Reservation. Due to 7 percent of the demand for Fire Facilities being generated outside the service area established for the Fire Facilities IIP and development fees, the inventory and value of each Fire Facilities component must be adjusted to account for the 93 percent of demand generated for Fire Facilities from within the service area.
Share of
2012 Demand
Total Calls for Service (Calendar Year) 2,680
Total Calls for Service Outside Town 191 7%
Total Calls for Service In Town 2,489 93%
Total Calls for Service In Town by Land Use 2,338
Source: Town of Payson Fire Department
Proportionate Cal ls for CFS per
Land Use Share Service (CFS) Service Unit
Res identia l 79% 1,842 18,331 Population 0.10
Nonres identia l 21% 496 17,768 Nonres Vehicles Trips 0.03
Service Units
2013

Development Fee Study: Infrastructure Improvements Plan Town of Payson, Arizona
26
Public Safety Communications Command Center The Town of Payson Public Safety Communications Command Center dispatches calls for service for the Payson Fire and Police Departments, as well as for eight surrounding agencies. In order to calculate the portion of the shared center facilities that is attributable to demand for Payson Fire Department service, proportionate shares must be calculated from the total calls for service received by the shared center.
Of the 23,292 calls for service received in calendar year 2012, 11 percent (2,680) were for the Payson Fire Department.2 This proportionate share represents the demand the Payson Fire Department puts on the Public Safety Communications Command Center for square footage of space and units of equipment and infrastructure.
Figure 16: Public Safety Communications Infrastructure Proportionate Share
IIP FOR FIRE FACILITIES
For each necessary public service that is the subject of a development fee, ARS 9-463.05(E) requires that the IIP include seven elements. The sections below detail each of the required components of the Fire Facilities IIP. (A forecast of new revenues generated by sources other than development fees can be found in Appendix B – Forecast of Revenues Other Than Development Fees.)
ANALYSIS OF CAPACITY, USAGE, AND COSTS OF EXISTING PUBLIC SERVICES
ARS 9-463.05(E)(1) requires:
“A description of the existing necessary public services in the service area and the costs to upgrade, update, improve, expand, correct or replace those necessary public services to meet existing needs and usage and stricter safety, efficiency, environmental or regulatory standards, which shall be prepared by qualified professionals licensed in this state, as applicable.”
ARS 9-463.05(E)(2) requires:
“An analysis of the total capacity, the level of current usage and commitments for usage of capacity of the existing necessary public services, which shall be prepared by qualified professionals licensed in this state, as applicable.”
2 Total calls for service for the Payson Fire Department include miscellaneous calls that cannot be assigned to either a
residential or nonresidential land use and calls for service outside the municipal boundary of Payson.
Calendar Year 2012 Proportionate
Agency Cal ls for Service Share
Payson Fire 2,680 11%
Payson Pol ice 20,030 86%
Other 582 3%
TOTAL 23,292 100%
Source: Town of Payson, Police Department

Development Fee Study: Infrastructure Improvements Plan Town of Payson, Arizona
27
Fire Vehicles
The Town plans to maintain the level of service for the Fire vehicles fleet it currently provides to existing development. Thus, the incremental expansion methodology is used to calculate this component of the Fire Facilities IIP. The Town of Payson Fire Department has a 15-unit fleet. Based on the 93 percent service area adjustment calculated to reflect the portion of Fire Facilities demand generated from within the service area, the service area generates demand for 13.95 units.
Based on the proportionate share analysis, residential development creates 79 percent of the demand for Fire service, with nonresidential development accounting for 21 percent. The current LOS for residential development is calculated as follows: ((13.95 adjusted total X 79 percent proportionate share)/(18,331 persons/1,000) = 0.60 units per 1,000 persons (rounded). This calculation is repeated for nonresidential development resulting in a LOS of 0.16 units per 1,000 nonresidential vehicle trips (rounded).
The cost per service unit is the product of units per service unit and the average cost per unit. The cost per service unit for residential development is calculated as follows: 0.0006 units per capita X $317,667 average cost per unit = $190.98 per capita. This calculation is repeated for nonresidential development resulting in a cost per nonresidential vehicle trip of $52.37.
Figure 17: Incremental Expansion – Fire Vehicles
Vehicles and Total
Apparatus Units in Service Unit Price Value
Type 1 Engine 4 $500,000 $2,000,000
Type 6 Engine 2 $100,000 $200,000
Type 2 Water Tender 2 $300,000 $600,000
Type 1 Ladder Truck 1 $1,200,000 $1,200,000
Uti l i ty Truck 1 $300,000 $300,000
Rehab Unit 1 $100,000 $100,000
Command Vehicles 3 $55,000 $165,000
Ambulance 1 $200,000 $200,000
TOTAL 15 $317,667 $4,765,000
Service Area Adjustment 93% 93%
ADJUSTED TOTAL 13.95 $317,667 $4,431,450
Source: Town of Payson Fire Department
Proportionate Vehicles Cost per
Land Use Share per 1,000 Service Units Service Unit
Res identia l 79% 18,331 Population 0.60 $190.98
Nonres identia l 21% 17,768 Nonres Vehicle Trips 0.16 $52.37
2013
Service Units

Development Fee Study: Infrastructure Improvements Plan Town of Payson, Arizona
28
Fire Communications Equipment
The Town plans to maintain the level of service for Fire communications equipment it currently provides to existing development. Thus, the incremental expansion methodology is used to calculate this component of the Fire Facilities IIP. The Town of Payson Fire Department makes use of 50 portable components of communications equipment. Based on the 93 percent service area adjustment calculated to reflect the portion of Fire Facilities demand generated from within the service area, the service area generates demand for 46.5 units.
Based on the proportionate share analysis, residential development creates 79 percent of the demand for Fire service, with nonresidential development accounting for 21 percent. The current LOS for residential development is calculated as follows: ((46.5 adjusted total X 79 percent proportionate share)/(18,331 persons/1,000) = 2.00 pieces of equipment per 1,000 persons. This calculation is repeated for nonresidential development resulting in a LOS of 0.55 pieces of equipment per 1,000 nonresidential vehicle trips.
The cost per service unit is the product of units per service unit and the average cost per unit. The cost per service unit for residential development is calculated as follows: 0.002 units per capita X $1,238 average cost per unit = $2.48 per capita. This calculation is repeated for nonresidential development resulting in a cost per nonresidential vehicle trip of $0.68.
Figure 18: Incremental Expansion – Fire Communications Equipment
Fire Communications Infrastructure
The Town of Payson Public Safety Communications Command Center dispatches calls for service for the Payson Fire and Police Departments, as well as for eight surrounding agencies. The entire infrastructure for the Public Safety Communications Command Center includes communications towers, telecommunications system technology, and computer hardware and software. The complete infrastructure inventory supports the operation of three public safety dispatch consoles. The entire communications infrastructure has a value of $1.2 million. This equates to a per dispatch console value of $413,515.
Total Cost per Total
Equipment Units Unit Value
Portable Radios 25 $1,000 $25,000
Mobi le Radios 22 $1,200 $26,400
Repeaters 3 $3,500 $10,500
TOTAL 50 $1,238 $61,900
Service Area Adjustment 93% 93%
ADJUSTED TOTAL 46.5 $1,238 $57,567
Source: Town of Payson Fire Department
Proportionate Units per 1,000 Cost per
Land Use Share Service Units Service Unit
Res identia l 79% 18,331 Population 2.00 $2.48
Nonres identia l 21% 17,768 Nonres Vehicle Trips 0.55 $0.68
2013
Service Units

Development Fee Study: Infrastructure Improvements Plan Town of Payson, Arizona
29
Based on the Public Safety Communications Command Center proportionate shares calculated above, the Payson Fire Department generates 11 percent of the demand on the entire system, which is equivalent to using 0.33 units of the three dispatch consoles currently in operation. Once the service area adjustment of 93 percent is applied, the share of units allocated to serve demand for Fire communications infrastructure generated within the service area is adjusted to 0.307 units.
As development occurs, the shared center will expand in order to maintain the current level of service. The LOS for the Fire portion of the communications infrastructure is a measure of units per service unit. The LOS for residential development is calculated as follows: (0.307 adjusted unit count X 79 percent residential proportionate share)/(18,331 persons/1,000) = 0.013 units per 1,000 residents. This calculation is repeated for nonresidential development using the nonresidential vehicle trips in 2013. The results are shown in Figure 19.
The cost per service unit for residential development is calculated as follows: (0.013/1,000 residential level of service X $413,515 cost per unit = $5.46 per capita. This calculation is repeated for nonresidential development using the nonresidential vehicle trips.
Figure 19: Incremental Expansion – Fire Communications Infrastructure
Excluded Costs
Development fees in Payson exclude costs to upgrade, update, improve, expand, correct or replace those necessary public services to meet existing needs and usage and stricter safety, efficiency, environmental or regulatory standards. The Town of Payson Capital Improvement Plan includes the cost of these excluded items.
Current Use and Available Capacity
The current Fire Facilities discussed above are fully utilized and there is no available capacity for future development.
Communications Units in Cost per Total
Infrastructure Service Unit Value
Dispatch Consoles 3 $413,515 $1,240,545
Payson Fire Department Share 0.330 $136,460
Service Area Adjustment 93%
ADJUSTED TOTAL 0.307
Source: Town of Payson, Police Department
Proportionate Units per 1,000 Cost per
Land Use Share Service Units Service Unit
Res identia l 79% 18,331 Population 0.013 $5.46
Nonres identia l 21% 17,768 Nonres Vehicle Trips 0.004 $1.49
2013
Service Units

Development Fee Study: Infrastructure Improvements Plan Town of Payson, Arizona
30
RATIO OF SERVICE UNIT TO DEVELOPMENT UNIT
ARS 9-463.05(E)(4) requires:
“A table establishing the specific level or quantity of use, consumption, generation or discharge of a service unit for each category of necessary public services or facility expansions and an equivalency or conversion table establishing the ratio of a service unit to various types of land uses, including residential, commercial and industrial.”
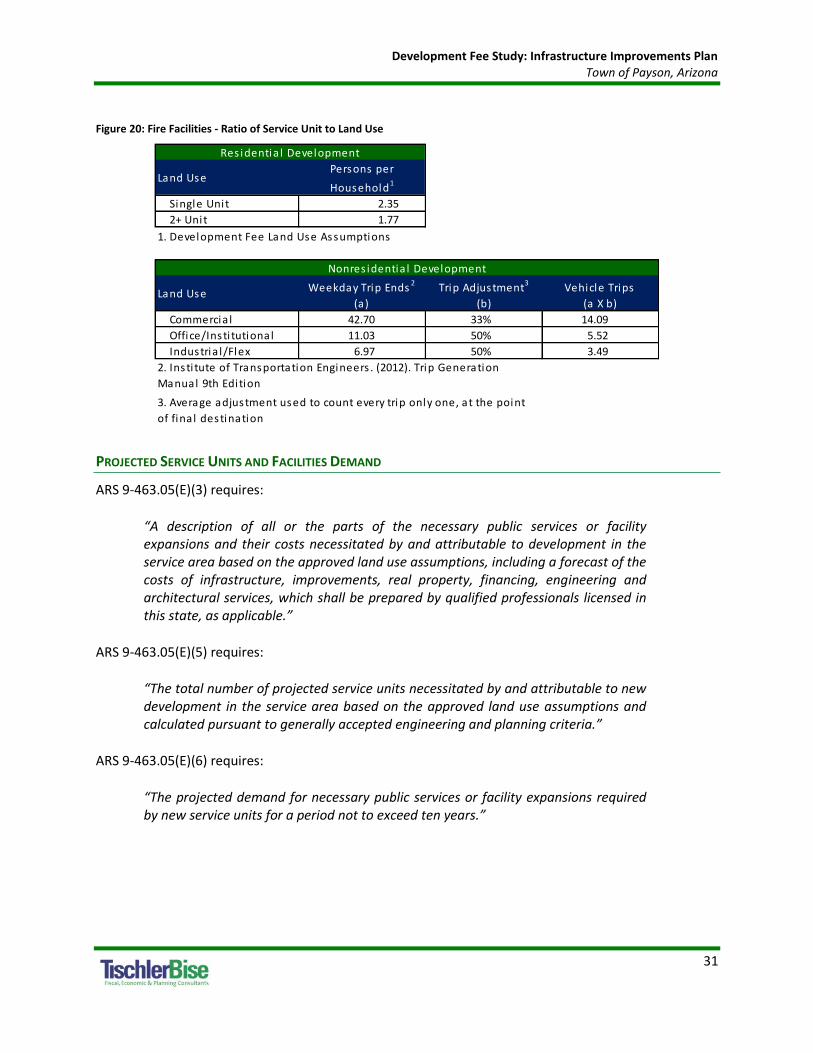
Shown in the table below are the ratios of a service unit (i.e., persons and nonresidential vehicle trips) to various types of land uses for residential and nonresidential development. The residential development table displays the Persons per Household factors for single family and multifamily homes.
For nonresidential development, average daily vehicle trips are used for the Fire Facilities IIP as a measure of demand by land use. TischlerBise recommends using Nonresidential Vehicle Trips as the best demand indicator for Fire Facilities. Trip generation rates are used for nonresidential development because vehicle trips are highest for commercial developments, such as shopping centers, and lowest for industrial/flex development. Office and institutional trip rates fall between the other two categories. Because the Payson Fire Department responds to emergency medical services calls for service this ranking of trip rates is consistent with the relative demand for Fire services from nonresidential development.
Other possible nonresidential demand indicators, such as employment or floor area, would not accurately reflect the demand for service. For example, if employees per thousand square feet were used as the demand indicator, Fire development fees would be too high for office and institutional development because offices typically have more employees per 1,000 square feet than retail uses. If floor area were used as the demand indicator Fire development fees would be too high for industrial development.
Vehicle trips are estimated using average weekday vehicle trips ends from the reference book Trip Generation published by the Institute of Transportation Engineers (ITE 9th Edition 2012). A vehicle trip end represents a vehicle either entering or exiting a development (as if a traffic counter were placed across a driveway).
Trip generation rates are adjusted to avoid double counting each trip at both the origin and destination points. Therefore, the basic trip adjustment factor of 50 percent is applied to the office/institutional, and industrial/flex categories. The commercial/retail category has a trip factor of less than 50 percent because this type of development attracts vehicles as they pass-by on arterial and collector roads. For example, when someone stops at a convenience store on the way home from work, the convenience store is not the primary destination. For the average shopping center, the ITE data indicate that 34 percent of the vehicles that enter are passing-by on their way to some other primary destination. The remaining 66 percent of attraction trips have the commercial site as their primary destination. Because attraction trips are half of all trips, the trip adjustment factor of 66 percent is multiplied by 50 percent to calculate a trip adjustment factor for commercial land use of 33 percent.
Development Fee Study: Infrastructure Improvements Plan Town of Payson, Arizona
31
Figure 20: Fire Facilities - Ratio of Service Unit to Land Use
PROJECTED SERVICE UNITS AND FACILITIES DEMAND
ARS 9-463.05(E)(3) requires:
“A description of all or the parts of the necessary public services or facility expansions and their costs necessitated by and attributable to development in the service area based on the approved land use assumptions, including a forecast of the costs of infrastructure, improvements, real property, financing, engineering and architectural services, which shall be prepared by qualified professionals licensed in this state, as applicable.”
ARS 9-463.05(E)(5) requires:
“The total number of projected service units necessitated by and attributable to new development in the service area based on the approved land use assumptions and calculated pursuant to generally accepted engineering and planning criteria.”
ARS 9-463.05(E)(6) requires:
“The projected demand for necessary public services or facility expansions required by new service units for a period not to exceed ten years.”
Land UsePersons per
Household1
Single Unit 2.35
2+ Unit 1.77
1. Development Fee Land Use Assumptions
Land UseWeekday Trip Ends 2
(a)
Trip Adjustment3
(b)
Vehicle Trips
(a X b)
Commercia l 42.70 33% 14.09
Office/Insti tutional 11.03 50% 5.52
Industria l/Flex 6.97 50% 3.49
2. Insti tute of Transportation Engineers . (2012). Trip Generation
Manual 9th Edition
3. Average adjustment used to count every trip only one, at the point
of fina l destination
Res identia l Development
Nonres identia l Development

Development Fee Study: Infrastructure Improvements Plan Town of Payson, Arizona
32
TischlerBise projects an additional 2,555 persons and 9,318 nonresidential vehicle trips over the next ten years. As shown Figure 21, and based on current level of service new development in the service area will generate demand for an additional three vehicles, ten units of communication equipment, and a small fraction of the shared communications infrastructure. The ten-year totals of the projected demand for each existing public service category are multiplied by their respective average unit cost to determine the total investment needed for each to accommodate the projected demand. For example, ten additional communications equipment components each with an average cost of $1,238 will require an investment of $12,380 by the Payson Fire Department.
Figure 21: Projected Demand for Fire Facilities
Vehicles Comm. Equip. Comm. Infrastructure
(units) (units) (units)
Unit Per 1,000 Persons 0.601 2.004 0.013
Unit Per 1,000 Trips 0.165 0.550 0.004
Average Cost per Component $317,667 $1,238 $413,515
Vehicles Comm. Equip. Comm. Infrastructure
Persons Nonres. Vehicle Trips (units) (units) (units)
Base 2013 18,331 17,768 14 47 0.3
1 2014 18,406 18,533 14 47 0.3
2 2015 18,441 19,328 14 48 0.3
3 2016 18,532 20,164 14 48 0.3
4 2017 18,681 21,032 15 49 0.3
5 2018 18,887 21,932 15 50 0.3
6 2019 19,154 22,877 15 51 0.3
7 2020 19,485 23,863 16 52 0.3
8 2021 19,883 24,888 16 54 0.4
9 2022 20,346 25,961 17 55 0.4
10 2023 20,886 27,086 17 57 0.4
Ten Yr Total 2,555 9,318 3 10 0.1
Cost of Vehicles $953,001
Cost of Communications Equipment $12,380
Cost of Communications Infrastructure $27,950
Projected Service Units
Service Unit
Res LOS
Nonres LOS
Projected Demand (Rounded)

Development Fee Study: Infrastructure Improvements Plan Town of Payson, Arizona
33
Fire Facilities Improvements Plan
The Fire Facilities improvements and expansions necessary to incrementally meet demand from new development are listed below. Included in the list below is the necessary investment of $18,920 in a dispatch console. This amount represents the Fire Department’s 11 percent proportionate share of a Town-identified investment in dispatch console expansion expected to cost $172,000.
Figure 22: Necessary Fire Facilities Expansions
Source: Town of Payson; TischlerBise
MAXIMUM SUPPORTABLE FIRE FACILITIES DEVELOPMENT FEES
The proposed development fees for Fire Facilities are shown in Figure 23 on the following page.
Fire Facilities IIP and Development Fee Study
Included in the Fire Facilities per service unit cost is the cost to prepare the Fire Facilities IIP and Development Fee Study. See Appendix A – Cost of Professional Services for the detailed calculations.
Revenue Credit
Included in the maximum supportable development fees is a Revenue Credit of 16 percent. The unadjusted Fire Facilities development fees per development unit would generate more revenue over the next ten years, based on the approved APPENDIX C – Land Use Assumptions, than the identified growth-related necessary expenditures of $997,121 (necessary public services plus the cost for the IIP and Development Fee Study). To ensure that no more fee revenue is collected than the Town plans to spend, the potential gross cost per service unit is reduced by the revenue credit to calculate the net capital cost per service unit. Based on the gross capital costs per service unit, the projected development fee revenue would equal $1,179,517. The formula to calculate the Revenue Credit is as follows: ($1,179,517 – $997,121)/$1,179,517 = 16 percent (rounded).
Infrastructure Improvements Plans
Improvements 10-Year
Projects Plan
Incremental Expans ion of Vehicles $953,001
Incremental Expans ion of Communications Equipment $12,380
Communications Infrastructure
Dispatch Console $18,920
Incremental Expans ion of Comm. Infrastructure $9,030
TOTAL $993,331

Development Fee Study: Infrastructure Improvements Plan Town of Payson, Arizona
34
Figure 23: Maximum Supportable Fire Facilities Development Fees
Fire Residential Capital Costs Per Person
Fire Vehicles $190.98
Fire Communications Equipment $2.48
Fire Communications Infrastructure $5.46
IIP and Development Fee Study $5.39
GROSS CAPITAL COST $204.31
Revenue Credit 16% ($31.67)
NET CAPITAL COST $172.64
Fire Development Fee Schedule Development Fee per Housing Unit
2+ Unit Al l Sizes 1.77 $305 $250 $55
Single Unit 0-3 2.07 $357 $250 $107
Single Unit 4+ 3.26 $563 $250 $313
Single Unit Avg 2.35 $406 $250 $156
PUMA 0800 match the average va lue for Payson, derived from 2011 American Community Survey data, with
persons adjusted to the Townwide average of 2.35 persons per s ingle fami ly household.
[2] Current Publ ic Safety development fee of $500 is col lected for both Pol ice and Fi re Faci l i ties .
Fire Nonresidential Capital Costs Per Trip
Fire Vehicles $52.37
Fire Communications Equipment $0.68
Fire Communications Infrastructure $1.49
IIP and Development Fee Study $0.19
GROSS CAPITAL COST $54.73
Revenue Credit 16% ($8.48)
NET CAPITAL COST $46.25
Fire Development Fee Schedule Development Fee per Square Foot of Floor Area
Trip Rate
Nonresidential Land Use Trips [3] Adj. Factors
(per 1,000 SF)
Commercia l 42.70 33% $0.65 $0.00 $0.65
Office/Insti tutional 11.03 50% $0.25 $0.00 $0.25
Industria l/Flex 6.97 50% $0.16 $0.00 $0.16
[4] Town of Payson does not currently assess Fi re Faci l i ties
development fees on nonres identia l development.
[3] Insti tute of Transportation Engineers . (2012). Trip Generation Manual 9th Edition.
Increase
(Decrease)
Number of
Bedrooms
Persons per
Household [1] Proposed Fee Current Fee [2]Unit Type
(Per Square Foot of Floor Area)
[1] Persons per Household recommended multipl iers are sca led to make the average va lue by type of hous ing for AZ
Increase
(Decrease)Proposed Fee Current Fee [4]

Development Fee Study: Infrastructure Improvements Plan Town of Payson, Arizona
35
FORECAST OF REVENUES
Appendix B – Forecast of Revenues Other Than Development Fees contains a forecast of revenues other than development fees required by Arizona’s enabling legislation.
Fire Facilities Cash Flow
The cash flow summary shown below provides an indication of the 10-year projected necessary expenditures to meet the demand for growth-related Fire Facilities, and projected development fee revenue based on the approved APPENDIX C – Land Use Assumptions. To the extent the rate of development either accelerates or slows down, there will be a corresponding change in the development fee revenue and capital costs.
Figure 24: Fire Facilities Cash Flow Summary
Ten-Year Growth-Related Costs for Fire Facilities
Fire Vehicles 953,001$
Fi re Communications Equipment 12,380$
Fi re Communications Infrastructure 27,950$
I IP and Development Fee Study 3,790$
TOTAL 997,121$
Single Unit 2+ Units Commercial Office Industrial
$406 $305 $0.65 $0.25 $0.16
Year
Base 2013 8,116 921 982 598 182
Year 1 2014 8,130 923 1,022 630 191
Year 2 2015 8,168 927 1,063 663 200
Year 3 2016 8,230 934 1,106 699 210
Year 4 2017 8,315 944 1,150 736 221
Year 5 2018 8,427 956 1,196 775 231
Year 6 2019 8,564 972 1,244 817 242
Year 7 2020 8,729 991 1,294 860 254
Year 8 2021 8,922 1,013 1,346 905 267
Year 9 2022 9,147 1,038 1,400 953 280
Year 10 2023 9,404 1,067 1,457 1,004 294
Ten-Yr Increase 1,288 146 475 406 113
Projected Fees (Rounded)=> $522,928 $44,530 $308,425 $101,487 $18,040
Total Projected Revenues $995,410
Cumulative Net Surplus/(Defici t) ($1,711)
per Housing Unit Per Square Foot of Floor Area
Housing Units Added Square Feet Added (1,000)

Development Fee Study: Infrastructure Improvements Plan Town of Payson, Arizona
36
[PAGE INTENTIONALLY LEFT BLANK]

Development Fee Study: Infrastructure Improvements Plan Town of Payson, Arizona
37
POLICE FACILITIES INFRASTRUCTURE IMPROVEMENTS PLAN
OVERVIEW
ARS 9-463.05 (T)(7)(f) defines the facilities and assets that can be included in a Public Safety Facilities IIP:
“Fire and police facilities, including all appurtenances, equipment and vehicles. Fire and police facilities do not include a facility or portion of a facility that is used to replace services that were once provided elsewhere in the municipality, vehicles and equipment used to provide administrative services, helicopters or airplanes or a facility that is used for training police and firefighters from more than one station or substation.”
The Police Facilities IIP includes components for facilities, vehicles, communications equipment, communications infrastructure, and the cost of preparing the Police Facilities IIP and development fees. Incremental expansion is used to calculate the IIP for Police facilities.
SERVICE AREA
The Town of Payson Police Department provides a uniform level of service to the entire Town. Therefore, the service area for the Police IIP is Townwide.
PROPORTIONATE SHARE
Functional Population
ARS 9-463.05 (B)(3) states that the development fee shall not exceed a proportionate share of the cost of necessary public services needed to accommodate new development. The Police IIP and development fees use a functional population concept to allocate the demand between residential and nonresidential development. Characteristics of the residential population and workers in the Town of Payson were analyzed to determine demand by type of land use using “person-hours”. For residential development, the proportionate share factor is based on estimated person hours of non-working residents, plus the non-working hours of resident workers. The portion of the population not working is estimated at 9,691 in 2010. (This is calculated by subtracting the Longitudinal Employer-Household Dynamics (LEHD) web-based application OnTheMap estimate of employed residents of the Town (5,610) from the Decennial Census population in 2010 (15,301)). For these residents, the full day (or 24 hours) is allocated to residential demand. According to the 2010 Decennial Census, employed persons living in Payson equals 5,610 residents. Of the resident workers living in Town, the U.S. Census Bureau estimates that 2,120 work in Payson and 3,490 work outside the Town. For workers living in the Town, two-thirds of the day (or 16 hours) is allocated to residential demand. Time spent at work (8 hours) is allocated to nonresidential development.

Development Fee Study: Infrastructure Improvements Plan Town of Payson, Arizona
38
For nonresidential development, 8 hours per person is estimated for each worker. For the 2,120 estimated Town residents working in Town and the 2,272 non-resident workers (estimated based on the number of jobs in the Town minus resident workers), 8 hours of demand per day is allocated. Based on estimated person hours, the cost allocation is 90 percent for residential development (322,344 person hours of residential demand out of a total 357,480 person hours) and 10 percent for nonresidential development (35,136 person hours of nonresidential demand out of a total 357,480 person hours). The following figure provides further detail on the calculation of proportionate share using functional population. While the Town of Payson does not formally track calls by land use, results of the functional population were discussed with staff, and found to be consistent with available data regarding the Town of Payson Police Department demand.
Figure 25: Police Functional Population
Service Units
The Police Facilities costs are allocated to both residential and nonresidential development based on the functional population discussed above. For residential development, fees are calculated on a per capita basis, and then converted to an appropriate amount by type of housing unit, based on Persons per Household factors.
For nonresidential development fees, TischlerBise recommends using nonresidential vehicle trips as the best demand indicator for Police Facilities. Trip generation rates are used for nonresidential development because vehicle trips are highest for commercial developments, such as shopping centers, and lowest for industrial/flex development. Office and institutional trip rates fall between the other two categories. This ranking of trip rates is consistent with the relative demand for Police services from nonresidential development.
Demand Person Proportionate
Land Use Hours/Day Hours Share
Residential
Estimated Res idents 15,301
Res idents Not Working 9,691 24 232,584
Workers Living in Town 5,610
Town Res idents Working in Town 2,120 16 33,920
Town Res idents Working outs ide of Town 3,490 16 55,840
Res identia l Subtotal 322,344 90%
Nonresidential
Jobs Located in Town 4,392
Town Res idents Working in Town 2,120 8 16,960
Non-Res ident Workers 2,272 8 18,176
Nonres identia l Subtotal 35,136 10%
TOTAL 357,480 100%
Source: U.S. Census Bureau, 2010 Decennia l Census ; U.S. Census Bureau, OnTheMap 6.1.1 Appl ication
and LEHD Origin-Destination Employment Statis tics
Demand Units in 2010

Development Fee Study: Infrastructure Improvements Plan Town of Payson, Arizona
39
Other possible nonresidential demand indicators, such as employment or floor area, will not accurately reflect the demand for service. For example, if employees per thousand square feet were used as the demand indicator, Police development fees would be too high for office and institutional development because offices typically have more employees per 1,000 square feet than retail uses. If floor area were used as the demand indicator Police development fees would be too high for industrial development. More information regarding the calculation of nonresidential vehicle trips can be found in Figure 32: Police Facilities Ratio of Service Unit to Land Use.
Vehicle trips are estimated using average weekday vehicle trips ends from the reference book Trip Generation published by the Institute of Transportation Engineers (ITE 9th Edition 2012). A vehicle trip end represents a vehicle either entering or exiting a development (as if a traffic counter were placed across a driveway).
Trip generation rates are adjusted to avoid double counting each trip at both the origin and destination points. Therefore, the basic trip adjustment factor of 50 percent is applied to the office/institutional, and industrial/flex categories. The commercial/retail category has a trip factor of less than 50 percent because this type of development attracts vehicles as they pass-by on arterial and collector roads. For example, when someone stops at a convenience store on the way home from work, the convenience store is not the primary destination. For the average shopping center, the ITE data indicates that 34 percent of the vehicles that enter are passing by on their way to some other primary destination. The remaining 66 percent of attraction trips have the commercial site as their primary destination. Because attraction trips are half of all trips, the trip adjustment factor of 66 percent is multiplied by 50 percent to calculate a trip adjustment factor for commercial land use of 33 percent.
Police Calls for Service
The functional population allocation to residential and nonresidential development is applied to calls for service data provided by the Town of Payson Police Department for calendar year 2012 to derive calls for service per service unit by land use. See Figure 26 for additional detail.
Figure 26: Police Proportionate Share
2012
Total Calls for Service (Calendar Year) 20,030
Source: Town of Payson Police Department
Proportionate Cal ls for CFS per
Land Use Share Service (CFS) Service Unit
Res identia l 90% 18,027 18,331 Population 0.98
Nonres identia l 10% 2,003 17,768 Nonres Vehicle Trips 0.11
2013
Service Units

Development Fee Study: Infrastructure Improvements Plan Town of Payson, Arizona
40
Public Safety Communications Command Center The Town of Payson Public Safety Communications Command Center dispatches calls for service for the Payson Police and Fire Departments, as well as for eight surrounding agencies. In order to calculate the portion of the shared center that is attributable to demand for Payson Police Department service, proportionate shares must be calculate from total calls for service received by the shared center.
Of the 23,292 calls for service received in calendar year 2012, 86 percent (20,030) were for the Payson Police Department. This proportionate share represents the demand the Payson Police Department puts on the Public Safety Communications Command Center for square footage of space and units of equipment.
Figure 27: Public Safety Communications Infrastructure Proportionate Share
IIP FOR POLICE FACILITIES
For each necessary public service that is the subject of a development fee, ARS 9-463.05(E) requires the IIP to include seven elements. The sections below detail each of the required components of the Police Facilities IIP. (A forecast of new revenues generated by sources other than development fees can be found in Appendix B – Forecast of Revenues Other Than Development Fees.)
ANALYSIS OF CAPACITY, USAGE, AND COSTS OF EXISTING PUBLIC SERVICES
ARS 9-463.05(E)(1) requires:
“A description of the existing necessary public services in the service area and the costs to upgrade, update, improve, expand, correct or replace those necessary public services to meet existing needs and usage and stricter safety, efficiency, environmental or regulatory standards, which shall be prepared by qualified professionals licensed in this state, as applicable.”
ARS 9-463.05(E)(2) requires:
“An analysis of the total capacity, the level of current usage and commitments for usage of capacity of the existing necessary public services, which shall be prepared by qualified professionals licensed in this state, as applicable.”
Calendar Year 2012 Proportionate
Agency Cal ls for Service Share
Payson Fire 2,680 11%
Payson Pol ice 20,030 86%
Other 582 3%
TOTAL 23,292 100%
Source: Town of Payson, Police Department
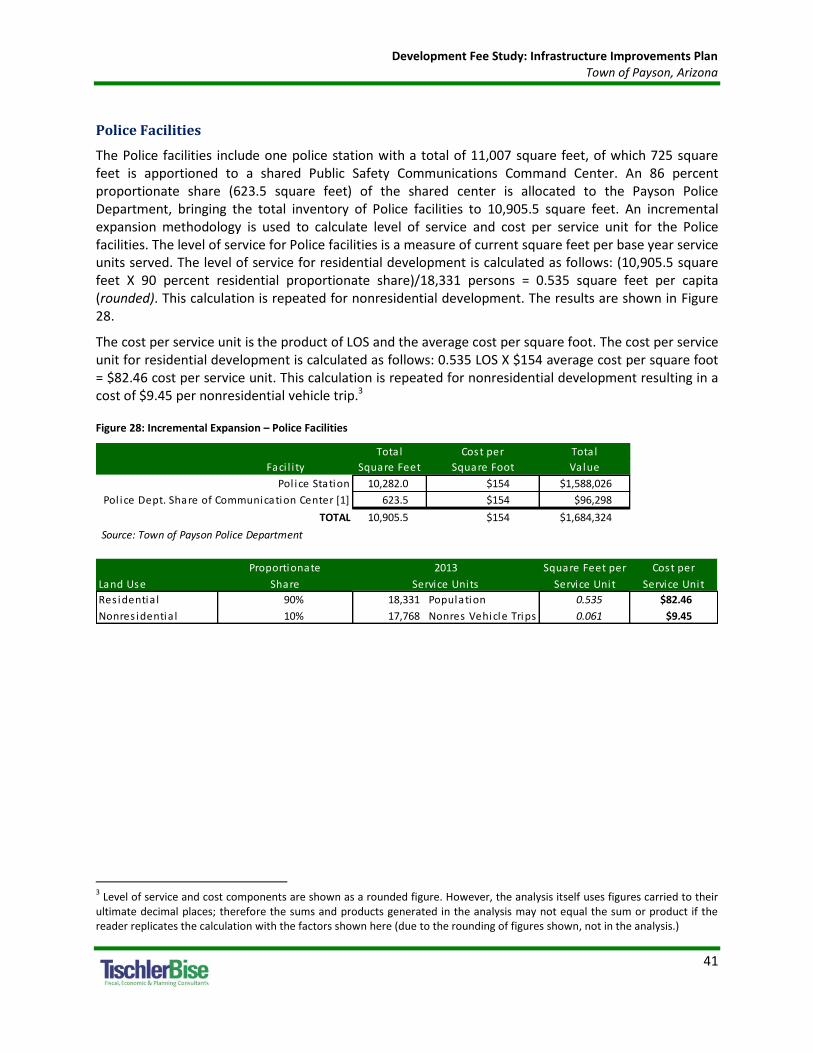
Development Fee Study: Infrastructure Improvements Plan Town of Payson, Arizona
41
Police Facilities
The Police facilities include one police station with a total of 11,007 square feet, of which 725 square feet is apportioned to a shared Public Safety Communications Command Center. An 86 percent proportionate share (623.5 square feet) of the shared center is allocated to the Payson Police Department, bringing the total inventory of Police facilities to 10,905.5 square feet. An incremental expansion methodology is used to calculate level of service and cost per service unit for the Police facilities. The level of service for Police facilities is a measure of current square feet per base year service units served. The level of service for residential development is calculated as follows: (10,905.5 square feet X 90 percent residential proportionate share)/18,331 persons = 0.535 square feet per capita (rounded). This calculation is repeated for nonresidential development. The results are shown in Figure 28.
The cost per service unit is the product of LOS and the average cost per square foot. The cost per service unit for residential development is calculated as follows: 0.535 LOS X $154 average cost per square foot = $82.46 cost per service unit. This calculation is repeated for nonresidential development resulting in a cost of $9.45 per nonresidential vehicle trip.3
Figure 28: Incremental Expansion – Police Facilities
3 Level of service and cost components are shown as a rounded figure. However, the analysis itself uses figures carried to their
ultimate decimal places; therefore the sums and products generated in the analysis may not equal the sum or product if the reader replicates the calculation with the factors shown here (due to the rounding of figures shown, not in the analysis.)
Total Cost per Total
Faci l i ty Square Feet Square Foot Value
Pol ice Station 10,282.0 $154 $1,588,026
Pol ice Dept. Share of Communication Center [1] 623.5 $154 $96,298
TOTAL 10,905.5 $154 $1,684,324
Source: Town of Payson Police Department
Proportionate Square Feet per Cost per
Land Use Share Service Unit Service Unit
Res identia l 90% 18,331 Population 0.535 $82.46
Nonres identia l 10% 17,768 Nonres Vehicle Trips 0.061 $9.45
Service Units
2013

Development Fee Study: Infrastructure Improvements Plan Town of Payson, Arizona
42
Police Vehicles
The Town plans to maintain the LOS for Police vehicles it currently provides to existing development. As staff are added, the vehicle fleet of patrol sedans will be expanded to accommodate new officers. Thus, the incremental expansion methodology is used to calculate this component of the Police IIP. The Town of Payson Police Department makes use of 32 vehicles, including 29 fully equipped patrol sedans, and three special unit vehicles. Based on the proportionate share analysis, residential development creates 90 percent of the demand for Police service, with nonresidential development accounting for 10 percent. The current LOS for residential development is calculated as follows: (32 vehicles X 90 percent proportionate share)/(18,331 persons/1,000) = 1.571 vehicles per 1,000 persons. This calculation is repeated for nonresidential development resulting in a LOS of 0.180 vehicles per 1,000 nonresidential vehicle trips.
The cost per service unit is the product of the LOS and the average cost per unit. The cost per service unit for residential development is calculated as follows: 1.571/1,000 LOS X $39,800 average cost per vehicle = $62.53 cost per service unit. This calculation is repeated for nonresidential development resulting in a cost of $7.17 per nonresidential vehicle trip.
Figure 29: Incremental Expansion –Police Vehicles
Vehicles Units in Service Unit Price Total Value
Patrol Sedans 29 $36,000 $1,044,000
Specia l Response SUV 1 $65,000 $65,000
K-9 Unit 1 $39,000 $39,000
Command Unit 1 $125,000 $125,000
Total 32 $39,800 $1,273,000
Source: Town of Payson Police Department
Proportionate Vehicles per 1,000 Cost per
Land Use Share Service Units Service Unit
Res identia l 90% 18,331 Population 1.571 $62.53
Nonres identia l 10% 17,768 Nonres Vehicle Trips 0.180 $7.17
Service Units
2013

Development Fee Study: Infrastructure Improvements Plan Town of Payson, Arizona
43
Police Communications Equipment
The Town plans to maintain the LOS for Police communications equipment it currently provides to existing development. Thus, the incremental expansion methodology is used to calculate this component of the Police IIP. The Town of Payson Police Department makes use of 66 components of communications equipment. Based on the proportionate share analysis, residential development creates 90 percent of the demand for Police service, with nonresidential development accounting for 10 percent. The current LOS for residential development is calculated as follows: (66 units of equipment X 90 percent proportionate share)/(18,331 persons/1,000) = 3.24 pieces of equipment per 1,000 persons. This calculation is repeated for nonresidential development resulting in a LOS of 0.37 units of equipment per 1,000 nonresidential vehicle trips.
The cost per service unit is the product of the LOS and the average cost per unit. The cost per service unit for residential development is calculated as follows: 3.24/1,000 LOS X $1,200 average cost per unit = $3.89 cost per service unit. This calculation is repeated for nonresidential development resulting in a cost of $0.45 per nonresidential vehicle trip.
Figure 30: Incremental Expansion –Police Communications Equipment
Police Communications Infrastructure
The Town of Payson Public Safety Communications Command Center dispatches calls for service for the Payson Fire and Police Departments, as well as for eight surrounding agencies. The entire infrastructure for the shared center includes communications towers, telecommunications system technology, and computer hardware and software. The complete infrastructure inventory supports the operation of three public safety dispatch consoles.
Based on the Public Safety Communications Infrastructure proportionate shares calculated above, the Payson Police Department generates 86 percent of the demands on the system, which is equivalent to 2.58 units of the three dispatch consoles in operation. The entire communications infrastructure has a value of $1.2 million. This equates to a per dispatch console value of $413,515. The value of the Police Departments share is equal to $1,066,869.
Units in Cost per Total
Equipment Service Unit Value
Portable Radios 30 $1,000 $30,000
Mobi le Radios 32 $1,200 $38,400
Repeaters 4 $3,500 $14,000
Total 66 $1,200 $82,400
Source: Town of Payson Police Department
Proportionate Units per 1,000 Cost per
Land Use Share Service Units Service Unit
Res identia l 90% 18,331 Population 3.24 $3.89
Nonres identia l 10% 17,768 Nonres Veh Trips 0.37 $0.45
2013
Service Units

Development Fee Study: Infrastructure Improvements Plan Town of Payson, Arizona
44
As development occurs, the shared center will expand in order to maintain the current level of service. The LOS for the Police portion of the Communications Infrastructure is a measure of dispatch consoles per service unit. The LOS for residential development is calculated as follows: (2.58 units X 90 percent residential proportionate share)/(18,331 persons/1,000) = 0.13 units per 1,000 residents (rounded). This calculation is repeated for nonresidential development using the nonresidential vehicle trips in 2013. The results are shown in Figure 31.
The cost per service unit for residential development is calculated as follows: (0.00013 residential level of service X $413,515 cost per unit = $52.38 per capita.4 This calculation is repeated for nonresidential development using the nonresidential vehicle trips in 2013, resulting in a cost per trip of $6.00.
Figure 31: Incremental Expansion – Police Communications Infrastructure
Excluded Costs
Development fees in Payson exclude costs to upgrade, update, improve, expand, correct or replace those necessary public services to meet existing needs and usage and stricter safety, efficiency, environmental or regulatory standards. The Town of Payson Capital Improvement Plan includes the cost of these excluded items.
Current Use and Available Capacity
The current Police Facilities discussed above are fully utilized and there is no available capacity for future development.
4 Level of service is shown as a rounded figure. However, the analysis itself uses figures carried to their ultimate decimal places;
therefore the sums and products generated in the analysis may not equal the sum or product if the reader replicates the calculation with the factors shown here (due to the rounding of figures shown, not in the analysis.)
Communications Units in Cost per Total
Infrastructure Service Unit Value
Dispatch Consoles 3.00 $413,515 $1,240,545
Payson Pol ice Department Share 2.58 $1,066,869
Source: Town of Payson, Police Department
Proportionate Units per 1,000 Cost per
Land Use Share Service Units Service Unit
Res identia l 90% 18,331 Population 0.13 $52.38
Nonres identia l 10% 17,768 Nonres Vehicle Trips 0.01 $6.00
2013
Service Units

Development Fee Study: Infrastructure Improvements Plan Town of Payson, Arizona
45
RATIO OF SERVICE UNIT TO DEVELOPMENT UNIT
ARS 9-463.05(E)(4) requires:
“A table establishing the specific level or quantity of use, consumption, generation or discharge of a service unit for each category of necessary public services or facility expansions and an equivalency or conversion table establishing the ratio of a service unit to various types of land uses, including residential, commercial and industrial.”
Figure 32 displays the ratio of a service unit (i.e., persons and nonresidential vehicle trips) to various types of land uses for residential and nonresidential development. The residential development table displays the Persons per Household factors for single family and multifamily homes.
For nonresidential development fees, TischlerBise recommends using nonresidential vehicle trips as the best demand indicator for Police Facilities. Trip generation rates are used for nonresidential development because vehicle trips are highest for commercial developments, such as shopping centers, and lowest for industrial/flex development. Office and institutional trip rates fall between the other two categories. This ranking of trip rates is consistent with the relative demand for Police services from nonresidential development.
Other possible nonresidential demand indicators, such as employment or floor area, will not accurately reflect the demand for service. For example, if employees per thousand square feet were used as the demand indicator, Police development fees would be too high for office and institutional development because offices typically have more employees per 1,000 square feet than retail uses. If floor area were used as the demand indicator Police development fees would be too high for industrial development.
Vehicle trips are estimated using average weekday vehicle trips ends from the reference book Trip Generation published by the Institute of Transportation Engineers (ITE 9th Edition 2012). A vehicle trip end represents a vehicle either entering or exiting a development (as if a traffic counter were placed across a driveway).
Trip generation rates are adjusted to avoid double counting each trip at both the origin and destination points. Therefore, the basic trip adjustment factor of 50 percent is applied to the office/institutional, and industrial/flex categories. The commercial/retail category has a trip factor of less than 50 percent because this type of development attracts vehicles as they pass-by on arterial and collector roads. For example, when someone stops at a convenience store on the way home from work, the convenience store is not the primary destination. For the average shopping center, the ITE data indicate that 34 percent of the vehicles that enter are passing by on their way to some other primary destination. The remaining 66 percent of attraction trips have the commercial site as their primary destination. Because attraction trips are half of all trips, the trip adjustment factor of 66 percent is multiplied by 50 percent to calculate a trip adjustment factor for commercial land use of 33 percent.

Development Fee Study: Infrastructure Improvements Plan Town of Payson, Arizona
46
Figure 32: Police Facilities Ratio of Service Unit to Land Use
PROJECTED SERVICE UNITS AND FACILITIES DEMAND
ARS 9-463.05(E)(3) requires:
“A description of all or the parts of the necessary public services or facility expansions and their costs necessitated by and attributable to development in the service area based on the approved land use assumptions, including a forecast of the costs of infrastructure, improvements, real property, financing, engineering and architectural services, which shall be prepared by qualified professionals licensed in this state, as applicable.”
ARS 9-463.05(E)(5) requires:
“The total number of projected service units necessitated by and attributable to new development in the service area based on the approved land use assumptions and calculated pursuant to generally accepted engineering and planning criteria.”
ARS 9-463.05(E)(6) requires:
“The projected demand for necessary public services or facility expansions required by new service units for a period not to exceed ten years.”
Land UsePersons per
Household1
Single Unit 2.35
2+ Unit 1.77
1. Development Fee Land Use Assumptions
Land UseWeekday Trip Ends 2
(a)
Trip Adjustment3
(b)
Vehicle Trips
(a X b)
Commercia l 42.70 33% 14.09
Office/Insti tutional 11.03 50% 5.52
Industria l/Flex 6.97 50% 3.49
2. Insti tute of Transportation Engineers . (2012). Trip Generation
Manual 9th Edition
3. Average adjustment used to count every trip only one, at the point
of fina l destination
Res identia l Development
Nonres identia l Development
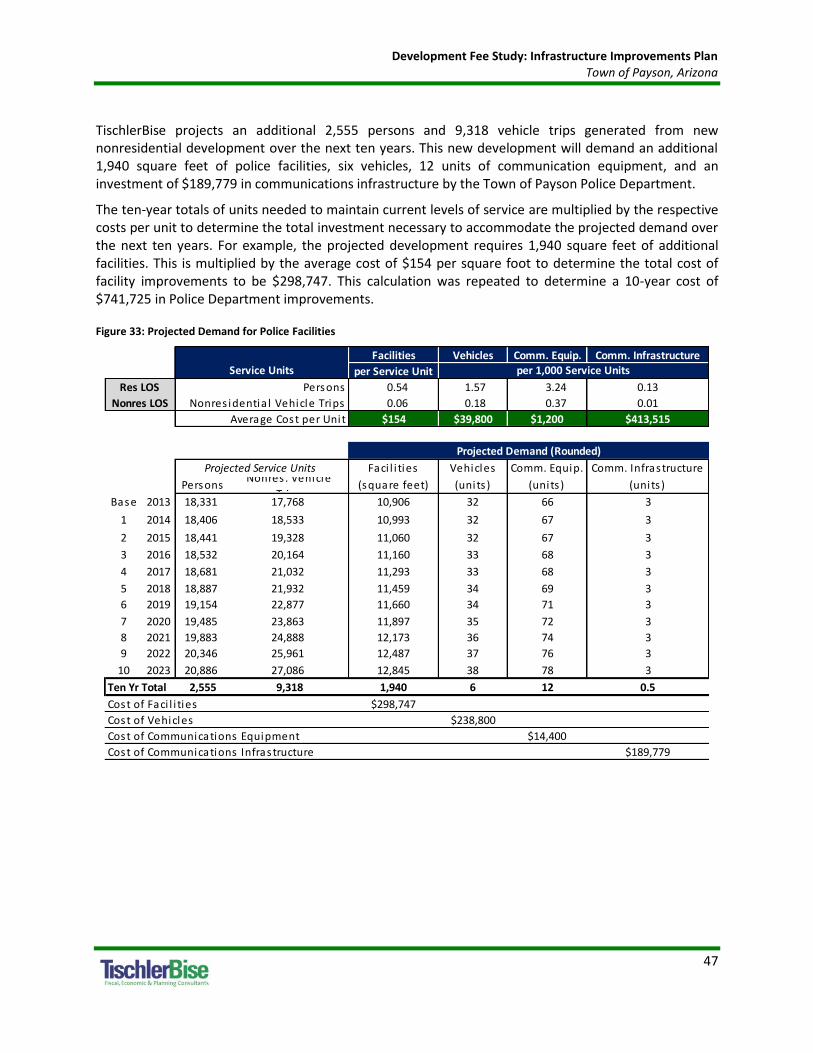
Development Fee Study: Infrastructure Improvements Plan Town of Payson, Arizona
47
TischlerBise projects an additional 2,555 persons and 9,318 vehicle trips generated from new nonresidential development over the next ten years. This new development will demand an additional 1,940 square feet of police facilities, six vehicles, 12 units of communication equipment, and an investment of $189,779 in communications infrastructure by the Town of Payson Police Department.
The ten-year totals of units needed to maintain current levels of service are multiplied by the respective costs per unit to determine the total investment necessary to accommodate the projected demand over the next ten years. For example, the projected development requires 1,940 square feet of additional facilities. This is multiplied by the average cost of $154 per square foot to determine the total cost of facility improvements to be $298,747. This calculation was repeated to determine a 10-year cost of $741,725 in Police Department improvements.
Figure 33: Projected Demand for Police Facilities
Facilities Vehicles Comm. Equip. Comm. Infrastructure
per Service Unit
Persons 0.54 1.57 3.24 0.13
Nonres identia l Vehicle Trips 0.06 0.18 0.37 0.01
Average Cost per Unit $154 $39,800 $1,200 $413,515
Faci l i ties Vehicles Comm. Equip. Comm. Infrastructure
PersonsNonres . Vehicle
Trips(square feet) (units ) (units ) (units )
Base 2013 18,331 17,768 10,906 32 66 3
1 2014 18,406 18,533 10,993 32 67 3
2 2015 18,441 19,328 11,060 32 67 3
3 2016 18,532 20,164 11,160 33 68 3
4 2017 18,681 21,032 11,293 33 68 3
5 2018 18,887 21,932 11,459 34 69 3
6 2019 19,154 22,877 11,660 34 71 3
7 2020 19,485 23,863 11,897 35 72 3
8 2021 19,883 24,888 12,173 36 74 3
9 2022 20,346 25,961 12,487 37 76 3
10 2023 20,886 27,086 12,845 38 78 3
Ten Yr Total 2,555 9,318 1,940 6 12 0.5
Cost of Faci l i ties $298,747
Cost of Vehicles $238,800
Cost of Communications Equipment $14,400
Cost of Communications Infrastructure $189,779
Res LOS
Service Units
Nonres LOS
per 1,000 Service Units
Projected Demand (Rounded)
Projected Service Units

Development Fee Study: Infrastructure Improvements Plan Town of Payson, Arizona
48
Police Facilities Improvements Plan
Lastly, the qualified Police Facilities improvements and expansions identified for development fee revenues are listed below. This amount represents the Police Department’s 86 percent proportionate share of a Town-identified investment in dispatch console expansion expected to cost $172,000.
Figure 34: Necessary Police Facilities Expansions
Source: Town of Payson; TischlerBise
MAXIMUM SUPPORTABLE POLICE FACILITIES DEVELOPMENT FEES
The proposed development fees for Police Facilities are shown in Figure 35 on the following page.
Police Facilities IIP and Development Fee Study
Included in the Police Facilities per service unit cost is the cost to prepare the Police Facilities IIP and Development Fee Study. See Appendix A – Cost of Professional Services for the detailed calculations.
Revenue Credit
Included in the maximum supportable development fees is a Revenue Credit of 16 percent. The unadjusted Police Facilities development fees per development unit would generate more revenue over the next ten years, based on the approved APPENDIX C – Land Use Assumptions, than the identified growth-related necessary expenditures of $745,515 (necessary public services plus the cost of the IIP and Development Fee Study). To ensure that no more fee revenue is collected than the Town plans to spend, the potential gross cost per service unit is reduced by the revenue credit to calculate the net capital cost per service unit. Based on the gross capital costs per service unit, the projected development fee revenue would equal $891,700. Therefore, a Revenue Credit of 16 percent (rounded) is necessary to ensure no more revenue is collected than the Town expects to spend.
Improvements 10-Year
Projects Plan
Faci l i ties
Evidence Storage Faci l i ty $212,000
Incremental Expans ion of Pol ice Faci l i ties $86,747
Incremental Expans ion of Vehicles $238,800
Incremental Expans ion of Communications Equipment $14,400
Communications Infrastructure
Dispatch Console $147,920
Incremental Expans ion of Comm. Infrastructure $41,859
TOTAL $741,725

Development Fee Study: Infrastructure Improvements Plan Town of Payson, Arizona
49
Figure 35: Maximum Supportable Police Facilities Development Fees
Police Residential Capital Costs Per Person
Pol ice Faci l i ties $82.46
Pol ice Vehicles $62.53
Pol ice Communications Equipment $3.89
Pol ice Communications Infrastructure $52.38
IIP and Development Fee Study $6.13
GROSS CAPITAL COST $207.39
Revenue Credit 16% ($34.01)
NET CAPITAL COST $173.38
Police Development Fee Schedule Development Fee per Housing Unit
2+ Unit Al l Sizes 1.77 $307 $250 $57
Single Unit 0-3 2.07 $359 $250 $109
Single Unit 4+ 3.26 $565 $250 $315
Single Unit Avg 2.35 $407 $250 $157
PUMA 0800 match the average va lue for Payson, derived from 2011 American Community Survey data, with
persons adjusted to the Townwide average of 2.35 persons per s ingle fami ly household.
[2] Current Publ ic Safety development fee of $500 is col lected for both Pol ice and Fi re Faci l i ties .
Police Nonresidential Capital Costs Per Trip
Pol ice Faci l i ties $9.45
Pol ice Vehicles $7.17
Pol ice Communications Equipment $0.45
Pol ice Communications Infrastructure $6.00
IIP and Development Fee Study $0.09
GROSS CAPITAL COST $23.16
Revenue Credit 16% ($3.80)
NET CAPITAL COST $19.36
Police Development Fee Schedule Development Fee per Square Foot of Floor Area
Trip Rate
Nonresidential Land Use Trips [3] Adj. Factors
(per 1,000 SF)
Commercia l 42.70 33% $0.27 $0.00 $0.27
Office/Insti tutional 11.03 50% $0.10 $0.00 $0.10
Industria l/Flex 6.97 50% $0.06 $0.00 $0.06
[4] Town of Payson does not currently assess Pol ice Faci l i ties
development fees on nonres identia l development.
[3] Insti tute of Transportation Engineers . (2012). Trip Generation Manual 9th Edition.
(Per Square Foot of Floor Area)
Proposed Fee Current Fee [4]
Increase
(Decrease)
Increase
(Decrease)
[1] Persons per Household recommended multipl iers are sca led to make the average va lue by type of hous ing
Unit Type
Number of
Bedrooms
Persons per
Household [1] Proposed Fee Current Fee [2]

Development Fee Study: Infrastructure Improvements Plan Town of Payson, Arizona
50
FORECAST OF REVENUES
Appendix B – Forecast of Revenues Other Than Development Fees contains a forecast of revenues other than development fees required by Arizona’s enabling legislation.
Police Facilities Cash Flow
The cash flow summary shown below provides an indication of the 10-year projected necessary expenditures to meet the demand for growth-related Police Facilities, and projected development fee revenue based on the approved APPENDIX C – Land Use Assumptions. To the extent the rate of development either accelerates or slows down, there will be a corresponding change in the development fee revenue and capital costs.
Figure 36: Police Facilities Cash Flow Summary
Ten-Year Growth-Related Costs for Police Facilities
Police Facilities 298,747$
Police Vehicles 238,800$
Police Communications Equipment 14,400$
Police Communications Infrastructure 189,779$
IIP and Development Fee Study 3,790$
TOTAL 745,515$
Single Unit 2+ Units Commercial Office Industrial
$407 $307 $0.27 $0.10 $0.06
Year
Base 2013 8,116 921 982 598 182
Year 1 2014 8,130 923 1,022 630 191
Year 2 2015 8,168 927 1,063 663 200
Year 3 2016 8,230 934 1,106 699 210
Year 4 2017 8,315 944 1,150 736 221
Year 5 2018 8,427 956 1,196 775 231
Year 6 2019 8,564 972 1,244 817 242
Year 7 2020 8,729 991 1,294 860 254
Year 8 2021 8,922 1,013 1,346 905 267
Year 9 2022 9,147 1,038 1,400 953 280
Year 10 2023 9,404 1,067 1,457 1,004 294
Ten-Yr Increase 1,288 146 475 406 113
Projected Fees (Rounded)=> $524,216 $44,822 $128,115 $40,595 $6,765
Total Projected Revenues $744,513
Cumulative Net Surplus/(Defici t) ($1,002)
per Housing Unit Per Square Foot of Floor Area
Housing Units Added Square Feet Added (1,000)

Development Fee Study: Infrastructure Improvements Plan Town of Payson, Arizona
51
STREET FACILITIES INFRASTRUCTURE IMPROVEMENTS PLAN
OVERVIEW
ARS 9-463.05 (T)(7)(e) defines the facilities and assets that can be included in the Street Facilities IIP:
“Street facilities located in the service area, including arterial or collector streets or roads that have been designated on an officially adopted plan of the municipality, traffic signals and rights-of-way and improvements thereon.”
The Street Facilities IIP includes components for street improvements, and the cost of preparing the Street Facilities IIP and Development Fees. For the purpose of the Street Facilities IIP, minor arterial and collector streets are considered as system improvements. Street Facilities development fees are calculated using a plan-based methodology.
SERVICE AREA
The Town of Payson streets network includes local roads that connect to Town-maintained collectors and minor arterials. For the purpose of calculating and imposing Street Facilities development fees the Town-maintained minor arterials and collectors form a single integrated network serving the entire Town. Therefore, the service area for the Street Facilities IIP is Townwide. Shown in Figure 37 is a map of the streets network within the Town of Payson.
Figure 37: Town of Payson Existing Roadway Functional Classifications
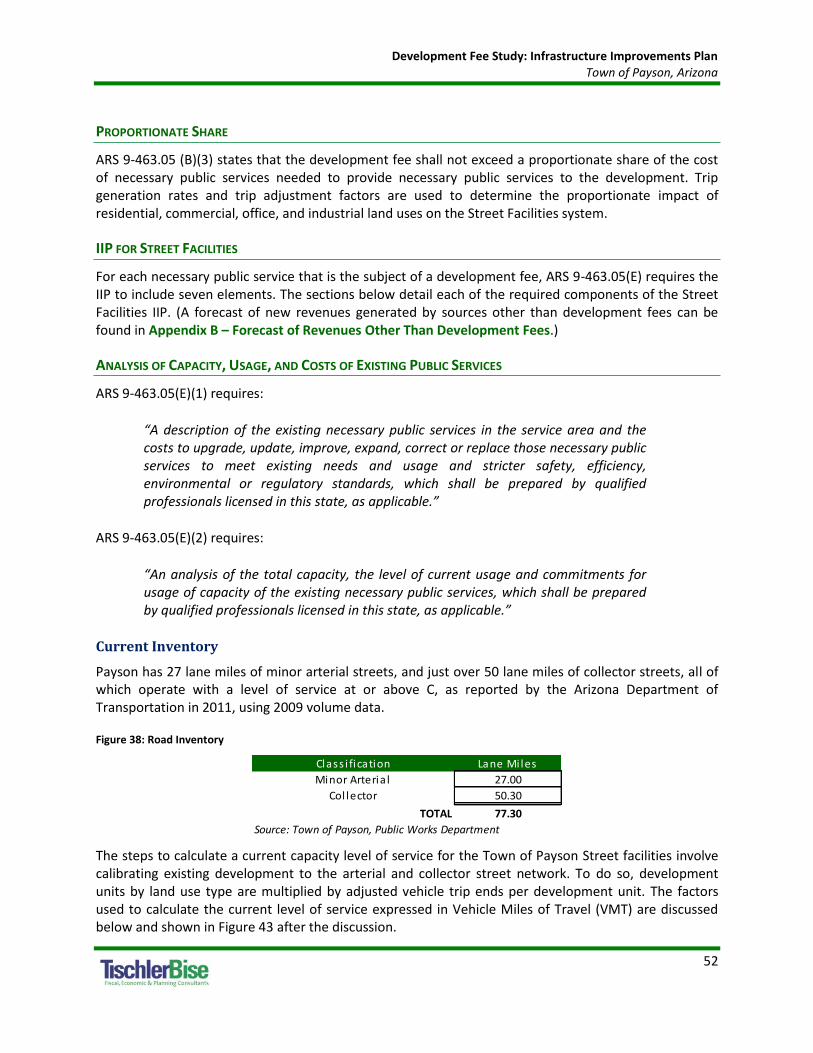
Development Fee Study: Infrastructure Improvements Plan Town of Payson, Arizona
52
PROPORTIONATE SHARE
ARS 9-463.05 (B)(3) states that the development fee shall not exceed a proportionate share of the cost of necessary public services needed to provide necessary public services to the development. Trip generation rates and trip adjustment factors are used to determine the proportionate impact of residential, commercial, office, and industrial land uses on the Street Facilities system.
IIP FOR STREET FACILITIES
For each necessary public service that is the subject of a development fee, ARS 9-463.05(E) requires the IIP to include seven elements. The sections below detail each of the required components of the Street Facilities IIP. (A forecast of new revenues generated by sources other than development fees can be found in Appendix B – Forecast of Revenues Other Than Development Fees.)
ANALYSIS OF CAPACITY, USAGE, AND COSTS OF EXISTING PUBLIC SERVICES
ARS 9-463.05(E)(1) requires:
“A description of the existing necessary public services in the service area and the costs to upgrade, update, improve, expand, correct or replace those necessary public services to meet existing needs and usage and stricter safety, efficiency, environmental or regulatory standards, which shall be prepared by qualified professionals licensed in this state, as applicable.”
ARS 9-463.05(E)(2) requires:
“An analysis of the total capacity, the level of current usage and commitments for usage of capacity of the existing necessary public services, which shall be prepared by qualified professionals licensed in this state, as applicable.”
Current Inventory
Payson has 27 lane miles of minor arterial streets, and just over 50 lane miles of collector streets, all of which operate with a level of service at or above C, as reported by the Arizona Department of Transportation in 2011, using 2009 volume data.
Figure 38: Road Inventory
The steps to calculate a current capacity level of service for the Town of Payson Street facilities involve calibrating existing development to the arterial and collector street network. To do so, development units by land use type are multiplied by adjusted vehicle trip ends per development unit. The factors used to calculate the current level of service expressed in Vehicle Miles of Travel (VMT) are discussed below and shown in Figure 43 after the discussion.
Class i fication Lane Mi les
Minor Arteria l 27.00
Col lector 50.30
TOTAL 77.30
Source: Town of Payson, Public Works Department
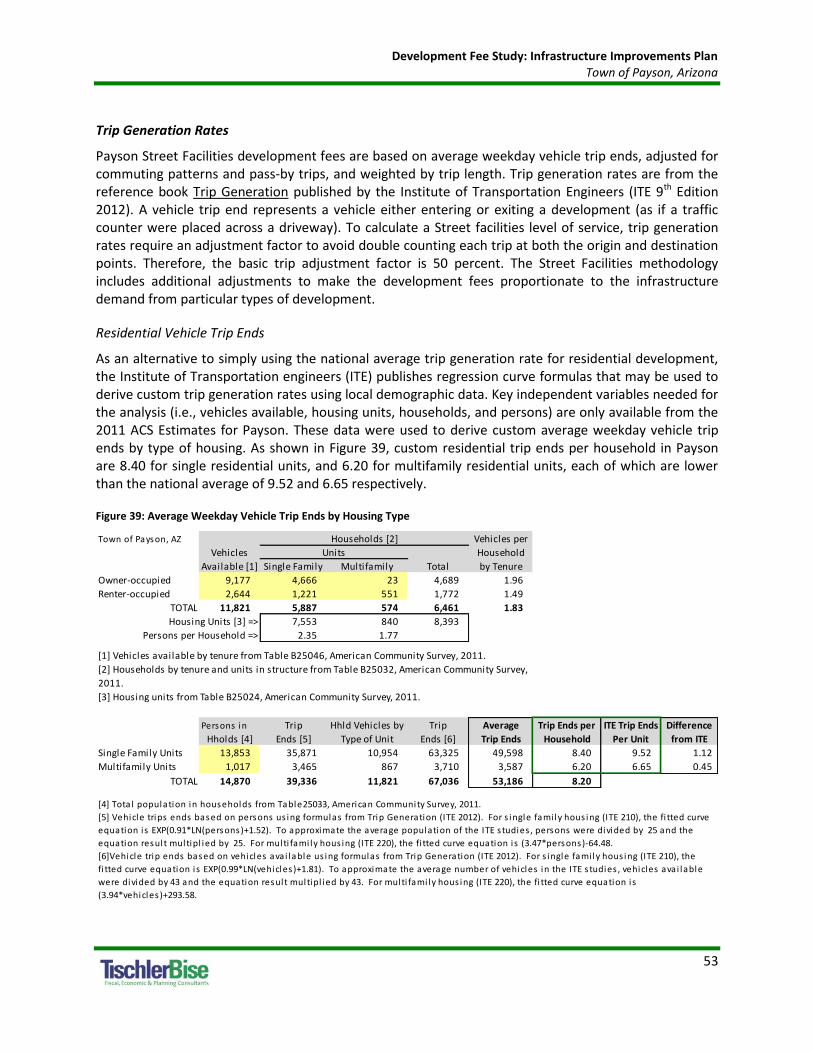
Development Fee Study: Infrastructure Improvements Plan Town of Payson, Arizona
53
Trip Generation Rates
Payson Street Facilities development fees are based on average weekday vehicle trip ends, adjusted for commuting patterns and pass-by trips, and weighted by trip length. Trip generation rates are from the reference book Trip Generation published by the Institute of Transportation Engineers (ITE 9th Edition 2012). A vehicle trip end represents a vehicle either entering or exiting a development (as if a traffic counter were placed across a driveway). To calculate a Street facilities level of service, trip generation rates require an adjustment factor to avoid double counting each trip at both the origin and destination points. Therefore, the basic trip adjustment factor is 50 percent. The Street Facilities methodology includes additional adjustments to make the development fees proportionate to the infrastructure demand from particular types of development.
Residential Vehicle Trip Ends
As an alternative to simply using the national average trip generation rate for residential development, the Institute of Transportation engineers (ITE) publishes regression curve formulas that may be used to derive custom trip generation rates using local demographic data. Key independent variables needed for the analysis (i.e., vehicles available, housing units, households, and persons) are only available from the 2011 ACS Estimates for Payson. These data were used to derive custom average weekday vehicle trip ends by type of housing. As shown in Figure 39, custom residential trip ends per household in Payson are 8.40 for single residential units, and 6.20 for multifamily residential units, each of which are lower than the national average of 9.52 and 6.65 respectively.
Figure 39: Average Weekday Vehicle Trip Ends by Housing Type
Town of Payson, AZ Vehicles per
Vehicles Household
Available [1] Single Family Multifamily Total by Tenure
Owner-occupied 9,177 4,666 23 4,689 1.96
Renter-occupied 2,644 1,221 551 1,772 1.49
TOTAL 11,821 5,887 574 6,461 1.83
Housing Units [3] => 7,553 840 8,393
Persons per Household => 2.35 1.77
Persons in Trip Hhld Vehicles by Trip Average Trip Ends per ITE Trip Ends Difference
Hholds [4] Ends [5] Type of Unit Ends [6] Trip Ends Household Per Unit from ITE
Single Family Units 13,853 35,871 10,954 63,325 49,598 8.40 9.52 1.12
Multifamily Units 1,017 3,465 867 3,710 3,587 6.20 6.65 0.45
TOTAL 14,870 39,336 11,821 67,036 53,186 8.20
[4] Total population in households from Table25033, American Community Survey, 2011.
[5] Vehicle trips ends based on persons us ing formulas from Trip Generation (ITE 2012). For s ingle fami ly hous ing (ITE 210), the fi tted curve
equation is EXP(0.91*LN(persons)+1.52). To approximate the average population of the ITE s tudies , persons were divided by 25 and the
equation result multipl ied by 25. For multi fami ly hous ing (ITE 220), the fi tted curve equation is (3.47*persons)-64.48.
[6]Vehicle trip ends based on vehicles avai lable us ing formulas from Trip Generation (ITE 2012). For s ingle fami ly hous ing (ITE 210), the
fi tted curve equation is EXP(0.99*LN(vehicles )+1.81). To approximate the average number of vehicles in the ITE s tudies , vehicles avai lable
were divided by 43 and the equation result multipl ied by 43. For multi fami ly hous ing (ITE 220), the fi tted curve equation is
(3.94*vehicles )+293.58.
Households [2]
Units
[1] Vehicles available by tenure from Table B25046, American Community Survey, 2011.
[2] Households by tenure and units in structure from Table B25032, American Community Survey,
2011.
[3] Housing units from Table B25024, American Community Survey, 2011.

Development Fee Study: Infrastructure Improvements Plan Town of Payson, Arizona
54
Nonresidential Vehicle Trip Ends
Vehicle trip ends for nonresidential development are from the reference book Trip Generation published by the Institute of Transportation Engineers (ITE 9th Edition, 2012). The shaded categories in Figure 40 represent the proxy categories used to determine existing and projected trips from nonresidential development in the Town of Payson.
Light Industrial serves as the proxy for industrial/flex land uses. Data for an average sized General Office is used as the proxy for office/institutional land uses. Lastly, the average for Shopping Center is used as a proxy for commercial land uses.
Figure 40: The Institute of Transportation Engineers, Nonresidential Trip Ends, 2012

Development Fee Study: Infrastructure Improvements Plan Town of Payson, Arizona
55
Adjustment for Journey-To-Work Commuting
Residential development in the Town of Payson has a slightly larger trip adjustment factor of 60 percent to account for commuters leaving Payson for work. According to the National Household Travel Survey (2009), home-based work trips are typically 31 percent of “production” trips, in other words, out-bound trips (which are 50 percent of all trip ends). Data from the LEHD for 2010 indicate that 62 percent of Payson’s employed residents travel outside the Town for work. In combination, these factors (0.31 x 0.50 x 0.62 = 0.10) account for 10 percent (rounded) of additional production trips. The total adjustment factor for residential includes attraction trips (50% of trip ends) plus the journey-to-work commuting adjustment for a total of 60 percent (rounded).
Figure 41: Adjustment for Journey-To-Work Commuting
Adjustments for Pass-By Trips
For commercial development, the trip adjustment factor is less than 50 percent because retail development and some services attract vehicles as they pass by on collector roads. For example, when someone stops at a convenience store on the way home from work, the convenience store is not the primary destination. For the average shopping center, the ITE data indicate that 34 percent of the vehicles that enter are passing-by on their way to some other primary destination. The remaining 66 percent of attraction trips have the commercial site as their primary destination. Because attraction trips are half of all trips, the trip adjustment factor is 66 percent multiplied by 50 percent, or approximately 33 percent of the trip ends.
Trip Length Weighting Factor by Type of Land Use
The Street Facilities methodology includes a percentage adjustment, or weighting factor, to account for trip length variation by type of land use. As documented in Table 6 of the 2009 National Household Travel Survey, vehicle trips from residential development are approximately 121 percent of the average trip length. The residential trip length adjustment factor includes data on home-based work trips, social, and recreational purposes. Conversely, shopping trips associated with commercial development are roughly 66 percent of the average trip length while other nonresidential development typically accounts for trips that are 73 percent of the average for all trips.
Trip Adjustment Factor for Commuters [1]
Employed Residents 5,610
Residents Working in Town 2,120
Residents Commuting Outside Town for Work 3,490
Percent Commuting out of the Town 62%
Additional Production Trips [2] 10%
Residential Trip Adjustment Factor 60%
[1] U.S. Census Bureau, OnTheMap Application (version 6.1.1) and
LEHD Origin-Destination Employment Statistics
[2] National Household Travel Survey, 2011: Table 30

Development Fee Study: Infrastructure Improvements Plan Town of Payson, Arizona
56
Lane Capacity
In October of 2006, Gila County and the Arizona Department of Transportation released the Gila County Small Area Transportation Study Final Report. Recommendations made in the report sought to facilitate “closer coordination between land use and transportation improvements” to ensure a streets network with the capacity to accommodate future development. The study examined the existing streets network and established daily per-lane capacities for each classification of roadways. Daily per-lane capacities of roadways in Gila County were established to be 8,000 for minor arterials and 5,300 for collectors. This equates to a weighted average capacity for the system of 6,200.
Figure 42: Daily Per-Lane Capacity
Current Level of Service
Figure 43 shows the factors used to calibrate existing development to the current Town arterial and collector streets network. Knowing the current lane miles (77.3), TischlerBise determined the weighted-average trip length of 7.30 using a series of spreadsheet iterations. As shown in Figure 43 below, existing development within Payson attracted an estimated 479,257 Vehicle Miles of Travel (VMT) in 2013, based on the trip generation, trip adjustment, trip length factor and other assumptions shown.
A VMT is a measurement unit equal to one vehicle traveling one mile. In the aggregate, VMT is the product of vehicle trips multiplied by the average trip length.5 Therefore, the current infrastructure standard is 1.61 lane miles per 10,000 VMT (i.e., 77.3 lane miles divided by 479,257 VMT expressed in ten-thousands).
5 Typical VMT calculations for development-specific traffic studies, along with most transportation models of an entire urban
area, are derived from traffic counts on particular road segments multiplied by the length of that road segment. For the purpose of development fees, VMT calculations are based on attraction (inbound) trips to development located in the service area, with the trip lengths calibrated to the streets network considered system improvements. This refinement eliminates pass-through or external- external trips, and travel on roads that are not system improvements (e.g. interstate highways).
Dai ly Per-lane
Network Lane Mi les [1] Capacity [2]
Minor Arterial 27.0 8,000
Collector 50.3 5,300
Existing - Minor Arterial & Collector 77.3 6,200
[1] Town of Payson, Publ ic Works Department
[2] Lima & Associates . (Oct. 2006). Gi la County Smal l Area Transportation Study.

Development Fee Study: Infrastructure Improvements Plan Town of Payson, Arizona
57
Figure 43: Existing Level of Service on Town Arterial and Collector Network
[A] [B] [C] [A]X[B]X[C]
Development
Type [1] Dev. Unit
Avg Wkdy Veh
Trip Ends per
Dev. Unit [2]
Trip
Adjustment
Factors [3]
Trip Length
Weighting
Factor [4]
Trip
Length
RESIDENTIAL
Single Unit HU 8.40 60% 121% 6.10
Multi -Unit HU 6.20 60% 121% 4.50
NONRESIDENTIAL
Commercia l KSF 42.70 33% 66% 9.30
Office/ Other KSF 11.03 50% 73% 4.03
Industria l KSF 6.97 50% 73% 2.54
Average Trip Length (Mi les ) 7.30
Capacity per Lane 6,200
Base Year
2013
Development Unit
Single Unit Res identia l 8,116
Multi -Unit Res identia l 921
Commercia l KSF 982
Office/ Other KSF 598
Industria l KSF 182
Vehicle Trips
Single Unit Res identia l 40,905
Multi -Unit Res identia l 3,426
Commercia l KSF 13,837
Office/ Other KSF 3,298
Industria l KSF 633
TOTAL Trips 62,099
Vehicle Mi les of Travel (VMT) 479,257
Total Lane Mi les 77.3
Lane Mi les per 10,000 VMT 1.61
[1] Single Unit = SFD, SFA, and Mobi le Homes; KSF = square feet of floor area in thousands .
[4] Table 6, National Household Travel Survey, 2009.
[2] Res identia l : TischlerBise Draft Land Use Assumptions ; Nonres identia l : Trip Generation, Insti tute
of Transportation Engineers , 2012.
[3] On an average weekday, ha l f of a l l trip ends are inbound. Retai l and insti tutional include 34%
pass-by adjustment (i .e. 66% are primary trips ) ha l f of which are trip ends . The res identia l
adjustment factor accounts for 62% of employed res idents commuting to jobs outs ide the Town.

Development Fee Study: Infrastructure Improvements Plan Town of Payson, Arizona
58
Planned Cost per Lane Mile
As shown in Figure 44, Payson has identified necessary system improvements to be constructed in the next ten years, including one minor arterial, and two collectors. In total, there are 1.05 lane miles of system improvements planned at a cost to the Town of $2,193,000 in 2013 dollars (i.e., not inflated over time). Of this amount, Street Facilities development fees will fund 70 percent, which is the share of project costs attributable to growth.
Data from the 2011 Payson Transportation Study Final Report, and the 2006 Gila County Small Area Transportation Study were used to calculate the growth share for each project. Existing Daily Traffic Counts, taken in 2009, for the existing portions of roads adjacent to the segments planned for construction were used to calculate the share of the improvement that is being generated by new development. An example of the calculation, using S. McLane Road project, is as follows: (8,000 future capacity – 584 daily traffic count)/8,000 future capacity = 93 percent of the project is attributable to growth.
Dividing the growth cost of system improvements by the total lane mile increase (1.05) indicates an average cost of $1,456,119 per lane mile that is attributable to growth. A Lane mile is a rectangular area of pavement, one lane wide and one mile long.
Figure 44: Cost per Lane Mile for System Improvements
Excluded Costs
Development fees in Payson exclude costs to upgrade, update, improve, expand, correct or replace those necessary public services to meet existing needs and usage and stricter safety, efficiency, environmental or regulatory standards. The Town of Payson Capital Improvement Plan includes the cost of these excluded items.
Current Use and Available Capacity
The Planned Street Facilities discussed above will serve existing and new development. Only the portion of each project that is attributable to growth, as calculated in Figure 44 above, will be eligible for Street Facilities development fee revenue.
Class i fication Project
Added
Lanes
Added
Lane Mi les
Total
Project Cost [1]
Recent
Count [2]
Future
Capacity [3]
Growth
Share
Cost Attributable
to Growth
Minor Arteria l S. McLane Road 2 0.25 $333,000 584 8,000 93% $308,691
Col lector Mud Springs Road Phase II 2 0.38 $1,300,000 1,210 5,300 77% $1,003,208
Col lector Rumsey Drive 2 0.42 $560,000 3,246 5,300 39% $217,026
TOTAL 2 1.05 $2,193,000 $1,528,925
Cost per Lane Mi le $2,088,571 $1,456,119
[2] Jacobs . (March 2011) Payson Transportation Study Final Report.
[3] Lima & Associates . (Oct. 2006). Gi la County Smal l Area Transportation Study.
[1] Town of Payson, Publ ic Works
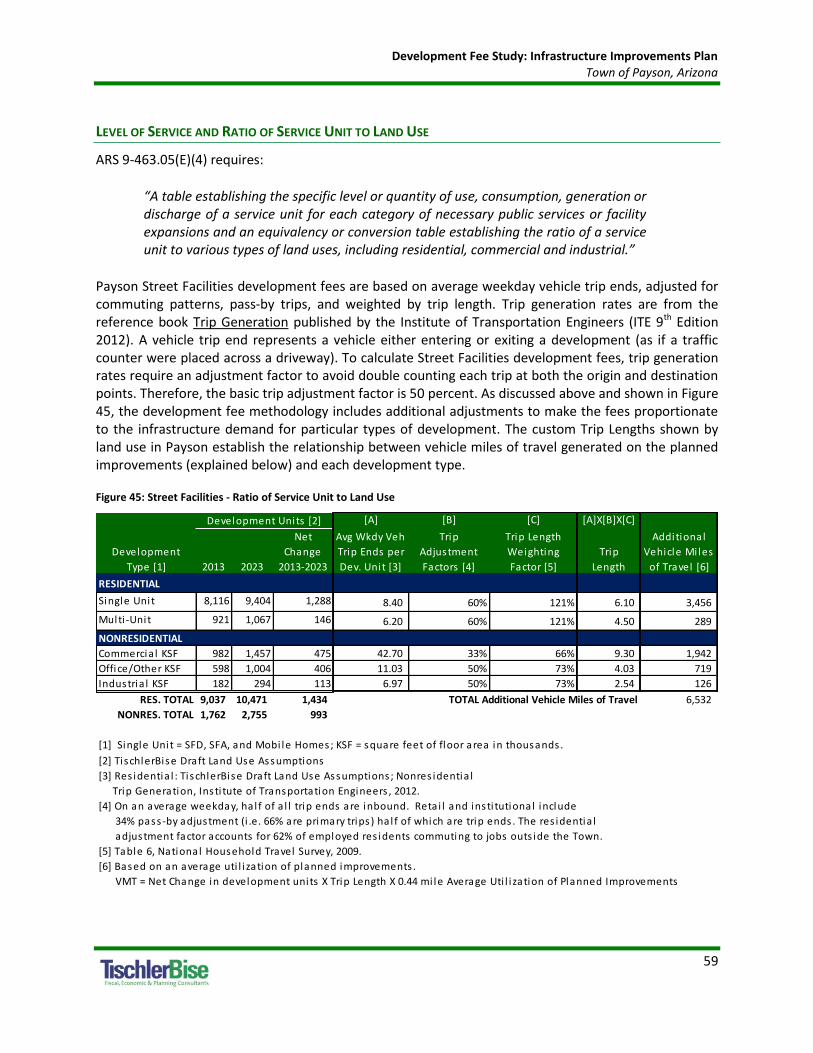
Development Fee Study: Infrastructure Improvements Plan Town of Payson, Arizona
59
LEVEL OF SERVICE AND RATIO OF SERVICE UNIT TO LAND USE
ARS 9-463.05(E)(4) requires:
“A table establishing the specific level or quantity of use, consumption, generation or discharge of a service unit for each category of necessary public services or facility expansions and an equivalency or conversion table establishing the ratio of a service unit to various types of land uses, including residential, commercial and industrial.”
Payson Street Facilities development fees are based on average weekday vehicle trip ends, adjusted for commuting patterns, pass-by trips, and weighted by trip length. Trip generation rates are from the reference book Trip Generation published by the Institute of Transportation Engineers (ITE 9th Edition 2012). A vehicle trip end represents a vehicle either entering or exiting a development (as if a traffic counter were placed across a driveway). To calculate Street Facilities development fees, trip generation rates require an adjustment factor to avoid double counting each trip at both the origin and destination points. Therefore, the basic trip adjustment factor is 50 percent. As discussed above and shown in Figure 45, the development fee methodology includes additional adjustments to make the fees proportionate to the infrastructure demand for particular types of development. The custom Trip Lengths shown by land use in Payson establish the relationship between vehicle miles of travel generated on the planned improvements (explained below) and each development type.
Figure 45: Street Facilities - Ratio of Service Unit to Land Use
[A] [B] [C] [A]X[B]X[C]
Development
Type [1] 2013 2023
Net
Change
2013-2023
Avg Wkdy Veh
Trip Ends per
Dev. Unit [3]
Trip
Adjustment
Factors [4]
Trip Length
Weighting
Factor [5]
Trip
Length
Additional
Vehicle Mi les
of Travel [6]
RESIDENTIAL
Single Unit 8,116 9,404 1,288 8.40 60% 121% 6.10 3,456
Multi -Unit 921 1,067 146 6.20 60% 121% 4.50 289
NONRESIDENTIAL
Commercia l KSF 982 1,457 475 42.70 33% 66% 9.30 1,942
Office/Other KSF 598 1,004 406 11.03 50% 73% 4.03 719
Industria l KSF 182 294 113 6.97 50% 73% 2.54 126
RES. TOTAL 9,037 10,471 1,434 TOTAL Additional Vehicle Miles of Travel 6,532
NONRES. TOTAL 1,762 2,755 993
[1] Single Unit = SFD, SFA, and Mobi le Homes; KSF = square feet of floor area in thousands .
[2] TischlerBise Draft Land Use Assumptions
[3] Res identia l : TischlerBise Draft Land Use Assumptions ; Nonres identia l
Trip Generation, Insti tute of Transportation Engineers , 2012.
[4] On an average weekday, ha l f of a l l trip ends are inbound. Retai l and insti tutional include
34% pass-by adjustment (i .e. 66% are primary trips ) ha l f of which are trip ends . The res identia l
adjustment factor accounts for 62% of employed res idents commuting to jobs outs ide the Town.
[5] Table 6, National Household Travel Survey, 2009.
[6] Based on an average uti l i zation of planned improvements .
VMT = Net Change in development units X Trip Length X 0.44 mi le Average Uti l i zation of Planned Improvements
Development Units [2]
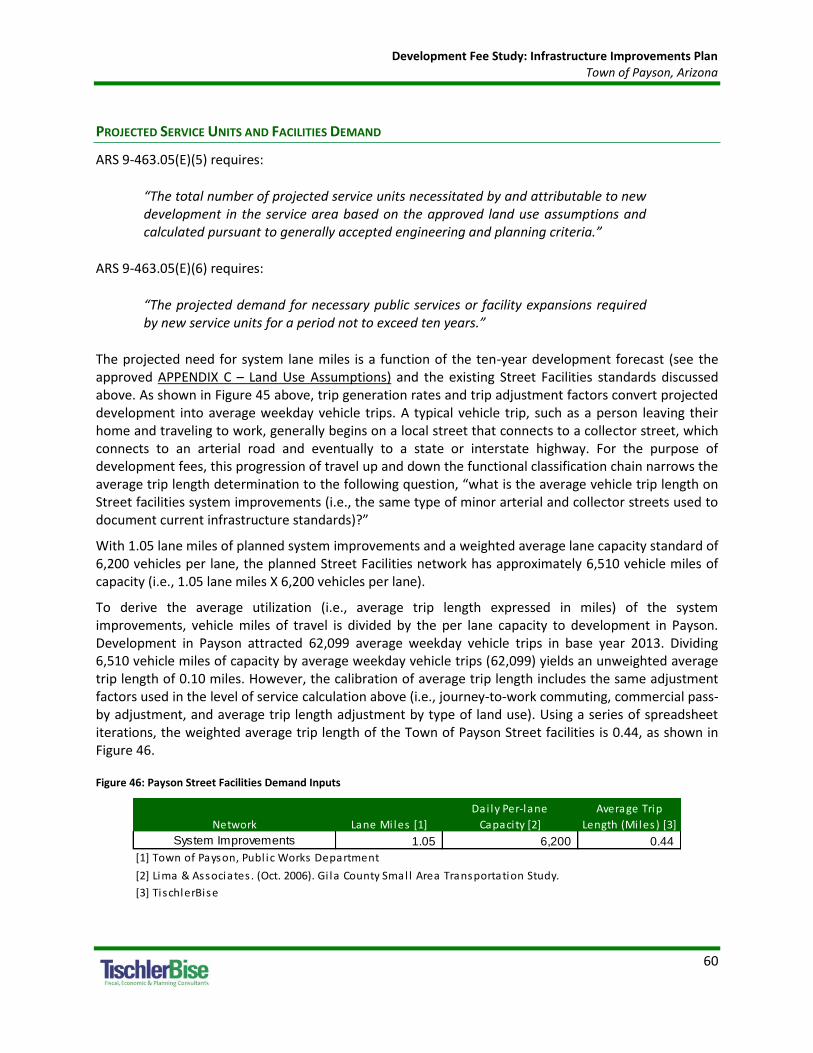
Development Fee Study: Infrastructure Improvements Plan Town of Payson, Arizona
60
PROJECTED SERVICE UNITS AND FACILITIES DEMAND
ARS 9-463.05(E)(5) requires:
“The total number of projected service units necessitated by and attributable to new development in the service area based on the approved land use assumptions and calculated pursuant to generally accepted engineering and planning criteria.”
ARS 9-463.05(E)(6) requires:
“The projected demand for necessary public services or facility expansions required by new service units for a period not to exceed ten years.”
The projected need for system lane miles is a function of the ten-year development forecast (see the approved APPENDIX C – Land Use Assumptions) and the existing Street Facilities standards discussed above. As shown in Figure 45 above, trip generation rates and trip adjustment factors convert projected development into average weekday vehicle trips. A typical vehicle trip, such as a person leaving their home and traveling to work, generally begins on a local street that connects to a collector street, which connects to an arterial road and eventually to a state or interstate highway. For the purpose of development fees, this progression of travel up and down the functional classification chain narrows the average trip length determination to the following question, “what is the average vehicle trip length on Street facilities system improvements (i.e., the same type of minor arterial and collector streets used to document current infrastructure standards)?”
With 1.05 lane miles of planned system improvements and a weighted average lane capacity standard of 6,200 vehicles per lane, the planned Street Facilities network has approximately 6,510 vehicle miles of capacity (i.e., 1.05 lane miles X 6,200 vehicles per lane).
To derive the average utilization (i.e., average trip length expressed in miles) of the system improvements, vehicle miles of travel is divided by the per lane capacity to development in Payson. Development in Payson attracted 62,099 average weekday vehicle trips in base year 2013. Dividing 6,510 vehicle miles of capacity by average weekday vehicle trips (62,099) yields an unweighted average trip length of 0.10 miles. However, the calibration of average trip length includes the same adjustment factors used in the level of service calculation above (i.e., journey-to-work commuting, commercial pass-by adjustment, and average trip length adjustment by type of land use). Using a series of spreadsheet iterations, the weighted average trip length of the Town of Payson Street facilities is 0.44, as shown in Figure 46.
Figure 46: Payson Street Facilities Demand Inputs
Dai ly Per-lane Average Trip
Network Lane Mi les [1] Capacity [2] Length (Mi les) [3]
System Improvements 1.05 6,200 0.44
[1] Town of Payson, Publ ic Works Department
[2] Lima & Associates . (Oct. 2006). Gi la County Smal l Area Transportation Study.
[3] TischlerBise

Development Fee Study: Infrastructure Improvements Plan Town of Payson, Arizona
61
Next, the travel demand model inputs above are used to derive level of service in Vehicle Miles of Travel (VMT). A VMT is a measurement unit equal to one vehicle traveling one mile. In the aggregate, VMT is the product of vehicle trips multiplied by the average trip length.
New development in the next 10 years is projected to generate 6,532 VMT on the planned Street Facilities system improvements.
Figure 47: Street Facilities Needs Analysis6
Source: TischlerBise
6 The needs analysis is shown in rounded figures. However, the analysis itself uses figures carried to their ultimate decimal
places; therefore the sums and products generated in the analysis may not equal the sum or product if the reader replicates the calculation with the factors shown in the memo (due to the rounding of figures shown, not in the analysis.)
Base Yr 1 2 3 4 5 10 10-Year
Year-> 2013 2014 2015 2016 2017 2018 2023 Increase
DEMAND DATA
SFD UNITS 8,116 8,130 8,168 8,230 8,315 8,427 9,404 1,288
MF RES UNITS 921 923 927 934 944 956 1,067 146
COMMERCIAL KSF 982 1,022 1,063 1,106 1,150 1,196 1,457 475
OFFICE KSF 598 630 663 699 736 775 1,004 406
INDUSTRIAL KSF 182 191 200 210 221 231 294 113
SFD TRIPS 40,905 40,975 41,167 41,479 41,908 42,472 47,396
MF/OTHER RES TRIPS 3,426 3,434 3,448 3,474 3,512 3,556 3,969
RES TRIPS 44,331 44,409 44,615 44,954 45,419 46,028 51,365 7,035
COMMERCIAL TRIPS 13,837 14,394 14,972 15,578 16,205 16,853 20,524
OFFICE TRIPS 3,298 3,474 3,659 3,855 4,059 4,274 5,537
INDUSTRIAL TRIPS 633 664 698 732 769 805 1,026
NONRES TRIPS 17,768 18,533 19,328 20,164 21,032 21,932 27,086 9,318
TOTAL TRIPS 62,099 62,942 63,943 65,118 66,451 67,960 78,452 16,353
Town Total VMT 28,883 29,153 29,500 29,930 30,438 31,031 35,415 6,532
Town Lane Mi les 4.66 4.70 4.76 4.83 4.91 5.01 5.71
Annual Lane Mi le Increase 0.04 0.06 0.07 0.08 0.10 0.17
Cumulative Lane Mi les 0.04 0.10 0.17 0.25 0.35 1.05 1.05

Development Fee Study: Infrastructure Improvements Plan Town of Payson, Arizona
62
DESCRIPTION OF NECESSARY EXPANSIONS AND COSTS ATTRIBUTABLE TO DEVELOPMENT
ARS 9-463.05(E)(3) requires:
“A description of all or the parts of the necessary public services or facility expansions and their costs necessitated by and attributable to development in the service area based on the approved land use assumptions, including a forecast of the costs of infrastructure, improvements, real property, financing, engineering and architectural services, which shall be prepared by qualified professionals licensed in this state, as applicable.”
The Town of Payson has identified three new road segments, which once constructed will improve circulation on the system. The minor arterial new road segment will connect S. McLane Road to Green Valley Parkway. The Mud Springs Road Phase II new collector road segment includes the construction of an intersection at State Route 260 to connect the Mud Spring Road segments north and south of the highway. The Rumsey Drive new collector road segment will connect Rumsey Drive to N. McLane Road.
There exists a current need to connect S. McLane Road to Green Valley Highway just west of the southern gateway into Town. Completing this connection will provide an alternate access route to areas identified for growth on the west side of Town. There is an existing need to provide alternate routes to the north-south running Beeline Highway. Based on traffic counts taken in 2009, and the capacity of the lane miles once constructed, 93 percent of the project cost to construct the new S. McLane Road segment is attributable to providing capacity to future development.
The Rumsey Drive project will finish the extension of Rumsey Drive west from Beeline Highway to N. McLane Road just east of Rumsey Park. Like the S. McLane project, there is an existing need to provide an additional connection between N. McLane and Beeline Highway along the developed core of Town. Based on an average of traffic counts taken in 2009 at both ends of the Rumsey Park project, and the capacity of the lane miles once constructed, 39 percent of the total project cost of $560,000 is attributable to new development in the future.
There currently exist only two direct crossings over State Road 260 to connect the northeast and southeast sections of Town. The Town of Payson General Plan Update 2014-2024 identifies the State Route 260 area as a critical growth area with the capacity to absorb higher density mixed-use development. As this development occurs, it will become necessary to add an additional intersection across State Route 260. Based on an average of traffic counts taken in 2009 on both the north and south segments of Mud Springs Road, and the capacity of the lane miles once constructed, 77 percent of the total project cost of $1,300,000 is attributable to new development in the future.

Development Fee Study: Infrastructure Improvements Plan Town of Payson, Arizona
63
As shown in the demand model additional system lane miles are needed to accommodate a net increase in VMT of 6,532. To calculate a capital cost per net new VMT between 2013 and 2023 the growth portion ($1,528,925) of the planned system improvements costs is divided by the net new VMT (6,532), resulting in a cost per Vehicle Mile of Travel of $234.06.
Figure 48: Necessary Street Facilities Expansions
MAXIMUM SUPPORTABLE STREET FACILITIES DEVELOPMENT FEES
Figure 49 on the following page provides a summary of the input variables (described in the chapter sections above) used to calculate the net capital cost per vehicle mile of travel for Street Facilities.
Street Facilities IIP and Development Fee Study
Included in the Street Facilities per service unit (i.e., VMT) cost is the cost to prepare the Street Facilities IIP and Development Fee Study. See Appendix A – Cost of Professional Services for the detailed calculations.
Revenue Credit
Included in the maximum supportable development fees is a Revenue Credit of 2 percent. The unadjusted Street Facilities development fees per development unit would generate more revenue over the next ten years, based on the approved APPENDIX C – Land Use Assumptions, than the identified growth-related planned expenditures of $1,540,295 (planned Street Facilities expansion plus the IIP and Development Fee Study cost). To ensure that no more fee revenue is collected than the Town plans to spend, the potential gross cost per service unit is reduced by the revenue credit to calculate the net capital cost per service unit. Based on the gross capital costs per service unit, the projected development fee revenue would equal $1,562,617. The formula to calculate the Revenue Credit is as follows: ($1,562,617 – $1,540,295)/$1,562,617 = 2 percent (rounded).
Class i fication Project
Added
Lanes
Added
Lane Mi les
Total
Project Cost [1]
Growth
Share
Cost Attributable
to Growth
Minor Arteria l S. McLane Road 2 0.25 $333,000 93% $308,691
Col lector Mud Springs Road Phase II 2 0.38 $1,300,000 77% $1,003,208
Col lector Rumsey Drive 2 0.42 $560,000 39% $217,026
TOTAL 1.05 $2,193,000 $1,528,925
Increase in VMT 2013-2023 6,532
Cost per VMT $234.06
[1] Town of Payson, Publ ic Works

Development Fee Study: Infrastructure Improvements Plan Town of Payson, Arizona
64
Figure 49: Maximum Supportable Street Facilities Development Fees
Per Vehicle
Street Level Of Service and Capital Costs Mile Traveled
Cost per VMT $234.06
IIP and Development Fee Study $5.29
GROSS CAPITAL COST $239.35
Revenue Credit 2% ($3.59)
NET CAPITAL COST $235.76
VMT =
Residential Schedule [A] [B] [C] [D] [A] x [B] x [C] x [D] Development Fee per Housing Unit
Weekday Trip Rate Avg Miles Trip Length Proposed
Vehicle Adjustment per Veh. Trip Weighting Streets Current Increase
Number of Trip Ends Factors on System Factors VMT Impact Fee Fee [1] (Decrease)
Unit Type Bedrooms per unit (Per Housing Unit)
2+ Unit Al l Sizes 6.20 60% 0.44 121% 1.98 $466 $1,235 ($769)
Single Unit 0-3 7.59 60% 0.44 121% 2.42 $571 $1,235 ($664)
Single Unit 4+ 11.02 60% 0.44 121% 3.52 $830 $1,235 ($405)
Single Unit Average 8.40 60% 0.44 122% 2.71 $637 $1,235 ($598)
Nonresidential Schedule Development Fee per Square Foot of Floor Area
(Per 1,000 sq. ft.) per 1,000 sf (Per Square Foot of Floor Area)
Commercia l 42.70 33% 0.44 66% 4.09 $0.96 $0.00 $0.96
Office/Insti tutional 11.03 50% 0.44 73% 1.77 $0.41 $0.00 $0.41
Industria l/Flex 6.97 50% 0.44 73% 1.12 $0.26 $0.00 $0.26
[1] Town of Payson does not currently assess Street Faci l i ties development fees on nonres identia l development

Development Fee Study: Infrastructure Improvements Plan Town of Payson, Arizona
65
FORECAST OF REVENUES
Appendix B – Forecast of Revenues Other Than Development Fees contains a forecast of revenues other than development fees required by Arizona’s enabling legislation.
Street Facilities Cash Flow
The cash flow summary shown below provides an indication of the 10-year projected necessary expenditures to meet the demand for growth-related Street Facilities, and projected development fee revenue based on the approved APPENDIX C – Land Use Assumptions. To the extent the rate of development either accelerates or slows down, there will be a corresponding change in the development fee revenue and capital costs.
Figure 50: Street Facilities Cash Flow Summary
Ten-Year Growth-Related Costs for Street Facilities
Street Facilities 1,528,925$
IIP and Development Fee Study 11,370$
TOTAL 1,540,295$
Single Unit 2+ Units Commercial Office Industrial
$637 $466 $0.96 $0.41 $0.26
Year
Base 2013 8,116 921 982 598 182
Year 1 2014 8,130 923 1,022 630 191
Year 2 2015 8,168 927 1,063 663 200
Year 3 2016 8,230 934 1,106 699 210
Year 4 2017 8,315 944 1,150 736 221
Year 5 2018 8,427 956 1,196 775 231
Year 6 2019 8,564 972 1,244 817 242
Year 7 2020 8,729 991 1,294 860 254
Year 8 2021 8,922 1,013 1,346 905 267
Year 9 2022 9,147 1,038 1,400 953 280
Year 10 2023 9,404 1,067 1,457 1,004 294
Ten-Yr Increase 1,288 146 475 406 113
Projected Fees (Rounded)=> $820,456 $68,036 $455,520 $166,438 $29,315
Total Projected Revenues $1,539,765
Cumulative Net Surplus/(Defici t) ($530)
Per Square Foot of Floor Area
Housing Units Added Square Feet Added (1,000)
per Housing Unit

Development Fee Study: Infrastructure Improvements Plan Town of Payson, Arizona
66
[PAGE INTENTIONALLY LEFT BLANK]
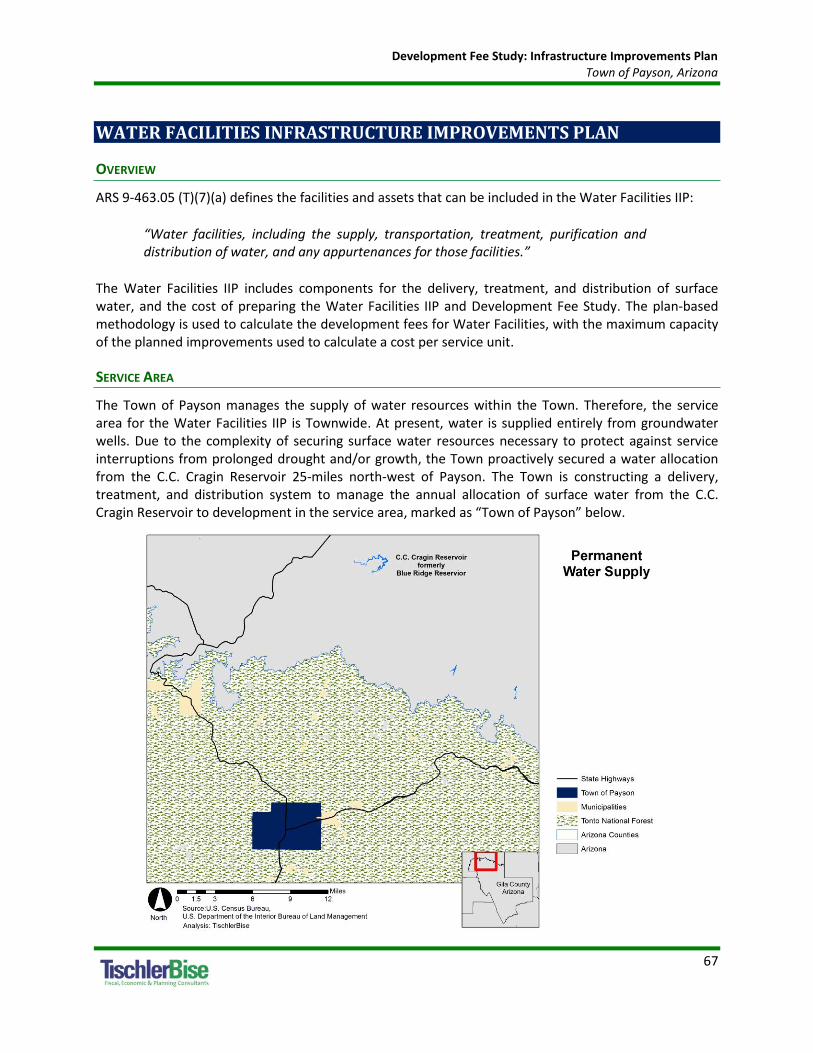
Development Fee Study: Infrastructure Improvements Plan Town of Payson, Arizona
67
WATER FACILITIES INFRASTRUCTURE IMPROVEMENTS PLAN
OVERVIEW
ARS 9-463.05 (T)(7)(a) defines the facilities and assets that can be included in the Water Facilities IIP:
“Water facilities, including the supply, transportation, treatment, purification and distribution of water, and any appurtenances for those facilities.”
The Water Facilities IIP includes components for the delivery, treatment, and distribution of surface water, and the cost of preparing the Water Facilities IIP and Development Fee Study. The plan-based methodology is used to calculate the development fees for Water Facilities, with the maximum capacity of the planned improvements used to calculate a cost per service unit.
SERVICE AREA
The Town of Payson manages the supply of water resources within the Town. Therefore, the service area for the Water Facilities IIP is Townwide. At present, water is supplied entirely from groundwater wells. Due to the complexity of securing surface water resources necessary to protect against service interruptions from prolonged drought and/or growth, the Town proactively secured a water allocation from the C.C. Cragin Reservoir 25-miles north-west of Payson. The Town is constructing a delivery, treatment, and distribution system to manage the annual allocation of surface water from the C.C. Cragin Reservoir to development in the service area, marked as “Town of Payson” below.
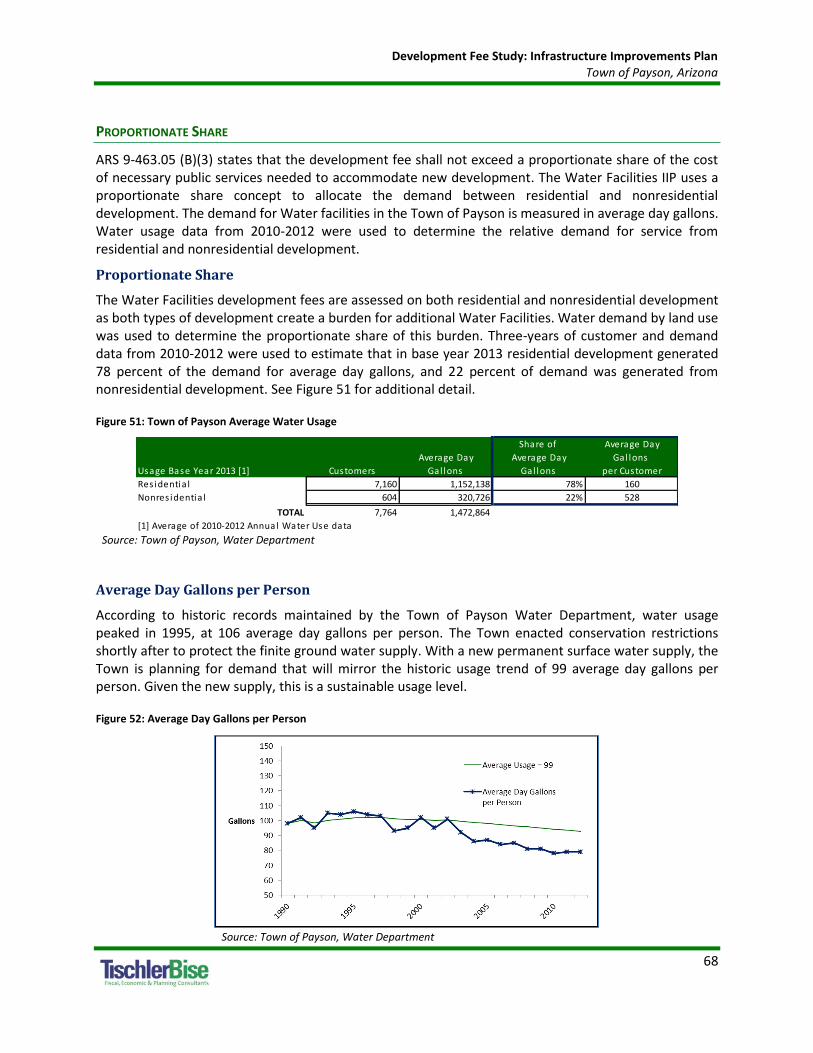
Development Fee Study: Infrastructure Improvements Plan Town of Payson, Arizona
68
PROPORTIONATE SHARE
ARS 9-463.05 (B)(3) states that the development fee shall not exceed a proportionate share of the cost of necessary public services needed to accommodate new development. The Water Facilities IIP uses a proportionate share concept to allocate the demand between residential and nonresidential development. The demand for Water facilities in the Town of Payson is measured in average day gallons. Water usage data from 2010-2012 were used to determine the relative demand for service from residential and nonresidential development.
Proportionate Share
The Water Facilities development fees are assessed on both residential and nonresidential development as both types of development create a burden for additional Water Facilities. Water demand by land use was used to determine the proportionate share of this burden. Three-years of customer and demand data from 2010-2012 were used to estimate that in base year 2013 residential development generated 78 percent of the demand for average day gallons, and 22 percent of demand was generated from nonresidential development. See Figure 51 for additional detail.
Figure 51: Town of Payson Average Water Usage
Source: Town of Payson, Water Department
Average Day Gallons per Person
According to historic records maintained by the Town of Payson Water Department, water usage peaked in 1995, at 106 average day gallons per person. The Town enacted conservation restrictions shortly after to protect the finite ground water supply. With a new permanent surface water supply, the Town is planning for demand that will mirror the historic usage trend of 99 average day gallons per person. Given the new supply, this is a sustainable usage level.
Figure 52: Average Day Gallons per Person
Source: Town of Payson, Water Department
Share of Average Day
Average Day Average Day Gal lons
Usage Base Year 2013 [1] Customers Gal lons Gal lons per Customer
Res identia l 7,160 1,152,138 78% 160
Nonres identia l 604 320,726 22% 528
TOTAL 7,764 1,472,864
[1] Average of 2010-2012 Annual Water Use data

Development Fee Study: Infrastructure Improvements Plan Town of Payson, Arizona
69
Service units
The Water Facilities cost are allocated to both residential and nonresidential development based on the average day gallons discussed above. For residential development, fees are calculated based on average day gallons per person, and then converted to an appropriate amount by type of housing unit based on Persons per Household (PPH) factors.
According to the approved APPENDIX C – Land Use Assumptions, the average single residential unit in Payson has 2.35 PPH. As shown in Figure 53, this equates to an average water usage of 232 average day gallons per single residential unit. Therefore, proportionate share for Water facilities is expressed in average day gallons where water usage for an equivalent residential unit = 232 gallons.
For nonresidential development fees, the Town of Payson Water Department reviewed historic water usage data by nonresidential land use to provide Equivalent Residential Units by proxy types. See nonresidential Equivalent Residential Units in the figure below.
Figure 53: Water Facilities Service units
Source: Town of Payson, Water Department; TischlerBise
Average Residential Unit
Average Day Gallons
per Person
99
Land Use Convers ion Unit
Average Day Gal lons
per Development
Unit
Equiva lent
Res identia l
Units
Res identia l Units Persons per Household [1]
Single Unit - Avg 2.35 232 1.00
Single Unit - 0-3 Bdrms 2.07 204 0.88
Single Unit - 4+ Bdrms 3.26 321 1.38
Multi -Unit - Avg 1.77 175 0.75
Multi -Unit - 0-2 Bdrms 1.48 146 0.63
Multi -Unit - 3+ Bdrms 2.69 265 1.14
Nonres identia l [2] Square Feet
Retai l 1,000 31 0.13
Office 1,000 77 0.33
Industria l - Manufacturing 1,000 23 0.10
Industria l - Warehouse Space 1,000 12 0.05
Nonres identia l [2] Specia l i zed
Hotel/Motel per Room 104 0.45
Nurs ing Home per Bed 77 0.33
[1] Development Fee Land Use Assumptions
[2] Nonres identia l Equiva lent Res identia l Units ca lculated and provided by
Town of Payson Water Department

Development Fee Study: Infrastructure Improvements Plan Town of Payson, Arizona
70
IIP FOR WATER FACILITIES
For each necessary public service that is the subject of a development fee, ARS 9-463.05(E) requires the IIP to include seven elements. The sections below detail each of the required components of the Water Facilities IIP. (A forecast of new revenues generated by sources other than development fees can be found in Appendix B – Forecast of Revenues Other Than Development Fees.)
ANALYSIS OF COSTS, CAPACITY, AND USAGE OF EXISTING PUBLIC SERVICES
ARS 9-463.05(E)(1) requires:
“A description of the existing necessary public services in the service area and the costs to upgrade, update, improve, expand, correct or replace those necessary public services to meet existing needs and usage and stricter safety, efficiency, environmental or regulatory standards, which shall be prepared by qualified professionals licensed in this state, as applicable.”
ARS 9-463.05(E)(2) requires:
“An analysis of the total capacity, the level of current usage and commitments for usage of capacity of the existing necessary public services, which shall be prepared by qualified professionals licensed in this state, as applicable.”
The Town of Payson is halfway through a multi-year phased project to more than double the supply of safe clean potable water available to development in Town. The new system will include a delivery pipeline, treatment facility, and distribution mains, and will have sufficient capacity for the full 3,000 annual acre feet (AAF) of surface water. Based on the planned costs to expand the Water Facilities capacity to deliver, treat, and distribute an average of 2.7 million gallons a day (MGD), which is equivalent to the annual allotment of 3,000 AAF, a plan-based methodology is used to calculate the cost per service unit for the Water Facilities development fees.
Figure 54: Annual Acre Feet (AAF) Equivalency
Annual
Acre Feet [1]
Average Day
Gal lons
Mil l ion Gal lons
per Day (MGD)
Planned Capacity Improvement 3,000 2,676,398 2.7
[1] 1 Acre Foot = 325,851 gal lons
Service Units
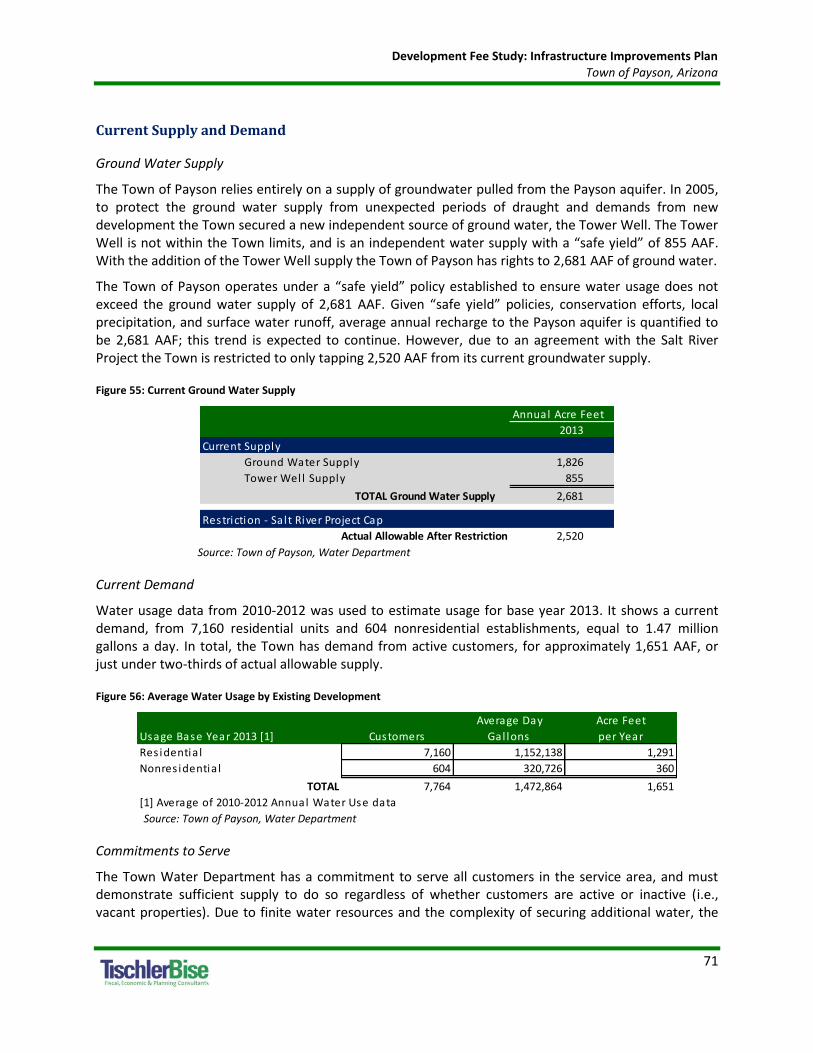
Development Fee Study: Infrastructure Improvements Plan Town of Payson, Arizona
71
Current Supply and Demand
Ground Water Supply
The Town of Payson relies entirely on a supply of groundwater pulled from the Payson aquifer. In 2005, to protect the ground water supply from unexpected periods of draught and demands from new development the Town secured a new independent source of ground water, the Tower Well. The Tower Well is not within the Town limits, and is an independent water supply with a “safe yield” of 855 AAF. With the addition of the Tower Well supply the Town of Payson has rights to 2,681 AAF of ground water.
The Town of Payson operates under a “safe yield” policy established to ensure water usage does not exceed the ground water supply of 2,681 AAF. Given “safe yield” policies, conservation efforts, local precipitation, and surface water runoff, average annual recharge to the Payson aquifer is quantified to be 2,681 AAF; this trend is expected to continue. However, due to an agreement with the Salt River Project the Town is restricted to only tapping 2,520 AAF from its current groundwater supply.
Figure 55: Current Ground Water Supply
Source: Town of Payson, Water Department
Current Demand
Water usage data from 2010-2012 was used to estimate usage for base year 2013. It shows a current demand, from 7,160 residential units and 604 nonresidential establishments, equal to 1.47 million gallons a day. In total, the Town has demand from active customers, for approximately 1,651 AAF, or just under two-thirds of actual allowable supply.
Figure 56: Average Water Usage by Existing Development
Source: Town of Payson, Water Department
Commitments to Serve
The Town Water Department has a commitment to serve all customers in the service area, and must demonstrate sufficient supply to do so regardless of whether customers are active or inactive (i.e., vacant properties). Due to finite water resources and the complexity of securing additional water, the
Annual Acre Feet
2013
Current Supply
Ground Water Supply 1,826
Tower Wel l Supply 855
TOTAL Ground Water Supply 2,681
Restriction - Sa l t River Project Cap
Actual Allowable After Restriction 2,520
Average Day Acre Feet
Usage Base Year 2013 [1] Customers Gal lons per Year
Res identia l 7,160 1,152,138 1,291
Nonres identia l 604 320,726 360
TOTAL 7,764 1,472,864 1,651
[1] Average of 2010-2012 Annual Water Use data

Development Fee Study: Infrastructure Improvements Plan Town of Payson, Arizona
72
Town of Payson must demonstrate a sufficient supply of water to serve the maximum possible demand from existing development.
Based on the APPENDIX C – Land Use Assumptions the Town currently has 9,037 housing units, of which 7,160 are active residential water customers. This equates to a vacancy of 20 percent, which is consistent with recent census estimates for residential vacancy. The remaining 1,877 housing units are assumed vacant, but the Water Department must demonstrate the ability to serve all of them. This equates to a potential demand for an additional 300,953 average gallons per day, based on average usage of 160 gallons per day per residential customer, or 337 AAF.
As shown in the APPENDIX C – Land Use Assumptions the Town of Payson has a base year employment of 4,370 and 1,761,629 square feet of active nonresidential development, based on an average of 403 square feet per employee. In comparison, the Gila County Assessor’s office maintains a database of parcels in the service area. The 2012 Gila County parcel data suggest there is as much as 3,479,000 square feet of nonresidential development in the Town. This equates to a very high commercial vacancy of almost 50 percent.
Water usage by nonresidential development varies based on size of establishment, industry of activity, and employment. Due to these variables, the method used to related demand for water resources by nonresidential development is to calculate a ratio of jobs in Payson (4,370) to nonresidential customers (604). The ratio of 7.236 jobs per customer is used to convert nonresidential square footage to nonresidential establishments. The total number of nonresidential establishments is calculated as follows: 3,479,000 square feet / 403 jobs per SF / 7.236 ratio = 1,193 nonresidential establishments that the Water Department must be able to serve. At present, there are 604 active nonresidential customers, which equates to 589 vacant nonresidential establishments. This equates to a potential demand for an additional 310,835 average gallons per day, based on usage of 528 average day gallons per nonresidential customer, or 348 AAF.
As shown below, the Town of Payson Water Department must demonstrate the ability to provide an additional 686 AAF beyond current usage demand for 1,651 AAF.
Figure 57: Commitments to Serve Active and Vacant Development7
Source: Town of Payson, Water Department; Land Use Assumptions; Gila County Assessor
7 The figures shown are rounded. However, the analysis itself uses figures carried to their ultimate decimal places; therefore the
sums and products generated in the analysis may not equal the sum or product if the reader replicates the calculation with the factors shown here (due to the rounding of figures shown, not in the analysis.)
Development Average Day Annual
Land Use Units Gal lons Acre Feet
Res identia l 160
Total Hous ing Units 9,037
Active Res identia l Customer Units 7,160
Total Inactive Res identia l Customers 1,877 300,953 337
Nonres identia l 528
Total Nonres identia l Establ ishments 1,193
Active Nonres identia l Customer Establ ishments 604
Total Inactive Nonres identia l Customers 589 310,835 348
Commitment to Serve
TOTAL Potential Demand from Inactive Customers 2,466 611,788 686

Development Fee Study: Infrastructure Improvements Plan Town of Payson, Arizona
73
Current Water Portfolio
In 2005, as part of the funding arrangement to secure the Tower Well the Town committed 182 AAF to a separate legal entity developing the well.8 Therefore, based on current allowable supply and allotment, usage, and commitments to serve, the Town has a base year surplus of one AAF of available water. Due to the complexity of securing rights to surface water resources, and the capital investments necessary to deliver and distribute surface water to future water customers, the Town began a multi-year capital investment program to deliver, treat and distribute the 3,000 AAF allotment from the C.C. Cragin Reservoir in advance of demonstrated demand. Access to a permanent surface water supply will ensure an adequate supply to serve growth, and to protect the Payson aquifer in times of draught.
Figure 58: Town of Payson Water Resource - Current Supply and Demand
Planned Water Facilities System
As stated in the Town of Payson General Plan Update 2014-2024, “Payson proactively sought to secure a permanent water supply, to ensure an abundant resource to serve anticipated growth in demand. The Town secured a water allocation from the C.C. Cragin Reservoir as an additional and permanent water supply for the Town. The reservoir…is in Coconino County about 25 miles north of Payson atop the Mogollon Rim…The Town of Payson is contracted to tap up to 3,000 AAF.” This allotment will be in addition to the ground water supply of 2,681 AAF. Adjusting for actual allowable ground water supply, the total accessible water portfolio for the Town of Payson will be 5,520 AAF, or approximately 4.9 million gallons per day.
The Water Facilities necessary public service investments are being made in a three-phased project to deliver, treat, and distribute the surface water. Phase I is to construct a trailrace connection for a raw water pipeline to connect with an existing Salt River Project pipeline running from the C.C. Cragin Reservoir to the Verde River, and with the Phase II investments. Phase II includes a hydroelectric generator, raw water tank, and a water treatment plant. Phase III of the planned investments, includes building an aquifer storage recovery well to store treated water for use during an annual three-month
8 The commitment, subject to certain time and place restrictions, act as prepaid water development fees.
Annual Acre Feet
2013
Current Supply
Ground Water Supply 1,826
Tower Wel l Supply 855
TOTAL Ground Water Supply 2,681
Restriction - Sa l t River Project Cap
Actual Allowable After Restriction 2,520
Current Usage and Commitments
Demand from Exis ting Development (1,651)
Commitment to Exis ting Vacant Development (686)
Tower Wel l Commitment (182)
TOTAL Existing System Surplus/(Deficit) 1
Source: Town of Payson, Water Department
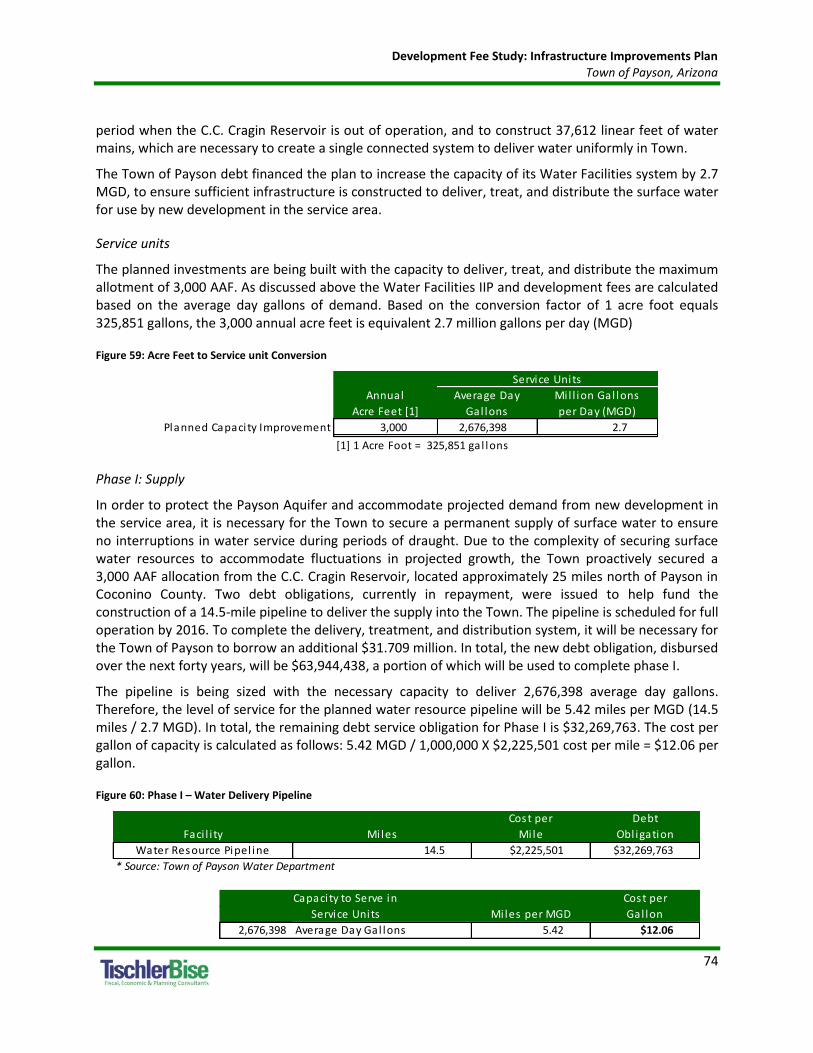
Development Fee Study: Infrastructure Improvements Plan Town of Payson, Arizona
74
period when the C.C. Cragin Reservoir is out of operation, and to construct 37,612 linear feet of water mains, which are necessary to create a single connected system to deliver water uniformly in Town.
The Town of Payson debt financed the plan to increase the capacity of its Water Facilities system by 2.7 MGD, to ensure sufficient infrastructure is constructed to deliver, treat, and distribute the surface water for use by new development in the service area.
Service units
The planned investments are being built with the capacity to deliver, treat, and distribute the maximum allotment of 3,000 AAF. As discussed above the Water Facilities IIP and development fees are calculated based on the average day gallons of demand. Based on the conversion factor of 1 acre foot equals 325,851 gallons, the 3,000 annual acre feet is equivalent 2.7 million gallons per day (MGD)
Figure 59: Acre Feet to Service unit Conversion
Phase I: Supply
In order to protect the Payson Aquifer and accommodate projected demand from new development in the service area, it is necessary for the Town to secure a permanent supply of surface water to ensure no interruptions in water service during periods of draught. Due to the complexity of securing surface water resources to accommodate fluctuations in projected growth, the Town proactively secured a 3,000 AAF allocation from the C.C. Cragin Reservoir, located approximately 25 miles north of Payson in Coconino County. Two debt obligations, currently in repayment, were issued to help fund the construction of a 14.5-mile pipeline to deliver the supply into the Town. The pipeline is scheduled for full operation by 2016. To complete the delivery, treatment, and distribution system, it will be necessary for the Town of Payson to borrow an additional $31.709 million. In total, the new debt obligation, disbursed over the next forty years, will be $63,944,438, a portion of which will be used to complete phase I.
The pipeline is being sized with the necessary capacity to deliver 2,676,398 average day gallons. Therefore, the level of service for the planned water resource pipeline will be 5.42 miles per MGD (14.5 miles / 2.7 MGD). In total, the remaining debt service obligation for Phase I is $32,269,763. The cost per gallon of capacity is calculated as follows: 5.42 MGD / 1,000,000 X $2,225,501 cost per mile = $12.06 per gallon.
Figure 60: Phase I – Water Delivery Pipeline
Annual
Acre Feet [1]
Average Day
Gal lons
Mil l ion Gal lons
per Day (MGD)
Planned Capacity Improvement 3,000 2,676,398 2.7
[1] 1 Acre Foot = 325,851 gal lons
Service Units
Cost per Debt
Mi les Mi le Obl igation
14.5 $2,225,501 $32,269,763
* Source: Town of Payson Water Department
Cost per
Mi les per MGD Gal lon
2,676,398 Average Day Gal lons 5.42 $12.06
Faci l i ty
Water Resource Pipel ine
Capacity to Serve in
Service Units
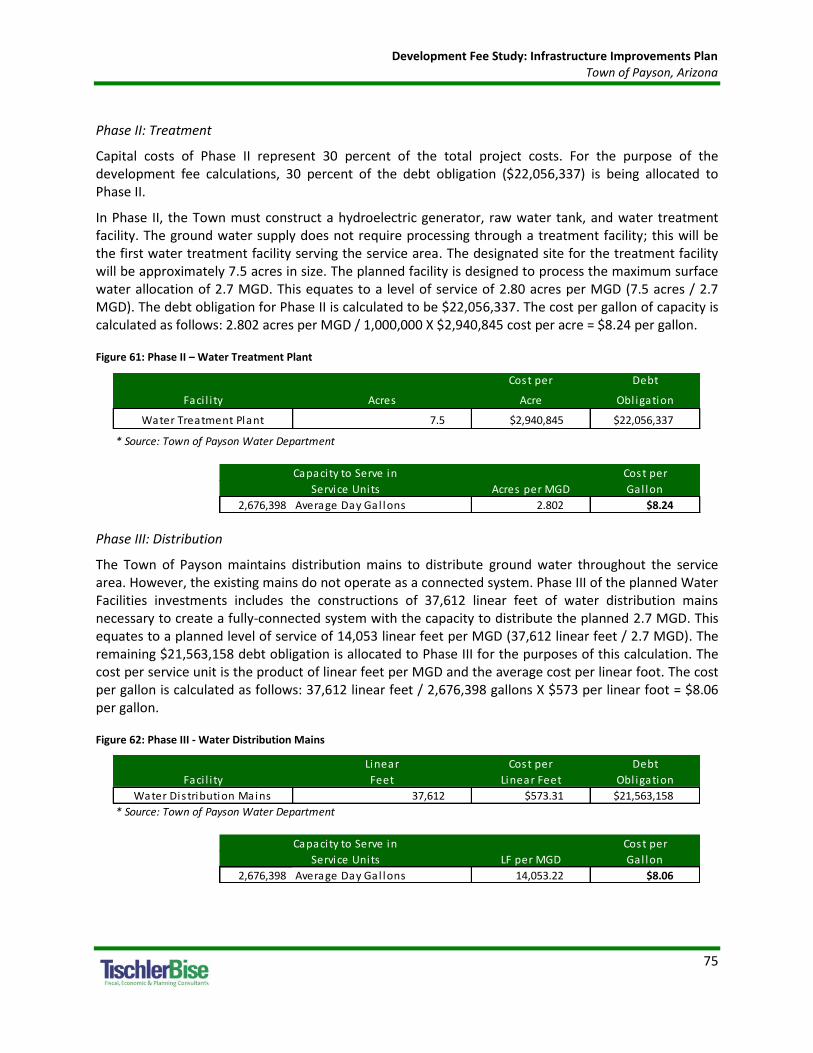
Development Fee Study: Infrastructure Improvements Plan Town of Payson, Arizona
75
Phase II: Treatment
Capital costs of Phase II represent 30 percent of the total project costs. For the purpose of the development fee calculations, 30 percent of the debt obligation ($22,056,337) is being allocated to Phase II.
In Phase II, the Town must construct a hydroelectric generator, raw water tank, and water treatment facility. The ground water supply does not require processing through a treatment facility; this will be the first water treatment facility serving the service area. The designated site for the treatment facility will be approximately 7.5 acres in size. The planned facility is designed to process the maximum surface water allocation of 2.7 MGD. This equates to a level of service of 2.80 acres per MGD (7.5 acres / 2.7 MGD). The debt obligation for Phase II is calculated to be $22,056,337. The cost per gallon of capacity is calculated as follows: 2.802 acres per MGD / 1,000,000 X $2,940,845 cost per acre = $8.24 per gallon.
Figure 61: Phase II – Water Treatment Plant
Phase III: Distribution
The Town of Payson maintains distribution mains to distribute ground water throughout the service area. However, the existing mains do not operate as a connected system. Phase III of the planned Water Facilities investments includes the constructions of 37,612 linear feet of water distribution mains necessary to create a fully-connected system with the capacity to distribute the planned 2.7 MGD. This equates to a planned level of service of 14,053 linear feet per MGD (37,612 linear feet / 2.7 MGD). The remaining $21,563,158 debt obligation is allocated to Phase III for the purposes of this calculation. The cost per service unit is the product of linear feet per MGD and the average cost per linear foot. The cost per gallon is calculated as follows: 37,612 linear feet / 2,676,398 gallons X $573 per linear foot = $8.06 per gallon.
Figure 62: Phase III - Water Distribution Mains
Cost per Debt
Acres Acre Obl igation
7.5 $2,940,845 $22,056,337
* Source: Town of Payson Water Department
Cost per
Acres per MGD Gal lon
2,676,398 Average Day Gal lons 2.802 $8.24
Faci l i ty
Water Treatment Plant
Capacity to Serve in
Service Units
Linear Cost per Debt
Feet Linear Feet Obl igation
37,612 $573.31 $21,563,158
* Source: Town of Payson Water Department
Cost per
LF per MGD Gal lon
2,676,398 Average Day Gal lons 14,053.22 $8.06
Capacity to Serve in
Service Units
Faci l i ty
Water Distribution Mains

Development Fee Study: Infrastructure Improvements Plan Town of Payson, Arizona
76
Excluded Costs
Development fees in Payson exclude costs to upgrade, update, improve, expand, correct or replace those necessary public services to meet existing needs and usage and stricter safety, efficiency, environmental or regulatory standards. The Town of Payson Capital Improvement Plan includes the cost of these excluded items.
Current Use and Available Capacity
As discussed above, the current Water Facilities are fully utilized and there is no available capacity for future development. The Planned Water Facilities investments discussed above will provide a secure water supply to accommodate future growth in the service area.
LEVEL OF SERVICE AND RATIO OF SERVICE UNIT TO LAND USE
ARS 9-463.05(E)(4) requires:
“A table establishing the specific level or quantity of use, consumption, generation or discharge of a service unit for each category of necessary public services or facility expansions and an equivalency or conversion table establishing the ratio of a service unit to various types of land uses, including residential, commercial and industrial.”
The figure below displays the ratio of gallons per unit per day to various types of land uses. Residential Water Facilities development fees are assessed on a per unit basis, based on average day gallons per housing unit. Nonresidential Water Facilities development fees are assessed based on the Equivalent Residential Unit factors provided by the Town of Payson water department, and shown below.
Figure 63: Water Facilities - Ratio of Service Unit to Land Use
Source: Town of Payson, Water Department; TischlerBise
Land Use Convers ion Unit
Average Day Gal lons
per Development
Unit
Equiva lent
Res identia l
Units
Res identia l Units Persons per Household [1]
Single Unit - Avg 2.35 232 1.00
Single Unit - 0-3 Bdrms 2.07 204 0.88
Single Unit - 4+ Bdrms 3.26 321 1.38
Multi -Unit - Avg 1.77 175 0.75
Multi -Unit - 0-2 Bdrms 1.48 146 0.63
Multi -Unit - 3+ Bdrms 2.69 265 1.14
Nonres identia l [2] Square Feet
Retai l 1,000 31 0.13
Office 1,000 77 0.33
Industria l - Manufacturing 1,000 23 0.10
Industria l - Warehouse Space 1,000 12 0.05
Nonres identia l [2] Specia l i zed
Hotel/Motel per Room 104 0.45
Nurs ing Home per Bed 77 0.33
[1] Development Fee Land Use Assumptions
[2] Nonres identia l Equiva lent Res identia l Units ca lculated and provided by
Town of Payson Water Department

Development Fee Study: Infrastructure Improvements Plan Town of Payson, Arizona
77
PROJECTED SERVICE UNITS AND FACILITIES DEMAND
ARS 9-463.05(E)(5) requires:
“The total number of projected service units necessitated by and attributable to new development in the service area based on the approved land use assumptions and calculated pursuant to generally accepted engineering and planning criteria.”
ARS 9-463.05(E)(6) requires:
“The projected demand for necessary public services or facility expansions required by new service units for a period not to exceed ten years.”
Residential Demand
TischlerBise used historic customer data provided by the Town to determine a base year 2013 active residential customers (7,160) of the Water Department accounted for 79 percent of all housing units (9,037) in the Town of Payson. Residential projections show the Town adding 3,105 units between 2013 and 2033. The assumptions used to project residential demand for water resources is that the current average usage per customer per day of 160 gallons would remain constant, and that all new units built in the Town of Payson would require access to the water system. Therefore, current residential customers (7,160) plus added units (3,105) will equal almost 85 percent of total Payson housing units (12,142) projected in 2033.
Assuming average daily usage remains constant, new residential development over the next twenty years will generate demand for approximately an additional 0.49 MGD.
Figure 64: Residential Demand for Water Facilities
Source: Town of Payson Water Department, TischlerBise
Avg Dai ly Gal lons per Res identia l 160 Five-Year Increments ===>
Customers share of Total Housing Units 79% 81% 82% 82% 83% 84% 82% 83% 85% Cumulative Avg. Ann.
Base Yr 1 2 3 4 5 10 15 20 Increase Increase
2013 2014 2015 2016 2017 2018 2023 2028 2033 2013-2033 2013-2033
Town of Payson, Arizona
SUMMARY OF DEMAND PROJECTIONS
TOTAL HOUSING UNITS 9,037 9,053 9,095 9,164 9,259 9,383 10,471 11,275 12,142 3,105 155
Water Customers and Demand
RESIDENTIAL DEVELOPMENT
Residential Customers TOTAL 7,160 7,290 7,423 7,558 7,695 7,835 8,573 9,381 10,265 3,105 155
Gallons per Day (millions) TOTAL 1.15 1.17 1.19 1.21 1.23 1.26 1.37 1.50 1.65 0.49 0.02
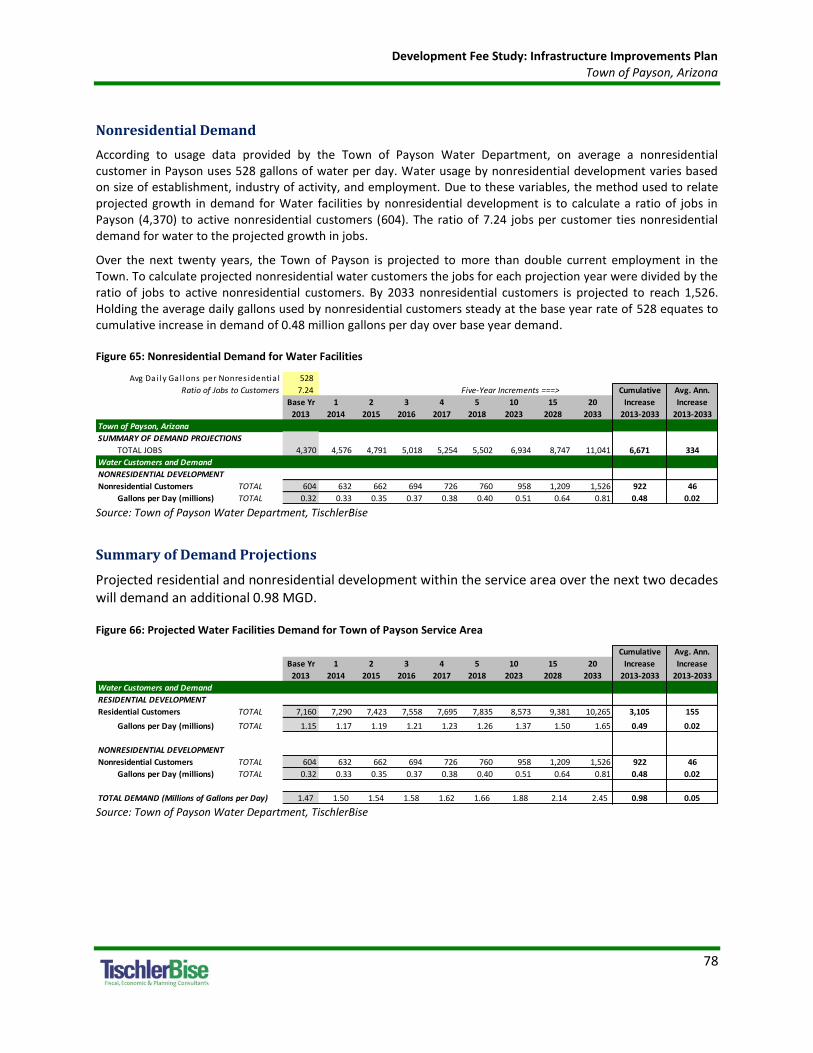
Development Fee Study: Infrastructure Improvements Plan Town of Payson, Arizona
78
Nonresidential Demand
According to usage data provided by the Town of Payson Water Department, on average a nonresidential customer in Payson uses 528 gallons of water per day. Water usage by nonresidential development varies based on size of establishment, industry of activity, and employment. Due to these variables, the method used to relate projected growth in demand for Water facilities by nonresidential development is to calculate a ratio of jobs in Payson (4,370) to active nonresidential customers (604). The ratio of 7.24 jobs per customer ties nonresidential demand for water to the projected growth in jobs.
Over the next twenty years, the Town of Payson is projected to more than double current employment in the Town. To calculate projected nonresidential water customers the jobs for each projection year were divided by the ratio of jobs to active nonresidential customers. By 2033 nonresidential customers is projected to reach 1,526. Holding the average daily gallons used by nonresidential customers steady at the base year rate of 528 equates to cumulative increase in demand of 0.48 million gallons per day over base year demand.
Figure 65: Nonresidential Demand for Water Facilities
Source: Town of Payson Water Department, TischlerBise
Summary of Demand Projections
Projected residential and nonresidential development within the service area over the next two decades will demand an additional 0.98 MGD.
Figure 66: Projected Water Facilities Demand for Town of Payson Service Area
Source: Town of Payson Water Department, TischlerBise
Avg Dai ly Gal lons per Nonres identia l 528
Ratio of Jobs to Customers 7.24 Five-Year Increments ===> Cumulative Avg. Ann.
Base Yr 1 2 3 4 5 10 15 20 Increase Increase
2013 2014 2015 2016 2017 2018 2023 2028 2033 2013-2033 2013-2033
Town of Payson, Arizona
SUMMARY OF DEMAND PROJECTIONS
TOTAL JOBS 4,370 4,576 4,791 5,018 5,254 5,502 6,934 8,747 11,041 6,671 334
Water Customers and Demand
NONRESIDENTIAL DEVELOPMENT
Nonresidential Customers TOTAL 604 632 662 694 726 760 958 1,209 1,526 922 46
Gallons per Day (millions) TOTAL 0.32 0.33 0.35 0.37 0.38 0.40 0.51 0.64 0.81 0.48 0.02
Cumulative Avg. Ann.
Base Yr 1 2 3 4 5 10 15 20 Increase Increase
2013 2014 2015 2016 2017 2018 2023 2028 2033 2013-2033 2013-2033
Water Customers and Demand
RESIDENTIAL DEVELOPMENT
Residential Customers TOTAL 7,160 7,290 7,423 7,558 7,695 7,835 8,573 9,381 10,265 3,105 155
Gallons per Day (millions) TOTAL 1.15 1.17 1.19 1.21 1.23 1.26 1.37 1.50 1.65 0.49 0.02
NONRESIDENTIAL DEVELOPMENT
Nonresidential Customers TOTAL 604 632 662 694 726 760 958 1,209 1,526 922 46
Gallons per Day (millions) TOTAL 0.32 0.33 0.35 0.37 0.38 0.40 0.51 0.64 0.81 0.48 0.02
TOTAL DEMAND (Millions of Gallons per Day) 1.47 1.50 1.54 1.58 1.62 1.66 1.88 2.14 2.45 0.98 0.05
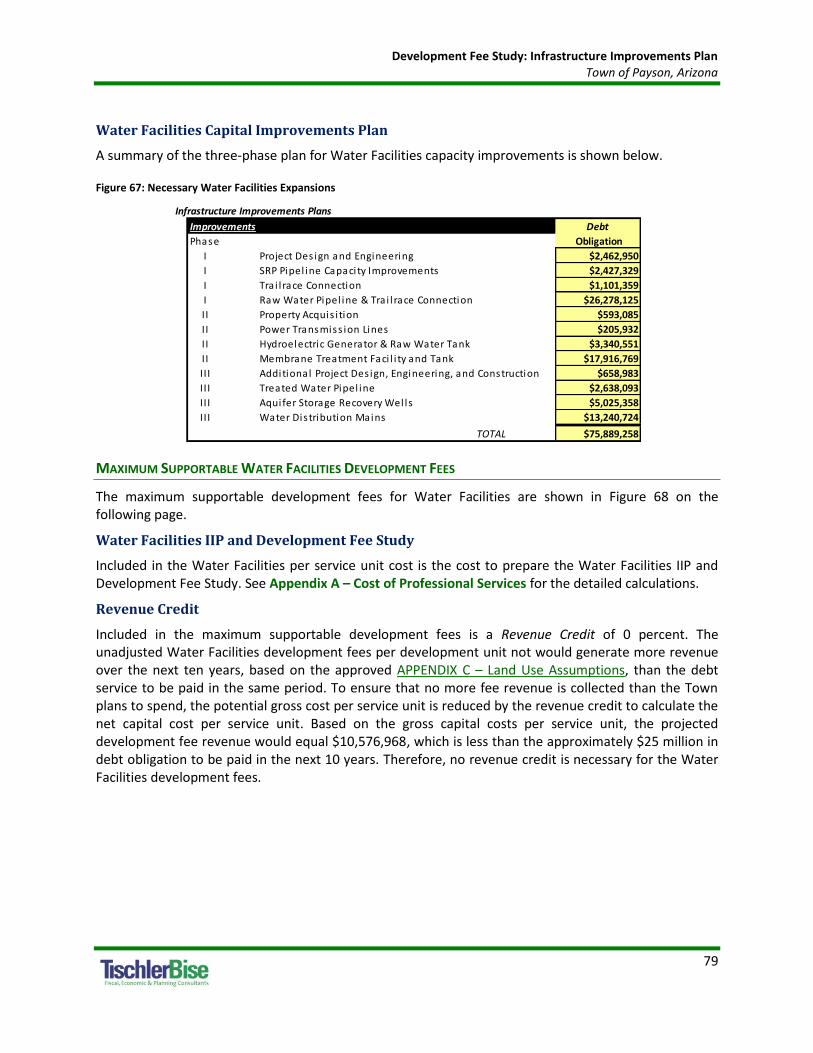
Development Fee Study: Infrastructure Improvements Plan Town of Payson, Arizona
79
Water Facilities Capital Improvements Plan
A summary of the three-phase plan for Water Facilities capacity improvements is shown below.
Figure 67: Necessary Water Facilities Expansions
MAXIMUM SUPPORTABLE WATER FACILITIES DEVELOPMENT FEES
The maximum supportable development fees for Water Facilities are shown in Figure 68 on the following page.
Water Facilities IIP and Development Fee Study
Included in the Water Facilities per service unit cost is the cost to prepare the Water Facilities IIP and Development Fee Study. See Appendix A – Cost of Professional Services for the detailed calculations.
Revenue Credit
Included in the maximum supportable development fees is a Revenue Credit of 0 percent. The unadjusted Water Facilities development fees per development unit not would generate more revenue over the next ten years, based on the approved APPENDIX C – Land Use Assumptions, than the debt service to be paid in the same period. To ensure that no more fee revenue is collected than the Town plans to spend, the potential gross cost per service unit is reduced by the revenue credit to calculate the net capital cost per service unit. Based on the gross capital costs per service unit, the projected development fee revenue would equal $10,576,968, which is less than the approximately $25 million in debt obligation to be paid in the next 10 years. Therefore, no revenue credit is necessary for the Water Facilities development fees.
Infrastructure Improvements Plans
Improvements Debt
Phase Obligation
I Project Des ign and Engineering $2,462,950
I SRP Pipel ine Capacity Improvements $2,427,329
I Tra i l race Connection $1,101,359
I Raw Water Pipel ine & Tra i l race Connection $26,278,125
I I Property Acquis i tion $593,085
I I Power Transmiss ion Lines $205,932
I I Hydroelectric Generator & Raw Water Tank $3,340,551
I I Membrane Treatment Faci l i ty and Tank $17,916,769
I I I Additional Project Des ign, Engineering, and Construction $658,983
I I I Treated Water Pipel ine $2,638,093
I I I Aqui fer Storage Recovery Wel ls $5,025,358
I I I Water Dis tribution Mains $13,240,724
TOTAL $75,889,258

Development Fee Study: Infrastructure Improvements Plan Town of Payson, Arizona
80
Figure 68: Maximum Supportable Water Facilities Development Fees
Water Level Of Service and Capital Costs per Gallon
Phase I - Water Del ivery Pipel ine $12.06
Phase II - Water Treatment Plant $8.24
Phase III - Water Dis tribution Mains $8.06
IIP and Development Fee Study $0.06
GROSS CAPITAL COST $28.42
Revenue Credit 0% ($0.00)
NET CAPITAL COST $28.42
232
Residential Schedule Development Fee per Housing Unit
Equivalent Average Proposed
Residential Day Water Current Increase
Number of Unit [1] Gallons Fee Fee (Decrease)
Unit Type Bedrooms (Per Housing Unit)
0-2 0.63 146 $4,153 $4,769 ($616)
3+ 1.14 264 $7,515 $8,630 ($1,115)
Average 0.75 174 $4,944 $5,678 ($734)
0-3 0.88 204 $5,801 $6,662 ($861)
4+ 1.38 320 $9,097 $10,447 ($1,350)
Average 1.00 232 $6,592 $7,570 ($978)
Development Fee per Square Foot
Equivalent Average Proposed
Nonresidential Schedule Residential Day Water Current Increase
Unit [2] Gallons Fee Fee (Decrease)
(Per Square Foot)
Commercia l 0.13 31 $0.88 $1.01 ($0.13)
Office/Insti tutional 0.33 77 $2.20 $2.52 ($0.33)
Industria l - Manufacturing 0.10 23 $0.66 $0.76 ($0.10)
Industria l - Warehouse Space 0.05 12 $0.33 $0.38 ($0.05)
Unit (Per Unit)
Hotel/Motel per Room 0.45 104 $2,955 $3,393 ($438)
Nurs ing Home per Bed 0.33 77 $2,188 $2,512 ($324)
[2] Nonres identia l Equiva lent Res identia l Units ca lculated and provided by
Town of Payson Water Department
[1] Res identia l ERUs based on Persons per Household recommended multipl iers sca led to make the average va lue by type of
hous ing for AZ PUMA 0800 match the average va lue for Payson, derived from 2011 American Community Survey data,
with persons adjusted to the Townwide average of 2.35 persons per s ingle fami ly household.
per Unit
ERU Gallons per Average Day
per unit
Single Unit
Single Unit
Single Unit
per 1,000 Square Feet
Multi Unit
Multi Unit
Multi Unit
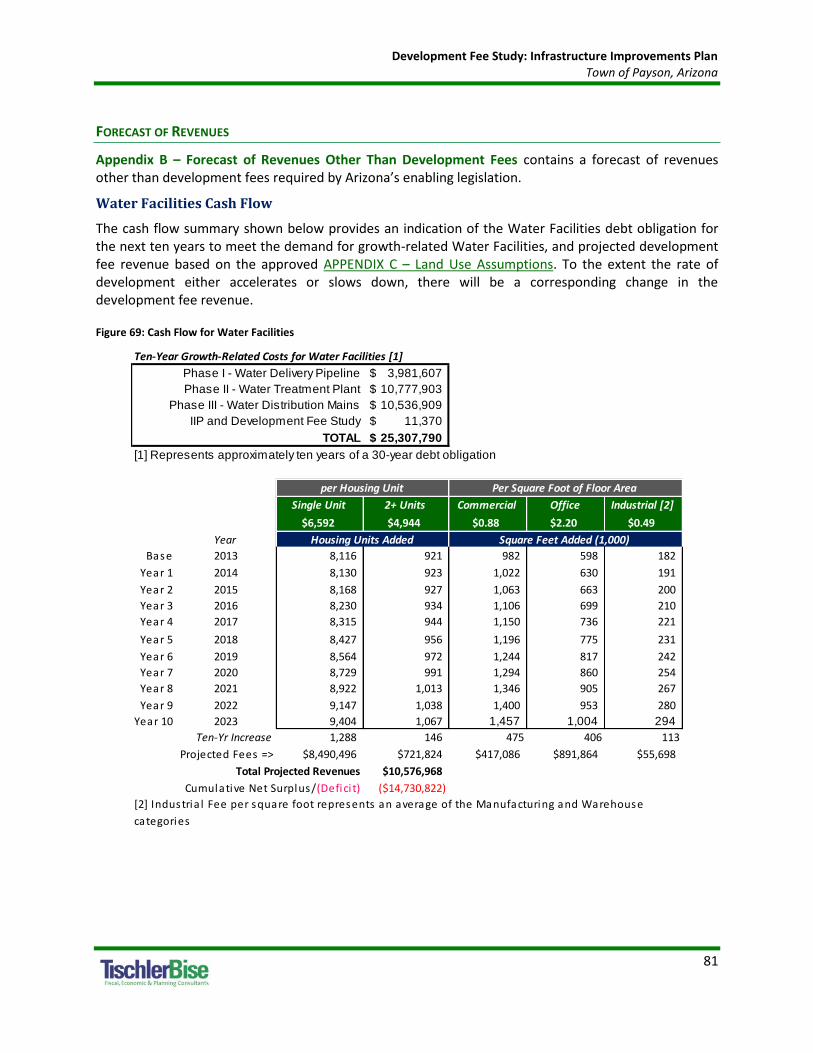
Development Fee Study: Infrastructure Improvements Plan Town of Payson, Arizona
81
FORECAST OF REVENUES
Appendix B – Forecast of Revenues Other Than Development Fees contains a forecast of revenues other than development fees required by Arizona’s enabling legislation.
Water Facilities Cash Flow
The cash flow summary shown below provides an indication of the Water Facilities debt obligation for the next ten years to meet the demand for growth-related Water Facilities, and projected development fee revenue based on the approved APPENDIX C – Land Use Assumptions. To the extent the rate of development either accelerates or slows down, there will be a corresponding change in the development fee revenue.
Figure 69: Cash Flow for Water Facilities
Ten-Year Growth-Related Costs for Water Facilities [1]
Phase I - Water Delivery Pipeline 3,981,607$
Phase II - Water Treatment Plant 10,777,903$
Phase III - Water Distribution Mains 10,536,909$
IIP and Development Fee Study 11,370$
TOTAL 25,307,790$
[1] Represents approximately ten years of a 30-year debt obligation
Single Unit 2+ Units Commercial Office Industrial [2]
$6,592 $4,944 $0.88 $2.20 $0.49
Year
Base 2013 8,116 921 982 598 182
Year 1 2014 8,130 923 1,022 630 191
Year 2 2015 8,168 927 1,063 663 200
Year 3 2016 8,230 934 1,106 699 210
Year 4 2017 8,315 944 1,150 736 221
Year 5 2018 8,427 956 1,196 775 231
Year 6 2019 8,564 972 1,244 817 242
Year 7 2020 8,729 991 1,294 860 254
Year 8 2021 8,922 1,013 1,346 905 267
Year 9 2022 9,147 1,038 1,400 953 280
Year 10 2023 9,404 1,067 1,457 1,004 294
Ten-Yr Increase 1,288 146 475 406 113
Projected Fees => $8,490,496 $721,824 $417,086 $891,864 $55,698
Total Projected Revenues $10,576,968
Cumulative Net Surplus/(Defici t) ($14,730,822)
[2] Industria l Fee per square foot represents an average of the Manufacturing and Warehouse
categories
per Housing Unit Per Square Foot of Floor Area
Housing Units Added Square Feet Added (1,000)

Development Fee Study: Infrastructure Improvements Plan Town of Payson, Arizona
82
[PAGE INTENTIONALLY LEFT BLANK]

Development Fee Study: Infrastructure Improvements Plan Town of Payson, Arizona
83
APPENDIX A - COST OF PROFESSIONAL SERVICES
The table below displays each section of the IIP and Development Fee Study. Each necessary public service is allocated to residential and nonresidential development based on the proportionate share factors listed. Then, it displays the change in service units between base year 2013 and year 5 (2018). Because development fees are updated at least every five years, the cost is assessed against the service units for only 5 years. Cost per service unit by land use is shown for each necessary public service.
Figure A70: IIP and Development Fee Study
Parks and Recreation Development Fee Report Street Development Fee Report
Land Use Residential Nonresidential Land Use
Proportionate Share 92% 8% Proportionate Share
Consultant Fee $7,580 $3,487 $303 Consultant Fee $11,370
Service Unit Person Jobs Service Unit
Increase in Service Units 2013-2018 556 1,132 Increase in Service Units 2013-2018
Cost per Service Unit $6.27 $0.27 Cost per Service Unit
Fire Development Fee Report Water Development Fee Report
Land Use Residential Nonresidential Land Use
Proportionate Share 79% 21% Proportionate Share
Consultant Fee $3,790 $2,994 $796 Consultant Fee $11,370
Service Unit Person Vehicle Trip Service Unit
Increase in Service Units 2013-2018 556 4,164 Increase in Service Units 2013-2018
Cost per Service Unit $5.39 $0.19 Cost per Service Unit
Police Development Fee Report
Land Use Residential Nonresidential
Proportionate Share 90% 10%
Consultant Fee $3,790 $3,411 $379
Service Unit Person Vehicle Trip
Increase in Service Units 2013-2018 556 4,164
Cost per Service Unit $6.13 $0.09
$5.29
100%
Residential & Nonresidential
$11,370
Vehicle Mile of Travel
2,148
$0.06
Residential & Nonresidential
100%
$11,370
Average Day Gallons
184,634

Development Fee Study: Infrastructure Improvements Plan Town of Payson, Arizona
Appendix B - 84
APPENDIX B - FORECAST OF REVENUES OTHER THAN DEVELOPMENT FEES
ARS 9-463.05(E)(7) requires:
“A forecast of revenues generated by new service units other than development fees, which shall include estimated state-shared revenue, highway users revenue, federal revenue, ad valorem property taxes, construction contracting or similar excise taxes and the capital recovery portion of utility fees attributable to development based on the approved land use assumptions, and a plan to include these contributions in determining the extent of the burden imposed by the development as required in subsection B, paragraph 12 of this section.”
ARS 9-463.05(B)(12) states,
“The municipality shall forecast the contribution to be made in the future in cash or by taxes, fees, assessments or other sources of revenue derived from the property owner towards the capital costs of the necessary public service covered by the development fee and shall include these contributions in determining the extent of the burden imposed by the development. Beginning August 1, 2014, for purposes of calculating the required offset to development fees pursuant to this subsection, if a municipality imposes a construction contracting or similar excise tax rate in excess of the percentage amount of the transaction privilege tax rate imposed on the majority of other transaction privilege tax classifications, the entire excess portion of the construction contracting or similar excise tax shall be treated as a contribution to the capital costs of necessary public services provided to development for which development fees are assessed, unless the excess portion was already taken into account for such purpose pursuant to this subsection.”

Development Fee Study: Infrastructure Improvements Plan Town of Payson, Arizona
Appendix B - 85
REVENUE PROJECTIONS
Payson does not have a higher than normal construction excise tax rate; therefore, the required offset described above is not applicable. The required forecast of non-development fee revenue that might be used for growth related capital costs is shown below. General Fund revenues are highlighted in light purple. Highway User Taxes are highlighted in light grey, and Net Available Water Revenue is highlighted in blue. The forecast of revenues was derived from a linear regression analysis. Historical revenue data, obtained from Town’s Comprehensive Annual Fiscal Reports, were correlated to the growth in population and jobs (as reported in the approved Land Use Assumptions.) Projected population plus jobs is the independent variable that drives each revenue forecast.
Figure B71: Five-Year Revenue Projections
General Fund
Figure B72 gives the impression that General Fund revenues are expected to remain flat or increase only slightly over the next five years. When nominal dollars are converted to constant 2013 dollars, to account for inflation, and then divided by persons plus jobs in Payson, to “normalize” the amounts for population and jobs growth, the projected revenue is shown to remain flat. In other words, there is no General Fund fiscal surplus available for growth-related capital improvements. The projected increase in General Fund revenue will be offset by an increase in operating, maintenance, and replacement capital costs.
FY13-14 FY14-15 FY15-16 FY16-17 FY17-18
Sales Tax $5,935,511 $5,995,574 $6,070,011 $6,159,591 $6,263,546
State Shared Sales Taxes $1,217,879 $1,212,768 $1,206,432 $1,198,809 $1,189,961
State Shared Income Taxes $1,370,150 $1,493,714 $1,646,849 $1,831,140 $2,045,001
Vehicle License Tax (State) $827,087 $839,689 $855,308 $874,104 $895,916
Franchise Fees $352,882 $351,313 $349,367 $347,026 $344,309
FY13-14 FY14-15 FY15-16 FY16-17 FY17-18
Highway User Taxes (HURF) $1,328,584 $1,359,392 $1,397,573 $1,443,523 $1,496,845
FY13-14 FY14-15 FY15-16 FY16-17 FY17-18
Net Available Water Revenue $1,087,176 $966,074 $815,991 $635,374 $425,775

Development Fee Study: Infrastructure Improvements Plan Town of Payson, Arizona
Appendix B - 86
Figure B72: General Fund Revenues by Source

Development Fee Study: Infrastructure Improvements Plan Town of Payson, Arizona
Appendix B - 87
Highway User Tax (HURF)
The methodology described above was also applied to Highway User Tax revenue, with the results displayed in Figure B73. The “gas tax” funding pattern in Payson has shown a gradual decline. Essentially, Payson has increasing traffic but decreasing dollars that are used for maintenance of existing Street facilities. The projected increase in HURF revenue will be offset by an increase in operating, maintenance, and replacement capital costs. Therefore, the Town is not projecting a surplus of HURF revenue available for growth-related capital improvements.
Figure B73: Highway User Tax Revenues

Development Fee Study: Infrastructure Improvements Plan Town of Payson, Arizona
Appendix B - 88
Water Utility Revenue
In contrast to the General Fund and Highway User Tax analysis shown above, net available water revenue is projected to drop noticeable in the next five years. Therefore, the Town is not projecting a surplus of Water revenue available for growth-related capital improvements.
Figure B74: Water Utility Revenue

Development Fee Study: Land Use Assumptions Town of Payson, Arizona
Appendix C - 89
APPENDIX C – LAND USE ASSUMPTIONS
The Town of Payson engaged TischlerBise to update its development fees for several categories of necessary public services pursuant to Arizona Revised Statutes 9-463.05. Municipalities in Arizona may assess development fees to offset infrastructure costs to a municipality associated with providing necessary public services to a development within the Town boundary. Arizona Revised Statutes (ARS) 9-463.05 (T)(6) requires the preparation of a Land Use Assumptions document, which shows:
“projections of changes in land uses, densities, intensities and population for a specified service area over a period of at least ten years and pursuant to the General Plan of the municipality.”
TischlerBise prepared current demographic estimates and future development projections for both residential and nonresidential development that will be used in the Infrastructure Improvement Plan (IIP) and calculation of the development fees. Current demographic data estimates for FY12-13 are used in calculating levels-of-service (LOS) provided to existing development in the Town of Payson. Although long-range projections are necessary for planning infrastructure systems, a shorter time frame of five to ten years is critical for the development fee analysis. Due to the slow recovery from the Great Recession, TischlerBise used slower growth rates for the next five years.
Arizona’s Development Fee Act requires fees to be updated at least every five years and limits the IIP to a maximum of ten years. Therefore, the use of a very long-range “build-out” analysis is no longer acceptable for deriving development fees in Arizona municipalities.
Service Area
The Town of Payson is located adjacent to the Tonto Apache Reservation. The 383-acre reservation is home to the Tonto Apache Tribe, a sovereign nation. The Tonto Apache Reservation is not subject to the Town’s land use or other regulations. Town of Payson development fees are not assessed on new development within the Reservation, therefore the service area for the Town of Payson Development Fee Study is the Town of Payson without the Tonto Apache Reservation. The Land Use Assumptions do not include residential and nonresidential inventory on the Tonto Apache Reservation.
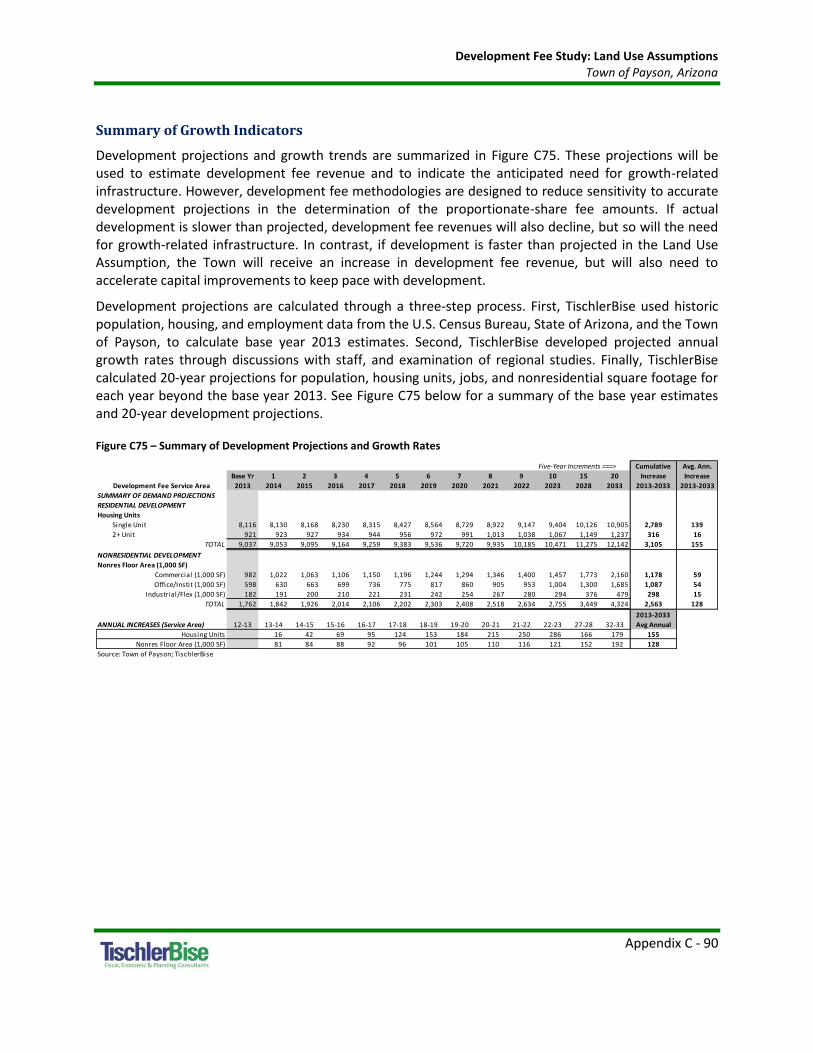
Development Fee Study: Land Use Assumptions Town of Payson, Arizona
Appendix C - 90
Summary of Growth Indicators
Development projections and growth trends are summarized in Figure C75. These projections will be used to estimate development fee revenue and to indicate the anticipated need for growth-related infrastructure. However, development fee methodologies are designed to reduce sensitivity to accurate development projections in the determination of the proportionate-share fee amounts. If actual development is slower than projected, development fee revenues will also decline, but so will the need for growth-related infrastructure. In contrast, if development is faster than projected in the Land Use Assumption, the Town will receive an increase in development fee revenue, but will also need to accelerate capital improvements to keep pace with development.
Development projections are calculated through a three-step process. First, TischlerBise used historic population, housing, and employment data from the U.S. Census Bureau, State of Arizona, and the Town of Payson, to calculate base year 2013 estimates. Second, TischlerBise developed projected annual growth rates through discussions with staff, and examination of regional studies. Finally, TischlerBise calculated 20-year projections for population, housing units, jobs, and nonresidential square footage for each year beyond the base year 2013. See Figure C75 below for a summary of the base year estimates and 20-year development projections.
Figure C75 – Summary of Development Projections and Growth Rates
Five-Year Increments ===> Cumulative Avg. Ann.
Base Yr 1 2 3 4 5 6 7 8 9 10 15 20 Increase Increase
2013 2014 2015 2016 2017 2018 2019 2020 2021 2022 2023 2028 2033 2013-2033 2013-2033
SUMMARY OF DEMAND PROJECTIONS
RESIDENTIAL DEVELOPMENT
Housing Units
Single Unit 8,116 8,130 8,168 8,230 8,315 8,427 8,564 8,729 8,922 9,147 9,404 10,126 10,905 2,789 139
2+ Unit 921 923 927 934 944 956 972 991 1,013 1,038 1,067 1,149 1,237 316 16
TOTAL 9,037 9,053 9,095 9,164 9,259 9,383 9,536 9,720 9,935 10,185 10,471 11,275 12,142 3,105 155
NONRESIDENTIAL DEVELOPMENT
Nonres Floor Area (1,000 SF)
Commercial (1,000 SF) 982 1,022 1,063 1,106 1,150 1,196 1,244 1,294 1,346 1,400 1,457 1,773 2,160 1,178 59
Office/Instit (1,000 SF) 598 630 663 699 736 775 817 860 905 953 1,004 1,300 1,685 1,087 54
Industrial/Flex (1,000 SF) 182 191 200 210 221 231 242 254 267 280 294 376 479 298 15
TOTAL 1,762 1,842 1,926 2,014 2,106 2,202 2,303 2,408 2,518 2,634 2,755 3,449 4,324 2,563 128
2013-2033
ANNUAL INCREASES (Service Area) 12-13 13-14 14-15 15-16 16-17 17-18 18-19 19-20 20-21 21-22 22-23 27-28 32-33 Avg Annual
Housing Units 16 42 69 95 124 153 184 215 250 286 166 179 155
Nonres Floor Area (1,000 SF) 81 84 88 92 96 101 105 110 116 121 152 192 128
Source: Town of Payson; TischlerBise
Development Fee Service Area
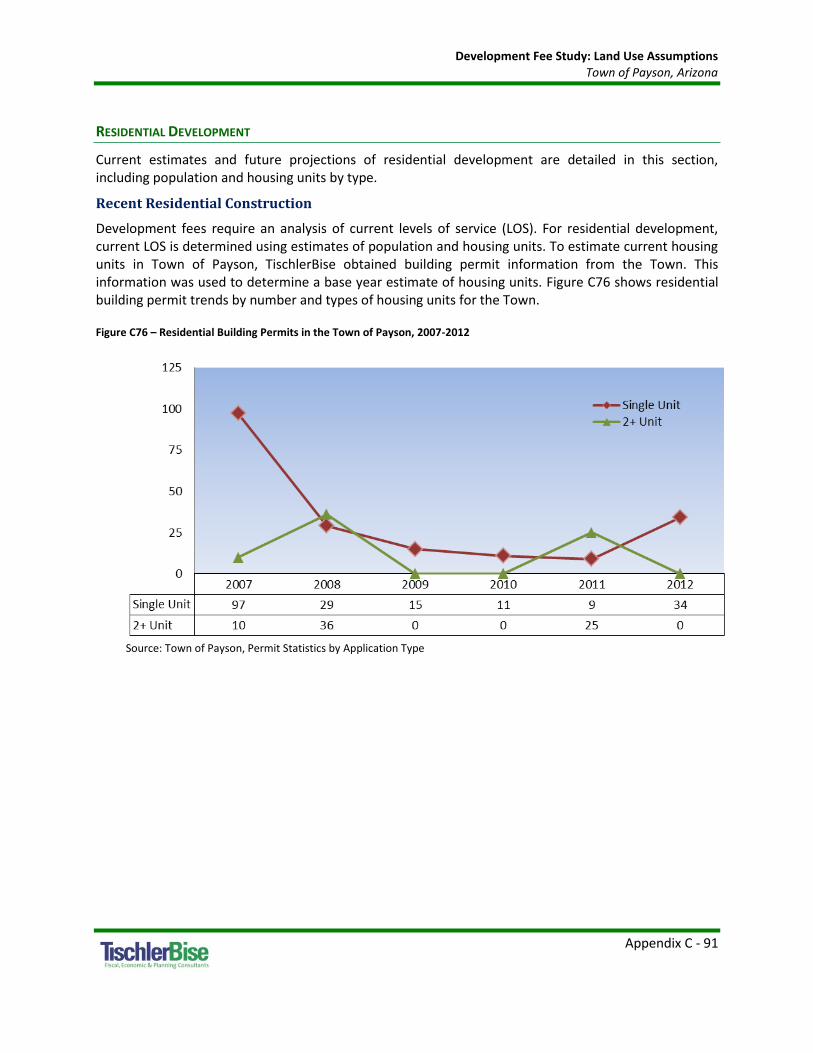
Development Fee Study: Land Use Assumptions Town of Payson, Arizona
Appendix C - 91
RESIDENTIAL DEVELOPMENT
Current estimates and future projections of residential development are detailed in this section, including population and housing units by type.
Recent Residential Construction
Development fees require an analysis of current levels of service (LOS). For residential development, current LOS is determined using estimates of population and housing units. To estimate current housing units in Town of Payson, TischlerBise obtained building permit information from the Town. This information was used to determine a base year estimate of housing units. Figure C76 shows residential building permit trends by number and types of housing units for the Town.
Figure C76 – Residential Building Permits in the Town of Payson, 2007-2012
Source: Town of Payson, Permit Statistics by Application Type

Development Fee Study: Land Use Assumptions Town of Payson, Arizona
Appendix C - 92
Residential housing units and building permits by type are shown in Figure C77 below. To calculate total housing units, the distribution of 90 percent single unit structures and 10 percent 2+ units was calculated from the 2011 U.S. Census American Community Survey (ACS), 5-Year Estimates for Units in Structure. This distribution was applied to the total number of units reported by the 2010 decennial census (8,958) to get 8,062 single family units, and 896 multifamily units in Town of Payson in 2010.
Figure C77 – Residential Housing Units in the Town of Payson
To estimate 2011, 2012, and 2013 housing units, the building permits issued each year were added to the housing units, starting with the 2010 census count. TischlerBise estimates the Town of Payson had 9,037 housing units at the start of base year 2013. The 2013 distribution of housing units by type of structure remains unchanged from the 2010 distribution.
Current Household Size and Peak Population
According to the U.S. Census Bureau, a household is a housing unit that is occupied by year-round residents. Development fees often use per capita standards and persons per housing unit (PPHU) or persons per household (PPH) to derive proportionate share fee amounts. When PPHU is used in the fee calculations, infrastructure standards are derived using year-round population. When PPH is used in the fee calculations, the development fee methodology assumes a higher percentage of housing units will be occupied, thus requiring seasonal or peak population to be used when deriving infrastructure standards. TischlerBise recommends that development fees for residential development in the Town of Payson be imposed according to the number of persons per household. This methodology recognizes the impacts of seasonal population peaks.
Persons per Household requires data on population in occupied units and the types of units by structure and bedroom count. The 2010 census did not obtain detailed information using a “long-form” questionnaire. Instead, the U.S. Census Bureau switched to a continuous monthly mailing of surveys, known as the American Community Survey (ACS), which has limitations due to sample-size constraints. For example, data on detached housing units are now combined with attached single units (commonly known as townhouses). For development fees in Payson, “single unit” residential units include detached
Building Permits [1) 2010* 2011* 2012* Total Average
Single Unit [2] 11 9 34 54 18
2+ Unit [3] 0 25 0 25 8
Total 11 34 34 79
*Issued during calendar year
2010 Base Year 2013
Housing Units by Structure [4] Distribution [5] 2010 2011 2012 2013 Distribution^
Single Unit 90% 8,062 8,073 8,082 8,116 90%
2+ Unit 10% 896 896 921 921 10%
Total 8,958 8,969 9,003 9,037
[1] Town of Payson, Permit Statis tics by Appl ication Type
[3] 2+ Unit includes s tructures with 2 or more units
[4] U.S. Census Bureau, 2010 Decennia l Census : DP1
[5] U.S. Census Bureau, 2011 American Community Survey 5-Year Estimates : Table B25024
Reflects the addition of issued permits
[2] Single Unit include detached, attached, and mobi le homes
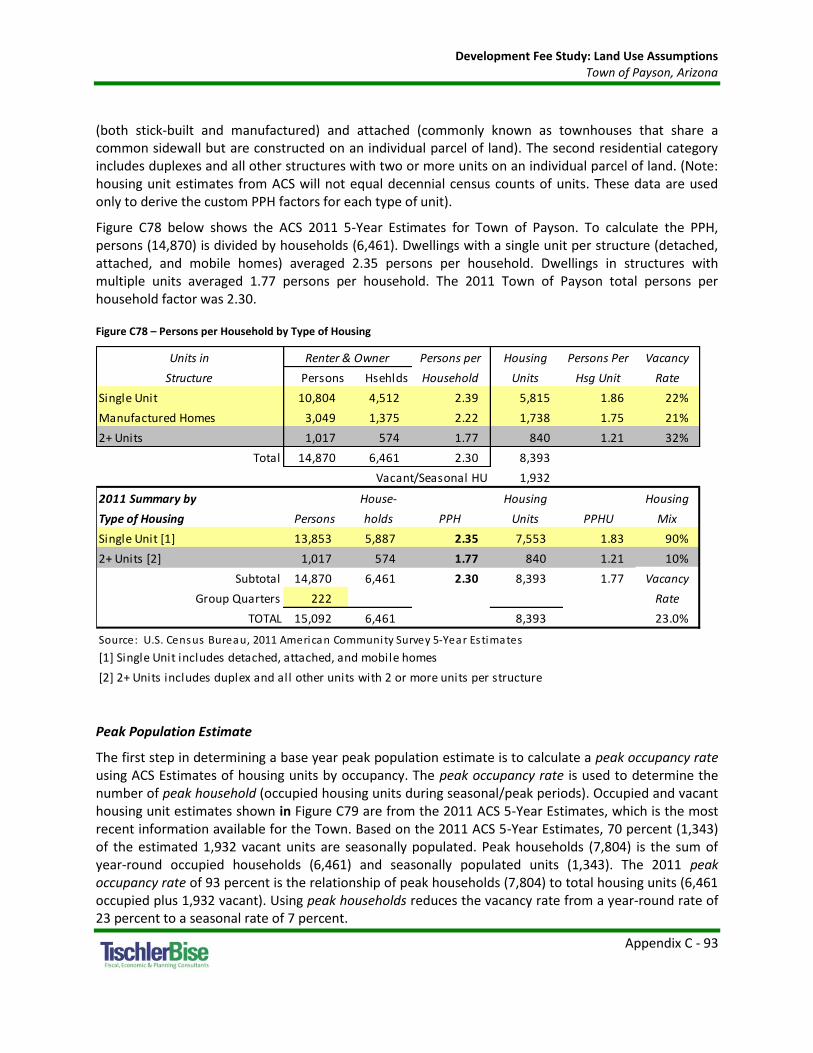
Development Fee Study: Land Use Assumptions Town of Payson, Arizona
Appendix C - 93
(both stick-built and manufactured) and attached (commonly known as townhouses that share a common sidewall but are constructed on an individual parcel of land). The second residential category includes duplexes and all other structures with two or more units on an individual parcel of land. (Note: housing unit estimates from ACS will not equal decennial census counts of units. These data are used only to derive the custom PPH factors for each type of unit).
Figure C78 below shows the ACS 2011 5-Year Estimates for Town of Payson. To calculate the PPH, persons (14,870) is divided by households (6,461). Dwellings with a single unit per structure (detached, attached, and mobile homes) averaged 2.35 persons per household. Dwellings in structures with multiple units averaged 1.77 persons per household. The 2011 Town of Payson total persons per household factor was 2.30.
Figure C78 – Persons per Household by Type of Housing
Peak Population Estimate
The first step in determining a base year peak population estimate is to calculate a peak occupancy rate using ACS Estimates of housing units by occupancy. The peak occupancy rate is used to determine the number of peak household (occupied housing units during seasonal/peak periods). Occupied and vacant housing unit estimates shown in Figure C79 are from the 2011 ACS 5-Year Estimates, which is the most recent information available for the Town. Based on the 2011 ACS 5-Year Estimates, 70 percent (1,343) of the estimated 1,932 vacant units are seasonally populated. Peak households (7,804) is the sum of year-round occupied households (6,461) and seasonally populated units (1,343). The 2011 peak occupancy rate of 93 percent is the relationship of peak households (7,804) to total housing units (6,461 occupied plus 1,932 vacant). Using peak households reduces the vacancy rate from a year-round rate of 23 percent to a seasonal rate of 7 percent.
Units in Renter & Owner Persons per Housing Persons Per Vacancy
Structure Persons Hsehlds Household Units Hsg Unit Rate
Single Unit 10,804 4,512 2.39 5,815 1.86 22%
Manufactured Homes 3,049 1,375 2.22 1,738 1.75 21%
2+ Units 1,017 574 1.77 840 1.21 32%
Total 14,870 6,461 2.30 8,393
Vacant/Seasonal HU 1,932
2011 Summary by House- Housing Housing
Type of Housing Persons holds PPH Units PPHU Mix
Single Unit [1] 13,853 5,887 2.35 7,553 1.83 90%
2+ Units [2] 1,017 574 1.77 840 1.21 10%
Subtotal 14,870 6,461 2.30 8,393 1.77 Vacancy
Group Quarters 222 Rate
TOTAL 15,092 6,461 8,393 23.0%
Source: U.S. Census Bureau, 2011 American Community Survey 5-Year Estimates
[1] Single Unit includes detached, attached, and mobile homes
[2] 2+ Units includes duplex and all other units with 2 or more units per structure

Development Fee Study: Land Use Assumptions Town of Payson, Arizona
Appendix C - 94
Figure C79 – Household Occupancy Rates for Town of Payson
Next in the process to estimate a base year peak population is to apply the peak occupancy rates by unit type to the 2011-2012 residential building permit data from Figure C77 above to determine how many peak households have been added since the 2011. The peak households added annually are added to the 2011 estimate to determine the 2013 peak households by type. See Figure C80 for additional detail.
Figure C80 – Peak Households
The last step in calculating a base year peak population for Town of Payson is to apply the persons per household factors by housing type (see Figure C78) to the base year peak households by housing type (see Figure C80). The 2013 peak population estimate for Town of Payson is the population in single family and multifamily households (18,106) plus the 2013 estimate of the group quarters population (225). Group Quarters population is estimated by applying the distribution of group quarters population (222) to the total population (15,116) from the 2011 ACS 5-Year Estimates to the estimate of year-round population in the Town of Payson for 2013 (15,354). As shown in Figure C81, the 2013 group quarters population estimate of 225 is added to the peak households population estimate of 18,106 to determine a base year 2013 peak population of 18,331 persons in the Town of Payson.
2011 Peak Peak Occ.
Households Estimate Occupied Vacant Seasonal Count Share Rate
Single Unit 4,512 1,303 900 5,412 69% 93%
Manufactured Homes 1,375 363 255 1,630 21% 94%
2+ Units 574 266 188 762 10% 91%
Total 6,461 1,932 1,343 7,804 100% 93%
Source: U.S. Census Bureau, 2011 American Community Survey 5-Year Estimates
Housing Units Peak Households
Peak 2013 Peak
Households Estimate Households [1] Occupancy 2011 2012 Households
Single Unit 7,042 93% 8 32 7,082
2+ Units 762 91% 23 0 785
Total 7,804 93% 31 32 7,867[1] U.S. Census Bureau, 2011 American Community Survey 5-Year Estimates
[2] Town of Payson, Permit Statistics by Application Type
2011 Peak
Peak Households
Added Annually [2]
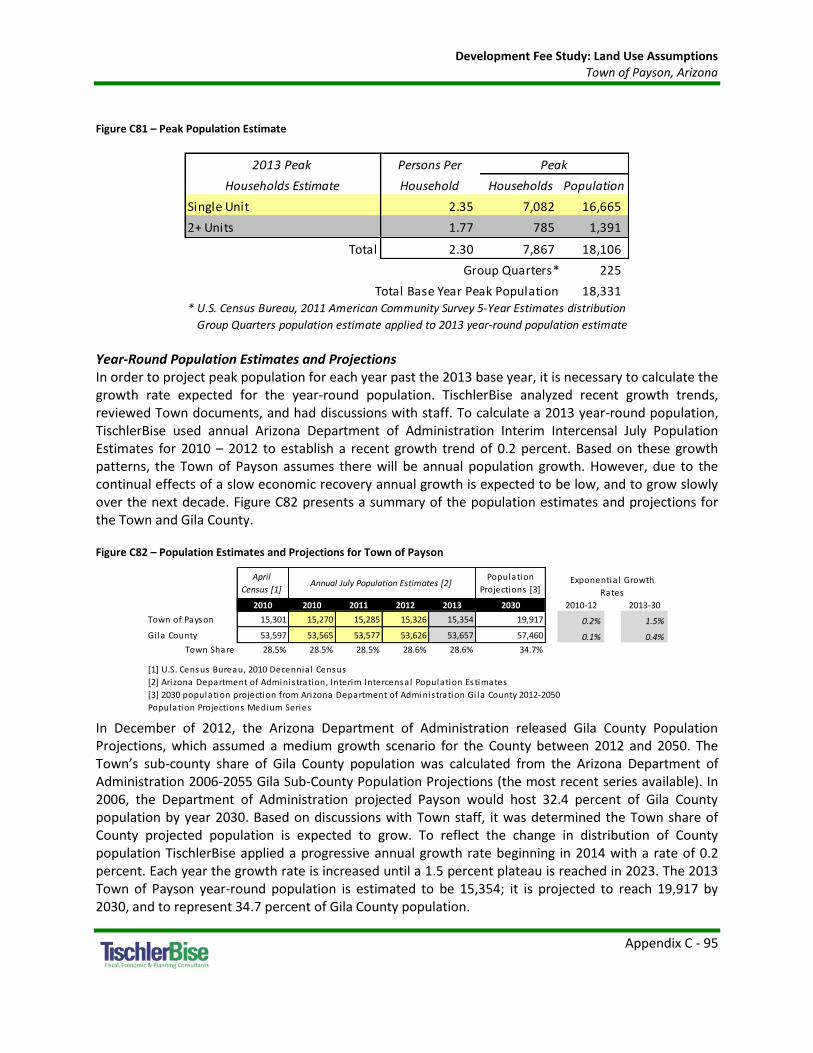
Development Fee Study: Land Use Assumptions Town of Payson, Arizona
Appendix C - 95
Figure C81 – Peak Population Estimate
Year-Round Population Estimates and Projections In order to project peak population for each year past the 2013 base year, it is necessary to calculate the growth rate expected for the year-round population. TischlerBise analyzed recent growth trends, reviewed Town documents, and had discussions with staff. To calculate a 2013 year-round population, TischlerBise used annual Arizona Department of Administration Interim Intercensal July Population Estimates for 2010 – 2012 to establish a recent growth trend of 0.2 percent. Based on these growth patterns, the Town of Payson assumes there will be annual population growth. However, due to the continual effects of a slow economic recovery annual growth is expected to be low, and to grow slowly over the next decade. Figure C82 presents a summary of the population estimates and projections for the Town and Gila County.
Figure C82 – Population Estimates and Projections for Town of Payson
In December of 2012, the Arizona Department of Administration released Gila County Population Projections, which assumed a medium growth scenario for the County between 2012 and 2050. The Town’s sub-county share of Gila County population was calculated from the Arizona Department of Administration 2006-2055 Gila Sub-County Population Projections (the most recent series available). In 2006, the Department of Administration projected Payson would host 32.4 percent of Gila County population by year 2030. Based on discussions with Town staff, it was determined the Town share of County projected population is expected to grow. To reflect the change in distribution of County population TischlerBise applied a progressive annual growth rate beginning in 2014 with a rate of 0.2 percent. Each year the growth rate is increased until a 1.5 percent plateau is reached in 2023. The 2013 Town of Payson year-round population is estimated to be 15,354; it is projected to reach 19,917 by 2030, and to represent 34.7 percent of Gila County population.
2013 Peak Persons Per
Households Estimate Household Households Population
Single Unit 2.35 7,082 16,665
2+ Units 1.77 785 1,391
Total 2.30 7,867 18,106
Group Quarters* 225
Total Base Year Peak Population 18,331* U.S. Census Bureau, 2011 American Community Survey 5-Year Estimates distribution
Group Quarters population estimate applied to 2013 year-round population estimate
Peak
April
Census [1]
Population
Projections [3]
2010 2010 2011 2012 2013 2030 2010-12 2013-30
Town of Payson 15,301 15,270 15,285 15,326 15,354 19,917 0.2% 1.5%
Gi la County 53,597 53,565 53,577 53,626 53,657 57,460 0.1% 0.4%
Town Share 28.5% 28.5% 28.5% 28.6% 28.6% 34.7%
[1] U.S. Census Bureau, 2010 Decennia l Census
[2] Arizona Department of Administration, Interim Intercensal Population Estimates
Exponentia l Growth
RatesAnnual July Population Estimates [2]
[3] 2030 population projection from Arizona Department of Administration Gi la County 2012-2050
Population Projections Medium Series

Development Fee Study: Land Use Assumptions Town of Payson, Arizona
Appendix C - 96
Population and Housing Unit Projections Population and housing unit projections are used to illustrate the possible future pace of service demands, revenues, and expenditures. Population projections for each year past the base were calculated for both year-round population, as described above, and for peak population. Peak population is calculated by applying the peak occupancy rate and persons per household factor to the net increase in annual housing units to calculate an annual addition of population in households. Lastly, group quarters population, which was held constant at 1.47 percent of annual year-round population, was added to the peak population in households to calculate a peak population for each year past the base year 2013. As these factors will vary to the extent that future development varies, there will be virtually no effect on the actual amount of the development fee. See Figure C83 below for a summary of population and housing unit projections.

Development Fee Study: Land Use Assumptions Town of Payson, Arizona
Appendix C - 97
Figure C83 – Population and Housing Unit Projections for the Town of Payson, 2013-2033
Persons Per Housing Unit 1.77
Persons Per Household 2.30 Five-Year Increments ===>
Population Projected Rate 0.2% 0.3% 0.5% 0.6% 0.8% 0.9% 1.1% 1.2% 1.4% 1.5% 1.5% 1.5% Cumulative Avg. Ann.
Base Yr 1 2 3 4 5 6 7 8 9 10 15 20 Increase Increase
2013 2014 2015 2016 2017 2018 2019 2020 2021 2022 2023 2028 2033 2013-2033 2013-2033
SUMMARY OF DEMAND PROJECTIONS
TOTAL PEAK POPULATION 18,331 18,406 18,441 18,532 18,681 18,887 19,154 19,485 19,883 20,346 20,886 22,875 24,714 6,383 319
TOTAL YEAR-ROUND POPULATION 15,354 15,382 15,457 15,579 15,748 15,968 16,239 16,564 16,945 17,387 17,893 19,316 20,852 5,498 275
TOTAL HOUSING UNITS 9,037 9,053 9,095 9,164 9,259 9,383 9,536 9,720 9,935 10,185 10,471 11,275 12,142 3,105 155
RESIDENTIAL DEVELOPMENT
Housing Units Unit Mix
Single Unit 90% 8,116 8,130 8,168 8,230 8,315 8,427 8,564 8,729 8,922 9,147 9,404 10,126 10,905 2,789 139
2+ Unit 10% 921 923 927 934 944 956 972 991 1,013 1,038 1,067 1,149 1,237 316 16
TOTAL 9,037 9,053 9,095 9,164 9,259 9,383 9,536 9,720 9,935 10,185 10,471 11,275 12,142 3,105 155
2013-2033
ANNUAL INCREASES (Town Limits) 12-13 13-14 14-15 15-16 16-17 17-18 18-19 19-20 20-21 21-22 22-23 27-28 32-33 Avg Annual
Peak Population 75 35 91 149 206 267 331 398 463 540 353 379 319
Housing Units 16 42 69 95 124 153 184 215 250 286 166 179 155
Source: Town of Payson; TischlerBise
Development Fee Service Area

Development Fee Study: Land Use Assumptions Town of Payson, Arizona
Appendix C - 98
NONRESIDENTIAL DEVELOPMENT
Employment Estimates and Projections
In addition to data on residential development, the calculation of development fees requires data on nonresidential square footage and employment (number of jobs) in Town of Payson.
TischlerBise analyzed recent employment trends, reviewed data provided by the Town, and had discussions with staff. According to the analysis conducted by the Central Arizona Council of Governments for a 2012 CEDS Update, the Town historically hosts approximately 35 percent of all Gila County employment. Recent employment trends for the Town and County from the U.S. Census Bureau LEHD web-based application OnTheMap, demonstrate each has lost jobs since a 2007 peak. However, a 2009 analysis by the Arizona Department of Transportation suggests job growth will return, and by 2030, Gila County is projected to host 24,000 jobs. LEHD data from 2011 suggest Payson is hosting a growing share of County jobs. Continuing this trend equates to a job projection for the Town of Payson of 9,600 by 2030, or an exponential growth rate of 4.74 percent. Employment estimates and projections between 2013 and 2030 were calculated with the exponential growth rates. TischlerBise estimates the Town of Payson had 4.370 jobs for the base year of 2013.
Figure C84 – Employment Trends in Gila County and Town of Payson
2004 2007 2010 2011 2012 2013 2018 2023 2030 2004-11 2013-30
Town of Payson 4,901 5,839 4,392 4,483 4,426 4,370 5,508 6,943 9,600 -1.27% 4.74%
Gila County 11,819 13,619 12,292 11,369 11,306 11,244 14,053 17,564 24,000 -0.55% 4.56%
Town Share 41.5% 42.9% 35.7% 39.4% 39.1% 38.9% 39.2% 39.5% 40.0%
2030 Town projections represents 40 percent of projected County employment
Exponential Growth
Rates
[1] U.S. Census Bureau LEHD web-based application OnTheMap, "all jobs", excluding Tonto Apache Reservation
[2] 2030 County projection from Arizona Department of Transportation Statewide Transportation Planning Framework (2009).
Employment EstimatesLEHD Estimates [1] Employment Projections [2]

Development Fee Study: Land Use Assumptions Town of Payson, Arizona
Appendix C - 99
Employment by Industry Type
In addition to projecting total employment, as part of the Town of Payson General Plan Update 2014-2024 process, the Town analyzed employment trends and set economic development priorities for the future. Town staff made three assumptions to project employment distribution. First, there will be employment growth. Second, as a population hub for the County, Payson will have a growing share of commercial and office jobs. Between 2013 and 2030, the Town of Payson is projected to add over 5,000 jobs. Figure C85 shows the incremental shifts in employment distribution of commercial and office jobs. Each industry type is projected to have job growth between 2013 and 2030. Commercial/Retail jobs are expected to grow 4.02 percent annually; Office/Institutional jobs will grow the fastest at 5.33 percent. Industrial jobs will grow 4.74 percent annually.
Figure C85 – Employment Distribution by Industry Type
Nonresidential Square Footage Development
Job estimates are used to calculate nonresidential square footage based on nationally recognized average square feet per employee data published by The Institute of Transportation Engineers (ITE), and shown in Figure C86. The shaded categories represent the proxy categories used to determine nonresidential square footage by land use type.
Figure C86 – The Institute of Transportation Engineers, Employee and Building Area Ratios, 2012
2010 2010 Share 2013 2013 Share 2018 2018 Share 2030 2030 Share 2013-2030
Commercial/Retail 1,974 45% 1,964 45% 2,392 43% 3,840 40% 4.02%
Office/Institutional 1,997 45% 1,987 45% 2,575 47% 4,800 50% 5.33%
Industrial/Flex 421 10% 419 10% 535 10% 960 10% 5.00%TOTAL 4,392 100% 4,370 100% 5,508 100% 9,600 100% 4.74%
Source: Town of Payson, Draft General Plan Update 2014-2024
Employment Projections [1] Exponential
Growth RatesEmployment Estimate
ITE Land Use / Size Demand Emp Per Sq Ft
Code Unit Demand Unit* Employee* Dmd Unit** Per Emp
Commercial / Shopping Center
820 Average 1,000 Sq Ft 42.70 na 2.00 500
General Office
710 Average 1,000 Sq Ft 11.03 3.32 3.32 301
Other Nonresidential
770 Bus iness Park*** 1,000 Sq Ft 12.44 4.04 3.08 325
760 Research & Dev Center 1,000 Sq Ft 8.11 2.77 2.93 342
610 Hospita l 1,000 Sq Ft 13.22 4.50 2.94 340
565 Day Care student 4.38 26.73 0.16 na
550 Univers i ty/Col lege student 1.71 8.96 0.19 na
530 High School student 1.71 19.74 0.09 na
520 Elementary School student 1.29 15.71 0.08 na
520 Elementary School 1,000 Sq Ft 15.43 15.71 0.98 1,018
320 Lodging room 5.63 12.81 0.44 na
254 Ass is ted Living bed 2.66 3.93 0.68 na
151 Mini -Warehouse 1,000 Sq Ft 2.50 61.90 0.04 24,760
150 Warehous ing 1,000 Sq Ft 3.56 3.89 0.92 1,093
140 Manufacturing 1,000 Sq Ft 3.82 2.13 1.79 558
110 Light Industrial 1,000 Sq Ft 6.97 3.02 2.31 433* Trip Generation, Insti tute of Transportation Engineers , 9th Edition (2012).** Employees per demand unit ca lculated from trip rates , except for Shopping Centerdata, which are derived from Development Handbook and Dol lars and Centsof Shopping Centers , publ ished by the Urban Land Insti tute.
Weekday Trip Ends per

Development Fee Study: Land Use Assumptions Town of Payson, Arizona
Appendix C - 100
TischlerBise used 2012 data from the ITE to calculate the total nonresidential floor areas for three categories of development used for the calculation of development fees. To estimate current nonresidential floor area, 2013 job estimates by category were multiplied by ITE square feet per employee factors. It is estimated Town of Payson has over 1.7 million square feet of nonresidential space in active use. The estimated square footage in 2013 for each major category of nonresidential development is shown below in Figure C87.
Figure C87 – Estimated Employment and Nonresidential Floor Area in Town of Payson, 2013
Nonresidential Floor Area and Employment Projections
Future employment growth and nonresidential development in Town of Payson are projected based on information provided by Town staff, and analysis of past trends.
The projected increase in employment by industry type was then used to project growth in nonresidential square footage using the Square Feet per Employee factors data previously discussed. Results are shown in Figure C88. The Town expects to add on average 334 jobs a year for the next twenty years. To keep pace with employment growth, the Town should expect to add roughly 128,000 square feet of active nonresidential floor space each year.
2013 Square Feet
Jobs Distribution Estd Jobs Per Employee [2] Square Feet Distribution
Commercial/Retail 1,974 45% 1,964 500 982,000 56%
Office/Institutional 1,997 45% 1,987 301 598,082 34%
Industrial/Flex 421 10% 419 433 181,547 10%
TOTAL 4,392 100% 4,370 403 1,761,629 100%
[1] U.S. Census Bureau, OnTheMap Appl ication and LEHD Origin-Destination Employment Statis tics
[2] Trip Generation Manual , Insti tute of Transportation Engineers , 9th Edition (2012).
2010 Town of Payson [1] Nonresidential Floor Area

Development Fee Study: Land Use Assumptions Town of Payson, Arizona
Appendix C - 101
Figure C88 – Nonresidential Floor Area and Employment Projections in Town of Payson, 2013-2033
Employment Projected Rate 4.74% Five-Year Increments ===> Cumulative Avg. Ann.
Base Yr 1 2 3 4 5 6 7 8 9 10 15 20 Increase Increase
2013 2014 2015 2016 2017 2018 2019 2020 2021 2022 2023 2028 2033 2013-2033 2013-2033
SUMMARY OF DEMAND PROJECTIONS
TOTAL JOBS 4,370 4,576 4,791 5,018 5,254 5,502 5,762 6,034 6,321 6,620 6,934 8,747 11,041 6,671 334
NONRESIDENTIAL DEVELOPMENTEmployment By Type 2013 2030
Commercial/Retail 45% 40% 1,964 2,043 2,125 2,211 2,300 2,392 2,488 2,588 2,693 2,801 2,914 3,549 4,322 2,358 118
Office/Institutional 45% 50% 1,987 2,093 2,204 2,322 2,445 2,575 2,713 2,857 3,009 3,169 3,338 4,327 5,608 3,621 181
Industrial/Flex 10% 10% 419 440 462 485 509 535 561 589 619 650 682 871 1,111 692 35
TOTAL 4,370 4,576 4,791 5,018 5,254 5,502 5,762 6,034 6,321 6,620 6,934 8,747 11,041 6,671 334
Nonres Floor Area (1,000 SF) ITE
Commercial (1,000 SF) 500 982 1,022 1,063 1,106 1,150 1,196 1,244 1,294 1,346 1,400 1,457 1,773 2,160 1,178 59
Office/Instit (1,000 SF) 301 598 630 663 699 736 775 817 860 905 953 1,004 1,300 1,685 1,087 54
Industrial/Flex (1,000 SF) 433 182 191 200 210 221 231 242 254 267 280 294 376 479 298 15
TOTAL 1,762 1,842 1,926 2,014 2,106 2,202 2,303 2,408 2,518 2,634 2,755 3,449 4,324 2,563 128
2013-2033
ANNUAL INCREASES (Town Limits) 12-13 13-14 14-15 15-16 16-17 17-18 18-19 19-20 20-21 21-22 22-23 27-28 32-33 Avg Annual
Jobs 206 215 227 236 248 260 272 287 299 314 399 503 334
Nonres Floor Area (1,000 SF) 81 84 88 92 96 101 105 110 116 121 152 192 128
Source: Town of Payson; TischlerBise
Development Fee Service Area
Distribution

Development Fee Study: Land Use Assumptions Town of Payson, Arizona
Appendix C - 102
AVERAGE DAILY VEHICLE TRIPS
Average Daily Vehicle Trips are used for the Streets development fee category as a measure of demand by land use. Vehicle trips are estimated using average weekday vehicle trip ends from the reference book, Trip Generation, 9th Edition, published by the Institute of Transportation Engineers (ITE) in 2012. A vehicle trip end represents a vehicle either entering or exiting a development (as if a traffic counter were placed across a driveway).
Trip Rate Adjustments
Trip generation rates are adjusted to avoid double counting each trip at both the origin and destination points. Therefore, the basic trip adjustment factor is 50 percent. As discussed below, additional adjustments are made to ensure the fees are proportionate to the infrastructure demand for particular types of development.
Adjustment for Journey-To-Work Commuting
Residential development in the Town of Payson has a slightly larger trip adjustment factor of 60 percent to account for commuters leaving Payson for work. According to the National Household Travel Survey (2009), home-based work trips are typically 31 percent of “production” trips, in other words, out-bound trips (which are 50 percent of all trip ends). Data from the LEHD for 2010 indicate that 62 percent of Payson’s employed residents travel outside the Town for work. In combination, these factors (0.31 x 0.50 x 0.62 = 0.10) account for 10 percent of additional production trips. The total adjustment factor for residential includes attraction trips (50% of trip ends) plus the journey-to-work commuting adjustment for a total of 60 percent.
Figure C89 – Adjustment for Journey-To-Work Commuting
Adjustment for Pass-By Trips
The basic trip adjustment factor of 50 percent is applied to the office/institutional, and industrial/flex categories. The commercial/retail category has a trip factor of less than 50 percent because this type of development attracts vehicles as they pass-by on arterial and collector roads. For an average size shopping center, the ITE (2012) indicates that on average 34 percent of the vehicles that enter are passing by on their way to some other primary destination. The remaining 66 percent of attraction trips have the shopping center as their primary destination.
Trip Adjustment Factor for Commuters [1]
Employed Residents 5,610
Residents Working in Town 2,120
Residents Commuting Outside Town for Work 3,490
Percent Commuting out of the Town 62%
Additional Production Trips [2] 10%
Residential Trip Adjustment Factor 60%
[1] U.S. Census Bureau, OnTheMap Application (version 6.1.1) and
LEHD Origin-Destination Employment Statistics
[2] National Household Travel Survey, 2011: Table 30

Development Fee Study: Land Use Assumptions Town of Payson, Arizona
Appendix C - 103
Estimated Vehicle Trips in Payson
As an alternative to simply using the national average trip generation rate for residential development, the ITE publishes regression curve formulas that may be used to derive custom trip generation rates using local demographic data. Key independent variables needed for the analysis (i.e. vehicles available, housing units, households, and persons) are only available collectively from the 2011 ACS 5-Year Estimates for Payson. (Note: data from the ACS will not equal decennial census counts. These data are used only to derive the custom average weekday vehicle trip ends by type of housing unit, as shown below).
Figure C90 – Average Weekday Vehicle Trip Ends by Housing Type in Town of Payson
As shown, a single family unit has an average daily trip rate of 8.40 per unit (compared to 9.52 from ITE), and a multifamily unit has an average daily trip rate of 6.20 trips per unit (compared to 6.65 per unit from ITE). Average daily trips are derived using these data.
Figure C91 details the calculations to determine that existing development in the Town generates an average of 62,099 vehicle trips on an average weekday. Residential development is estimated to generate 44,331 vehicle trips (71 percent) compared to 17,768 vehicle trips (29 percent) generated by nonresidential development. An example of the calculation is as follows for single family units: 8,116 single family units x 8.40 vehicle trips per day per unit x 60 percent adjustment factor = 40,905 total vehicle trips per day from single family units in the Town. The same calculation is done for each land use type.
Town of Payson, AZ Vehicles per
Vehicles Household
Available [1] Single Family Multifamily Total by Tenure
Owner-occupied 9,177 4,666 23 4,689 1.96
Renter-occupied 2,644 1,221 551 1,772 1.49
TOTAL 11,821 5,887 574 6,461 1.83
Housing Units [3] => 7,553 840 8,393
Persons per Household => 2.35 1.77
Persons in Trip Vehicles by Trip Average Trip Ends per ITE Trip Ends Difference
Hholds [4] Ends [5] Type of Housing Ends [6] Trip Ends Household Per Unit from ITE
Single Family Units 13,853 35,871 10,954 63,325 49,598 8.40 9.52 -12%
Multifamily Units 1,017 3,465 867 3,710 3,587 6.20 6.65 -7%
TOTAL 14,870 39,336 11,821 67,036 53,186 8.20
[4] Total population in households from Table25033, American Community Survey, 2011.
[5] Vehicle trips ends based on persons us ing formulas from Trip Generation (ITE 2012). For s ingle fami ly hous ing (ITE 210), the fi tted curve
equation is EXP(0.91*LN(persons)+1.52). To approximate the average population of the ITE s tudies , persons were divided by 25 and the
equation result multipl ied by 25. For multi fami ly hous ing (ITE 220), the fi tted curve equation is (3.47*persons)-64.48.
[6]Vehicle trip ends based on vehicles avai lable us ing formulas from Trip Generation (ITE 2012). For s ingle fami ly hous ing (ITE 210), the
fi tted curve equation is EXP(0.99*LN(vehicles )+1.81). To approximate the average number of vehicles in the ITE s tudies , vehicles avai lable
were divided by 43 and the equation result multipl ied by 43. For multi fami ly hous ing (ITE 220), the fi tted curve equation is
(3.94*vehicles )+293.58.
Households [2]
Units
[1] Vehicles available by tenure from Table B25046, American Community Survey, 2011.
[2] Households by tenure and units in structure from Table B25032, American Community
Survey, 2011.
[3] Housing units from Table B25024, American Community Survey, 2011.

Development Fee Study: Land Use Assumptions Town of Payson, Arizona
Appendix C - 104
Figure C91 – Average Daily Trips from Existing Development in Town of Payson
Demand Indicators by Size of Detached Housing
As part of the Town of Payson Development Fee Study, TischlerBise further analyzed demographic data to present the option to refine the development fee schedule to be more progressive for residential development. This can be done by developing fees by size of housing unit based on bedroom count. Household size and vehicle trip rates can be derived using custom tabulations of demographic data by bedroom range from survey responses provided by the U.S. Census Bureau in files know as Public Use Micro-data Samples (PUMS). Because PUMS data are only available for areas of roughly 100,000 persons, the Town of Payson is included in Arizona Public Use Micro-data Area (PUMA) 0800. Data are first analyzed for the PUMA area and then calibrated to conditions in Town of Payson.
Base Year
Residential Vehicle Trips on an Average Weekday* 2013
Residential Units Assumptions
Single Family 8,116
Multifamily 921
Average Weekday Vehicle Trip Ends per Unit* Trip Rate Trip Factor
Single Family 8.40 60%
Multifamily 6.20 60%
Residential Vehicle Trip Ends of an Average Weekday
Single Family 40,905
Multifamily 3,426 % of total
Total Residential Trips 44,331 71%
Nonresidential Vehicle Trips on an Average Weekday** 2013
Nonresidential Gross Floor Area (1,000 sq. ft.) Assumptions
Commercial/Retail 982
Office/Institutional 598
Industrial/Flex 182
Average Weekday Vehicle Trips Ends per 1,000 Sq. Ft.** Trip Rate Trip Factor
Commercial 42.70 33%
Office/Institutional 11.03 50%
Industrial/Flex 6.97 50%
Nonresidential Vehicle Trips on an Average Weekday
Commercial 13,837
Office/Institutional 3,298
Industrial/Flex 633
Total Nonresidential Trips 17,768 29%
TOTAL TRIPS 62,099 100%
*Trip rates are customized for Town of Payson See accompanying tables and discussion.
**Trip rates are from the Institute of Transportation Engineers (ITE) Trip Generation Manual (2012)

Development Fee Study: Land Use Assumptions Town of Payson, Arizona
Appendix C - 105
TischlerBise used 2011 ACS 1-Year Estimates to derive persons per household by number of bedrooms as well as number of vehicle trips per household by number of bedrooms. As shown in Figure C92, TischlerBise derived trip generation rates and average persons, by bedroom range, using the number of persons and vehicles available. Recommended multipliers were scaled to make the average value by type of housing for Arizona PUMA 0800 match the average value derived from ACS data specific to Payson. As the number of bedrooms increases, trip ends and persons per household increase as well.
Figure C92 – Average Persons and Trip Ends by Bedroom Range in Town of Payson
SUMMARY
Provided on the next page is a summary of annual demographic and development projections to be used for the development fee study. Base year estimates for 2013 are used in the development fee calculations. Development projections are used to illustrate a possible future pace of service demands and cash flows resulting from revenues and expenditures associated with those service demands.
Recommended Multipliers for Municipality [4]
House- Persons Trip Vehicles Trip Average Trip Ends per Persons per
holds [1] [1] Ends [2] Available [1] Ends [3] Trip Ends Household Household
Single Family 0-3 Bdrms 755 1,684 4,560 1,225 7,109 5,834 7.59 2.07
Single Family 4+ Bdrms 233 818 2,364 495 2,899 2,631 11.02 3.26
Average Single Fami ly 988 2,502 7,293 1,720 10,066 8,680 8.40 2.35
Multi fami ly Total 46 110 317 39 447 382 6.20 1.77
GRAND TOTAL 1,034 2,612 7,610 1,759 10,514 9,062
[1] American Community Survey, Publ ic Use Microdata Sample for AZ PUMA 0800 (unweighted data for 2011).
[2] Vehicle trips ends based on persons us ing formulas from Trip Generation (ITE 2012). For s ingle fami ly hous ing (ITE 210), the fi tted
curve equation is EXP(0.91*LN(persons)+1.52). To approximate the average population in the ITE s tudies , persons were divided by 5 and
the equation result multipl ied by 5. For multi fami ly hous ing (ITE 220), the fi tted curve equation is (3.47*persons)-64.48.
[4] Recommended multipl iers are sca led to make the average va lue by type of hous ing for AZ PUMA 0800 match the average va lue for
Payson, derived from American Community Survey 2011 data, with persons adjusted to the Townwide average of 2.35 persons per s ingle
fami ly household.
[3] Vehicle trip ends based on vehicles avai lable us ing formulas from Trip Generation (ITE 2012). For s ingle fami ly hous ing (ITE 210), the
fi tted curve equation is EXP(0.99*LN(vehicles )+1.81). To approximate the average number of vehicles in the ITE s tudies , vehicles
avai lable were divided by 7 and the equation result multipl ied by 7. (3.94*vehicles )+293.58

Development Fee Study: Land Use Assumptions Town of Payson, Arizona
Appendix C - 106
Figure C93 – Town of Payson Land Use Assumptions Summary
Cumulative Avg. Ann.
Base Yr 1 2 3 4 5 6 7 8 9 10 11 12 13 14 15 16 17 18 19 20 Increase Increase
2013 2014 2015 2016 2017 2018 2019 2020 2021 2022 2023 2024 2025 2026 2027 2028 2029 2030 2031 2032 2033 2013-2033 2013-2033
SUMMARY OF DEMAND PROJECTIONS
TOTAL PEAK POPULATION 18,331 18,406 18,441 18,532 18,681 18,887 19,154 19,485 19,883 20,346 20,886 21,499 21,835 22,176 22,522 22,875 23,232 23,594 23,962 24,335 24,714 6,383 319
TOTAL HOUSING UNITS 9,037 9,053 9,095 9,164 9,259 9,383 9,536 9,720 9,935 10,185 10,471 10,627 10,785 10,946 11,109 11,275 11,443 11,614 11,787 11,963 12,142 3,105 155
TOTAL JOBS 4,370 4,576 4,791 5,018 5,254 5,502 5,762 6,034 6,321 6,620 6,934 7,263 7,608 7,970 8,348 8,747 9,162 9,600 10,058 10,538 11,041 6,671 334
RESIDENTIAL DEVELOPMENT
Housing Units
Single Unit 8,116 8,130 8,168 8,230 8,315 8,427 8,564 8,729 8,922 9,147 9,404 9,544 9,686 9,830 9,977 10,126 10,277 10,430 10,586 10,744 10,905 2,789 139
2+ Unit 921 923 927 934 944 956 972 991 1,013 1,038 1,067 1,083 1,099 1,116 1,132 1,149 1,166 1,184 1,201 1,219 1,237 316 16
TOTAL 9,037 9,053 9,095 9,164 9,259 9,383 9,536 9,720 9,935 10,185 10,471 10,627 10,785 10,946 11,109 11,275 11,443 11,614 11,787 11,963 12,142 3,105 155
NONRESIDENTIAL DEVELOPMENTEmployment By Type
Commercial/Retail 1,964 2,043 2,125 2,211 2,300 2,392 2,488 2,588 2,693 2,801 2,914 3,031 3,153 3,280 3,411 3,549 3,691 3,840 3,994 4,155 4,322 2,358 118
Office/Institutional 1,987 2,093 2,204 2,322 2,445 2,575 2,713 2,857 3,009 3,169 3,338 3,516 3,703 3,900 4,108 4,327 4,557 4,800 5,056 5,325 5,608 3,621 181
Industrial/Flex 419 440 462 485 509 535 561 589 619 650 682 716 752 790 829 871 914 960 1,008 1,058 1,111 692 35
TOTAL 4,370 4,576 4,791 5,018 5,254 5,502 5,762 6,034 6,321 6,620 6,934 7,263 7,608 7,970 8,348 8,747 9,162 9,600 10,058 10,538 11,041 6,671 334
Nonres Floor Area (1,000 SF)
Commercial (1,000 SF) 982 1,022 1,063 1,106 1,150 1,196 1,244 1,294 1,346 1,400 1,457 1,515 1,576 1,639 1,705 1,773 1,844 1,919 1,996 2,076 2,160 1,178 59
Office/Instit (1,000 SF) 598 630 663 699 736 775 817 860 905 953 1,004 1,057 1,113 1,172 1,235 1,300 1,369 1,442 1,519 1,600 1,685 1,087 54
Industrial/Flex (1,000 SF) 182 191 200 210 221 231 242 254 267 280 294 309 325 341 358 376 394 414 435 456 479 298 15
TOTAL 1,762 1,842 1,926 2,014 2,106 2,202 2,303 2,408 2,518 2,634 2,755 2,881 3,014 3,152 3,297 3,449 3,607 3,775 3,949 4,133 4,324 2,563 128
2013-2033
ANNUAL INCREASES (Town Limits) 12-13 13-14 14-15 15-16 16-17 17-18 18-19 19-20 20-21 21-22 22-23 23-24 24-25 25-26 26-27 27-28 28-29 29-30 30-31 31-32 32-33 Avg Annual
Peak Population 75 35 91 149 206 267 331 398 463 540 613 336 341 346 353 357 362 368 373 379 319
Housing Units 16 42 69 95 124 153 184 215 250 286 156 158 161 163 166 168 171 173 176 179 155
Jobs 206 215 227 236 248 260 272 287 299 314 329 345 362 378 399 415 438 458 480 503 334
Nonres Floor Area (1,000 SF) 81 84 88 92 96 101 105 110 116 121 126 133 138 145 152 158 168 175 183 192 128
Source: Town of Payson; TischlerBise
Development Fee Service Area

Development Fee Study: Land Use Assumptions Town of Payson, Arizona
Appendix C - 107