draft trends of ftas and patterns of trade in east asia
TRANSCRIPT

Draft
Trends of FTAs and Patterns of Trade in East Asia from the 1990s to 2110s
June 2017
Shujiro Urata
Waseda University
Prepared for International Conference on Regional Integration and Economic Resilience,
co-organized by Asian Development Bank, Korea International Economic Association,
and United Nations Economic and Social Commission for Asia and the Pacific:
Subregional Office for East and North-East Asia (UNESCAP-ENEA), to be held on June
13, 2017, Seoul, Korea. This paper expands the paper presented at ERIA workshop on
“East Asian Integration” held on March 22-23, 2017, Tokyo, Japan

1
I. Introduction
The East Asia region witnessed rapid expansion of intra-regional trade in the late
1980s and 1990s, resulting in “de-facto” regional economic integration. Behind this
development was the formation of regional production networks by multinational
corporations (MNCs). MNCs adopted the fragmentation strategy, under which they break
up production process into a number of production sub-processes (blocks) and locate
them in a country or a region where these sub-production processes can be performed
most efficiently. MNCs actively trade parts and components connecting sub-processes
and produce final products by assembling parts and components imported from various
locations. MNCs were able to adopt the fragmentation strategy because of free and open
business environment established by liberalization in trade and foreign direct investment
(FDI) policies adopted by East Asian economies and because of reduction in
transportation costs due to technological progress and deregulation.
Construction and use of regional production networks contributed to economic
growth, which in turn led to further liberalization of trade and FDI policies, resulting in
greater and deeper regional economic integration. Because of the importance of market
forces, resulting from trade and FDI policy liberalization, in the formation of regional
economic integration, such integration is characterized as market-driven regional
economic integration1.
In the late 1990s East Asia began to observe the emergence of institution-driven
regionalization, which was promoted mainly by the establishment of free trade
agreements (FTAs). An FTA is a trade policy, where tariffs on trade between and among
FTA members are eliminated, while tariffs on imports from non-FTA members remain at
the same level. East Asia was a late comer in the FTA frenzy, as other regions including
Europe, North and South America and others began to establish FTAs in the late 1980s.
Although East Asia was a late starter in the FTA race, it caught up with the rest of the
world very quickly, first establishing mostly bilateral FTAs involving two countries and
later moving to plurilateral and multilateral FTAs.
The objective of this paper is to provide an overview of the FTA developments
in East Asia and to examine the patterns of trade, which are likely to have been affected
by FTAs. Specifically, it attempts to examine the patterns of FTA developments in East
Asia and then identify the factors that led to active formation of FTAs. The analysis of
the developments of FTAs is performed more or less on chronological order, beginning
with the 1990s, then 2000s, and finally in the 2010s before examining the trade patterns.
1 See Urata (2004) for the discussions on market-driven and institution-driven regional
economic integration in East Asia.
2
Although there are both economic as well as non-economic, particularly political, factors
are at work behind the formation of FTAs, this paper focuses on economic factors. The
main geographical focus is East Asia, but discussions are sometimes extended to include
those countries/economies in Asia-Pacific.
II. 1990s: ASEAN Free Trade Area and Emergence of Discussions on Bilateral FTAs
Starting in the latter half of the 1980s, the movement towards forming regional
economic integration, which is regionalization in terms of institutions, became active
among the regions of the world. In Europe, the movement towards regional economic
integration in institutions which started in the 1950s, accelerated. The European single
market was formed in 1992, in which goods, services, labor and capital could move freely.
The European Union (EU), which is an economic and political union, was established in
1993, and the currency union was established in 1999 by introducing a common currency,
euro. In North America, through forming FTAs starting in the mid-1980s, the United
States (US) promoted institutional regional economic integration. Among the FTAs to
which the US is a party, North American Free Trade Area (NAFTA), which was founded
with Canada and Mexico in 1994, is the largest in economic scale.
In contrast to other regions of the world, East Asia was inactive in pursuing
institutional regional economic integration in the form of FTAs until the end of the 1990s.
In fact, the ASEAN Free Trade Area (AFTA) comprised of ASEAN countries was the
only major FTA established in East Asia before the turn of the century. ASEAN was
founded in 1967 with political objectives but became increasingly active as an economic
framework after the end of the East–West Cold War in 1989. AFTA was created by the
ASEAN members of that time (Brunei, Indonesia, Malaysia, the Philippines, Singapore
and Thailand), and came into effect in 1993. Thereafter, Vietnam, Myanmar, Lao PDR,
and Cambodia, which had joined ASEAN, acceded to AFTA. Through AFTA tariffs were
reduced in stages, and for the six original member countries tariffs on trade among the
member nations (intra-regional tariffs) were abolished for all products aside from those
which were considered exceptions to liberalization by 2010. For the four newer member
countries, elimination of intra-regional tariffs is planned for 2018. Within ASEAN, not
only is there the FTA regarding goods in the framework of AFTA2 there is also an FTA
on trade in services (AFAS) and an agreement regarding investment (AIA).3 These policy
2 ATIGA (ASEAN Trade in Goods Agreement) was enacted in 2010. 3 AFAS (ASEAN Framework Agreement in Services) was founded in 1995 and AIA
(ASEAN Investment Area) in 1998. In 2009, AIA developed into ACIA (ASEAN
Comprehensive Investment Area), which contains more comprehensive contents.

3
and institutional initiatives toward economic integration in ASEAN were culminated by
establishing the ASEAN Economic Community (AEC) in 2015. The main objective of
AEC is to set up a single market and production base, where free movements of goods,
services, investment and skilled personnel, is established4. While a remarkable progress
has been made to achieve AEC, there still remain unfinished goals. To deal with the
remaining issues and to complete AEC, a new target year of 2025 has been agreed to
complete AEC by the ASEAN Economic Ministers5.
Several factors may be found behind the formation of AFTA and AEC6. Two
important external motives are formation of regional economic integration frameworks
in the rest of the world and competitive threat from China. Moves toward strengthening
regional economic groups became active in the latter half of the 1980s as was discussed
earlier (Figure 1). Intensified moves toward regional economic grouping in major areas
in the world made ASEAN realize that FTA could be an important policy option to
promote trade and not to be left out from the major markets.
Another factor was the increasing importance of China as a recipient of foreign
direct investment (FDI). China became to attract FDI notably in the late 1980s, as
multinational corporations (MNCs) from developed countries found China an attractive
FDI destination. This is largely because of abundant availability of low-wage labor and
potentially huge market in the future. Furthermore, the Chinese government improved
inward FDI environment by implementing reform and market opening policy and
providing various incentives to foreign investors. Faced with increasing amount of FDI
being attracted to China, ASEAN Leaders and government officials became concerned
with further expansion of FDI inflows to China at the expense of FDI inflows to the
ASEAN region. One response to deal with this concern was to set up a region-wide
market by establishing a free trade area. Indeed, for ASEAN China has been always
regarded as a competitor in various aspects including as FDI host country/region and as
an exporter in overseas markets such as the US. Indeed, ASEAN’s schedule for the
completion of AFTA and AEC were moved forward, as ASEAN thought competitive
threat from China grew remarkably.
The internal dynamic of ASEAN has also contributed to deeper integration in the
form of ASEAN Economic Community. Specifically, Asian Financial Crisis in 1997-1998
made the ASEAN Leaders realize the need to promote cooperation, in order to avoid
another crisis. They expected that through various types of economic cooperation under
4 On ASEAN Economic Community, see, for example, ASEAN (2008). 5 See ASEAN (2017) on this point. 6 See ERIA (2014) on AFTA and AEC.
4
AEC would contribute to making ASEAN a resilient and competitive region, a region
with equitable economic development.
Toward the end of 1990s, several countries in East Asia began to consider the
establishment of bilateral FTAs. Among ASEAN countries, Singapore actively pursued
FTAs. Singapore approached Japan and Korea for possible FTAs in 1998. Among North
East Asian countries, Korea was the first country that began discussing FTAs. Korea and
Chile began bilateral FTA negotiations in 1999. Compared to Korea, Japan was passive
in pursing FTAs. Mexico approached Japan to discuss possible bilateral FTA in 1998,
while Korea and Singapore each approached Japan in 1998 and 1999. Japan and Korea
are two major WTO members that did not have any FTAs at that time. Japan and Korea
shared a view that they should not be involved in preferential and discriminatory trade
agreements such as FTAs because they would violate a basic principle of non-
discrimination in the WTO, thereby complicate the trading environment to discourage
trade.
Both Japan and Korea changed their attitude toward FTAs and began to study
their feasibility. Several reasons may be identified as the reasons behind their change in
attitude. One is rapid increase in FTAs in the world. As discussed earlier, FTAs began to
increase rapidly in the 1990s (Figure 1). One reason behind this rapid expansion of FTAs
is slow progress in multinational trade liberalization under General Agreement on Tariffs
and Trade (GATT) until 1994 and the World Trade Organization (WTO) after 1995. Faced
with the situation, those countries interested in trade liberalization opted for FTAs with
like-minded countries. FTAs tend to trigger the domino effect, because they are
discriminatory trade policy. Those countries that are excluded from FTAs suffer from
discrimination. In order to deal with the disadvantageous situation, those excluded
countries try to join existing FTAs or set up their own new FTAs. This way the number
of FTAs expanded.
Faced with discriminatory situation resulting from a rapid expansion of FTAs,
Japan and Korea changed their attitude toward FTAs from negative to positive. Another
reason is the break out of the Asian Financial Crisis (AFC). Korea suffered seriously from
AFC that began in June 1997 in Thailand. The crisis spread through other Asian countries
including Indonesia, Korea, Philippines and Malaysia. Faced with the crisis situation,
Korea approached Japan and other countries, in order to obtain various types of
cooperation including provision of emergency loans. Another type of economic
cooperation sought by the leaders is the formation of FTAs. Many bilateral FTAs that
were proposed and studied later became to be negotiated and then enacted in the 21st
century, to which we turn in the next section.

5
III. 2000s: ASEAN+1 FTAs and Beginning of Discussions on Region-Wide FTAs:
ASEAN+3FTA, ASEAN+6 FTA, CJK FTA and TPP
The early 2000s saw the enactment of a series of bilateral FTAs involving East
Asian countries, beginning with Japan-Singapore FTA in 2002. While Japan and Korea
became active in establishing FTAs, China did not show an interest in FTAs. However,
after China joined the WTO in 2001 and established an access to the world market, it
started to pursue regional strategies by using FTAs. China’s approach toward FTAs was
quite different from those of other countries in several respects, and thus many East Asian
countries, especially Japan and Korea, were caught by surprise. First, unlike Japan and
Korea that pursued bilateral FTAs, China approached ASEAN as a group to form an FTA.
Second, China-ASEAN FTA contains the components that have not been incorporated in
other FTAs. Specifically, China offered various schemes attractive to ASEAN and
particularly to its new members such as economic cooperation for the new ASEAN
members and advanced trade liberalization (early harvest) in tropical foods and other
products.
Several factors may be considered behind China’s active FTA policy. One is to
maintain and expand export markets and another is reduced adjustment costs for trade
liberalization as a result of substantial trade liberalization committed before its entry to
the WTO. China started to have a concern about its export market because of the increase
in FTAs and increase in protectionist measures against Chinese exports, particularly in
the form of antidumping charges. Faced with these obstacles to the expansion of its
exports, China considered FTAs as possible solution. China’s positive attitude toward
FTAs was attributable to the realization that China may not have to incur much additional
adjustment costs from FTAs because it had already committed to substantial trade
liberalization under the WTO. Besides these economic motives, it is commonly perceived
that China uses FTAs as regional policy to increase and strengthen its economic and non-
economic positions in East Asia.
China-ASEAN FTA triggered the Domino effect in that Japan, Korea, Australia-
New Zealand, and India individually approached ASEAN to establish FTAs. Although
there was a strong tendency for these FTAs to have been brought to ASEAN by the other
party rather than ASEAN working towards them, the fact that partner countries were able
to be made aware of the political and economic importance of ASEAN indicates high
diplomatic abilities of ASEAN. China-ASEAN FTA was enacted in 2005. Other FTAs
involving ASEAN as a group were enacted during the subsequent period, and by 2010
five ASEAN+1 FTAs (each with China, Japan, Korea, India, and Australia-New Zealand)
6
were enacted, making ASEAN a regional hub of FTAs in East Asia. Table 1 shows the
level of trade liberalization for five ASEAN+1 FTA. The figures show the percentage of
tariff lines (HS-6 digit) that are committed to be tariff elimination in total tariff lines.
ASEAN+ANZ FTA has the highest level of tariff elimination, while ASEAN+India FTA
has the lowest. These differences lead to difficulty in forming a region-wide FTA, which
will be discussed in section IV.
The concept of an FTA that encompasses all countries of East Asia emerged in
the late 1990s. At the ASEAN+3 (China, Japan, Korea) summit meeting in 1998, the East
Asia Vision group was suggested to be established by President Kim Dae Jung of Korea,
to study goals for long-term economic cooperation. This group submitted a policy
proposal including the formation of an East Asian FTA (EAFTA) to its leaders in 2002.
In 2005, a research group of private-sector experts was formed to examine the possibility
of achieving an EAFTA, and after completing a first and second phase compiled a 2009
proposal that intergovernmental discussions should begin. Thereafter, a working group
centered around the Chinese government was formed to discuss important themes such
as the definition of rules of origin for the creation of an FTA at the regional level.
Soon after the research group for EAFTA was formed, Japan proposed the idea
of a Comprehensive Economic Partnership for East Asia (CEPEA) in 2006 as an
economic partnership agreement to include an FTA with the member countries of
ASEAN+3+3 (ASEAN, China, Japan, Korea, India, Australia and New Zealand).
ASEAN+3+3 (ASEAN+6) also comprises the members of the East Asian Summit
meeting that was launched in 20057. Considering the rivalry between Japan and China,
and keeping in mind that China was the country that took the initiative in discussing the
EAFTA, it can be understood that the backdrop to the CEPEA concept was Japan’s
strategy to play a leadership role in creating regional institutions in East Asia. A research
group of private-sector researchers to study the feasibility of the CEPEA started in 2007,
and it passed through first and second phases, proposing in 2009 that discussions between
governments should begin. From this recommendation, just like the case of EAFTA, the
government extracted important themes for achieving a CEPEA, including the rules of
origin, and is furthering discussion under a working group.
The activities and research surrounding the EAFTA and CEPEA moved in
parallel, often organizing discussions back to back. It is clear that China and Japan were
respectively taking the leadership role in each group, but ASEAN countries, which did
not want to deepen the opposition by aligning with one or the other, participated in both
activities with equal weight. Amidst these circumstances, ASEAN countries were
7 Since then, the US and Russian joined the East Asian Summit group.

7
strengthening their voice in both frameworks and became to engage actively in order to
take the lead in the discussions on regional integration in East Asia. Japan and China both
participated in EAFTA and CEPEA activities for the reason that there is a common
understanding that maintaining favorable relations between the two countries is important
for the promotion of regional integration in East Asia. In fact, through EAFTA and
CEPEA activities it may be considered that the rival attitudes of Japan and China seemed
to have decreased.
One goal of founding EAFTA and CEPEA is to increase the level of economic
activity by forming an integrated market in East Asia. In 2000s five ASEAN+1 FTAs
were about to be completed, but these FTAs did not result in a unified single market. FTAs
connecting +6 countries (China, Japan, Korea, India, Australia-New Zealand) were
missing. If a single market like that of Europe were created in East Asia as well, the
elements that carry out an important role in economic activity, such as people, goods and
capital, would come to move actively, and economic growth and prosperity could be
expected. More specifically, the expansion and smoother utilization of the regional
production network that extends through East Asia would become possible as a result of
forming a free and open single market, resulting in higher economic growth.
There is a view that an EAFTA or CEPEA that encompasses the East Asian
countries can be founded by combining the existing ASEAN+1 FTAs. Theoretically this
is not incorrect, but the contents of the ASEAN+1 FTAs are quite different for each FTA
and so in reality it is not quite that easy. Furthermore, it is the delay in moving towards
creating FTAs among the three countries of Japan, China and Korea that is hindering the
founding of the EAFTA and CEPEA. Negotiations for a Japan–Korea FTA began in 2003,
but were broken off in 2004 without coming to an agreement regarding the framework
for negotiations. Japan wants to avoid market opening for its agricultural and fishery
industries and Korea fears a negative effect on small and medium enterprises resulting
from market opening in the area of manufactured products, and so between these
countries opposing opinions over market opening are a barrier. Japan’s industrial sector
is extremely forward-looking regarding a Japan–China FTA but Japanese agriculture fears
damage from market opening and is firm in its stance of opposition. Factors that make a
Japan–South Korea and a Japan–China FTA difficult do not only include the economic
factors mentioned above but also include problems of history and politics.
An idea of China-Japan-Korea (CJK) FTA was proposed informally by Chinese
Premier Zhu Rongi at the leaders meeting in 2002. This proposal led to the initiation of a
“private sector” study involving three countries. The study that began in 2003 continued
until 2009 with a recommendation to begin a feasibility study involving government,
8
business, and academics. A joint research group of government, business, and academia
was founded in 2010 by Japanese, Chinese and South Korean leaders to consider the
feasibility of a trilateral FTA; and it produced a report in December 2011, indicating that
the trilateral FTA would bring benefits to all three countries and recommending
governments to decide on how to proceed with a possible trilateral FTA.
While East Asian countries became active in discussing the possible formation
of region-wide FTAs, some economies/countries belonging to Asia-Pacific Economic
Cooperation (APEC) began to discuss the formation of a region-wide FTA with high level
of trade liberalization. At several APEC meetings in the 1990s, Australia, Chile, New
Zealand, Singapore and the United States (P5) held informal discussions intended to
discuss mechanisms for creating a new type of trade agreement among “like-minded”
states8. Out of P5, Chile, Singapore and New Zealand, which shared very high enthusiasm
for establishing a high-level FTA, launched the negotiations at the APEC Leaders'
Summit in 2002. Brunei joined the negotiations in 2005 9 . P4, consisting of Chile,
Singapore, New Zealand, and Brunei, was enacted in 2006.
It may be important to note that several attempts at trade liberalization under the
APEC framework had been unsuccessful, leading to the formulation of P4. One is slow
progress toward achieving the Bogor Goals of free trade and investment, and another is
the failure of the Early Voluntary Sectoral Liberalization (EVSL). In Bogor in 1994 APEC
Leaders committed to achieve free trade and investment by 2010 for industrialized
economies and by 2020 for developing economies. APEC Leaders introduced the Osaka
Action Agenda (OAA) in 1995 and the Manila Action Plan in 1996, in order to make
progress toward the Bogor Goals, but the progress was disappointingly slow and small.
The EVSL was an initiative developed by the APEC trade ministers in 1997 to liberalize
the selective sectors, which were agreed upon by the APEC members, as a way to pursue
the OAA10. The EVSL was not implemented as Japan refused to liberalize forestry and
fish products, food and oil seeds. It should be noted that slow progress on multilateral
trade liberalization negotiations under the WTO and the increasing number of FTAs in
many parts of the world were also factors leading to the formation of P4.
P4 is a comprehensive FTA covering broad range of issues including trade in
goods and services, rules of origin, trade remedies, sanitary and phytosanitary (SPS)
8 Elms and Lim (2012). Elms and Lim provides a detailed discussions on the origin and
evolution of the TPP. 9 New Zealand Ministry of Foreign Affairs http://www.mfat.govt.nz/Trade-and-
Economic-Relations/2-Trade-Relationships-and-Agreements/Trans-Pacific/2-P4.php 10 See, Okamoto (2000), for the detailed account of the discussions regarding the
EVSL.

9
measures, technical barriers to trade (TBT), competition policy, intellectual property,
government procurement, economic cooperation, and dispute settlement11. P4 is a high
level FTA requiring the members to eliminate tariffs on basically all the products by 2015.
The primary objective of P4 is the establishment of a business friendly environment under
which free trade and investment are achieved with fair competition and effective
protection and enforcement of intellectual property rights12. Another important objective
is to support the APEC process toward the goals of free and open trade and investment.
In other words, the founding members hoped P4 to become a foundation for a larger trade
agreement by accepting new members.
In March 2008, P4 members began negotiations on trade in financial services
and investment, in order to broaden P4’s issue coverage. Broadening the issue coverage
to meet the demands/needs of the businesses was one of notable characteristics of P4,
which is known as a living agreement. In September that year the United States, which
was interested in liberalization of financial services and investment, made an
announcement to seek to join the expanded P4 negotiations. The Obama Administration,
which began in January 2009, decided to join the expanded P4 negotiations in November
2009. Australia, Peru, and Vietnam quickly joined the US in expressing the intention of
joining the negotiations. During this period the P4 became the Trans-Pacific Partnership
(TPP). It should be noted that the emergence of the discussions on the formulation of
region-wide FTAs in East Asia, in the forms of ASEAN+3 and ASEAN+6 FTAs made the
US interested in TPP, which encompasses the countries in both sides of the Pacific, in
order not to be kept out from East Asia.
Before closing this section on the discussion of region-wide FTA developments
in 2000s, it should be noted that the US proposed a Free Trade Area of Asia-Pacific
(FTAAP), which includes all APEC member economies, in 2006. An idea of an FTAAP
was first presented by APEC Business Advisory Council (ABAC), representing business
community, in 2005. This idea was taken up by the US government, which thought
FTAAP would play an important role for the US businesses to maintain access to a fast
growing East Asian market. At the APEC summit meeting that was held in Yokohama in
2010, an FTAAP was considered a primary means for regional economic integration in
the Asia–Pacific, and EAFTA, CEPEA and the Trans–Pacific Strategic Economic
Partnership (TPP) were considered the path to realizing FTAAP. China proposed a
feasibility study for the realization of FTAAP at Beijin APEC in 2014. A feasibility study
11 Trans-Pacific Strategic Economic Partnership Agreement
http://www.mfat.govt.nz/downloads/trade-agreement/transpacific/main-agreement.pdf 12 ibid.
10
entitled “Collective Strategic Study on Issues Related to the Realization of the FTAAP”
and headed jointly by China and the US was launched and the report was delivered at
APEC Leaders’ meeting in Peru in 2016. Although a roadmap to the realization of the
FTAAP was expected from the study, the report did not provide concrete plans to meet
the expectation.
IV. 2010s: Negotiation of Mega FTAs: RCEP and TPP
Enlarged TPP negotiation with eight countries including Brunei, Chile, New
Zealand, Singapore, Australia, Peru, the US, and Vietnam began in March 2010. After the
negotiations began, four countries joined; Malaysia in October 2010, Canada and Mexico
in 2012, and Japan in 2013. The fact that the number of negotiating countries increased
during the negotiation process is quite unusual and it may reflect the importance of the
TPP for many countries. TPP negotiations lasted for 5 years and 7 months before reaching
an agreement in October 2015. The TPP agreement was signed by the TPP members in
February 2016. The ratification process began after the signing. At the time of writing
(May 2017), Japan and New Zealand ratified the TPP agreement. Enactment of the TPP
is unlikely now that US President Donald Trump announced a withdrawal of the US from
the TPP agreement. US ratification is a necessary condition for the enactment of the TPP
treaty.
Turning to EAFTA and CEPEA, the government level discussions began in 2010,
following the recommendations by feasibility studies. Discussions proceeded in parallel
until 2011, when Japan and China jointly proposed the founding of a working group, in
order to accelerate the formation of an EAFTA and CEPEA. This joint move by China
and Japan, which were competing for a leadership role in the establishment of a region-
wide FTA, resulted from a desire on the part of China to move forward an East Asian
FTA, either EAFTA or CEPEA, in light of the fact that the TPP negotiations began to
make progress.
While China and Japan were taking the lead in the formation of a region-wide
FTA in East Asia, the ASEAN countries, which did not wish to deepen opposition by
deciding an order of precedence, participated in both activities (EAFTA and CEPEA) with
equal weight. But the joint proposal by China and Japan for accelerating EAFTA and
CEPEA pushed the ASEAN countries, which feared losing a central role in the movement
towards East Asian regional framework, to respond by proposing a Regional
Comprehensive Economic Partnership (RCEP) in 2011. RCEP is a framework that does
not specify membership such as ASEAN+3 or ASEAN+6, and that can be joined by East
Asian countries that are prepared to sign an FTA with ASEAN. A statement was released

11
for launching RCEP negotiations at the ASEAN+6 summit meeting held in November
2012, and as a result, the movement towards founding an EAFTA and CEPEA were
unified in RCEP. Negotiations did not begin until May 2013. It is argued that Japan’s
announcement about its participation in TPP negotiation in March 2013 pushed RCEP
members, especially non-TPP members such as China, to begin negotiations. Indeed, it is
interesting to note that the negotiations for CJK FTA and TTIP (Trans-Atlantic Trade and
Investment Partnership involving the US and the EU) began in March and July 2013,
respectively, possibly triggered by the intensification of TPP negotiations. This kind of
chain-reaction or the Domino effect has been discerned concerning FTAs and such
phenomenon is described as “competitive regionalism.”13 RCEP negotiations missed the
target for conclusion twice, December 2015 and December 2016. 18th round of
negotiations finished in May 2017 and the prospects for reaching a conclusion by the end
of 2017, another target, seem rather dim.
The remaining of this section provides a comparison of TPP and RCEP. The TPP
text has been released and thus the contents are known. However, RCEP are still under
negotiations, and thus discussions on the contents of RCEP, which are yet to be known,
are bound to suffer from uncertainty. In the discussion on RCEP we rely on the limited
information obtained from various sources including the official documents and press
reports.
Let us compare TPP and RCEP in terms of their objectives, the contents and the
quality of the agreements. The objectives of TPP and RCEP seem quite different. The
objective of the TPP is to enhance trade and investment among the TPP partner countries,
promote innovation, economic growth and development, and support the creation and
retention of jobs14 . These objectives are to be achieved by establishing a high-level,
comprehensive, next generation trade agreement that liberalizes trade and investment and
addresses new and traditional trade issues and 21st century challenges.15 It is further
envisaged to become a model for other free trade agreements in the future.
The objective of RCEP is to achieve a modern, comprehensive, high-quality and
mutually beneficial economic partnership agreement among the ASEAN Member States
and ASEAN’s FTA Partners, in order to support and contribute to economic integration,
13 Solis, et al (2009) 14 USTR website.
http://www.ustr.gov/about-us/press-office/fact-sheets/2011/november/united-states-trans-
pacific-partnership
15 TPP Leaders’ Statement on November 12, 2011. http://www.ustr.gov/about-us/press-office/press-releases/2011/november/trans-pacific-partnership-leaders-statement.

12
equitable economic development and strengthening economic cooperation among the
participating countries.16
Although both TPP and RCEP are aimed to establish high-quality and
comprehensive trade agreement, in order to promote economic growth and development,
there are differences in their emphasis between economic growth and economic
development. One of the most important elements for RCEP is to achieve equitable
economic development through economic cooperation. By contrast, TPP does not put
much emphasis on economic cooperation. It is only natural that RCEP puts an emphasis
on economic cooperation as the RCEP members includes least-developed countries such
as Cambodia, Lao PDR, and Myanmar, whose successful economic development is very
important for region’s sustainable economic growth and social stability.
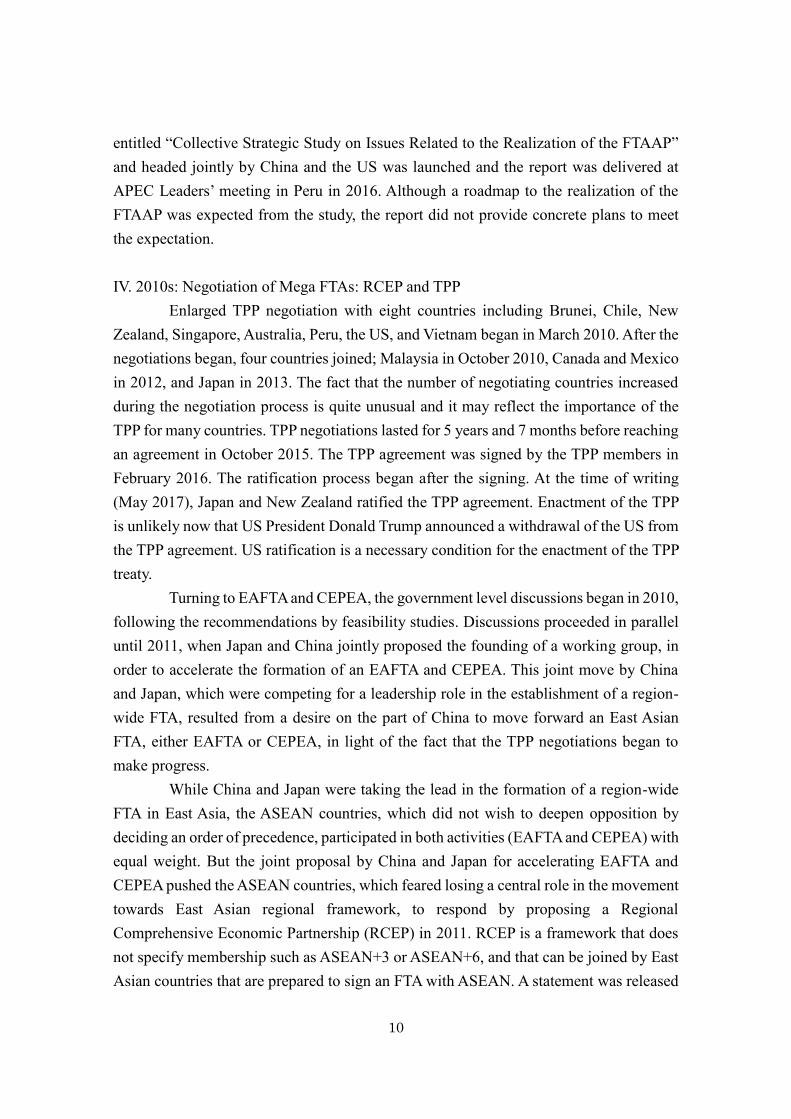
The coverage of the issues for TPP and RCEP appears quite different. RCEP
covers trade in goods, trade in services, investment, economic and technical cooperation,
intellectual property, competition, dispute settlement and other issues, whereas TPP's
coverage is broader and more comprehensive, including the following areas (Table 2):
market access in industrial goods, agriculture, textiles, technical barriers to trade (TBT),
sanitary and phytosanitary measures (SPS), rules of origin, customs cooperation,
investment, services, financial services, telecommunications, E-commerce, business
mobility, government procurement, competition, intellectual property, labor, environment,
capacity building, trade remedies, and legal and institutional frameworks. In addition to
these issue-specific areas, cross-cutting "horizontal issues" such as regulatory coherence,
competitiveness, development, and small and medium enterprises are also addressed.
Having discussed the differences in the issue coverage between RCEP and TPP,
the comparison made above is quite deceptive because the description of the issue
coverage in RCEP (2012) is very rough and not detailed, compared to the case for TPP.
If one considers the contents of the issue coverage of RCEP more in details, one realizes
that the differences between the two are much less significant. Table 2 indicates that the
major differences are environment, government procurement, labor, and cross-cutting
horizontal issues such as regulatory coherence, which are covered in TPP but not in RCEP.
Although these are only four issue areas out of many areas, these are regarded very
important for developed countries such as the US, in order to achieve a level-playing field
in competition and to achieve sustainable economic growth, while these issue areas pose
16 RCEP (2012) “Guiding Principles and Objectives for Negotiating the Regional
Comprehensive Economic Partnership
https://dfat.gov.au/trade/agreements/rcep/Documents/guiding-principles-rcep.pdf

13
challenges to developing countries.
A closer look at the contents of TPP and RCEP revealed that the contents are
similar with some important differences. What is likely to be quite different is the level
of commitment or the quality of the contents of the agreements. One of the areas where
the differences in the level of commitments are clearly seen is the level of trade
liberalization, or market access in goods’ trade. The TPP is seeking for complete
elimination of tariffs, or 100 percent trade liberalization, although in reality trade
liberalization rates (proportion of the number of tariff lines subject to tariff elimination in
total number of tariff lines) for some members are lower than 100 percent because of
political sensitivities concerning some products such as sugar for the US and the rice for
Japan (Table 3). By contrast, the trade liberalization rate for RCEP is likely to be
substantially lower compared to the case for TPP. Some observers predict 90 percent trade
liberalization, considering the trade liberalization achieved by five ASEAN+1 FTAs.
ASEAN countries achieved nearly 90 percent trade liberalization in each ASEAN+1 FTA
(Table 1), while only 73.3 percent of tariff lines are commonly eliminated vis-à-vis their
ASEAN+1 FTA partners. Considering that common tariff concessions are adopted in the
RCEP negotiation, even achieving 90 percent trade liberalization requires significant
efforts on the part of ASEAN members. Furthermore, it should be pointed out that India
has the lowest trade liberalization rate at 78.8 percent in its FTA with ASEAN, indicating
substantial difficulty in achieving 90 percent trade liberalization. If one considers that
India is very much concerned with possible increase of imports from China, India is not
likely to achieve the rate achieved in its FTA with ASEAN (78.8%). Non-ASEAN RCEP
members also have to make enormous efforts in achieving 90 percent trade liberalization
except for Australia and New Zealand, which have achieved 100 percent trade
liberalization in their FTA with ASEAN.
Another major difference between TPP and RCEP is the treatment of the least-
developed countries. ASEAN+6 trade ministers agreed to provide special and differential
treatment to the least-developed ASEAN Member States in RCEP. Considering
substantial differences in the levels of economic development of the RCEP negotiating
members, this special and differential treatment is understandable and consistent with the
arrangements adopted in ASEAN+1 FTAs. Specific examples of special and differential
treatment of the least-developed ASEAN Member States in the ASEAN+1 FTA include
the postponement of trade liberalization by new ASEAN members in ASEAN-China FTA.
TPP does not provide special and differential treatment to the least-developed members
in terms of the contents of the agreements, although it may provide different schedule for
the implementation of the agreement to the least-developed countries.

14
Finally, it should be noted that the modes of agreement are likely to be different
between TPP and RCEP. Despite very comprehensive contents as shown above, TPP
members need to accept all of these contents/components from the outset in the form of
single undertaking. Single undertaking has been a practice for the comprehensive FTAs
involving the US. Contrary to TPP, RCEP is likely to adopt a gradual and sequential
approach, where different components are negotiated and implemented under different
time schedule, depending on the difficulty in reaching an agreement.
V. Changing Patterns of Intra-regional Trade in East Asia
We argued that East Asia has been witnessing the emergence of regional
economic integration since the 1980s. We also argued that the characteristics of regional
economic integration in East Asia changed from market-driven to institution-driven
regional economic integration since the 1990s, particularly after the turn of the century.
These discussions are presented without referring to the statistics. In this section we
examine how trade patterns changed in East Asia. In particular, we are interested in the
changes in the intra-regional trade patterns.
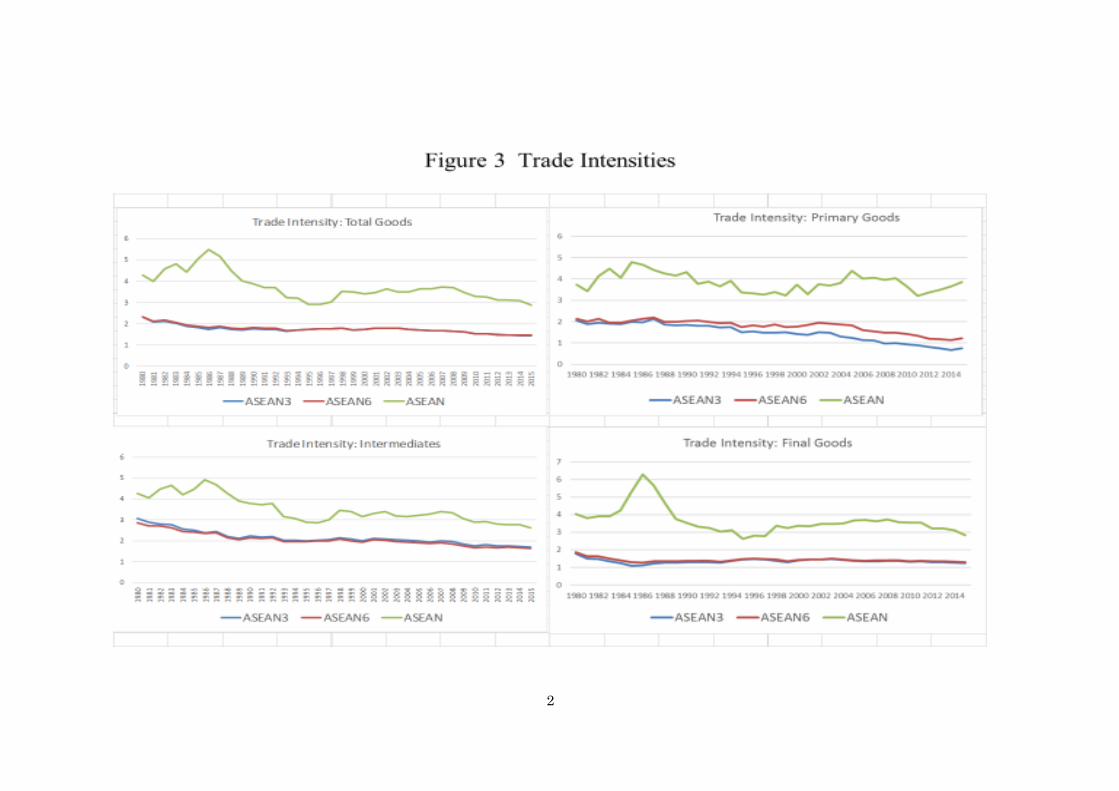
Figure 2 shows the changing patterns of intra-regional trade for ASEAN+3,
ASEAN+6 and ASEAN member countries. Specifically, the share of intra-regional trade
in region’s overall trade (intra-regional trade share) is computed for the three groups of
the countries. The figures for total goods show that ASEAN+6 has the highest share (35-
45%), and ASEAN+3 has the second-highest share (30-40%), while ASEAN has the
lowest share (20%). The intra-regional trade share for ASEAN+6 and ASEAN+3 rose
notably from the mid-1980s through 2015 more or less steadily, while the intra-regional
trade share for ASEAN stayed around the same level. These patterns reflect the fact that
China’s trade with East Asian countries including ASEAN countries increased
significantly. More or less similar patterns may be found for intermediate goods and final
goods for the three groups of countries, although the levels of intra-regional trade shares
differ between them. Intra-regional trade share is higher for intermediate goods than final
goods. This observation is attributable to the development of regional production
networks, under which intermediate goods including parts and components are actively
traded inside the East Asia region. A large increase in the intra-regional trade share
observed for final goods for ASEAN+3 and ASEAN+6 appear to reflect the fact that the
East Asian region has become a large market for final goods, thanks to rapid economic
growth. In contrast to the cases of intermediate goods and final goods, the intra-regional
trade share for primary goods declined for the three groups of the countries. This pattern
may be explained by rapid industrialization of East Asian countries, resulting in a

15
reduction in the share of primary sector in their production structure.
We would like to find out if institution-driven regional economic integration
contributed to a rise in intra-regional dependence. In order to examine the validity of this
observation, we need rigorous statistical analysis, which we discuss later. Before we do
so, let us see very roughly if the hypothesis may be supported by computing the trade
intensity index, which measures the intensity of trade linkage between two
countries/regions by taking into account of the magnitude of trade of the countries/regions.
If the intensity is greater (smaller) than unity, then bilateral trade linkage is considered
above (below) world average. Trade intensity index is regarded superior to intra-regional
trade ratio in measuring the degree of bilateral trade linkage.
One could argue that institution-driven regional economic in the form of FTAs
expanded intra-regional trade if the trade intensity index increased after the establishment
of regional economic institution such as FTAs. With these observations in mind, let us see
how the trade intensity index changed over time. One may detect a slight increase in the
index for ASEAN from the early 1990s to mid-2000s, probably caused by the enactment
of AFTA in 1993. The index for ASEAN+3 and ASEAN+6 declined over time, albeit a
small decline. Although a number of bilateral FTAs involving East Asian countries have
been established, there have not yet established ASEAN+3 or ASEAN+6 FTAs.
ASEAN+1 FTAs began to be formed in the mid-2000s. Given these situations, it may not
be surprising to observe a decline in the trade intensity index. Having made these
observations, casual and visual observations are subject to inaccuracy. We need to conduct
a rigorous statistical analysis in order to examine the impacts of FTAs on trade, to which
we turn next.
There have been a large number of studies that examined the impacts of FTAs
on trade by adopting statistical analysis. But studies on East Asian countries are rather
few. One of them is Okabe and Urata (2014) that investigated the impacts of tariff
reduction on intra-ASEAN trade. Their econometric analysis using trade data at product
level revealed positive and statistically significant trade creation effects for a wide range
of products. They also found that trade creation effects are smaller for new AFTA
members compared to AFTA original members. They argue that the information about
the merits of using AFTA may not have been spread to exporters in these countries.
Studies on the impacts of ASEAN+1 FTAs on trade involving ASEAN+1 countries
should be high on future research agenda.
VI. Concluding Remarks
Almost two decades have passed since the discussions on a region-wide FTA in
16
East Asia began. Substantial progress has been made, but a region-wide FTA has not yet
been established. The TPP became very close to be enacted, but US withdrawal from the
TPP has made it almost impossible for the TPP to be enacted. TPP countries without the
US, or TPP11, are discussing the ways to form TPP11. Indeed, trade ministers from
TPP11 countries agreed to conclude the talks by November this year.
As a result of the US withdrawal from the TPP, RCEP is receiving a lot of
attention as an important region-wide FTA in East Asia. RCEP negotiations began in 2013
and after 4 years the negotiation team has not reached an agreement. Difficult issues have
been identified and discussions on these issues appear to have reached a deadlock. One
of the most difficult issues is the level of tariff elimination in the market access
negotiations. Countries such as Australia and Japan demand high level of tariff
elimination exceeding 90-95 percent, while countries such as India and China,
particularly India, insist much lower level of tariff elimination. Possible conclusion may
require either one of the following three options. One is to accept low level of tariff
elimination. Another is to drop the countries that cannot accept high level of tariff
elimination. The other alternative, which I think may be the best, is to set a high level
target and allow countries to achieve the target with transition period, depending on the
level of economic development.
In light of growing protectionism in the world, it is important for East Asia to
fight against growing protectionism by concluding RCEP negotiations. Strong political
will by the Leaders based on the understanding of the importance of RCEP for regional
cooperation and economic growth is needed for the negotiations to reach an agreement.
In order for the Leaders to commit to RCEP, they need strong support from business
community and general public. Researchers and journalists, who have strong influence
on the opinion of general public, need to provide evidence on the possible benefits of
RCEP to the public.

17
References
ASEAN (2008) ASEAN Economic Community Blue Print
ASEAN (2017) ASEAN Economic Community 2025 Consolidated Strategic Action Plan
http://asean.org/storage/2017/02/Consolidated-Strategic-Action-Plan.pdf
Economic Research Institute for ASEAN and East Asia [ERIA] (2014) ASEAN Rising:
ASEAN and AEC Beyond 2015
http://www.eria.org/publications/key_reports/ASEAN-Rising.html
Elms, D.K. and C.L. Lim (2012) “An Overview and snapshot of the TPP negotiations,”
C.L.Lim, D.K. Elms, and P. Low eds. The Trans-Pacific Partnership: A Quest for a
Twenty-first-Century Trade Agreement, Cambridge University Press, Cambridge, U.K.
Kuno, A., Y. Fukunaga, and F. Kimura (2015) “Pursuing a Consolidated Tariff Structure
in the RCEP: Sensitivity and Inconsistency in ASEAN’s Trade Protection.” In
Christopher Findlay ed. ASEAN and Regional Free Trade Agreements, Routledge
Okamoto, J. (2000) “The Political Process of APEC Early Voluntary Sectoral
Liberalization: Setting the Research Agenda,” Working Paper Sercies 99/00-No.1, APEC
Study Center, Institute of Developing Economies.
Solis, M., B. Stallings, and S. Katada eds. (2009) Competitive Regionalism: FTA
Diffusion in the Pacific Rim, Palgrave Macmillan, England
Urata, S. (2004) “The Shift from ‘Market-led’ to ‘Institution-led’ Regional Economic
Integration in East Asia in the late 1990s” RIETI Discussion Paper, 04-E-012
http://www.rieti.go.jp/jp/publications/dp/04e012.pdf

18

Table 1. Tariff Elimination Rates for ASEAN+1 FTAs
ASEAN-
ANZ
ASEAN-
China
ASEAN-
India
ASEAN-
Japan
ASEAN-
KoreaAverage
Brunei 99.2 98.3 85.3 97.5 99.1 95.9
Cambodia 89.1 89.9 88.4 85.1 90.8 88.7
Indonesia 93.1 92.3 48.6 91.2 91.1 83.3
Lao PDR 91.8 97.4 80.1 86.3 90.0 89.1
Malaysia 97.3 92.6 79.7 93.9 92.4 91.2
Myanmar 88.1 93.6 76.6 84.9 91.6 86.9
Philippines 95.1 92.5 80.9 97.1 89.6 91.1
Singapore 100.0 100.0 100.0 100.0 100.0 100.0
Thailand 98.9 93.5 78.1 96.4 95.1 92.4
Vietnam 94.8 92.2 79.5 94.2 89.3 90.0
Australia 100.0
China 94.7
India 78.8
Japan 91.9
Korea 90.4
New Zealand 100.0
Average 95.6 94.3 79.6 92.6 92.7 90.9
Note: The share of tariff elimination in total # of imports, compuated at HS 6-digit level
Source: Kuno et al (2015)
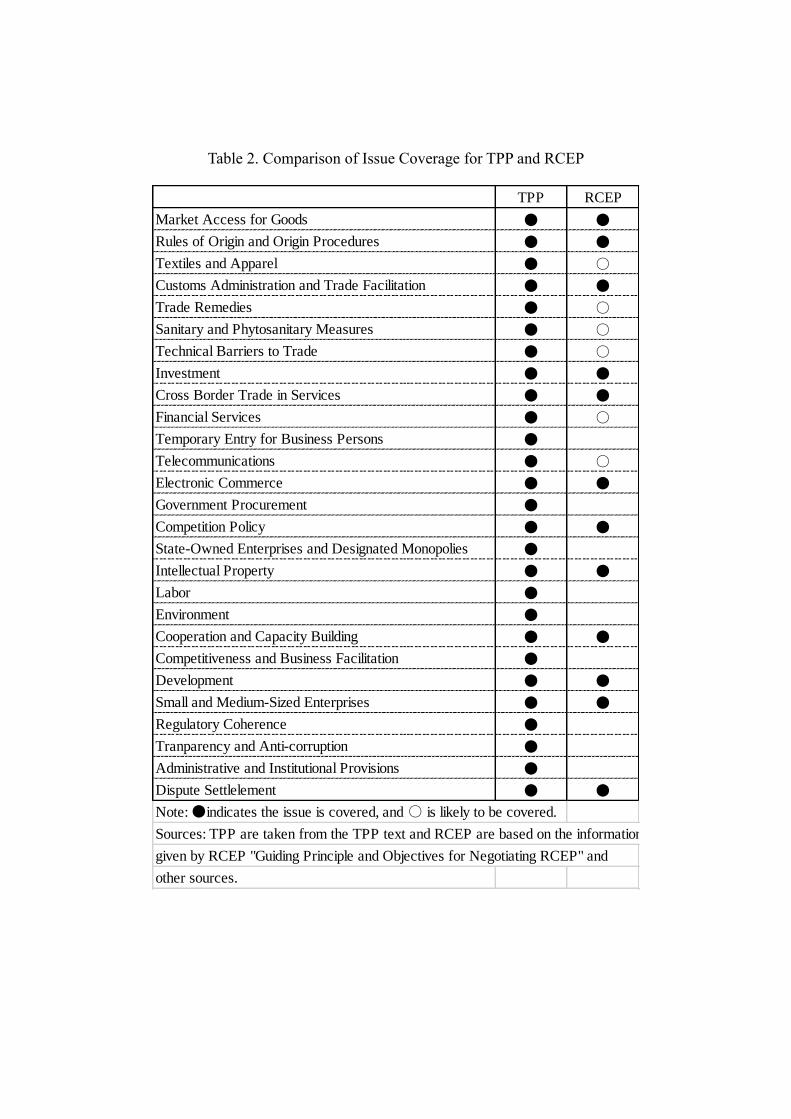
Table 2. Comparison of Issue Coverage for TPP and RCEP
TPP RCEP
Market Access for Goods ● ●
Rules of Origin and Origin Procedures ● ●
Textiles and Apparel ● ○
Customs Administration and Trade Facilitation ● ●
Trade Remedies ● ○
Sanitary and Phytosanitary Measures ● ○
Technical Barriers to Trade ● ○
Investment ● ●
Cross Border Trade in Services ● ●
Financial Services ● ○
Temporary Entry for Business Persons ●
Telecommunications ● ○
Electronic Commerce ● ●
Government Procurement ●
Competition Policy ● ●
State-Owned Enterprises and Designated Monopolies ●
Intellectual Property ● ●
Labor ●
Environment ●
Cooperation and Capacity Building ● ●
Competitiveness and Business Facilitation ●
Development ● ●
Small and Medium-Sized Enterprises ● ●
Regulatory Coherence ●
Tranparency and Anti-corruption ●
Administrative and Institutional Provisions ●
Dispute Settlelement ● ●
Note: ●indicates the issue is covered, and ○ is likely to be covered.
Sources: TPP are taken from the TPP text and RCEP are based on the information
given by RCEP "Guiding Principle and Objectives for Negotiating RCEP" and
other sources.

Table 3. Tariff Elimination Rates for TPP
Actual Figures (2015) TPP Commitments
Agricultural products Manufactured products Total Agricultural products Manufactured products
Final boundMFN
appliedFinal bound
MFN
applied
Eventual
elimination
Immediate
elimination
Eventual
elimination
Immediate
elimination
Eventual
elimination
Australia 31.3 77.0 18.8 45.9 100 99.5 100 91.8 99.8
Brunei 0.0 98.5 0.0 78.5 100 98.6 100 70.2 96.4
Canada 46.0 59.6 25.8 78.5 99 86.2 94.1 96.9 100
Chile 0.0 0.0 0.0 0.3 100 96.3 99.5 94.7 100
Japan 34.1 36.5 55.9 55.7 95 51.3 81 95.3 100
Malaysia 12.9 75.0 5.0 64.1 100 96.7 99.6 78.8 100
Mexico 0.4 19.6 0.3 55.2 99 74.1 96.4 77 99.6
New Zealand 54.8 72.4 46.4 62.5 100 97.7 100 93.9 100
Peru 0.0 52.6 2.2 70.0 99 82.1 96 80.2 100
Singapore 4.1 99.8 17.0 100.0 100 100 100 100 100
United States 30.2 30.8 47.4 48.4 100 55.5 98.8 90.9 100
Viet Nam 8.7 15.5 15.0 38.8 100 42.6 99.4 70.2 100
Source: WTO Tariff Profiles, and Japanese Government, Cabinet Secretariat, TPP Section


1
2