drag coefficient of a stationary sphere in gradient flow
TRANSCRIPT

This article was downloaded by: [University of Minnesota Libraries, Twin Cities]On: 22 May 2013, At: 00:50Publisher: Taylor & FrancisInforma Ltd Registered in England and Wales Registered Number: 1072954 Registeredoffice: Mortimer House, 37-41 Mortimer Street, London W1T 3JH, UK
Journal of Hydraulic ResearchPublication details, including instructions for authors andsubscription information:http://www.tandfonline.com/loi/tjhr20
Drag coefficient of a stationary spherein gradient flowP. C. Patnaik a , P. K. Pande b & Nandana Vittal ba R.E. College, Rourkela, Indiab Univ. of Roorkee, Roorkee, IndiaPublished online: 19 Jan 2010.
To cite this article: P. C. Patnaik , P. K. Pande & Nandana Vittal (1992): Drag coefficient of astationary sphere in gradient flow, Journal of Hydraulic Research, 30:3, 389-402
To link to this article: http://dx.doi.org/10.1080/00221689209498926
PLEASE SCROLL DOWN FOR ARTICLE
Full terms and conditions of use: http://www.tandfonline.com/page/terms-and-conditions
This article may be used for research, teaching, and private study purposes. Anysubstantial or systematic reproduction, redistribution, reselling, loan, sub-licensing,systematic supply, or distribution in any form to anyone is expressly forbidden.
The publisher does not give any warranty express or implied or make anyrepresentation that the contents will be complete or accurate or up to date. Theaccuracy of any instructions, formulae, and drug doses should be independentlyverified with primary sources. The publisher shall not be liable for any loss, actions,claims, proceedings, demand, or costs or damages whatsoever or howsoever causedarising directly or indirectly in connection with or arising out of the use of this material.

Drag coefficient of a stationary sphere in gradient flow Coefficient de trainee d'une sphere immobile dans un écoulement cisaillé
P. C. PATNAIK Assistant Professor, R.E. College, Rourkela, India
P. K. PANDE Prof, of Civil Engineering, Univ. of Roorkee, Roorkee, India
SUMMARY This paper describes an experimental study of the drag force experienced by a stationary smooth sphere placed in a boundary layer type gradient flow. The test sphere was kept close to as well as away from the boundary. Both smooth and rough boundary conditions were studied. The Reynolds number varied in the range of 3.62 x 10³ to 6.45 x 10⁴ while the relative size defined as the ratio of sphere diameter to the nominal thickness of the boundary layer varied from 0.29 to 1.0. Notwithstanding its variation with the relative size, the drag coefficient-Reynolds number function in the present study is closer to that of a sphere falling freely through infinite fluid and appreciably below that for a sphere rolling allong smooth and rough boundaries.
RESUME L'article décrit une étude experimental sur la force de trainee d'une sphere lisse immobile placée dans la couche limite d'un écoulement cisaillé. La sphere d'essais était maintenue soit proche de la paroi, soit éloignée de celle-ci. Des conditions de paroi lisses et rugueuses ont été étudiées. Le nombre de Reynolds a varié dans l'intervalle 3,62 x 10³ - 6,45 x 10⁴ tandis qua la taille relative du phénomène, définie par le rapport du diamètrede la sphere a l'épaisseur nominale de la couche limite, a varié entre 0,29 et 1,00. Malgré sa variation avec la taille relative du phénomène, la loi coefficient de trainee - nombre de Reynolds dans la présente étude est proche de celle une sphere tombant librement dans un milieu infini et notablement endessous de celle d'une sphere roulant sur des parois lisses et rugueuses.
Introduction
Flow past a sphere placed in gradient flow exhibits complex features like unsymmetrical separation and non-uniform distribution of pressure and skin friction over the body surface. As a result, it exerts a force having components parallel and normal to the flow termed as drag and lift forces.
Revision received May 7, 1991. Open for discussion till December 31, 1992.
JOURNAL OF HYDRAULIC RESEARCH, VOL. 30, '992, NO. 3 389
NANDANA VITTAL Prof of Civil Engineering,
Univ. of Roorkee, Roorkee, India
Dow
nloa
ded
by [
Uni
vers
ity o
f M
inne
sota
Lib
rari
es, T
win
Citi
es]
at 0
0:50
22
May
201
3

Although the study of drag force on a smooth sphere in gradient flow has attracted the attention of many investigators in the past, it has not reached the thoroughness comparable to that in uniform flow. In the studies reported earlier, the condition of the boundary vis-a-vis the test sphere and the ranges of Reynolds number of flow were different in different studies. Aksoy [1], for instance, studied stationary sphere kept on smooth boundary, whereas Coleman [3] and Watters and Rao [10] dealt with a stationary sphere kept on a rough boundary. Garde and Sethuraman [7] on the other hand, investigated the case of sphere rolling along smooth and rough boundaries. The ranges of Reynolds number Ruo(= KQD/V) covered by Aksoy and Coleman are 2700 to 6600 and 50 to 9400 respectively, w0, D and v being the approach velocity at the level of sphere centre, the diameter of the sphere and the kinematic viscosity of the flowing fluid respectively. On the other hand Watters and Rao covered the range upto 100 for RUt (= ut Djv), ut being the shear velocity. Also there is very little information on drag force away from the boundary. The time-averaged drag coefficient is conventionally defined by all the investigators as
\QU%A
in which FD is the time-averaged drag force, uc is the characteristic velocity, Q is the mass density of the flowing fluid and A is the projected area of the body normal to the direction of flow. While Aksoy found CDu0 for smooth boundary to be greater than that given by the well known CD — R function for sphere in uniform flow and almost equal to that of sphere rolling along smooth boundary, Coleman reported it for rough boundary to be more or less the same as that of sphere in uniform flow but appreciably lower than that for sphere rolling along the boundary. In all these studies, drag coefficient has been looked upon as a function of Reynolds number alone and no other parameter characterising the gradient flow has been considered. For bodies kept in gradient flow, the choice of characteristic velocity for computing the drag coefficient and Reynolds number is of considerable importance. The choices of various investigators in this regard include the velocity at the top of the sphere w,, the velocity at its centre level «o, free stream velocity U, shear velocity w», the velocity averaged over the height of the sphere U] (= l/D)^ udy), the R.M.S. value of velocities over its height u2 (= V l/DJpM2 dy), u being the velocity at a distance y above the boundary. The present experimental investigation was taken up to provide further information and analysis of the aforementioned aspects of drag force on a sphere in gradient flow. The gradient flow considered herein is the boundary layer type. The drag force on a sphere kept in a turbulent boundary layer is governed by the variables characterising the boundary layer flow, the fluid and the size and location of the body i.e.
FD = h(U,t,n,Q,/i,D,yJ (2)
in which it is the dynamic viscosity coefficient of the fluid, yg is the clear gap between the body and the boundary and n is the reciprocal of the power law index of the boundary layer velocity profile
H*) (3) The variables U, ö and n in equation 2 characterising boundary layer flow, indirectly characterise the nature of boundary roughness, which in the present case is a close packing of boundary
390 JOURNAL DE RECHERCHES 11YDRAUL1QUES, VOL. 30, 1992. NO. 3
Dow
nloa
ded
by [
Uni
vers
ity o
f M
inne
sota
Lib
rari
es, T
win
Citi
es]
at 0
0:50
22
May
201
3

spheres. Also since the size of the boundary spheres is held the same during the present study, it is not included as one of the variables in equation (2). Replacing U by the characteristic velocity uc, equation (2) can be grouped as
For a sphere kept close to the boundary, equation (4) reduces to
CDuc = h(R^,DlS,n) (5)
The variables D and ö are managed in the present study so as to achieve maximum possible range for Djö since the main aim here is to bring out the effect of Djö on CDuc. The measured velocity profiles of the ambient flow are used to compare the suitability of some of the velocities mentioned above as characteristic velocities. The independent variables in equation (2) being common to both drag and lift, it is believed that the drag and lift forces are interrelated but can be analysed separately. Thus, while both drag and lift forces formed part of the experimental programme, this paper is concerned only with the study of mean and fluctuating drag force close to and away from the boundary, only a concise treatment of the lift force being included (for want of space) to put the study in proper perspective. The detailed treatment of lift investigations will be reported separately.
Experimental programme
The experiments were conducted in an open circuit wind tunnel with a test section of 0.510 m x 0.510 m cross-section. The tunnel was connected to the suction side of an industrial blower. The air speed through the tunnel could be regulated by a butterfly valve provided in the exhaust duct of the blower. The tests were carried out in the tunnel for smooth and rough conditions of the boundary. The existing tunnel floor served as the smooth boundary while the rough boundary condition was obtained by glueing 38 mm spheres to the tunnel floor in close packing. The details of the experimental set-up are given elsewhere (8). A wider range of {Djö) for smooth boundary could be obtained by testing three different sizes of the spheres, viz. 38 mm, 53 mm and 72 mm diametre and also by generating a shear flow profile by introducing a suitably designed plane grid across the flow before the test section. The grid was designed so as to give the same power law index for the velocity distribution as for the smooth boundary without the grid. On the rough boundary, the test sphere was tested in two configurations viz. configuration I-test sphere resting on three boundary spheres and configuration Il-test sphere resting on the crest of one of the boundary spheres. Subjected to the velocities available in the wind tunnel, attempt was made to achieve as large a range for the Reynolds number as possible and at the same time cover the ranges of the previous studies to enable make comparative studies.
Instrumentation
The velocity profiles were measured by a combination of total head and static head tubes made out of commercial hypodermic needles of 0.91 mm outside diameter. The combination was traversed vertically at the centre of the tunnel and the differential pressure was measured using the "Baratron" which is a capacitance type pressure transducer.
JOURNAL OF HYDRAULIC RESEARCH, VOL. 30, 1992, NO. 3 391
Dow
nloa
ded
by [
Uni
vers
ity o
f M
inne
sota
Lib
rari
es, T
win
Citi
es]
at 0
0:50
22
May
201
3

A spring activated parallel-link force dynamometer was developed which was capable of measuring drag and lift forces directly and simultaneously without the interference of lift on drag measurement and vice-versa. The arrangement of the force dynamometer is shown in Fig. 1. The drag and lift forces were sensed by linear displacement transducers along with the associated circuitory. Its efficient performance under dynamic condition was obtained by adjusting the stiffness of the dynamometer springs and the size of plates of dashpot shown in the figure.
Flow 14
16
13
* , I *^12 I»
K i
O u t p u t
8
N*Ou j t p u t
F i x e d s t r a p of l i f t f r a m e 7 M o v a b l e s t r a p of l i f t f r a m e 8 Fixed s t rap of d r a g f r a m e 9 Movable s t r a p of drag f rame F l a t s p r i n g s of l i f t f r a m e 10
6 F la t s p r i n g s of drag f rame
17 Revet p l a t e B a s e p l a t e P e r m e a n c e m e t e r of l i f t f r a m e P e r m e a n c e m e t e r of d r a g f r a m e
3 1 1 D a m p i n g p l a t e 12 Dashpot c o n t a i n i n g c a s t e r oil
13 Shie ld
14 Test sphere 15 L - s h a p e d a t t a c h m e n t 16 Floor of w i n d t u n n e l 17 M a s o n r y p l a t f o r m
Fig. 1. Sketch showing force dynamometer. Schema du dispositif dynamométrique.
The frequency response of the drag frame was flat upto 20 Hz. The force dynamometer was calibrated separately for drag and lift forces before data collection for each setting of the test spheres. During the process, it was observed that, while the calibration was done for drag, the lift output was zero and vice-versa, thus confirming non-interference of drag and lift frames. It was ensured that the calibration covered the anticipated range of forces during the measurement. The calibration in the range was found to be linear.
Force measurement
The force dynamometer was mounted on a masonry platform below the centre of the tunnel floor at predetermined stations. It was aligned parallel to the flow direction and levelled. The attachment supporting the test sphere was then clamped to the dynamometer. The vertical portion of the attachment supporting the test sphere was properly shielded to eliminate the drag force on it. Free and elastic movement of the system for each setting of test sphere was ensured by reproduci-bility of the calibration. The mean drag and lift forces on the test spheres were measured digitally
392 JOURNAL DE RECHERCHES HYDRAULIQUES, VOL. 30, 1992, NO. 3
Dow
nloa
ded
by [
Uni
vers
ity o
f M
inne
sota
Lib
rari
es, T
win
Citi
es]
at 0
0:50
22
May
201
3

as well as from a strip chart recorder. A sampling time of 50 seconds was found adequate from the statistical analysis of a few recorded outputs (not included here). Table 1 gives the range of variables covered in the investigation.
Table 1 Range of variables
quantity smooth boundary smooth boundary with profile grid rough boundary
U m s" ö mm D mm Djö K, R,,
2.30 to 13.91 39 to 130 38, 53, 72 0.292 to 1.000 5977 to 67350 4963 to 64500
2.48 to 15.22 364.50 to 413.50 38, 53, 72 0.092 to 0.197 5690 to 66190 3675 to 49920
2.66 to 15.70 109.60 to 169.60 38, 53, 72 0.224 to 0.657 6170 to 69040 3620 to 51630
Analysis of data
The velocity measurements made in the wind tunnel were used to estimate U, S and n of the boundary layer and also the various reference velocities. Fig. 2 shows typical velocity profiles at a station 5.25 m from the entrance of the tunnel for the full opening of the butterfly valve for the cases of smooth boundary, smooth boundary with profile grid and rough boundary. The nominal thickness of the boundary layer, ö was estimated from the velocity profiles using the definition of one percent defect of the free stream velocity. The value of n was obtained from a log-log plot of
160
120
80
40
0
" Run no.
S&i
-
Run no-Run no.
5G3
1 ■ J^^L-
Run no s&4 ' Run no-
s&s
0 2 4 6 8 10 12 14 16 Veloc i ty o t f l ow (u ) in MS 1
(a) SMOOTH BOUNDARY
'.SO
320
160
0
Run no . PGl
Run) PG2
1 no R u n n °
Püi
• J j JJ ~y
Run no\ P 0 4
Run n o \ P&5 ]
4 6 8 10 12 14 16 Ve loc i ty ot f low <u) in M s '
(b ) SMOOTH B O U N D A R Y - P R O F I L E GRID
10 12 14 16
V e l o c i t y ot f l o w (u ) in MS
( c ) ROUGH BOUNDARY
Fig. 2. Typical velocity profiles. Profils de vitesses types.
JOURNAL OF HYDRAULIC RESEARCH. VOL. 30. 1992, NO. 3 393
Dis
tan
ce
fro
m
tun
ne
l bo
unda
ry (
y)
in
mm
Dis
tanc
e tr
om
tu
nnel
b
ou
nd
ary
(y)
in
mm
Dow
nloa
ded
by [
Uni
vers
ity o
f M
inne
sota
Lib
rari
es, T
win
Citi
es]
at 0
0:50
22
May
201
3

the measured velocity distributions (not shown here) and it was found to be nearly constant, within the range of velocities studied, at 8.52, 5.40 and 3.42 for the three cases of the boundary in the order. The shear stress r0 measured on the tunnel floor with the help of Preston tube, for the case of smooth boundary, was used to obtain the shear velocity u, (=Vr0/e). It is well known that fluid dynamic force on bodies kept in confined flow needs to be corrected for blockage. In the present study the blockage ratio, which is the ratio of the projected area of the body to the tunnel cross section, for the biggest size of the test sphere was only 1.56 percent. This is likely to result in a very insignificant correction and as such the drag force data are analysed as they are without applying any blockage correction.
Analysis of mean drag force data close to boundary
The mean drag force data for the sphere kept close to smooth boundary, smooth boundary with profile grid and rough boundary are analysed separately using equation (5) and then an attempt has been made to combine them. As envisaged earlier, the analysis is made using different reference velocities in order to bring out their suitability.
Smooth boundary data
The computed values of CDu0 for smooth boundary are shown plotted against Ru0 in Fig. 3. Also included in the figure are the data of Aksoy [1] for sphere kept on smooth boundary, CD ~ R curve for a sphere falling freely through infinite fluid and that for a sphere rolling along a smooth boundary (7). The drag coefficients obtained in the present study are in general closer to the free fall case and much lower than those for a rolling sphere in the common range of Reynolds number. This is only to be expected because in the latter case, the drag force might have included rolling friction. Further, in the experiments of Garde and Sethuraman, the sphere was moving
2.0
1.0
0.8
-r ~\—r
C Du 0
0.6
0 -4
0-2
051 ««/ A . 0 5 »
.107
a o « ■08 0 3 4 4 « * 4 ° 0 « " M 'As.
0*1 A & \ 06] 064
D ; 38 mm ' D = S3 mm D = 72 m m j D r 20 mm Aksoys study [ l ]
Present study
\
9}
69
V
_ .64 -t> -^*-tfo *£ <iJ«— -
Free t a l l case Rol l ing sphere on smooth boundary [7
Third parameter D/6
■o 9 tt 4 « 6 V 4 9
«
10 J 8 10*
Ru„
Fig. 3. Variation of CDu0 with Ru0 - close to smooth boundary. Variation de CDu0 en fonction de Ru() - a proximité de la paroi lisse.
394 JOURNAL DE RECHERCHES HYDRAUL1QUES, VOL. 30, 1992, NO. 3
Dow
nloa
ded
by [
Uni
vers
ity o
f M
inne
sota
Lib
rari
es, T
win
Citi
es]
at 0
0:50
22
May
201
3

through static fluid which has neither velocity gradient nor ambient turbulence associated with it. CD ~ R plots were also made using uu uu w2and uf as reference velocities. It was found that those with «t, U] and u2 were more or less similar to Fig. 3. Thus among u0, uu W| and u2, one may prefer u0 for the simple reason that ux and u2 are not readily known and need to be computed and w, is only the extreme of the velocities that the body faces in its height. Figs. 4 and 5 show the CD~ R using the remaining reference velocities viz. U and ut, respectively. A close look at Figs. 3 and 4
1.0
0.8
0.6
0.4
c D u
0.2
0-1
1 — r n—r~r
For s y m b o l s see F i g . 3
T h i r d p a r a m e t e r 0 / 6
1 0 ' ioJ
Fig. 4. Variation of CDu with Ru - close to smooth boundary. Variation de CDu en fonction de Ru - a proximité de la paroi lisse.
c D u „
10
10 '
I — 1 — 1 — I — I — I 1 1 — 1 59 , -8 95 -85, .
^ « 5
■ si "r*
For symbols see F i g . 3
T h i r d p a r a m e t e r D /6
8 10 2 4 6 8 10 2 4
R u * Fig. 5. Variation of CDu, with Ru. - close to smooth boundary.
Variation de CDu. en function de Ru. - a proximité de la paroi lisse.
JOURNAL OF HYDRAULIC RESEARCH, VOL. 30, 1992, NO. 3 395
Dow
nloa
ded
by [
Uni
vers
ity o
f M
inne
sota
Lib
rari
es, T
win
Citi
es]
at 0
0:50
22
May
201
3

reveals that CD in these plots increases systematically with increase of both /? and Djö. The rate of increase of CD with /? however is higher at lower values of R whereafter it decreases and CD
tends to attain a constant value independent of R at high values. Also, at a given value of/?, CD
increases with increase in D/ö, this effect again being more pronounced at lower values of/?. In contrast, in Fig. 5, the nature of variation of CD with Reynolds number is the same as in Figs. 3 and 4 and more pronounced. However, the effect of Djö in this plot is just the reverse, less pronounced and less systematic and the omission of Djö as the third variable in this plot amounts to very large scatter of data. As such, further analysis of data was carried out using only «0 and U as reference velocities. Further, a comparison of Figs. 3 and 4 also shows that the dependence of CD on Djö is more pronounced with U as reference velocity, and hence CDU and Rv are considered for purpose of evolving an empirical relation between the variables. Towards this objective, Fig. 4 is replotted as CDU vs Djö, the values of Rv being written as the third variable, in Fig. 6, in which straight lines could be approximated for constant Reynolds numbers. The equation for the lines may be written in the form
C, n\-\- (6)
in which m and C are both functions of Rv. The values of m and C for the lines on Fig. 6 were studied against Rv and the following equations have been obtained.
0.6
0.5 -
0-4= - - ~ -DU
0.3 - -
0.2 -
0.1 -
Fig. 6.
-_ ■■
-
----
Ru — - -_
"*" -- " ^ -
t , 0 - 3=
^ — "-_ —
- "
I
1
50-0
~a>xZ 35-0 _
130]? _
20.0 _
15.0. . l7.5__
%-l . 6 . 0 ,
— i
__ _ — ~~"_ƒ"
- 7 4 "
2 6 * _ - -: :M _ 9 ~ -o.
- - 1 5 1 - \1-8-5 . J>-9
-I'l '
' ■ * >
6-t« "" 6
'
_ - 9 -_35.5
Bjf.*-
i
/ Q C 6V4 48-5 57.3
- 3 4 6 o- Zf--Tl 5V2ÏM
t ' 8-4 - -, - "9" 5-96
-♦ 0 = 38 mm
-0- D ; 53 mm ■*- D ; 72 mm
Thi rd pa ramete r RU x 10 3
■ 1 . 1
0.1 0-2 0.3 0.6 0.7 0.8 0.9 0.4 0.5 D/6
Variation of CDU with DjS - close to smooth boundary. Variation de CDU en function de Djö - a proximité de la paroi lisse
1.0
m= 1.02-0.02 log /?u
C = 0.42 log / ? u - 1.52
Introducing equations 7 and 8 in equation 6, one gets
CDU = (1.02 - 0.20 log Ru) - + (0.32 log Rv - 1.52) o
(7)
(8)
(9)
396 JOURNAL DE RECHERCHES HYDRAULIQUES, VOL. 30, 1992, NO. 3
Dow
nloa
ded
by [
Uni
vers
ity o
f M
inne
sota
Lib
rari
es, T
win
Citi
es]
at 0
0:50
22
May
201
3

Equation 9 can be used as a predictor for CDU for the sphere kept close to a smooth boundary in the ranges of 6-103 < / ? u < 6.7-104 and 0.29 <Djö < 1.0. Equation 9 is shown on Fig. 4 and found to be in agreement with the experimental data.
Smooth boundary data (profile grid)
The data for the sphere kept close to smooth boundary and facing the flow generated by profile grid are shown in Figs. 7a and 7b using u0 and U as reference velocities respectively. In both the plots, although the nature of variation of CD with R is similar to the smooth boundary case, its variation with Djö is just the reverse i.e. while for the smooth boundary CD increases with increase in Djö at a given R, in this case CD decreases with increased values of Djö. This behaviour is apparently due to the nature of boundary layer development in two cases. Although the index of the measured velocity profiles was seen to be almost the same for both the cases, the former is the case of freely developing boundary layer whereas the latter is forced through the profile grid. Further, in the presence of the grid, nominal boundary layer thickness <5 at any section increased with increasing velocity of flow. This is opposite to the well known behaviour of a freely developing boundary layer. Thus, the reverse variation of CD with Djö in the case of grid data is an apparent distortion because of the increase of ö with Reynolds number. Also, a comparison of Figs. 7a and 7b with the corresponding Figs. 2 and 3 for smooth boundary reveals that the profile grid data plot below those of smooth boundary.
0 - 6
0 .4
0.3
-Du„ 0.2
0.1
1
-0.194
1
! 1
0.097
i — i —
o-i35
0.197
0-145 «-
i ■
' 0.093
0-095 0-132 T 0.185
A
^ D = 36 mm ■*- D = 53 mm -^- D = 72 mm
'0-092 ' ' i 0.128 V ♦ 0-1741 0-13 •"■
0-18 0*77 >
Third parameter D/6 i t . i i
10' Ru„
Fig. 7a. Variation of CDu0 with Rvo - close to smooth boundary (profile grid) Variation de CDu0 en fonction de Ru„ - a proximité de la paroi lisse (profil avec grille).
0-3
0-2
CDu
0.1
1 1
0.104
' '
1 1
0.097
-ft-0
1 1
1 i
0-132 0.095 ♦
0-135 + +■» 0.185 0.197
145 i i i
1 1 I 1 0.093 0 .13 0-128 0.174
0-18 9 4 - T
- f 0.092 0.177 -<f 0 : 38 mm
-a- D = 53 mm -^ D = 72 mm
Third parameter D/6 i i i i
10' 6 7
Fig. 7b. Variation of Cml with Rv - close to smooth boundary (profile grid) Variation de CDu en fonction de Ru - a proximité de la paroi lisse (profil avec grille).
JOURNAL OF HYDRAULIC RESEARCH, VOL. 30, 1992, NO. 3 397
Dow
nloa
ded
by [
Uni
vers
ity o
f M
inne
sota
Lib
rari
es, T
win
Citi
es]
at 0
0:50
22
May
201
3

Rough boundary data
Fig. 8 shows the plot similar to Figs. 3 and 7a using u0 as reference velocity. The plot includes the data of both the configurations of the test sphere along with the curve for sphere rolling along rough boundary as well as the curve proposed by Coleman [5]. The present data lie between the free fall curve and the curve proposed by Coleman. Here also as for the smooth boundary, the data lie far below the rolling sphere curve in the common range of Reynolds number. The nature of variation of CDu0 with RuQ and D\6 is the same as for smooth boundary i.e. CDu0 increases with increased values of Ru0 and Djö.
—i—i—i i i i 4 D = 38mm
i I i i I 7 1 4 D : 38 mm — D = 53 m m -+- D = 72 mm
Present data Configuration I
Present d a t a Configuration I I
c D u r
- Plan view of -boundary spheres + D = 72 mm
Curve for sphere in free t a l l Curve tor sphere rol l ing along rough boundary, Garde and Sethuraman [7 ] Coleman's curve of best f i t to his da ta [ 4 ]
\
0-2
0.1 L I I I I I I I I 11
Fig.
8 10 8
R u ,
Variation of CDu0 with Ru0 - close to rough boundary. Variation de CDu0 en function de Ru0 - a proximité de la paroi rugueuse.
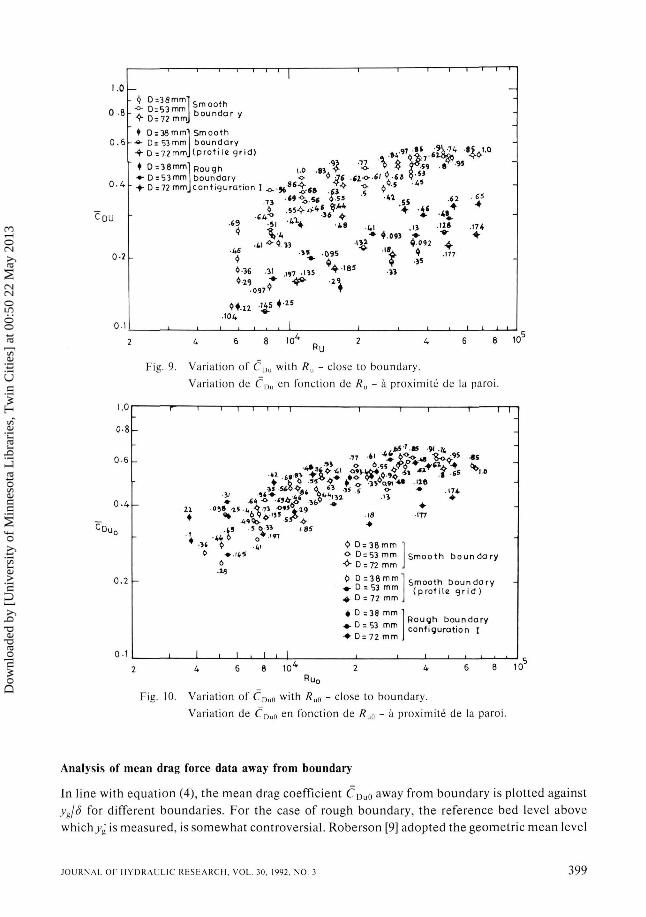
Combined study of data for all the boundaries
Since a comparison of the data of smooth boundary with and without profile grid has already been made earlier, comparison of the data for the three types of boundary is now in order. Figs. 9 and 10 show such a comparison using U and u0 as characteristic velocities respectively. In Fig. 9, the rough boundary data lie between those of smooth boundary and smooth boundary with profile grid. This relative positioning of the data is perhaps largely due to the free stream velocity increasing in the order for smooth boundary, rough boundary and smooth boundary with profile grid for a given flow rate through the tunnel, as evidenced by measured velocity profiles (see Fig. 2). In contrast, Fig. 10 shows rough boundary data overlying the data of smooth boundary and smooth boundary with profile grid. The values of n being 3.42,8.40 and 8.52 for the three cases of boundaries in the order, the placement of data in Fig. 10 with u0 as characteristic velocity appears justified, lending support to the adoption of u0 as characteristic velocity.
398 JOURNAL DE RECHERCHES HYDRAULIQUES. VOL. 30. 1992, NO. 3
Dow
nloa
ded
by [
Uni
vers
ity o
f M
inne
sota
Lib
rari
es, T
win
Citi
es]
at 0
0:50
22
May
201
3
1.0
0.8
0.6
0.4
CDU
0-2
0.1
- § D = 3 S m m ' - ° - 0 = 5 3 m m
" ■$■ D = 7 2 m m
♦ D = 3 8 m m ' - •*• D = 53 m m
• f D = 7 2 m m ,
♦ D = 3 8 m m " ♦ D = 5 3 m m
~ - f D = 72 mm_
-
_
i
i r I I 1 1 |
S m o o t h b o u n d a r y
S m o o t h b o u n d a r y
( p r o f i l e g r i d )
Rough i.o . « 4-b o u n d a r y o ' Jt c o n f i g u r a t i o n I ^ V * ^ , fi*
73 **%iS * • «
■69 -51 * V AS
4 i* ■*f • » * 0 9 5
I
•77 -O-
i 1
. 97 * s
^ - O - . f i / V . 6 8 ■o-
■LI ♦
* *
♦•36 .11 „ 7 . , « > - ' 8 5
. 0 9 7 y T
.104
I i
*v'5
" V ♦ .«93
"V 3*
i
45
•*< 13 f-9092
35
I
1
•9k -74
8 ^ » !
.6 2
.128 ♦
4 .177
1
-i 1 r
v-° . 6 5 4
.174 4-
i i i
r^
--
--
~
-
_
1
4 6 8 \0 „ 2 4 6 8 RU
Fig. 9. Variation of CDu with Ru - close to boundary. Variation de CDu en fonction de Ru - a proximité de la paroi.
ioJ
0.6
0 . 4 -
cDu
0.2
0.1
-
-
-
r
22
1 ♦
I
i I I ' i i 1 1 I I 1 1
6 S ' « 5 ■»(.«,
•* 6.^' iU' 8W2*T * T-* **
•09» * t . * . 4 . T J ° « » - 2 9 *
4 s Q b - W 5 * ^ -0 -.49 5 0 . » IBS '
■34 « , 4 , $ D = 3 8 m m * « . ^ s o D = 53 m m
* A D = 72 m m . S m o o t h b o u n d a r y
■n <> D : 3 6 m m
♦ D = S3 m m
4 . D = 72 m m .
« D = 3 8 m m
♦ D = 53 m m -♦• D = 7 2 m m ,
, 1 , 1 . 1
S m o o t h b o u n d a r y ( p r o f i l e g r i d )
R o u g h b o u n d a r y c o n f i g u r a t i o n I
1 , ,
1
_
_
10M 10 <U0
Fig. 10. Variation of CDu0 with Ru0 - close to boundary. Variation de CDu0 en fonction de Ru„ - a proximité de la paroi.
Analysis of mean drag force data away from boundary
In line with equation (4), the mean drag coefficient CDu0 away from boundary is plotted against yjö for different boundaries. For the case of rough boundary, the reference bed level above whichyg is measured, is somewhat controversial. Roberson [9] adopted the geometric mean level
JOURNAL OF HYDRAULIC RESEARCH. VOL. 30, 1992, NO. 3 399
Dow
nloa
ded
by [
Uni
vers
ity o
f M
inne
sota
Lib
rari
es, T
win
Citi
es]
at 0
0:50
22
May
201
3

as the reference which is defined as the new boundary surface that would result if all roughness elements were melted. For closely packed hemispherical roughness, Einstein and El-Samni [6] obtained the reference bed level to be at 0.2 D below the crest by fitting a logarithmic distribution law to the measured velocity data. This interestingly coincides almost with the geometric mean level which would be 0.198 Z) below crest. Accordingly, in the present studyy% is considered from the theoretical bed level at 0.2 D below the sphere crest. Since in the present investigation, Ru0
and Djö varied simultaneously, the data are selected such that Djö varied appreciably with a minimum change in Ru0. Figs. 1 la and 1 lb show typical variations for smooth and rough boundaries respectively. Fig. 11a also includes the flume data of Bagnold [2] for non rotating sphere at Ru0 = 2.72 x 10³. In both the plots, CDu0 increases with increase in both .yg/ó and Djö. The influence of Djö appears maximum near the boundary and reduces away from it. The large deviation of Bagnold's data from the present data is beyond comprehension.
11 8
0.6
0 .5
0 - 4
0.3
0-2
0.1
0
S y m b o l D/6 Rue
0 - 2 9 5 -00x10 . 0 - 4 6 5 -04x10-0 - 6 9 5 -45x10 -
P r e s e n t d a t a
o 0 . 2 1 2-72X 10 3 Bagnold's d a t a o
(a) Smooth boundary
<
C
0-2
Symbol
-•-♦
" (b)
1
D/6
0-29 0-35 0-48
Rough
» i
Ru0
1.05X10* 8-50 * I0 3
1-25 «10
boundary
*
0 . 2 V ö l 0Z O 5\6 0 7 Ö Ü 0 . 9 0-2 0.3 0.4 0.5 0-6 0-7
CDuo C D U 0
Fig. 11. Variation of CDu0 with ygjö - away from boundary. Variation de CUu0 on fonction de ygjö - loin de la paroi.
Summary of lift force studies
The lift force data close to and away from the boundary, was analysed on lines similar to those of drag force. The mean lift coefficient CLu0(= FJ^QUITD2) was found to decrease with increase in both the Reynolds number flu0 and relative size Djö. It also decreases continuously with increase in distance from the boundary and becomes even negative at large values ofyjö. The variation of CLu0 away from the boundary did not show any sudden peaks as reported by Willetts and Murray [11], although the instantaneous value may change sign because of the large fluctuations in the lift force. It was found that the lift force may change its direction from positive to negative close to the boundary also. This has been reported by some other investigators as well. A criterion for the reversal of lift force direction close to the boundary has been evolved in terms of the Reynolds number and relative size.
400 JOURNAL DE RECHERCHES HYDRAULIQUES, VOL. 30, 1992, NO. 3
Dow
nloa
ded
by [
Uni
vers
ity o
f M
inne
sota
Lib
rari
es, T
win
Citi
es]
at 0
0:50
22
May
201
3
Conclusions
Arising out of the present study, if may be concluded that, among the various reference velocities adopted by different investigators in the past, the velocity at the centre level of sphere, u0 appears more suitable. Also the mean drag coefficient CD u 0 of sphere kept close to and away from boundary is not only a function of Reynolds number RuQ but also of the sphere size relative to the boundary layer thickness Djö. The influence of Djö appears maximum near the boundary. Notwithstanding the variation of CD u 0 with Djö, the CD u 0 ~ Ruo function for sphere near smooth and rough boundaries is closer to that of sphere falling freely through infinite fluid and appreciably below the corresponding functions of sphere rolling along a boundary.
Notations
A projected area of the sphere normal to flow direction C constant in the predictor for CD U
CD mean drag coefficient CL mean lift coefficient D diameter of sphere FD mean drag force FL mean lift force m constant in the predictor for CD U
n reciprocal of powe lawe index R Reynolds number ^ u c Reynolds number suffixed with any characteristic velocity uQ
U free stream velocity u local mean velocity u0 velocity at the level of the sphere centre w, shear velocity (=VTOIQ) U\ velocity averaged over height of sphere u2 R.M.S. value of velocity over height of sphere «t velocity at top of sphere yg height above boundary ö nominal thickness of boundary layer (i dynamic viscosity of fluid v kinematic viscosity of fluid Q mass density of fluid T0 shear stress on boundary
References / Bibliographie
1. AKSOY SAHAP, Fluid forces acting on a sphere near a solid boundary, Proc. 15th Congress, IAHR, Istanbul, 1973, Vol. 1, p. 217.
2. BAGNOLD, R. A., Fluid forces on a body in shear flow; Experimental use of stationary flow, Proc. Roy. Society, London, Ser. A, Vol. 340, No. 621, 1974, p. 47.
3. COLEMAN, N. L., A theoretical and experimental study of drag and lift forces acting on a sphere resting on a hypothetical stream bed, Proc. 12th Cong. IAHR, Fort Collins, Vol. 3, 1967, p. 185.
4. COLEMAN, N. L., The drag coefficient of a stationary sphere on a boundary of similar spheres, La Houille Blanche, No. 1, 1972, p. 17.
JOURNAL OF HYDRAULIC RESEARCH, VOL. 30, 1992, NO. 3 401
Dow
nloa
ded
by [
Uni
vers
ity o
f M
inne
sota
Lib
rari
es, T
win
Citi
es]
at 0
0:50
22
May
201
3

5. COLEMAN, N. L., Extension of the drag coefficient function for a stationary sphere on a boundary of similar spheres, La Houille Blanche, Vol. 32. No. 4, 1977, p. 325.
6. EINSTEIN, H. A. and EL-SAYED AH. EL-SAMNI, Hydrodynamic forces on a rough wall, Review of Modern Physics, Vol. 21, No. 3, 1949, p. 520.
7. GARDE, R. J. and S. SETHURAMAN, Variation of drag coefficient of a sphere rolling along boundary, La Houille Blanche, No. 7, 1969, p. 727.
8. PATNAIK, P. C , Fluid dynamic forces on a sphere submerged in turbulent boundary layer, Ph.D. Thesis, submitted to the University of Roorkee, Roorkee, 1983.
9. ROBERSON, J. A., Surface resistance as a function of the concentration and size of roughness elements, Ph.D. Thesis, University of Iowa, 1961.
10. WATTERS, G. Z. and M. V. P. RAO, Hydrodynamic effects of seepage on bed particles, Journal Hydraulics Division, Proc. ASCE, Vol. 97, 1971, p. 421.
11. WILLETTS, B. B. and C. G. MURRAY, Lift exerted on stationary spheres in turbulent flow. Journal of Fluid Mech., Vol. 105, 1981, p. 487.
402 JOURNAL DE RECHERCHES llYDRAULIQUF.S, VOL. 30, 1992, NO. 3
Dow
nloa
ded
by [
Uni
vers
ity o
f M
inne
sota
Lib
rari
es, T
win
Citi
es]
at 0
0:50
22
May
201
3