drainage design in brunei darussalam: generation … design in brunei darussalam: generation of...
TRANSCRIPT

Drainage design in Brunei Darussalam: Generation of Design Rainfall and Ocean Water Level Conditions
Chris Nielsen
Associate, BMT WBM Pty Ltd, Brisbane, Australia E-mail: [email protected]
Hj Mohd Sidek bin Hj Mohd Yusof Drainage Engineer, Public Works Department, Bandar Seri Begawan, Brunei Darussalam
E-mail: [email protected]
Claus Pedersen Coastal Engineer, DHI Water and Environment, Kota Kinabalu, Malaysia
E-mail: [email protected]
Henrik Madsen Head of Innovation, DHI Water and Environment, Hørsholm, Denmark
E-mail: [email protected]
Located on the north-west coast of Borneo, the population centres of Brunei Darussalam are low lying and prone to flooding from the combined influences of overtopping of main rivers, ponding due to localised rainfall and tidal and storm surge influences. As part of an assessment of drainage and flood management practices, design rainfall and ocean water levels have been developed for use in drainage design in Brunei Darussalam including rainfall intensity-duration-frequency (IDF) curves, rainfall temporal patterns and estimates of extreme mean sea levels due to tides, storm surge, wave and wind setup and global mean sea level rise. Also considered is the relative timing of design events, which is an important aspect for Brunei due to the low lying, flat terrain and strong influence of backwater effects. The analyses provided the basis for the Drainage Design Standards, which sets out the standards and processes to apply in developing and submitting designs for drainage works associated with development in Brunei.
1. INTRODUCTION
Brunei Darussalam, with a total area of approximately 5800 km2, is situated on the west coast of Borneo in South East Asia. Terrain is characterised by a flat coastal plain that rises to mountains in the eastern hinterland and hilly lowland in the western hinterland. Of a total population of about 400,000 approximately 55% are concentrated in the capital (Bandar Seri Begawan) and surrounds, 40% along the coastal strip, and the remainder dispersed throughout the interior. The majority of industries, mainly relating to the oil and gas sector, are located along the coast. Climatic features are typical of equatorial regions with uniform temperature, high humidity and high annual rainfall (annual average is 2850 mm). Seasonal influences are monsoonal, but as Brunei is not directly exposed to the monsoon there is a more even distribution of climatic conditions compared to other south-east Asian regions. El Niño tends to cause drier than normal conditions and La Niña more rainfall and more extreme climatic events. While typhoons in the region are infrequent and comparatively weak they can generate extreme wind and wave conditions in coastal waters and heavy rainfall on land through interaction with monsoon winds. The paper describes the specific investigations into design rainfall and ocean water levels which informed a broader Drainage Masterplan for Brunei and an associated Drainage Design Standard (PWD, 2006).
ISBN 978-1-922107-62-6 © 2012 Engineers Australia HWRS 201225
2. ASSESSMENT OF DESIGN RAINFALL
2.1. Rainfall Data
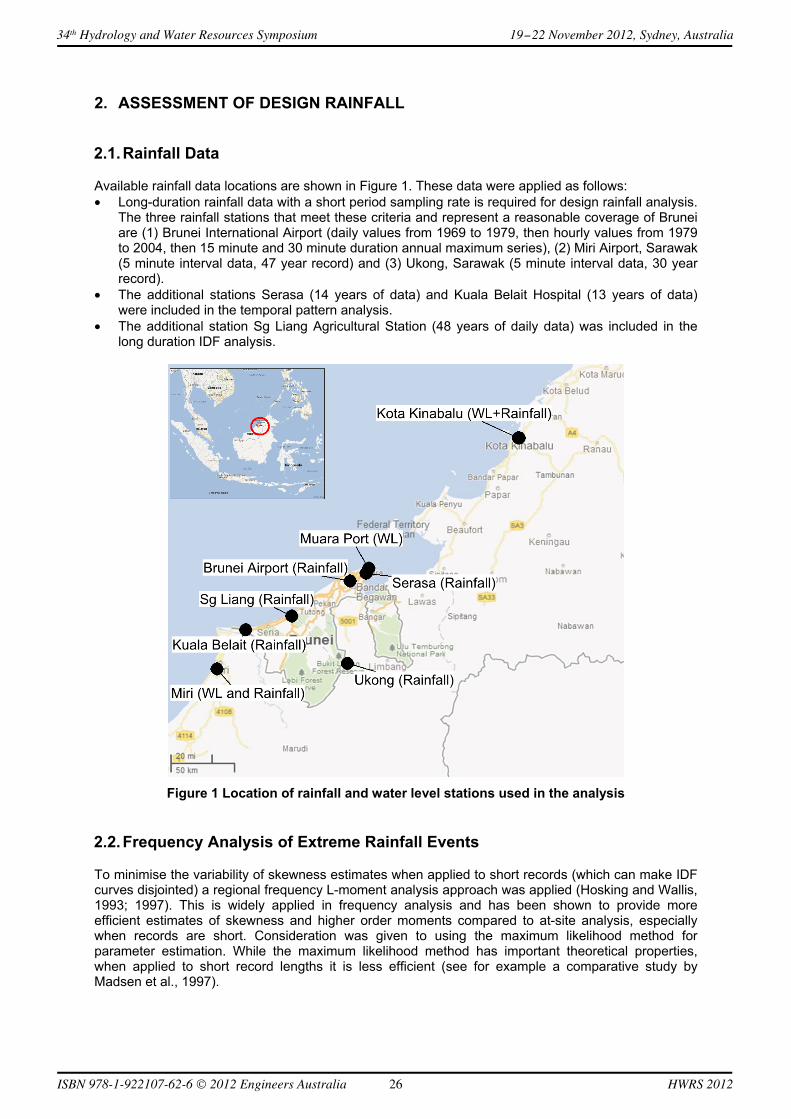
Available rainfall data locations are shown in Figure 1. These data were applied as follows: • Long-duration rainfall data with a short period sampling rate is required for design rainfall analysis.
The three rainfall stations that meet these criteria and represent a reasonable coverage of Brunei are (1) Brunei International Airport (daily values from 1969 to 1979, then hourly values from 1979 to 2004, then 15 minute and 30 minute duration annual maximum series), (2) Miri Airport, Sarawak (5 minute interval data, 47 year record) and (3) Ukong, Sarawak (5 minute interval data, 30 year record).
• The additional stations Serasa (14 years of data) and Kuala Belait Hospital (13 years of data) were included in the temporal pattern analysis.
• The additional station Sg Liang Agricultural Station (48 years of daily data) was included in the long duration IDF analysis.
Figure 1 Location of rainfall and water level stations used in the analysis
2.2. Frequency Analysis of Extreme Rainfall Events
To minimise the variability of skewness estimates when applied to short records (which can make IDF curves disjointed) a regional frequency L-moment analysis approach was applied (Hosking and Wallis, 1993; 1997). This is widely applied in frequency analysis and has been shown to provide more efficient estimates of skewness and higher order moments compared to at-site analysis, especially when records are short. Consideration was given to using the maximum likelihood method for parameter estimation. While the maximum likelihood method has important theoretical properties, when applied to short record lengths it is less efficient (see for example a comparative study by Madsen et al., 1997).
34th Hydrology and Water Resources Symposium 19-22 November 2012, Sydney, Australia
ISBN 978-1-922107-62-6 © 2012 Engineers Australia HWRS 201226
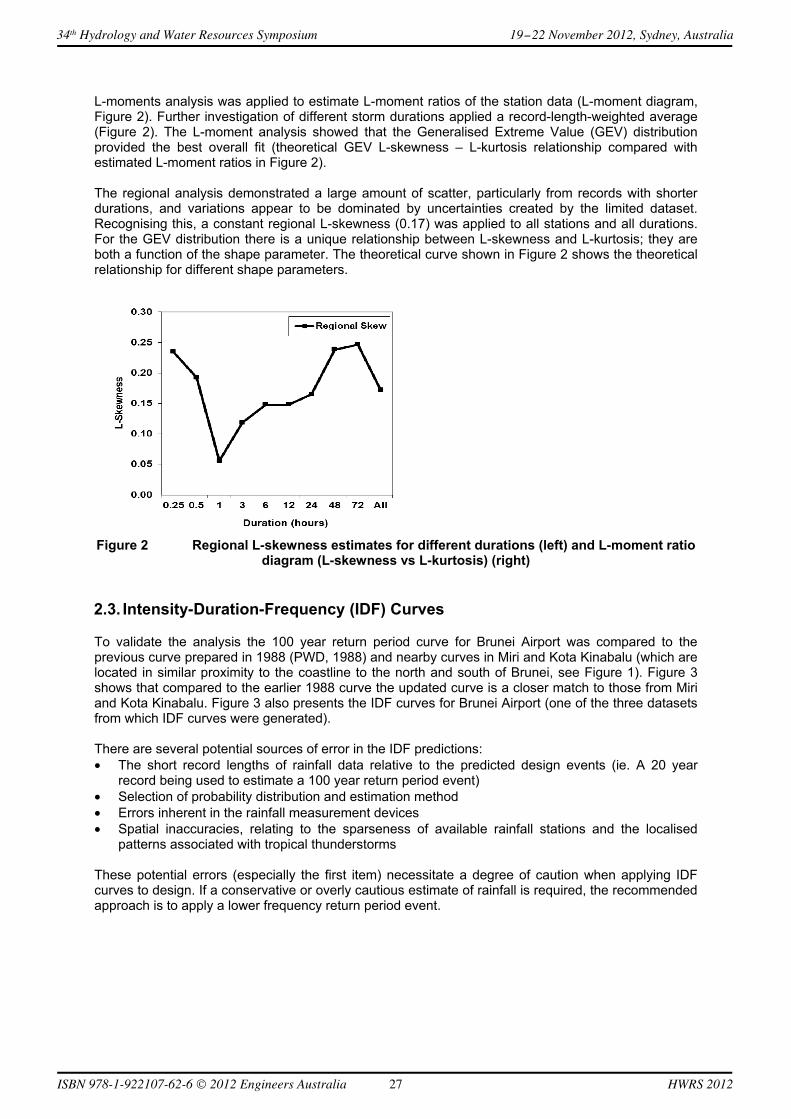
L-moments analysis was applied to estimate L-moment ratios of the station data (L-moment diagram, Figure 2). Further investigation of different storm durations applied a record-length-weighted average (Figure 2). The L-moment analysis showed that the Generalised Extreme Value (GEV) distribution provided the best overall fit (theoretical GEV L-skewness – L-kurtosis relationship compared with estimated L-moment ratios in Figure 2). The regional analysis demonstrated a large amount of scatter, particularly from records with shorter durations, and variations appear to be dominated by uncertainties created by the limited dataset. Recognising this, a constant regional L-skewness (0.17) was applied to all stations and all durations. For the GEV distribution there is a unique relationship between L-skewness and L-kurtosis; they are both a function of the shape parameter. The theoretical curve shown in Figure 2 shows the theoretical relationship for different shape parameters.
Figure 2 Regional L-skewness estimates for different durations (left) and L-moment ratio
diagram (L-skewness vs L-kurtosis) (right)
2.3. Intensity-Duration-Frequency (IDF) Curves
To validate the analysis the 100 year return period curve for Brunei Airport was compared to the previous curve prepared in 1988 (PWD, 1988) and nearby curves in Miri and Kota Kinabalu (which are located in similar proximity to the coastline to the north and south of Brunei, see Figure 1). Figure 3 shows that compared to the earlier 1988 curve the updated curve is a closer match to those from Miri and Kota Kinabalu. Figure 3 also presents the IDF curves for Brunei Airport (one of the three datasets from which IDF curves were generated). There are several potential sources of error in the IDF predictions: • The short record lengths of rainfall data relative to the predicted design events (ie. A 20 year
record being used to estimate a 100 year return period event) • Selection of probability distribution and estimation method • Errors inherent in the rainfall measurement devices • Spatial inaccuracies, relating to the sparseness of available rainfall stations and the localised
patterns associated with tropical thunderstorms These potential errors (especially the first item) necessitate a degree of caution when applying IDF curves to design. If a conservative or overly cautious estimate of rainfall is required, the recommended approach is to apply a lower frequency return period event.
34th Hydrology and Water Resources Symposium 19-22 November 2012, Sydney, Australia
ISBN 978-1-922107-62-6 © 2012 Engineers Australia HWRS 201227

Figure 3 Comparisons of the updated 100 year return period IDF curve to Kota Kinabalu,
Miri and 1988 guidelines (left) and IDF curves for Brunei Airport (right)
2.4. Design Rainfall Temporal Patterns
Temporal patterns describe the time dependence of falling rain during a storm burst, which can significantly affect the peak intensity of the resulting runoff from a particular catchment area. The annual maximum storm burst for each seasonal year was extracted for a number of specific storm durations and analysis performed using the average variability method (Pilgrim et al, 1969 and Cordery et al, 1984), which has been applied in Australia (AR&R, IEAust, 2003) and Malaysia, (MSMAM, DID, 2000). An example of the temporal patterns provided is shown in Figure 4. Temporal patterns from a selection of the more reliable, long record stations were prepared. The subsequent drainage guidelines recommend their application in the estimation of design storm events.
Figure 4 Temporal Pattern for 12 hour duration storm burst for Brunei Airport
2.5. Impacts of Climate Change
A particularly uncertain aspect of climate change is the potential for changes in regional weather patterns and, hence, increased rainfall. IPCC (2007) provides discussions specific to rainfall, with mean annual rainfall projected to be more in Borneo by 2080 and highlights the likelihood of more frequent, persistent and intense El Niño / La Niña events. While El Niño events generally reduce rainfall in Brunei, the related La Niña events generally increase rainfall and, more importantly, are associated with more frequent and intense typhoon activity. Based upon the available information it is very difficult to provide any advice on how (or if) to incorporate climate change into design rainfall conditions. While no quantitative advice is provided, a cautious approach for particularly sensitive
34th Hydrology and Water Resources Symposium 19-22 November 2012, Sydney, Australia
ISBN 978-1-922107-62-6 © 2012 Engineers Australia HWRS 201228

developments is warranted and prompt re-assessment made if or when more certain estimates become available.
3. ASSESSMENT OF DESIGN OCEAN WATER LEVELS
3.1. Analysis Approach
Available long term water level data were limited; 3 years of water level data at Muara and 4 years at Kota Kinabalu (station locations shown in Figure 1). Due to the limited datasets an analysis based upon “residuals” was applied, which splits measured water levels into harmonic and non-harmonic components. In this way the known properties of the harmonic component are taken into account (ie the tides) and the analysis is concentrated on the non-harmonic component (storm surge, wind and wave setup). The tidal records from Muara and Kota Kinabalu cover one main extreme event; Typhoon Greg made landfall to the north of Kota Kinabalu on December 26, 1996. Figure 5 shows the residuals derived for Kota Kinabalu, which shows a residual water level rise of more than 0.6 m. The rise in mean sea level is not particularly noticeable in the total water level curve because peak setup did not coincide with high tide. Exceedence frequency analysis of the residuals (Figure 5) highlights the outliers created by this event and underscores the significance of typhoon activity upon extreme water levels. Typhoons hitting the west coast of Borneo are very rare and Typhoon Greg has been adopted as a design event in terms of climatic conditions.
Figure 5 Measured (red), predicted (from tidal constituents, green) and residual (blue) water levels for Kota Kinabalu during Typhoon Greg, December 1996 (left) and exceedence
frequency of residuals showing the outliers created by this event (right)
3.2. Storm Surge
The potential for storm surge along Brunei’s coast during strong winds was investigated using a two-dimensional hydrodynamic model for several cases of design wind speed and direction. Figure 6 shows water level setup (surge only, excluding wave setup) for an example 15 m/s northerly wind. Setup is about 20 cm along the open coast and higher within Brunei Bay (exceeding 50 cm, depending upon wind direction).
34th Hydrology and Water Resources Symposium 19-22 November 2012, Sydney, Australia
ISBN 978-1-922107-62-6 © 2012 Engineers Australia HWRS 201229

Figure 6 Simulated water level setup due to a constant northerly wind of 15 m/s
(approximately a 25 year return period event)
3.3. Wave Setup
Extreme surge events usually coincide with storms and high wave conditions and wave setup can be a significant component of the overall extreme water level at the coast. A number of different wind and wave conditions were simulated to investigate the exposure and wave heights along the coast. The wave climate for a northerly wave direction and an offshore HS = 5.5 m (Figure 7) shows that the west coast of Brunei is exposed while Brunei Bay is sheltered. It is noted that the wave setup for the open coast is of the same order of magnitude as the surge within Brunei Bay; additional surge in Brunei Bay is of the order of 30 cm for a wind speed of 15 m/s, which corresponds approximately to the sustained wind for the 25 years event which gave rise to a wave setup of 30 cm. Based on this it has been assumed for the assessment of the overall design water levels that the additional surge in Brunei Bay is balanced out by the lack of wave setup.
Figure 7 Simulation of extreme offshore waves for northerly offshore waves
(approximately a 50 year return period event)
3.4. Coincidence with Tidal Variations
The design still water level is the addition of the residual to the harmonic (tidal) component. The tides vary in an organised fashion with generally one high tide per day (diurnal), while an event such as a typhoon can last some hours or days depending upon track and speed at landfall. It is (conservatively) considered that there is a high probability that elevated residuals will cover a high tide. Residuals and
34th Hydrology and Water Resources Symposium 19-22 November 2012, Sydney, Australia
ISBN 978-1-922107-62-6 © 2012 Engineers Australia HWRS 201230

tides are also not necessarily independent variables; part of the residuals may be caused by wave setup and with protective shoals and reefs offshore the waves and wave setup will be higher during high tide than low tide for a given wave climate associated with an extreme wind/pressure event. The 2% exceedence tidal elevation was adopted as the representative high tide level for design purpose. This elevation, lying between Mean Higher High Water (MHHW, representing the average daily highest water level) and Highest Astronomical Tide (HAT, considered to be too conservative as the probability of an coincident extreme residual event is extremely small), is likely to be exceeded approximately 14 hours in a month.
3.5. Global Sea Level Rise
IPCC 2007 provides predictions of future global mean sea level rise; a value of 0.2 m for a 50 year design period was assigned. From the information provided in IPCC it is very difficult to assess how (or if) to incorporate other consequences of climate change (for example an increased frequency of typhoon events) into design ocean water levels. While no quantitative advice is provided, a cautious approach for particularly sensitive developments is warranted.
3.6. Tsunami
Tsunamis are generally associated with two types of damage; the effects of still water inundation over land area or buildings and the destructive force exerted by an impacting wave. Tsunami generation is complex and the events leading to tsunami generation such as earthquakes, volcanoes, subsea landslides and meteors are to a large degree unpredictable. However, earthquakes and volcanoes do tend to concentrate along certain fault zones in the earth’s mantle, and a potential zone that could trigger a tsunami capable of impacting Brunei is between Luzon and Taiwan. A hydrodynamic numerical model was applied to simulate tsunami propagation; Figure 8 shows wave heights 1 and 3½ hours after initial disturbance. These results demonstrate that a tsunami generated between Luzon and Taiwan can impact Brunei, however it is generally considered that the risk of tsunami is low and associated with events of return periods greater than 100 years.
Figure 8 Regional tsunami model 1 hour and 3.5 hours after initial disturbance between Luzon and Taiwan
3.7. Recommended Design Water Levels
Determination of design water levels is subject to interpretation and scrutiny, particularly when data is limited and design events are based on rare events (typhoons) which are difficult to ascribe a statistical occurrence. Due to the limited data available there is a large statistical uncertainty in establishing design water levels. Residuals, representing water levels above the pure tidal variation, are relatively small. With the relatively small residuals a high safety factor can be included at reasonable cost. Waves are primarily wind generated and it is reasonable to assume that wave setup will coincide with wind generated surge for a given event. With this in mind, design water levels for drainage design purposes were derived (Figure 9).
34th Hydrology and Water Resources Symposium 19-22 November 2012, Sydney, Australia
ISBN 978-1-922107-62-6 © 2012 Engineers Australia HWRS 201231

When incorporating hydrodynamic modelling into design analysis a time dependent rise and fall is considered more appropriate over the application of a constant water level. Such a time series, with a normal tidal signal superimposed over the various abnormal residual components, should be combined in such a way that the designated design ocean water level occurs at a certain time (see Section 4). When there is a significant risk to life or major property damage, a more conservative approach is recommended by assigning a lower frequency return period event.
Figure 9 Design water levels for drainage design purposes
4. TIMING OF RAINFALL AND ABNORMAL OCEAN WATER LEVELS
Elevated residual water levels generally coincide with the central low pressure area of a particular tropical storm or typhoon event, so that when a storm centre reaches the coastline ocean water levels are probably at their highest. Rainfall events can also coincide with the passage of a storm event, so that rainfall experienced by a particular catchment area will probably be highest when the storm centre has travelled inland and lies directly over the catchment in question. A time lag between peak abnormal ocean water levels and peak rainfall on an inland catchment area is therefore likely. There is also a time lag between rainfall and runoff which depends upon the size and shape of a particular catchment and its response (faster if urbanised). Thus, it may not be appropriate to coincide the peak of the design water level with the peak runoff from a given catchment as the likelihood of this joint concurrence is probably extremely rare and overly conservative. Three alternatives are considered: 1. Peak rainfall coincides with peak ocean water level and peak runoff occurs later (worst case water
levels resulting from the ocean). 2. Peak rainfall coincides with peak abnormal residuals and peak runoff coincides with peak normal
tide levels (worst case water levels resulting from upstream runoff). 3. A combination of 1 and 2 of differing occurrence (such as a 100 year return period ocean level
coinciding with a 20 year return period rainfall). To predict design water levels for a given application it is recommended that all alternatives be considered and the worst case adopted.
5. CONCLUSIONS
Design conditions assign risk of exceedence to the various phenomena that cause inundation and flooding, including rainfall, storm surge and tidal conditions. Drainage design, for which this research was focussed towards, is reliant upon these design values and also on how they are combined and applied. The analyses have been conducted with a limited data set that required a pragmatic approach to assignment of design conditions. For example, numerical modelling techniques were incorporated into the assessment of ocean water levels due to the lack of quality long duration data. The installation and
34th Hydrology and Water Resources Symposium 19-22 November 2012, Sydney, Australia
ISBN 978-1-922107-62-6 © 2012 Engineers Australia HWRS 201232
maintenance of long term monitoring stations in Brunei, to provide quality data for future updates to this assessment, is recommended. When combining the various phenomena, difficulties arise due to relative probabilities and questions of independence of occurrence of events. For Brunei, the timing of a rainfall event relative to the tidal cycle is critical as the backwater effect of a high tide can greatly increase the risk of flooding. The probabilities of coincidence of an ocean event occurring at the same time as a rainfall event are difficult to assess; they are not completely dependent, nor completely independent. For such instances where timing of events is critical, hydrodynamic numerical modelling techniques are recommended.
6. REFERENCES
Cordery, I., Pilgrim, D.H. and Rowbottom, I.A. (1984) Time patterns of rainfall for estimating design floods on a frequency basis. Water Sci. Tech., Vol.16, pp. 155-165. Department of Irrigation and Drainage Malaysia (DID) (2000), MSMAM (Manual Saliran Mesra Alam Malaysia, or Urban Stormwater Management Manual for Malaysia. Hosking, J.R.M. and Wallis, J.R., 1993, Some statistics useful in regional frequency analysis, Water Resour. Res., 29(2), 271-281. Correction, Water Resour. Res., 31(1), 251, 1995. Hosking, J.R.M. and Wallis, J.R., 1997, Regional Frequency Analysis, An Approach Based on L-moments, Cambridge University Press, UK. Institution of Engineers, Australia (IEAust), 2003. Australian Rainfall and Runoff, Volume 1, May 2003. IPCC (2007), Climate Change 2007: Synthesis Report. Contribution of Working Groups I, II and III to the Fourth Assessment Report of the Intergovernmental Panel on Climate Change [Core Writing Team, Pachauri, R.K and Reisinger, A. (eds.)]. IPCC, Geneva, Switzerland, 104 pp. Madsen, H., Rasmussen, P.F. and Rosbjerg, D., 1997, Comparison of annual maximum series and partial duration series methods for modeling extreme hydrologic events, 1. At-site modeling, Water Resources Research, 33(4), 747-757. Pilgrim, D.H., Cordery, I. and French, R (1969), Temporal patterns of design rainfall for Sydney. Civ. Engg Trans. Inst. Engrs Aust., Vol. CE11, pp. 9-14. Public Works Department (PWD), Brunei Darussalam (1988). Urban Drainage Design Standards, Report prepared by Syed Muhommad Dan Hooi for PWD. Public Works Department (PWD), Brunei Darussalam (2006). Brunei Drainage Masterplan Studies, prepared by Jurutera Tempatan and DHI Water and Environment for PWD.
34th Hydrology and Water Resources Symposium 19-22 November 2012, Sydney, Australia
ISBN 978-1-922107-62-6 © 2012 Engineers Australia HWRS 201233