drainage world-wide (smedema et al. 2004) · dm‐n adapt d effects on ... by irrigation water to...
TRANSCRIPT
1
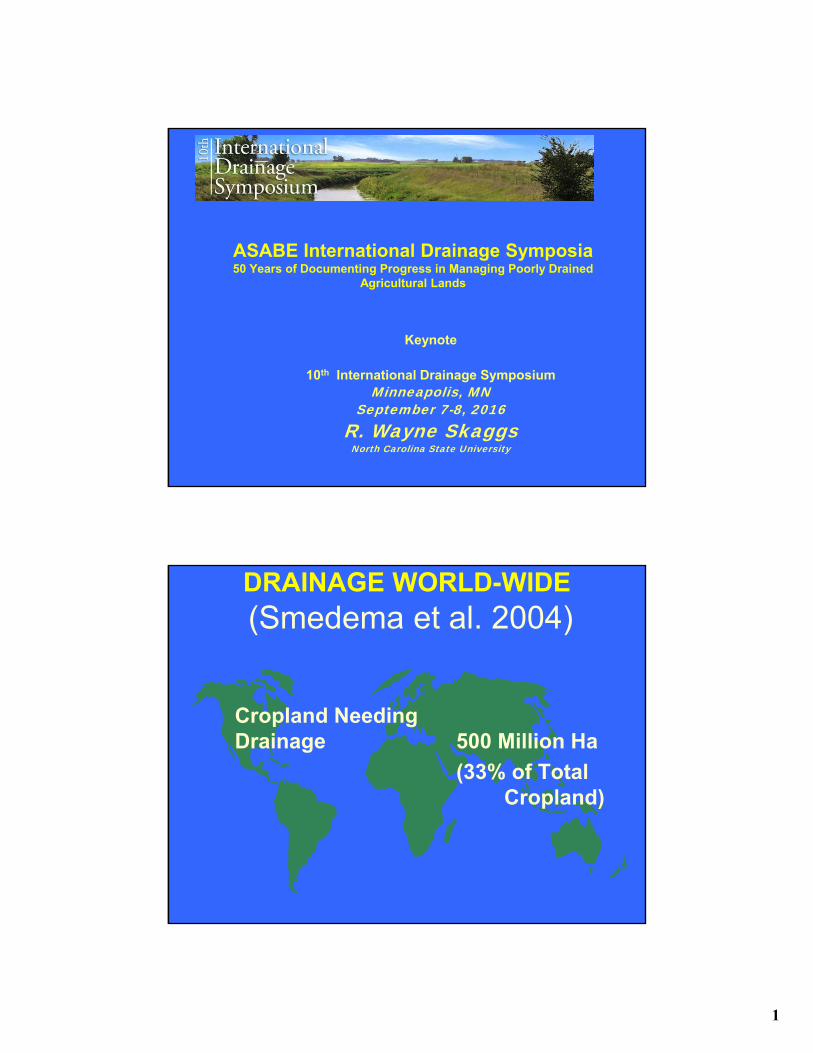
ASABE International Drainage Symposia50 Years of Documenting Progress in Managing Poorly Drained
Agricultural Lands
Keynote
10th International Drainage SymposiumMinneapolis, MN
September 7-8, 2016R. Wayne Skaggs
North Carolina State University
Cropland NeedingDrainage 500 Million Ha
(33% of Total Cropland)
DRAINAGE WORLD-WIDE
(Smedema et al. 2004)
2
History of Drainage
Drainage is an old and important practice
• Richard Cooke Observation—God was the first Drainage Engineer
• “And God said, let the waters be gathered together, and let the dry land appear: and it was so” Genesis 1:9
• The Roman Cato wrote about the importance of drainage in the first century. Luthin (1957)
• Archaeological evidence that the practice of drainage is much older
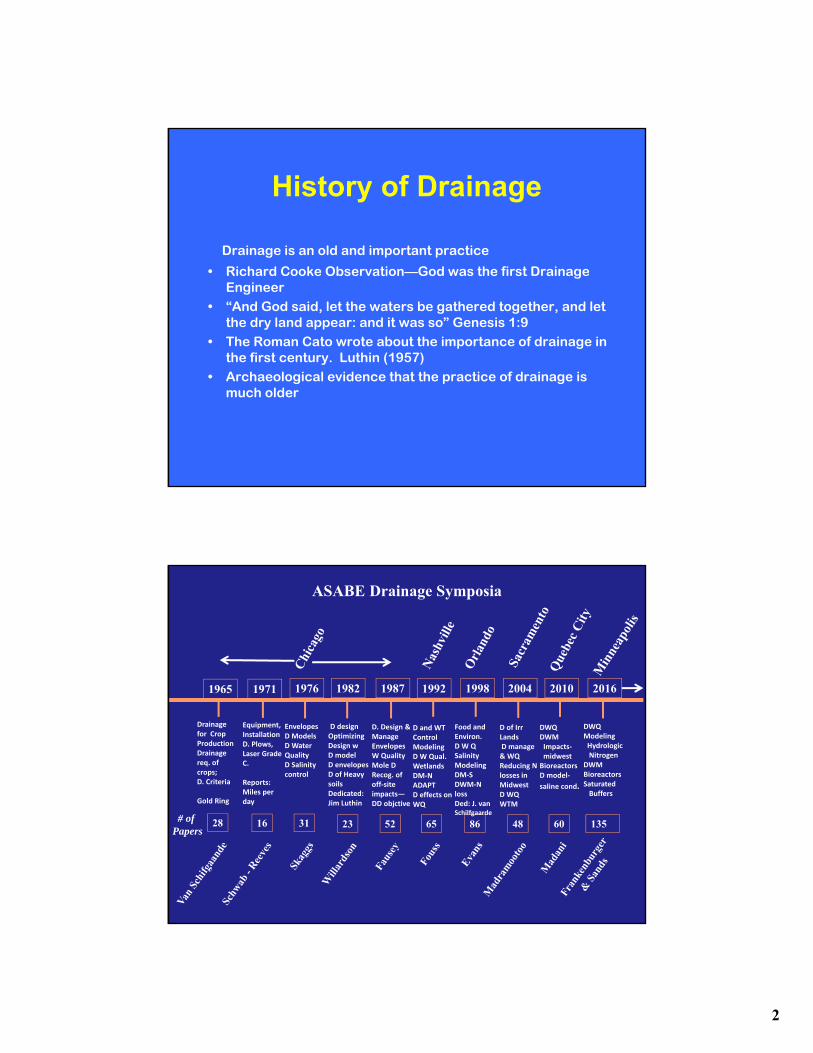
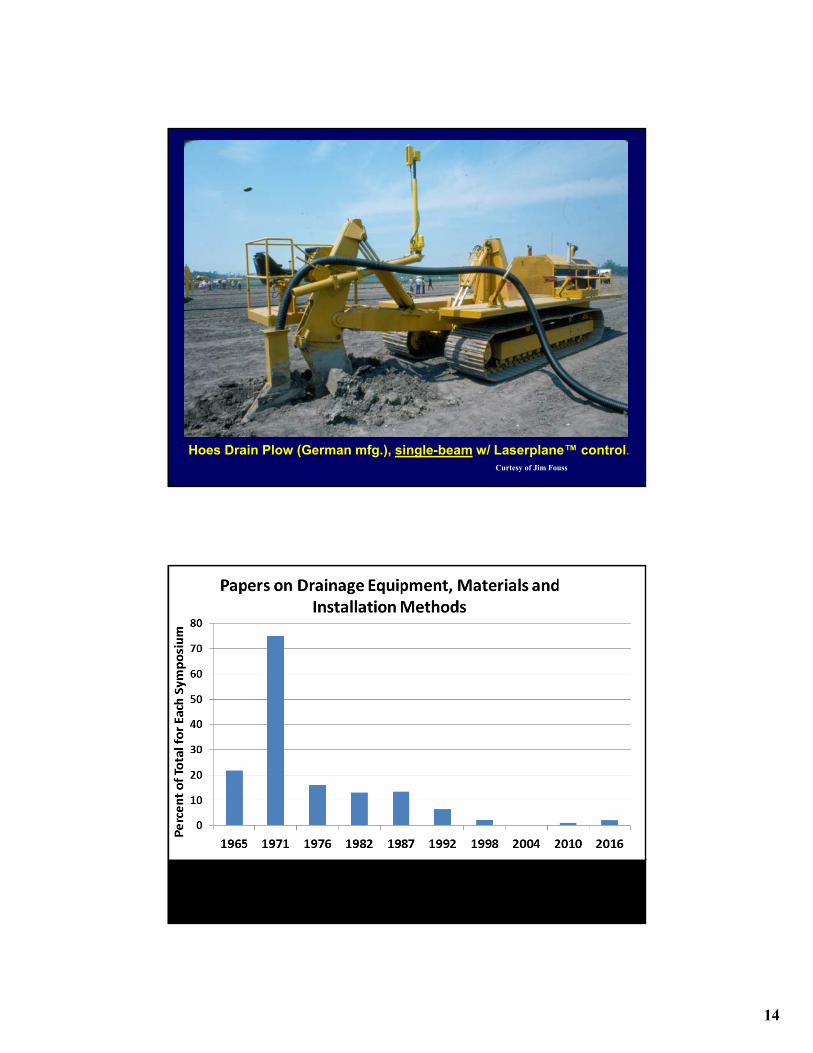
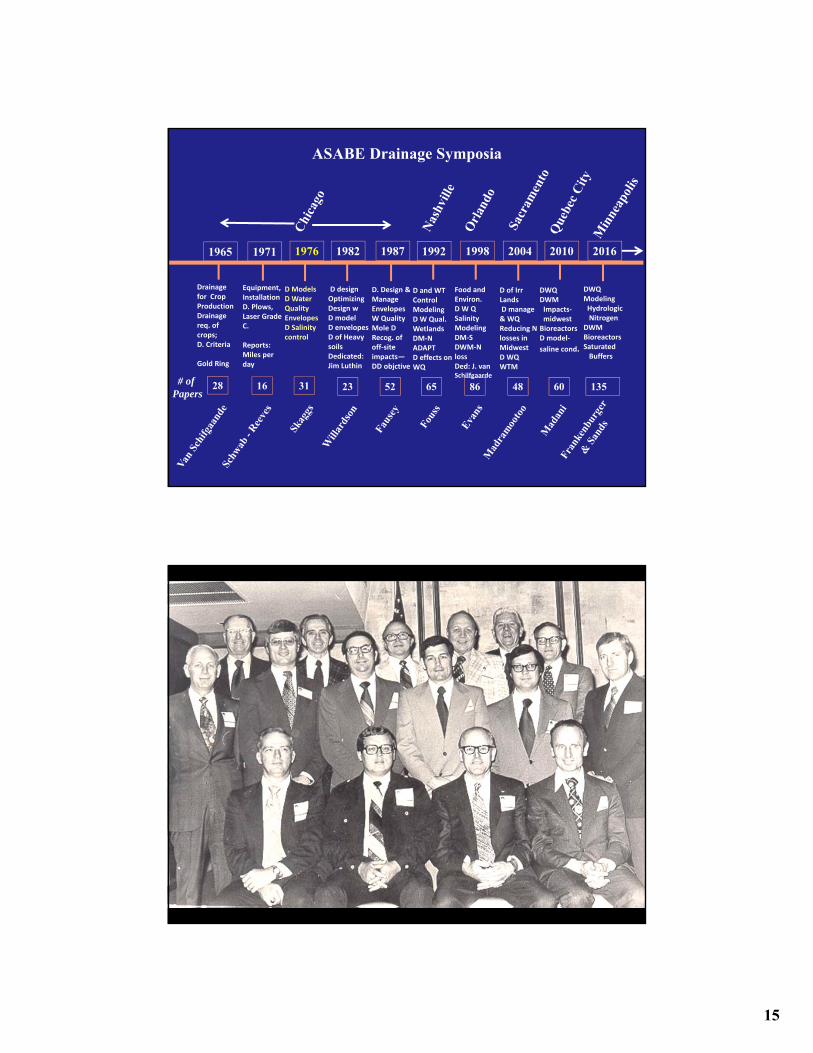
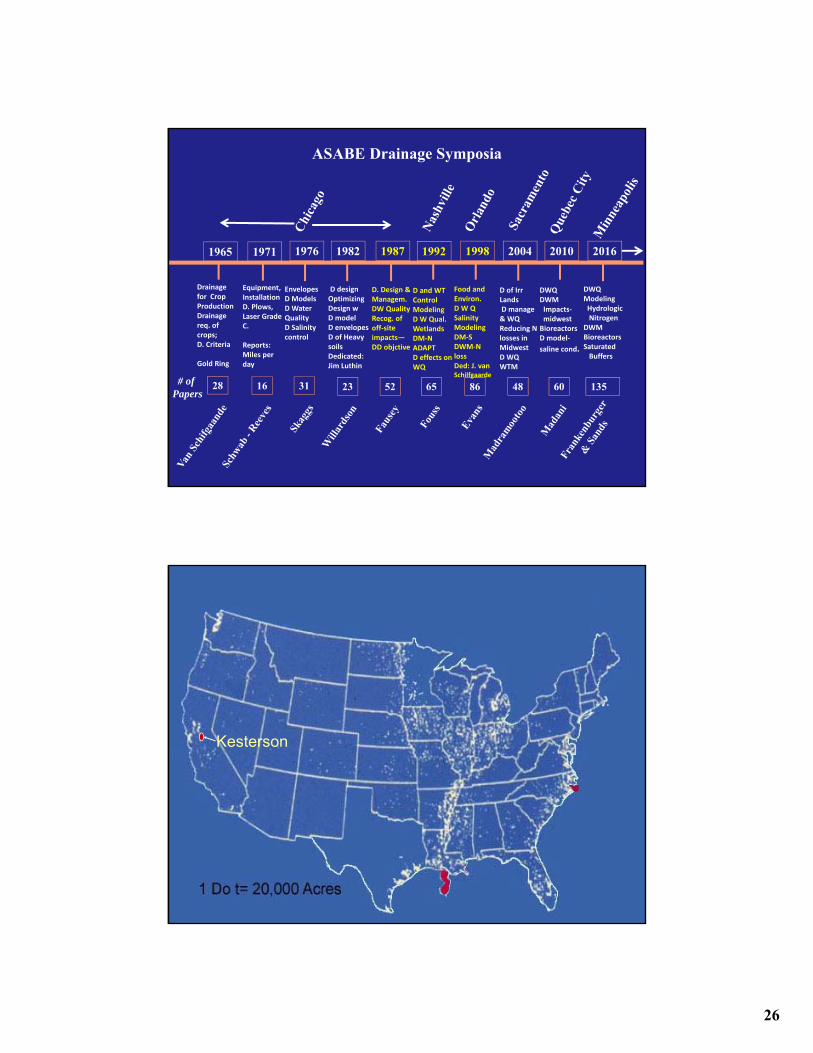
ASABE Drainage Symposia
1965 1971 1976 1982 1987 1992 1998 2004 2010 2016
# of Papers
Drainage for Crop ProductionDrainage req. of crops; D. Criteria
Gold Ring
28 16 31 23 52 65 86 48 60
Equipment, Installation D. Plows, Laser Grade C.
Reports:Miles per day
EnvelopesD ModelsD Water QualityD Salinity control
D. Design & ManageEnvelopesW QualityMole DRecog. of off‐site impacts—DD objctive
Food and Environ.D W Q SalinityModelingDM‐SDWM‐N lossDed: J. van Schilfgaarde
DWQDWMImpacts‐midwestBioreactorsD model‐
saline cond.
D designOptimizing Design wD modelD envelopesD of Heavy soils Dedicated: Jim Luthin
D and WT ControlModelingD W Qual. WetlandsDM‐NADAPTD effects on WQ
D of Irr LandsD manage & WQReducing N losses in MidwestD WQWTM
DWQModelingHydrologicNitrogen
DWMBioreactorsSaturatedBuffers
135

3

4
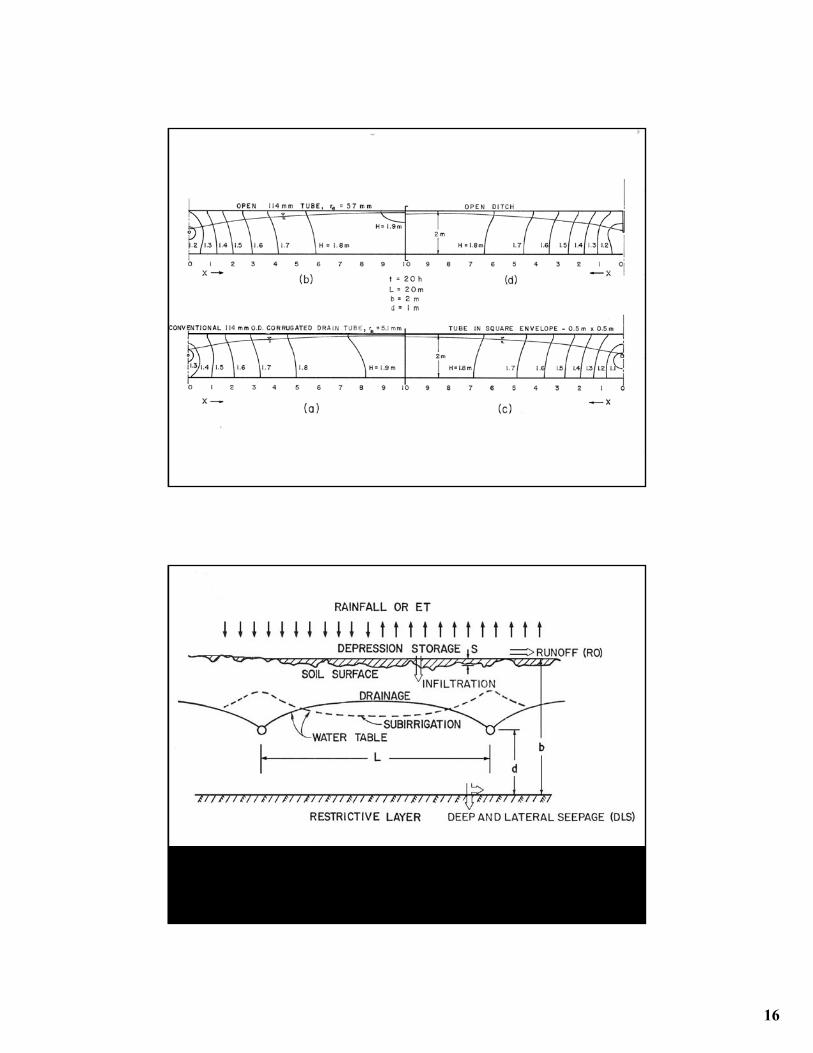
Drainage Theory
• Darcy, 1863• Dupuit, 1863• Colding, 1872• Boussinesq, 1903• Buckingham, 1907• Richards, 1931• Hooghoudt, 1939• Kirkham, 1937-1999• Donnan, 1946• Glover, 1954• Ernst, 1956• Van Schilfgaarde, 1963• Bouwer, 1963(Incomplete List)
Don Kirkham

5
6
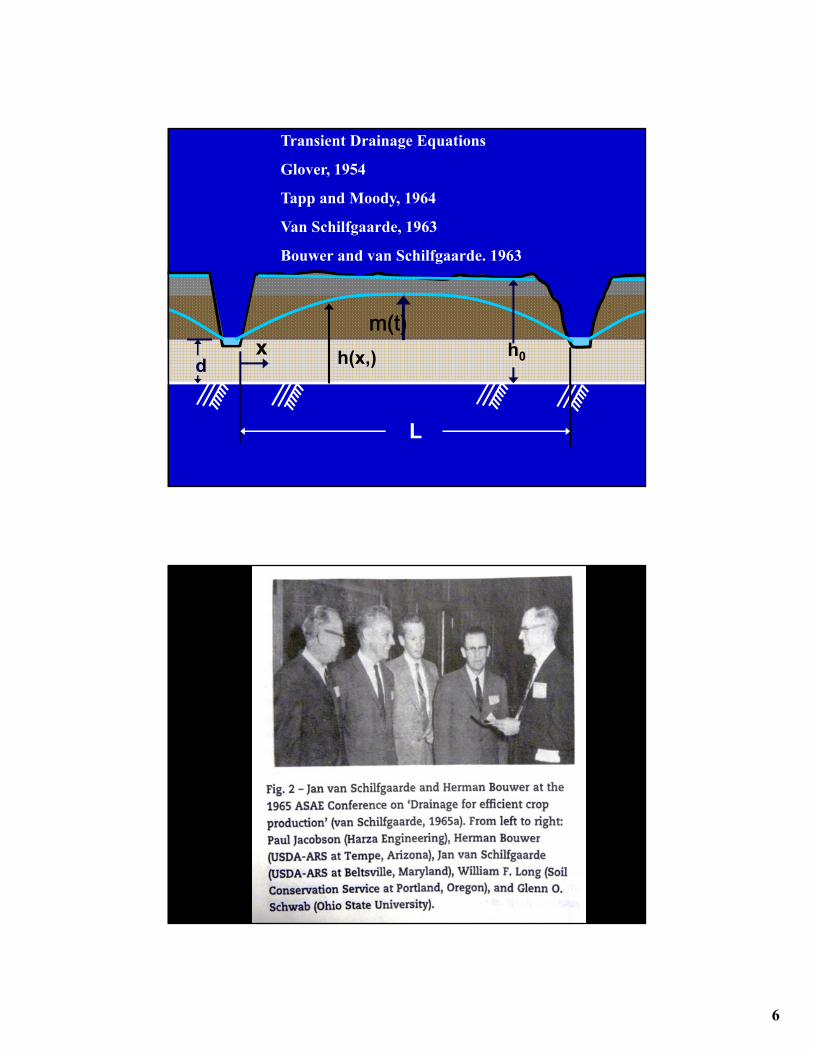
Transient Drainage Equations
Glover, 1954
Tapp and Moody, 1964
Van Schilfgaarde, 1963
Bouwer and van Schilfgaarde. 1963
m(t)x h(x,)
L
dh0
7
ASABE Drainage Symposia
1965 1971 1976 1982 1987 1992 1998 2004 2010 2016
# of Papers
Drainage for Crop ProductionDrainage req. of crops; D. Criteria
Gold Ring
28 16 31 23 52 65 86 48 60
Equipment, Installation D. Plows, Laser Grade C.
Reports:Miles per day
EnvelopesD ModelsD Water QualityD Salinity control
D. Design & ManageEnvelopesW QualityMole DRecog. of off‐site impacts—DD objctive
Food and Environ.D W Q SalinityModelingDM‐SDWM‐N lossDed: J. van Schilfgaarde
DWQDWMImpacts‐midwestBioreactorsD model‐
saline cond.
D designOptimizing Design wD modelD envelopesD of Heavy soils Dedicated: Jim Luthin
D and WT ControlModelingD W Qual. WetlandsDM‐NADAPTD effects on WQ
D of Irr LandsD manage & WQReducing N losses in MidwestD WQWTM
DWQModelingHydrologicNitrogen
DWMBioreactorsSaturatedBuffers
135

8
Social Significance of Drainage Law
“All law is socially significant, no matter how dry and uninteresting and technical”
(H.W. Hannah, 1965)
ASABE Drainage Symposia
1965 1971 1976 1982 1987 1992 1998 2004 2010 2016
# of Papers
Drainage for Crop ProductionDrainage req. of crops; D. Criteria
Gold Ring
28 16 31 23 52 65 86 48 60
Equipment, Installation D. Plows, Laser Grade C.
Reports:Miles per day
EnvelopesD ModelsD Water QualityD Salinity control
D. Design & ManageEnvelopesW QualityMole DRecog. of off‐site impacts—DD objctive
Food and Environ.D W Q SalinityModelingDM‐SDWM‐N lossDed: J. van Schilfgaarde
DWQDWMImpacts‐midwestBioreactorsD model‐
saline cond.
D designOptimizing Design wD modelD envelopesD of Heavy soils Dedicated: Jim Luthin
D and WT ControlModelingD W Qual. WetlandsDM‐NADAPTD effects on WQ
D of Irr LandsD manage & WQReducing N losses in MidwestD WQWTM
DWQModelingHydrologicNitrogen
DWMBioreactorsSaturatedBuffers
135

9
ASABE Drainage Symposia
1965 1971 1976 1982 1987 1992 1998 2004 2010 2016
# of Papers
Drainage for Crop ProductionDrainage req. of crops; D. Criteria
Gold Ring
28 16 31 23 52 65 86 48 60
Equipment, Installation D. Plows, Laser Grade C.
Reports:Miles per day
EnvelopesD ModelsD Water QualityD Salinity control
D. Design & ManageEnvelopesW QualityMole DRecog. of off‐site impacts—DD objctive
Food and Environ.D W Q SalinityModelingDM‐SDWM‐N lossDed: J. van Schilfgaarde
DWQDWMImpacts‐midwestBioreactorsD model‐
saline cond.
D designOptimizing Design wD modelD envelopesD of Heavy soils Dedicated: Jim Luthin
D and WT ControlModelingD W Qual. WetlandsDM‐NADAPTD effects on WQ
D of Irr LandsD manage & WQReducing N losses in MidwestD WQWTM
DWQModelingHydrologicNitrogen
DWMBioreactorsSaturatedBuffers
135
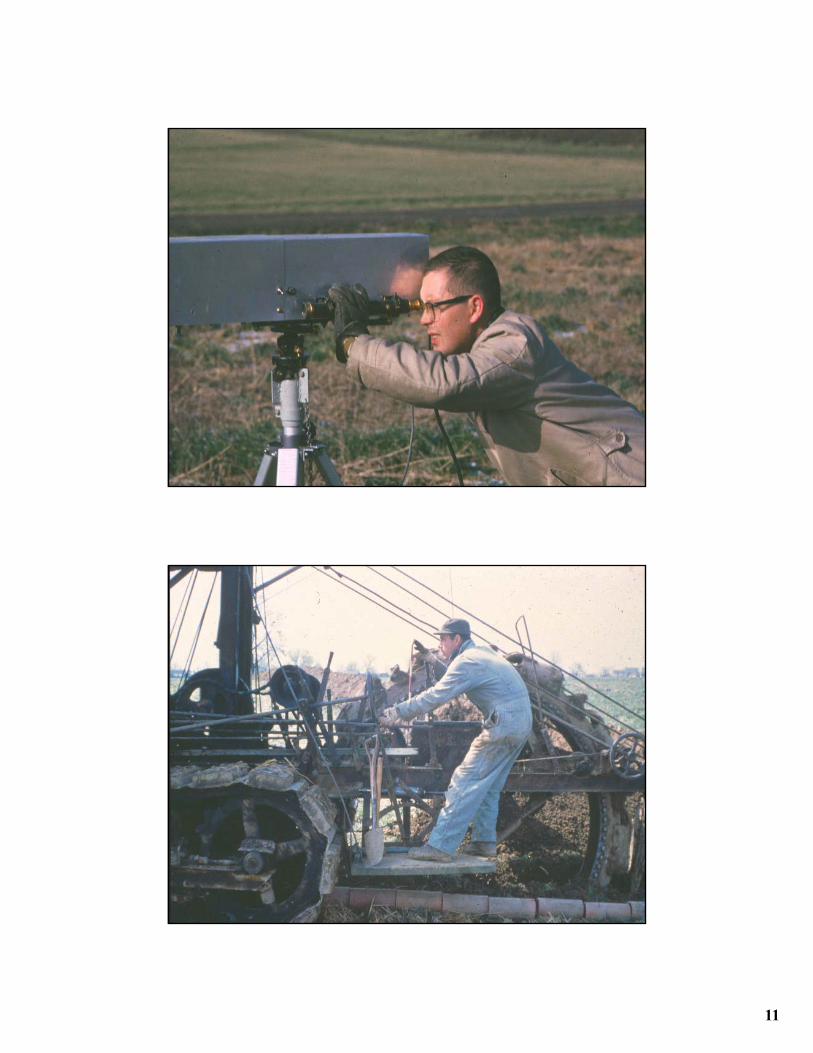
Advances in Subsurface Materials and Installat
Picture courtesy A. Ward
Picture courtesy R. Cooke
10
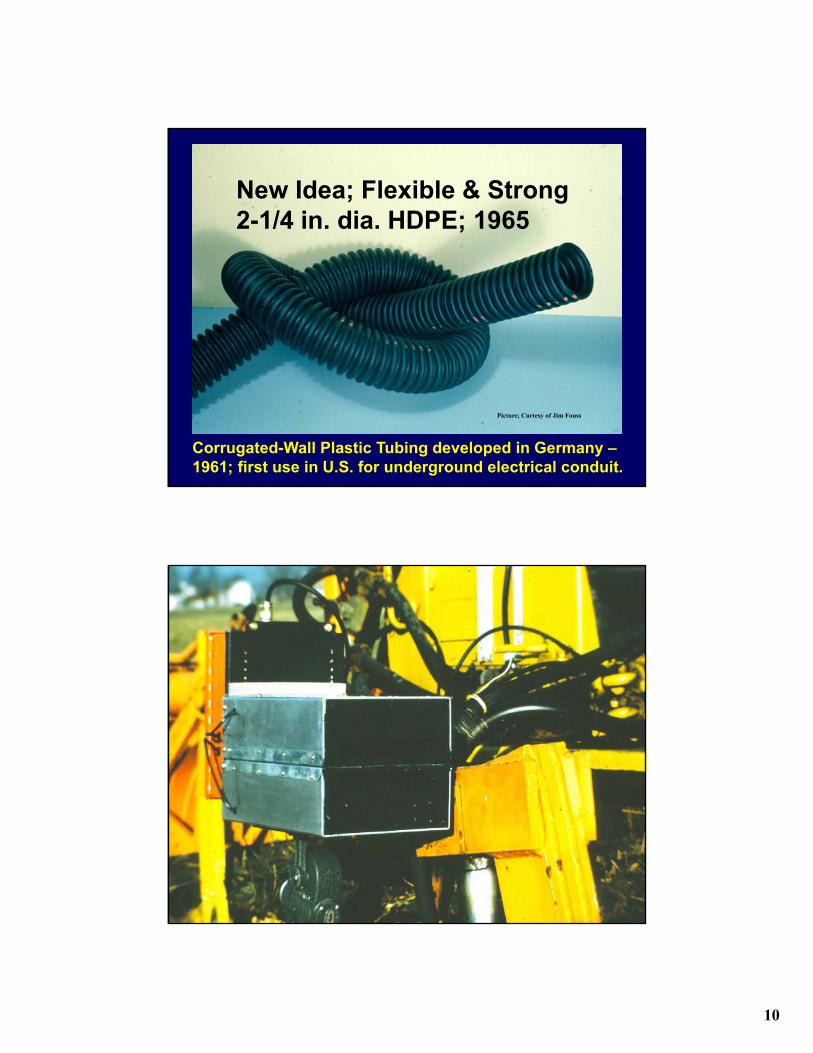
New Idea; Flexible & Strong2-1/4 in. dia. HDPE; 1965
Corrugated-Wall Plastic Tubing developed in Germany –1961; first use in U.S. for underground electrical conduit.
Picture, Curtesy of Jim Fouss
11

12
13
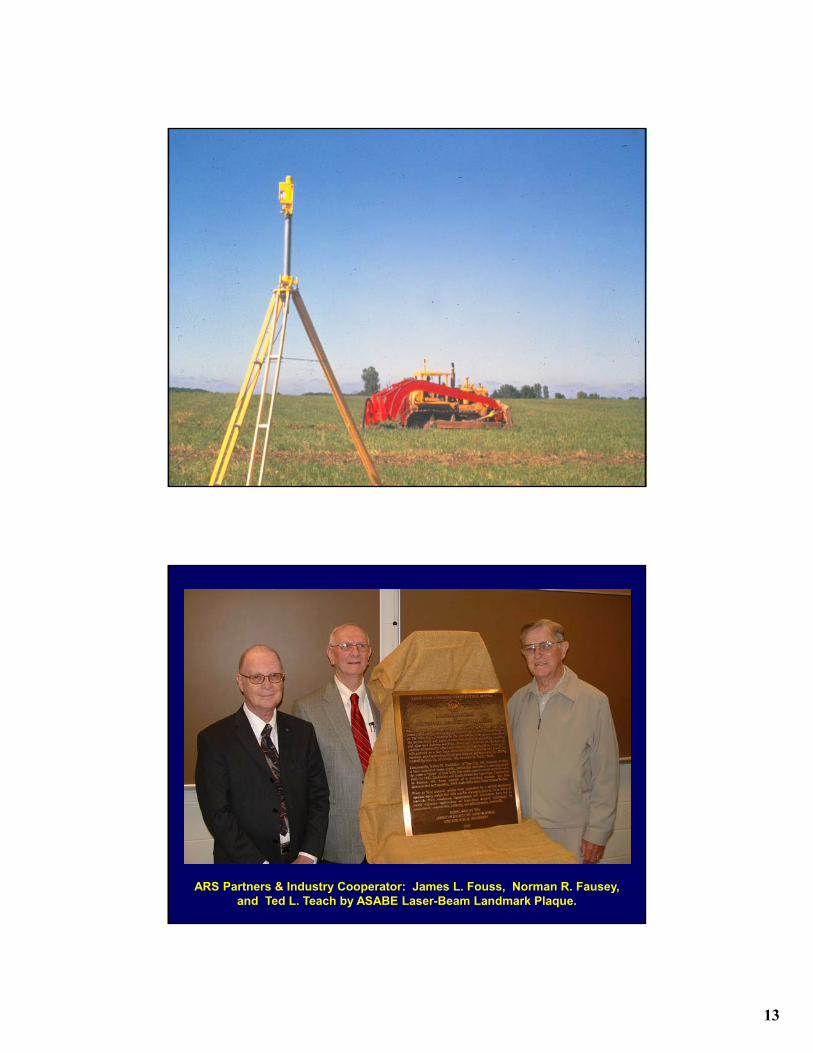
ARS Partners & Industry Cooperator: James L. Fouss, Norman R. Fausey, and Ted L. Teach by ASABE Laser-Beam Landmark Plaque.
14
Hoes Drain Plow (German mfg.), single-beam w/ Laserplane™ control. Curtesy of Jim Fouss
15
ASABE Drainage Symposia
1965 1971 1976 1982 1987 1992 1998 2004 2010 2016
# of Papers
Drainage for Crop ProductionDrainage req. of crops; D. Criteria
Gold Ring
28 16 31 23 52 65 86 48 60
Equipment, Installation D. Plows, Laser Grade C.
Reports:Miles per day
D ModelsD Water QualityEnvelopesD Salinity control
D. Design & ManageEnvelopesW QualityMole DRecog. of off‐site impacts—DD objctive
Food and Environ.D W Q SalinityModelingDM‐SDWM‐N lossDed: J. van Schilfgaarde
DWQDWMImpacts‐midwestBioreactorsD model‐
saline cond.
D designOptimizing Design wD modelD envelopesD of Heavy soils Dedicated: Jim Luthin
D and WT ControlModelingD W Qual. WetlandsDM‐NADAPTD effects on WQ
D of Irr LandsD manage & WQReducing N losses in MidwestD WQWTM
DWQModelingHydrologicNitrogen
DWMBioreactorsSaturatedBuffers
135
16
17
ASABE Drainage Symposia
1965 1971 1976 1982 1987 1992 1998 2004 2010 2016
# of Papers
Drainage for Crop ProductionDrainage req. of crops; D. Criteria
Gold Ring
28 16 31 23 52 65 86 48 60
Equipment, Installation D. Plows, Laser Grade C.
Reports:Miles per day
EnvelopesD ModelsD Water QualityD Salinity control
D. Design & ManageEnvelopesW QualityMole DRecog. of off‐site impacts—DD objctive
Food and Environ.D W Q SalinityModelingDM‐SDWM‐N lossDed: J. van Schilfgaarde
DWQDWMImpacts‐midwestBioreactorsD model‐
saline cond.
D designOptimizing Design wD modelD envelopesD of Heavy soils Dedicated: Jim Luthin
D and WT ControlModelingD W Qual. WetlandsDM‐NADAPTD effects on WQ
D of Irr LandsD manage & WQReducing N losses in MidwestD WQWTM
DWQModelingHydrologicNitrogen
DWMBioreactorsSaturatedBuffers
135
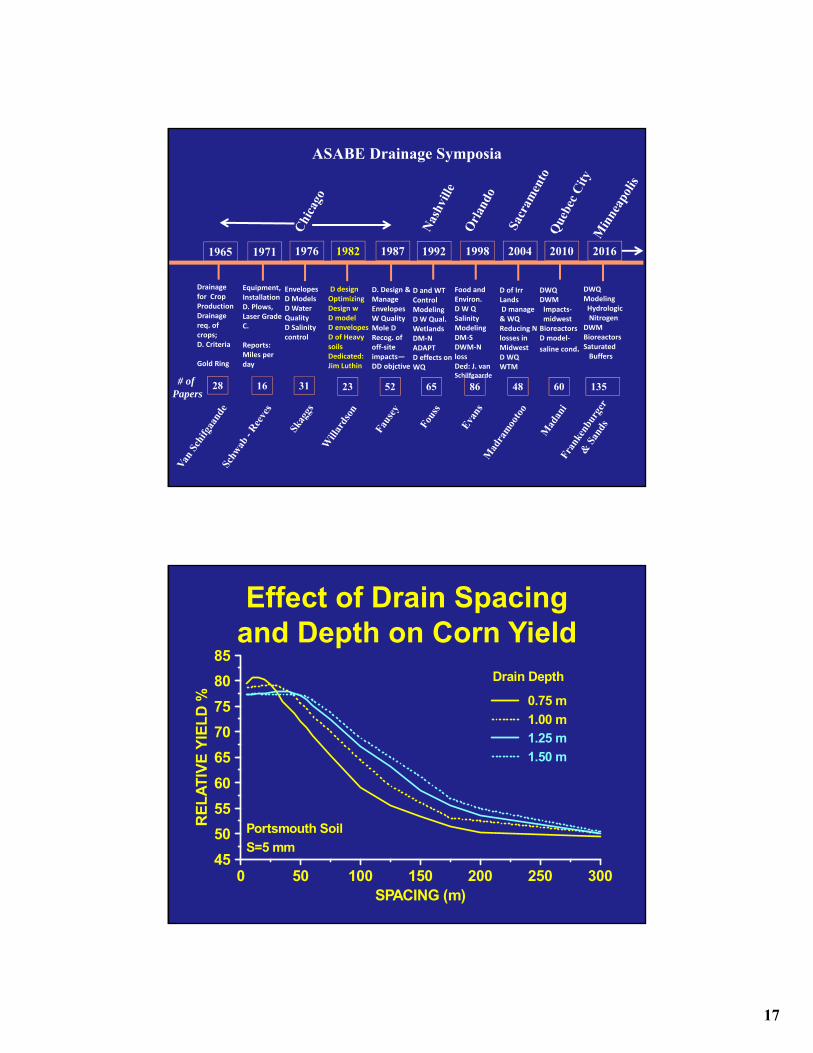
0 50 100 150 200 250 30045
50
55
60
65
70
75
80
85
SPACING (m)
RE
LA
TIV
E Y
IEL
D %
Portsmouth Soil
S=5 mm
0.75 m
1.00 m
1.25 m
1.50 m
Drain Depth
Effect of Drain Spacing and Depth on Corn Yield
18
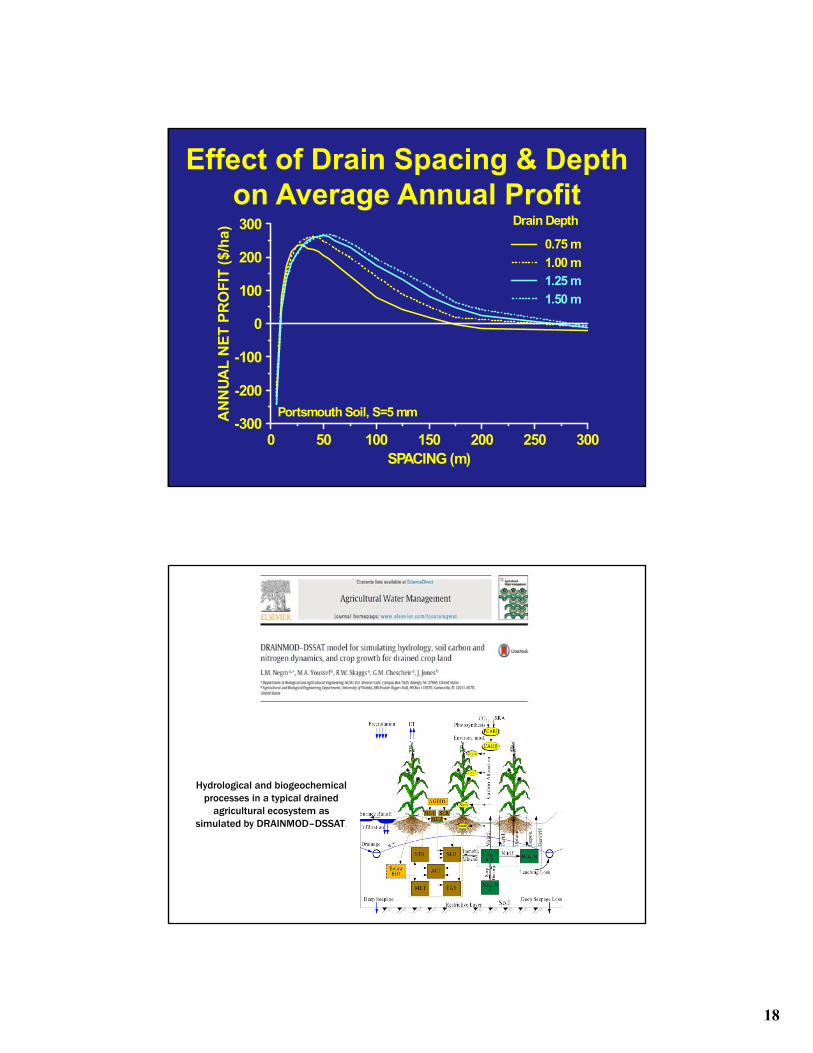
Effect of Drain Spacing & Depth on Average Annual Profit
0 50 100 150 200 250 300-300
-200
-100
0
100
200
300
SPACING (m)
AN
NU
AL
NE
T P
RO
FIT
($/
ha)
Portsmouth Soil, S=5 mm
0.75 m
1.00 m
1.25 m
1.50 m
Drain Depth
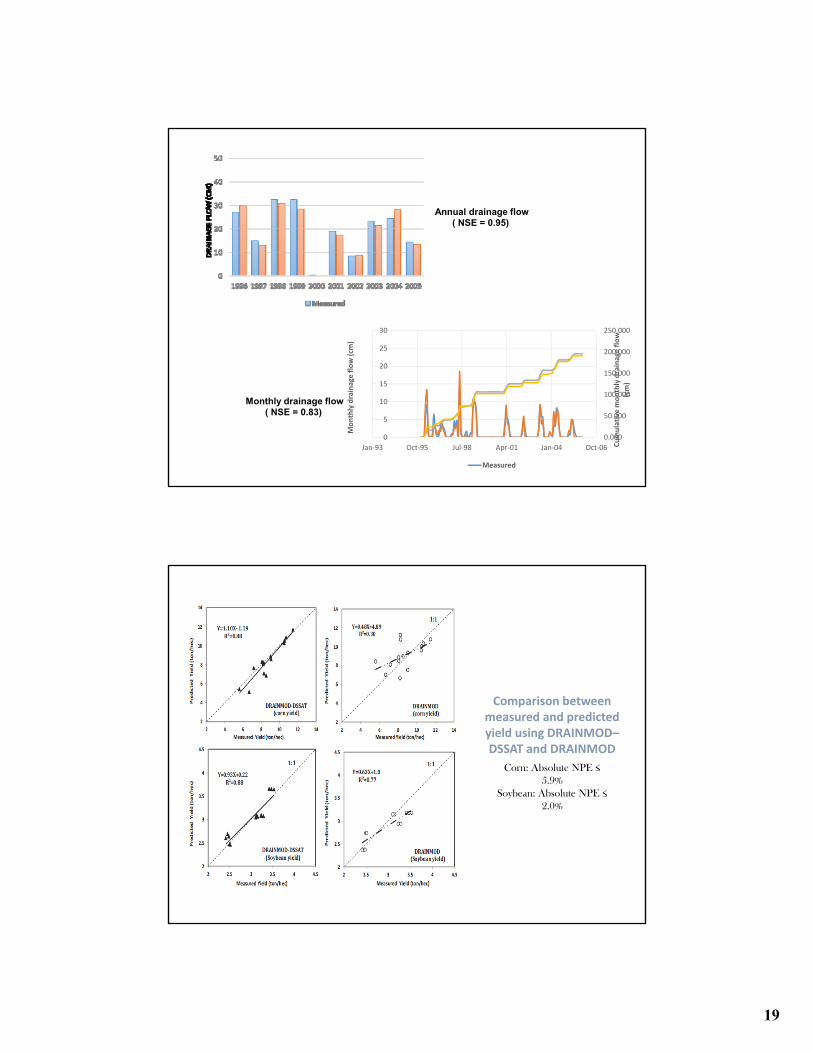
Hydrological and biogeochemical processes in a typical drained
agricultural ecosystem as simulated by DRAINMOD–DSSAT.
19
Annual drainage flow( NSE = 0.95)
0.000
50.000
100.000
150.000
200.000
250.000
0
5
10
15
20
25
30
Jan‐93 Oct‐95 Jul‐98 Apr‐01 Jan‐04 Oct‐06 Cumulative m
onthly drainage flow
(cm)
Monthly drainage flow (cm
)
Measured
Monthly drainage flow( NSE = 0.83)
Comparison between measured and predicted yield using DRAINMOD–DSSAT and DRAINMOD
Corn: Absolute NPE ≤ 5.9%
Soybean: Absolute NPE ≤ 2.0%

20
Comparison between measured and predicted monthly N losses for the high, medium, and low N treatment( 0.67 ≤ NSE ≤ 0.86)
Models
DRAINMOD
SWATR-SWATRE-SWACROP
RTZWQM
HYDRAS
MIKE-SHE
ADAPT
VS2DT
SWAT

21
ASABE Drainage Symposia
1965 1971 1976 1982 1987 1992 1998 2004 2010 2016
# of Papers
Drainage for Crop ProductionDrainage req. of crops; D. Criteria
Gold Ring
28 16 31 23 52 65 86 48 60
Equipment, Installation D. Plows, Laser Grade C.
Reports:Miles per day
EnvelopesD ModelsD Water QualityD Salinity control
D. Design & Managem.DW QualityRecog. of off‐site impacts—DD objctive
Food and Environ.D W Q SalinityModelingDM‐SDWM‐N lossDed: J. van Schilfgaarde
DWQDWMImpacts‐midwestBioreactorsD model‐
saline cond.
D designOptimizing Design wD modelD envelopesD of Heavy soils Dedicated: Jim Luthin
D and WT ControlModelingD W Qual. WetlandsDM‐NADAPTD effects on WQ
D of Irr LandsD manage & WQReducing N losses in MidwestD WQWTM
DWQModelingHydrologicNitrogen
DWMBioreactorsSaturatedBuffers
135

22
Reduction in Drainage Research
Recognition of value of wetlands Concern that long term government policies had
encouraged conversion of wetlands USDA-ARS units focused on drainage reduced from 14 to
4 University positions in drainage research reduced-
retirements not filled Failure to recognize importance of drained lands to our
cropland base New Challenges would eventually demand increased
research and development in drainage related issues
Kesterson

23
24

25
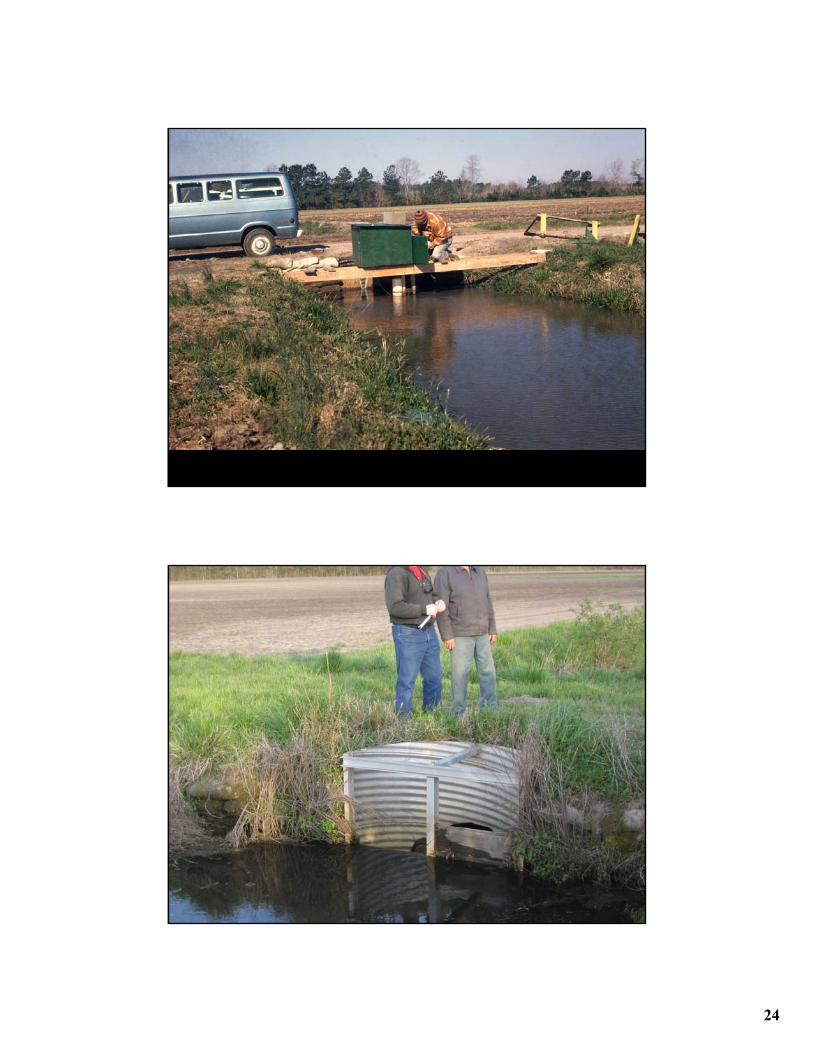
Controlled Drainage
Flashboard Riser Water Control Structure
26
ASABE Drainage Symposia
1965 1971 1976 1982 1987 1992 1998 2004 2010 2016
# of Papers
Drainage for Crop ProductionDrainage req. of crops; D. Criteria
Gold Ring
28 16 31 23 52 65 86 48 60
Equipment, Installation D. Plows, Laser Grade C.
Reports:Miles per day
EnvelopesD ModelsD Water QualityD Salinity control
D. Design & Managem.DW QualityRecog. of off‐site impacts—DD objctive
Food and Environ.D W Q SalinityModelingDM‐SDWM‐N lossDed: J. van Schilfgaarde
DWQDWMImpacts‐midwestBioreactorsD model‐
saline cond.
D designOptimizing Design wD modelD envelopesD of Heavy soils Dedicated: Jim Luthin
D and WT ControlModelingD W Qual. WetlandsDM‐NADAPTD effects on WQ
D of Irr LandsD manage & WQReducing N losses in MidwestD WQWTM
DWQModelingHydrologicNitrogen
DWMBioreactorsSaturatedBuffers
135
Kesterson
27
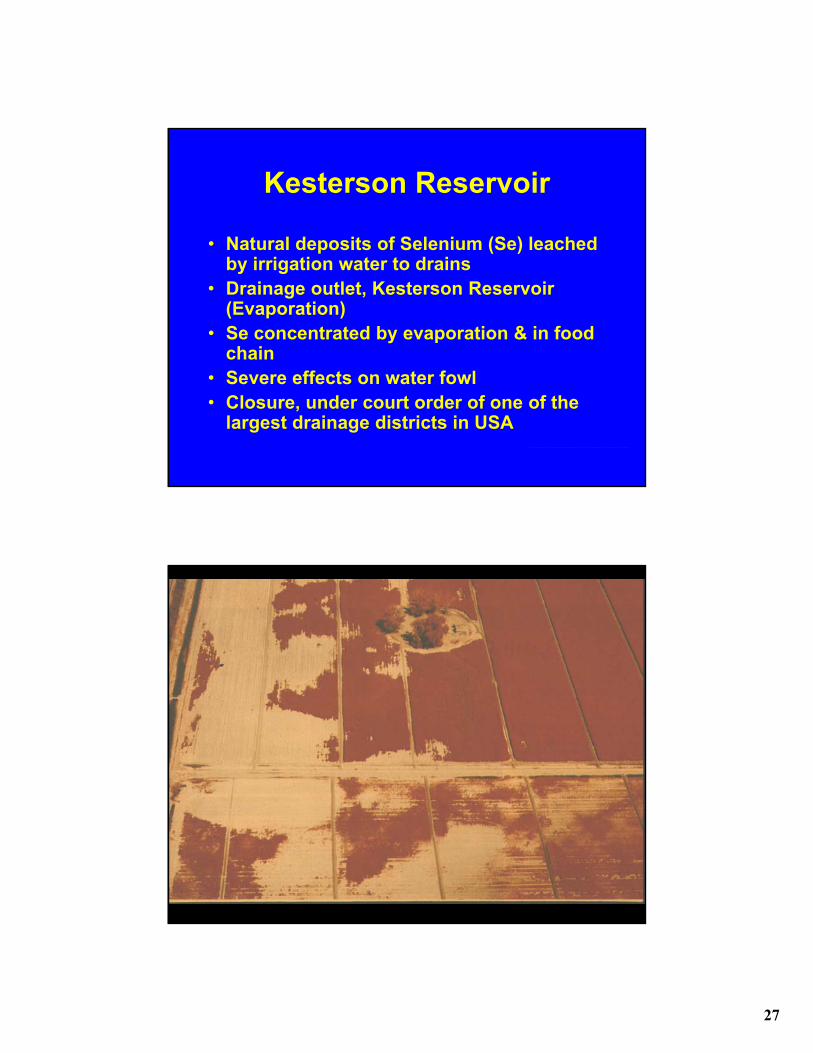
Kesterson Reservoir
• Natural deposits of Selenium (Se) leached by irrigation water to drains
• Drainage outlet, Kesterson Reservoir (Evaporation)
• Se concentrated by evaporation & in food chain
• Severe effects on water fowl• Closure, under court order of one of the
largest drainage districts in USA

28
ASABE Drainage Symposia
1965 1971 1976 1982 1987 1992 1998 2004 2010 2016
# of Papers
Drainage for Crop ProductionDrainage req. of crops; D. Criteria
Gold Ring
28 16 31 23 52 65 86 48 60
Equipment, Installation D. Plows, Laser Grade C.
Reports:Miles per day
EnvelopesD ModelsD Water QualityD Salinity control
D. Design & Managem.DW QualityRecog. of off‐site impacts—DD objctive
Food and Environ.D W Q SalinityModelingDM‐SDWM‐N lossDed: J. van Schilfgaarde
DWQDWMImpacts‐midwestBioreactorsD model‐
saline cond.
D designOptimizing Design wD modelD envelopesD of Heavy soils Dedicated: Jim Luthin
D and WT ControlModelingD W Qual. WetlandsDM‐NADAPTD effects on WQ
D of Irr LandsD manage & WQReducing N losses in MidwestD WQWTM
DWQModelingHydrologicNitrogen
DWMBioreactorsSaturatedBuffers
135

29
Avg. annual nitrogen yield Mississippi Riverof streams for 1980-1996 Drainage Basin
Hypoxic Zone
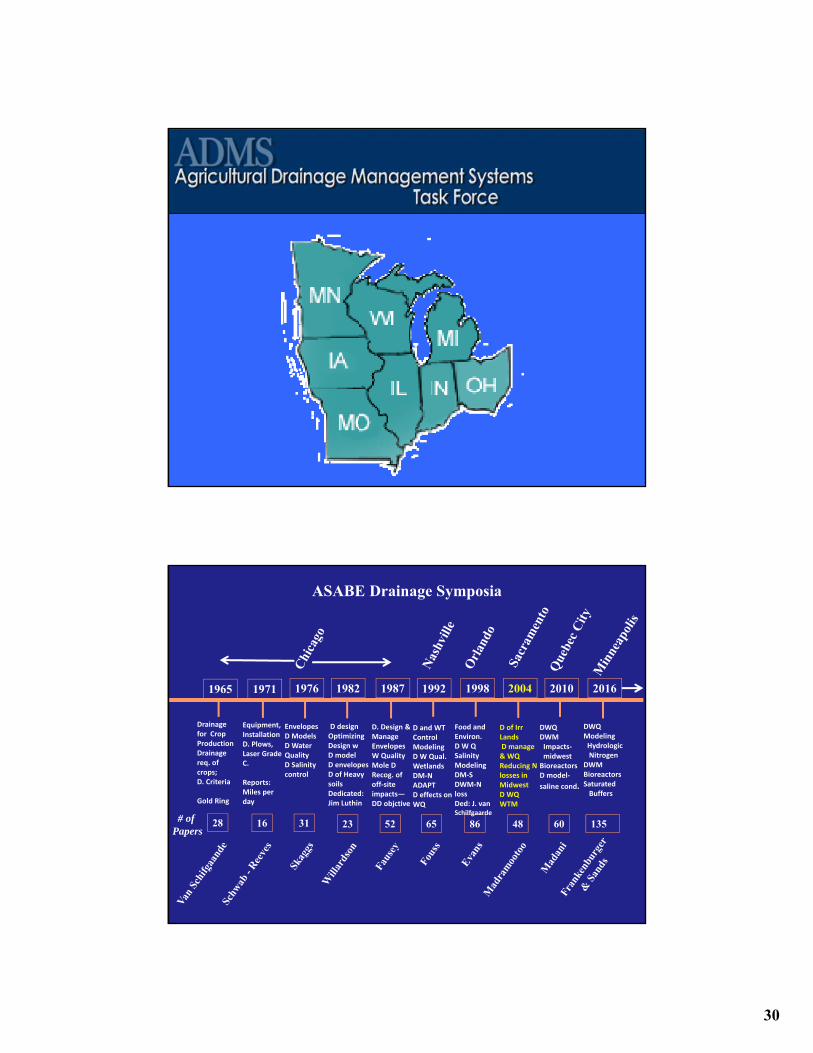
Agricultural Drainage Management Systems (ADMS)
• USDA – ARS
• USDA – NRCS
• Land Grant University Research and Extension
• Drainage Industry
• US EPA
• State Agricultural and Environmental Agencies
• NGOs (eg., Sand County Foundation)
• ADM Coalition (Industry)
30
ASABE Drainage Symposia
1965 1971 1976 1982 1987 1992 1998 2004 2010 2016
# of Papers
Drainage for Crop ProductionDrainage req. of crops; D. Criteria
Gold Ring
28 16 31 23 52 65 86 48 60
Equipment, Installation D. Plows, Laser Grade C.
Reports:Miles per day
EnvelopesD ModelsD Water QualityD Salinity control
D. Design & ManageEnvelopesW QualityMole DRecog. of off‐site impacts—DD objctive
Food and Environ.D W Q SalinityModelingDM‐SDWM‐N lossDed: J. van Schilfgaarde
DWQDWMImpacts‐midwestBioreactorsD model‐
saline cond.
D designOptimizing Design wD modelD envelopesD of Heavy soils Dedicated: Jim Luthin
D and WT ControlModelingD W Qual. WetlandsDM‐NADAPTD effects on WQ
D of Irr LandsD manage & WQReducing N losses in MidwestD WQWTM
DWQModelingHydrologicNitrogen
DWMBioreactorsSaturatedBuffers
135

31
2004 Drainage Symposium
Sessions on Drainage of Irrigated Lands
24 of the 48 papers involve drainage water quality
Most involve Nitrogen
– Effect of drainage on N losses
– Drainage design and management to reduce N losses
– Bioreactors, denitrification walls
– Other methods for reducing N losses
0
10
20
30
40
50
60
70
0 0.5 1 1.5 2 2.5Drainage Intensity, cm/day
NO
3-N
Lo
ss, l
b/a
c/y
r

32
Drainage Control Box
Main Collector Pipe
Lateral Drain Pipes
Root Zone
Drainage Ditch
Controlled Drainage(Drainage Water Management)
• Ontario Drury et al. (1996)
• Quebec Madramootoo et al. (1999)
• Ohio Fausey (2005)
• Sweden Wesstrom et al. (2006)

33
ASABE Drainage Symposia
1965 1971 1976 1982 1987 1992 1998 2004 2010 2016
# of Papers
Drainage for Crop ProductionDrainage req. of crops; D. Criteria
Gold Ring
28 16 31 23 52 65 86 48 60
Equipment, Installation D. Plows, Laser Grade C.
Reports:Miles per day
EnvelopesD ModelsD Water QualityD Salinity control
D. Design & ManageEnvelopesW QualityMole DRecog. of off‐site impacts—DD objctive
Food and Environ.D W Q SalinityModelingDM‐SDWM‐N lossDed: J. van Schilfgaarde
DWQDWMImpacts‐midwestBioreactorsD model‐
saline cond.
D designOptimizing Design wD modelD envelopesD of Heavy soils Dedicated: Jim Luthin
D and WT ControlModelingD W Qual. WetlandsDM‐NADAPTD effects on WQ
D of Irr LandsD manage & WQReducing N losses in MidwestD WQWTM
DWQModelingHydrologicNitrogen
DWMBioreactorsSaturatedBuffers
135
Drain Drain Control Percent ReductionReference Location Soil Area Spacing Depth Depth* Drainage N Loss
(ha) (m) (m) (m)_____________________________________________________________________________________________Gilliam et al. (1979) N. Carolina Portsmouth sl 5 to 16 30 & 80 1.2 0.3-0.5 50 50
N. Carolina Goldsboro sl 3 30 1 0.3 85 85Evans et al. (1989) N. Carolina Ballahack sl 4 18 1 0.6 56 56
N. Carolina Wasda muck 4 100 1.2 0.6 51 56N. Carolina Wasda muck 4 18 1 0.6 17 18
Lalonde et al. (1996) Ontario Bainesville sil 0.63 18.3 1 0.75 49 690.5 80 82
Tan et al.(1998) Ontario Brookston cl 2.2 9.3 0.65 0.3 20 19Drury et al., 2008 Ontario Brookston cl 0.1 7.5 0.6 0.3 29** 31 - 44***Wesstrom et al. (2007) Sweden Loamy Sand 0.2 10 1 0.2-0.4 80 80Fausey (2005) Ohio Hoytville sic 0.07 6 0.8 0.3 41 46
* Controll typically removed during seedbed preparation, planting, and harvesting periods. **CD reduced subsurface drainage by 29%, increased surface runoff by 38% & reduced total outflow by 10.6%*** CD reduced N loss by 44% for recommended N application rates and by 31% for elevated N rates
34
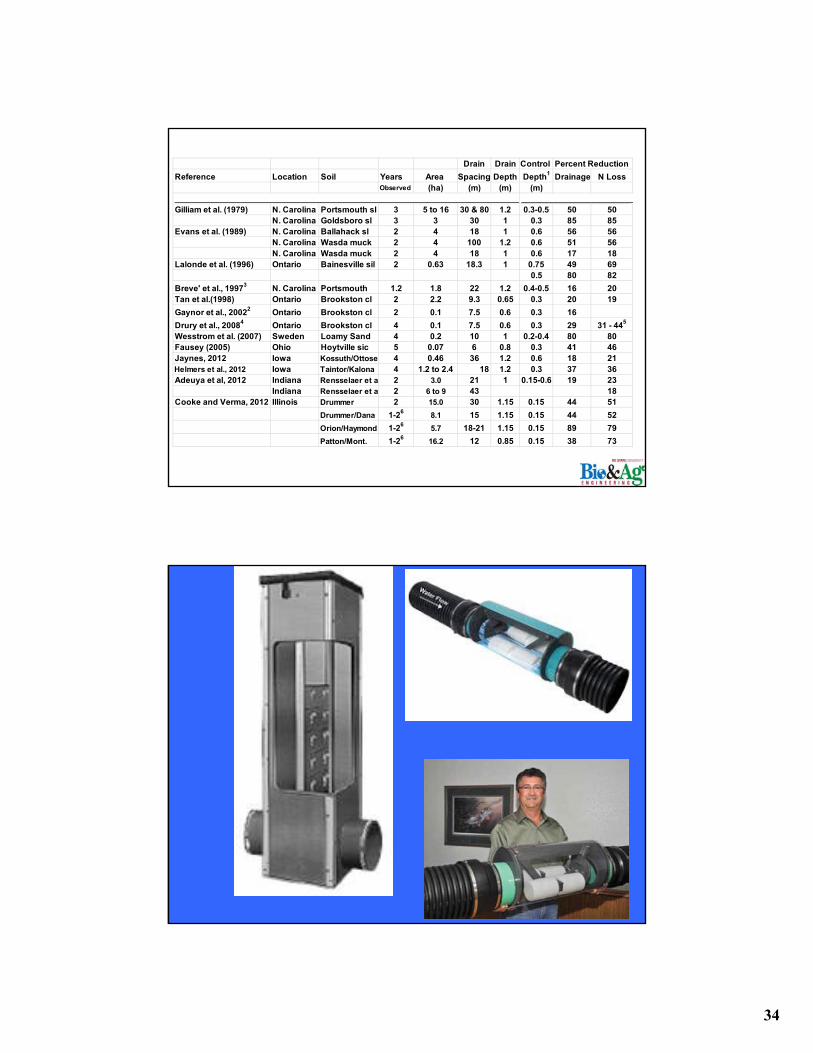
Drain Drain Control Percent Reduction
Reference Location Soil Years Area Spacing Depth Depth1 Drainage N LossObserved (ha) (m) (m) (m)
__________________________________________________________________________________________________Gilliam et al. (1979) N. Carolina Portsmouth sl 3 5 to 16 30 & 80 1.2 0.3-0.5 50 50
N. Carolina Goldsboro sl 3 3 30 1 0.3 85 85Evans et al. (1989) N. Carolina Ballahack sl 2 4 18 1 0.6 56 56
N. Carolina Wasda muck 2 4 100 1.2 0.6 51 56N. Carolina Wasda muck 2 4 18 1 0.6 17 18
Lalonde et al. (1996) Ontario Bainesville sil 2 0.63 18.3 1 0.75 49 690.5 80 82
Breve' et al., 19973 N. Carolina Portsmouth 1.2 1.8 22 1.2 0.4-0.5 16 20Tan et al.(1998) Ontario Brookston cl 2 2.2 9.3 0.65 0.3 20 19
Gaynor et al., 20022 Ontario Brookston cl 2 0.1 7.5 0.6 0.3 16
Drury et al., 20084 Ontario Brookston cl 4 0.1 7.5 0.6 0.3 29 31 - 445
Wesstrom et al. (2007) Sweden Loamy Sand 4 0.2 10 1 0.2-0.4 80 80Fausey (2005) Ohio Hoytville sic 5 0.07 6 0.8 0.3 41 46Jaynes, 2012 Iowa Kossuth/Ottose 4 0.46 36 1.2 0.6 18 21Helmers et al., 2012 Iowa Taintor/Kalona 4 1.2 to 2.4 18 1.2 0.3 37 36Adeuya et al, 2012 Indiana Rensselaer et a 2 3.0 21 1 0.15-0.6 19 23
Indiana Rensselaer et a 2 6 to 9 43 18Cooke and Verma, 2012 Illinois Drummer 2 15.0 30 1.15 0.15 44 51
Drummer/Dana 1-26 8.1 15 1.15 0.15 44 52
Orion/Haymond 1-26 5.7 18-21 1.15 0.15 89 79
Patton/Mont. 1-2616.2 12 0.85 0.15 38 73
35
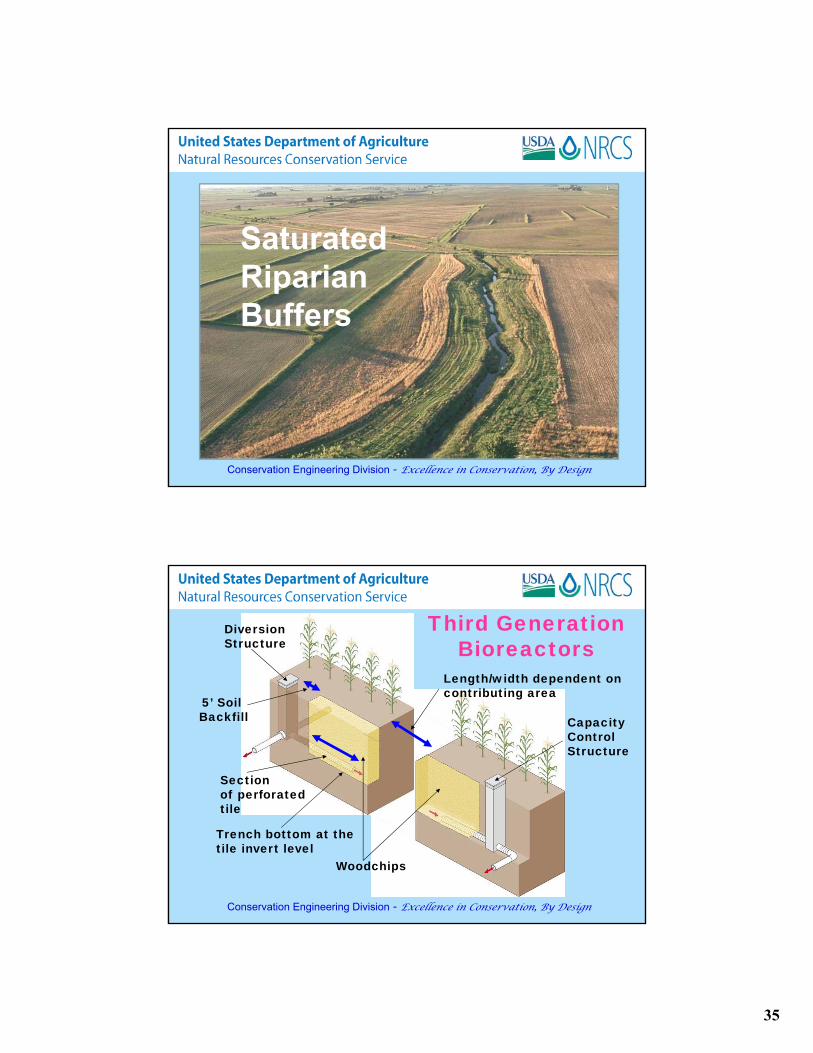
Conservation Engineering Division - Excellence in Conservation, By Design
Saturated RiparianBuffers
Conservation Engineering Division - Excellence in Conservation, By Design
CapacityControlStructure
5’ Soil Backfill
Woodchips
Trench bottom at thetile invert level
Length/width dependent on contributing area
DiversionStructure
Third Generation Bioreactors
Section of perforated tile
36
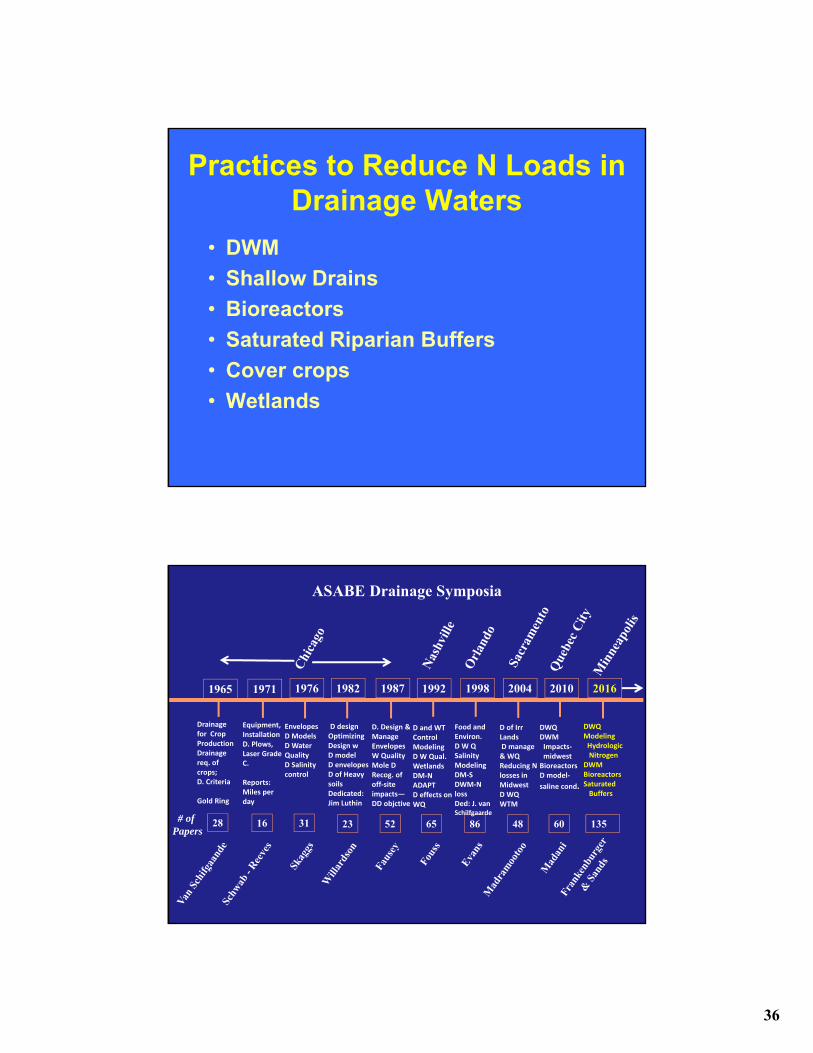
Practices to Reduce N Loads in Drainage Waters
• DWM
• Shallow Drains
• Bioreactors
• Saturated Riparian Buffers
• Cover crops
• Wetlands
ASABE Drainage Symposia
1965 1971 1976 1982 1987 1992 1998 2004 2010 2016
# of Papers
Drainage for Crop ProductionDrainage req. of crops; D. Criteria
Gold Ring
28 16 31 23 52 65 86 48 60
Equipment, Installation D. Plows, Laser Grade C.
Reports:Miles per day
EnvelopesD ModelsD Water QualityD Salinity control
D. Design & ManageEnvelopesW QualityMole DRecog. of off‐site impacts—DD objctive
Food and Environ.D W Q SalinityModelingDM‐SDWM‐N lossDed: J. van Schilfgaarde
DWQDWMImpacts‐midwestBioreactorsD model‐
saline cond.
D designOptimizing Design wD modelD envelopesD of Heavy soils Dedicated: Jim Luthin
D and WT ControlModelingD W Qual. WetlandsDM‐NADAPTD effects on WQ
D of Irr LandsD manage & WQReducing N losses in MidwestD WQWTM
DWQModelingHydrologicNitrogen
DWMBioreactorsSaturatedBuffers
135
37
Progress
Tremendous Improvement in Drainage Theory and TechnologyAchieved goals drainage researchers have sought for 100 years
• Can describe quantitatively the performance of drainage systems
• Determine effect of drainage design on yields and profits
• Quantify effect of design and operation on N losses and have developed practices to reduce those losses
• Orders of magnitude improvement in drainage installation methods and materials
• New devices to manage drainage rates with real potential for remote control and data acquisition
• Our understanding of impacts, benefits and costs of drainage is much improved, but still incomplete.
• Many challenges remain and new ones will be identified with time.
Tenth International Drainage Symposium
• Modeling
– Hydrology (2 Sessions)
– Nitrogen
– Phosphorus and Sediment
– Hydrology, Water Quality and Vegetative Growth
• Water Quality and Drainage at Large Scales
• Impacts of In-Field Practices on Drainage Water Quality
• Performance of Drainage Water Management
• Hydrology-Field to Watershed Scale
• Crop and Water Response to Drainage
• Drainage Infrastructure and Planning
• Bioreactors (2 sessions)
• Water Quality Monitoring
• Drainage Administration at State, Watershed, and County Levels
• Drainage Policy and Management (2 sessions)
• Wetlands and Saturated Buffers
• Salinity and Irrigation Issues
• Posters on wide variety of issues

38
END
Future of Drainage Research
Requires Predictions
“It is hard to predict, especially about the future”
Yogi Berra
39
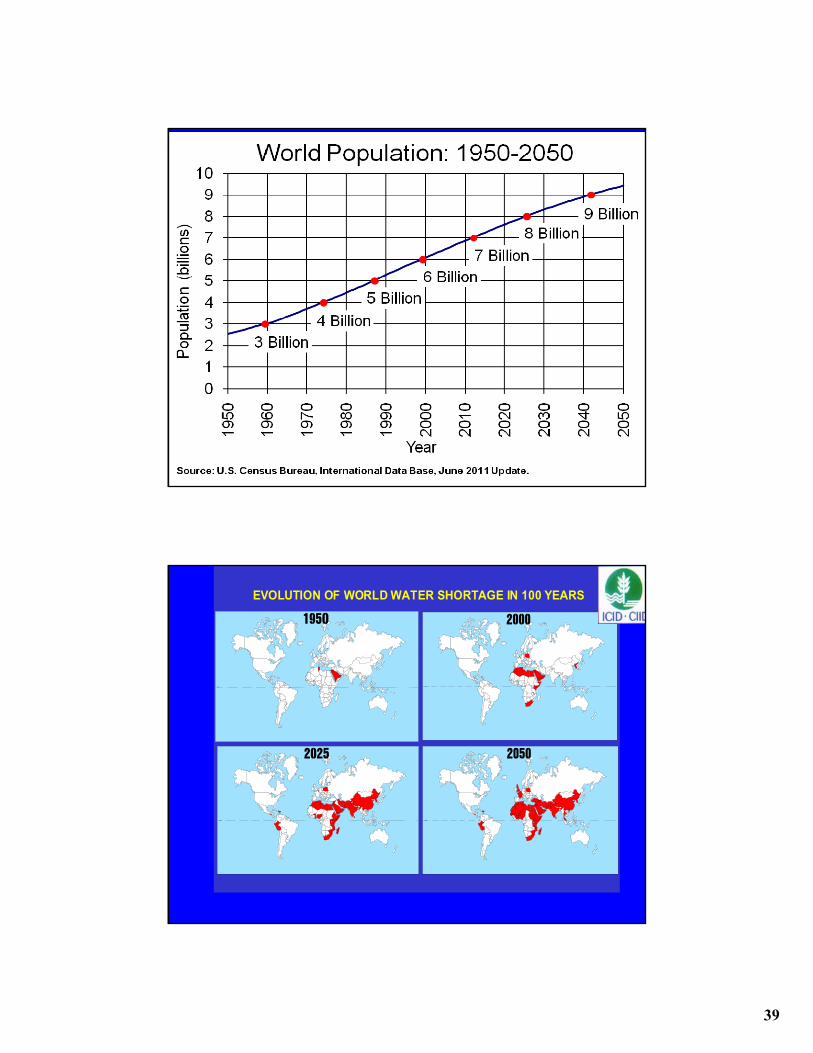
EVOLUTION OF WORLD WATER SHORTAGE IN 100 YEARS
40

41
Installation of Water Level Control Device
Installation Complete

42