draw the core label if you’re able annotate if you’re great stephen taylor draw the core1
TRANSCRIPT

Draw the CoreLabel if you’re able
Annotate if you’re great
Stephen Taylor
http://sciencevideos.wordpress.com Draw the Core 1

Draw the Core
http://sciencevideos.wordpress.com Draw the Core 2
This presentation is for practice with assessment statements where you need to draw, label, annotate or where a diagram would be very helpful to describe, outline or identify.
One slide has the assessment statement. The next has the diagram and the last has the diagram with labels.
How could you use it in your revision?
• QuickDraw flashcards – can you draw the item in the statement? • Labeling practice – can you add the correct labels? • Explain, outline, annotate, describe practice. Take the diagram or
image and use it to help in your treatment of objective 2 and 3 assessment statements.
This is a work in progress – but you might find it useful. It will be updated later.
The diagrams in the presentation are all creative commons (unless otherwise noted), which means you can share, edit and print them, as long as you cite the source as http://sciencevideos.wordpress.com.
Remember:It’s an exercise in
clarity, not a colouring-in
competition!
Assessment statements have been taken from the online IB Biology subject guide:http://xmltwo.ibo.org/publications/migrated/production-app2.ibo.org/publication/7/part/2/chapter/2.html

Drawing in IB Biology Exams
http://sciencevideos.wordpress.com Draw the Core 3
7. (a) Draw a labeled diagram showing the ultrastructure of a typical prokaryote. [4]
• You can use pencil and a ruler.• You must not use coloured pencils.
As of 2011, exams will be scanned and look like this:
This bit gets cut off
The scanning machine only looks inside the boxes, so stay inside! Use extra paper if needed, but include a note to that effect in this box. Make sure the extra paper is labeled clearly.
• Draw clearly! Not too light or messy.• Practice first on the scrap paper.

A Terrible Drawing…
http://sciencevideos.wordpress.com Draw the Core 4

A Terrible Drawing…
http://sciencevideos.wordpress.com Draw the Core 5
Too lightUnlabeled
Messy
Tiny

A Rubbish Drawing…
http://sciencevideos.wordpress.com Draw the Core 6
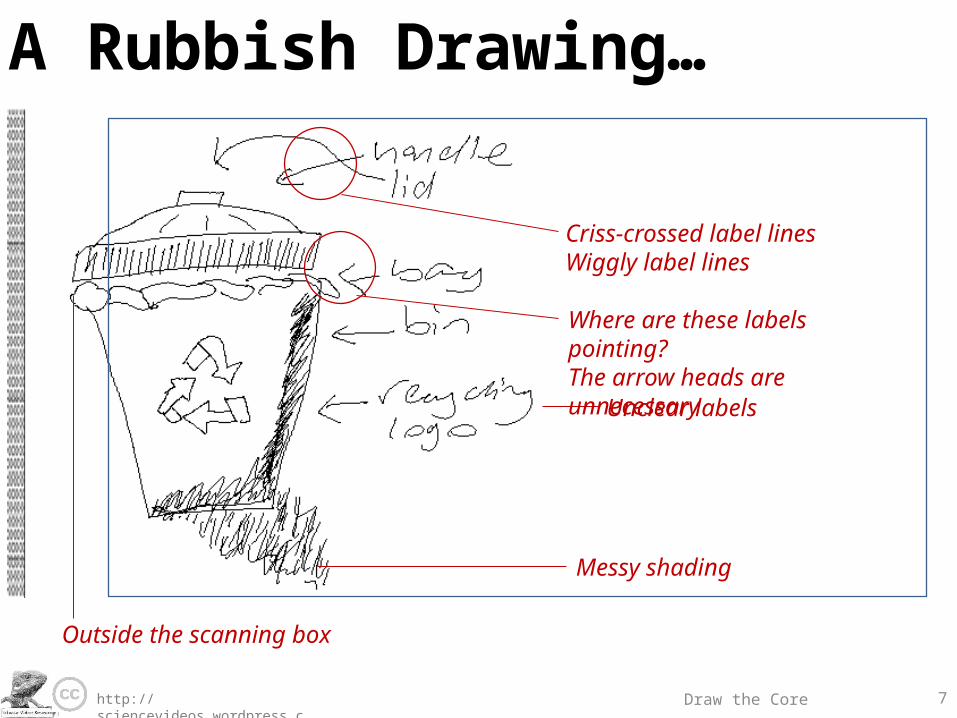
A Rubbish Drawing…
http://sciencevideos.wordpress.com Draw the Core 7
Where are these labels pointing?The arrow heads are unnecessary
Unclear labels
Outside the scanning box
Messy shading
Criss-crossed label linesWiggly label lines

A Good Drawing…
http://sciencevideos.wordpress.com Draw the Core 8

A Good Drawing…
http://sciencevideos.wordpress.com Draw the Core 9
• Good use of space• Clear strong lines• Label lines are straight• Labels clearly written• Scale bar if appropriate
• Lines touch the labeled structure
• No unnecessary shading or colouring

http://sciencevideos.wordpress.com Draw the Core 10
2.2.1 Draw and label a diagram of the ultrastructure of Escherichia coli (E. coli) as an example of a prokaryote.
All assessment statements taken from the online IB Biology subject guide:http://xmltwo.ibo.org/publications/migrated/production-app2.ibo.org/publication/7/part/2/chapter/2.html

http://sciencevideos.wordpress.com Draw the Core 11
2.2.1 Draw and label a diagram of the ultrastructure of Escherichia coli (E. coli) as an example of a prokaryote.
1µm

http://sciencevideos.wordpress.com Draw the Core 12
2.2.1 Draw and label a diagram of the ultrastructure of Escherichia coli (E. coli) as an example of a prokaryote.
1µm
cell wall
plasma membrane
flagellum
pili70S ribosomes
cytoplasm
nucleoid
Plasmids/ Loops of DNA

http://sciencevideos.wordpress.com Draw the Core 13
2.2.1 Draw and label a diagram of the ultrastructure of Escherichia coli (E. coli) as an example of a prokaryote. 2.2.2 Annotate the diagram from 2.3.1 with the functions of each named structure.
1µm
cell wallProtects cell, holds structure
plasma membraneControls what goes in and out of the cell
FlagellumMovement
PiliAttachment, Exchange of DNA
70S ribosomesProtein synthesis
CytoplasmContains solutes, enzymes for metabolic reactions
NucleoidContains:Plasmids/ Loops of DNAGenetic information

http://sciencevideos.wordpress.com Draw the Core 14
2.3.1 Draw and label a diagram of the ultrastructure of a liver cell as an example of an animal cell.
http://sciencevideos.wordpress.com Draw the Core 15
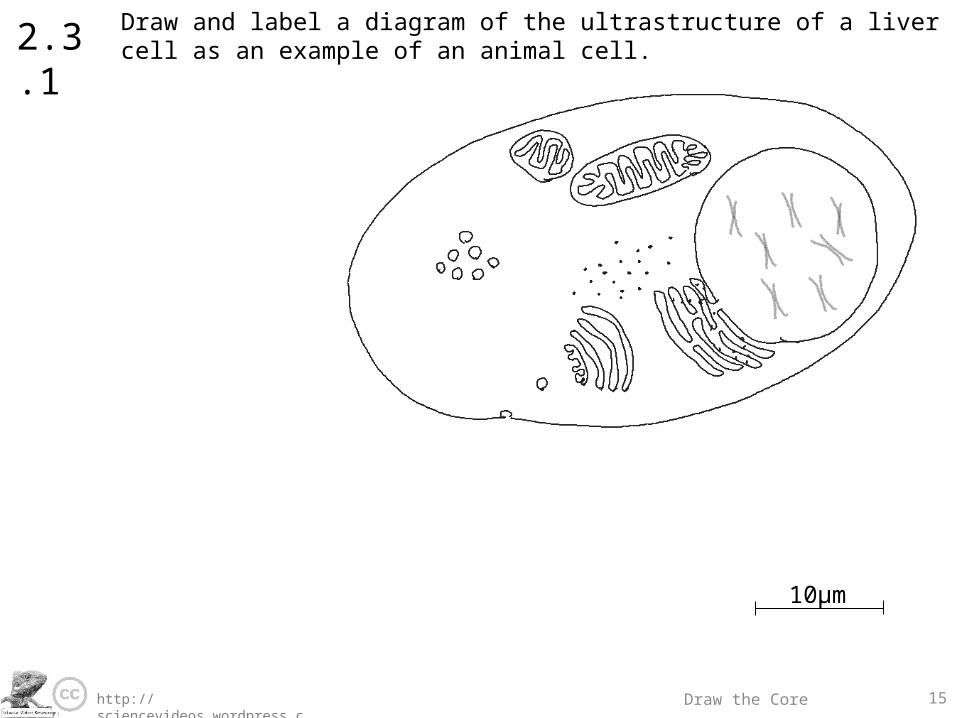
2.3.1 Draw and label a diagram of the ultrastructure of a liver cell as an example of an animal cell.
10µm

http://sciencevideos.wordpress.com Draw the Core 16
2.3.1 Draw and label a diagram of the ultrastructure of a liver cell as an example of an animal cell.
10µm
Plasma membrane
Mitochondria
Free 80S ribosomes
Lysosomes
Cytoplasm
Golgi apparatus Rough Endoplasmic Reticulum
Nucleus

http://sciencevideos.wordpress.com Draw the Core 17
2.3.1 Draw and label a diagram of the ultrastructure of a liver cell as an example of an animal cell. 2.3.2 Annotate the diagram from 2.3.1 with the functions of each named structure.
10µm
Plasma membrane Controls what enters and leaves the cell
MitochondriaCell respiration
Free 80S ribosomesProtein synthesis for use within the cell
LysosomesContain enzymes for intracellular digestion
CytoplasmSolutes and enzymes for metabolic pathways
Golgi apparatusModifies and packages proteins for export
from the cell. Produces vesicles for exocytosis
Rough Endoplasmic ReticulumAttached 80S ribosomes produce proteins for export from the cell
NucleusContains DNA in the form of chromosomes

http://sciencevideos.wordpress.com Draw the Core 18
2.5.4 Describe the events that occur in the four phases of mitosis (prophase, metaphase, anaphase and telophase). Try drawing this with a cell of n=2.

http://sciencevideos.wordpress.com Draw the Core 19
2.5.4 Describe the events that occur in the four phases of mitosis (prophase, metaphase, anaphase and telophase). Try drawing this with a cell of n=2.

http://sciencevideos.wordpress.com Draw the Core 20
2.4.1 Draw and label a diagram to show the structure of membranes.

http://sciencevideos.wordpress.com Draw the Core 21
3.1.4 Draw and label a diagram showing the structure of water molecules to show their polarity and hydrogen bond formation.

http://sciencevideos.wordpress.com Draw the Core 22
3.1.4 Draw and label a diagram showing the structure of water molecules to show their polarity and hydrogen bond formation.
Large oxygen atom pulls shared electrons closer to it, becoming slightly negative.
Therefore hydrogen atoms become slightly positive.
Covalent bond: shared electrons

http://sciencevideos.wordpress.com Draw the Core 23
3.1.4 Draw and label a diagram showing the structure of water molecules to show their polarity and hydrogen bond formation.
Large oxygen atom pulls shared electrons closer to it, becoming slightly negative.
Therefore hydrogen atoms become slightly positive.
Covalent bond: shared electrons
Hydrogen bonds form between the slightly positive hydrogens of one water molecule and the
slightly negative oxygens of the next.

http://sciencevideos.wordpress.com Draw the Core 24
3.2.2 Identify amino acids, glucose, ribose and fatty acids from diagrams showing their structure.

http://sciencevideos.wordpress.com Draw the Core 25
Diagrams taken from the online IB Biology subject guide:http://xmltwo.ibo.org/publications/migrated/production-app2.ibo.org/publication/7/part/2/chapter/4/page/3.html
3.3.1 Outline DNA nucleotide structure in terms of sugar (deoxyribose), baseand phosphate.
Phosphate ion
Deoxyribose sugar
Nitrogenous base:• Adenine• Thymine• Guanine• Cytosine

http://sciencevideos.wordpress.com Draw the Core 26
3.3.3 Outline how DNA nucleotides are linked together by covalent bondsinto a single strand.
Diagrams taken from the online IB Biology subject guide:http://xmltwo.ibo.org/publications/migrated/production-app2.ibo.org/publication/7/part/2/chapter/4/page/3.html
Phosphate ion
Deoxyribose sugar
Nitrogenous base:• Adenine• Thymine• Guanine• Cytosine
1
23
4
5
Covalent bond between C3 of one molecule and the phosphate of the next
Covalent bond between C3 of one molecule and the phosphate of the next. New nucleotides are added to the C3 each time.

http://sciencevideos.wordpress.com Draw the Core 27
3.3.5 Draw and label a simple diagram of the molecular structure of DNA.
Diagrams taken from the online IB Biology subject guide:http://xmltwo.ibo.org/publications/migrated/production-app2.ibo.org/publication/7/part/2/chapter/4/page/3.html
Deoxyribose sugar
1
23
4
5
Covalent bond
Phosphate ion
Antiparallel strands
adenine thymine
guanine cytosine
Hydrogen bonds between complementary base pairs
(A&T; G&C)
http://sciencevideos.wordpress.com Draw the Core 28
3.8.4 Outline the differences in absorption of red, blue and green light by chlorophyll.

http://sciencevideos.wordpress.com Draw the Core 29
3.8.4 Outline the differences in absorption of red, blue and green light by chlorophyll.

http://sciencevideos.wordpress.com Draw the Core 30
3.8.8 Outline the effects of temperature, light intensity and carbon dioxide concentration on the rate of photosynthesis. The shape of the graphs is required.

http://sciencevideos.wordpress.com Draw the Core 31
3.8.8 Outline the effects of temperature, light intensity and carbon dioxide concentration on the rate of photosynthesis. The shape of the graphs is required.
TemperatureAt low temperature:Increase in temperature increases rate of reaction. At high temperature:Increase in temp. leads to sharp decline in rate as enzymes are denatured.
Rate
of r
eacti
on
Rate
of r
eacti
on
Rate
of r
eacti
on
Light intensityAt low light intensity:Increase in light intensity increases rate of reaction. At high light intensity:Increase in light intensity has no effect on rate of reaction – plateau.
CO2 concentrationAt low [CO2] :Increase in [CO2] increases rate of reaction. At high [CO2] :Increase in [CO2] has no effect on rate of reaction – plateau as all active sites are filled.

http://sciencevideos.wordpress.com Draw the Core 32
4.2.3Outline the process of meiosis, including pairing of homologous chromosomes and crossing over, followed by two divisions, which results in four haploid cells. Try drawing this with a cell of n=2.

http://sciencevideos.wordpress.com Draw the Core 33
4.2.3Outline the process of meiosis, including pairing of homologous chromosomes and crossing over, followed by two divisions, which results in four haploid cells. Try drawing this with a cell of n=2.

http://sciencevideos.wordpress.com Draw the Core 34
5.1.4 Describe what is meant by a food chain, giving three examples, each with at least three linkages (four organisms).

http://sciencevideos.wordpress.com Draw the Core 35
5.1.4 Describe what is meant by a food chain, giving three examples, each with at least three linkages (four organisms).
Food chains show the flow of energy through the trophic levels of a feeding relationship. PRODUCER PRIMARY CONSUMER SECONDARY CONSUMER TERTIARY CONSUMER
“eaten by”
Yellow iris moth caterpillar great tit sparrowhawk
Phytoplankton krill cod seal
diatoms freshwater shrimp bream osprey
http://sciencevideos.wordpress.com Draw the Core 36
5.1.8 Construct a food web containing up to 10 organisms, using appropriate information.

http://sciencevideos.wordpress.com Draw the Core 37
5.1.8 Construct a food web containing up to 10 organisms, using appropriate information.
Arrows show flow of energy. Some species can be classified in two or more trophic levels, e.g. marine omnivores

http://sciencevideos.wordpress.com Draw the Core 38
5.2.1 Draw and label a diagram of the carbon cycle to show the processes involved.

http://sciencevideos.wordpress.com Draw the Core 39
5.2.1 Draw and label a diagram of the carbon cycle to show the processes involved.

http://sciencevideos.wordpress.com Draw the Core 40
5.3.1 Outline how population size is affected by natality, immigration, mortality and emigration.

http://sciencevideos.wordpress.com Draw the Core 41
5.3.1 Outline how population size is affected by natality, immigration, mortality and emigration.

http://sciencevideos.wordpress.com Draw the Core 42
5.3.3 Draw and label a graph showing a sigmoid (S-shaped) population growth curve.

http://sciencevideos.wordpress.com Draw the Core 43
5.3.3 Draw and label a graph showing a sigmoid (S-shaped) population growth curve.
time
popu
latio
n
K
Transition phase
Exponential phase
Plateau phase

http://sciencevideos.wordpress.com Draw the Core 44
5.3.3 Draw and label a graph showing a sigmoid (S-shaped) population growth curve.5.3.4 Explain the exponential, transition and plateau phases.
time
popu
latio
n
K
Transition phaseI + N > E + M (but less so)
Increased competition as space and resources are used up. Rate
of population growth slows.
Exponential phase
I + N > E + M Abundant space and resources. Very little competition so reproduction is high.
Plateau phaseI + N = E + M High competition as space and resources are limited. High effect of natural selection.

http://sciencevideos.wordpress.com Draw the Core 45
6.1.4 Draw and label a diagram of the digestive system.

http://sciencevideos.wordpress.com Draw the Core 46
6.1.4 Draw and label a diagram of the digestive system.
mouth
esophagus
stomach
small intestine
large intestine
rectum
liver
gall bladder
pancreas
anus
http://sciencevideos.wordpress.com Draw the Core 47
6.1.7 Explain how the structure of the villus is related to its role in absorption and transport of the products of digestion.

http://sciencevideos.wordpress.com Draw the Core 48
6.1.7 Explain how the structure of the villus is related to its role in absorption and transport of the products of digestion.

http://sciencevideos.wordpress.com Draw the Core 49
6.1.7 Explain how the structure of the villus is related to its role in absorption and transport of the products of digestion.
Single-cell epitheliumShort diffusion path for digested
moleculesLacteals
Absorption and transport of lipid molecules
Rich network of capillariesTransport of molecules. Maintains
high concentration gradient between lumen of gut and blood.
MitochondriaActive transport of
digested food molecules
MicrovilliFurther increase in SA:Vol ratio

http://sciencevideos.wordpress.com Draw the Core 50
6.2.1 Draw and label a diagram of the heart showing the four chambers, associated blood vessels, valves and the route of blood through the heart.

http://sciencevideos.wordpress.com Draw the Core 51
6.2.1 Draw and label a diagram of the heart showing the four chambers, associated blood vessels, valves and the route of blood through the heart.

http://sciencevideos.wordpress.com Draw the Core 52
6.2.5 Explain the relationship between the structure and function of arteries, capillaries and veins.

http://sciencevideos.wordpress.com Draw the Core 53
6.2.5 Explain the relationship between the structure and function of arteries, capillaries and veins.

http://sciencevideos.wordpress.com Draw the Core 54
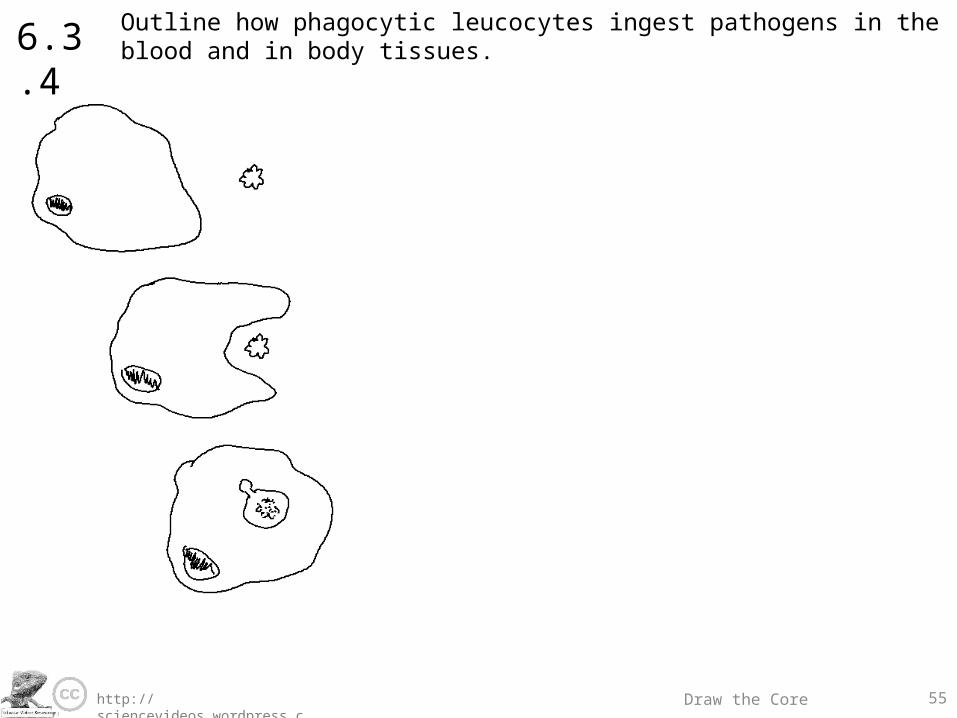
6.3.4 Outline how phagocytic leucocytes ingest pathogens in the blood and in body tissues.
http://sciencevideos.wordpress.com Draw the Core 55
6.3.4 Outline how phagocytic leucocytes ingest pathogens in the blood and in body tissues.

http://sciencevideos.wordpress.com Draw the Core 56
6.4.3 Describe the features of alveoli that adapt them to gas exchange.

http://sciencevideos.wordpress.com Draw the Core 57
6.4.3 Describe the features of alveoli that adapt them to gas exchange.

http://sciencevideos.wordpress.com Draw the Core 58
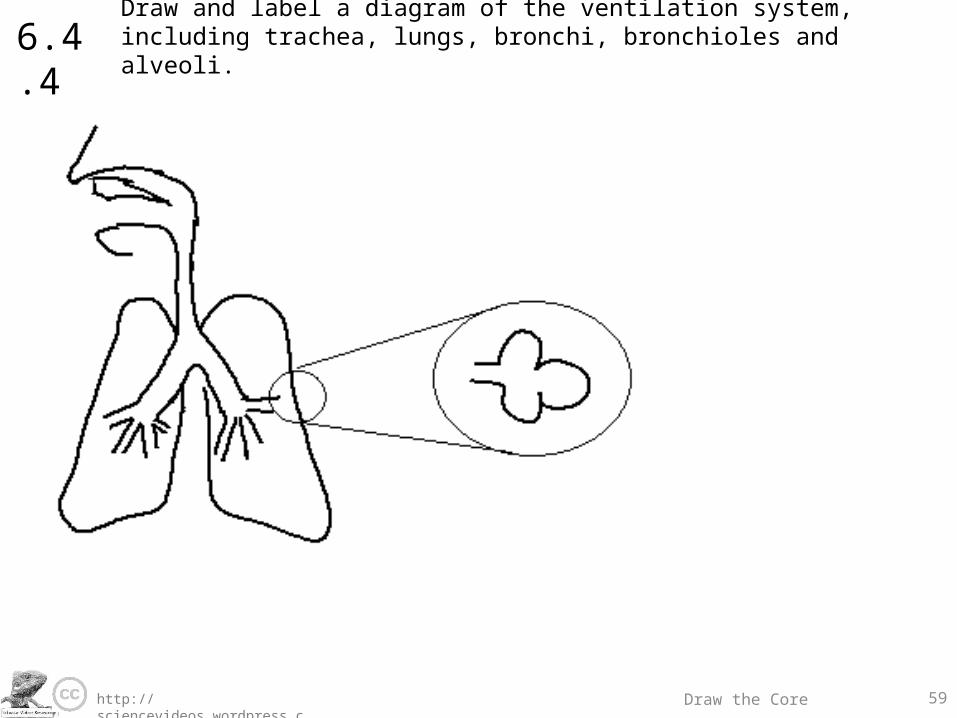
6.4.4 Draw and label a diagram of the ventilation system, including trachea, lungs, bronchi, bronchioles and alveoli.
http://sciencevideos.wordpress.com Draw the Core 59
6.4.4 Draw and label a diagram of the ventilation system, including trachea, lungs, bronchi, bronchioles and alveoli.

http://sciencevideos.wordpress.com Draw the Core 60
6.5.2 Draw and label a diagram of the structure of a motor neuron.

http://sciencevideos.wordpress.com Draw the Core 61
6.5.2 Draw and label a diagram of the structure of a motor neuron.

http://sciencevideos.wordpress.com Draw the Core 62
6.5.2 Draw and label a diagram of the structure of a motor neuron.
Dendritic end terminal end
dendrites
axon
axon hillock
cell body
nucleusmyelin sheath
Nodes of Ranviermotor end plates
muscle tissue

http://sciencevideos.wordpress.com Draw the Core 63
6.6.1 Draw and label diagrams of the adult male reproductive system.

http://sciencevideos.wordpress.com Draw the Core 64
6.6.1 Draw and label diagrams of the adult male reproductive system.

http://sciencevideos.wordpress.com Draw the Core 65
6.6.1 Draw and label diagrams of the adult male reproductive system.
sperm duct
bladder
semen gland
prostate gland
urethra
epididymispenis
testis

http://sciencevideos.wordpress.com Draw the Core 66
6.6.1 Draw and label diagrams of the adult female reproductive system.

http://sciencevideos.wordpress.com Draw the Core 67
6.6.1 Draw and label diagrams of the adult female reproductive system.

http://sciencevideos.wordpress.com Draw the Core 68
6.6.1 Draw and label diagrams of the adult female reproductive system.
vagina
cervixmuscle wallendometrium
uterusovary
Oviduct/ Fallopian tube
bladder
urethra

http://sciencevideos.wordpress.com Draw the Core 69
6.6.3 Annotate a graph showing hormone levels in the menstrual cycle, illustrating the relationship between changes in hormone levels and ovulation, menstruation and thickening of the endometrium.

http://sciencevideos.wordpress.com Draw the Core 70
6.6.3 Annotate a graph showing hormone levels in the menstrual cycle, illustrating the relationship between changes in hormone levels and ovulation, menstruation and thickening of the endometrium.
Day 0 5 14 28

http://sciencevideos.wordpress.com Draw the Core 71
6.6.3 Annotate a graph showing hormone levels in the menstrual cycle, illustrating the relationship between changes in hormone levels and ovulation, menstruation and thickening of the endometrium.
Day 0 5 14 28
Day 0-5 Endometrium is broken down (menstruation) as progesterone falls.Day 5-14 Estrogen rises, endometrium builds.
Day 14-28 Endometrium maintained by high progesterone levels to prepare for fertilisation.
endometrium
Day 0-14 FSH and LH stimulate development of the oocyte (egg) in the ovary.
Day 14 peak of LH causes ovulation.
Day 15-28 FSH and LH inhibited by estrogen and progesterone, preventing further release of eggs.
Day 0-14 estrogen increases, building the endometrium.
Day 14-18 estrogen drops, progesterone peaks, maintaining endometrium and inhibiting FSH and LH.
Day 28 Progesterone drops if the egg is not fertilised and does not implant onto endometrium.
Luteinising hormone (LH)
Follicle stimulating hormone (FSH)
estrogenprogesterone

For more IB Biology resources:http://sciencevideos.wordpress.com
Draw the Core 72This is a Creative Commons presentation. It may be linked and embedded but not sold or re-hosted.
This presentation is free to view. Please make a donation to one of my chosen charities at Gifts4Good and I will send you the editable pptx file.
Click here for more information about Biology4Good charity donations.