drg payment method options - fl agency for health care ... · fl ahca drg project: drg payment...
TRANSCRIPT

DRG Payment Method Options
Prepared for:
Florida Agency for Health Care Administration
August 24, 2012
Draft and For Discussion Purposes Only
navigant.com/healthcare

FL AHCA DRG Project: DRG Payment Method Options – August 24, 2012 Page 2
Submitted to the Florida Agency for Health Care Administration Draft for discussion purposes
Table of Contents Introduction ................................................................................................................................................ 5
1 Evaluating a DRG Payment Method ................................................................................................ 5
2 Basics of a DRG Payment Method .................................................................................................... 8
2.1 DRG Codes and Weights .......................................................................................................... 8
2.2 Summary of the DRG Pricing Formulas ................................................................................. 9
2.3 Basic DRG Pricing Calculation ................................................................................................. 9
2.4 Policy Adjustors ....................................................................................................................... 10
2.5 Adjustments to DRG Base Payment ...................................................................................... 11
2.5.1 Transfer Claims .................................................................................................................... 11
2.5.2 Partial Eligibility ................................................................................................................... 11
2.6 Outlier Payments ..................................................................................................................... 12
2.7 DRG Price versus Final Reimbursement .............................................................................. 13
2.8 Non‐DRG Paid Claims ............................................................................................................ 13
3 Scope of DRG Payment Method ..................................................................................................... 14
3.1 Affected Providers ................................................................................................................... 14
3.1.1 Affected Providers ‐ Discussion ......................................................................................... 14
3.1.2 Affected Providers ‐ Recommendation ............................................................................. 15
3.2 Affected Services ...................................................................................................................... 16
3.2.1 Affected Services ‐ Discussion ............................................................................................ 16
3.2.2 Affected Services ‐ Recommendation ................................................................................ 17
3.3 Affected Beneficiaries / Medicaid Programs ........................................................................ 19
3.3.1 Affected Beneficiaries / Medicaid Programs ‐ Discussion .............................................. 19
3.3.2 Affected Beneficiaries / Medicaid Programs ‐ Recommendation .................................. 20
3.4 Prior Authorization Changes ................................................................................................. 20
3.4.1 Prior Authorization Changes ‐ Discussion ....................................................................... 20
3.4.2 Prior Authorization Changes ‐ Recommendation ........................................................... 21
4 Cost Estimation ................................................................................................................................. 22
4.1 Cost Estimation ‐ Discussion .................................................................................................. 22
4.2 Cost Estimation ‐ Recommendation ...................................................................................... 23
5 DRG Grouping .................................................................................................................................. 25

FL AHCA DRG Project: DRG Payment Method Options – August 24, 2012 Page 3
Submitted to the Florida Agency for Health Care Administration Draft for discussion purposes
5.1 DRG Grouper ............................................................................................................................ 25
5.1.1 DRG Grouper ‐ Discussion ................................................................................................. 25
5.1.2 DRG Grouping ‐ Recommendation ................................................................................... 33
5.2 DRG Relative Weights ............................................................................................................. 33
5.2.1 DRG Relative Weights ‐ Discussion .................................................................................. 33
5.2.2 DRG Relative Weights ‐ Recommendation ...................................................................... 34
6 Provider Base Rates .......................................................................................................................... 35
6.1 Provider Base Rate Wage Area Adjustments ....................................................................... 35
6.1.1 Provider Base Rate Wage Area Adjustments ‐ Discussion ............................................ 35
6.1.2 Provider Base Rate Wage Area Adjustments ‐ Recommendation ................................ 36
6.2 Provider Base Rate Categories ............................................................................................... 37
6.2.1 Provider Base Rate Categories ‐ Discussion ..................................................................... 37
6.2.2 Provider Base Rate Categories ‐ Recommendation ......................................................... 37
6.3 Per Diem Base Rates ................................................................................................................ 38
6.3.1 Per Diem Base Rate ‐ Discussion ........................................................................................ 38
6.3.2 Per Diem Base Rate ‐ Recommendation ............................................................................ 38
7 Pricing Logic ...................................................................................................................................... 41
7.1 Pricing Flow .............................................................................................................................. 41
7.2 Policy Adjustors ....................................................................................................................... 41
7.2.1 Policy Adjustors ‐ Discussion ............................................................................................. 41
7.2.2 Policy Adjustors ‐ Recommendation ................................................................................. 43
7.3 Transfer Payment Adjustments ............................................................................................. 43
7.3.1 Transfer Payment Adjustments ‐ Discussion ................................................................... 43
7.3.2 Transfer Payment Adjustments ‐ Recommendation ....................................................... 44
7.4 Partial Eligibility Payment Adjustments .............................................................................. 47
7.4.1 Partial Eligibility Payment Adjustments ‐ Discussion .................................................... 47
7.4.2 Partial Eligibility Payment Adjustments ‐ Recommendation ........................................ 47
7.5 Outlier Payments ..................................................................................................................... 48
7.5.1 Outlier Payments ‐ Discussion ........................................................................................... 48
7.5.2 Outlier Payments ‐ Recommendation ............................................................................... 50
7.6 Per Claim Add‐On Payments ................................................................................................. 51
7.6.1 Per Claim Add‐On Payments ‐ Discussion ...................................................................... 51

FL AHCA DRG Project: DRG Payment Method Options – August 24, 2012 Page 4
Submitted to the Florida Agency for Health Care Administration Draft for discussion purposes
7.6.2 Per Claim Add‐On Payments ‐ Recommendation .......................................................... 51
7.7 Transitional Period ................................................................................................................... 51
7.7.1 Transitional Period ‐ Discussion ........................................................................................ 51
7.7.2 Transitional Period ‐ Recommendation ............................................................................ 53
7.8 Documentation and Coding Adjustment ............................................................................. 54
7.8.1 Documentation and Coding Adjustment ‐ Discussion ................................................... 54
7.8.2 Documentation and Coding Adjustment – Recommendation ...................................... 56
7.9 Interim Claims and Late Charges .......................................................................................... 56
7.9.1 Interim Claims and Late Charges – Discussion ............................................................... 56
7.9.2 Interim Claims and Late Charges – Recommendation ................................................... 57
7.10 Charge Cap ............................................................................................................................... 57
7.10.1 Charge Cap – Discussion ................................................................................................ 57
7.10.2 Charge Cap – Recommendation .................................................................................... 58
7.11 Medicare Crossover Comparison Pricing ............................................................................. 58
7.11.1 Medicare Crossover Comparison Pricing – Discussion .............................................. 58
7.11.2 Medicare Crossover Comparison Pricing – Recommendation .................................. 58
8 Specifics for Florida Medicaid ........................................................................................................ 58
8.1 Budget Neutrality .................................................................................................................... 58
8.2 Interaction of DRG Payment and IGT Funding ................................................................... 59
8.3 Interaction of DRG Payment and IGT Funding ................................................................... 59
8.4 Recipient Out of Pocket Expenses ......................................................................................... 60
8.5 45‐Day Benefit Limit ................................................................................................................ 60
8.5 Effect of Transition to Managed Care ................................................................................... 60
8.6 County Billing ........................................................................................................................... 60
Conclusion ................................................................................................................................................ 61
Appendix A – Summary DRG Payment Method Options ................................................................. 62
Appendix B ‐ Sample State Medicaid DRG Implementations ........................................................... 71

FL AHCA DRG Project: DRG Payment Method Options – August 24, 2012 Page 5
Submitted to the Florida Agency for Health Care Administration Draft for discussion purposes
Introduction
This document describes the components of a DRG pricing methodology and the decision
points that must be made during the design of a DRG pricing implementation. The intent in
this document is to include a comprehensive list of options available to customize a DRG
pricing method considering the experience of other state Medicaid agencies and Medicare. The
Florida Agency for Health Care Administration (AHCA) DRG project team will not necessarily
choose to implement all these options, but can select from this list those components that best
meet the agency’s goals. In addition, as the project progresses, other ideas for customization of
AHCA’s implementation of DRGs may arise.
The first two chapters of the document provide background on DRG pricing that will be helpful
in evaluating the various pricing design considerations. Chapter 1 lists a series of criteria
helpful in evaluating a payment method and describes some of the areas in which options in a
DRG pricing method affect the criteria. Chapter 2 describes the components of the actual
pricing calculation under a DRG pricing methodology, including a few optional components,
such as policy adjustors. The remaining sections of the document describe each option of the
overall DRG payment policy in detail, including discussion and recommendation for each
option. In this version of the document, the recommendations are filled in based on qualitative
review of the payment options with consideration of the guiding principles described in
Chapter 1. As payment simulations are performed, the options will be reviewed in more detail
and may be modified prior to finalization. As such, the recommendations contained herein
should be considered preliminary. Finally two appendices are provided. Appendix A is a table
summarizing all of the DRG payment method options described in this report. Appendix B
includes examples of the options selected by a half dozen states that either have implemented or
are in the process of implementing a new DRG payment method. States included in the matrix
are California, New York, Texas, Virginia, Pennsylvania and Illinois.
1 Evaluating a DRG Payment Method
Developing a Medicaid payment method requires balancing a variety of trade‐offs and
competing priorities. Payment methods have an impact on beneficiaries, medical providers,
taxpayers, and program administrators, each with their own point of view on what makes a
payment method successful. To balance the priorities of these different stakeholders, it is
helpful to establish a set of guiding principles that describe the goals of the payment method
and offer a structure against which various system design options can be evaluated. The list
below offers a series of guiding principles and discusses how these principles can affect a DRG
payment method.
» Efficiency. A payment method should be consistent with promoting hospital efficiency,
rewarding hospitals that increase efficiency while continuing to provide quality care. To
enable this, the payment method should minimize reliance on individual hospital
charges or costs, and create opportunities for providers to increase margins by more
effectively managing resources. For example, in the design of a DRG payment system,

FL AHCA DRG Project: DRG Payment Method Options – August 24, 2012 Page 6
Submitted to the Florida Agency for Health Care Administration Draft for discussion purposes
selecting a single standardized base rate can create incentives for hospitals to better
manage their resources to achieve improved margins. Conversely, establishing facility‐
specific base rates that fluctuate annually with increases or decreases in facility‐specific
costs would provide little incentive for cost effectiveness.
» Access. A payment method should promote beneficiary access to care. This guiding
principle is consistent with the requirements specified in federal regulation. In the State
Plan for Medical Assistance (State Plan), AHCA must make certain assurances to the
federal Centers for Medicare and Medicaid Services (CMS) with respect to its level of
payments to Medicaid providers. In particular, the State Plan must:
“… provide such methods and procedures relating to the utilization of, and the
payment for, care and services available under the plan … as may be necessary
to safeguard against unnecessary utilization of such care and services and to
assure that payments are consistent with efficiency, economy, and quality of care
and are sufficient to enlist enough providers so that care and services are
available under the plan at least to the extent that such care and services are
available to the general population in the geographic area[.]” 42 U.S.C. §
1396a(a)(30)(A) (“Section 30(A)”) (emphasis added).
Within a DRG payment method, policy adjustors, provider peer groups (used for setting
base rates), and outlier payment parameters are items that can be adjusted to affect
access to care.
» Equity. A payment method should generate fair payments both across hospitals and
across types of care. Generally, hospitals should be paid similar amounts for the same
services, with the potential exception being when there are necessary and measurable
differences in the costs associated with those similar services. Within a DRG payment
method, the bulk of the payment amount for an individual hospital stay is calculated by
multiplying a hospital base price times a DRG relative weight. The DRG relative
weights are determined using average costs from many hospitals, so the relative weights
help ensure similar payment for similar services, independent of where those services
are provided. If adjustments do need to be made for reasonable, measurable differences
in hospital cost structures, those can be made through modifications to the hospital base
price via rate adjustments (for example, wage area adjustments) and/or provider peer
groupings (for example, giving all children’s hospitals or all rural hospitals their own
provider base rate).
» Predictability. A payment method should generate stable, predictable payments. Both
the state Medicaid agency and the hospitals have to manage their budgets, and that can
best be facilitated through a payment method which generates consistent, predictable
reimbursements. DRG payment methods are predictable if patient acuity and volume
are understood.

FL AHCA DRG Project: DRG Payment Method Options – August 24, 2012 Page 7
Submitted to the Florida Agency for Health Care Administration Draft for discussion purposes
» Transparency. A payment method that is transparent promotes trust from hospital
administrators, hospital clinicians, legislators, and Medicaid program administrators. A
DRG payment method can be made transparent by selecting a DRG algorithm that is
openly documented, and by making DRG relative weights, provider base rates, and
pricing logic publicly available.
» Simplicity. A payment method that is relatively simple will be easier to implement,
easier for hospitals to understand, and easier to administer and maintain. For a
Medicaid program, implementing a new DRG payment method will require significant
MMIS changes, regulation changes, and program monitoring changes. For hospitals, a
new DRG payment method may impact medical coding practices, billing procedures,
and internal information systems. The complexity of these changes is limited if the
payment method is kept relatively simple. At the same time, over‐simplifying the
payment method may negatively impact payment equity and, in turn, negatively impact
access to care.
» Quality. It is generally known that it is a mission of all hospitals to provide high quality
care. Payment methods should be consistent with promoting quality care where
possible. In truth, very few payment methods specifically reward quality. Most
payment methods, including DRG payment methods, pay the same whether or not high
quality care is provided. At the same time, some payment components, such as outlier
payment parameters, can contribute to (or detract from) facilitating the effective use of
hospital resources in a way that is consistent with a hospital’s mission to provide high
quality care.
From a logistical point of view, a payment method is a framework or structure created to
determine reimbursement for medical services and supplies. The structure includes
organization of data, numerical formulas, and specific parameters or values used in the
formulas. This structure should be carefully developed as it controls the distribution of large
amounts of state and federal funding, and is intended to meet the needs of people and
organizations with competing priorities. The guiding principles presented above can be helpful
in evaluating various options for the payment structure so that the final design best meets the
needs of beneficiaries, providers, taxpayers and program administrators.

FL AHCA DRG Project: DRG Payment Method Options – August 24, 2012 Page 8
Submitted to the Florida Agency for Health Care Administration Draft for discussion purposes
2 Basics of a DRG Payment Method
This section describes the calculations performed when determining the price on a claim using a
DRG payment method. Ultimately, a payment method can be described as a series of
calculations. As such, this section offers a context for how decisions on the various pricing
options are applied to actually price claims. Discussions and recommendations for each
component within these calculations are provided in Chapter 7.
2.1 DRG Codes and Weights
DRG payment methods involve classifying inpatient stays and then determining a price based
on a combination of the classification and the hospital where the services were performed.
Classification of the hospital stay is based on the diagnoses describing the patient’s condition,
the surgical procedures performed (if any), patient age, and discharge status. The classifications
are labeled using codes referred to as DRG codes and the number of codes varies depending on
the selected patient classification model. For example, the MS‐DRG grouping method has 746
total codes including 335 base codes separated by severity into “no CC”, “with CC” or “with
major CC” (where “CC” stands for complications and comorbidities). Similarly, the APR‐DRG
grouping method has 1,254 codes including 314 base codes each separated into four levels of
severity, minor, moderate, major and extreme.
Each DRG code is assigned a relative weight which is intended to indicate the average relative
amount of hospital resources required to treat patients within that DRG category. These
weights are relative to the overall average amount of hospital resources needed to treat a
patient when looking across the full range of patients treated within an acute care inpatient
setting. For example, a DRG weight of 2.0 would indicate an admission that requires twice the
level of resources as an average admission, while a DRG weight of 0.5 would indicate an
admission that requires half the level of resources as an average admission.

FL AHCA DRG Project: DRG Payment Method Options – August 24, 2012 Page 9
Submitted to the Florida Agency for Health Care Administration Draft for discussion purposes
2.2 Summary of the DRG Pricing Formulas
A summary of a typical DRG pricing calculation is shown in Table 1 and the formulas are
described in more detail in the following sections.
Table 1
Typical DRG Payment Formulas
1) [Full DRG base pymt] = [Hospital base rate] * [DRG rel wt] * [Policy adjustor(s)] 5) [Estimated cost] = [Covered charge] * [Hospital cost-to-charge ratio]
2) If transfer, [per diem amt] = {[DRG base pymt] / [DRG avg LOS]} * (LOS + 1) 6) [Estimated gain/loss] = AbsVal{[Estimated cost] - [DRG base pymt]}
3) If partial elig, [per diem amt] = {[DRG base pymt] / [DRG avg LOS]} * (LOS + 1) 7) If [Estimated gain/loss] > outlier threshold then outlier payment applies
4) If transfer or partial elig, 8) If hospital loss,
[DRG base pymt] = lessor of [Full DRG base pymt] and [per diem amt] [Outlier pymt] = [Estimated gain/loss] * [Marginal cost percentage]
Else Else
[DRG base pymt] = [Full DRG base pymt] [Outlier pymt] = [Estimated gain/loss] * [Marginal cost percentage] * -1
9) [DRG allowed amount] = [DRG base pymt] + [Outlier pymt]
10) [Reimbursement amount] = [DRG allowed amount] - [Other ins pymt] - [Spend down] - [Cost sharing]
Notes:
Formulas are typical and can be modified to meet a state's specific needs.
"pymt" is an abbreviation for "payment".
"LOS" is an acronym for "length of stay".
2.3 Basic DRG Pricing Calculation
In a DRG pricing method, the vast majority of hospital stays are priced using a very simple
formula. The formula is:
[DRG Base Payment] = [Hospital base rate] * [DRG relative weight] * [Policy adjustor(s)]
Policy adjustors, which are discussed in the next section, are optional and in many cases are set
to 1.0, indicating no adjustment. If a policy adjustor of 1.0 is assumed, an example claim from a
provider with a DRG base rate of $8,000 and a DRG with relative weight of 2.0 would yield a
payment of $16,000. Similarly, an admission to the same provider that gets assigned a DRG
with relative weight of 0.5 would yield a payment of $4,000. Although this calculation is quite

FL AHCA DRG Project: DRG Payment Method Options – August 24, 2012 Page 10
Submitted to the Florida Agency for Health Care Administration Draft for discussion purposes
simple, a great deal of thought goes into development of the DRG grouping algorithm (which
determines the DRG code), assignment of relative weights to DRG codes, and assignment of
base prices to hospitals.
2.4 Policy Adjustors
Medicaid agencies can make a policy decision to increase (or decrease) payments for particular
types of hospital admissions to protect access for Medicaid beneficiaries. When increasing
payment for types of services, policy adjustors are used. There are three types of adjustors
commonly used, and should be considered as options:
Service adjustors
Age/service adjustors
Provider/service adjustors
If implementing all three options for policy adjustors, the calculation of DRG base payment
becomes:
[DRG Base Payment] = [Hospital base rate] * [DRG relative weight]
* [Service adjustor] * [Age/service adjustor]
* [Provider/service adjustor]
Policy adjustors, in general, modify payment for specific types of services, patient ages and
hospital types. Service adjustors apply for specific types of care independent of the recipient
and provider. Age/service adjustors apply only for recipients within a specific age range. Any
age range can be used, but Medicaid programs generally use this to increase payment for
pediatric care. Provider/service adjustors apply only for certain categories of providers.
For example, if a Medicaid agency decided to increase payments for neonatal care using a
service adjustor of 1.5, then the claim payment would be increased by 50 percent. In this
situation, a claim submitted from a provider with base rate $8,000 and mapping to APR‐DRG
622‐3 (Neonate birth weight 2000‐2499 grams with major respiratory condition; relative weight
= 2.9453) the DRG base payment would be calculated as follows:
[DRG Base Payment] = $8,000 * 2.9453 * 1.5 * 1.0 * 1.0
= $35,343.60
As a separate example, a Medicaid agency might decide to increase payment for pediatric care
using an age/service adjustor of 1.25. In that case, a claim submitted from a provider with base
rate $8,000, for a recipient age 10, and mapping to APR‐DRG 141‐2 (Asthma; relative weight =
0.4946) the DRG base payment would be:
[DRG Base Payment] = $8,000 * 0.4946 * 1.0 * 1.25 * 1.0

FL AHCA DRG Project: DRG Payment Method Options – August 24, 2012 Page 11
Submitted to the Florida Agency for Health Care Administration Draft for discussion purposes
= $4,946.00
A separate claim from the same hospital for a recipient age 35 (above the age adjustor cut‐off)
and mapping to the same APR‐DRG, 141‐2, would generate a DRG base payment of:
[DRG Base Payment] = $8,000 * 0.4946 * 1.0 * 1.0 * 1.0
= $3,956.80
2.5 Adjustments to DRG Base Payment
2.5.1 Transfer Claims
When processing claims for recipients transferred from one acute facility to another, most
Medicaid DRG implementations have followed the Medicare model for payment adjustments.
In this model, a payment amount is calculated using a per diem method and then compared to
the DRG base payment. If the per diem payment, referred to as a transfer‐adjusted base
payment, is less than the DRG base payment, then the transfer‐adjusted base payment is used.
Using the DRG base payment and the DRG’s average length of stay, a transfer‐adjusted
payment can be calculated as:
Transfer‐adjusted base payment = {[DRG base payment] / [DRG average length of stay]}
* {[length of stay] + 1}
Adding one to the length of stay takes into account the disproportionate amount of costs
required in the first day of admission to complete the admission process and perform an initial
diagnostic evaluation.
For example, APR‐DRG 602‐3 (neonate birth weight 1000‐1249 grams with respiratory distress
syndrome, other major respiratory anomaly or other major anomaly) has relative weight 8.3857
and average length of stay equal to 52.16 days (in version 29). If a baby with this DRG is
transferred out of a hospital after two days and the hospital’s base price is $8,000 then,
Full DRG base payment = $8,000 * 8.3857 = $67,085.60
Transfer‐adjusted base payment = (67,085.60 / 52.16) * (2 + 1) = $3,858.45
In this example, the transfer‐adjusted base payment is less and would be used in place of the
full DRG base payment.
2.5.2 Partial Eligibility
If a recipient is only eligible for Medicaid fee‐for‐service for part of a hospital stay, then a full
DRG payment may not be appropriate. A smaller payment may be acceptable as the hospital
will be getting reimbursement for part of the stay from other sources, such as a managed care
organization.

FL AHCA DRG Project: DRG Payment Method Options – August 24, 2012 Page 12
Submitted to the Florida Agency for Health Care Administration Draft for discussion purposes
Payment is determined in a partial eligibility situation very much the same way it is determined
on transfer claims – a per diem payment is calculated, compared to the full DRG base payment,
and the lower of the two is used. The calculation of eligibility‐adjusted base payment can be
exactly the same as the transfer‐adjusted base payment. That is,
Eligibility‐adjusted base payment = {[DRG base payment] / [DRG average length of stay]}
* {[length of stay] + 1}
Another option is to remove the “+ 1” from the number of days multiplier in cases where the
Medicaid fee‐for‐service eligibility did not begin until after the day of admission. In that case
the formula is,
Eligibility‐adjusted base payment = {[DRG base payment] / [DRG average length of stay]}
* [length of stay]
2.6 Outlier Payments
Inevitably, some claims will be submitted for extreme and unpredictable cases in which the
standard DRG payment differs greatly from the level of resources expended by the hospital.
For these cases, referred to as outliers, a DRG payment method can adjust payment upward to
share in hospital losses or downward to share in hospital gains. The Medicare model, also
adopted by several states, is to employ a stop‐loss threshold which generates outlier payments
whenever the hospital’s estimated loss is above a threshold. With this method, the formula for
an outlier payment adjustment is:
[Hospital loss/gain] = AbsVal{([Billed Charges] * [Cost to Charge Ratio])
‐ [DRG base payment]}
If [Hospital loss/gain] > [Outlier Threshold] Then
If hospital loss Then
[Outlier pymt adjstmnt] = {[Hospital loss/gain] – [Outlier threshold]}
* [Marginal cost %]
Else
[Outlier pymt adjstmnt] = {([Hospital loss/gain] – [Outlier threshold])
* [Marginal cost %]} * ‐1
Else
[Outlier payment adjstmnt] = 0
For example, an admission with charges of $200,000, at a hospital with cost‐to‐charge ratio
equal to 0.30 and a DRG base payment of $5,000 has a hospital loss equal to $55,000 {($200,000 *
0.3) ‐ $5,000}. If the Medicaid DRG policy included an outlier threshold of $30,000 and a
marginal cost percentage of 70% then the outlier payment would be {($55,000 ‐ $30,000) * 0.7) =
$17,500. Thus the final payment to the provider would be ($5,000 + $17,500) = $22,500.

FL AHCA DRG Project: DRG Payment Method Options – August 24, 2012 Page 13
Submitted to the Florida Agency for Health Care Administration Draft for discussion purposes
Medicare does not apply payment reductions when the hospital gain is above the threshold.
But this is an option AHCA can consider, either using the same or a different threshold amount
as used for hospital losses.
2.7 DRG Price versus Final Reimbursement
The previous sections in Chapter 2 describe how the DRG price is calculated. This is the
amount of money Medicaid is willing to pay for the services without consideration of any other
forms of payment. This price is sometimes referred to as the Medicaid allowed amount. Final
reimbursement for a claim equals the DRG price minus any other forms of payment such as
payment from another insurance carrier, recipient spend down, and patient cost sharing, such
as copays. Thus,
[Final reimbursement] = [Allowed amount] – [Other ins pymt] – [Spend down]
– [cost sharing]
2.8 Non-DRG Paid Claims
Depending on the payment policies set by the state, some acute care inpatient claims may fall
outside the DRG payment. These may be claims for services or providers carved out of the
DRG payment method, or they may be interim claims from providers for services that are
included in DRG payment. Both carved out items and interim claims are commonly paid per
diem model, although they can also be paid as a percentage of charges. Unlike carved‐out
services, the per diem for interim claims is set relatively low as it is intended to be a temporary,
partial payment. The interim claim per diem gives hospitals some reimbursement for cash flow
purposes, while still leaving the hospital incentive to submit a final claim when the recipient is
discharged.

FL AHCA DRG Project: DRG Payment Method Options – August 24, 2012 Page 14
Submitted to the Florida Agency for Health Care Administration Draft for discussion purposes
3 Scope of DRG Payment Method
3.1 Affected Providers
3.1.1 Affected Providers - Discussion
DRG payment methods typically cover payments to general acute care inpatient facilities.
Nursing home care and hospice care are normally paid outside of a DRG payment method.
There are other provider types, however, where the decision of inclusion or exclusion in DRG
payment is less clear and varies among states using DRG payments. These provider types
include:
Physical rehabilitation
Long term acute care
Mental health and substance abuse facilities
Critical access or rural hospitals
Children’s hospitals
Cancer hospitals
Federally Qualified Health Centers
Rural Health Clinics
In‐state / out‐of‐state / border hospitals
Native American Indian hospitals
Public hospitals
The first three provider types in the list above, physical rehabilitation, long term acute care, and
mental health / substance abuse facilities all treat patients with highly variable and
unpredictable lengths‐of‐stay. Because of this, some states choose to pay these providers with
another method, such as a per diem method, instead of paying via DRGs. In addition, a hybrid
option is possible where providers are paid per diem and the per diem amount is adjusted
based on patient acuity, using DRG grouping to measure patient acuity. The APR‐DRG patient
classification model, for example, contains 72 different APR‐DRG classifications and relative
weights intended to reflect the resource intensity of different types of psychiatric patient care.
The relative weights associated with the APR‐DRG classifications can be used to adjust the per
diem, offering a higher per diem for above average relative weight and a lower per diem for
below average relative weight.
The next five providers, critical access, children’s, cancer, Federally Qualified Health Centers,
and Rural Health Clinics are all excluded from the Medicare DRG inpatient prospective
payment system. For that reason, states get some push back when including these providers in
the Medicaid DRG payment method and need to offer justification for the decision. Payment
simulations are a valuable tool for reviewing payments to these providers under a DRG method
and help to show whether or not DRGs will offer fair reimbursement. With the robustness of
some DRG models, such as that reflected in the APR‐DRG algorithm, the simulations often do
show DRG payment is a reasonable option. In addition, special considerations within the DRG

FL AHCA DRG Project: DRG Payment Method Options – August 24, 2012 Page 15
Submitted to the Florida Agency for Health Care Administration Draft for discussion purposes
payment method can be reviewed to ensure fair reimbursement if needed. For example,
separate hospital base rates can be given for some or all of these categories of providers. Also
certain services can be given a service or age adjustor, which is particularly useful to children’s
hospitals. In addition, certain services can be defined as separately billable on outpatient
claims, such as organ search and acquisition costs, and blood factors, which is particularly
appealing to cancer institutions. Making these kinds of payment adjustments within the overall
DRG payment method allows for special considerations to be made while still maintaining the
simplicity of all or nearly all providers paid using the same method.
Similarly to maintain simplicity, most states pay in‐state, border hospitals, and out‐of‐state
hospitals via DRGs. The only decisions normally made based on general location of each
hospital are selection of hospital base price and determination of cost‐to‐charge ratio. For out‐
of‐state hospitals, normally a single hospital base price and a default cost‐to‐charge ratio are
used. For example, the state’s standard Medicare urban or rural cost‐to‐charge ratio can be
assigned to each out‐of‐state hospital. However, border hospitals may have a sufficiently high
volume of Medicaid recipients to justify treating them like in‐state hospitals for the purpose of
assigning base rates and cost‐to‐charge ratios.
Finally, many Medicaid agencies have separate policies associated with Native American Indian
hospitals and public hospitals, so decisions need to be made on how these categories of
providers will be affected by a DRG payment method.
3.1.2 Affected Providers - Recommendation
Consistent with guiding principles related to simplicity, fairness and incenting efficiency, we
recommend including the majority of hospital inpatient stays in the new DRG payment method.
A DRG payment method can promote hospital efficiency and can offer fair payment for the
majority of inpatient stays. In addition, keeping the majority of hospital stays under a single
payment method improves simplicity of program administration, including rate setting,
software implementation and maintenance, and program operations. Specifically, we
recommend the following types of providers be included in the DRG payment method:
General acute care
Critical access or rural hospitals
Children’s hospitals
Cancer hospitals
Teaching hospitals
In‐state / out‐of‐state / border hospitals
Long term acute care
Admissions in long term acute care facilities are similar to rehabilitation and psychiatric
services in the sense that they have highly variable lengths of stay and highly variable costs of
care. As a result, predicting their costs is a challenge for DRG groupers, and as such, we
suggest paying long term acute care stays via a per diem instead of a DRG payment

FL AHCA DRG Project: DRG Payment Method Options – August 24, 2012 Page 16
Submitted to the Florida Agency for Health Care Administration Draft for discussion purposes
methodology. However, Florida Medicaid only had 126 stays at long term acute care facilities
in fiscal year 2010/2011. Given this extremely low volume, whatever payment method provides
the greatest level of simplicity should prove acceptable. We expect that including the long term
acute care hospitals with all other hospitals to be paid via DRGs will be the easiest to
implement.
For the specialty provider types listed below, we recommend carving out of the DRG payment
method. These providers offer services whose costs are not as well predicted through a DRG
payment method and, are more fairly reimbursed under other payment methods such as that
which can be achieved through a per diem model.
Psychiatric specialty distinct part units
Physical rehabilitation free‐standing facilities and distinct part units
Free‐standing, specialized mental health facilities are not included in the list above because they
are not currently reimbursed by the Florida Medicaid fee‐for‐service program. It is our
understanding that Florida Medicaid’s policy related to these providers will not be changing
with the implementation of DRG payments.
Finally the following provider type should also be excluded from the DRG payment method
because their funding sources are sufficiently unique to justify treating them separately:
State‐owned hospitals
3.2 Affected Services
3.2.1 Affected Services - Discussion
The list of services sometimes included and sometimes excluded from DRG payments is similar
to the list of provider types open for debate. States vary on inclusion in DRG payment for the
following list of services,
Physical rehabilitation
Mental health and substance abuse
Unpredictable and expensive services and supplies such as blood factors and organ
search and acquisition
New technologies
As described in the previous section, a policy decision must be made relating to inclusion or
exclusion of specialty rehabilitation and psychiatric institutions within a DRG payment method.
In addition, a policy decision must be made for payment of rehabilitation and psychiatric
services when performed within a general acute care facility. If volumes are low, the simplicity
of including them in the DRG payment method are likely justifiable. However, if volumes are
high, it will be more justifiable to pay these services the same way they will be paid within the
specialty institutions and distinct part units.

FL AHCA DRG Project: DRG Payment Method Options – August 24, 2012 Page 17
Submitted to the Florida Agency for Health Care Administration Draft for discussion purposes
Unpredictable and expensive services and supplies such as blood factors and transplant organ
searches create challenges for a DRG payment method. DRG payments are based on average
resource usage and work very well when hospital admissions can be grouped into relatively
homogeneous categories. However some cases require resources far outside the norm, such as
the cost of blood factors required when operating on a patient with a blood clotting problem.
For items that occur in very low volumes, the policy might simply be to allow outlier payments
to help hospitals cover costs of very expensive cases. However, if volumes are high or are
heavily concentrated at specific hospitals, outlier payments alone may not be sufficient.
Instead, certain services and supplies can be carved out of the DRG payment and made
separately payable. However, such a policy can be extremely challenging to implement in an
MMIS. Other options such as different provider base rates, service adjustors, or multiple tiers in
the outlier payment method (using a higher marginal cost percentage for very high losses) may
generate fair payment and prove far simpler to implement.
New technologies can also be a challenge for a DRG payment. In theory they may reduce cost
of care, but in practice, they most often increase cost. Furthermore, DRG relative weights may
lag slightly behind in capturing these costs because DRG relative weights are calculated using
costs from historical claims. Thus, offering separate payment for new technologies is justifiable.
However, the task of maintaining an ever‐evolving list of new technologies is very challenging.
3.2.2 Affected Services - Recommendation
Physical Rehabilitation and Mental Health Services
Rehabilitation and mental health services are included in the same discussion here because our
recommendation is the same for both. For simplicity, we would prefer to include all services
within the new DRG payment method. However, some services, most notably rehabilitation
and mental health services, vary so much with respect to hospital costs and lengths of stay for
the same diagnoses that a pure DRG payment method is generally not the best way to
determine reimbursement. To confirm, we will perform analysis on Florida Medicaid claims for
these services looking particularly at how variable the hospitals’ costs are within each DRG. If
the results show a very high variability, as they have with other states’ Medicaid data, then we
will recommend carving rehabilitation and mental health services out of the DRG payment
method and maintaining some form of per diem payment method. Specifically, we recommend
carving the services out when provided in a specialty stand‐alone facility or in a distinct part
unit of a full service hospital. We expect stays with a primary diagnosis of rehabilitation or
mental health will for the most part occur in such a specialized setting. If there is an occasional
rehabilitation or mental health stay occurring in a general acute care setting, it can be
reimbursed under the new DRG payment method.
Identifying distinct part units within full service hospitals may be a function already performed
by the Florida Medicaid provider enrollment process. If it is not, we can use Medicare
information to determine which hospitals have distinct part rehab and/or psychiatric units.

FL AHCA DRG Project: DRG Payment Method Options – August 24, 2012 Page 18
Submitted to the Florida Agency for Health Care Administration Draft for discussion purposes
This designation could then be added to FMMIS, most likely into a new indicator on the
provider master file.
Paying via per diem is consistent with how Medicare pays these types of inpatient stays. Also
similar to Medicare, we recommend separate standardized per diem rates for rehabilitation and
mental health services with each standardized rate adjusted by the DRG relative weight
enabling payment. This will adjust the rate based on patient acuity, which is discussed in more
detail in section 6.3 ‐ Per Diem Base Rates. Unlike Medicare, we do not recommend adjusting
mental health per diem amounts based on the number of days in which a patient is in the
hospital. Adjustment based on length of stay seems to add complexity without adding
sufficient benefit. In addition, we do not have data in a sufficient level of detail to validate the
tiered structure implemented by Medicare or to calculate Florida Medicaid specific
multiplication factors. If implementing a tiered per diem adjustment, the best option would be
to accept Medicare’s multiplication factors at face value.
Substance Abuse Services
Substance abuse services are treated as medical conditions under Florida Medicaid policy. They
go through the same prior authorization procedures as medical services, not the prior
authorization procedures used for mental health services. In keeping with that distinction, we
recommend paying substance abuse claims via the DRG payment method, as will be used for
nearly all other medical services. In addition, the standard deviations of length of stay for
substance abuse DRGs is lower than the standard deviations for length of stay for mental health
DRGs, indicating DRGs are a better predictor of hospital resource use for substance abuse
services than for mental health services.
Unpredictable and Expensive Services
As with many policy decisions, the topic of unpredictable and expensive services requires a
trade‐off between the principles used to evaluate a payment method (described in Chapter 1).
Allowing separate payment for unpredictable and expensive services diminishes the incentives
for efficiency, reduces transparency, increases administrative burden, and increases complexity.
On the other hand, access to care may be jeopardized if certain types of cases result in
predictable and consistent losses, even with the casemix and outlier adjustments of a DRG
payment method. An example is surgery for patients with hemophilia. The need for blood
factors can sharply increase the hospital’s cost even for otherwise routine surgeries.
Looking at Medicare as an example, the inpatient prospective payment system allows for
separate payment for inpatient services under three circumstances:
Organ acquisition. In most cases, these costs are reimbursed through the cost settlement
process; for renal transplants, designated renal transplantation hospitals are paid
adjusted rates.
Blood clotting factors. Blood factors are paid based on a fee schedule (e.g., 95% of
average wholesale price).

FL AHCA DRG Project: DRG Payment Method Options – August 24, 2012 Page 19
Submitted to the Florida Agency for Health Care Administration Draft for discussion purposes
New medical technology. Devices that meet very specific Medicare criteria related to
newness, FDA approval, substantial clinical improvement and unusual costliness
criteria may qualify for add‐on payments. Very few devices meet these criteria.
State Medicaid DRG payers, in contrast, often do not allow separate payment for unpredictable
and expensive services because of both the concern over incentives and the added complexity to
the payment method.
Further analysis is needed before determining whether any other services, most notably organ
and bone marrow search and acquisition costs should be separately payable. Medicare does
pay for them separately through a cost settlement process. However, such a cost settlement
model can be rather complicated to administer. In addition, DRG payment simulations may
show these costs are being adequately addressed through DRG relative weights and related
payments. Payment simulations may also show payment via DRGs being higher to the types of
hospitals that perform organ and bone marrow transplants. If that proves to be the case, it will
be difficult to justify shifting even more money to these types of hospitals through separate
additional payments. Lastly, policy adjustors for the transplant DRGs may be a more consistent
way to address these cost differences, without making them separately payable.
New Technologies
Although Medicare pays separately for new technologies, we do not recommend Florida
Medicaid adopt this policy. Maintaining a list of new technologies and identifying appropriate
payment for each is a difficult administrative challenge. In addition, it can be troublesome to
distinguish new technologies that are in fact beneficial to Medicaid recipients versus those that
are simply more costly. Also, add‐on payments for new technologies lend themself to external
pressure being applied to Medicaid policy makers on an ongoing basis. Lastly, the current
payment method offers no additional payment for new technologies, so our recommendation
on this topic is in line with current policy.
In addition, updating DRG relative weights yearly is recommended so that the weights are as
up to date as possible with advances in technology. New technologies that prove to be
successful will gain traction in the industry, thus becoming a factor in the costs of more and
more hospitals. As that occurs, their costs will be captured within DRG relative weights.
3.3 Affected Beneficiaries / Medicaid Programs
3.3.1 Affected Beneficiaries / Medicaid Programs - Discussion
Medicaid agencies generally administer a variety of programs usually with beneficiaries
enrolled in only one program at a time. Common programs include fee‐for‐service, primary
care case management, managed care, and Children’s Health Insurance Program (CHIP). States
often also administer smaller programs sometimes based on a waiver and sometimes paid for
by separate funding sources than used for standard Medicaid. In addition, some Medicaid
beneficiaries are dually eligible for Medicaid and Medicare. For these beneficiaries, most

FL AHCA DRG Project: DRG Payment Method Options – August 24, 2012 Page 20
Submitted to the Florida Agency for Health Care Administration Draft for discussion purposes
healthcare services are paid primarily by Medicare with Medicaid acting as a supplementary
payer, usually paying only the Medicare coinsurance and deductible amounts. However, there
are certain services not covered by Medicare and cases where Medicare benefits have been
exhausted, in which case Medicaid becomes the primary payer. As part of a DRG payment
method implementation, Medicaid agencies must determine which programs and/or eligibility
categories will be included in the new payment method. The new payment policy must also
decide how Medicare crossover claims (where Medicare was the primary payer) are affected.
For simplicity of the payment methods, Medicaid programs typically aim to include all
programs in the DRG payment method and make exceptions only when specific, justifiable
reasons are identified.
3.3.2 Affected Beneficiaries / Medicaid Programs - Recommendation
Services for Medicaid fee‐for‐service recipients are planned for reimbursement under the new
DRG methodology. In addition, Medicare versus Medicaid lower‐of pricing is recommended
for Medicare crossover claims, so the new DRG payment methodology should apply to
calculation of the Medicaid allowed amount for dual eligible beneficiaries.
The payment methodology used for services to recipients enrolled in managed care plans will
continue to be the decision of the managed care organizations. Medicaid managed care plans
can choose to follow fee‐for‐service and move to a DRG‐based inpatient payment method, but
are not required to do so. If managed care plans do choose to convert to DRGs, we recommend
they perform a separate analysis to determine appropriate policies and payment factors for their
specific portions of the Medicaid population.
3.4 Prior Authorization Changes
3.4.1 Prior Authorization Changes - Discussion
When moving from a per diem‐based payment method to a DRG‐based payment method, the
unit of service that is tied to the payment methodology changes from a day to a complete
hospital stay, or discharge. This often has implications on the service authorization process. In
a per diem payment method, processes and systems are often installed to monitor the number
of days of each hospital stay. Under a DRG payment method, length of stay is no longer a
major contributor to payment. As a result, the Medicaid program no longer needs to emphasize
careful control over the number of days authorized. Instead, Medicaid programs generally
choose only to authorize hospital admissions, not the number of days following the admission.
Medicaid programs also monitor very expensive stays, sometimes in the pre‐payment
authorization process and sometimes in post payment review. In addition, Medicaid programs
may choose to monitor stays which are unusually short to prevent inappropriately early
discharges, as hospitals are now incented to limit the length of stay.
Similarly, a change from per diem to DRG payment may change some of the post‐payment
review processes and reports. With DRG payments, length of stay is of little concern, but
excessive numbers of very short stays or excessive numbers of stays for which outlier payments
are made are a concern. Overall, a DRG payment method may decrease the effort needed in

FL AHCA DRG Project: DRG Payment Method Options – August 24, 2012 Page 21
Submitted to the Florida Agency for Health Care Administration Draft for discussion purposes
support of prior authorizations, but may also increase the effort needed for post‐payment
review.
3.4.2 Prior Authorization Changes - Recommendation
We recommend procedures, system edits, and reports be reviewed with the idea in mind that
controlling lengths of stay is of limited value under a DRG payment method. Authorizing a
specific number of days for a hospital stay will no longer be necessary for those stays being paid
under a DRG payment method. (Note, psychiatric stays and rehabilitation stays may remain in
a per diem payment method.) In addition, concurrent reviews required after certain lengths of
stay may no longer be necessary. Ideally under a DRG payment method, concurrent reviews
are more valuable for stays that will generate an outlier payment. Unfortunately, identifying
outlier stays in advance of a discharge is problematic.

FL AHCA DRG Project: DRG Payment Method Options – August 24, 2012 Page 22
Submitted to the Florida Agency for Health Care Administration Draft for discussion purposes
4 Cost Estimation
4.1 Cost Estimation - Discussion
Estimating costs for inpatient hospital services is an important step in the design of a DRG‐
based payment or rate‐setting methodology for several reasons. First, for payers planning to
develop and implement their own relative weights, knowing the costs of claims is critical if
those weights are to be based on relative differences in the average costs of services described
by each DRG. Second, even for states that are considering adopting weights from other payers
or national sources, understanding the costs of services can be useful for validating the
appropriateness of the borrowed relative weight values. Third, understanding the costs of
services can be helpful in evaluating the overall fairness and equity of a payment model and
related rates.
Finally, costs can be useful as a starting point for establishing DRG base rates (as well as per
diem rates that might be used to pay for services that are excluded from the DRG payment
method). It should also be understood, however, that when designing a system that is intended
to be budget neutral, that it is not necessary to start with the costs of services when establishing
base rates. Base rates can be determined through an iterative process using a payment
simulation model where rates can be set at a level that will result in an aggregate “spend,” set at
a level to be consistent with the payer’s budget neutrality requirements.
Currently, AHCA’s policy for estimating costs uses an aggregated approach that would not be
practicable for application on a claim‐by‐claim basis, which will be a requirement for the
current design process. There are several other approaches that can be used to estimate costs on
a claim‐by‐claim basis using generally the same hospital Medicare cost report data and paid
claims data relied upon by AHCA for their calculations. Two common approaches require
extracting cost and charge data from hospital Medicare cost reports and determining either
aggregate or detailed cost‐to‐charge ratios (CCRs) and per diems to estimate routine and
ancillary costs. Regardless of the approach used, Florida hospital Medicare cost report data
extracted from the CMS Hospital Cost Reporting Information System (HCRIS) dataset will be
necessary.
One approach, an aggregate CCR approach, determines a hospital‐specific CCR based on the
ratio of total allowable costs to total allowed charges reported on the hospital‐specific Medicare
cost report. This hospital aggregate CCR is applied to the total charges on a claim to estimate a
total cost for the claim. This approach to cost estimation is less precise than the detailed
approach described next; however, it is a less resource intensive process, and is very easy to
understand.
An alternative approach to the aggregate CCR approach is to use a detailed line‐level approach
based on Medicare’s detailed cost apportionment methodology, relying on hospital‐specific
routine cost per diems and ancillary CCRs to estimate costs at a claim‐detail level. The detailed
line‐level costing approach is intuitively considered to be a more precise estimation of costs

FL AHCA DRG Project: DRG Payment Method Options – August 24, 2012 Page 23
Submitted to the Florida Agency for Health Care Administration Draft for discussion purposes
because it requires examination of the charges for each detail line within a claim to estimate a
total cost for the claim. Additional consideration during rate development should be given to
separately calculating for each claim the operating cost, capital cost and direct medical
education cost. This can be accomplished by calculating operating, capital and direct medical
education‐specific routine cost per diems and ancillary CCRs, the data elements for which are
readily available in the CMS HCRIS database.
The following steps are needed to estimate costs at the detailed line level:
Extract Florida hospital Medicare cost report data from the CMS HCRIS database for
each in‐state acute care hospital with reporting dates matching the dates‐of‐service of
the claims contained in the analytical dataset
Calculate hospital‐specific operating, capital and direct medical education routine per
diems and ancillary CCRs for each standard Medicare cost center
Crosswalk each ancillary CCR or routine cost per diem, by cost center, to the allowable
revenue codes in the analytical dataset claims data detail. This will include matching
cost reporting periods to claims data based on the claim date of service. Only revenue
codes that are identified as allowable under AHCA’s current provider billing
instructions would be included in the cost calculation.
Estimate ancillary costs of each claim by multiplying the ancillary claim detail line
charges by the applicable ancillary CCR
Estimate routine costs of each claim by multiplying the routine claim detail line days by
the applicable routine cost per diem
Subtotal the operating, capital and direct medical education costs for each claim at the
header level
Inflate the cost of each claim to the midpoint of the proposed rate year based on changes
in CMS hospital input price index levels
Both cost estimation approaches discussed here are acceptable methodologies used by Medicaid
agencies for rate determination and impact analyses, and there are many variations of these
approaches. The selection of a method for this project will be dependent on a number of factors,
including the anticipated methods to be used to determine base rates and relative weights.
4.2 Cost Estimation - Recommendation
For analysis purposes during the design of the DRG payment method, we propose calculating
hospital costs using a detailed line‐level approach. Under our proposal, Medicare cost reports
will be used to calculate routine cost per diems and ancillary cost‐to‐charge ratios (CCRs). The
per diems and ancillary CCRs will be mapped to revenue codes then applied to claim service
lines in the DRG simulation dataset based on the associated revenue codes. This will allow an
estimated cost to be calculated for each claim service line and then summed to identify the cost
per claim.

FL AHCA DRG Project: DRG Payment Method Options – August 24, 2012 Page 24
Submitted to the Florida Agency for Health Care Administration Draft for discussion purposes
For the purposes of individual claim payment calculations under a DRG payment method, cost
is only used in the determination of outlier payments. For this purpose, we recommend
adopting Medicare hospital‐specific CCRs which are the sum of the operating and capital CCRs.
For hospitals not currently reimbursed under the inpatient prospective payment system, these
CCRs will not be available. Instead, these CCRs can be calculated from cost reports.
We recommend CCRs be determined for every hospital with provider agreements to participate
in the Florida Medicaid program including high volume out‐of‐state hospitals. There are
currently 18 out‐of‐state hospitals participating in the Florida Medicaid program. For non‐
participating out‐of‐state hospitals, a default CCR will be needed. The default CCR can be set to
a statewide average CCR, or the Medicare urban or rural average CCR.

FL AHCA DRG Project: DRG Payment Method Options – August 24, 2012 Page 25
Submitted to the Florida Agency for Health Care Administration Draft for discussion purposes
5 DRG Grouping
The topic of DRG grouping breaks down into two basic decision points. The first is which DRG
grouping algorithm to use. Once that is decided, then the source of the DRG relative weights
and average lengths of stay can be determined.
5.1 DRG Grouper
5.1.1 DRG Grouper - Discussion
5.1.1.1 Introduction
The goal of diagnosis related groupers is to define patients into categories based on similar
clinical conditions and on similar levels of hospital resources required for treatment. These
categories are identified using Diagnosis Related Group (DRG) codes each of which is assigned
a relative weight appropriate for the relative amount of hospital resources used to treat the
patient. For example, if a DRG grouper assigns “patient A” to DRG 123 with relative weight
0.5, and assigns “patient B” to DRG 321 with relative weight 1.0, this indicates the average
amount of hospital resources required to treat “patient A” is a half the amount of resources
required to treat “patient B”. These relative weights associated with DRGs are used in the
calculation of reimbursement with the intent of paying more when the patient’s care required
more resources and less when the patient’s care required fewer resources. Thus, from the point
of view of hospital reimbursement, the best DRG grouper for a particular healthcare payer is the
one that most accurately predicts the relative hospital resource usage for the full range of
services reimbursed by the payer.
Given the importance of generating fair payment for services provided, the primary objective of
a DRG grouper is to categorize hospital stays in a way that most accurately predicts relative
hospital resource usage for the care provided to each patient. In addition, there are other
benefits of DRG grouping such as contributing to measurement of hospital quality and
categorizing the types of care reimbursed by the payer. Also, as with any tool, DRG groupers
need to be evaluated in terms of long term viability and reliability. With all these thoughts in
mind, the criteria recommended for evaluation of different DRG groupers are:
1. Accuracy categorizing relative cost of care for the full range of services reimbursed by
the Medicaid agency, with particular concentration on the services for which Medicaid is
a major player in the market
2. Long term viability in an ever‐evolving healthcare industry
3. Ability to contribute to measurement of hospital quality
4. Familiarity and experience being used in the industry

FL AHCA DRG Project: DRG Payment Method Options – August 24, 2012 Page 26
Submitted to the Florida Agency for Health Care Administration Draft for discussion purposes
5.1.1.2 Options
There are six DRG grouping algorithms currently available in the United States as shown in
Table 2.
Table 2
High‐Level Comparison of DRG Algorithms
Algorithm Developer
All‐
Patient
Weights
Planned
ICD‐10
Compliance
Marketed
for
Medicaid
Medicaid
Payer Use
Other
Payer
Use
Used to
Measure
Quality
CMS‐DRGs 3M for CMS No No No Yes Yes No
MS‐DRGs 3M for CMS No Yes No Yes Yes Yes
AP‐DRGs 3M Yes No Yes Yes No No
APR‐DRGs 3M / NACHRI Yes Yes Yes Yes Yes Yes
APS‐DRGs OptumInsight Yes Yes Yes No No No
Tricare DRGs 3M No Yes No Yes Yes No
Two of these algorithms, CMS‐DRGs and AP‐DRGs are being phased out. Neither is actively
being updated which means neither will be released with an ICD‐10 compliant version. The
Tricare DRG algorithm, which was developed and is currently maintained by 3M, uses
generally the same DRG grouping logic as MS‐DRGs, but has been enhanced to reflect the
grouping logic of the obsolete AP‐DRG model for pediatric and neonatal services. Based on our
discussions with representatives from 3M, there has been relatively little investment focused on
the Tricare DRG tool to bring it current with the standards established for more current models,
particularly with respect to classifying neonatal and pediatric cases. The DRGs for those types
of cases have been the same for many years and have not been (nor are they expected to be)
updated with new research. For these reasons, the CMS‐DRG, AP‐DRG and Tricare DRG
algorithms can be considered unacceptable options, leaving only three potential options for
Florida Medicaid, MS‐DRGs, APR‐DRGs, and APS‐DRGs. These are compared in greater detail
in Table 3.

FL AHCA DRG Project: DRG Payment Method Options – August 24, 2012 Page 27
Submitted to the Florida Agency for Health Care Administration Draft for discussion purposes
Table 3
Detailed Comparison of Select DRG Algorithms
Description MS‐DRGs V.28
(CMS ‐ Maintained by 3M)
APR‐DRGs V.28
(3M and NACHRI)
APS‐DRGs V.28
(OptumInsight – formerly
Ingenix)
Intended
Population
Medicare (age 65+ or under
age 65 with disability)
All patient (based on the
Nationwide Inpatient
Sample)
All patient (based on the
Nationwide Inpatient
Sample)
Overall
approach and
treatment of
complications
and
comorbidities
(CCs)
Intended for use in
Medicare Population.
Includes 335 base DRGs,
initially separated by
severity into “no CC”, “with
CC” or “with major CC”.
Low volume DRGs were
then combined.
Structure unrelated to
Medicare. Includes 314
base DRGs, each with four
severity levels. The is no
CC or major CC list;
instead, severity depends
on the number and
interaction of CCs.
Structure based on MS‐DRGs
but adapted to be suitable for
an all‐patient population.
Includes 407 base DRGs, each
with three severity levels.
Same CC and major CC list as
MS‐DRGs.
Number of
DRGs 746 1,258 1,223
Newborn
DRGs
7 DRGs, no use of birth
weight
28 base DRGs, each with
four levels of severity
(total 112)
9 base DRGs, each with three
levels of severity, based in
part on birth weight (total 27)
Psychiatric
DRGs
(including
chemical
dependency)
9 DRGs; most stays group to
“psychoses”
18 DRGs, each with four
levels of severity (total 72)
10 base DRGs, each with
three levels of severity (total
30)
Payment Use
by Medicaid
MI, NH, NM, OK, OR, SD,
WI
Operational: MA, MD, MT,
NY, PA, RI, SC
Announced: CA, CO, IL,
ND, TX
None
Payment use
by other
payers
Commercial plan use BCBSMA, BCBSTN Commercial plan use
Other users Medicare, hospitals
Hospitals, AHRQ,
MedPAC, JCAHO, various
state “report cards”
Hospitals, AHRQ, various
state “report cards”

FL AHCA DRG Project: DRG Payment Method Options – August 24, 2012 Page 28
Submitted to the Florida Agency for Health Care Administration Draft for discussion purposes
Table 3
Detailed Comparison of Select DRG Algorithms
Description MS‐DRGs V.28
(CMS ‐ Maintained by 3M)
APR‐DRGs V.28
(3M and NACHRI)
APS‐DRGs V.28
(OptumInsight – formerly
Ingenix)
Uses in
measuring
hospital
quality
Used as a risk adjustor in
measuring readmissions.
Used to reduce payment for
hospital‐acquired
conditions.
Used as risk adjustor in
measuring mortality,
readmissions,
complications
Used as risk adjustor in
measuring mortality and
readmissions and to reduce
payment for hospital‐
acquired conditions
Source: Quinn, K., Courts, C. Sound Practices in Medicaid Payment for Hospital Care; Center for Healthcare
Strategies, November 2010. Updated by Navigant with additional and more current information.
5.1.1.3 Accuracy Categorizing Relative Cost with a Medicaid Population
Both the APR‐ and APS‐DRG algorithms are designed for a full beneficiary population. The
APR‐DRG algorithm even includes significant granularities for sick newborns and pediatrics
that are developed and maintained by the National Association of Children’s Hospitals and
Related Institutions (NACHRI) for 3M Health Information Systems. Presumably both APR‐
DRGs and APS‐DRGs are reasonably accurate for predicting relative hospital cost given
characteristics of the patient. However, more confidence exists in the accuracy of the APR‐DRG
scheme simply because it is used by many more payers than APS‐DRGs.
MS‐DRGs, in contrast, are developed specifically for the Medicare population. The DRGs are
designed for beneficiaries over the age of 65 or who are disabled or suffering from end stage
renal disease. It was in 2004 when the Centers for Medicare and Medicaid Services (CMS) made
a policy shift to no longer support the needs of all payers.
“As previously stated, we do not have the data or the expertise to develop more
extensive newborn and pediatric DRGs. Our mission in maintaining the Medicare DRGs
is to serve the Medicare population.” 1
Then in 2007 when Medicare adopted its new Medical Severity DRG algorithm (MS‐DRGs),
CMS made several statements underscoring the fact that MS‐DRGs were developed only for the
Medicare population. For example,
“The MS‐DRGs were specifically designed for purposes of Medicare hospital inpatient
services payment. As we stated above, we generally use MEDPAR data to evaluate
1 CMS, “Medicare Program; Changes to the Hospital Inpatient Prospective Payment Systems and Fiscal Year 2005 Rates; Final
Rule,” Federal Register 69:154 (Aug. 11, 2004), p. 48,939.

FL AHCA DRG Project: DRG Payment Method Options – August 24, 2012 Page 29
Submitted to the Florida Agency for Health Care Administration Draft for discussion purposes
possible DRG classification changes and recalibrate the DRG weights. The MEDPAR
data only represent hospital inpatient utilization by Medicare beneficiaries. We do not
have comprehensive data from non‐Medicare payers to use for this purpose. The
Medicare program only provides health insurance benefits for people over the age of 65
or who are disabled or suffering from end‐stage renal disease. Therefore, newborns,
maternity, and pediatric patients are not well represented in the MEDPAR data that we
used in the design of the MS‐DRGs. We simply do not have enough data to establish
stable and reliable DRGs and relative weights to address the needs of non‐Medicare
payers for pediatric, newborn, and maternity patients. For this reason, we encourage
those who want to use MS‐DRGs for patient populations other than Medicare make the
relevant refinements to our system so it better serves the needs of those patients.” 2
The number of newborn DRGs provides a useful contrast between the MS‐DRG algorithm and
an all‐patient algorithm such as APR‐DRGs. MS‐DRGs provide seven (7) DRG codes for the
care of newborns while APR‐DRGs provide 112 DRG codes (28 base DRGs, each with four (4)
levels of severity). In addition, MS‐DRGs do not take birth weight into consideration when
assigning a DRG despite the fact that birth weight has been widely accepted as a significant
indicator of the viability and overall health of newborns.
When comparing APR‐DRGs and APS‐DRGs, APRs also stand out as having more granularity
for specific services commonly paid for by a Medicaid program. For example,
» For newborns, there are 112 APR‐DRG codes for newborns (28 base DRGs, each with 4
levels of severity), and 27 APS‐DRG codes (9 base DRGs each with 3 levels of severity)
» For psychiatric care, there are 96 APR‐DRGs (24 base DRGs each with 4 levels of
severity), and 30 APS‐DRG codes (10 base DRGs each with 3 levels of severity)
5.1.1.4 Long Term Viability
As mentioned previously, CMS‐DRGs and AP‐DRGs have already been discontinued and are
not expected to be offered in an ICD‐10 compliant version. APR‐DRGs and MS‐DRGs are
heavily used, and widely accepted, so their viability is strong. Both are planned to be released
with ICD‐10 compliant versions and are expected to be updated as necessary to follow future
changes in healthcare payment strategies in the United States for years to come. OptumInsight
has confirmed they too plan to have an ICD‐10 compliant version of APS‐DRGs and plan to
maintain the product for the foreseeable future. All of that is presumably true, but confidence
in the long term viability of the APS‐DRG product is a little lower simply because it appears to
hold a much smaller share of the market – in fact there is no state Medicaid agency using APS‐
DRGs to pay for fee‐for‐service claims.
2 CMS, “Medicare Program; Changes to the Hospital Inpatient Prospective Payment Systems and Fiscal Year 2008 Rates; Final
Rule,” Federal Register 72:162 (Aug. 22, 2007), p. 47,158.

FL AHCA DRG Project: DRG Payment Method Options – August 24, 2012 Page 30
Submitted to the Florida Agency for Health Care Administration Draft for discussion purposes
5.1.1.5 Applicability to Quality Measures
Incorporating hospital quality measures into payment systems has become increasingly
common and sophisticated over the past decade. States face increasing pressure to demonstrate
that Medicaid payments support quality care – as evidenced by section 2702 of the Patient
Protection and Affordable Care Act prohibiting federal Medicaid payments for services treating
healthcare‐acquired conditions (effective July 1, 2012).
To fairly measure hospital quality, the quality measure should be risk adjusted (also referred to
as casemix adjusted). For example, performing direct comparisons of mortality rates or
complication rates between a cancer institute and a small rural hospital would be unfair unless
they are casemix adjusted. In a situation where a cancer institute has a complication rate of 7
percent, and a small rural hospital has a complication rate of 5 percent, at face value, the
complication rate of the cancer institute appears higher. However, when taking into
consideration patient acuity between the two facilities, the complication rate at the cancer
institute might prove to be lower than the rate at the rural hospital. APR‐DRGs are very
commonly used for the purpose of casemix adjustment.
APR‐DRGs are also used as a basis for two quality measurement tools becoming increasing
popular with Medicaid programs for measurement of hospital quality using medical claims
data. Those tools are:
» 3M™ Potentially Preventable Complications (PPC) Grouping Software – identifies
complications that may have been avoided. This software first identifies conditions
not present on admission and then determines whether those conditions were
potentially preventable given the patient’s reason for admission, procedures, and
underlying medical conditions. It also flags Hospital Acquired Conditions
monitored by CMS.
» 3M™ Potentially Preventable Readmission (PPR) Grouping Software – identifies
readmissions clinically related to previous admissions which were potentially
preventable.
Both of the above software applications have already been used by various payers – including
Medicaid agencies – for reporting purposes, payment purposes, or both. The Maryland All
Payer system, for example, uses PPCs to adjust inpatient hospital rates. In the first year of use,
the system experienced a 12 percent reduction in PPCs ($62.5 million in averted costs to state
and providers) and an 8 percent reduction the following year ($43 million in additional averted
costs).3 Texas Medicaid reduced inpatient Medicaid spending by $18 million using PPRs and
PPCs and reduced premiums to managed care organizations (MCOs) by up to 5 percent by
reducing a variety of preventable events.4
3 3M Health Information Systems for the Navigant Healthcare Payer Strategy Group. 3M Payment and Performance Measurement
Systems. January 31, 2012. 4 3M Health Information Systems for the Navigant Healthcare Payer Strategy Group. 3M Payment and Performance Measurement
Systems. January 31, 2012.

FL AHCA DRG Project: DRG Payment Method Options – August 24, 2012 Page 31
Submitted to the Florida Agency for Health Care Administration Draft for discussion purposes
Because the 3M PPC and PPR quality measurements are built “using the language of APR‐
DRGs,” implementing APR‐DRGs for payment can facilitate a move to PPC and PPR quality
measures.
5.1.1.6 Prevalence in the Industry
MS‐DRGs are the DRG algorithm implemented for Medicare. In addition, a few state Medicaid
agencies have chosen MS‐DRGs. APR‐DRGs are also used by several public and commercial
payers. Figure 1 shows how states currently pay for inpatient care, including seven state
agencies already using APR‐DRGs (Massachusetts, Maryland, Montana, New York,
Pennsylvania, Rhode Island, South Carolina) and six having announced plans to implement
APR‐DRGs in the near future (California, Colorado, Illinois, Mississippi, North Dakota, and
Texas). APR‐DRGs have also been used to adjust for casemix differences in performance
measures in Florida, Hawaii, Maryland, Massachusetts, New York, Texas and Utah.5 Blue Cross
Blue Shield of Massachusetts and Blue Cross Blue Shield of Tennessee have also implemented
APR‐DRGs.
APS‐DRGs are not currently used by any state Medicaid agency for the purpose of determining
reimbursement of inpatient acute care claims.
5 Prepared by ACS for the California Department of Health Care Services. Medi‐Cal DRG Project Draft Policy Design Document.
January 10, 2012. Page 24.

FL AHCA DRG Project: DRG Payment Method Options – August 24, 2012 Page 32
Submitted to the Florida Agency for Health Care Administration
Figure 1: How states pay for inpatient acute care.
APR-DRGs MS-DRGs
*
*
*
CMS-DRGs AP or Tricare DRGs
Per Stay/Per Diem/Cost Reimbursement/Other
*
* **
* Indicates Moving Toward ** Indicates Under Consideration
***
*

FL AHCA DRG Project: DRG Payment Method Options – August 24, 2012 Page 33
Submitted to the Florida Agency for Health Care Administration
5.1.2 DRG Grouping - Recommendation
For a Medicaid population, there is one DRG grouper that stands out as the best option for use
in paying inpatient claims – APR‐DRGs. Of the two other primary options, MS‐DRGs are not
well suited for a Medicaid population (at CMS’s own admission) and APS‐DRGs have gained
little traction in the market – in fact are not used by any state Medicaid agency to pay fee‐for‐
service claims. APR‐DRGs, in contrast, have sufficient granularity to categorize hospital stays
and associated cost of care for the full range of beneficiaries served by Medicaid agencies. APR‐
DRGs are even particularly detailed for certain services in which Medicaid is a major payer,
specifically newborns and pediatrics. APR‐DRGs are currently used by several state Medicaid
agencies for claims payment and are planned for implementation in a handful of additional
states. With its strong market share, APR‐DRGs are expected to be updated for future changes
impacting the U.S. medical insurance industry, including the planned migration to ICD‐10.
And finally, APR‐DRGs are heavily used for risk adjustment and for hospital quality measures
becoming more prevalent as a way to incent quality care.
5.2 DRG Relative Weights
5.2.1 DRG Relative Weights - Discussion
States have three options when selecting a set of relative weights for the DRGs they will be
using:
a. Use national relative weights
b. Develop state‐specific weights
c. Borrow state‐specific weights developed by another payer or Medicaid program
National relative weights exist for APR‐DRGs, MS‐DRGs, and APS‐DRGs. For APR‐DRGs and
APS‐DRGs, national relative weights are updated yearly and are calculated using the two most
recent year’s data from the Nationwide Inpatient Sample maintained by the Agency for
Healthcare Research and Quality (AHRQ). This data includes claims from all types of payers
including many Medicaid programs. MS‐DRG relative weights are also updated each year,
using only claims data from Medicare recipients.
National relative weights are relatively easy to use as they are calculated by external agencies.
If using national relative weights, states can decide to use the values as they are distributed, or
re‐center the weights to the individual state’s overall casemix. Re‐centering the weights simply
resets the average relative weight to 1.0 which makes the numbers very easy to understand –
relative weights less than 1.0 are below average and relative weights above 1.0 are above
average.
Instead of using national relative weights, states can choose to calculate their own weights. This
option has the benefit of ensuring the weights accurately reflect costs of hospitals when treating
patients that are unique to that state’s Medicaid population. However calculating state‐specific
weights requires more effort from the Medicaid agency (more than simply downloading
national values). In addition, it offers the challenge of deciding what values to use for DRGs
with statistically low volume in the Medicaid program. Even California, the largest Medicaid

FL AHCA DRG Project: DRG Payment Method Options – August 24, 2012 Page 34
Submitted to the Florida Agency for Health Care Administration
program in the country, found there were 463 APR‐DRGs with fewer than 30 stays in a single
year (2009), including 46 APR‐DRGs with zero volume. 6 In cases with low volume, states can
choose to use the national value, or prorate the weight from a similar DRG.
If choosing to use state‐specific relative weights, decisions must also be made on how those
weights will be calculated. The basis for weights can be charges or relative costs. Typically,
relative weights come out similarly when using charges or costs, but using costs is far more
defensible (see Chapter 4 for a discussion of options for estimating the costs of services). When
using costs, another necessary decision is defining how costs will be determined for the relative
weight calculation. Further, the process for recalculating the weights would have to be
performed periodically, usually annually.
The final option a state can select is to copy the relative weights from another Medicaid
program. This has the advantage of limiting the effort a state expends to determine relative
weights while allowing the weights used to be specific to a Medicaid program. Pennsylvania
selected this option, and uses the state‐specific APR‐DRG relative weights calculated by New
York.
Once a DRG grouper is selected, a comparison can be made of national relative weights versus
state‐specific weights. Navigant has performed this type of comparison in the past and found
the national weights and state‐specific weights align very closely on the high volume and high
cost DRGs. If similar analysis using Florida Medicaid generates the same results, it will be an
argument for using the national weights.
Similar to relative weights, average length of stay must also be determined for each DRG.
Average length of stay is used in transfer and partial eligibility payment adjustments. Average
length of stay can also be used in outlier calculations if day outliers are implemented. If using
national relative weights, national average lengths of stay would also be available for use.
Similarly, if borrowing from another state, both the relative weights and average lengths of stay
could be borrowed. If, on the other hand, Florida Medicaid state‐specific relative weights are
selected, then state‐specific average lengths of stay would also need to be calculated, including
the challenge of deciding what to do with DRGs having statistically low volumes of
observations.
5.2.2 DRG Relative Weights - Recommendation
Studies with other state Medicaid data have shown that state‐specific weights and national
weights align very well for high volume DRGs. We believe the same will prove true with
Florida‐specific relative weights, although analysis will be performed to confirm. Also, as
mentioned in the discussion section, using national weights requires less administrative burden
and requires little or no manual adjustment for low‐volume DRGs. Given these facts, we
recommend adopting national relative weights for use by the Medicaid program.
6 Prepared by ACS for the California Department of Health Care Services. Medi‐Cal DRG Project Draft Policy Design Document.
January 10, 2012. Page 33.

FL AHCA DRG Project: DRG Payment Method Options – August 24, 2012 Page 35
Submitted to the Florida Agency for Health Care Administration
In addition, we recommend re‐centering those weights to 1.0 (by dividing each national relative
weight by the Florida Medicaid overall average casemix). Re‐centering the weights has the
simple effect of making 1.0 the average relative weight, numbers below 1.0 less than the
average, and numbers above 1.0 greater than the average, thus providing a quick and easy
interpretation of relative weight values.
If Florida state‐specific weights are used, there are 278 APR‐DRGs with volume below 30 stays
in two years of fee‐for‐service data (using data from fiscal years 09/10 and 10/11). Thirty is
generally accepted as a statistically significant sample size, so DRGs with less than 30 stays
would need their relative weights determined manually. Also, as Florida Medicaid shifts more
recipients to managed care, the number of DRGs in the fee‐for‐service population that have
small sample sizes will increase. Assuming the plan to migrate to a managed care model moves
forward, state‐specific weights would likely need to be calculated in the future using the Florida
Health Finder all‐payer inpatient data instead of the Medicaid fee‐for‐service data. Another
option will be to use a combination of Medicaid fee‐for‐service and managed care claims to
result in sufficient volume for relative weight calculations. For this option to work, the
encounter data will need to be as high in quality as the fee‐for‐service data.
6 Provider Base Rates
Provider base rates are another significant contributor to the reimbursement amount on
individual hospital stays and to Medicaid hospital inpatient reimbursement in aggregate. Thus
selection of provider base rates is a critical step in ensuring fair reimbursement when
implementing a DRG payment method. The simplest approach from the point of view of
maintaining budget neutrality would be to assign each hospital its own base rate. However,
this would defeat one of the basic goals of a DRG payment method – that is incenting and
rewarding hospital efficiency. The opposite approach would be to develop a single base rate to
be applied to all hospitals, with potential adjustments to that base rate for individual hospitals
only to address reasonable differences in cost, and where those differences are actually
measurable. Many states have found, however, that a solution somewhere between individual
hospital base rates and a single state‐wide base rate is a more appropriate answer.
6.1 Provider Base Rate Wage Area Adjustments
6.1.1 Provider Base Rate Wage Area Adjustments - Discussion
One factor employed by states (and by the Medicare program) to adjust hospital base rates is a
geographic wage area index or factor. The wage areas and associated wage indices can be state‐
defined values or can be linked to the Medicare values. Adjustment by wage area allows for
higher payment in geographic regions that have historically reported higher wage rates for
hospital employees.
Wage area indices act as multipliers to common base rate(s) and can be applied either to the
entire base rate or to a portion of the base rate. For example, Medicare applies the wage area
index only to a percentage of the common base rate where the percentage is a standardized
estimate of the percentage of hospital costs attributed to labor. In particular, Medicare applies
the wage index to 62% of the common base rate for hospitals with a wage index less than 1 and

FL AHCA DRG Project: DRG Payment Method Options – August 24, 2012 Page 36
Submitted to the Florida Agency for Health Care Administration
applies the wage index to 68.8% of the common base rate for hospitals with wage index greater
than or equal to 1. For example, the base rate for a hospital with a wage index greater than 1 is:
Base rate = ([Common base rate] * [hospital wage index] * 0.688)
+ ([Common base rate] * 0.312)
Medicare also has a cost of living adjustment (COLA) applied to the non‐labor portion, but that
is only applied to hospitals in Alaska and Hawaii. In addition, Medicare has separate
calculations for operating base payment and capital base payment, and sums the two to
generate overall payment. The formulas for the two separate base payments are very similar.
Medicare wage indices for providers participating in Florida Medicaid (including a select few
out of state providers) range from 0.7277 to 1.0163 and the average is 0.9287. The difference
from the lowest wage index to the highest is 0.2886 which is over 30% of the average.
An alternative to adopting Medicare’s wage indices would be to develop Florida‐specific wage
indices. However, determination of wage areas can be very complicated and would likely
require AHCA to take on a significant amount of additional effort. In addition, CMS is
currently undergoing a major effort to redesign wage areas that will presumably result in a
solution more widely accepted in the hospital community.
6.1.2 Provider Base Rate Wage Area Adjustments - Recommendation
Medicare wage indices in Florida vary from 0.8342 to 1.0163 (and if participating out‐of‐state
hospitals are included, the lowest wage index is 0.7277). With as much as a 22% difference in
wage index from the lowest to highest wage area in Florida, we believe the differential is
sufficient to justify the added complexity of implementing base rate adjustments for different
geographic regions. In particular, we recommend adoption of a simplified version of the
Medicare model of applying a wage index to the labor portion of each hospital’s base rate. The
simplification we suggest is due to the fact that we recommend calculation of only one base rate
for each hospital – not separate operating and capital base rates. So the wage index will be
applied to the labor portion of each hospital’s lone base rate. In addition, we recommend
simplifying the calculation by using a single percentage to identify the labor portion of hospital
costs in contrast to Medicare’s practice of identifying the labor portion as 62% for wage indices
less than 1 and 68.8% for wage indices greater than 1. Finally, we recommend adopting
Medicare’s wage area assignments, including reclassifications and redesignations of hospitals
into adjacent wage areas. The only adjustment to the Medicare numbers we recommend is a re‐
centering of the values so that the lowest value is 1.0 and all other values are greater than 1.0.
This is done by dividing each wage index by the lowest value, 0.8342. The simple result of this
calculation is that no hospital sees its base rate reduced because of a geographic adjustment.
Instead, base rates will only be increased or remain the same due to the geographic adjustment.
For non‐participating out‐of‐state hospitals, we recommend setting the wage index to 1.0, which
means they receive the standard base rate without any geographic adjustment.
The Medicare model for wage areas and indices may not be perfect, but it is generally accepted
in the industry. Also, Medicare is actively researching ways to improve it. Determining

FL AHCA DRG Project: DRG Payment Method Options – August 24, 2012 Page 37
Submitted to the Florida Agency for Health Care Administration
appropriate geographic cost adjustors is a complex and controversial topic. AHCA is better
served by using a model already entrenched in the industry than attempting to calculate and
justify its own set of adjustors.
6.2 Provider Base Rate Categories
6.2.1 Provider Base Rate Categories - Discussion
The combination of provider base rates adjusted by wage area, DRG relative weights, and
policy adjustors (discussed in section 7.2) may be enough to ensure fair payment to providers.
However, if those options leave open some areas of concern, another option available is
adjustment of hospital base rates based on hospital categories or peer groups. Hospital peer
groups can be used to protect access to care at specific facilities, such as rural hospitals, and/or
to generate fair payment to hospitals that legitimately have higher cost structures (if the reason
for higher cost is separate from wages in different geographic areas). To protect access to care,
for example, the California Department of Health Care Services plans to have a separate set of
base rates for remote rural hospitals. In addition, when looking at cost structures, separate base
rates may be justifiable, for example, for trauma facilities, specialty children’s hospitals and/or
teaching hospitals. For teaching hospitals, Medicare provides additional payment, separate
from the base rate. However, that additional payment can just as easily be incorporated into the
base rate.
A peer group can also be considered if there is a group of hospitals who treat very complicated,
expensive cases and are expected to have an unusually high percentage of outlier payments. In
most DRG implementations, outlier payments cover a lower percentage of hospital costs than
standard DRG payments so high numbers of outlier stays become a burden to hospitals. One
way to solve that problem is to give these hospitals a higher base rate, which will serve to
reduce their percentage of outlier stays.
If separate base rates are selected for some groups of providers, we recommend the criteria used
to categorize hospitals within groups be very clear and maintainable. Understandably,
hospitals will be motivated to be defined into the peer group offering the most attractive
reimbursement. Having clearly defined criteria for each grouping will help maintain the
integrity of the payment policy and lessen the administrative burden of categorizing all
hospitals.
6.2.2 Provider Base Rate Categories - Recommendation
Historically, the Florida State Legislature has protected rural hospitals by mandating a higher
pay‐to‐cost ratio for these facilities. As long as that continues to be true, we recommend two
base rates, one for rural hospitals and one for all other hospitals. Other hospital categories, such
as teaching and children’s receive additional payments for their unique cost structures through
funds coming from inter‐governmental transfers. These funds and their distribution model are
not expected to change with the implementation of DRG pricing. They will continue to be the
avenue through which additional funding is provided where appropriate for categories of
hospitals other than rural hospitals. Thus, two standardized base rates should prove sufficient,
although final decisions on this topic can only be made after DRG pricing simulations are
performed.

FL AHCA DRG Project: DRG Payment Method Options – August 24, 2012 Page 38
Submitted to the Florida Agency for Health Care Administration
Typically long term acute care (LTAC) providers are given separate consideration because their
cost per discharge is generally higher (generally due to longer lengths of stay). Medicare, for
example, calculates a separate set of DRG relative weights specifically for LTACs. Medicaid
programs do not have enough LTAC volume to calculate separate DRG relative weights, and
instead we typically recommend giving LTACs a separate base rate. However, there were less
than 130 stays annually at long term acute care providers in state fiscal years 2009/2010 and
2010/2011. In addition, the highest Florida Medicaid market share of any LTAC is 6.6% and
most LTACs have a Medicaid market share below 4%. The volume is so low that the extra
complexity of calculating a separate LTAC base rate may not be worthwhile.
For all out‐of‐state hospitals, including those participating in the Florida Medicaid program, we
recommend including them in with all the hospitals receiving the non‐rural hospital
standardized base rate.
6.3 Per Diem Base Rates
6.3.1 Per Diem Base Rate - Discussion
As mentioned previously, some provider types and some types of services may be carved out of
the DRG payment method because they are more appropriately paid via another method. If
such a decision is made, the carved‐out services will presumably be paid per diem as that is the
current AHCA inpatient payment method, and per diem rates will need to be determined. The
current method used to create per diem rates may be acceptable, in which case no changes need
to be made. However, the current method may be unnecessarily cumbersome when applied to
only a relatively small subset of inpatient stays, and, if so, AHCA may want to consider
adjusting the per diem rate setting process.
Options for setting per diem base rates include setting rates based on average hospital cost per
day and using a graduated scale based on length of stay as Medicare uses for paying psychiatric
services. In addition, the availability of DRG grouping allows the option of calculating casemix
adjusted per diems, similar to the way Medicare pays for some services. Furthermore, for a
limited number of specialty services, a percent of charges (cost based) method could be
considered in place of a per diem payment method.
6.3.2 Per Diem Base Rate - Recommendation
The types of hospitals and services under consideration for remaining in a per diem payment
method are psychiatric, long term acute, and rehabilitation. Given the low volume of stays paid
to LTAC facilities by the Medicaid fee‐for‐service program, we are recommending LTAC
facilities be included in the DRG payment method. However, we expect the data will show
psychiatric and rehabilitation services are too variable to be a good fit for DRG payment
method. As a result, we are recommending psychiatric and rehabilitation services be carved
out of the DRG payment method and remain under a per diem type of reimbursement model.
However, grouping claims to DRGs to understand differences in resource requirements can add
value even in a per diem payment method. We recommend setting two standardized per diem
rates, one for psychiatric services and one for rehabilitation services, and then adjusting the per
diem rates on individual claims based on the assigned DRG’s relative weight. This allows a

FL AHCA DRG Project: DRG Payment Method Options – August 24, 2012 Page 39
Submitted to the Florida Agency for Health Care Administration
higher per diem to be determined for higher acuity patients and a lower per diem for lower
acuity patients.
In addition, similar to standardized DRG base rates, per diems can also be adjusted for labor
costs in different geographic regions. We recommend doing this. Also similar to the
recommendation for standardized DRG base rates, we recommend adjusting the per diems
using Medicare wage indices assigned using Medicare wage areas. In addition, the percentage
of costs coming from labor is typically higher in psychiatric facilities and distinct part units, so
the wage index is multiplied by 76 percent of the base rate, as opposed to the percentage
between 62 and 68.8 percent used for general acute care facilities.
Unlike the recommendations for DRG base rates, we do not recommend separate standard base
rates for rural and non‐rural facilities. This is simply because the complexity is not justified.
Florida Medicaid only pays for psychiatric services at acute care facilities, including distinct
part units. It does not pay for services at free‐standing specialty psychiatric facilities. And we
are recommending per diem payment for psychiatric services only when provided in a specialty
facility or distinct part unit. There are likely few if any rural hospitals with distinct part
psychiatric units, so calculation of a separate standardized per diem rate for this category is
unwarranted.
In contrast, free‐standing specialty rehab facilities are reimbursed by Florida Medicaid. So a
separate rural per diem rate is worthy of consideration. However, relatively few of these are
likely in rural areas, and no free‐standing specialty rehab facility in Florida has a Medicaid
market share above 10 percent. This indicates Medicaid is not a big part of the business for any
of the free‐standing specialty rehab facilities. Thus, we have the same recommendation for
rehab services – a single standardized per diem rate is sufficient.
For psychiatric services, Medicare not only adjusts the standardized per diem based on
geographic region and DRG relative weight, but also adjusts based on the length of stay (see
Table 4). This is done to account for an expectation that hospital costs per day are greater early
on in a psychiatric stay and become less as the stay gets longer. Although this expectation may
be true, we do not believe the added complexity of adjusting per diems for length of stay is
worthwhile, and do not recommend adopting this policy.

FL AHCA DRG Project: DRG Payment Method Options – August 24, 2012 Page 40
Submitted to the Florida Agency for Health Care Administration
Table 4
Medicare Per Diem Adjustment Based on Length of Stay
Day of
Patient’s Stay
Per Diem
Adjustment Factor
Day of Patient’s
Stay
Per Diem
Adjustment Factor
1 1.19 12 0.99
2 1.12 13 0.99
3 1.08 14 0.99
4 1.05 15 0.98
5 1.04 16 0.97
6 1.02 17 0.97
7 1.01 18 0.96
8 1.01 19 0.95
9 1.00 20 0.95
10 0.99 21 0.95
11 0.99 22 or more 0.92

FL AHCA DRG Project: DRG Payment Method Options – August 24, 2012 Page 41
Submitted to the Florida Agency for Health Care Administration
7 Pricing Logic
7.1 Pricing Flow
Figure 2 shows the basic flow of DRG pricing logic, which was described in more detail in
Chapter 2. DRG codes, DRG relative weights, and hospital base prices were discussed
previously in Chapters 5 and 6. The following sections of this chapter discuss the rest of the
factors involved in calculating a DRG‐based price.
7.2 Policy Adjustors
7.2.1 Policy Adjustors - Discussion
Policy adjustors are multipliers applied to specific claims for the purpose of increasing or
decreasing payment. Generally, policy adjustors are applied for specific types of care, either for
all recipients receiving that care or for subsets of recipients. Three types of policy adjustors are
commonly used:
Service adjustors
Age/service adjustors
Provider/service adjustors
Determine DRG code
Retrieve DRG relative weight ,
average length of stay and
policy adjustors
Retrieve hospital base price
Calculate base payment = [hosp
base price] * [DRG rel wt] *
[policy adjustors]
Adjust DRG base payment for
transfer status and/or partial
eligibility
Calculate outlier payment
amount
Calculate Medicaid allowed
amount = [DRG base payment]
+ [outlier amount]
Calculate reimb. amount =
[allowed amount] – [Oth ins] –
[Spend down] – [Pat Res]
Figure 2: Basic DRG pricing flow

FL AHCA DRG Project: DRG Payment Method Options – August 24, 2012 Page 42
Submitted to the Florida Agency for Health Care Administration
Policy adjustors are an optional feature that can be used to help protect access to care for
specific services. Often these are used for services where Medicaid funding can have a
significant impact on beneficiary access, such as obstetrics, newborn care, mental health and
pediatrics. The adjustors are above and beyond DRG relative weights and represent an explicit
decision to direct funds to a particular group of patients who are otherwise clinically similar.
Also, assuming a goal of budget neutrality, use of policy adjustors cause hospital base rates to
be reduced having the effect of shifting some money from one area to another. We generally
recommend including policy adjustor functionality in a DRG implementation because it creates
an ability to meet current and future Medicaid program goals by adjusting payments without
requiring significant software changes within the MMIS. However, policy adjustors do not
necessarily need to be a major contributor to overall program reimbursements. They can be
used sparingly to meet specific needs.
The first type of policy adjustor, service adjustor, works particularly well if there is a desire to
increase payment for specifically targeted services, such as obstetrical and neonatal care.
The age/service adjustor is better suited if AHCA desires to adjust payment for recipients
within specific age categories, such as adjusting all pediatric services. Age/service adjustors
provide a different payment for similar services when provided to a child versus an adult. For
example, an age/service adjustor of 1.25 on APR‐DRG 139‐1 (pneumonia severity 1) would
increase payment by 25% if the patient was a child. In contrast, an adult whose claim mapped
to APR‐DRG 139‐1 (pneumonia severity 1) would receive the DRG base payment without any
adjustment. In truth, age/service adjustors can be applied to any age range, but are typically
used by Medicaid programs to promote access for pediatric beneficiaries.
Finally, provider/service adjustors can be used to increase (or decrease) payment for specific
services when offered by specific groups of providers. For example, a Medicaid agency might
choose to increase payment for neonatal care when offered at a specialty children’s hospital
which might incur greater costs to support clinical expertise and equipment needed to treat
very sick children. In such a scenario, a provider/service adjustor could be used to increase
payment for neonatal care when provided at children’s hospitals without increasing payment
for other types of care (such as normal deliveries) at the same hospitals. (Increasing payment
for all services at a particular hospital or group of hospitals can be done by setting their base
rate appropriately and would not be done using policy adjustors.)
Within DRG pricing calculations, the adjustors affect the DRG base payment using the
following formula:
[DRG base payment] = [Hospital base rate] * [DRG relative weight]
* [Service adjustor] * [Age/service adjustor]
* [Provider/service adjustor]
For any particular service, one, two, or all three of the adjustors can be, and very commonly are,
set to 1.0, thus creating no adjustment.

FL AHCA DRG Project: DRG Payment Method Options – August 24, 2012 Page 43
Submitted to the Florida Agency for Health Care Administration
The types or categories of service for which policy adjustors are applied are identified by DRG
codes. Each DRG code is assigned a DRG relative weight and three adjustor values, service,
age, and provider. In theory, a Medicaid program could simply make adjustments to DRG
relative weights outside the MMIS and avoid putting separate adjustor fields into the MMIS.
However, this would upset the integrity of the DRG relative weights and is something we
strongly discourage. DRG relative weights are intended to indicate relative hospital resource
expenditures and patient acuity, and can be used to measure hospital casemix. Those
measurements would not be valid if the DRG relative weights were manipulated.
7.2.2 Policy Adjustors - Recommendation
Because Medicaid is a major payer for neonatal and pediatric care, we recommend policy
adjustors to increase payment for these two categories of service. The exact values for the
adjustors will be determined during the DRG payment simulations. The DRG payment
simulations will also indicate if any other policy adjustors are warranted.
7.3 Transfer Payment Adjustments
7.3.1 Transfer Payment Adjustments - Discussion
DRG payments are designed to be a single payment for a complete stay in a hospital. Given this
design, full DRG payments can be unnecessarily high if a patient is transferred from one acute
care facility to another resulting in an unusually low length of stay at the “transferring from”
hospital. To handle this situation, most Medicaid DRG implementations have followed the
Medicare model in which a payment amount is calculated using a per diem method and then
compared to the DRG base payment. The per diem payment is referred to as a transfer‐adjusted
payment amount and, if less than the DRG base payment, is used in place of the DRG base
payment. The formula used to calculate transfer‐adjusted base payment is:
Transfer adjusted base pymt = {[DRG base payment] / [DRG average length of stay]}
* {[length of stay] + 1}
Adding one to the length of stay takes into account the disproportionate amount of costs
required in the first day of admission to complete the admission process and perform an initial
diagnostic evaluation. Under this particular formula, the transfer adjusted base payment comes
out less than the DRG base payment if the length of stay is less than the DRG’s average length
of stay minus 1. Otherwise, the “transferring from” hospital receives full DRG payment.
For average length of stay data, AHCA can use arithmetic or geometric averages derived from
untrimmed or trimmed data. In addition, statewide averages can be used, or national averages
calculated using data from the Nationwide Inpatient Sample.
Transfer payment adjustments only apply to the transferring hospitals. Receiving hospitals are
paid the full DRG amount.
The transfer payment adjustment process is used when a patient is transferred from one acute
care setting to another. Transfers are identified in claims data through the discharge status and

FL AHCA DRG Project: DRG Payment Method Options – August 24, 2012 Page 44
Submitted to the Florida Agency for Health Care Administration
AHCA’s DRG payment policy will need to specify which discharge status codes apply to the
transfer payment adjustment process. Possible status codes to include are:
02 – discharged/transferred to a short‐term general hospital for inpatient care
05 – discharged/transferred to a designated cancer center or children’s hospital
07 – left against medical advice (Medicare uses this value if the patient is admitted to
another acute care hospital on the same day)
43 – discharged/transferred to a federal facility
62 – discharged/transferred to an inpatient rehabilitation facility or distinct part unit
63 – discharged/transferred to a long term care hospital
65 – discharged/transferred to a psychiatric hospital or distinct part unit
66 – discharged/transferred to a critical access hospital
AHCA may also consider a “post‐acute care transfer policy” similar to that used by Medicare.
This policy reduces payment to hospitals for a specified list of DRGs (currently 275 MS‐DRGs)
when the patient is transferred to a particular type of hospital. The need for this policy arose
from the disparate payment incentives facing acute care providers (paid per stay) and post‐
acute care providers (paid per day). For patients requiring both acute and post‐acute care (as
identified by the list of 275 MS‐DRGs, for example, hip replacement), Medicare reduces
payment to the hospital if a stay is particularly short and the patient is discharged to a post‐
acute setting. Patient discharge status codes that Medicare includes in its post‐acute care
transfer policy are:
03 – discharged/transferred to a skilled nursing facility
05 – discharged/transferred to a cancer or children’s hospital
06 – discharged/transferred to a care of a home health agency
62 – discharged/transferred to a rehabilitation facility or distinct part unit
63 – discharged/transferred to a long‐term care hospital
65 – discharged/transferred to a psychiatric hospital or distinct part unit 7
Medicare has a large enough percentage of their population fitting this scenario to justify
incurring the extra administrative complexity of this post‐acute transfer policy. Medicaid
programs have a significantly lower percentage of their populations fitting this scenario, so the
added complexity of this policy may be unwarranted.
7.3.2 Transfer Payment Adjustments - Recommendation
7.3.2.1 Acute Care Transfers
We recommend including an acute care transfer policy that reduces payment for unusually
short lengths resulting from transfer of a patient from one acute care hospital to another. Also,
we recommend using the Medicare model for calculating the transfer payment amount and
deciding when it applies. As mentioned in the previous discussion section, the transfer
payment is calculated as
7 Medicare Claims Processing Manual ‐ Chapter 3 ‐ Inpatient Hospital Billing; Rev. 2388, 01‐20‐12, 40.2.4‐C p. 123

FL AHCA DRG Project: DRG Payment Method Options – August 24, 2012 Page 45
Submitted to the Florida Agency for Health Care Administration
Transfer adjusted base pymt = {[DRG base payment] / [DRG average length of stay]}
* {[length of stay] + 1}
This formula calculates a per diem amount using the DRG base payment and average length of
stay. The “plus 1” added to the length of stay takes into account the disproportionate amount
of costs required in the first day of admission to complete the admission process and perform
an initial diagnostic evaluation. The formula effectively pays double for the first day of care.
For DRG average length of stay, we recommend staying consistent with the data used for DRG
relative weights. If national relative weights are used, then we recommend using national
average lengths of stay. If Florida Medicaid state specific relative weights are used, then Florida
Medicaid state specific average lengths of stay should also be used.
The transfer adjusted base payment is compared to the DRG base payment and the lower of the
two gets paid. The effect is to reduce payment on transfer cases only if the length of stay is less
than [average‐length‐of‐stay minus 1]. Also, this calculation applies only to the transferring
hospital. The receiving hospital is paid a full DRG reimbursement.
Acute care transfers are determined through discharge statuses reported on the UB‐04 and 837I
and payers must identify which statuses will qualify. We recommend the following statuses as
an indication of an acute care transfer as opposed to a post‐acute care transfer:
02 – discharged/transferred to a short‐term general hospital for inpatient care
05 – discharged/transferred to a designated cancer center or children’s hospital
65 – discharged/transferred to a psychiatric hospital or distinct part unit
66 – discharged/transferred to a critical access hospital
The above list does not include discharge status 07 (left against medical advice). Medicare does
include this as an acute transfer status if the patient is admitted to another Medicare DRG
hospital on the same day. In practice, we expect this occurs very rarely and the logic required
to implement this policy is difficult to install in an MMIS and is dependent on the order in
which claims are received. As a result, we do not feel it is worthwhile to include in the acute
transfer policy stays with discharge status 07 followed by an admit at another hospital on the
same day.
The above list also does not include discharge status 43 (discharged/transferred to a federal
facility) because this includes discharges to both acute care providers (i.e., a VA hospital) and
post‐acute care providers (i.e., a VA nursing facility). We suggest following Medicare’s
example in not defining this status as an acute care transfer.
The above list does include discharge statuses 05, 65, and 66 which are not included in
Medicare’s acute transfer policy. Instead, Medicare chooses to include these in its post‐acute
transfer policy because none of the receiving hospitals are DRG paid hospitals under Medicare’s
Inpatient Prospective Payment System. We prefer to think of the transfer policy as applying to
any acute care facility independent of the receiving facility’s method of reimbursement. Thus,

FL AHCA DRG Project: DRG Payment Method Options – August 24, 2012 Page 46
Submitted to the Florida Agency for Health Care Administration
even if psychiatric care is carved out of Florida Medicaid’s DRG payment method, we
recommend leaving discharge status 65 in the acute transfer policy.
Given this list, the percentage of stays expected to be considered for transfer adjustments is
approximately 2 percent, as shown in Table 5.
7.3.2.2 Post‐Acute Care Transfers
Paying rehabilitation stays via a per diem while paying other acute care stays via a DRG
method creates an opportunity for hospitals (particularly those who own a rehab center) to
maximize reimbursement by shifting patients as quickly as possible from an acute care setting
to a rehab setting. Medicare limits this opportunity through its post‐acute transfer adjustment
policy. This policy reduces payment for stays with specific DRGs that have a discharge status
indicating the patient has moved to a post‐acute setting and has a length of stay less than the
DRG’s average length of stay. We do not recommend adopting a post‐acute care transfer policy
for Florida Medicaid.
We recommend against this policy because it adversely affects one of the basic concepts of a
DRG payment method – that being the idea that DRGs pay based on average service resource
needs, while individual cases may be higher or lower than average in terms of hospital
Table 5Discharge Statuses - Fee-for-Service, SFY 10/11
Discharge Status Description Stays Days Charges Allowed Amount
Percent of Total
01 Discharged home 298,129 1,196,950 8,751,833,411$ 2,042,796,865$ 86.5%02 Discharged to another short-term general hopsital 3,702 21,000 192,907,712$ 33,914,955$ 1.1%03 Discharged to SNF 6,564 69,304 610,160,631$ 111,000,715$ 1.9%04 Discharged to an Intermediate Care Facility (ICF) 1,593 10,663 70,739,802$ 15,999,544$ 0.5%05 Dishcarged to cancer center or children's hosp 667 5,414 38,261,392$ 10,696,870$ 0.2%06 Discharged to care of home health service organization 10,460 97,256 884,865,436$ 163,517,018$ 3.0%07 Left against medical advice 6,152 17,937 162,120,956$ 27,740,598$ 1.8%09 Admitted as an inpatient to this hospital 9 76 413,215$ 104,353$ 0.0%10 Unspecified 6 11 52,603$ 11,597$ 0.0%20 Expired 3,167 32,743 499,778,666$ 56,525,691$ 0.9%21 Discharged to law enforcement / prison 194 1,008 6,979,389$ 1,616,839$ 0.1%30 Still a patient 5,594 170,297 1,539,029,301$ 366,056,011$ 1.6%40 Expired at home 13 41 235,777$ 58,561$ 0.0%41 Expired in a medical facility 5 21 250,443$ 29,878$ 0.0%43 Discharged to a federal health care facility 26 283 2,840,099$ 451,050$ 0.0%50 Discharged to Hospice - home 1,437 11,700 92,219,972$ 19,680,300$ 0.4%51 Discharged to Hospice - medical facility 1,813 18,306 184,718,752$ 29,037,098$ 0.5%61 Discharged to SNF within same institution 14 152 1,720,623$ 335,896$ 0.0%62 Discharged to inpatient rehab facility / unit of hosp 1,878 22,976 265,771,188$ 41,997,263$ 0.5%63 Discharged to long term care hospital 207 3,073 31,963,986$ 4,556,314$ 0.1%64 Discharged to a Medicaid nursing facility 183 2,022 20,328,643$ 2,506,981$ 0.1%65 Dishcarged to a psychiatric hosp or distinct part unit 2,470 10,554 71,908,587$ 15,647,053$ 0.7%66 Discharged to a critical access hospital 18 231 2,434,333$ 394,023$ 0.0%70 Discharged to another type of healthcare institution 378 2,637 19,293,060$ 4,571,431$ 0.1%71 Unspecified 1 6 84,212$ 4,317$ 0.0%
Total 344,680 1,694,661 13,450,912,189$ 2,949,251,222$ 100%

FL AHCA DRG Project: DRG Payment Method Options – August 24, 2012 Page 47
Submitted to the Florida Agency for Health Care Administration
resources used. A post‐acute care transfer policy may take away from the basic integrity of a
DRG payment method. In addition, the policy would add some complexity to the overall
payment method and would require regular updates of the list of applicable DRGs.
7.4 Partial Eligibility Payment Adjustments
7.4.1 Partial Eligibility Payment Adjustments - Discussion
As mentioned in the section on transfer claims, a DRG payment is designed to be a single
payment for a complete hospital stay. This kind of payment will be inappropriate if the
beneficiary did not have eligibility for all of the days of the stay. Having eligibility for only part
of a hospital stay is relatively rare in a Medicaid program, but can happen at times either
because a beneficiary lost or gained Medicaid eligibility during the hospital stay or shifted from
fee‐for‐service to managed care during the stay.
One option for avoiding overpaying in this scenario is to perform calculations very much the
same as those used with transfer claims. A per diem type of payment, referred to as the
eligibility‐adjusted base payment can be calculated and compared against the full DRG base
payment. If the eligibility‐adjusted base payment is less, it is used in place of the full DRG base
payment.
Another option would be to prorate the full DRG payment based on the number of days the
recipient was eligible. For example, if a recipient is Medicaid fee‐for‐service eligible for 6 days
out of a 10 day hospital stay, payment could be reduced to 60% of the full DRG payment.
7.4.2 Partial Eligibility Payment Adjustments - Recommendation
Partial eligibility scenarios exist currently under the following circumstances,
» Dual eligible recipients who exhaust Medicare coverage prior to July 1 of a year, thus
making available Medicaid coverage which replenishes at the beginning of the state
fiscal year
» Medicaid managed care recipients under the age of 21 who exhaust their HMO inpatient
benefits
» Medically needy recipients who meet their share of cost during an inpatient hospital
stay
Because these scenarios exist (and potentially others), we recommend including a partial
eligibility payment reduction policy that works much the same way as the transfer payment
policy. That is, a per diem payment is calculated and if the per diem payment is less than the
full DRG payment, the per diem payment should be used. Specifically, if the recipient is
eligible on the admit date, then the partial eligibility payment should be calculated as:
Partial eligibility base pymt = {[DRG base payment] / [DRG average length of stay]}
* {[length of stay] + 1}

FL AHCA DRG Project: DRG Payment Method Options – August 24, 2012 Page 48
Submitted to the Florida Agency for Health Care Administration
If on the other hand the recipient is not eligible on the admit date, then the partial eligibility
payment should be calculated as:
Partial eligibility base pymt = {[DRG base payment] / [DRG average length of stay]}
* [length of stay]
The partial eligibility base payment should be compared to the full DRG base payment and the
lesser of the two should be used.
7.5 Outlier Payments
7.5.1 Outlier Payments - Discussion
DRG payment methods typically include outlier provisions to adjust payment for stays that are
unpredictably expensive and sometimes for stays that are unpredictably inexpensive. The DRG
grouper is designed to predict hospital resource use so that the relative weight and therefore the
DRG base payment may be set accordingly. However, the DRG grouper is limited to using
information on medical insurance claims including principal diagnosis, procedures, age,
complications and comorbidities (identified through secondary diagnosis codes), and discharge
status. Given the tremendously wide range of cases seen in an inpatient setting, DRG grouping
does not always accurately predict hospital resource use. In those cases, where the prediction
differs significantly from reality, outlier payments are used to generate a more reasonable
reimbursement.
Most outlier cases are stays where the costs to the hospital far outweigh the payment, but the
opposite also occurs – where payment far exceeds hospital cost (which occurs most often with
patients who expire). Payers typically provide outlier payment increases to mitigate extreme
losses to hospitals, thus promoting access to inpatient care for seriously ill patients. Making
outlier payment reductions for cases of extreme hospital gain is less common, but is worthy of
consideration. Having a policy to reduce payments in cases of high hospital profit is prudent
particularly if a charge cap is not in place. In addition, it has the benefit of shifting money,
albeit a relatively small amount of money, from highly profitable stays into other stays.
Medicare and many Medicaid agencies utilize a cost‐based stop‐loss model that applies outlier
payments if the estimated loss to a hospital exceeds a dollar amount threshold. When the
threshold is exceeded, remaining costs are reimbursed at some percentage. This percentage is
referred to as a “marginal cost factor” because it is intended to cover only the marginal costs of
the additional care. These costs include only variable costs such as staffing and supplies, not
fixed costs such as buildings and equipment. Medicare’s marginal cost factor is 80 percent (90
percent for burns) and states’ values range from 50 percent to 80 percent. 8
A variety of strategies are used to set the estimated loss threshold. Medicare uses a single
threshold. California Medicaid has selected two thresholds, with one marginal cost percentage
(60 percent) used for losses between threshold 1 and threshold 2 and a second marginal cost
8 Prepared by ACS for the California Department of Health Care Services. Medi‐Cal DRG Project Draft Policy Design Document.
January 10, 2012. Page 57.

FL AHCA DRG Project: DRG Payment Method Options – August 24, 2012 Page 49
Submitted to the Florida Agency for Health Care Administration
percentage (80 percent) applied for losses above threshold 2. Other states base the outlier
threshold on the DRG relative weight, for example, Washington, DC. While other states, for
example Pennsylvania, set the outlier threshold to some percentage of the DRG base payment,
such as 150 percent.
Under the cost‐based stop‐loss outlier payment model, a method has to be selected for
determining cost‐to‐charge ratios (CCRs) for purposes of estimating hospital cost. A single
state‐wide CCR can be used, separate CCRs for each hospital can be determined – one per
hospital, or separate CCRs can be determined for each standard cost center for each hospital.
The lower level of granularity in CCRs offers greater accuracy in estimating costs, but has the
trade‐off of requiring additional effort to periodically recalculate the values.
Less commonly, outlier cases are identified by length of stay being above a threshold number of
days. For days above the threshold a per diem amount can be paid to help alleviate hospital
losses. Rhode Island, for example, uses a length of stay outlier threshold for mental health
stays. However some states, as well as Medicare, have discarded the day outlier option because
virtually all day outliers are also cost outliers – so a day outlier policy adds complexity to the
payment method without having a significant effect on overall reimbursements.
Setting outlier threshold(s) and marginal cost percentage(s) are a policy decision. Generally the
values are set so that outlier payments are within a pre‐determined range of total payments.
For example, Medicare generally aims for an outlier payment percentage between 5 and 6
percent. Medicaid programs tend to have a slightly higher percentage of high‐cost cases and
generally aim for an outlier payment percentage between 5 and 10 percent. The percentage of
payments made through outliers can be adjusted by increasing or decreasing the outlier
threshold and/or increasing or decreasing the marginal cost percentage. As previously
described in Chapter 2:
[Outlier pymt adjstmnt] = {[Hospital cost] – [DRG payment] – [Outlier threshold]}
* [Marginal cost %]
and outlier payments are only made if {[Hospital cost] – [DRG payment]} is greater than the
outlier threshold. Payment simulations can be made in which the outlier threshold and the
marginal cost percentage are adjusted until the desired outlier payment percentage is reached.
Provider base rates and policy adjustors can also be manipulated resulting in an increase or
decrease of outlier payments.
From a policy perspective outlier payments are important to ensure access to care for very high
cost cases. Providers need to know they will be compensated if they treat very sick individuals.
However, paying too much out in the form of outliers removes provider incentives to contain
costs. In addition, in a budget neutral system, an increase in reimbursements paid out as
outliers generates a reduction in provider base rates. These trade‐offs are typically balanced in
Medicaid programs by setting a target outlier payment in the range of 5 to 10 percent, and
outlier threshold and marginal cost percentage are set to hit that target.

FL AHCA DRG Project: DRG Payment Method Options – August 24, 2012 Page 50
Submitted to the Florida Agency for Health Care Administration
A completely different strategy for dealing with outlier cases is to shift them out of the DRG
payment method and pay them with some other method, such as percentage of cost or per
diem. These methods may be more amenable to hospitals, however, they remove some of the
incentives to control costs provided by a DRG payment method. They also complicate the
overall Medicaid inpatient payment method because individual providers are reimbursed using
more than one process.
7.5.2 Outlier Payments - Recommendation
For significant hospital losses on individual stays, we recommend following the Medicare stop‐
loss outlier model. The exact values for the fixed outlier threshold and the marginal cost
percentage cannot be determined until payment simulations are performed. These numbers
will be set so that the percentage of total payments made in the form of outliers is somewhere
between 5 and 10 percent. Prior to simulations, we can only speculate that the fixed outlier
threshold will likely be in the range of $25,000 to $40,000 and the marginal cost factor will likely
be in the range of 60% to 80%.
In the calculation of hospital loss, we recommend including add‐on payments which we
anticipate will be the payments from automatic and self‐funded Inter‐Governmental Transfers
(IGTs). Thus, the formula will be,
[Hospital loss] = ([Billed Charges] * [Cost to Charge Ratio])
‐ ([DRG base payment] + [Add‐on payments])
The inclusion of add‐on payments prior to the outlier calculation has been made because a
relatively high portion of hospitals’ reimbursements come from IGT funding. Without
inclusion of the add‐ons prior to calculating outliers, the number of outliers would be expected
to be unusually high. Another option to address with this scenario would be to set the outlier
threshold unusually high, thus reducing the number of claims hitting outlier status and/or set
the marginal cost percentage unusually low, thus paying less for each outlier. But either of
these options would penalize those providers who do not receive much reimbursement through
IGT‐funded payments.
We also recommend a “low‐side” or hospital gain outlier policy symmetrical with the “high
side” or hospital loss outlier policy. We recommend this in place of a charge cap policy where
Medicaid pays the lesser of allowed amount and hospital charges. We prefer a hospital gain
outlier policy in place of a charge cap because the charge cap gives a slight benefit to hospitals
who inflate their charges. In addition, we recommend the hospital loss and hospital gain outlier
policies are symmetrical simply because it makes them easier to understand, thus making them
easier to communicate and administer. Being symmetrical means the same values and logic are
used to calculate the outlier threshold, and the same values are used for marginal cost
percentage. For example, if the fixed loss outlier threshold is $30,000 then the fixed gain outlier
threshold would also be $30,000. Also, if outlier payment increases on hospital losses are made
using a 60% marginal cost factor, then payment reductions on hospital gains would also be
calculated using a 60% marginal cost factor.

FL AHCA DRG Project: DRG Payment Method Options – August 24, 2012 Page 51
Submitted to the Florida Agency for Health Care Administration
7.6 Per Claim Add-On Payments
7.6.1 Per Claim Add-On Payments - Discussion
In addition to using varying provider base rates to ensure fair payment, some DRG installations
include per‐claim add‐on payments, which can be applied for a variety of reasons. For
example, Medicare offers per‐claim add‐on payments for direct graduate medical education
costs. (Medicare also provides payment adjustments for indirect medical education costs,
capital, and disproportionate share hospitals, but these adjustments are made to the common
base rates. 9) Montana Medicaid provides separate add‐on payments for medical education,
capital, and disproportionate share payments. Similarly, Washington DC Medicaid provides
per‐claim add‐on payments for medical education and capital. Other supplemental payments
can also be distributed through add‐on payments if distribution of the funds makes sense to be
made on a per claim basis.
7.6.2 Per Claim Add-On Payments - Recommendation
The current recommendation is for payments resulting from automatic and self‐funded IGTs be
incorporated as add‐on payments and kept separate from provider base rates. This will help
distinguish payments made from each source of funding. It also takes away the need to have
separate base rates for statutory teaching, children’s, CHEP, rehabilitation and high charity
hospitals, each of which are allotted specific percentages of the automatic IGT funds.
No other add‐on payments are recommended.
7.7 Transitional Period
7.7.1 Transitional Period - Discussion
Making a change in payment method from per diem to DRGs has potential to result in
significant redistribution of funds. Even if implemented with budget neutrality, we expect
some hospitals will receive higher payments under the new DRG method (when compared to
legacy system payments) and some hospitals will receive lower payments. A transition period
can be implemented to give hospitals time to adapt to these changes in funding levels. Also, the
transition can be applied to all hospitals or only to hospitals with particularly significant
changes in overall Medicaid inpatient reimbursement. Medicare, for example, commonly uses a
four year transition period when making significant changes to its payment methodology.
Medicaid programs, New York for example, have also utilized transition periods. On the other
hand, some states, like Pennsylvania, provided no phase‐in or transitional period.
A variety of methods can be devised to implement a transition period. Medicare and New York
Medicaid often use a linear phased‐in approach where payment is calculated the old way and
the new way and a percentage of each is used to determine actual reimbursement. The linear
phase‐in approach is illustrated in the following table:
9 Medicare Learning Network (MLN), Acute Care Hospital Inpatient Prospective Payment System – Payment System Fact Sheet, ICN
006815, February 2012.

FL AHCA DRG Project: DRG Payment Method Options – August 24, 2012 Page 52
Submitted to the Florida Agency for Health Care Administration
Table 6
Linear Phase‐In of a New Payment Method
Implementation
Year
Percentage of
Reimbursement from Legacy
Payment Method
Percentage of
Reimbursement from New
Payment Method
1 75% 25%
2 50% 50%
3 25% 75%
4 0% 100%
Although conceptually very straight forward, we consider calculation of payment of the legacy
and new method to be a less attractive option because it is very complicated to implement in the
MMIS. Also, it clouds the incentives to improve efficiency since the previous AHCA payment
method potentially rewards longer lengths of stay while the new DRG payment method
potentially rewards shorter lengths of stay.
To simplify implementation in the MMIS, we generally recommend a transition process in
which the hospital DRG base rates are adjusted to meet the transition goals. The calculation of
hospital base rates can be performed outside the MMIS, requiring only a load of new base rates
yearly through the transition time period.
As another example, California Medicaid (Medi‐Cal) decided the linear phase‐in approach
created too much of a change year‐to‐year in hospital reimbursement, producing too great a
burden on those hospitals expected to receive significant reimbursement shifts. As such they
decided to limit the projected change in reimbursement to 5 percent each year for the first three
years, then shift to full, unadjusted DRG payment in year 4. For example, a hospital projected
to receive a 28 percent reduction in Medicaid reimbursement would get their base rate adjusted
so that the projection is no more than a 5 percent change in year 1, no more than a 10 percent
change in year 2, no more than a 15 percent change in year 3, and a full 28 percent change in
year 4. Medi‐Cal felt this gave hospitals more time to react to the new DRG payment method.
During the phase‐in period, hospitals would have the opportunity to improve documentation
and coding, if needed, and to make decisions on service offerings.
Medi‐Cal is also an example program planning to proceed with the method of controlling the
transition period through use of hospital‐specific DRG base rates. These rates get set using the
historical dataset from which DRG pricing simulations are run. The simulations provide
prediction of future hospital reimbursement under the assumption that Medicaid volume and
patient acuity at a hospital remain unchanged. If actual volume or patient acuity at a particular
hospital happens to change, then actual payments will adjust accordingly. As mentioned
previously, the bulk of the payment on any given claim comes from the simple multiplication of
[hospital base rate] times [DRG relative weight]. If the number of claims (patient volume)
changes or the casemix (average DRG relative weight) changes at a hospital, then actual
payment will automatically change accordingly.

FL AHCA DRG Project: DRG Payment Method Options – August 24, 2012 Page 53
Submitted to the Florida Agency for Health Care Administration
Of course, when reviewing the projected change in Medicaid inpatient reimbursement for
individual hospitals, it’s helpful to know the percentage of each hospital’s revenue coming from
Medicaid. A 20 percent change in Medicaid revenue has significantly more impact to a hospital
with half of its business coming from Medicaid versus a hospital with a tenth of its business
coming from Medicaid.
7.7.2 Transitional Period - Recommendation
Transition periods may be appropriate if the change in the payment model will create
significant changes in Medicaid reimbursement to individual hospitals. Also the length of the
transition should be proportionate to the size of the reimbursement change – greater
reimbursement changes justify longer transition periods.
Experience in other states has shown that a move from a per diem payment method to a DRG
payment method will generate sufficient changes in hospital Medicaid reimbursement to justify
a transition period. However, Florida Medicaid inpatient reimbursements have a major
component coming from IGT funds, which will be largely unaffected by the shift to DRG
payments. As such, the impact resulting from a new DRG model on Florida hospitals may not
prove as significant as seen in some other states that converted from per diem payments to DRG
payments. DRG pricing simulations will be needed to create a clear picture of the magnitude of
this change for Florida hospitals.
Prior to running DRG pricing simulations, we will make the assumption that there will be a
need for some sort of transition period so that we will be prepare to recommend such an
implementation option should it be warranted. If in fact it proves warranted, we will likely
recommend a transition period somewhere between one and four years in length.
If a relatively long transition period proves to be warranted, then we prefer the model devised
by the California Medicaid agency. In the Medi‐Cal model, gains or losses in annual Medicaid
reimbursement are held relatively small for the first three years (no more than 5% each year, for
a maximum of 15% at the end of year three). This is followed by full implementation of the new
DRG payment method in year four in which any remaining adjustment in reimbursement to
individual hospitals is applied. This model provides hospitals more time to adjust to the new
payment levels while experiencing limited payment changes in the first few years of
implementation.
Logistically, we recommend implementing the transition period by calculating base rates that
enable total Medicaid reimbursement to hit specific target values for each individual hospital.
We find this method significantly less complicated than blending of payments calculated using
the legacy payment method (per diem) and the new payment method (DRGs). We find it is also
simpler than blending DRG base rates calculated using historical payment levels and projected
new payment levels.

FL AHCA DRG Project: DRG Payment Method Options – August 24, 2012 Page 54
Submitted to the Florida Agency for Health Care Administration
7.8 Documentation and Coding Adjustment
7.8.1 Documentation and Coding Adjustment - Discussion
Under a DRG payment method, overall casemix has a significant impact on overall Medicaid
payments. This can be seen when looking at the DRG base payment formula:
[DRG Base Payment] = [Hospital base rate] * [DRG relative weight] * [Policy adjustor(s)]
Overall casemix equals the average DRG relative weight from all inpatient claims paid via
DRGs. Assuming limited use of policy adjustors, aggregate Medicaid inpatient spending can be
roughly estimated as
[Total inpatient payments] = [Average hospital base rate] * [Overall casemix]
Actual spending in a DRG payment method is also affected by policy adjustors, outlier
payments, and transfer and partial eligibility adjustments. But these additional factors all have
a relatively small impact on overall spending. The bulk of the spending comes from hospital
base rates and casemix, making it important to estimate these values carefully and to monitor
them through the first few years of a DRG payment implementation.
Overall casemix is expected to increase between the historical claims used for DRG payment
simulations and the claims paid during the first couple of years of DRG implementation. The
primary reason for increased casemix is expected to result from increased numbers of diagnosis
and procedure codes on inpatient claims. The increase in number of codes is referred to as
documentation and coding improvement, and is an appropriate and necessary response by
providers to the implementation of a DRG payment method. The new method puts increased
value on claim documentation compared to the legacy per diem payment method. These
changes in casemix are not actual changes in patient acuity, but changes resulting from
improved reporting/billing. In addition, a smaller amount of casemix increase is expected
between the simulation dataset and production claims because of true increases in overall
casemix. Overall casemix tends to increase each year because of ongoing improvements in
medical technology and because of shifts of care of relatively low acuity patients to the
outpatient setting.
As a result, AHCA may decide to incorporate a documentation and coding adjustment that
reduces the DRG base price in anticipation of casemix increases. This type of payment
adjustment is necessary to hit budget targets and is consistent with other state Medicaid
implementations of DRGs and with Medicare’s move from CMS‐DRGs to MS‐DRGs. The first
challenge for AHCA is to determine how much of a casemix increase to expect between the data
used for DRG payment simulation and the first year of claims processed for payment using
DRGs. The second challenge involves devising an adjustment plan if the predicted increase in
casemix proves inaccurate. Nearly all stakeholders will agree there will be some increase in
casemix, however few will agree on the magnitude. And no definitive method exists for
conclusively predicting casemix change. As such, a strategy for adjusting payment parameters
based on actual casemix numbers is a necessity.

FL AHCA DRG Project: DRG Payment Method Options – August 24, 2012 Page 55
Submitted to the Florida Agency for Health Care Administration
Medi‐Cal for example, has a tentative plan of estimating a 2.5 percent increase in casemix from
documentation and coding improvement as well as a 2 percent increase in casemix for the four
years between its DRG pricing simulation dataset (2009) and its first year of DRG payment
(2013). Given a casemix of 0.61 in its DRG pricing simulation dataset (using APR‐DRG
grouping) this means Medi‐Cal is predicting casemix in the first year of DRG payment to be
0.6375 (0.61 * 104.5%).
As another example, Illinois Medicaid is expecting a casemix increase of 0.8 percent per year for
the years between the DRG pricing simulation dataset and the first year of production DRG
payments. This 0.8 percent per year is for actual increase in casemix and is based on analysis of
four years of historical Illinois Medicaid claims. This increase totals 3.2 percent as there are four
years between the simulation dataset (2009) and the first year of production, 2013. In addition,
Illinois is anticipating up to a 5 percent increase in overall casemix from improved
documentation and coding. The net result is hospital base payments will be set 8.32 percent
lower in anticipation of casemix increase. Illinois Medicaid is also considering a strategy of
“holding back” the 5 percent in anticipation of improved documentation and coding adjustable
based on actual results in the first year of DRG payment.
Using casemix numbers for 2009 centered at 1.0, this means Illinois is expecting the casemix
during the first year of DRG payment, 2013, to be somewhere between 1.032 and 1.082. This is
depicted in the following chart, with the first 3.2 percent change referred to as “expected” and
the following 5% change referred to as the “corridor.”
Based on this strategy (which is still in the development stages), if the overall casemix in 2013
comes out less than 1.032, the full 5 percent of payments withheld for improved documentation
and coding will be reimbursed back to hospitals. On the other hand, if actual casemix in 2013 is
greater than “expected”, but falls within the “corridor”, Illinois will return an appropriate
portion of the money set‐aside for the casemix corridor. Finally, if actual casemix in 2013 is
0.950
1.000
1.050
1.100
2009 2010 2011 2012 2013 2014 2015
Casemix
Year
Figure 3: Illinois Casemix Increase Strategy
Casemix Corridor
Expected Casemix

FL AHCA DRG Project: DRG Payment Method Options – August 24, 2012 Page 56
Submitted to the Florida Agency for Health Care Administration
greater than the combined “expected” and “corridor,” Illinois will retain the full set‐aside
amount as that amount will have been fully absorbed through aggregate casemix increases.
Actual casemix changes that fall outside of the “corridor” may also trigger “re‐centering” of the
relative weights to prevent significant overpayments in future periods.
Pennsylvania implemented a transition strategy, similar to that under consideration in Illinois,
with one key difference; adjustments for changes outside of the expected range are made
prospectively. In other words, the Commonwealth is at risk for higher payments resulting from
casemix increases above the threshold for a full year before adjustments to the weights are
made.
7.8.2 Documentation and Coding Adjustment – Recommendation
Experience with Medicare and several state Medicaid programs has shown there is both actual
casemix increases each year and casemix increases due to changes in claim documentation and
coding when a new DRG payment method is implemented. In some cases, the documentation
and coding changes are improvements resulting from implementation of more thorough
processes and in other cases they are simply adjustments in coding to better align with the
codes given priority by the DRG grouping algorithm. For example, the MS‐DRG grouper does
not put an emphasis on birth weight, but the APR‐DRG grouper does. As such, hospitals
become more consistent with their coding of birth weight when a payer shifts from MS‐DRG
grouping to APR‐DRG grouping.
As a result, we recommend planning for an increase in casemix between the dataset used for
DRG pricing simulations (which will contain historical claims from state fiscal year 2010/2011)
and the claims received during first year of DRG payment. In addition, we believe the model
planned for the Illinois conversion is the best for limiting risk to both the State and the hospitals.
In this model, a yearly amount of actual casemix increase is estimated using historical data. In
addition, an amount of casemix increase from documentation and coding improvements is
estimated and reimbursement covering that increase in casemix is held aside in a way that is
akin to escrow. If the casemix increase turns out to be less than the estimated and set‐aside
amount, then an appropriate amount of the money held in reserve gets distributed back to the
hospitals. If the casemix increase turns out greater than, the estimate then the money held in
reserve would have been fully consumed through payments on individual claims.
7.9 Interim Claims and Late Charges
7.9.1 Interim Claims and Late Charges – Discussion
DRG payments are designed to be single payments for complete hospital stays. Thus, a final
DRG payment cannot be made until the patient is discharged. For most hospital stays, that is
perfectly acceptable to both the provider and the Medicaid agency. However, for very long
stays, waiting until discharge for payment from Medicaid can cause cash flow challenges for
hospitals. This can be solved by allowing interim billing and payment. Unfortunately,
generating final payment for a hospital stay after interim payments have been made is an
extremely challenging task to implement in an MMIS. As a result, decisions related to interim
claim payments are an important part of a DRG payment policy despite the fact that they affect
a relatively small percentage of overall stays.

FL AHCA DRG Project: DRG Payment Method Options – August 24, 2012 Page 57
Submitted to the Florida Agency for Health Care Administration
One option is to disallow all interim claims and put the onus on hospitals to manage their cash
flow. If instead, AHCA decides to allow interim payments, then a series of design decisions
must be made. First, the threshold minimum number of days per interim claim must be
decided – most states have selected 30 days. Next the method of payment for interim claims
must be determined. Per diem payment is the most common option, and if per diem is used
then a per diem amount needs to be selected. The amount should be set low enough so that
interim claim payment is rarely, if ever greater than the full DRG payment. If the interim
payment(s) are greater than the full DRG payment, then hospitals will have no incentive to
submit a final bill when the patient is discharged. Finally the payment policy must include a
method for making final payment. When the final claim is submitted, many states have chosen
to void all interim claims, thus taking back the money paid out on the interim claims, and then
pay the full DRG payment on the final claim. With this solution, decisions must be made either
to give hospitals the responsibility to submit voids for all the interim claims, or systematically
void all the interim claims, or suspend the final claim and require manual void of all interim
claims. Once all the interim claims are voided, the final claim can be paid. Another option is to
adjust reimbursement on the final claim down by the amount already paid out on interim
claims. However, there is risk that the interim payment(s) turn out to be more than the final
DRG payment, which would be extremely problematic under this option because the payment
amount on the final claim would be negative.
Late charges (claims with bill type 115) are also problematic in a DRG payment method. To
accurately calculate DRG payment, including outlier payments, all charges for the hospital stay
need to be submitted on a single claim. For this reason, late charges are typically not accepted
by Medicaid agencies paying via DRGs.
7.9.2 Interim Claims and Late Charges – Recommendation
Because of the very tight implementation timelines, we recommend disallowing payment on
interim claims, asking hospitals instead to manage their cash flow. However, if AHCA feels
strongly that late charges need to be accepted, then we recommend requiring the length of stay
to be at least 30 days on each interim claim. We also recommend setting the interim claim per
diem rate relatively low, such as $400 or $500 so that hospitals have an incentive to submit a
final claim after the patient is discharged.
In addition, we also recommend against accepting claims for late charges. The decision on late
charges is independent of the decision on interim claims, and we believe late charges should be
disallowed even if the final policy design includes acceptance of some interim claims.
7.10 Charge Cap
7.10.1 Charge Cap – Discussion
Medicaid programs, like most payers traditionally have a charge cap in place which ensures
payment on individual claims equals the lessor of the Medicaid allowable payment and the
provider’s submitted charges. AHCA will need to decide if a charge cap should be put in place
for claims priced via the new DRG method. Because DRGs are a prospective payment based off
of averages of hospital resource usage (recorded in the form of DRG relative weights), the actual

FL AHCA DRG Project: DRG Payment Method Options – August 24, 2012 Page 58
Submitted to the Florida Agency for Health Care Administration
payment for an individual stay may be above or below hospital costs and could possibly even
be above hospital charges. The general strategy with DRG payments is that payments will over
time average out to hit Medicaid’s desired pay‐to‐cost ratio even though payments on
individual claims may be above or below this ratio. Applying a charge cap can get in the way
of this basic strategy, so it is worthwhile to consider excluding the charge cap logic from claims
paid via DRGs. In addition, instituting a charge cap on DRG claims has potential to negatively
impact providers who are doing a good job of aligning charges with costs. Charge caps have
the effect of rewarding hospitals who inflate charges well above costs, which is not necessarily a
behavior worthy of reward.
If AHCA decides to exclude charge caps on DRG priced claims, then we more strongly
recommend instituting a hospital gain cost outlier policy. If on the other hand, AHCA decides
to apply a charge cap to DRG priced claims, then the need for a hospital gain outlier policy is
diminished.
7.10.2 Charge Cap – Recommendation
We recommend a hospital gain outlier policy in place of a charge cap. However, if AHCA
chooses not to implement a hospital gain outlier policy, then we strongly recommend a charge
cap be included with the DRG payment logic. In one form or another, we believe AHCA needs
to have a policy that avoids gross overpayments for individual stays. Further, is important to
note that the risk of large over payments is greater under a DRG, per‐discharge payment system
than under a per diem system.
7.11 Medicare Crossover Comparison Pricing
7.11.1 Medicare Crossover Comparison Pricing – Discussion
Many Medicaid programs have implemented Medicare crossover comparison pricing logic.
This logic is applied specifically to Medicare crossover claims and compares the Medicare
allowed amount to the Medicaid allowed amount. It then sets Medicaid reimbursement
amount so that the total provider reimbursement, combining Medicare and Medicaid payments,
reaches the lower of the two allowed amounts. If AHCA uses this kind of pricing logic, then
Medicare crossover claims will need to be processed through the new DRG pricing method so
that a DRG‐based Medicaid allowed amount can be determined.
7.11.2 Medicare Crossover Comparison Pricing – Recommendation
We recommend including Medicare/Medicaid comparison logic, ensuring total payment is the
lesser of the Medicare allowed amount and the Medicaid allowed amount. For this to occur,
DRG pricing should be performed on Part A crossover claims to determine the Medicaid
allowed amount.
8 Specifics for Florida Medicaid
8.1 Budget Neutrality
The implementation of DRG pricing is intended to be budget neutral across the entire Medicaid
program. That is, the total Medicaid expenditures in the first year of DRG payment are

FL AHCA DRG Project: DRG Payment Method Options – August 24, 2012 Page 59
Submitted to the Florida Agency for Health Care Administration
intended to equal the total expenditures from the previous year, except for standard
adjustments made for inflation and fee for service eligibility changes. Reaching budget
neutrality at the program level will not ensure neutrality for individual hospitals. Some
hospitals will see overall Medicaid revenue increase with DRG payments while others will see
revenues decrease.
DRG payment simulations will be performed using historical Florida Medicaid fee‐for‐service
inpatient claims from state fiscal year 2010/2011. Base rates, policy adjustors, outlier parameters
and so forth will be determined to reach the same total Medicaid reimbursement via DRGs as
was actually paid on these claims using the current payment method. This will allow
predictions of how the DRG payments will reimburse individual hospitals, categories of
hospitals, and categories of care in the future. Final base rates, adjustors, etc., to be used in
production when DRG pricing first goes live will be adjusted and/or recalculated based on
actual budget numbers planned for state fiscal year 2013/ 2014 (the first year DRG pricing is
expected to be live).
Separate budget values will be determined for each category of hospitals receiving their own
standardized base rate. Under our preliminary recommendations, there are only two categories
– rural hospitals and all other hospitals. In addition, separate budget figures will be identified
for services that are carved out of the DRG payment method and remain in some form of per
diem payment method. Under current recommendations, the services carved out of DRG
payment are psychiatric and rehabilitation services. We recommend setting the initial budget
values for these two types of service to amounts that keep the pay‐to‐cost ratios the same for
these services and for all the services being reimbursed via DRGs.
8.2 Interaction of DRG Payment and IGT Funding
It is our understanding that the only way in which the DRG payment method may affect IGT
funding is related to the limits on amounts providers and local governments can contribute.
CMS will only provide federal matching funds up to certain limits. The limits are related to
total reimbursements to hospitals. If individual hospitals receive more money through DRG
payments than through historical per diem payments, then the amount they can receive from
IGT funds (which will be eligible for federal matching dollars) will go down, thus their
contributions to IGTs will go down. Of course, the opposite is also true. Individual hospitals
that receive less money through DRG payments than historical payments will be able to receive
more from IGT funds and will have the option to contribute more in the form of IGTs.
We won’t be able to predict the changes in Medicaid reimbursement for individual hospitals
until we begin payment simulations. When that occurs we will pay particular attention to the
reimbursement changes for those entities that have historically been major contributors of IGT
funds.
8.3 Interaction of DRG Payment and IGT Funding
The current plan is to determine DRG base rates using only funds from general revenue and the
PMATF. Payments from funds originating from IGTs that are paid out on individual claims
will be included as add‐on payments, separate from the DRG base payment. We recommend,

FL AHCA DRG Project: DRG Payment Method Options – August 24, 2012 Page 60
Submitted to the Florida Agency for Health Care Administration
however, that the add‐on payments be included before calculation of DRG outlier payments,
otherwise an unusually high percentage of claims are likely going to reach outlier status.
8.4 Recipient Out of Pocket Expenses
Policies related to recipient out of pocket expenses will be unaffected by the transition to DRG
pricing for inpatient fee‐for‐service stays.
8.5 45-Day Benefit Limit
The 45‐day limit is an existing AHCA policy that limits Medicaid benefits to adults to 45 days in
an inpatient setting each state fiscal year. The day limit does not apply to recipients under the
age of 21. This policy is easily implemented in the current per diem pricing method, but is more
challenging to implement in a DRG methodology. Under a DRG methodology, partial
eligibility scenarios will be created each time a recipient reaches the 45 day limit in the middle
of a hospital stay. To avoid numerous partial eligibility claims, we recommend changing the
policy so that it is enforced only at the beginning of each hospital stay. Under this
recommendation, any recipient admitted prior to reaching the 45‐day limit would receive
Medicaid benefits for the entire hospital stay. Only for new hospital stays begun after a
recipient has reached the 45‐day limit would benefits be denied.
8.5 Effect of Transition to Managed Care
The planned move of Florida Medicaid recipients to managed care has relatively little effect on
the DRG payment method and vice versa. There will always be some services paid via
Medicaid fee‐for‐service, and DRG payment will be the method for reimbursing those services
when performed in an inpatient setting. DRG payment parameters such as policy adjustors and
outlier values should be reviewed each year under normal course of events. This review should
include only recipients and types of stays that are expected to be in fee‐for‐service in the
following year. Also, as the volume of fee‐for‐service claims gets smaller, encounter claims or
all‐payer claims may need to be included in the calculation of DRG relative weights if state‐
specific relative weights are used.
Managed care plans may choose to adopt DRG payment. In general, we believe DRG payment
is the best method currently available for reimbursing most inpatient acute care stays. In
addition, there may be a policy or expectation that managed care plans pay hospitals at a level
similar to what Medicaid fee‐for‐service would have paid. As such, we would expect that
managed care plans would consider DRG reimbursement.
8.6 County Billing
AHCA currently relies on contributions from the counties for a portion of reimbursement for
hospital stays in excess of a specified number of days. The amount paid by the counties is made
in the form of a per diem amount, referred to as the county billing rate. Under the new DRG
per discharge payment model, a new method will need to be identified for determining the
counties’ obligation under this program.

FL AHCA DRG Project: DRG Payment Method Options – August 24, 2012 Page 61
Submitted to the Florida Agency for Health Care Administration
Conclusion
A variety of decisions need to be made when developing a DRG payment method. This
document strives to give a comprehensive list of those decisions and offers criteria against
which the decisions can be evaluated.
In the initial version of this options document, recommendations for the various decisions were
left blank. As the project progresses, a combination of review of AHCA goals, the current
payment method, and simulations of the new DRG payment method will be used to make
recommendations on each decision. When completed, AHCA will be well on its way to
defining its new inpatient pricing methodology.

FL AHCA DRG Project: DRG Payment Method Options – August 24, 2012 Page 62
Submitted to the Florida Agency for Health Care Administration
Appendices
Appendix A – Summary DRG Payment Method Options
The following table summarizes the payment method options described in this document.
Appendix A
Summary of DRG Payment Method Options
Decision Point Options / Comments Recommendation
3.1. Affected Providers
Stand‐alone facilities
General acute care
Physical rehabilitation
Long term acute care
Mental health and substance abuse
facilities
Critical access / rural hospitals
Children’s hospitals
Cancer hospitals
Federally Qualified Health Centers
Rural Health Clinics
In‐state / out‐of‐state / border hospitals
Native American Indian hospitals
Public hospitals
Include or exclude in DRG payment Include the following hospitals in the DRG
payment method:
General acute care
Long term acute care
Critical access / rural hospitals
Children’s hospitals
Cancer hospitals
In‐state / out‐of‐state / border hospitals
Teaching hospitals
Distinct part units
Physical rehabilitation
Long term acute care
Mental health and substance abuse
Include or exclude in DRG payment Include long‐term acute care distinct part units
in the DRG payment method.
3.2. Affected Services
Physical rehabilitation Include or exclude in DRG payment Include physical rehabilitation and mental

FL AHCA DRG Project: DRG Payment Method Options – August 24, 2012 Page 63
Submitted to the Florida Agency for Health Care Administration
Appendix A
Summary of DRG Payment Method Options
Decision Point Options / Comments Recommendation
Mental health and substance abuse
Unpredictable and expensive services and
supplies such as blood factors and organ
search and acquisition
New technologies
health services in DRG payment only when
performed in a general acute care setting, not
when performed in a free‐standing specialty
facility or distinct part unit.
Always include substance abuse services in
DRG payment
Allow separate payment only for a very
select list of procedures/services – initially
recommending only blood factors as
separately payable
No separate payments for new technologies
3.3. Affected Beneficiaries / Medicaid Programs
Fee‐for‐service
Primary care case management
Managed care
CHIP
Waiver programs
Dual eligible (Medicare and Medicaid)
Include or exclude in DRG payment Include
Fee‐for‐service
Dual eligible (Medicare and Medicaid)
3.4. Prior authorizations
Authorize length of stay
Change concurrent review
Change focus of post‐payment review
Yes/no/sometimes
Currently based on length of stay
No, not on claims paid via DRG
Yes if a more applicable method can be
identified Yes
4. Cost Estimation
Aggregate CCR methodology
Detailed line‐level methodology
Select costing methodology. Note that both
options provide reasonable estimates.
Use detailed line‐level cost measurements for
analysis of the DRG payment method and a
single aggregate CCR (the Medicare value where

FL AHCA DRG Project: DRG Payment Method Options – August 24, 2012 Page 64
Submitted to the Florida Agency for Health Care Administration
Appendix A
Summary of DRG Payment Method Options
Decision Point Options / Comments Recommendation
available) for each hospital in the claim outlier
calculations
5. DRG Grouping
DRG Grouper
APR (all patient refined)
MS (medical severity)
APS (all‐payer severity‐adjusted)
Select a grouping algorithm APR
Source of DRG relative weights and average
length of stay
Options are,
National all‐payer values
State Medicaid‐specific values
Values borrowed from another state
National all‐payer values
If state‐Medicaid‐specific values are created …
Basis for the weights Hospital charges or estimated cost Estimated cost
Method for estimating costs (if costs are the bases
for the weights)
See decision point 4. Cost Estimation above. Detailed line‐level cost measurements
Determination of values for stays with statistically
low numbers of occurrences
Use national weights and lengths of stays or
prorate values from similar DRGs
Prorate from similar DRGs
6. Provider Base Rates
Number of common (a.k.a. standard) base rates Generally one or very few common base rates are
used. If more than one is used, the different
values are typically used for different categories
of providers.
Two standardized base rates – one for rural
hospitals, one for all other hospitals
Geographic base rate adjustments Apply or forego geographic base rate adjustments Yes include geographic base rate adjustments
If geographic base rate adjustments are applied,
define geographic regions
Options are,
Medicare wage areas
State counties
Any other state designator of geographic
regions
Use Medicare wage areas and wage area
assignments, including re‐classifications
If geographic base rate adjustments are applied,
define the adjustment factor per region
Wage indices are available with Medicare wage
areas. If some other method is used to define
Use Medicare wage indices
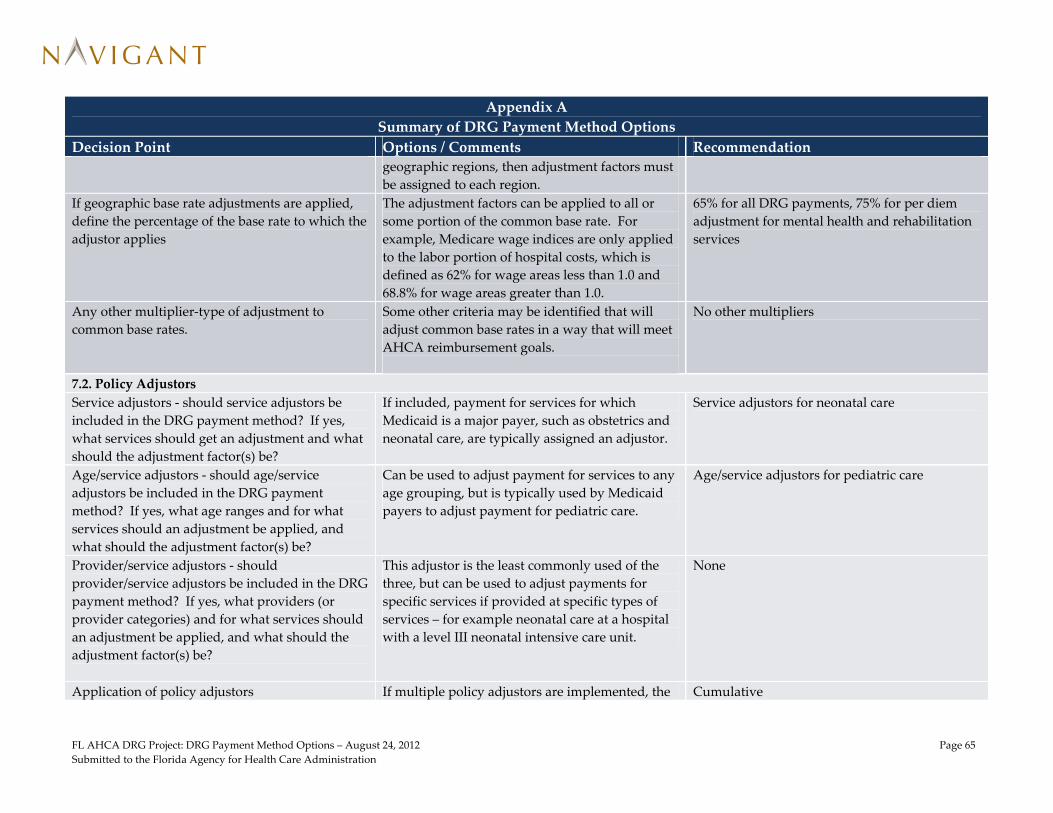
FL AHCA DRG Project: DRG Payment Method Options – August 24, 2012 Page 65
Submitted to the Florida Agency for Health Care Administration
Appendix A
Summary of DRG Payment Method Options
Decision Point Options / Comments Recommendation
geographic regions, then adjustment factors must
be assigned to each region.
If geographic base rate adjustments are applied,
define the percentage of the base rate to which the
adjustor applies
The adjustment factors can be applied to all or
some portion of the common base rate. For
example, Medicare wage indices are only applied
to the labor portion of hospital costs, which is
defined as 62% for wage areas less than 1.0 and
68.8% for wage areas greater than 1.0.
65% for all DRG payments, 75% for per diem
adjustment for mental health and rehabilitation
services
Any other multiplier‐type of adjustment to
common base rates.
Some other criteria may be identified that will
adjust common base rates in a way that will meet
AHCA reimbursement goals.
No other multipliers
7.2. Policy Adjustors
Service adjustors ‐ should service adjustors be
included in the DRG payment method? If yes,
what services should get an adjustment and what
should the adjustment factor(s) be?
If included, payment for services for which
Medicaid is a major payer, such as obstetrics and
neonatal care, are typically assigned an adjustor.
Service adjustors for neonatal care
Age/service adjustors ‐ should age/service
adjustors be included in the DRG payment
method? If yes, what age ranges and for what
services should an adjustment be applied, and
what should the adjustment factor(s) be?
Can be used to adjust payment for services to any
age grouping, but is typically used by Medicaid
payers to adjust payment for pediatric care.
Age/service adjustors for pediatric care
Provider/service adjustors ‐ should
provider/service adjustors be included in the DRG
payment method? If yes, what providers (or
provider categories) and for what services should
an adjustment be applied, and what should the
adjustment factor(s) be?
This adjustor is the least commonly used of the
three, but can be used to adjust payments for
specific services if provided at specific types of
services – for example neonatal care at a hospital
with a level III neonatal intensive care unit.
None
Application of policy adjustors If multiple policy adjustors are implemented, the Cumulative

FL AHCA DRG Project: DRG Payment Method Options – August 24, 2012 Page 66
Submitted to the Florida Agency for Health Care Administration
Appendix A
Summary of DRG Payment Method Options
Decision Point Options / Comments Recommendation
adjustors can either be cumulative (multiple
adjustors applied to the same claim, when
appropriate), or hierarchical in which case only
one adjustor (possibly the largest one) gets
applied to a claim.
7.3. Transfer Payment Adjustments
What patient discharge statuses should be used
for acute‐to‐acute hospital transfers
Options are:
02 – discharged/transferred to a short‐term
general hospital for inpatient care
05 – discharged/transferred to a designated
cancer center or children’s hospital
07 – left against medical advice (Medicare uses
this value if the patient is admitted to
another acute care hospital on the same
day)
43 – discharged/transferred to a federal facility
62 – discharged/transferred to an inpatient
rehabilitation facility or distinct part unit
63 – discharged/transferred to a long term care
hospital
65 – discharged/transferred to a psychiatric
hospital or distinct part unit
66 – discharged/transferred to a critical access
hospital
02, 05, 65, 66
Should there be an acute‐to‐post‐acute care
transfer payment adjustment? If yes, for which
patient discharge statuses should the adjustment
apply?
If a post‐acute care transfer policy is
implemented, options for applicable patient
discharge statues are:
03 – skilled nursing facility
05 – cancer/children
No post‐acute transfer policy. But if one is
implemented, use statuses 03, 06, 43, 62, and 63

FL AHCA DRG Project: DRG Payment Method Options – August 24, 2012 Page 67
Submitted to the Florida Agency for Health Care Administration
Appendix A
Summary of DRG Payment Method Options
Decision Point Options / Comments Recommendation
06 – home health
43 – federal facility
62 – rehabilitation
63 – long‐term care hospital
65 – psychiatric
What should the transfer claim payment
adjustment formula be?
Medicare and several states use the following
formula:
Transfer‐adjusted base payment = {[DRG base
payment] / [DRG average length of stay]} *
{[length of stay] + 1}
Medicare formula
7.4. Partial Eligibility Adjustments
Do partial eligibility scenarios occur enough to
justify a partial eligibility payment adjustment?
Include or forego a partial eligibility payment
adjustment calculation.
Include a partial eligibility payment adjustment
If a partial eligibility payment adjustment is
included, what should the formula be?
A formula similar to the transfer payment
adjustment formula makes sense. However, the
“+ 1” for day of admission could be dropped.
Add 1 day to the length of stay if the recipient is
eligible on the date of admission, otherwise do
not add the additional day
7.5. Outliers
How to pay outlier claims DRG with outlier (stop loss model) or another
method such as percentage of charges
Stop loss model with a single threshold
Loss and/or gain Pay outliers only for cases of extreme hospital loss
or for both cases of loss and gain
Symmetrical outlier policy for both hospital
losses and gains
Size of outlier pool Set targeted percentage of payments made via
outliers
Medicaid agencies generally have an outlier pools
between 5 and 10 percent. In FY 2012, Medicare is
aiming for an outlier pool of 5.1 percent of total
IPPS payments.10
Between 5 and 10 percent
If using stop‐loss model …
10 Medicare Learning Network (MLN), Acute Care Hospital Inpatient Prospective Payment System – Payment System Fact Sheet, ICN 006815, February 2012.
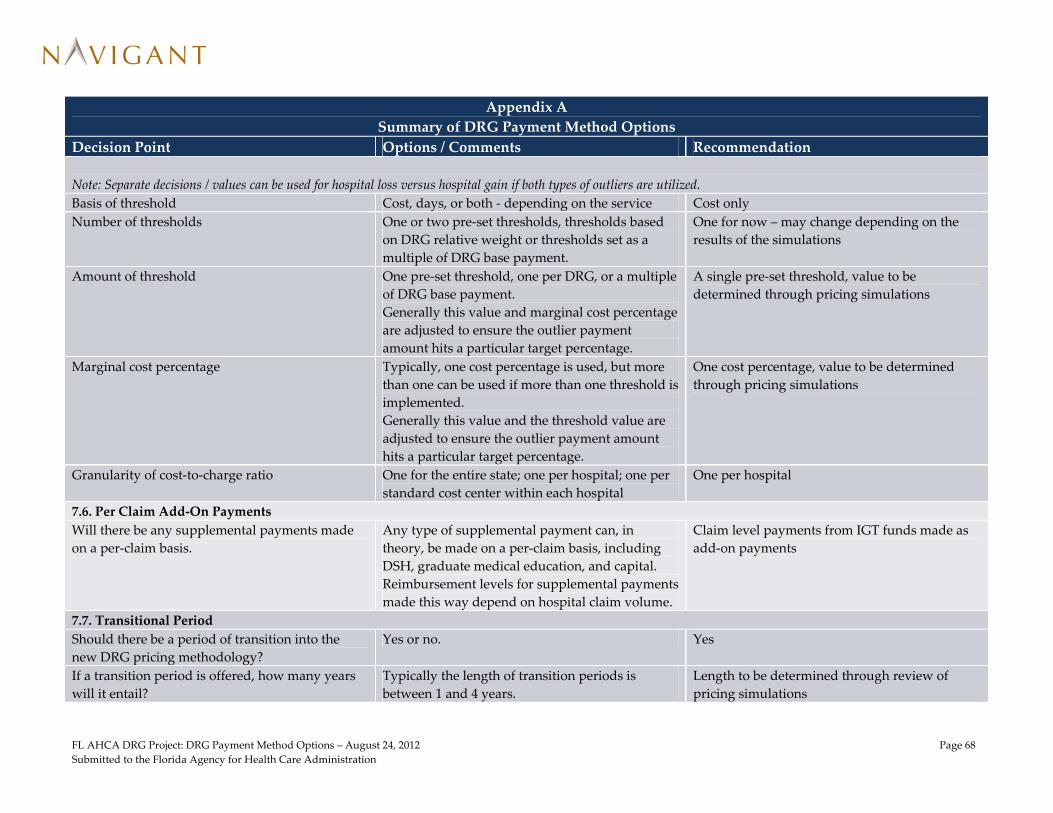
FL AHCA DRG Project: DRG Payment Method Options – August 24, 2012 Page 68
Submitted to the Florida Agency for Health Care Administration
Appendix A
Summary of DRG Payment Method Options
Decision Point Options / Comments Recommendation
Note: Separate decisions / values can be used for hospital loss versus hospital gain if both types of outliers are utilized.
Basis of threshold Cost, days, or both ‐ depending on the service Cost only
Number of thresholds One or two pre‐set thresholds, thresholds based
on DRG relative weight or thresholds set as a
multiple of DRG base payment.
One for now – may change depending on the
results of the simulations
Amount of threshold One pre‐set threshold, one per DRG, or a multiple
of DRG base payment.
Generally this value and marginal cost percentage
are adjusted to ensure the outlier payment
amount hits a particular target percentage.
A single pre‐set threshold, value to be
determined through pricing simulations
Marginal cost percentage Typically, one cost percentage is used, but more
than one can be used if more than one threshold is
implemented.
Generally this value and the threshold value are
adjusted to ensure the outlier payment amount
hits a particular target percentage.
One cost percentage, value to be determined
through pricing simulations
Granularity of cost‐to‐charge ratio One for the entire state; one per hospital; one per
standard cost center within each hospital
One per hospital
7.6. Per Claim Add‐On Payments
Will there be any supplemental payments made
on a per‐claim basis.
Any type of supplemental payment can, in
theory, be made on a per‐claim basis, including
DSH, graduate medical education, and capital.
Reimbursement levels for supplemental payments
made this way depend on hospital claim volume.
Claim level payments from IGT funds made as
add‐on payments
7.7. Transitional Period
Should there be a period of transition into the
new DRG pricing methodology?
Yes or no. Yes
If a transition period is offered, how many years
will it entail?
Typically the length of transition periods is
between 1 and 4 years.
Length to be determined through review of
pricing simulations

FL AHCA DRG Project: DRG Payment Method Options – August 24, 2012 Page 69
Submitted to the Florida Agency for Health Care Administration
Appendix A
Summary of DRG Payment Method Options
Decision Point Options / Comments Recommendation
If a transition period is offered, which providers
will be affected?
All providers or only those with project payment
changes above a certain percentage. In addition,
each hospital’s Medicaid market share could be
used as a determining factor.
To be determined through review of pricing
simulations
If a transition period is offered, how the transition
be applied?
Through adjustments to base rates performed
outside the MMIS, or through adjustment
multipliers in the MMIS, or through merger of
payments calculated using the Legacy method
and the new DRG method.
Adjusted base rates
If a transition period is offered, what will the
phase in percentages be each year?
One option (used by Medicare), is to phase in by
25% each year, ending up at full transition (100%)
in year 4. Another option is to transition slowly
in the first year or two, limiting hospital
reimbursement shifts, then making the final jump
to full DRG reimbursement in the final year of the
transition.
If a long transition, such as 4 years, then set the
phase‐in percentages relatively low for the first
two or three years.
7.8. Documentation and Coding Adjustment
How much adjustment should be estimated for
real casemix changes between the dataset used for
pricing simulations and the first year of DRG
payment in production?
Typically this value is estimated between 0.5 and
1 percent.
Recommendation will require further
conversations with AHCA
How much adjustment should be estimated for
improvements in coding by providers?
Typically, this value is estimated between 2 and 5
percent, but can be greater.
Recommendation will require further
conversations with AHCA
What kind of strategy should be used to cover
risk of inaccurate estimate for both the Medicaid
program and the hospital community?
Lump sum payments or hospital credits can be
applied, or retroactive payment adjustments can
be made by adjusting previously paid claims.
Recommendation will require further
conversations with AHCA
7.9. Interim Claims and Late Charges
Should interim claims be accepted? Yes or no No
If interim claims are accepted, what will be the
minimum length of stay on each interim claim?
Typically 30 days. If accepted, 30 days

FL AHCA DRG Project: DRG Payment Method Options – August 24, 2012 Page 70
Submitted to the Florida Agency for Health Care Administration
Appendix A
Summary of DRG Payment Method Options
Decision Point Options / Comments Recommendation
If interim claims are accepted, how should they be
paid?
Typically they are paid a per diem with a
relatively low per diem rate so that there is little
risk of the payment made on interim claims being
greater than the final DRG payment.
If accepted, per diem
If interim claims are accepted, how will final
payment be calculated when the final claim is
received?
Typically, the final claim is paid the full DRG
payment amount, but only after all interim claims
are voided. Under this method, a process must be
defined to identify the interim claims and submit
a void for each one.
If accepted, systematically void interim claims
Should claims for late charges (type of bill 0115)
be paid?
Typically the answer is no. Instead, if a provider
identifies additional charges, it must submit a
void for the original claim and then submit a new
claim.
No
7.10. Charge Cap
Should a charge cap be applied to claims paid via
a DRG method?
Yes, or no. If no, then a provider gain outlier
function is highly recommended.
No, prefer a provider gain outlier instead
7.11. Medicare Crossover Comparison Pricing
Will comparison pricing (Medicare versus
Medicaid) be applied to Medicare crossover
claims?
Yes or no. Yes

FL AHCA DRG Project: DRG Payment Method Options – August 24, 2012 Page 71
Submitted to the Florida Agency for Health Care Administration
Appendix B - Sample State Medicaid DRG Implementations
Category California New York Texas Virginia Pennsylvania Illinois Scope
Included provider types All acute care hospitals
not in the exclusion
list, including,
children’s hospitals,
specialty cancer
hospitals, critical
access hospitals,
teaching hospitals,
and tertiary hospitals
General acute
Specialty hospitals
(long‐term acute,
cancer, and
Blythedale Children’s
Hospital)
Chemical dependency
rehab
Critical access hospitals
All acute care hospitals
not in the exclusion
list
General acute hospitals
Children’s hospitals
All acute care hospitals
not in the exclusion
list, including,
children’s hospitals,
specialty cancer
hospitals, critical
access hospitals,
teaching hospitals,
and tertiary hospitals
and trauma centers
General acute hospital
Freestanding Children’s
Hospitals
Long term acute care
providers
Excluded provider types Psychiatric hospitals
Hospice providers
Designated public
hospitals
Rehabilitation hospitals
(including alcohol
and drug
rehabilitation)
Rehabilitation units at
general hospitals
Psychiatric hospitals
Medical rehabilitation
Children’s hospitals
Rural hospitals,
including critical
access hospitals
State‐owned teaching
hospitals
Freestanding psychiatric
facilities
FQHCs have the option
of payment via DRGs
or payment at 100% of
reasonable cost
Rural health clinics
Freestanding Psychiatric
facilities
Rehabilitation hospitals
Rehabilitation units at
general hospitals
Hospitals operated by
the Department of
Behavioral Health and
Developmental
Services
Psychiatric hospitals and
distinct part units
Hospice providers
Designated public
hospitals
Rehabilitation hospitals
(including alcohol
and drug
rehabilitation) and
distinct part units
Psychiatric freestanding
and distinct part units
Rehabilitation
freestanding and
distinct part units
Included services General acute care
Transplants
Neonatal care
Trauma
General acute care
Transplants
Neonatal care
Trauma
General acute care
Transplants
Neonatal care
General acute care
Neonatal care
Transplants
Inpatient acute
psychiatric (with
service authorization)
General acute care
Neonatal
Trauma
General acute care
Neonatal care
Long‐term acute care
Transplants
Excluded services Rehabilitation
Most psychiatric care
Sub‐acute
Administrative days
Blood factors
Donor search
Chemical dependency
detoxification
Behavior modification
Remedial education
Psychological testing
Alcoholism and drug
abuse therapy
Transplants, including
acq. (negotiated)
Psych, rehab, D&A in
freestanding or DPUs
Psych partial
hospitalization
Observation
Psych and rehab in
freestanding or DPRs
Included Medicaid Fee for service Fee‐for‐service Fee for service Fee for service Fee‐for‐service Fee for service and CHIP

FL AHCA DRG Project: DRG Payment Method Options – August 24, 2012 Page 72
Submitted to the Florida Agency for Health Care Administration
Category California New York Texas Virginia Pennsylvania Illinois programs California Children’s
Services (CCS)
Genetically
Handicapped Persons
Program (GHPP)
Managed care
Workers comp
No fault
Primary care case
management
Excluded Medicaid
programs
Managed care None listed Managed care None listed Managed care, but
required to pay out‐
of‐network using
predecessor AP‐DRG
model
Managed care
DRG Grouping
Grouper APR (planned for
implementation
7/1/2013)
APR APR (effective 9/1/2012) AP APR APR
Relative weights National weights
adjusted (re‐centered)
for CA casemix
New York specific Texas specific National Adopted New York
weights, adjusted (re‐
centered) for PA
casemix
National weights
adjusted (re‐centered)
for Illinois case mix
Provider Base Rates
Provider groupings with
separate standard
base rates
Remote rural
All other
Single common base rate Single common base rate Single common base
rate, but separate rate
for State Teaching
Hospitals
Single statewide
operating rate
(excludes capital and
medical education)
Long‐term acute care
hospitals
All other hospitals
Base rate adjustments Medicare wage indices Hospital’s labor costs
wage equalization
factor (WEF) and each
hospital’s GME costs
using updated cost
basis and formula
Geographic wage
adjustment
Medical education
Trauma designation
Medicare wage indices
Rural hospitals ‐
Medicare wage index
of the nearest
metropolitan wage
area or the effective
Medicare wage index,
whichever is higher
Adjustment for medical
education
Adopted Medicare wage
index adjustment if
hospital’s Medicare
index exceeded 1.0. If
below 1.0, no
adjustment.
Geographic wage
adjustments using
Medicare values and
method
Adjustments for critical
access and specialty
providers are
maintained through
legacy supplemental
payments outside of
DRG model – but will
be phased out over
time.
Pricing Rules
Policy adjustors 1.25 for pediatrics
1.25 for most neonates
1.75 for neonates at a
facility operating a
None None None Provider‐specific
teaching hospital
adjustments of either
5% (Teaching) or 10%
Yes – for critical access
hospitals only – value
TBD.
No other policy

FL AHCA DRG Project: DRG Payment Method Options – August 24, 2012 Page 73
Submitted to the Florida Agency for Health Care Administration
Category California New York Texas Virginia Pennsylvania Illinois certified NICU
surgery unit
(Advanced Teaching).
Designations based on
Medicare resident ot
bed ratio – Advanced
Teaching above
average ratio,
Teaching below
average ratio.
Provider‐specific
adjustments based on
Medicaid utilization
ranging from 0% to
20%.
adjustors, but
enhanced funding for
specialty services
(children’s, neonatal,
pediatric, etc.) are
accommodated
through legacy
supplemental
payments made
outside of the DRG
model. Supplemental
funding will be
gradually
incorporated into
DRG model over time,
and may be replaced
with additional policy
adjustors.
Transfer payments
Calculation for acute‐to‐
acute transfers:
Lesser of [DRG base
payment] and {([DRG
base pymt] / [DRG
ALOS]) * (LOS + 1)}
No acute‐to‐post‐acute
transfer payment
reductions
Calculation for acute‐to‐
acute transfers:
Lesser of [DRG base
payment] and {([DRG
base pymt] / [DRG
ALOS]) * LOS}
No acute‐to‐post‐acute
transfer payment
reductions
Calculation for acute‐to‐
acute transfers:
{[DRG base pymt] /
[DRG ALOS]} times
the lessor of {[DRG
ALOS], [claim LOS],
and [30 days]}
No acute‐to‐post‐acute
transfer payment
reductions
Calculation for acute‐to‐
acute transfers:
Lesser of [DRG base
payment] and {([DRG
base pymt] / [DRG
ALOS]) * LOS}
No acute‐to‐post‐acute
transfer payment
reductions
Calculation for acute‐to‐
acute transfers:
Lesser of [DRG base
payment] and {([DRG
base pymt] / [DRG
ALOS]) * LOS}
No acute‐to‐post‐acute
transfer payment
reductions
Calculation for acute‐to‐
acute transfers:
Lesser of [DRG base
payment] and {([DRG
base pymt] / [DRG
ALOS]) * (LOS + 1)}
No acute‐to‐post‐acute
transfer payment
reductions
Provider loss outliers? Yes, cost based Yes, cost based Yes for recipients under
age 21 only, and based
on either cost or
length of stay. If both
apply on a single
claim, the higher
outlier amount is
paid.
Yes, cost based Yes, cost based Yes – cost based
Provider loss outlier
threshold(s)
Two thresholds: tier 1
threshold $30,000, tier
By DRG and adjusted by
provider wage
Variable – greater of [1.5
times DRG base
$26,000, adjusted in the
base year so as to
$30,000 $22,385

FL AHCA DRG Project: DRG Payment Method Options – August 24, 2012 Page 74
Submitted to the Florida Agency for Health Care Administration
Category California New York Texas Virginia Pennsylvania Illinois 2 threshold $100,000 equalization factor payment] and [11.14
times hospital base
price]
result in expenditures
for outliers operating
payments equal to
5.1% of total operating
payments for DRG
cases.
Provider loss outlier
marginal cost
percentage(s)
60% for losses between
tier 1 and tier 2
thresholds;
80% for losses above tier
2 threshold
100% 60% 80% 100% for neonatal and
burn cases;
80% for all other services
80 % marginal cost
factor
Provider gain outliers? Yes, cost based No No No Yes, cost based Under consideration
Provider gain outlier
threshold(s)
$30,000 n/a n/a n/a $30,000
Provider gain outlier
marginal cost
percentage(s)
60% n/a n/a n/a 80%
Interim claims Paid via per diem if
length of stay is > 30
days
Yes, but only one
accepted per hospital
stay.
Yes No Yet to be determined
Charge cap Currently undecided Yes Currently undecided
Medicare/Medicaid dual
eligible pricing
comparison logic
Yes Yes Yes No Yes – lesser of payment
difference or
deductible/copay
amount
Proposed but not in
effect
Implementation Items
Transition strategy Limit gain and loss to
5% per year for first 3
years (maximum is
15% in third year).
Full implementation
in year 4.
None (Moving from MS‐
DRG to APR‐DRG)
No transition period Considering a transition
similar to California
Documentation and
coding adjustment
0.5% real casemix
increase yearly
between simulation
dataset and
implementation
2.5% anticipated
casemix change from
improved
1% real casemix increase
yearly between
simulation dataset
and implementation
No prospective
adjustment in
anticipation of
documentation and
0.8% real casemix
increase yearly
between simulation
dataset and
implementation
5% anticipated casemix
change from
improved

FL AHCA DRG Project: DRG Payment Method Options – August 24, 2012 Page 75
Submitted to the Florida Agency for Health Care Administration
Category California New York Texas Virginia Pennsylvania Illinois documentation and
coding
coding with plan.
Documentation and
coding improvement
proved to be
significant in the first
year of
implementation.
documentation and
coding with plan to
redistribute money to
hospitals if
documentation and
coding improvement
is over estimated.