drilling fluid loss control by leong khai siang
TRANSCRIPT

Drilling Fluid Loss Control By Using Oil Palm Fibres
by
LEONG KHAI SIANG
Dissertation submitted in partial fulfilment of
tbe requirements for the
Bachelor of Engineering (Hons)
(Mechanical Engineering)
JANUARY 2008
Universiti Teknologi PETRONAS Bandar Seri Iskandar 31750 Tronoh Perak Darul Ridzuan

CERTIFICATION OF APPROVAL
Drilling Fluid Loss Control By Using Oil Palm Fibres
Approved by,
by
Leong Khai Siang
A project dissertation submitted to the
Mechanical Engineering Programme
Universiti Teknologi PETRONAS
in partial fulfilment of the requirement for the
BACHELOR OF ENGINEERING (Hons)
(MECHANICAL ENGINEERING)
(Ms. How Meng Git)
UNIVERSITI TEKNOLOGI PETRONAS
TRONOH, PERAK
January 2008

CERTIFICATION OF ORIGINALITY
This is to certizy that I am responsible for the work submitted in this project, that the
original work is my own except as specified in the references and
acknowledgements, and that the original work contained herein have not been
undertaken or done by unspecified sources or persons.
LEONG SIANG
ii

ABSTRACT
The harsh environment in underground drilling operations encouraged the research
and development of drilling fluids that can fill several crucial roles in the drilling
process. One of the critical problems faced in well drilling operation is the loss of
drilling fluid, namely lost circulation. A method for preventing loss of drilling fluid
into fractures of rock formation includes using lost circulation material. In an attempt
to solve moderate-to-severe lost circulation problems, operators have pumped a
variety of substances down the wellbore to reduce the loss of drilling fluid to a thief
zone. These involve the use of materials that swell in the presence of water and fill
the thief zone area or plug the flow path from the wellbore so that fluid loss ceases.
This project is to study the alternative lost circulation material for drilling operation
in oil and gas industry. The objective of the project is to propose oil palm fibres and
its treatment method to be considered for the usage in loss circulation situation. The
scopes of the study include the understanding of lost circulation and its classification
for drilling operation and investigation on the lost circulation material which can
provide improved fluid loss control. Besides that, the scope of study also includes
the conduct of laboratory experiment on the samples of drilling mud in order to
determine effectiveness for the proposed material and the results can be compared
with the American Petroleum Institute (API) Standards.
The methodologies used can be grouped into five phases. Phase one is information
gathering and literature review. Phase two is preparation of additive which is related
to the oil palm fibres (proposed material). This is followed by conducting sample
analysis on X-ray Powder Diffraction (XRD) and Scanning Electron Microscope
(SEM). Next, preparation of mud samples will be conducted to show the influence of
selected variables (different mixture of weighting agents and additive). :Finally, the
rheological experiments are done in laboratory. The anticipated results from the
study are to prove the effectiveness of the use of oil palm fibres as a lost circulation
material in reducing fluid loss.
iii

ACKNOWLEDGEMENTS
The writer is delighted to have finally completed his Final Year Project which is
entitled "Drilling Fluid Loss Control by Using Oil Palm Fibres". Nothing can be
done without the God's blessing and will. Thus the writer owes the God so much for
giving him the opportunity to finish this study successfully.
The writer's supervisor, Ms. How Meng Git, was the vital backbone throughout the
projects and activities he was involved in. Ms. How's close supervision, advice and
guidance tremendously contributed in his works for the project. He would like to
express his gratitude to Ms. How and appreciate all the helps and supports.
Besides that, the writer is also indebted to Mr. Sonny Irawan, who played vital role
as his co-supervisor. Mr. Sonny's supports and guidance throughout the project has
ensured the project to achieve its objectives and greatly benefited the writer.
Reference and consultation the writer made was not restricted to the supervisors, but
also the technician in U.T.P, such as Mr. Amirul and Mr. Riduan from Petroleum
and Geoscience Department. They, with different expertise provided the writer with
comments, technical advises and guidance on the writer's project.
Not forgotten is the UTP coordinators which organized and conducted the Final Year
Project's programme successfully. Thousand thanks again are given to those who
have helped the writer in making his Final Year Project can be done successfully and
meet the time frame.
iv
TABLE OF CONTENTS
CERTIFICATION OF APPROVAL
CERTIFICATION OF ORIGINALITY . ii
ABSTRACT. iii
ACKNOWLEDGEMENT . iv
CHAPTER I: INTRODUCTION . I
1.1 Background of Study • I
1.2 Problem Statement 2
1.3 Significance of The Project 3
1.4 Objective and Scope of Study. 3
CHAPTER2: LITERATURE REVIEW 5
2.1 Mud Engineering 5
2.1.1 Roles of Drilling Mud. 6
2.1.2 Types of Drilling Mud 8
2.1.3 Fundamental Properties of Drilling Mud 9
2.2 Lost Circulation 12
2.2.1 Lost Circulation Classification 12
2.2.2 Lost Circulation Material 13
2.3 Previous Research Done in Similar Field 14
2.3.1 Mud Density • 14
2.3.2 Plastic Viscosity 15
2.3.3 Yield Point 16
2.3.4 Gel Strength 17
CHAPTER3: METHODOLOGY . 19
3.1 Methodology and Procedure 20
3.1.1 Literature Review and Data Gathering 20
v

CHAPTER4:
CHAPTERS:
REFERENCES
3 .1.2 Preparation of Additive 20
3 .1.3 Chemical Analysis Using XRD and SEM 22
3.1.4 Preparation of Mud Samples . 24
3.1.5 Rheological Properties Measurement. 27
3.2 Tools and Equipment Required 31
3.3 Gantt Chart for Final Year Project I 32
3.4 Gantt Chart for Final Year Project II . 33
RESULTS AND DISCUSSION
4.1 SEM and EDX Analysis
4.2 XRD Analysis.
4.3 Results for Formulation A, B and C
34
34
36
37
4.3.1 Rheological Test Results for Formulation A 39
4.3.2 Rheological Test Results for Formulation B 42
4.3.3 Rheological Test Results for Formulation C 45
CONCLUSION AND RECOMMENDATION
5.1 Conclusion
5.2 Recommendation
48
48
48
50
VI

LIST OF FIGURES
Figure 2.1 Principle of Temperature Survey 6
Figure 2.2 Typical Drill String Configuration 7
Figure 2.3 Composition of Typical Water Base Mud 9
Figure 2.4 Composition of Typical Oil Base Mud 9
Figure 2.5 Formation of Filtrate and Filter Cake 10
Figure 2.6 Typical Marsh Funnel II
Figure 2.7 Rotational Viscometer 11
Figure 2.8 Mud Density of Com Cobs Additive 14
Figure 2.9 Mud Density of Sugar Cane Additive 15
Figure 2.10 Plastic Viscosity for Com Cobs Additive 15
Figure 2.11 Plastic Viscosity for Sugar Cane Additive 16
Figure 2.12 Yield Point for Com Cobs Additive 16
Figure 2.13 Yield Point for Sugar Cane Additive 17
Figure 2.14 I 0 Second and I 0 Minutes Gel Strength for Com Cobs Additives 18
Figure 2.15 10 Second and I 0 Minutes Gel Strength for Sugar Cane Additives 18
Figure 3.1 Flow Diagram of the Overall Project Plarmed 19
Figure 3.2 Oven 21
Figure 3.3 Oil Palm Fibres heated in Oven at 70°C for 24 hours 21
Figure 3.4 Laboratory Blender 21
Figure 3.5 Vibratory Sieve Shaker 22
Figure 3.6 X -ray Diffractometer 23
Figure 3.7 Variable Scanning Electron Microscope (VPSEM) 23
Figure 3.8 Hamilton Beach Multi Mixer 24
Figure 3.9 Flow Chart of Oil Base Mud Mixing Process 26
Figure 3.10 Mud Balance 27
Figure 3.11 F ANN Model 35SA Viscometer 28
Figure 3.12 LPLT Filter Press 29
Figure 3.13 HPHT Filter Press 30
Figure 4.1 Anatomic Characteristic of Oil Palm Fibre 35
Figure 4.2 EDX Result of Oil Palm Fibre 35
Figure 4.3 XRD Result of Oil Palm Fibre 36
vii
Figure 4.4 Acceptable Plastic Viscosity for Formulation A 40
Figure 4.5 Acceptable Yield Point for Formulation A 40
Figure 4.6 Filtration Loss for Formulation A 41
Figure 4.7 Acceptable Plastic Viscosity for Formulation B 43
Figure 4.8 Acceptable Yield Point for Formulation B 43
Figure 4.9 Filtration Loss for Formulation B 44
Figure 4.10 Acceptable Plastic Viscosity for Formulation C 46
Figure 4.11 Acceptable Yield Point for Formulation C 46
Figure 4.12 Filtration Loss for Formulation C 47
viii

LIST OF TABLES
Table 1.1 Lost Circulation Cost Impact 2
Table 3.1 Substance and Quantity of Formulation A 25
Table 3.2 Substance and Quantity of Formulation B 25
Table 3.3 Substance and Quantity of Formulation C 26
Table 3.4 Recommended Minimum Back Pressure 30
Table 3.5 Tools and Equipment Required 31
Table 4.1 API 13A Specification for Mud Properties 37
Table 4.2 Acceptable Plastic Viscosity and Yield Point Ranges 37
Table 4.3 Results for Formulation A 39
Table 4.4 Results for Formulation B 42
Table 4.5 Results for Formulation C 45
ix

1.1 Background of Study
CHAPTER I
INTRODUCTION
Drilling is an operation to access the underground deposits of liquids and gases, such as
oil, water and natural gas. Wells are drilled through different fonnations in order to
achieve optimum penetrations and stable borehole conditions. Reducing the friction and
the heat produced by such friction is an important factor of any drilling operation,
because most types of drilling is either reciprocal or involves rotational movement of the
drilling apparatus within the borehole.
Drilling fluids are important for the drilling operation in oil and gas industry because
they perfonn many functions. These include lubricating the drill and applying
hydrostatic pressure in the well bore. The purpose is to ensure well safety and minimize
fluid loss across penneable fonnations by forming a filter cake on the walls of the well
bore. In the standard practice, the fluid is inserted into the borehole and act as a
lubricant at the point where the well surface contact with the drilling pipe. Therefore,
component and additives availability, temperature and contamination are just a few of
the major factors that detennine the design of a particular mud progranune [I].
The loss of drilling fluid occurs when penneable or fractured rock fonnations are
encountered. This happens whenever the hydrostatic pressure of the fluid column
exceeds the pressure that exists within opening in the rock fonnation. When such
condition happens, the drilling fluid will be forced into the openings. The losses of
drilling fluid may cause the rock fonnation become unstable, resulting bad impact and
1

damage to the well and equipment. Besides that, it may also cause injury to workers as
well as greatly increase the cost for drilling operation.
In order to mitigate this problem, the drilling fluid must contain some type of element
that can block the open holes in the rock. These elements of drilling fluid typically act as
agent across the openings in the rock formation. This is to seal them into the hole and
prevent more drilling fluid seeping in. These agents are termed as lost circulation
material.
1.2 Problem Statement
When drilling in deep wells for oil, gas or geothermal reservoirs, high temperatures are
usually encountered which adversely affect the performance of drilling fluids. One of
the challenges in drilling is to keep the lubricating fluid from seeping out of the hole.
High temperature will cause the hydrostatic pressure exceeds the pressure which exist
within the openings of rock formation. This occurrence will cause the drilling fluid
being forced in the openings, resulting in drilling fluid loss.
Table 1.1 shows the lost circulation cost impact. The occurrence of lost circulation will
affect the process of drilling, cementing as well as the completion. Cementing
production zones characterized by lost circulation will encounter problems which are
not easily solved during and after the cementing operation. Besides that, extra cost and
formation damage are some of the consequences of lost circulation, whereby the
operators have to deal with during the construction and completion stages of the well.
Therefore, the loss of drilling fluid is an expensive and pervasive problem faced by the
well drilling industry.
2

Table 1.1: Lost Circulation Cost Impact
Lost Cii'DIII•tialo Cad iiiiiNid Dril•l'llll C-lding Co.......,.ioniW.,rk-C~VW
LOS>OtmUCJ R""'oucE<J a.11nu1ar Los.s oTcom~on
coverage !l .. id Lon tirrte Casing c-orrosfon Lost tiane
Poorcetnentjob Poor .zonal isolatiorn Formation damag~
Reduced saf..ty Reduce<± sarety Reduced sarety Stuck iro hele Lost n!Senres
'Wasted ca>ing >trin;~ lo.sofwell Failure to reach
ta~g~EtTD
Blow out am:!: kill ope~ratitons.
Downhole biO\vouts
En'!\ronon...m>l lndden"t
1.3 Significance of The Project
This project is to study the use of oil palm fibres as a lost circulation material, by adding
to drilling fluid, in order to prevent or mitigate the loss of drilling fluid during the
process of well drilling.
Agriculture is among the main activites in Malaysia. A number of wastes are produced
from this industry. The trend to use waste materials has motivated the idea of using oil
palm fibres instead of throwing or burning these wastes without any purposes. These
waste materials will create enviroumental problem if left on the plantation. Therefore, it
is beneficial if oil palm fibres can be utilised in oil and gas industry.
1.4 Objective and Scopes of Study
There is a variety of lost circulating materials, including hard rubber, plastic, paper and
etc. The objective of the project is to propose an alternative lost circulation material that
can effectively reduce loss of drilling fluid and has the characteristics that can meet the
specifications in American Petroleum Institute (API) Standards.
3

In order to evaluate the potential of oil palm fibres for new application as lost circulation
material, a detailed and comprehensive study is necessary. The scope of study is given
as follows:
• Study of the drilling mud and its fundamental properties.
• Study of the lost circulation and its classifications.
• Conduct of laboratory experiment on samples of drilling fluid by measuring the
rheological properties and filtration loss.
4

CHAPTER2
LITERATURE REVIEW
The purpose of this chapter is to provide a better understanding about fluid loss and lost
circulation material. There are several causes of lost circulatious for drilling operation.
This chapter provides the basic knowledge of how lost circulation takes place and
causes bad impact to drilling operation, the roles of drilling mud and and the current
research in drilling technology.
2.1 Mud Engineering
Prior to drilling, mud program will be worked out by engineers according to the
expected geology. The drilling engineer is concerned with the selection and
maintenance of the best mud for drilling process. More mud is required as the depth of
the hole increases, and the mud engineer is responsible to ensure that the drilling mud
used is able to meet the specification. The chemical composition of the mud will be
designed so as not to destabilize the hole. It is sometimes necessary to completely
change the mud to drill through particular subsurface layer. For example, high density
mud is required when drill through oil, gas and salt water, whereas low density mud is
advantageous for low pressure production zones.
As drilling proceeds, the mud engineer will get information from the mud logger about
progress through the geology and will make regular physical and chemical checks on the
drilling mud. Temperature survey and radioactive trace survey are those methods which
used for this purpose to identify the specific location of lost circulation. For temperature
survey as shown in Figure 2.1, the temperature recording device is used to run in hole
5

on a wire line to provide a record of temperature against depth. The trend is recorded
under static conditions to provide base log. The cool mud is then pumped in the hole in
order to obtain the secondary log. After that, the lost circulation zone can be determined
by referring to the temperature gradient. The similar procedure is applied to the
radioactive tracer survey by using ganuna-ray log. The mud engineer has to keep an eye
on the equipment which is used to pump the mud and to remove particles if the
geologists' predictions are not entirely correct, or if other problems arise.
Depth
LQst circulatiQn zQne
Temperature
'
''~ Under static conditions
',,>~ U __ ~
' ' ' ' ' While pumping
Figure 2.1: Principle of Temperature Survey
2.1.1 Functions of Drilling Mud
The harsh enviromnent in underground drilling operations encouraged the research and
development of drilling mud that can fill several crucial roles in the drilling process
which include suspension, pressure control, buoyancy, lubrication, cooling and
stabilization offormations [2].
The drilling mud is used to carry out many functions in well drilling operation. These
include lubricating and cooling the drill string, to cool the drill bit and lubricate its teeth,
carry out of the holes, stabilize the well bore to prevent from caving in and help in the
evaluation and interpretation of well logs [3].
6

One of the primary functions of the drilling mud is to cool the drill bit and lubricate its
teeth. As the drilling action requires mechanical and hydraulic energy, a large
proportion of this energy is dissipated as heat. The drilling mud plays an important role
to remove the heat and allow the drill bit to function properly. It also helps to remove
drill cutting between the spaces and the teeth of the drill bit.
Besides that, the mud also provides lubrication by reducing the friction between the
borehole walls and the drill string. This is normally achieved by the addition of oil,
bentonite, graphite and etc. Drill string is the tubular and accessories on which the drill
bit can run to the bottom of borehole. Figure 2.2 shows the use of drill string to suspend
the drill bit and transmit rotary torque from the kelly to the bit. In general, the mud will
absorb the heat generated by the string and release it by convection and radiation, to the
air surrounding the surface pit tanks.
Drill String
Kelly
Drill Pipe
,.._ Bottom Hole Assembly \ (Collars, Stabilizers, Jars) ' ! ~ ~
Figure 2.2: Typical Drill String Configuration [3]
7

From the safety perspective, the drilling mud can provide hydrostatic pressure which is
greater than the formation pressure. This can prevent the damage to equipment or injury
to personnel as the formation pressure contained within the hole is high. Mud is
designed to prevent such accidents by counteracting the natural pressure of fluids in
rock formation. A proper balance must be achieved in which the pressure of the drilling
fluid against the walls of the borehole is enough to counter the pressure exerted by both
rock formations and by oil or gas, but not so much that it damages the well [4].
Other than that, the drilling mud also can posses required properties that will aid the
production of good logs. This is usually needed when wire line logs run in mud-filled
holes or open-hole logs run to determine porosity and boundaries between formations
and also to ascertain the existence and size of hydrocarbon zones.
2.1.2 Types of Drilling Mud
Generally, drilling mud can be defined as a suspension of solids in liquid phase. The
liquid can be either water or oil. There are three types of drilling mud commonly used,
which are water base mud, oil base mud and emulsion mud.
Figure 2.3 shows the composition of typical water base mud [6]. Water base mud
consists of liquid water, reactive fraction, inert fraction and chemical additive. Reactive
fraction is referred to the low specific gravity solids which react with the water phase
and dissolved chemicals. It is used to provide viscosity and yield point, whereas inert
fraction is high specific gravity solids to provide required mud weight and chemical
additive to control mud properties. Besides that, the reactive fraction of a water base
mud consists of clay such as bentonite and attapulgite. The inert solids include sand,
barite, limestone and etc [3].
8

• Water Phase
Emulsified Diesel Oil or lease Crude
High Specify Gravity Solids (Inert Fraction)
• low Specific Gravity Inactive Solids
low Specific Gravity Active Solids (Reactive Fraction)
Figure 2.3: Composition of Typical Water Base Mud
Figure 2.4 shows the composition of a typical oil base mud [6]. It is similar to water
base mud but oil base mud is emulsion of water in oil. The crude or diesel is the
continuous phase and water is the dispersed phase for this type of drilling mud. Oil
based mud is used to drill boles with severe shale problems and to reduce torque in well.
It tends to be more stable at high temperature compared to the water based mud.
4% 3% Diesel
Water
High Specify Gravity Solids
• calcium Chloride or Sodium Chloride
low Specify Gravity Solids
Figure 2.4: Composition of Typical Oil Base Mud
Emulsion mud is different with oil based mud, in which water is the continuous phase
and oil is the dispersed phase. It can increase penetration rate, reduce filter loss, reduce
chances of lost circulation and reduce drag and torque in well when the oil is added. An
9

oil-emulsion mud normally contains 5-l 0% of oil by volume and the emulsion can be
formulated by the use of sodium sap emulsifiers [3].
2.1.3 Fundamental Properties of Drilling Mud
The fundamental properties of mud include density, pH value, rheological properties
and filtrate and filter cake. Mud density is defmed by the mass of a given sample of mud
divided by its volume. Mud weight is dependent on the quantity of solids in the liquid
phase. The acidity or alkalinity of the mud is described by the use of pH value. The
selection of mud weight is based on the wellbore pressure required to control the
formation pressures encountered in the open hole without causing lost returns [7].
Figure 2.5 shows the formation of ftltrate and ftlter cake. The fluid lost to the rock is
described as 'ftltrate' when a drilling mud comes into contact with porous rock. The
rock will act as a screen to allow the fluid and small solids to pass through, retaining the
larger solids. The layer of solid deposited on the rock surface is described as 'filter
cake'. The quantity of mud is dependent on the volume of filtrate lost to the formation
and the thickness of the filter cake. In other words, this volume is dependent on the
magnitude of the differential pressure and mud characteristics of filter cake. Spurt loss is
the condition where the initial volume of filtrate lost to the rock and forms the filter
cake.
Drill Bit Solid Ground
Borehole
Filtrate
Figure 2.5: Formation of Filtrate and Filter Cake
10

The most important rheological properties of mud are density, plastic viscosity, yield
point and gel strength. All these properties will be measured throughout this project for
the proposed material. Plastic viscosity is a property to control the magnitude of shear
stress which develops one layer of fluid over another. This property relates to the
portion of flow resistance caused by mechanical friction. If the plastic viscosity is
excessive, the equivalent circulating density will be excessive. This results in an
increased risk of lost returns.
Yield point is a measure of the attractive forces between particles of mud resulting from
the chargers on the surface of these particles and gel strength is the measure of
minimum shearing stress to produce slip wise movement. If these properties are too
high, the consequences will be the same as for high plastic viscosity. If they are too low,
the result will be poor cuttings transport and an increased potential for weighting agents
settling [7]. Figure 2.6 shows the typical marsh funnel used to measure plastic viscosity,
yield point and gel strength. However, these properties also can be obtained by using
rotational viscometer (Figure 2. 7) which is able to produce results of higher accuracy.
Figure 2.6: Typical Marsh Funnel (8]
Figure 2.7: Rotational Viscometer [8]
11

2.2 Lost Circulation
If the mud weight exceeds the fracture pressure of the formation, the formation may
rupture and large quantities of mud are lost inside it. This situation is referred as lost
circulation. These cracks can also cause water seep into the well bore or into the
hydrocarbon bearing zone, which would impede the ability of the formation to produce
oil [5]. For lost circulation to occur, the size of the pore openings of the induced
fractures must be larger than the size of the mud particles. In practice, the size of
opening which can cause lost circulation is in the range 0.1- 1.0 mm [3].
2.2.1 Lost Circulation Classification
Losses can simply be defined as the loss of drilling fluid (mud) to the formation. When
losses occur, the dynamic or static pressure exerted by the total mud column exceeds the
total formation pore pressure and fracture gradient. Additionally, the porosity and
permeability of the formation is such that whole mud is lost to the formation thus
preventing the sealing effect of the filter cake. Type of losses can generally be
categorised as naturally occurring losses and mechanically induced losses. These rock
formations contain the areas of high permeability that allow drilling fluid seep into the
rock easily. Such rock formations may cause sudden loss of all or a significant part of
the drilling fluid. These corresponding losses in well pressure will cause the rock
formation to become unstable, and may cause a blowout, resulting in damage to the well
and equipment and injury to the workers. Even if such damage does not occur, the loss
of significant amounts of drilling fluid greatly increases the cost of drilling [9].
Naturally occurring losses are losses resulting from some aspect of the formation being
drilled. Losses are common in various formations such as unconsolidated formations
which include sand and gravel and cavernous formations which include gravel,
limestone and dolomite. Besides that, permeable formations such as poorly cemented
sandstone will also lead to the natural fractures or fissures which can occur at all depths
in all formations.
12

Mechanically induced losses refer to the losses resulting from some aspect directly
related to the drilling operation. Induced fractures are typically caused by large increases
or spikes in the well pressure while drilling. The most common causes of mechanically
induced losses are due to the high hydrostatic pressure resulting from an excessive mud
weight or annular cutting load. Besides that, high surge pressure resulting from an
excessive drill string or casing running speed also can cause the induced fractures.
2.2.2 Lost Circulation Material
Lost circulation material (LCM) is added to a mud to control the loss of mud into highly
permeable sandstone, natural fractures, cavernous formations and induced fractures.
Historically, lost circulation materials and chemical products designed to treat severe or
massive fluid loss situations have included cellulose, almond hulls, black walnut hulls,
dried tumbleweed, kenaf, paper, asphalt and both coarse and fine rice [10]. Before a
mud filter cake can be deposited, lost circulation additive must bridge across the large
openings and provide a base upon which the mud cake can be built
The drilling industry for oil and gas field has studied various lost circulation materials
(LCM) and has vast field experience using currently available products. They are
generally divided into four categories, which are flake shaped materials, granular
materials, fibre shaped materials and slurries.
Flake shaped materials include mica, cellulose, cottonseed hulls, wood chips, laminated
plastic, graphite, calcium carbonate. These materials inhibit lost circulation by laying
flat across the face of the leaking formation and seal it off. Granular materials include
items such as nutshells, calcium carbonate, sized salt, hard rubber, asphalt and plastic.
These materials have the characteristic of strength and rigidity. They can seal the
leaking formation by wedging themselves inside the openings to reduce opening size,
and enhancing the drilling fluid filtration control.
13

Cellulose fibre, saw dust, shredded paper, hay, rice husks and paper pulp are categorize
as fibre shaped materials. These materials are being forced into openings and bridging
them off which can allow the drilling fluid filtration control agents to become more
effective. Slurries are mixtures to increase the strength of the material. These mixtures
can be oil bentonite mud, hydraulic cement, or high filtrate loss drilling fluids.
2.3 Previous Research Done in Similar Field
Result from a similar study draws the comparison of performance between the com cobs
additive with the sugar cane additive by using two different sizes of additive, which are
125~ and 500 ~m. Generally, the result focuses on four parameters, which include
mud density, plastic viscosity, yield point and gel strength.
2.3.1 Mud Density
Figure 2.8 shows that as the amount of additives is increased, the mud density increased.
It is the same trend for both sizes, which are 125 microns and 500 microns. Initially,
both samples show the same density until the additive amount of 0.013 lb and further
addition of additives would cause the curve to diverge. For the 500 microns of particle
size, the density is higher due to the solid content of the particle size is larger compare
with 125 microns.
!r r-----------------------~ u +-----------------__..------,'""'a......~-
:~t=~~~~~~ ./
ti ~.----------------------~ ~~~~~~ it ~----------------------~ l! ~--~~------------~--~ om1 ~! om·: em: em: o.a::
~l*
Figure 2.8: Mud Density of Corn Cobs Additive [11)
14

Figure 2.9 shows mud added with sugar cane has the same density trend as same added
with com cobs. The amount has a direct relationship with the density of the mud.
However, the particle size has less effect and the density is almost similar throughout
the addition of the additives.
.~ ~ ~
,.. ~ ,..
. u n<:tt a:t, ll!IH um;
.~1)11111 (lbl
Figure 2.9: Mud Density of Sugar Cane Additive [11]
2.3.2 Plastic Viscosity
Figure 2.10 shows plastic viscosity of mud increases linearly with the amount of com
cobs added but further increment of com cobs will decrease the value of the plastic
viscosity. As expected, 500 microns shows a slightly higher value of plastic viscosity
compared to 125 microns due to its particle size. The larger the particle size of additive
used, the more viscous of the fluid will be.
Plast ic VIscosity for Corn Cotrs l;r.;tie vi!ii:IO'Oi'ty (r,:~J ~~~----------------------~
'5 ~----------------------~ ~ :' +------- - - -------1
5 +-----------------------~ 1 +---~--~--~--~--~--~
: )' liJ) \~ U ·.>; H : ·; l:.li ' i l l«
k!ol UDl(lb )
--1:LIS t:ti:r>n•J -a-5)) "I•:T:')" 'J
Figure 2.10: Plastic Viscosity for Sugar Cane Additive [11)
15

Figure 2.11 shows the trend of plastic viscosity for mud added sugar cane. Unlike com
cobs, sugar cane additives experience its optimum value in smaller amount of the
addition. Based on the observation, there will be the optimum of plastic viscosity value
for the formulation to work effectively. For the com cobs, the optimum value is about
0.019lb and for sugar cane is about 0.013 lb.
I'IWI&~l!'i
:t:~ T~=::::::=:G~=::;:==::;;-1 a m m
~- l==~G==--==~~~:::;;;~:::=~ .... -~ ~--~----~
1 -...-t<!.'i ·~:lll<j I 1!! +---------------------; ,,.,
-&- :iii:! .~l'ii::"(l'l·.i ,.,; +---------------!
.i +-----------------! ;J ..._ __ '""'T"' __ __, ____ ..---..-;
il\11 I :1.!:11:1 tl ~11'i
. >ad(lbl
Figure 2.11: Plastic Viscosity for Sugar Cane Additive [11]
2.3.3 Yield Point
From Figure 2.12, the value of yield point for both sizes of com cobs decreases as the
amount of additive increases. For the 125 and 500 microns, the minimum reading is at
0.022. Based on the trend, further increment of the amount of additives will cause the
curve to keep on decreasing.
'tllll.d ~·lnit ~lblt~)IJ fl ~ 10
1~
10 J
.
.
, ---..,
" ........... .~ -.....__ ---- -
J.Jtt n.·:l1 !i CL:u.s u:Jt ; 1.an :J.oa.~;:
.l!i.mt)U.n.l{ lt l
Figure 2.12: Yield Point for Corn Cobs Additive [11]
16

The trend of graph for sugar cane as shown in Figure 2.13 demonstrates better
performance compared with com cobs curves. The solid content in fluid sample of
125 microns is more compared with 500 microns causing the 500 microns having lower
value compared to 125 microns. Further increment of amount would result in reduction
of the value of yield point. Yield point is sensitive to the electrochemical environment
indicates the need for chemical treatment. The yield point may be reduced by the
addition of substances neutralizing the electric charges such as thinning agent and by
addition of chemicals to precipitate the contaminants [11] .
.. .
...__
t.----. . ... ~ . '
I
- -e. :;; ). :. ;
Figure 2.13: Yield Point for Sugar Cane Additive [11]
2.3.4 Gel Strength
Figure 2.14 shows the 10 second and 10 minutes gel strength for com cobs additives.
For 125 and 500 microns size com cobs, the highest value is at the amount of 0.011 lb
and the lowest value is at the amount of 0.022. For gel strength in both tests,
125 microns size com cobs have a lower value compared to 500 microns size com cobs.
Similar trend is obtained for sugar cane additives from Figure 2.15. However, the lower
value for both tests is same and obtained at the amount of0.017. For both additives, the
particle size of 500 microns shows a higher value compare with 125 microns. The
trends of the graph for gel strength for both additives are almost similar with the yield
point graph. This could be due to the attractive forces in a mud system.
17

'l r -"""-.. l
'i --------~,
1 l I ~
:).liJI lilll
I
...._; ::--., -I
I l
HIT
;(
~
(
.;t 1
!(
---~ 1hliiiM~I 'St~~bforCornColl'l
I I
~ J ---- --- ; -1.:5 "1tTm
--.....J J I
tall :J:HI ~ill'i ~>IIi :JHJ :JUl ---Figure 2.14: 10 Second and 10 Minutes Gel Strength for Com Cobs Additives [11]
11-r---- ------,1 1 ......._
6 ----~ c;P! +==~::::::::;;::::::~;; ~:-l~IIIIQOtt~ 3 .., -'i0011111lllll~
2~-------------1~-------------,l 0 +-----+----+--~ 0011 001) 001'i 0017
111 --...
cP, 6 ~ --,
•r--------~----~~ SOOmiaun
2~--------------0~--~----~--~ 11011 0.01:! 0.01'i 0.017
AIIIUIJ~ 1111)
Figure 2.15: 10 Second and 10 Minutes Gel Strength for Sugar Cane Additives [11]
As overall, this study found that corn cobs could serve more as a viscosifier than as a
fluid loss. Besides that, sugar cane could serve as a lost circulation material. The plastic
viscosity has a direct relationship with the added amount while the yield point and gel
strength shows a reverse relationship with the added amount
18

CHAPTER3
METHODOLOGY
The flow chart of the project is shown in Figure 3.1.
START Scopes:
~ - Fluid loss classification H Literature review
- Lost circulation ~ material
Preparation of additive (Proposed material)
- To identify the + anatomical - XRD and SEM analysis characteristic of the on sample proposed material.
+ Preparation of mud
Five properties: samples
+ - Density - Plastic viscosity Rheological properties
~ - Yield point measurement - Gel strength
+ - Filtration loss Result analysis
+ I Conclusion I l
END
Figure 3.1: Flow diagram ofthe Overall Project Planned
19

3.1 Methodology and Procedure
The methodology and procedure to conduct the project is divided into five main parts.
These include literature review and information gathering, preparation of additive, SEM
and XRD analysis on sample, preparation of mud samples and measurement of
rheological properties.
3.1.1 Literature Review and Information Gathering
The literature review provides an overview of the classifications of existing fluid loss
and loss circulation material related to drilling operation in oil and gas industry. Besides
that, the study on previous research done in similar field is also included. Information is
gathered from resources such as books, journals and theses. All information is skimmed
and selected based on importance and relevancy. The relevant information and data is
studied thoroughly and extracted as the project's reference.
3.1.2 Preparation of Additive
The oil palm fibres additive was firstly cleaned and dried to remove other particles.
Next, the additive was dehmuidified for 24 hours at 70°C in an oven as shown in
Figure 3.2 and Figure 3.3.
A laboratory blender was used to blend the additive into small pieces as shown in
Figure 5. The oil palm fibres are placed in the glass and the power is turn on. The
laboratory blender is controlled by a timer and the speed of cutter can be set. The fibres
are blended until the powder form is obtained.
20

Technical Specification
Brand Memmert
Dimensions 55 x 60 x40 (em) (wxhxd)
Voltage 20-200 °C
Temperature 240 Volts Range 50/60Hz
Figure 3.2: Oven
Figure 3.3: Oil Palm Fibres heated in Oven at 70°C for 24 hours
Technical Specification
Brand
Revolution
Power
Voltage
Mixing Vol.
Grinding Vol.
Figure 3.4: Laboratory Blender
Waring
11000 -22000 rpm
300W
240 Volts 50Hz
1600 ml
150 g
21

Figure 3.5 shows the vibratory sieve shaker which is used to obtain the desired particle
size through the segregation process. The oil palm fibres in powder form were sieved
from the top stage until the bottom stage. Each stage has a container which is of
different sieve's size. The desired particle size is set to below 70 micron meter. This
container is placed at the second bottom and the sample can be collected at the bottom
container. When the power is turned on, the sieve shaker will vibrate automatically
within the time which is set by the user.
Technical Specification
Size 500..., Brand Retsch
Size 250...,
Size 125..., Max Feed Capacity
4kg
Slze70..., Analysis 1- 60
Collecting Point Time minutes
Measuring 63-500 Range J.1ID
Figure 3.5: Vibratory Sieve Shaker
3.1.3 Chemical Analysis Using XRD and SEM
Two chemical analysis was conducted, namely X-ray Powder Diffraction (XRD) and
Scanning Electron Microscope (SEM). The purpose of these sample analysis is to
identify the chemical and mineral contaminants of the oil palm fibres. For SEM
experiment, additional equipment, namely Energy Dispersive X-ray (EDX) is required.
The sample to be measured in XRD must be dried and in powder form. The smaller of
the particle size of the sample, the more accurate result can be obtained. By using x-ray
diffractometer as shown in Figure 3.6, it provides a versatile non-destructive analytical
technique for identification and quantitative determination of the various crystalline
phases of compounds present in powdered or solid samples. Identification is achieved
22

by comparing the x-ray diffraction pattern obtained from an unknown sample with an
internationally recognized database containing more than 70,000 phases.
Figure 3.6: X-ray Diffractometer
SEM provides high resolution, three dimensional imaging of the pore system of the
fibres. A specimen is placed into a high vacuum chamber and radiation from an electron
beam is forced onto the sample. The interaction of the electron beam from the filament
and the sample atoms generates a variety of signals. The secondary or backscattered
electrons are detected and converted to an image. The device used for this experiment
namely variable scanning electron microscope (VPSEM), model LEO VP 1430 is
shown in Figure 3.7.
Figure 3.7: Variable Scanning Electron Microscope (VPSEM)
23

3.1.4 Preparation of Mud Samples
Hamilton Beach Multi mixer as shown in Figure 3.8 was used extensively to prepare
mud samples. The mixer is used to stir the mixture for the drilling mud which is placed
in the mud cup. This is to ensure the solid particles of additive can fully dilute into the
mud. Otherwise, these solid particles will concentrate at the bottom of the mud cup.
Technical Specification
Brand Hamilton
Beach
No. of Spindle 5
Cup Capacity 300z
Motor Max. 11000 rpm Speed
MotorHp 1/3
Voltage 240 Volts
60Hz
Figure 3.8: Hamilton Beach Multi Mixer
There are two types of mud samples to be prepared for the experiments, which are water
base mud and oil base mud. The mixture for water base mud is only containing 350ml
distilled water with 22.5g bentonite [12]. The composition of the mixture for water base
mud is recommended by the API Standards 13B-l. Before adding the additive into it,
the pure water base mud will be the control sample in the experiment. Table 3.1 shows
the substance and quantity for the water base mud and named as Formulation A. Besides
that, Formulation B contains the water base mud which mixed with chemical additives,
such as barite and hematite. This is shown in Table 3.2, where barite and hematite act as
the weighting agents.
24

Table 3.1: Substance and Quantity of Formulation A
Sq~JltQce, fo.lmlllitfoa A ,....,
1 2 3 4 s 6
Water,ml 350.0 350.0 350.0 350.0 350.0 350.0
Bentonite (Mt/), g 22.5 22.5 22.5 22.5 22.5 22.5
Oil Palm Fibre, g 0.0 1.0 2.0 3.0 4.0 5.0
Table 3.2: Substance and Quantity of Formulation B
sa~ ~ ~t~to~a :si [~.:c. ; ·. ):4:'.:J;:~.'~':·>·:: _,.): ;;;,;. .. :.
~ ·.,;, 1 2 3 4 s 6 ·" ' .·· ·.
Water,ml 350.0 350.0 350.0 350.0 350.0 350.0
Bentonite (M4), g 22.5 22.5 22.5 22.5 22.5 22.5
Barite, g. 45.0 45.0 45.0 45.0 45.0 45.0
Hemtltite, g. 15.0 15.0 15.0 15.0 15.0 15.0
Oil Palm Fibre, g 0.0 1.0 2.0 3.0 4.0 5.0
For oil base mu~ the oil-water ratio was set at 70:30, as recommended by the
API 13B-2 [13]. The required volume of Sarapar 147 was poured into the mixing
container, followed by primary emulsifier and secondary emulsifier. Next, the required
mass of lime was added followed by Brine (calcium chloride + water) and additives.
Lastly, the required amount of bentonite was mixed and stirred. The flow chart of the
oil base mud mixing process is shown in Figure 3.9. The substance and quantity of the
mixture for oil base mud is described in Table 3.3 and named as Formulation C.
25

SARAPAR147
Primary Emulsifier (Confimul P)
S«ondary E•alsifier (Coafi•al S)
Figure 3.9: Flow Chart of Oil Base Mud Mixing Process
Table 3.3: Substance and Quantity of Formulation C
Su~e~ ' i ·. fomaufatioa C
'• ,,-.·:
~~ 1 2 3 4 s 6
Sarapar 147 ,ml 245.0 245.0 245.0 245.0 245.0 245.0
Confimul P, g 20.0 20.0 20.0 20.0 20.0 20.0
Confimul S, g 20.0 20.0 20.0 20.0 20.0 20.0
Lime, g. 15.0 15.0 15.0 15.0 15.0 15.0
Brine, ml 105.0 105.0 105.0 105.0 105.0 105.0
Oil Palm Fibre, g 0.0 1.0 2.0 3.0 4.0 5.0
Bentonite (M4), g 22.5 22.5 22.5 22.5 22.5 22.5
26
3.1.5 Rheological Properties Measurement
Rheological tests conducted in this study are based on the procedures recommended by
the American Petroleum Institute (API) Standards. Five parameters were measured to
assess the rheological performance of the prepared mud samples. They are density
(lb/gal), plastic viscosity (cP), yield point (lb), gel strength (cP) and filtration over time
(ml). These tests include density measurement from mud balance, gel strength and
apparent viscosity from rotational viscometer and fluid loss and mud cake measurement
from API high-temperature filter press.
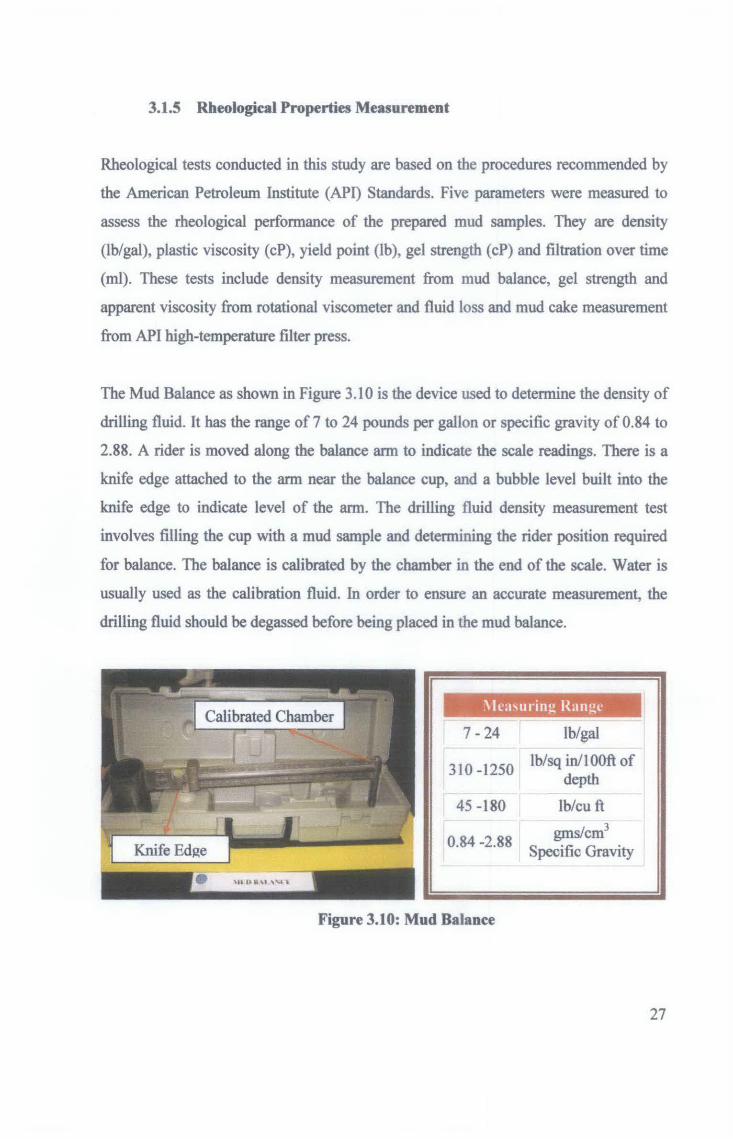
The Mud Balance as shown in Figure 3.10 is the device used to determine the density of
drilling fluid. It has the range of 7 to 24 pounds per gallon or specific gravity of 0.84 to
2.88. A rider is moved along the balance arm to indicate the scale readings. There is a
knife edge attached to the arm near the balance cup, and a bubble level built into the
knife edge to indicate level of the arm. The drilling fluid density measurement test
involves filling the cup with a mud sample and determining the rider position required
for balance. The balance is calibrated by the chamber in the end of the scale. Water is
usually used as the calibration fluid. In order to ensure an accurate measurement, the
drilling fluid should be degassed before being placed in the mud balance.
- --
!\1 C .. Sll ring nangc
7-24 lb/gal
310-1250 lb/sq in/1OOft of
depth
45 -180 lb/cu ft
0.84-2.88 gms/cm3
Specific Gravity
Figure 3.10: Mud Balance
27
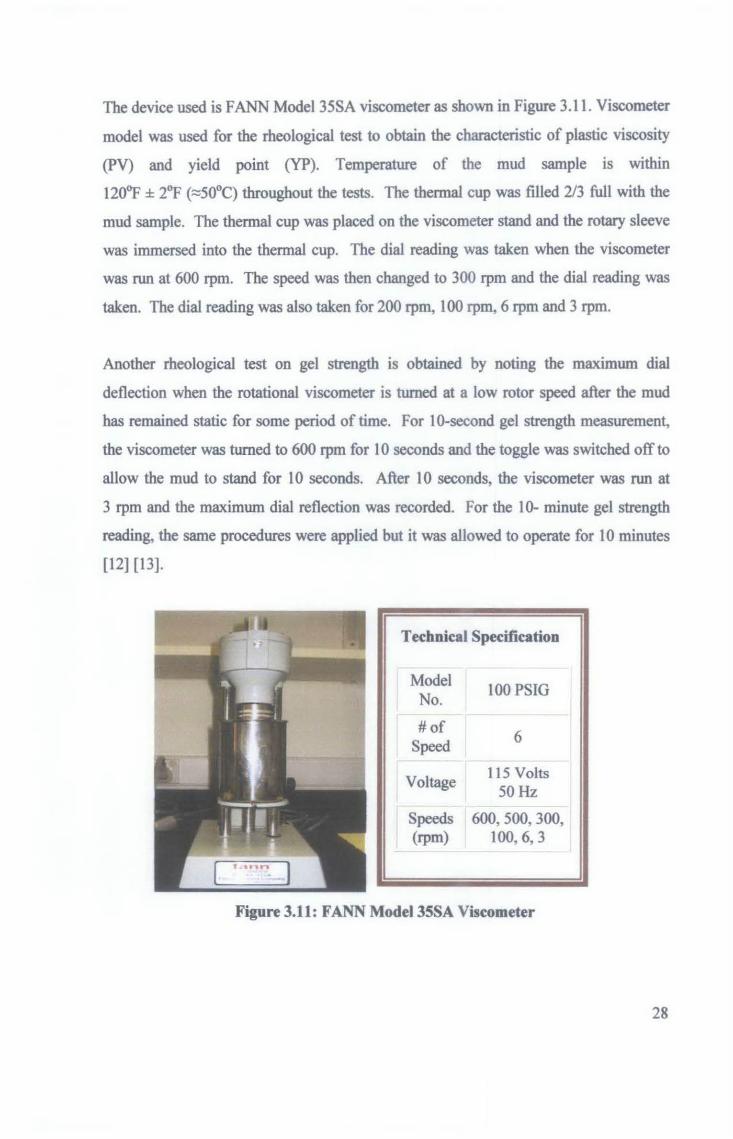
The device used is FANN Model35SA viscometer as shown in Figure 3.11. Viscometer
model was used for the rheological test to obtain the characteristic of plastic viscosity
(PV) and yield point (YP). Temperature of the mud sample is within
120~ ± 2°F (~50°C) throughout the tests. The thermal cup was filled 2/3 full with the
mud sample. The thermal cup was placed on the viscometer stand and the rotary sleeve
was immersed into the thermal cup. The dial reading was taken when the viscometer
was run at 600 rpm. The speed was then changed to 300 rpm and the dial reading was
taken. The dial reading was also taken for 200 rpm, 100 rpm, 6 rpm and 3 rpm.
Another rheological test on gel strength is obtained by noting the maximum dial
deflection when the rotational viscometer is turned at a low rotor speed after the mud
has remained static for some period of time. For 1 0-second gel strength measurement,
the viscometer was turned to 600 rpm for 10 seconds and the toggle was switched off to
allow the mud to stand for 10 seconds. After I 0 seconds, the viscometer was run at
3 rpm and the maximum dial reflection was recorded. For the 10- minute gel strength
reading, the same procedures were applied but it was allowed to operate for I 0 minutes
[12] [13].
Technical Specification
Model No.
#of Speed
Voltage
100 PSIG
6
115 Volts 50Hz
Speeds 600, 500, 300, (rpm) 100, 6, 3
Figure 3.11: FANN Modei35SA Viscometer
28

The Filter press for LPLT test is shown in Figure 3.12. It consists mainly of the
cylindrical drilling fluid cells. These cells are made of materials resistant to strongly
alkaline solutions which are so fitted. This is to ensure the applied pressure medium can
be conveniently admitted into or bleed from the top. Besides that, it shall also be fitted
with a sheet of filter paper that can be placed in the bottom of the cell just above a
suitable support. The purpose of the filter paper is to collect the mud cake that has built
up.
Measurement of the filtration behaviour and filter cake thickness characteristics of a
drilling fluid is fundamental to drilling fluid control and treatment. Generally, the test
will be done in 30 minutes by applying the appropriate pressure or temperature. The
characteristics of the filtrate include oil, water or emulsion content. These characteristics
are affected by temperature, pressure, the types and quantities of solids in the fluid and
their physical and chemical interactions. Therefore, tests are run at both low pressure
low temperature (LPL T) and high pressure high temperature (HPHT), and each requires
different equipment and techniques.
Technical Specification
Rated working pressure
115/230 VAC
100 PSIG
50/60 Hz
Sample Volume 350 ml
Filtering Area 7.0 in2
Figure 3.12: LPLT Filter Press
HPHT filter press as shown in Figure 3.13 consists of a controlled pressure source
(C02 or nitrogen), regulators, a drilling fluid cell able to contain working pressures, a
system for heating the cell, a pressurized collection cell to maintain proper
back-pressure (Table 3.4). The purpose of back pressure settling mainly is to prevent
29
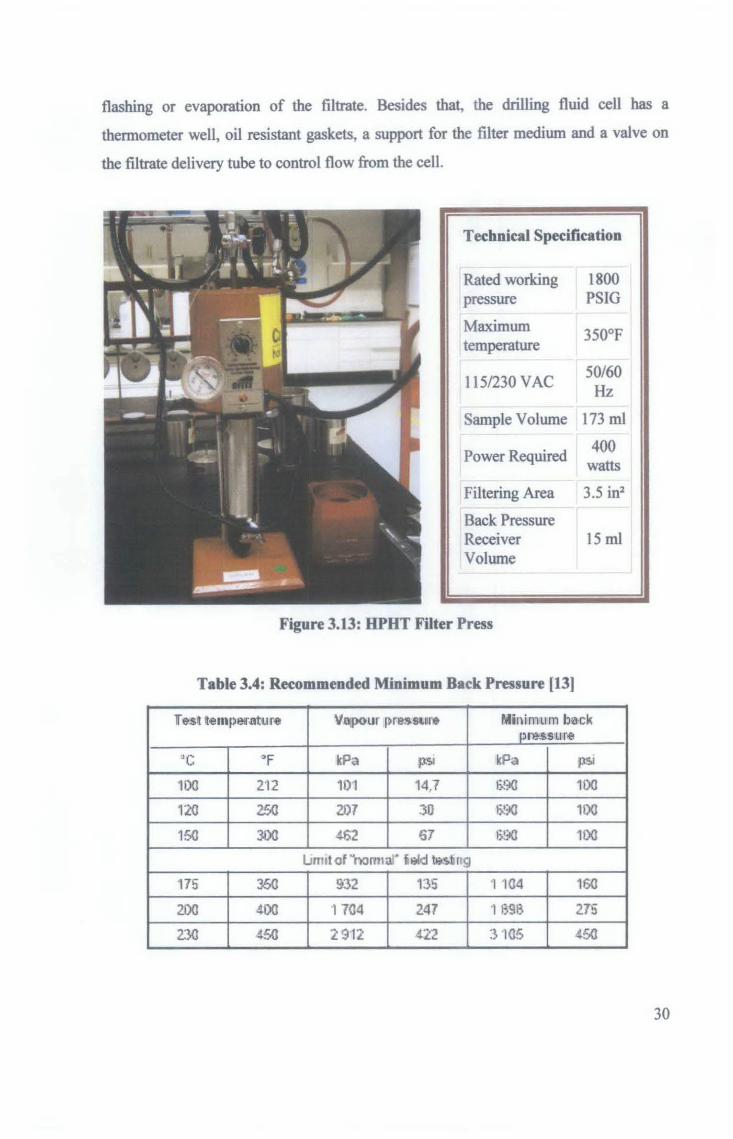
flashing or evaporation of the filtrate. Besides that, the drilling fluid cell has a
thermometer well, oil resistant gaskets, a support for the filter medium and a valve on
the filtrate delivery tube to control flow from the cell.
Technical Specification
Rated working 1800 pressure PSIG
Maximum 350°F temperature
115/230 VAC 50/60 Hz
Sample Volume 173 ml
Power Required 400
watts
Filtering Area 3.5 in2
Back Pressure Receiver 15 ml Volume
Figure 3.13: HPHT Filter Press
Table 3.4: Recommended Minimum Back Pressure (13)
r e.st tentper.atu re V.QjpOur prnst.11r. Minimum back m-e..ss u re
~c '"F kPa psi kPa psi
100 212 101 14.7 1).!:.<) 100
120 2..?0 lJYl :3D ))!:.<) 100
150 300 ~ 67 6..9C 11)0
limit of 'hom1 at 1i likl bi.st ng
175 360 932 135 '1 '104 160
200 400 1704 247 '1 698 275
2.30 450 2912 422 :~ ·105 ~50
30

3.2 Tools and Equipment Required
Suitable tools, equipment and selected materials are needed to conduct the experiments
and preparation of additive and mud samples. In the preparation of additive, the
equipments needed include laboratory blender, vibratory sieve shaker and the
experimental setup to conduct the XRD and SEM. Besides that, the equipments used in
the rheological tests include mud balance, mixer, API filter press and viscometer. The
summary of the required tools and equipment in listed in Table 3.5.
Table 3.5: Tools and Equipment Required
Task Tools aad Equipmeats Availability
Oven
Preparation of additive Laboratory Blender UTP Building S (Chemical Engineering Block)
Vibratory Sieve Shaker
X-ray Diffractometer UTP Building 17 Chemical Analysis Scanning Electron Microscope (Mechanical Engineering Block)
Preparation of mud Hamilton Beach Multi Mixer samples
Mud Balance UTP Building IS Rheological Properties
Viscometer (Petroleum & Geoscience Block)
Measurement
Filter Press (LPL T and HPHT)
31
I

3.3 Gantt Chart for Fiaal Year Project I
TASKS Au. -07 s 07 Oet-07 s ~ 7 s ~ 10 11 12 1~ 14 1S
a ~ < -~ -·~ --., :r: .... , --. ~
mellt ;::: iE ...... -;ol!l
~ - ... . ·~·-~~·
15<1 Process I ActuE.\1 Progress
32

II t
,Is i t
11~ ~ • 'I~ DG)G ,.
1:: DG m IS ~ II ~ DO ~ I JVJIIH31SD
lpr. • I ~a
~ IG
! • Del J t4 11'1 • l ,.
~ .. DG
,,. I~
I ~ I~ l1u l 1
li
~I ll j
14 IC 4 ~
liiJ 01 1 I 1m • I~ 11 1 ~ j
( 11 I~ l•l1 11 1:
1 11 II 1: I' li
' I! 1l1o ~ I
! I! I! li liJ I i lc II II ! ~ I!
I ~
til ~
I i i .. a. 1. It 1 i
I~
• ~

CHAPTER4
RESULT AND DISCUSSION
The main discussion of this chapter is the comparison of performance before and after
adding oil palm fibres as additive. Five parameters are being considered in the
experiments, which are mud density, plastic viscosity, yield point, gel strength and
filtration loss. Focus is given to filtration loss for the mud samples added with the
appropriate amount of proposed material (oil palm fibres). Besides that, the sample
analysis on scanning electron microscope (SEM), electron dispersive x-ray (EDX) and
x-ray diffiactometer are used for additional info to cross check if the mud samples show
any abnormality.
4.1 SEM and EDX Analysis
Figure 4.1 shows the SEM image of the anatomical characteristic of the oil palm fibres.
Oil palm fibres contain various sizes of vascular bundles. The vascular bundles were
imbedded into a thin wall, namely parenchyma. Each bundle was made up of fibrous
sh~ vessels, phloem and parenchymatous tissues [14]. Pholem was divided into two
separate areas in each bundle and metaxylem vessels are separated by at least one layer
of live parenchyma cells, which form a living barrier to possible transfer of gas bubbles.
Figure 4.2 shows the EDX result of oil palm fibre, revealing atomic percentage of
59.56% of carbon, 40.22% of oxygen and 0.22% of Silicon. The composition of carbon
and oxygen indicates oil palm fibres are categorized as holocellulose material.
Holocellulose consists of long chain carbohydrate molecules and it is the tough stuff that
strengthens the structure of material [15]. In general, oil palm fibre contains the highest
percent of homocellulose compared to other plant' s fibre, such as coconut coir and
34

banana stem. Besides that, the element of silicon is effective in oil spill absorbent and
suitable to be used as lost circulation material.
WD= 10mm Sign .. A= SE1 lli!IVERSm TEKNOLOGI PETRONAS
Figure 4.1: Anatomic Characteristic of Oil Palm Fiber
Processing option : All elements analyzed (Nonnalised) Number of iterations = 5
Standard : c CaC03 1-Jun-1999 12:00 AM 0 Si02 1-Jun-1999 12:00 AM Si Si02 1-Jun-1999 12:00 AM
Element Weigh~Al Atomic%
CK 52.40 59.56 OK 47.14 40.22 SiK 0.46 0.22
Totals 100.00 -
Figure 4.2 EDX Result of Oil Palm Fibre
35

4.2 XRD Analysis
Figure 4.3 shows the sample analysis for oil palm fibres by using x-my diffractometer in
room temperature {25°C) with peak positions are reproducible to 0.02 degrees. Based on
the result, the oil palm fibres are distinguished as molecular structure of non-crystalline
substances, namely amorphous. This is indicated by the graph which shows the
characteristic of amorphous, whereby the fluctuation did not reach the peak of Y -axis.
Oll Palm F iber
- I
• --~---•T --- ., ~ .. -T ., ..,.. .. .,.. ., .. T.... .,... ,... .. - - - - .. " ... ,. -~;:.::.. .. · .. .:: .......... ... - ...... ·-· .... ·- ... -- ..... - ·-- .............. - . ····-· -.. --...... ,._ .... .
Figure 4.3: XRD Result of Oil Palm Fibre
36

4.3 Results for Formulation A, B and C
The results obtained from the rheological tests include mud density, plastic viscosity,
yield point, gel strength and filtration loss. The substance of the formulation can be
referred to Chapter 3.1.4. Analysis conducted are focused on plastic viscosity and yield
point for the mud samples and compared with the standards in API 13A. The purpose is
to determine whether the properties of the mud samples are able to meet the requirement
and specification range. Besides that, the concern on filtration loss is to determine
whether the mud samples added with proposed material (oil palm fibres) are able to
reduce the filtration loss.
Table 4.1 shows the API 13A specification for mud properties, where the formula of
standard ranges for plastic viscosity and yield point are shown. These formulas are
applicable to drilling mud with density below 14 ppg.
Table 4.1: API 13A Specification for Mud Properties
0.4p- 0.6
Based on the result obtained, the range of mud density is between 7.3 - 1 0 ppg. By
substituting this range of mud density into formula, the acceptable plastic viscosity (PV)
and yield point (YP) are calculated and tabulated in Table 4.2. All the results obtained
through rheological tests will be compared with the values in Table 4.2, by referring to
the corresponding mud density. The desire mud samples must fall within the values
between the high range and low range in order to meet the specification. This is applied
to both plastic viscosity and yield point properties.
37

Table 4.2: Acceptable Plastic Viscosity and Yield Point Ranges
Mud Plastic Viscosity (cpl Yield Point (lb/100ft2)
Density - 2.0p-14 ·-· 0.4p- 0.6 (PPI) Low Ranae Low Ranae
10.00 15.40 6.00 26.00 3.40
9.80 14.72 5.60 26.80 3.32
9.70 14.38 5.40 27.20 3.28
9.60 14.04 5.20 27.60 3.24
9.50 13.70 5.00 28.00 3.20
9.40 13.36 4.80 28.40 3.16
9.30 13.02 4.60 28.80 3.12
9.20 12.68 4.40 29.20 3.08
9.10 12.34 4.20 29.60 3.04
9.00 12.00 4.00 30.00 3.00
8.90 11.66 3.80 30.40 2.96
8.80 11.32 3.60 30.80 2.92
8.70 10.98 3.40 31.20 2.88
8.60 10.64 3.20 31.60 2.84
8.50 10.30 3.00 32.00 2.80
8.40 9.96 2.80 32.40 2.76
8.30 9.62 2.60 32.80 2.72
8.20 9.28 2.40 33.20 2.68
8.10 8.94 2.20 33.60 2.64
8.00 8.60 2.00 34.00 2.60
7.90 8.26 1.80 34.40 2.56
7.80 7.92 1.60 34.80 2.52
7.70 7.58 1.40 35.20 2.48
7.60 7.24 1.20 35.60 2.44
7.50 6.90 1.00 36.00 2.40
7.40 6.56 0.80 36.40 2.36
38

4.3.1 Rheological Test Results for Formulation A
Table 4.3 shows the results for formulation A throughout the rheological tests. By
referring to API 13A with the mud density of 8.5 ppg, the ranges for plastic viscosity
and yield point are 3 - 10.3 cP and 2.8 - 32 lb/1 00 if respectively. For mud density of
8.6 ppg, the ranges for plastic viscosity and yield point are 3.2 - 10.46 cP and
2.84 - 31.6 lb/1 00 ff. Based on the observations on plastic viscosity and yield point, all
the mud samples from formulation A are able to meet the standards of API 13A as
shown in Table 4.2. Additionally, the filtration loss of the mud samples can improve by
adding the oil palm fibres.
Table 4.3: Results for Formulation A
Property, measuilnl unit S.mraleA
1 2 3 4 5 6
Mud density, ppg. 8.5 8.5 8.5 8.6 8.6 8.6
600 rpm reading 34.0 32.0 32.0 28.0 24.0 22.0
300 rpm reading 28.0 27.0 26.0 22.0 20.0 17.0
Plastic viscosity, cP 6.0 5.0 6.0 6.0 4.0 5.0
Yield point, lb/1.00 Jil 22.0 22.0 20.0 16.0 16.0 12.0
Gei1.0Sec 31.0 30.0 27.0 25.0 22.0 20.0
GellOMin 36.0 36.0 34.0 32.0 26.0 25.0
FlltnJtion Loss, mi/30min 23.8 23.2 21.7 21.2 20.4 19.2
Cake Thickness (mm} 3.27 3.33 4.2 4.51 92.8 79.2
Figure 4.4 shows the acceptable values of plastic viscosity for Formulation A. All the
values obtained from rheological experiments are between the maximum range and
minimum range for the mud which has density of 8.5 or 8.6 ppg. Without any additive,
which is the base mud sample, it gives reading of 6 cP. The trend of the graph is
fluctuating when the oil palm fibres are added. However, the optimum value is around
6 cP, where the mud samples are without additive and added 2g or 3g of oil palm
additives.
39

Acceptable Plastic Viscosity for Formulation A
12
a. u 10 --+- Max. Range (8.6 ppg)
~ 8 'i 0 - Max. Range (8.5 ppg) u
6 , -s; u 4 · .... - Plastic Viscosity, cP ., ,; ~ .. .,.
.. ~- - !I@ ::f: a. 2 - Min. Range (8.6 ppg)
0 0 1 2 3 4 5 ---.--Min. Range (8.5 ppg)
Amount of Additive, g
Figure 4.4: Acceptable Plastic Viscosity for Formulation A
Figure 4.5 shows the acceptable yield point for Formulation A. The desired results are
shown, where all the values obtained from rheological experiments are between the
maximum range and minimum range for the mud which has density of 8.5 or 8.6 ppg.
The value of yield point decreases as the amount of additive increases. It is estimated
the further increment of amount would also result the value of yield point to decrease.
Acceptable Yield Point for Formulation A
35 ,~ ~ . -~ ~· .,
30 ----------------r-.~ ~ - Max. Range (8.6 ppg) g 25 .... ., ;e 20 - -..-- Max. Range (8.5 ppg) .J ~ r c 15 0 ~ a. -e-Yield Point, lb/1 00 ft2 l! 10 Q)
> 5 ---- Min. Range (8.6 ppg) '-"
0
0 1 2 3 4 5 - Min. Range (8.5 ppg)
Amount of Additive, g
Figure 4.5: Acceptable Yield Point for Formulation A
40

The results of filtrate loss can be shown in Figure 4.6. It is obvious that the filtration
volume is directly proportional with the added amount of additive. The filtrate loss is
being improved by adding the amount of additive (oil palm fibres) into the mud
samples. The optimum result is obtained when the greatest amount of additive is added.
The percent of reduction for filtration loss is approximately 19.3% when 5g of additive
is added. Therefore, oil palm fibres are feasible to be used in water base mud as lost
circulation material to reduce the filtrate loss of drilling fluid.
'
--·---------··---·-·---- -l Filtration Loss for Formulation A 1
25 ·----
1 • • 20 --·--·
I
-·--··-·---
• • ----. :: t --------~==-= I :=-======
0 1 2 3 4 5
Amount of additive, g
I
-+- Filtration Loss, ml
~-------·· -----·------··-------· Figure 4.6: Filtration Loss for Formulation A
41

4.3.2 Rheological Test Results for Formulation B
Table 4.4 shows the results for fonnulation B throughout the rheological tests.
Generally, there are six different mud density values have been obtained. Notice that,
further increment of the amount of additives, will cause the mud density to keep on
decreasing. This might due to the absorbent characteristic of oil palm fibres has react
with the weighting additive (barite and hematite) which added in the mud sample.
However, majority mud samples from fonnulation B also able to meet the standards of
API 13A as Fonnulation A. Besides that, the filtration loss of the mud samples also can
be improved by adding the oil palm fibres.
Table 4.4: Results for Formulation 8 ....
' ~t~-.. ,,. .
1 2 3 4 5 6
Mud density, PPfl· 10.0 9.5 9.1 8.8 8.6 8.5
600 rpm mldlng 44.0 43.0 41.0 41.0 38.0 34.0
300 rpm I'Hdlng 37.0 35.0 34.0 33.0 30.0 28.0
Plastic viscosity, cP 7.0 8.0 7.0 8.0 8.0 6.0
Yield point, lb/100 If 30.0 27.0 27.0 25.0 22.0 22.0
Gel lOS« 43.0 41.0 40.0 38.0 36.0 33.0
Gei10Min 50.0 42.0 38.0 33.0 31.0 30.0
Filtration Loss, ml/30mln 21.2 20.6 19.2 18.8 18.5 17.0
Cake Thickness (mm) 3.3 3.3 4.9 5.5 6.0 6.8
Figure 4.7 shows the acceptable plastic viscosity for Fonnulation B. The maximum
range and minimum range for the respective mud densities is 10.3 cP and 6 cP. All the
mud samples present the values within the range, proving the properties are able to meet
the standard of API 13A. The trend of graph is similar with Fonnulation A, where the
values of plastic viscosity obtained is fluctuating.
42

12
~ 10
~
j 8
6
4
2
0
Acceptable Plastic Viscosity for Fonnulatlon B
--+- Max. Range (8.5 -10 ppg) - - -.....-----............- ~,_ - · - Plastic Viscosity, cP
.- Min. Range (8.5 -10 ppg)
0 2 3 4 5
Amount of Additive, g
Figure 4.7: Acceptable Plastic Viscosity for Formulation B
Figure 4.8 shows the acceptable yield point for formulation B which has the mud
samples with the density between 8.5 - 10 ppg. Based on the figure shown, the yield
point obtained could not achieve the standard range of API 13A. The values of plastic
viscosity only present the acceptable when 3g of additives have been added in the mud.
Further increment of the amount of additive would result the value of yield point to
decrease and become more desirable.
Acceptable Yield Point for Fonnulation B
35
30 -§ - - - - - Max. Range (8.5- 10 ppg) 25 -~ 20 J Yield Point, lb/1 00 ft2 c 0 15 B. 'a .. 10 - Min. Range ( 8.5- 10 ppg)
> 5 -I
>E H IE H u ~
0
0 1 2 3 4 5
Amount of Additive, g
Figure 4.8: Acceptable Yield Point for Formulation B
43

The results of filtrate loss for Formulation B can be shown in Figure 4.9. It is obvious
that the filtration volume is decreasing by adding the amount of additive
(oil palm fibres) into the mud samples. This is similar with the trend which obtained
from Formulation ~ whereby Formulation A also substances of water base mud.
However, the filtration loss for Formulation B with the same densities (8.5 and 8.6 ppg)
is lesser compared to Formulation A. This is due to the mixture of weighting agents,
such as barite and hematite which also can reduce the filtration volume. Besides that, the
percent of reduction for filtration loss is up to 20% when 5g of additive is added.
Therefore, oil palm fibres are still feasible to be used in water base mud which has
added the weighting agents. Additionally, the performance as lost circulation material to
reduce the filtrate loss of drilling fluid is greater.
Filtration Loss for Fonnulation B
25
J e .. !
20 - II-~ 15 ·-""'· "' I s 10 u::
5
0
0 2 3 4 5
Amount of Additive, g
Figure 4.9: Filtration Loss for Formulation B
44
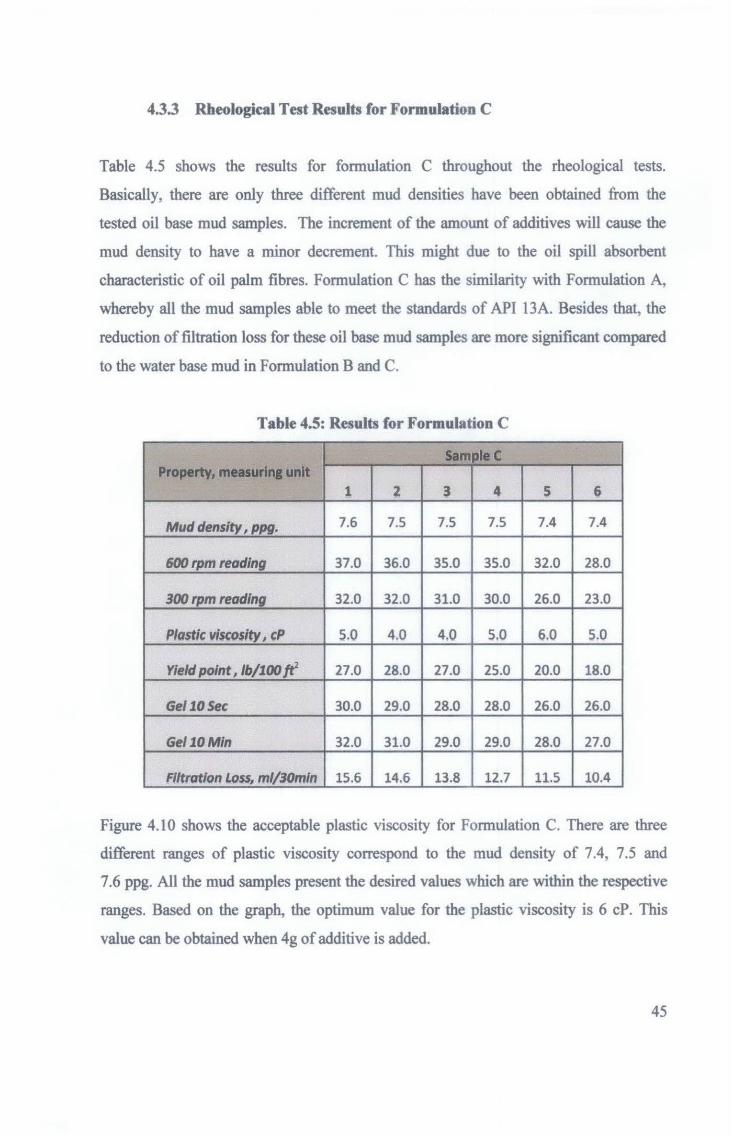
4.3.3 Rheological Test Results for Formulation C
Table 4.5 shows the results for formulation C throughout the rheological tests.
Basically, there are only three different mud densities have been obtained from the
tested oil base mud samples. The increment of the amount of additives will cause the
mud density to have a minor decrement. This might due to the oil spill absorbent
characteristic of oil palm fibres. Formulation C has the similarity with Formulation A,
whereby all the mud samples able to meet the standards of API 13A. Besides that, the
reduction of filtration loss for these oil base mud samples are more significant compared
to the water base mud in Formulation Band C.
Table 4.5: Results for Formulation C
.. .,..~:~ ~· .. ,-,-,;;.~ :~::__.;_-',. ...... ...:.
., 1 2 3 4 5 6
Mud ·,ppg. 7.6 7.5 7.5 7.5 7.4 7.4
600rpm. "''· 37.0 36.0 35.0 35.0 32.0 28.0
300rpm. "''· 32.0 32.0 31.0 30.0 26.0 23.0
Plostlc "'-'""';, cP 5.0 4.0 4,0 5.0 6.0 5.0
Yield point, lb/100 If 27.0 28.0 27.0 25.0 20.0 18.0
Gei10Sec 30.0 29.0 28.0 28.0 26.0 26.0
GeiJOMin 32.0 31.0 29.0 29.0 28.0 27.0
FllftVtlon Loss, ,;:, ............ 15.6 14.6 13.8 12.7 11.5 10.4
Figure 4.10 shows the acceptable plastic viscosity for Formulation C. There are three
different ranges of plastic viscosity correspond to the mud density of 7.4, 7.5 and
7.6 ppg. All the mud samples present the desired values which are within the respective
ranges. Based on the graph, the optimum value for the plastic viscosity is 6 cP. This
value can be obtained when 4g of additive is added.
45

Acceptable Plastic Viscosity for Fonnulatlon C ---- Max. Range (7.6 ppg)
8 r Max. Range (7.5 ppg) - - - -- - -0. 7 u
~ ~--*"- *" -...lk
6 _ .....
§ ~~ - Max. Range (7 4 ppg) 5 ~ ~ > 4
u -il- Plastic Viscosity, cP
1 3
Q: 2 -1
... ... ~ Mm. Range (7 6 ppg)
0
0 1 2 3 4 5 - Min. Range (7 5 ppg)
Amount of Additive, g - Min. Range (7 4 ppg)
Figure 4.10: Acceptable Plastic Viscosity for Formulation C
Figure 4.11 shows the acceptable yield point for Formulation C. The desired results are
shown, where all the values obtained from rheological experiments are between the
maximum range and minimum range for the mud with density from 7.4 to 7.5 ppg. The
optimum value is 28 lb/1 00 ff when 1 g of additive is added. Further on, the value of
yield point decreases as the amount of additive increases. It is estimated the further
increment of amount would also result the value of yield point to decrease.
Acceptable Yield Point for Fonnulatlon C
40 - Max. Range (7 .6 ppg)
35 ~f w ·~ ·~ ~ 2 ... Max. Range (7.5 ppg)
8 30 ...Jit. ... 25
liiC ....._ - Max. Range (7.4 ppg) ;e "-.. .; 20 c ~
0 15 - Yield Point, lb/100 ft2 a. , 10 "i s: 5 ~ Min. Range (7.6 ppg)
• • • • • • 0
0 1 2 3 4 5 - Min. Range (7.5 ppg)
Amount of Additive, g - Min. Range (7.4 ppg)
Figure 4.11: Acceptable Yield Point for Formulation C
46
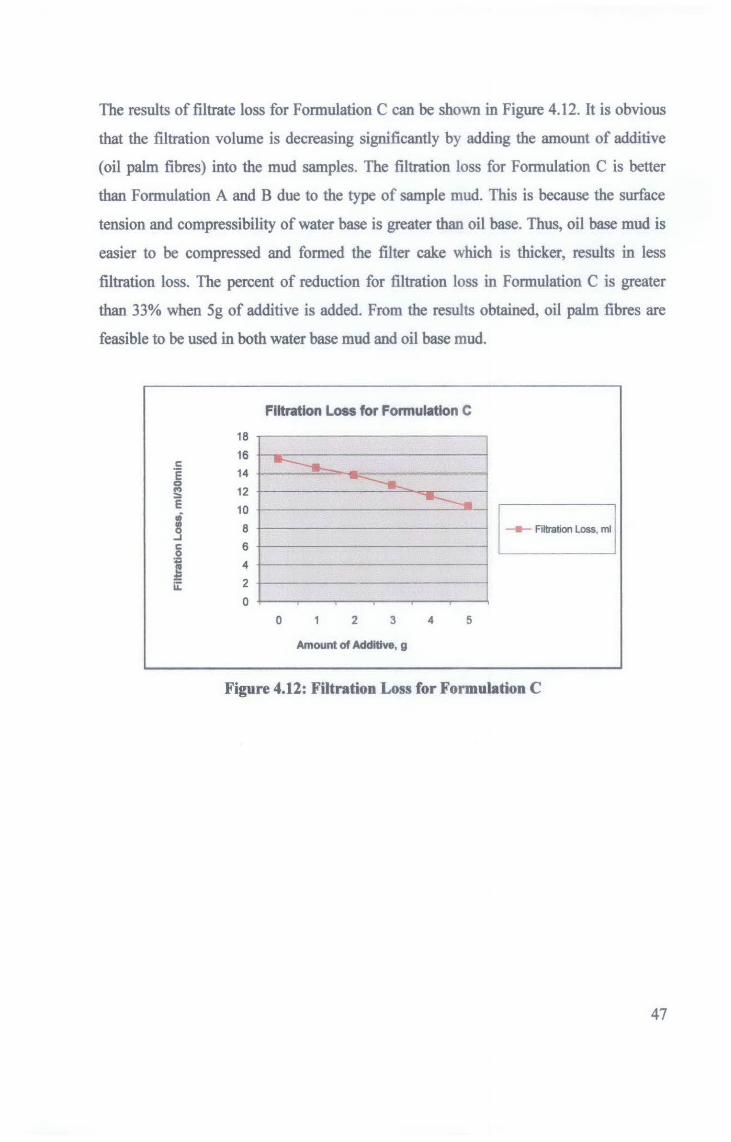
The results of filtrate loss for Formulation C can be shown in Figure 4.12. It is obvious
that the filtration volume is decreasing significantly by adding the amount of additive
(oil palm fibres) into the mud samples. The filtration loss for Formulation C is better
than Formulation A and B due to the type of sample mud. This is because the surface
tension and compressibility of water base is greater than oil base. Thus, oil base mud is
easier to be compressed and formed the filter cake which is thicker, results in less
filtration loss. The percent of reduction for filtration loss in Formulation C is greater
than 33% when 5g of additive is added. From the results obtained, oil palm fibres are
feasible to be used in both water base mud and oil base mud.
Filtration Loss for Fonnulatlon C
18 -~
16 c . -~ e 14 0 -~ ~ 12 ----...... E 10 FU,__,I H 8 ...I
5 6 ., 4 I
ii: 2
0
0 2 3 4 5
Amount of Additive, g
Figure 4.12: Filtration Loss for Formulation C
47

CHAPTERS
CONCLUSION AND RECOMMENDATION
5.1 Conclusion
In drilling operation, the fractured rock formations provide areas of high permeability
that allow drilling fluid to seep into the openings. In order to inhibit this loss, the drilling
mud used must contain lost circulation material which act as sealing agent. One problem
with conventional lost circulation material is they are not completely effective in closing
the openings and preventing the loss of drilling fluid. The objective of the project is to
propose a new lost circulation material that can mix into the drilling mud and effective
in reducing the filtration loss. Besides that, it is also tend to fulfil the requirement of
American Petroleum Institute (API) Standards.
Based on the obtained results, the present study found that the proposed material
(oil palm fibres) are feasible to be used as lost circulation material in both water base
mud and oil base mud. The oil palm fibres not only can reduce the filtration loss, but
also can act as viscosifier agent to reduce the viscosity of the mud. Moreover, the
prepared mud samples with oil palm fibres are able to meet the standards of American
Petroleum Institute (API) Standards.
5.2 Recommendation
Careful drilling practices used in conjunction with the drilling mud which is most
suitable can optimise drilling progress and minimise sample disturbance. As with all
other aspects of planning and executing a quality drilling and sampling programme,
there are certain facets of the selected drilling mud should be considered.
48

Formation Damage System (FDS) is the damage test system designed for formation
damage testing of core samples. Test can be performed with before and after
permeability measurement in both forward and reverse direction. It can simulate the
flow in both directions between the formation and the borehole. The sample analysis on
formation damage system can use to check the changes of permeability by injecting the
sample mud mixed with oil palm fibres. If the reduction of permeability is significant,
indicates that oil palm fibres are feasible as lost circulation material.
Besides that, there is a need to conduct detailed study on maximum percentage of oil
palm fibre to be added without affecting its function in improving lost circulation
material. Moreover, laboratory experiments on rheological tests by using different
particle size of oil palm fibres can be considered to determine the suitable size of oil
palm fibres which can provide optimum performance.
49

REFERENCES
[1] Greek lignites as additives for controlling filtration properties of water-bentonite
suspensions at high temperatures by Vassilios C. Kelessidis, Christina Tsamantaki,
Athanasios Michalakis, George E. Christidis, Pagona Makri, Kassiani Papanicolaou,
Antonios Foscolos.
[2] <http://www.seed.slb.com/en/scictr/watch/mud/char.htm>
[3] H. Rabia, 1985, Oilwell Drilling Engineering: Principles and Practice, Graham &
Trotman Limited.
[ 4] <http:/ /www.seed.slb.com/en/scictr/watch/mud/char.htm>
[ 5] <http:/ /en. wikipedia.orglwiki!Mud _engineer>
[ 6] <http:/ /www.halliburton.com/public/news/source _ files/Newsletters/KCNews/2006/
May06Bar _FUSEIT.html?positionl'age I>
[7] Experiment investigation of drilling fluid formulation and processing method for a
riser dilution approach to dual density reading by John Shelton, Purdue University,
Indiana.
[8] Dolomite as an alternative weighting agent in drilling fluid by M.J. Badrul, L.L.
Chiou, Z. Azlina, Z. Juliana, University of Malaya, 2007.
[9] Method for using coconut coir as a lost circulation material for well drilling by
Macquoid Malcom, Skodack David, 2004.
[10] A.T. Bourgoyne Jr., K.K. Millheim, M.E. Chenevert, F.S. Young, 1991, Applied
Drilling Engineering, Society of Petroleum Engineers.
50

[11] Corn cobs and sugar cane waste as a viscosivier in drilling fluid by Ahmad
Zakuan, Mohd. Saaid, Sonny Irawan
[12] Recommended Practice for Field Testing Water Based Drilling Fluid, API
Recommended Practice l3B-l Third Edition, 2003
[13] Recommended Practice Standard Procedure for Field Testing Oil Based Drilling
Fluid, API Recommended Practice l3B-2 Third Edition, 1998
[14] Chemical composition, anatomy, lignin distribution and cell wall structure of
Malaysian plant waste fibres by H.P.S. Abdul Khalil, M. Siti Alwani, A.K. Mohd Omar,
2006
[15] <http://www.gi.alaska.edu/ScienceForum/ ASF13/l307 .html>
51