drinking from the firehose - real-time metrics
TRANSCRIPT

Drinking from the Firehose Real-Time Metrics
Samantha Quiñones


“How would you let editors test how well
different headlines perform for the same
piece of content?”

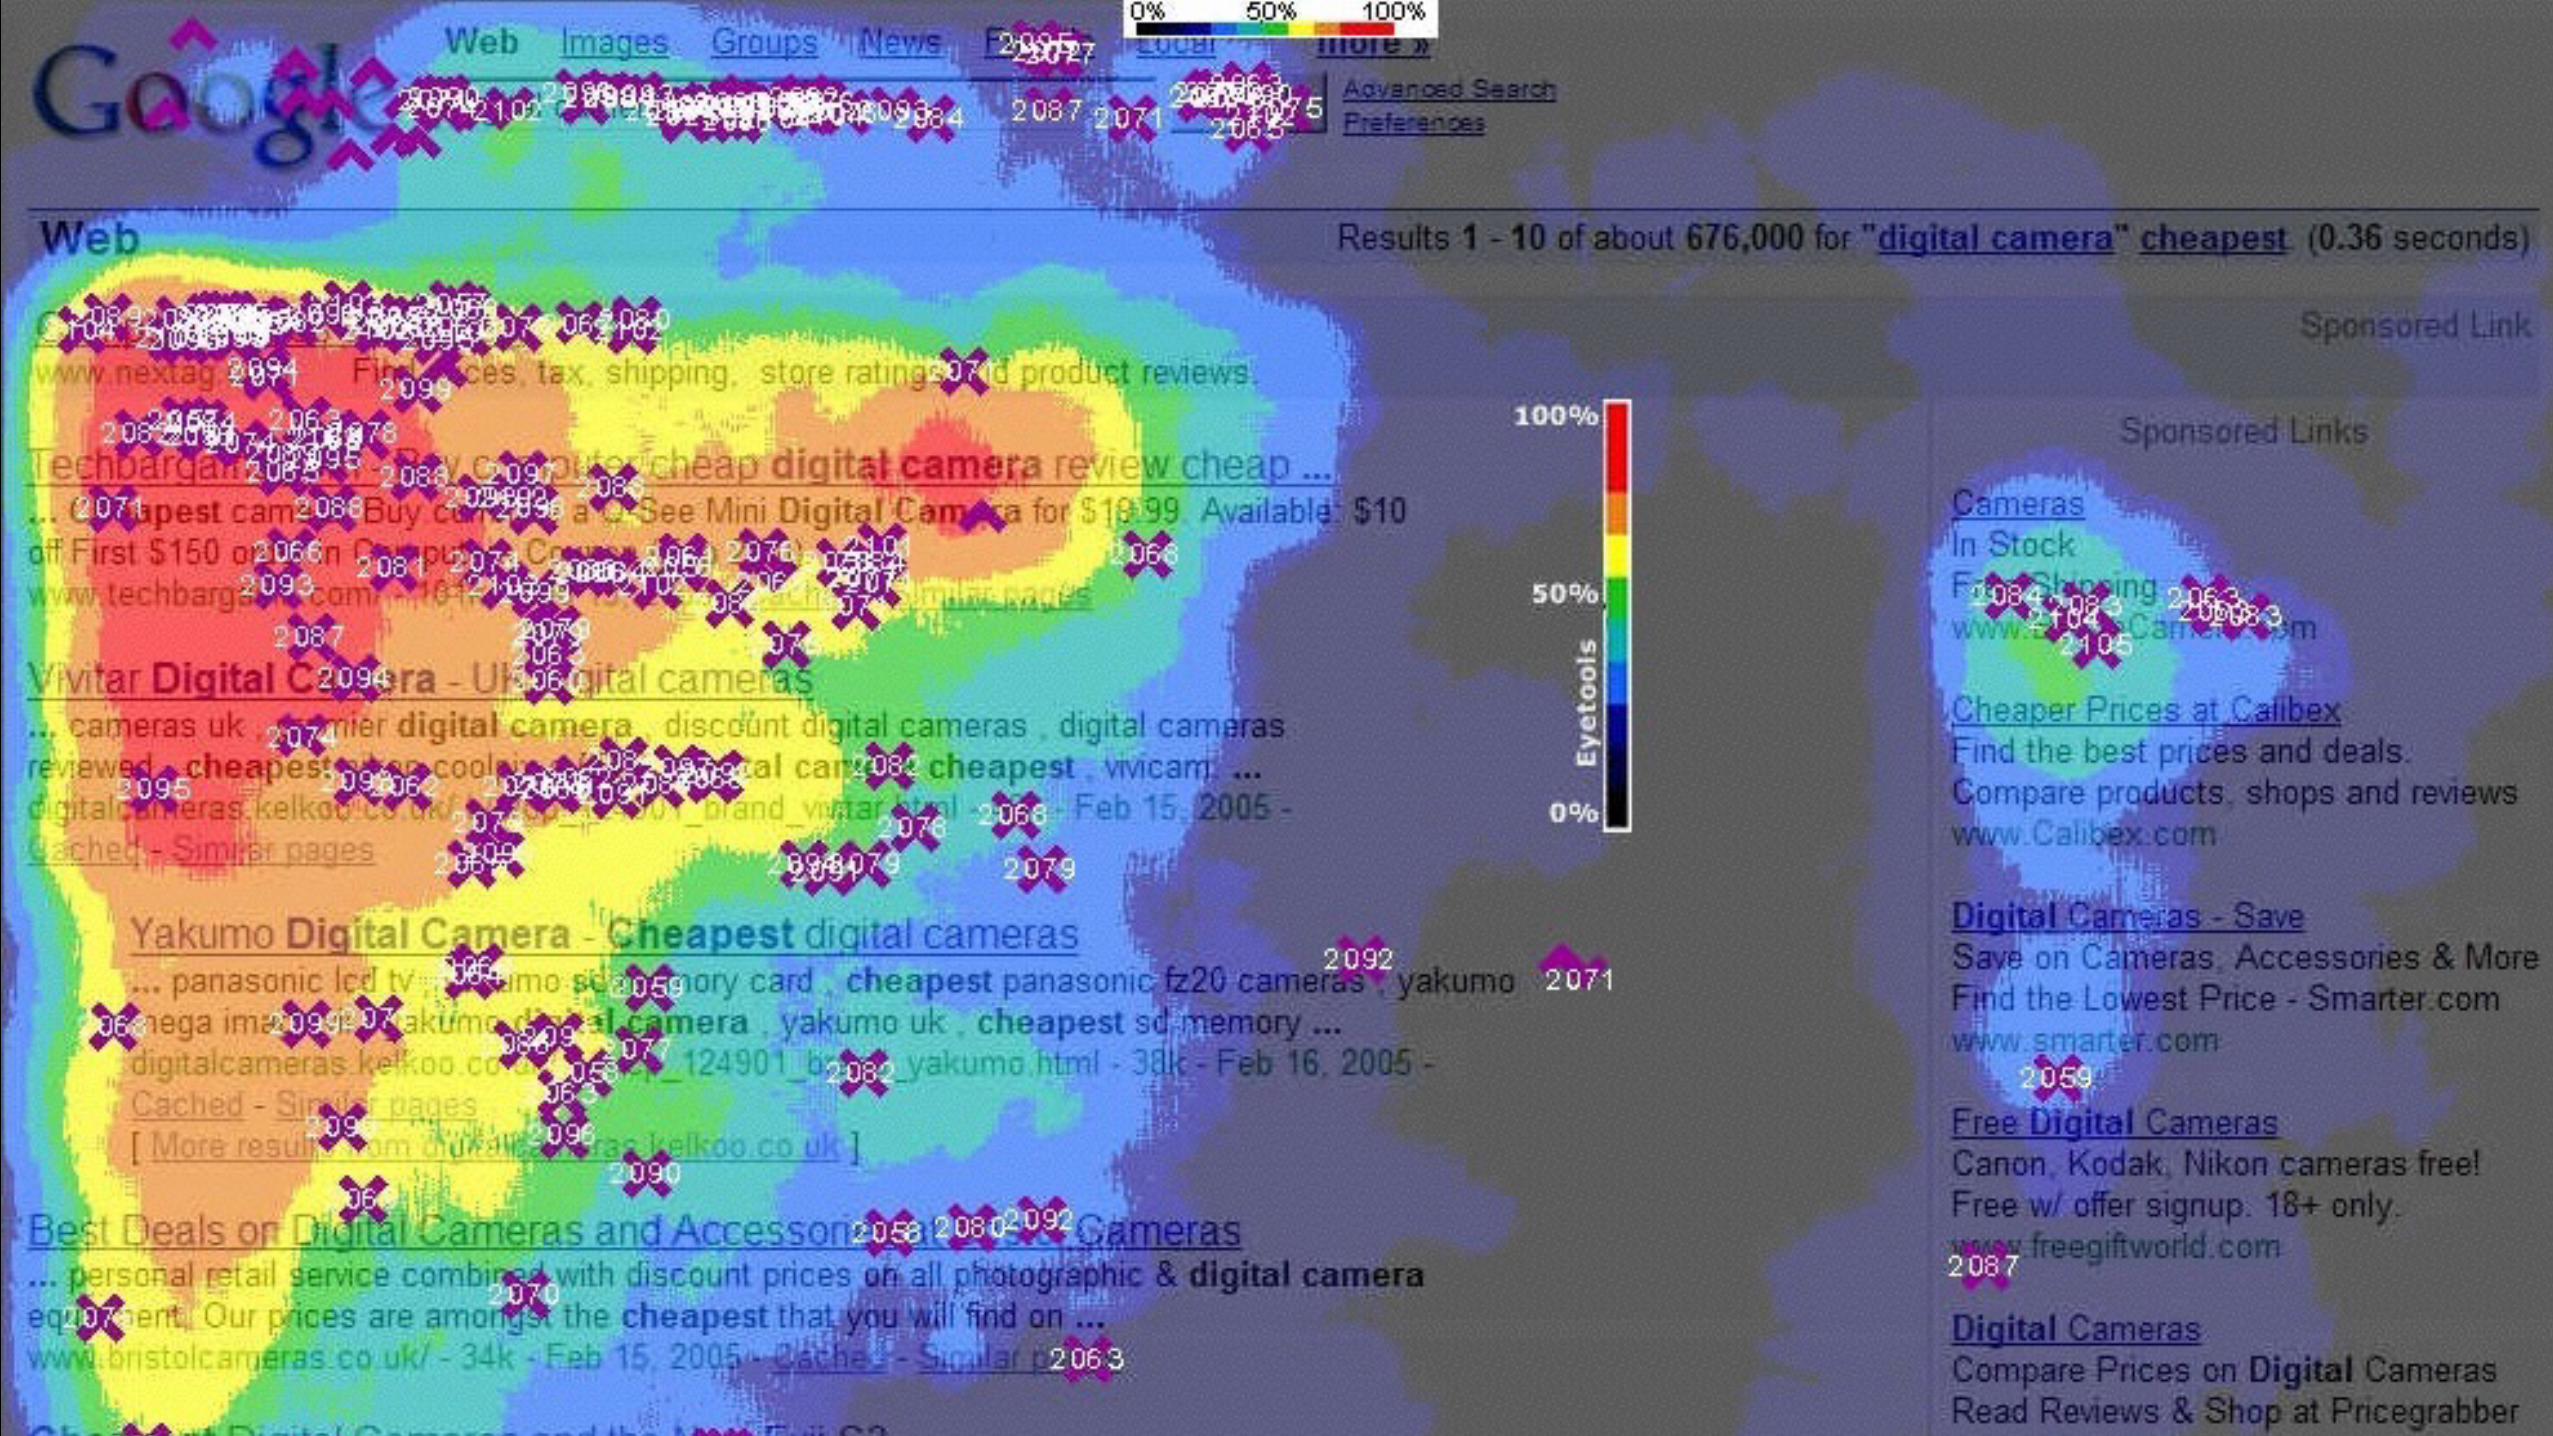
Measuring User Behavior
• Application path
• Use patterns
• Mouse & attention tracking

Multivariate Testing
• Sort all users in to groups
• 1 control group receives unaltered content
• 1 or more groups receive altered content
• Measure behavioral statistics (CTR, abandon rate, time on page, scroll depth) for each group

State Monitoring
• Debugging
• Load Monitoring

And then…?

• Augmented intelligence for content creators
• Quality prediction

What if content could change itself based on the weather?

Managing Big Data

How big is big?

1,300,000,000,000events per
DAY

~40 datapointsper
EVENT

~15,000 eventsper
SECOND

~600,000 datapoints
Containing

25 megabytes / second
At a rate up to

CollectorCollectorCollectorCollector CollectorCollectorCollectorCollector CollectorCollectorCollectorCollector
Rabbit MQ Farm
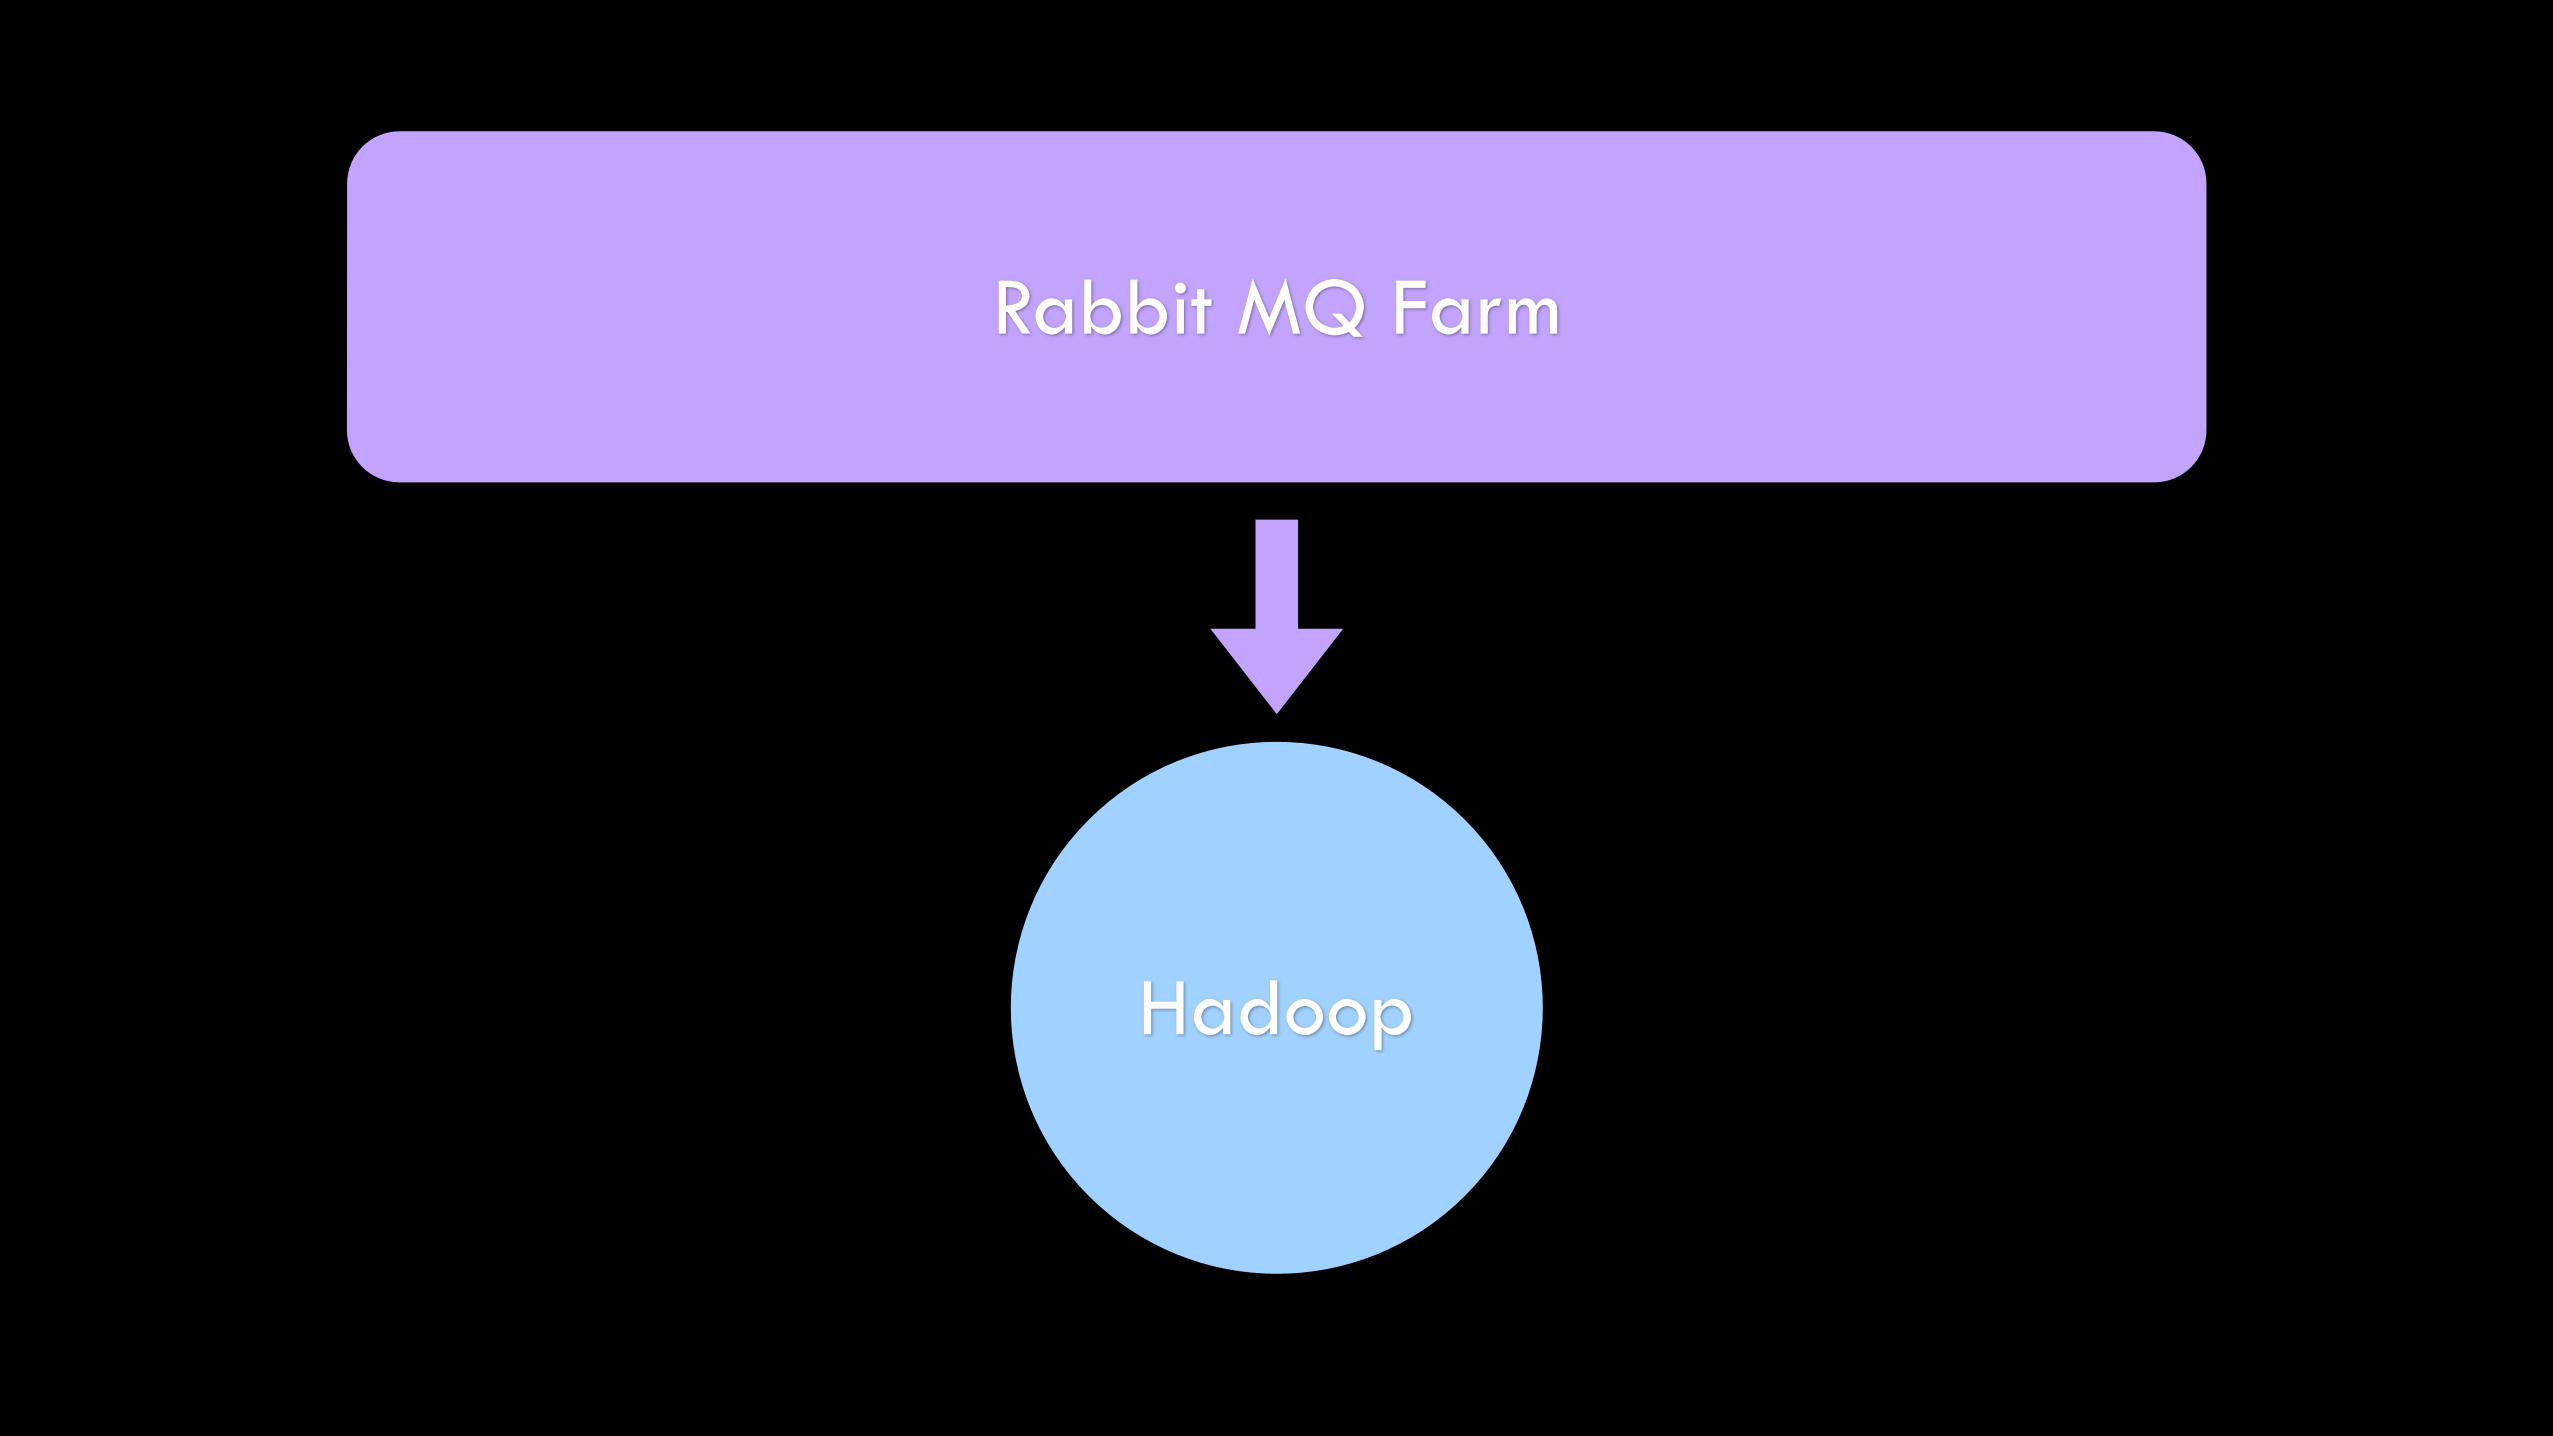
Rabbit MQ Farm
Hadoop

Hadoop
• Framework for distributed storage and processing of data
• Designed to make managing very large datasets simple with…
• Well-documented, open-source, common libraries
• Optimizing for commodity hardware
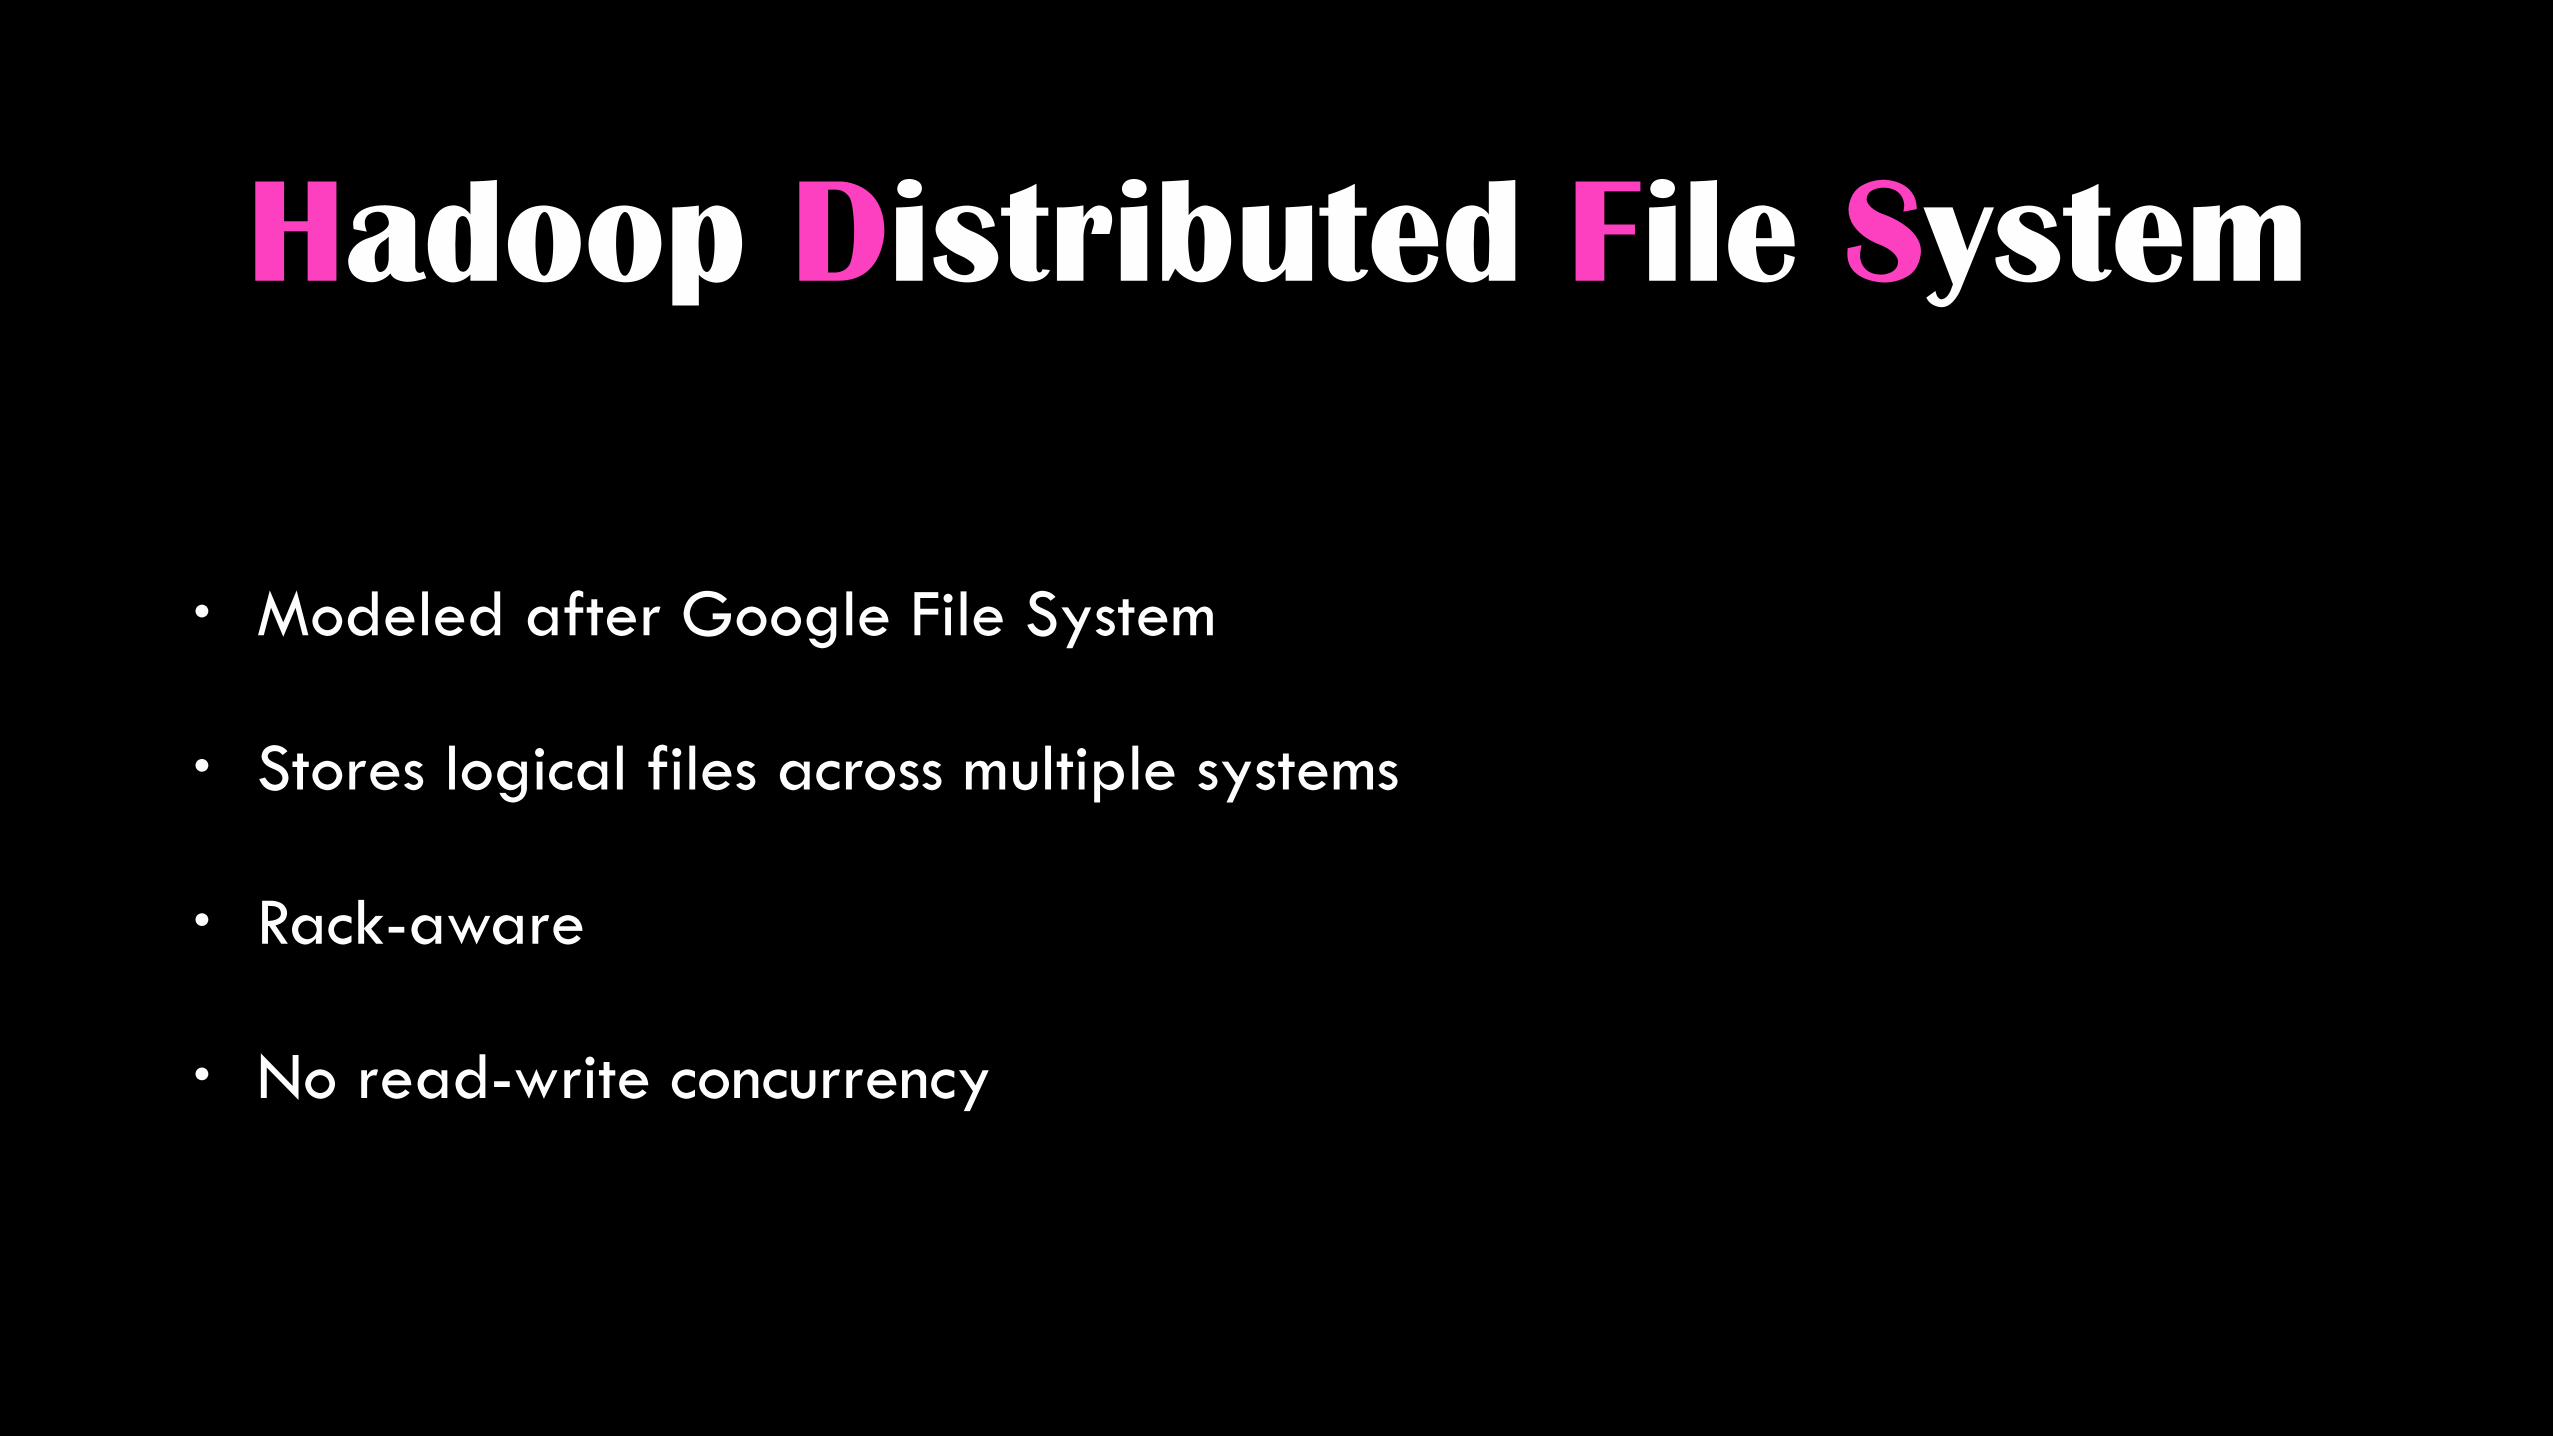
Hadoop Distributed File System
• Modeled after Google File System
• Stores logical files across multiple systems
• Rack-aware
• No read-write concurrency

MapReduce
• Framework for massively parallel data processing tasks

Map<?php $document = "I'm a little teapot short and stout here is my handle here is my spout";
/** * Outputs: [0,0,0,0,0,0,0,0,1,0,0,0,1,0,0] */ function map($target_word, $document) { return array_map( function ($word) use ($target_word) { if ($word === $target_word) { return 1; } return 0; }, preg_split('/\s+/', $document) ); } echo json_encode(map("is", $document)) . PHP_EOL;
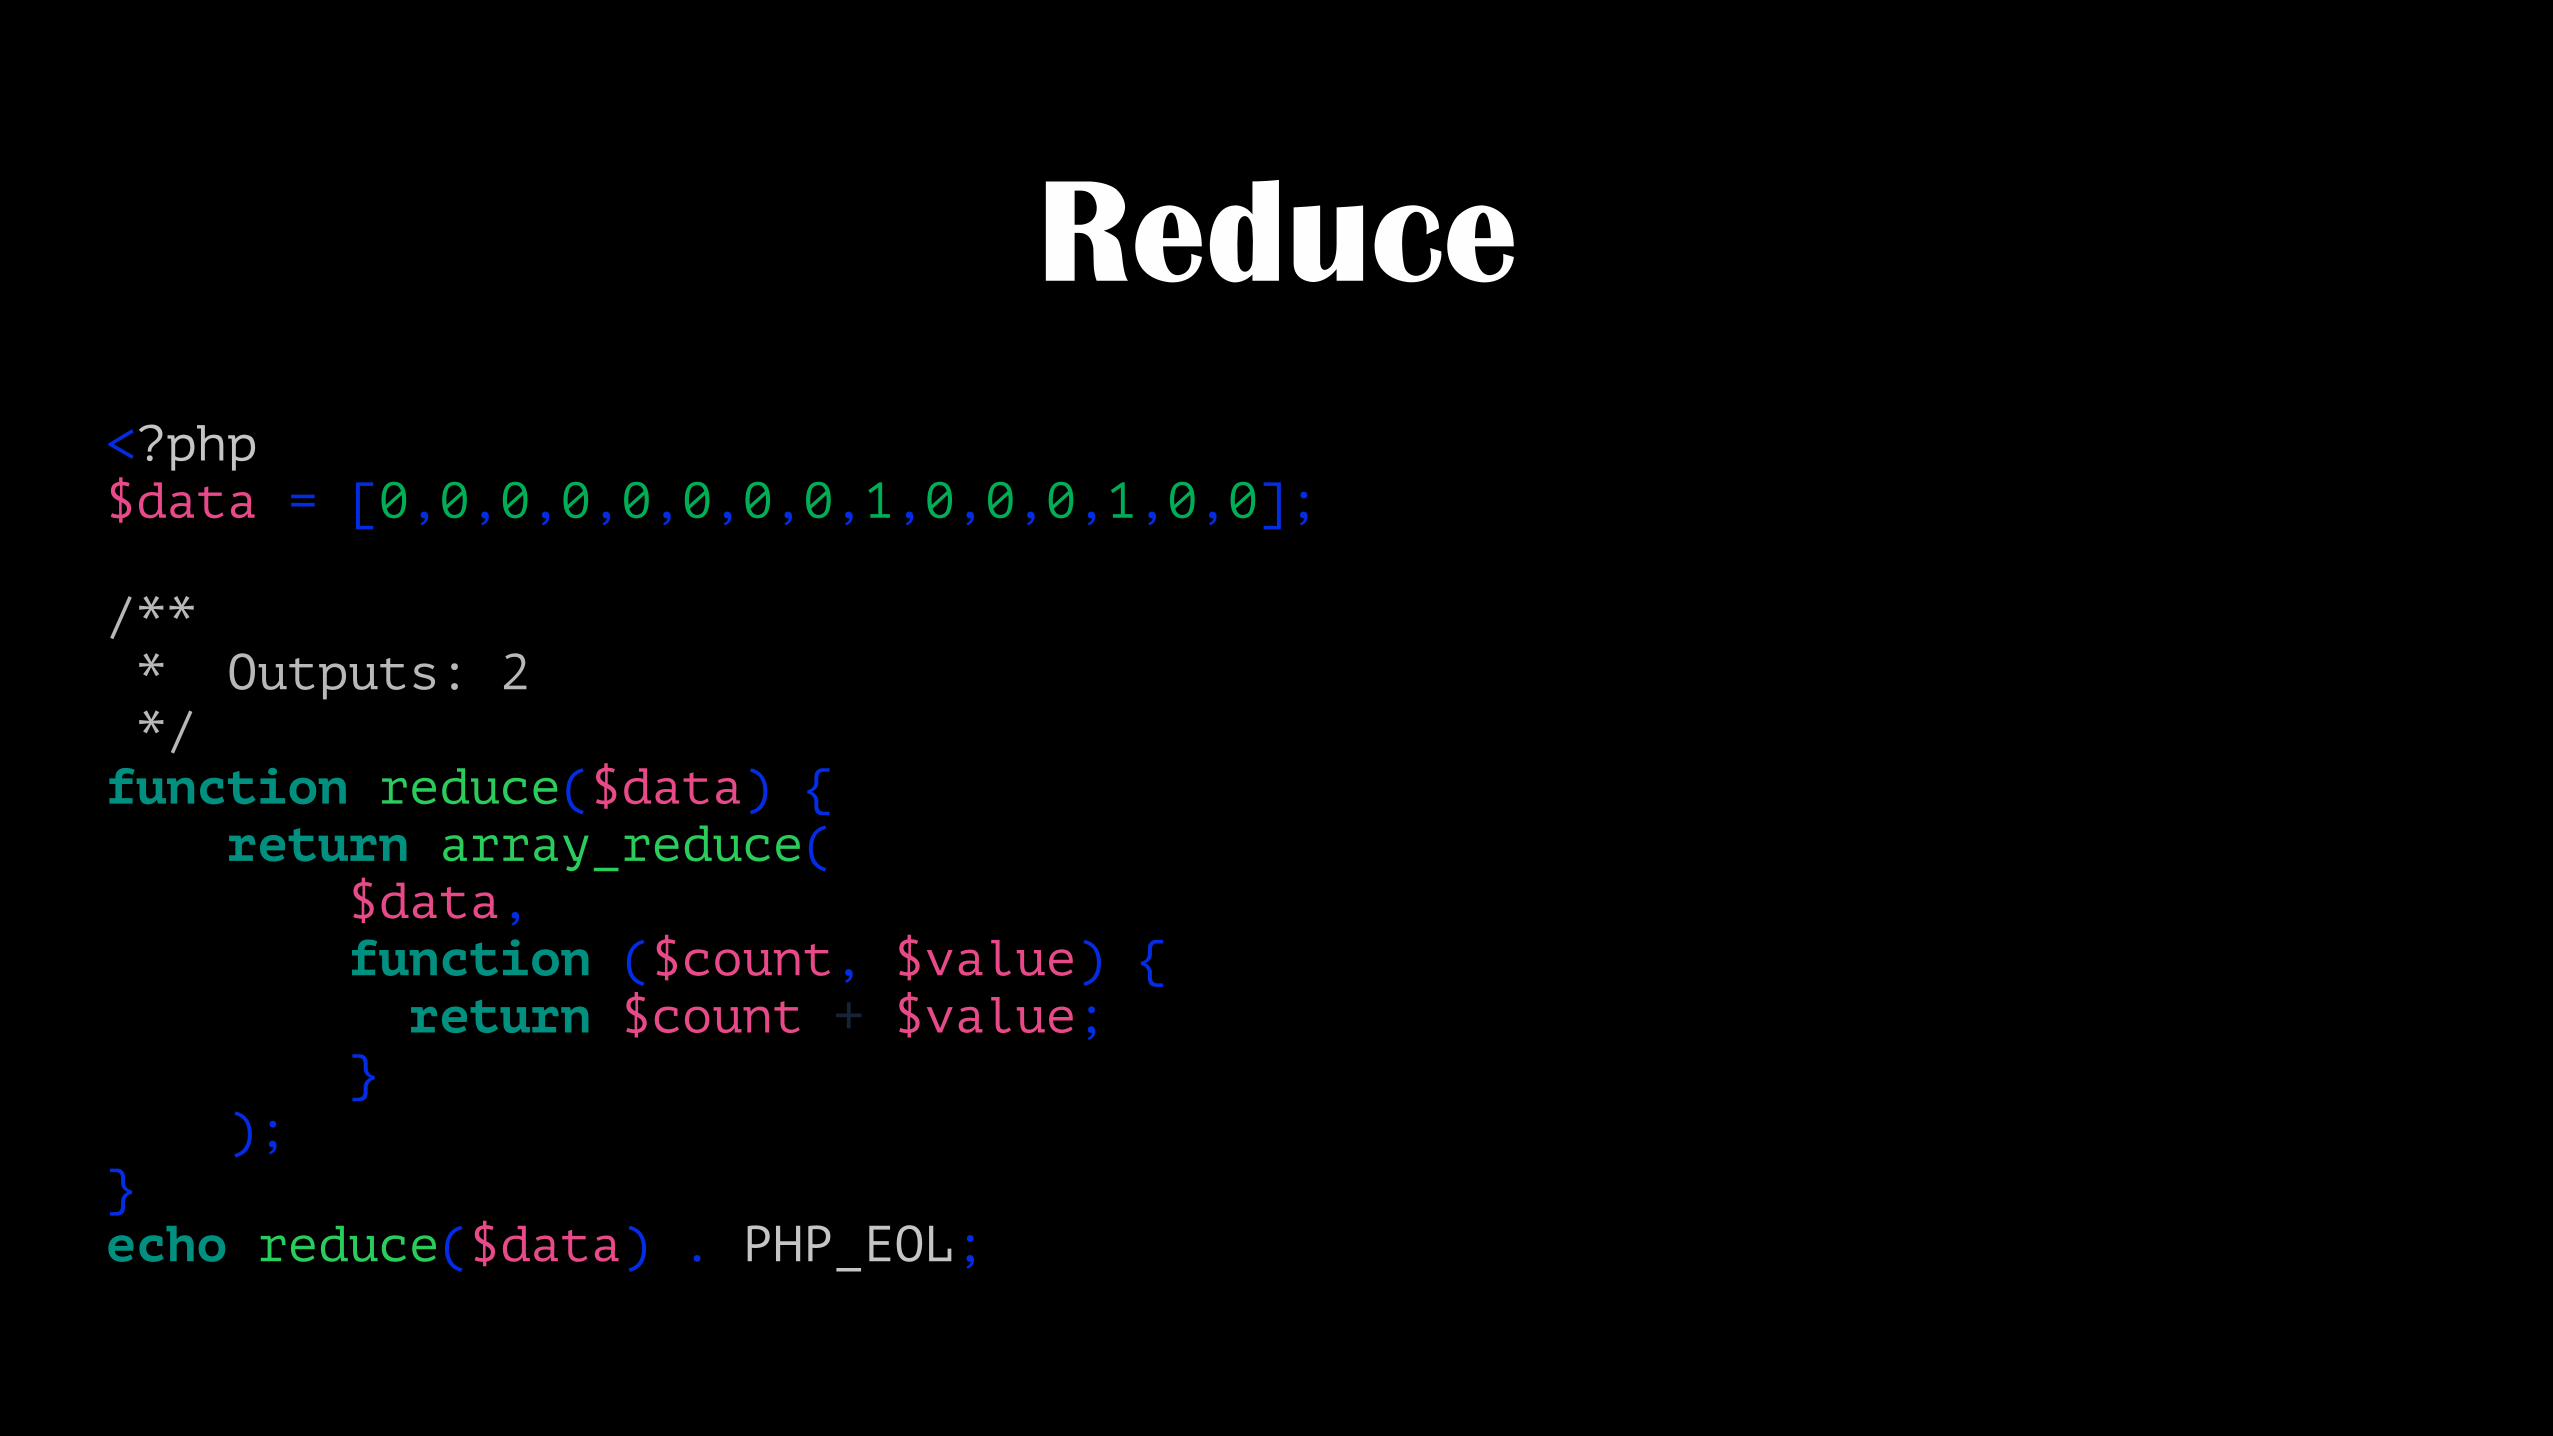
Reduce<?php $data = [0,0,0,0,0,0,0,0,1,0,0,0,1,0,0];
/** * Outputs: 2 */ function reduce($data) { return array_reduce( $data, function ($count, $value) { return $count + $value; } ); } echo reduce($data) . PHP_EOL;

Hadoop Limitations
• Hadoop jobs are batched and take significant time to run
• Data may not be available for 1+ hours after collection
“How would you let editors test how well
different headlines perform for the same
piece of content?”

Consider Shelf-life
• Most articles are relevant for < 24 hours
• Interest peaks < 3 hours

Real-Time Pipelines

CollectorCollectorCollectorCollector
CollectorCollectorCollectorCollector
CollectorCollectorCollectorCollector
Rabbit MQ Farm
CollectorCollectorCollectorStreamer
CollectorCollectorCollectorStreamer
CollectorCollectorCollectorStreamer


Version 1 (PoC)
CollectorCollectorCollectorStreamer CollectorCollectorCollectorReceiver CollectorCollectorCollectorStatsD Cluster
ElasticSearch

this.visit = function(record) { if (record.userAgent) { var parser = new UAParser(); parser.setUA(record.userAgent); var user_agent = parser.getResult(); return { user_agent: user_agent } } return {}; };

Findings
• Max throughput per collector: 300 events/second
• ~70 receivers needed for prod
• StatsD key format creates data redundancy and reduced data richness

Version 1 (PoC)
CollectorCollectorCollectorStreamer CollectorCollectorCollectorReceiver CollectorCollectorCollectorStatsD Cluster
ElasticSearch

Transits & Terminals
• Transits - Short-term, in-memory, volatile storage for data with a life-span up to a few seconds
• Terminals - Destinations for data that either store, abandon, or transmit

An efficient real-time data pathway consists
of a network of transits and terminals, where
no single node acts as both a transit and a
terminal at the same time.

StatsD
• Acts as a transit, taking data and passing it along…
• BUT
• Acts as a terminal, aggregating keys in memory and becoming a transit after a time or buffer threshold.

Version 2
CollectorCollectorCollectorStreamer CollectorCollectorCollectorReceiver ElasticSearchRabbitMQ

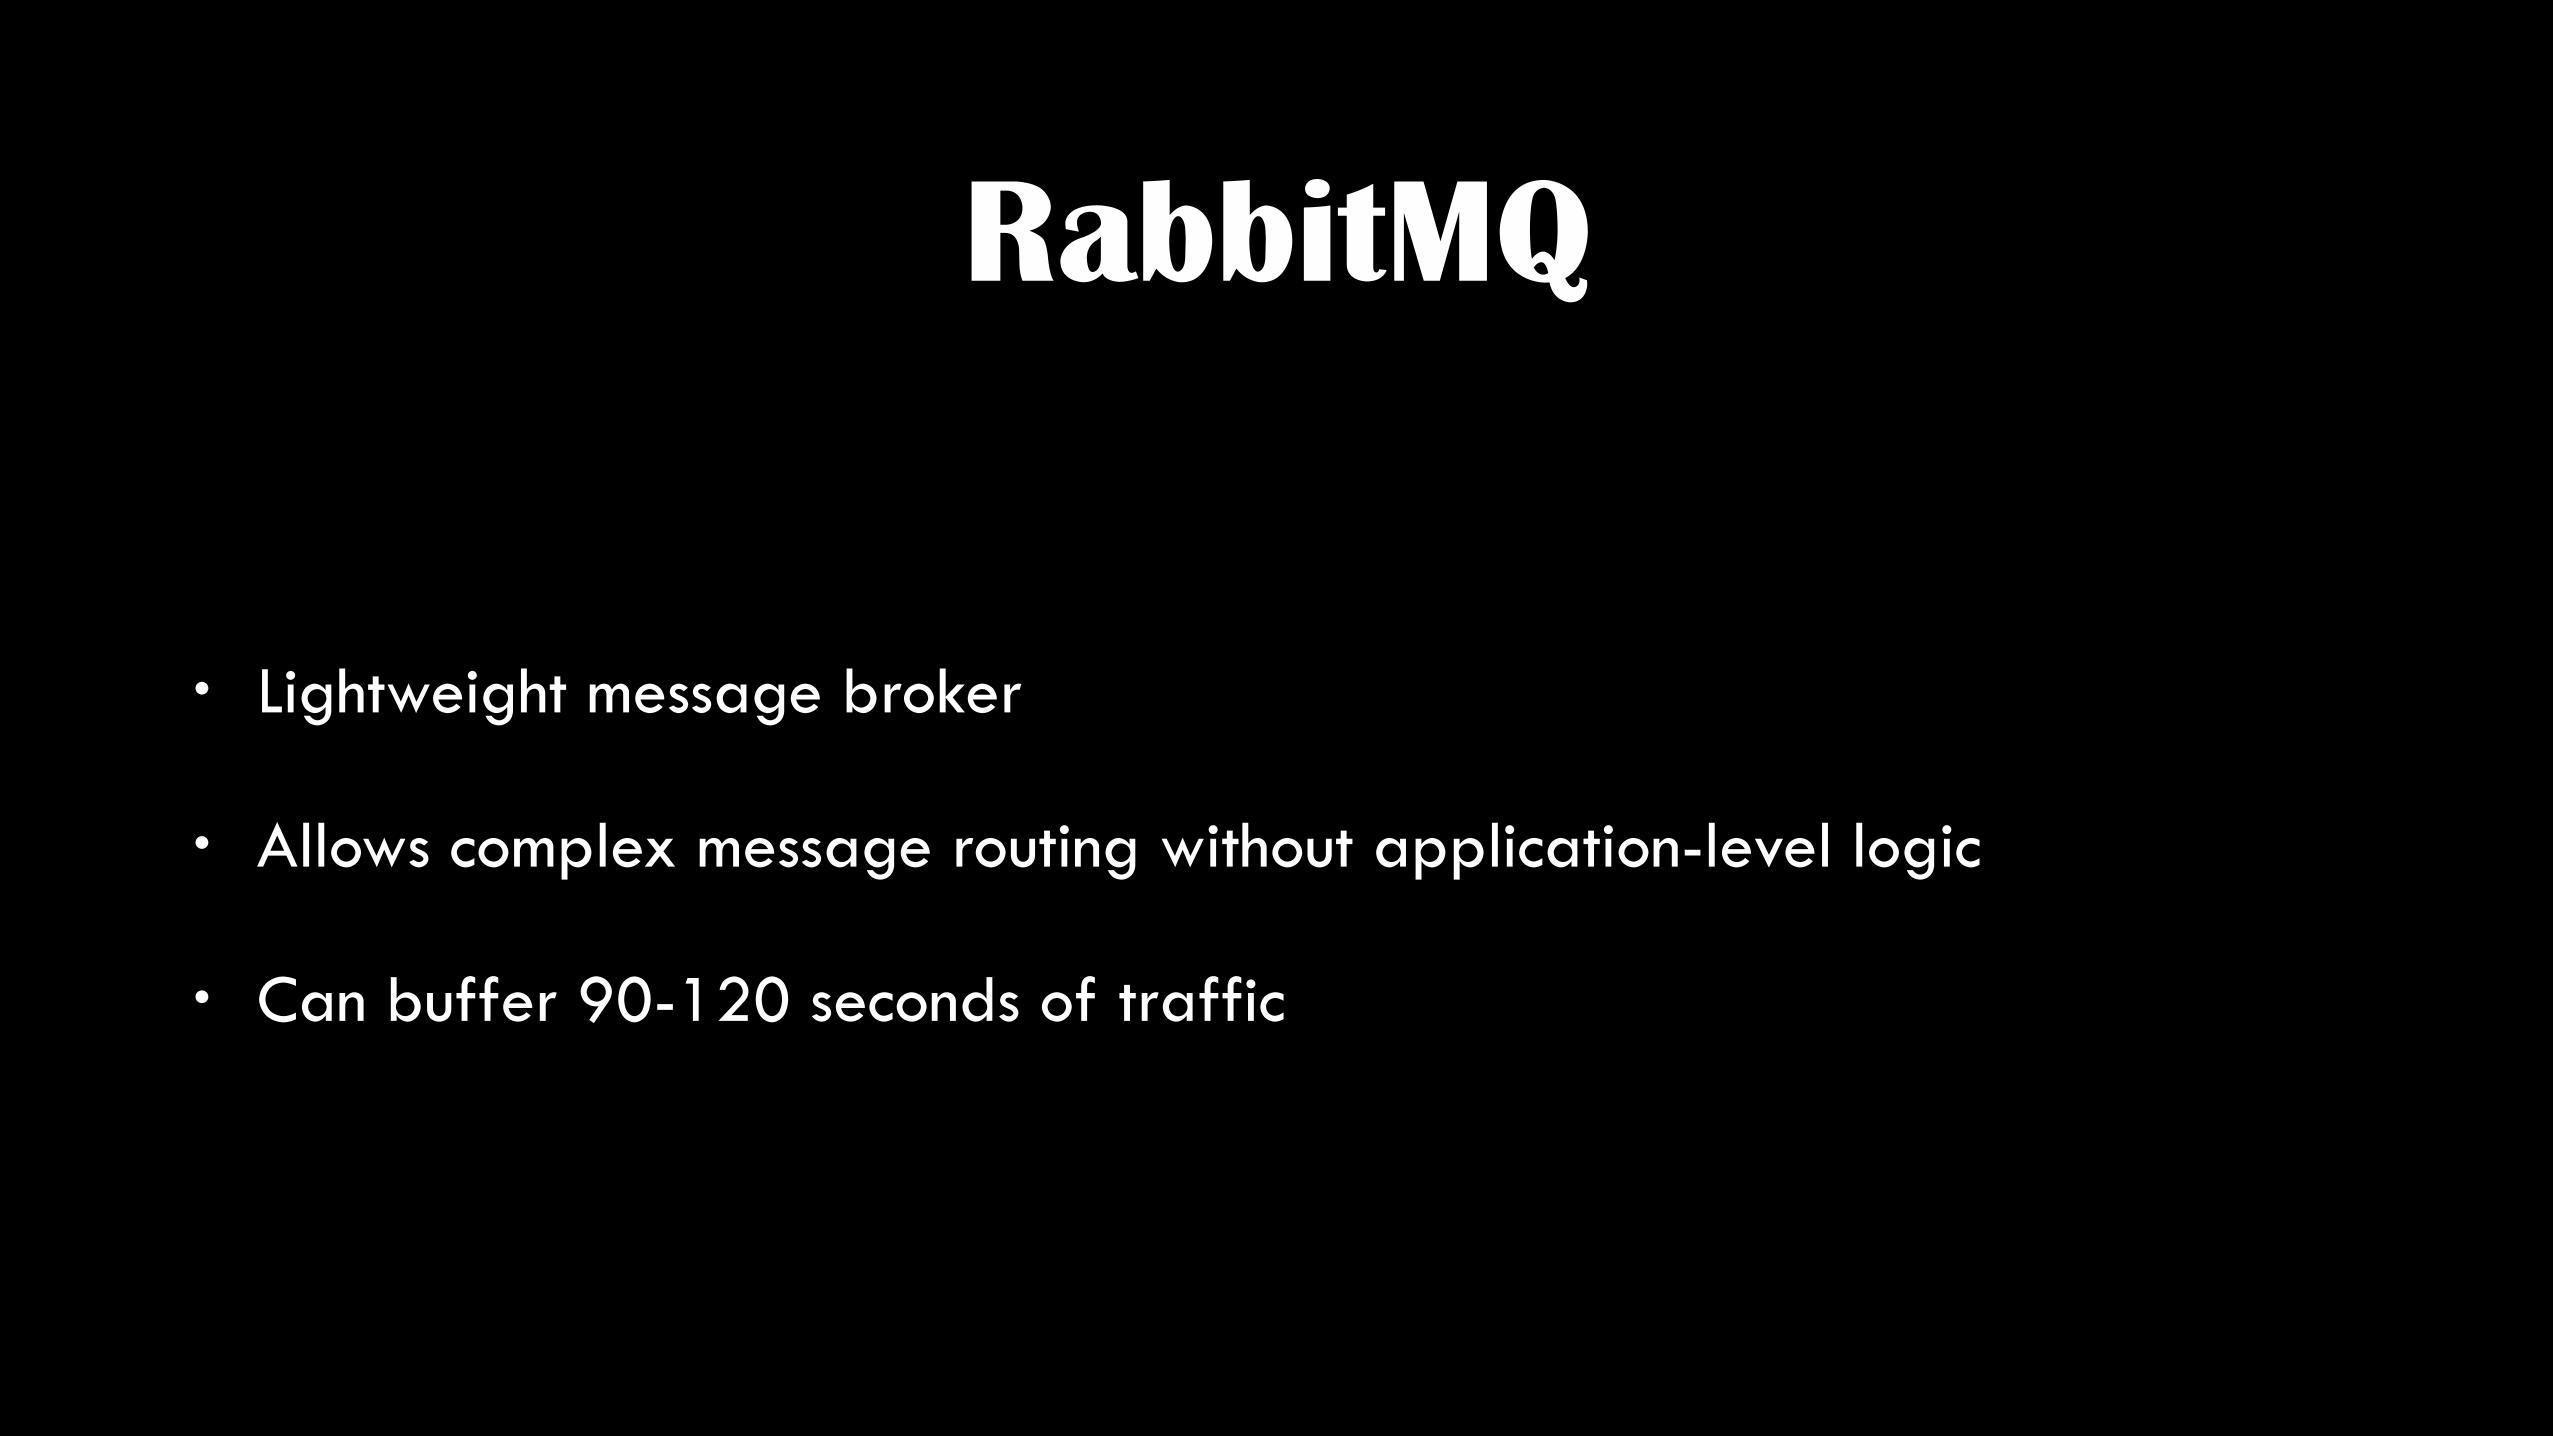
RabbitMQ
• Lightweight message broker
• Allows complex message routing without application-level logic
• Can buffer 90-120 seconds of traffic

Version 2
• Eliminated eventing and improved performance
• Replaced StatsD with RabbitMQ
• Data records are kept together
• No longer works with Kibana (sadface)
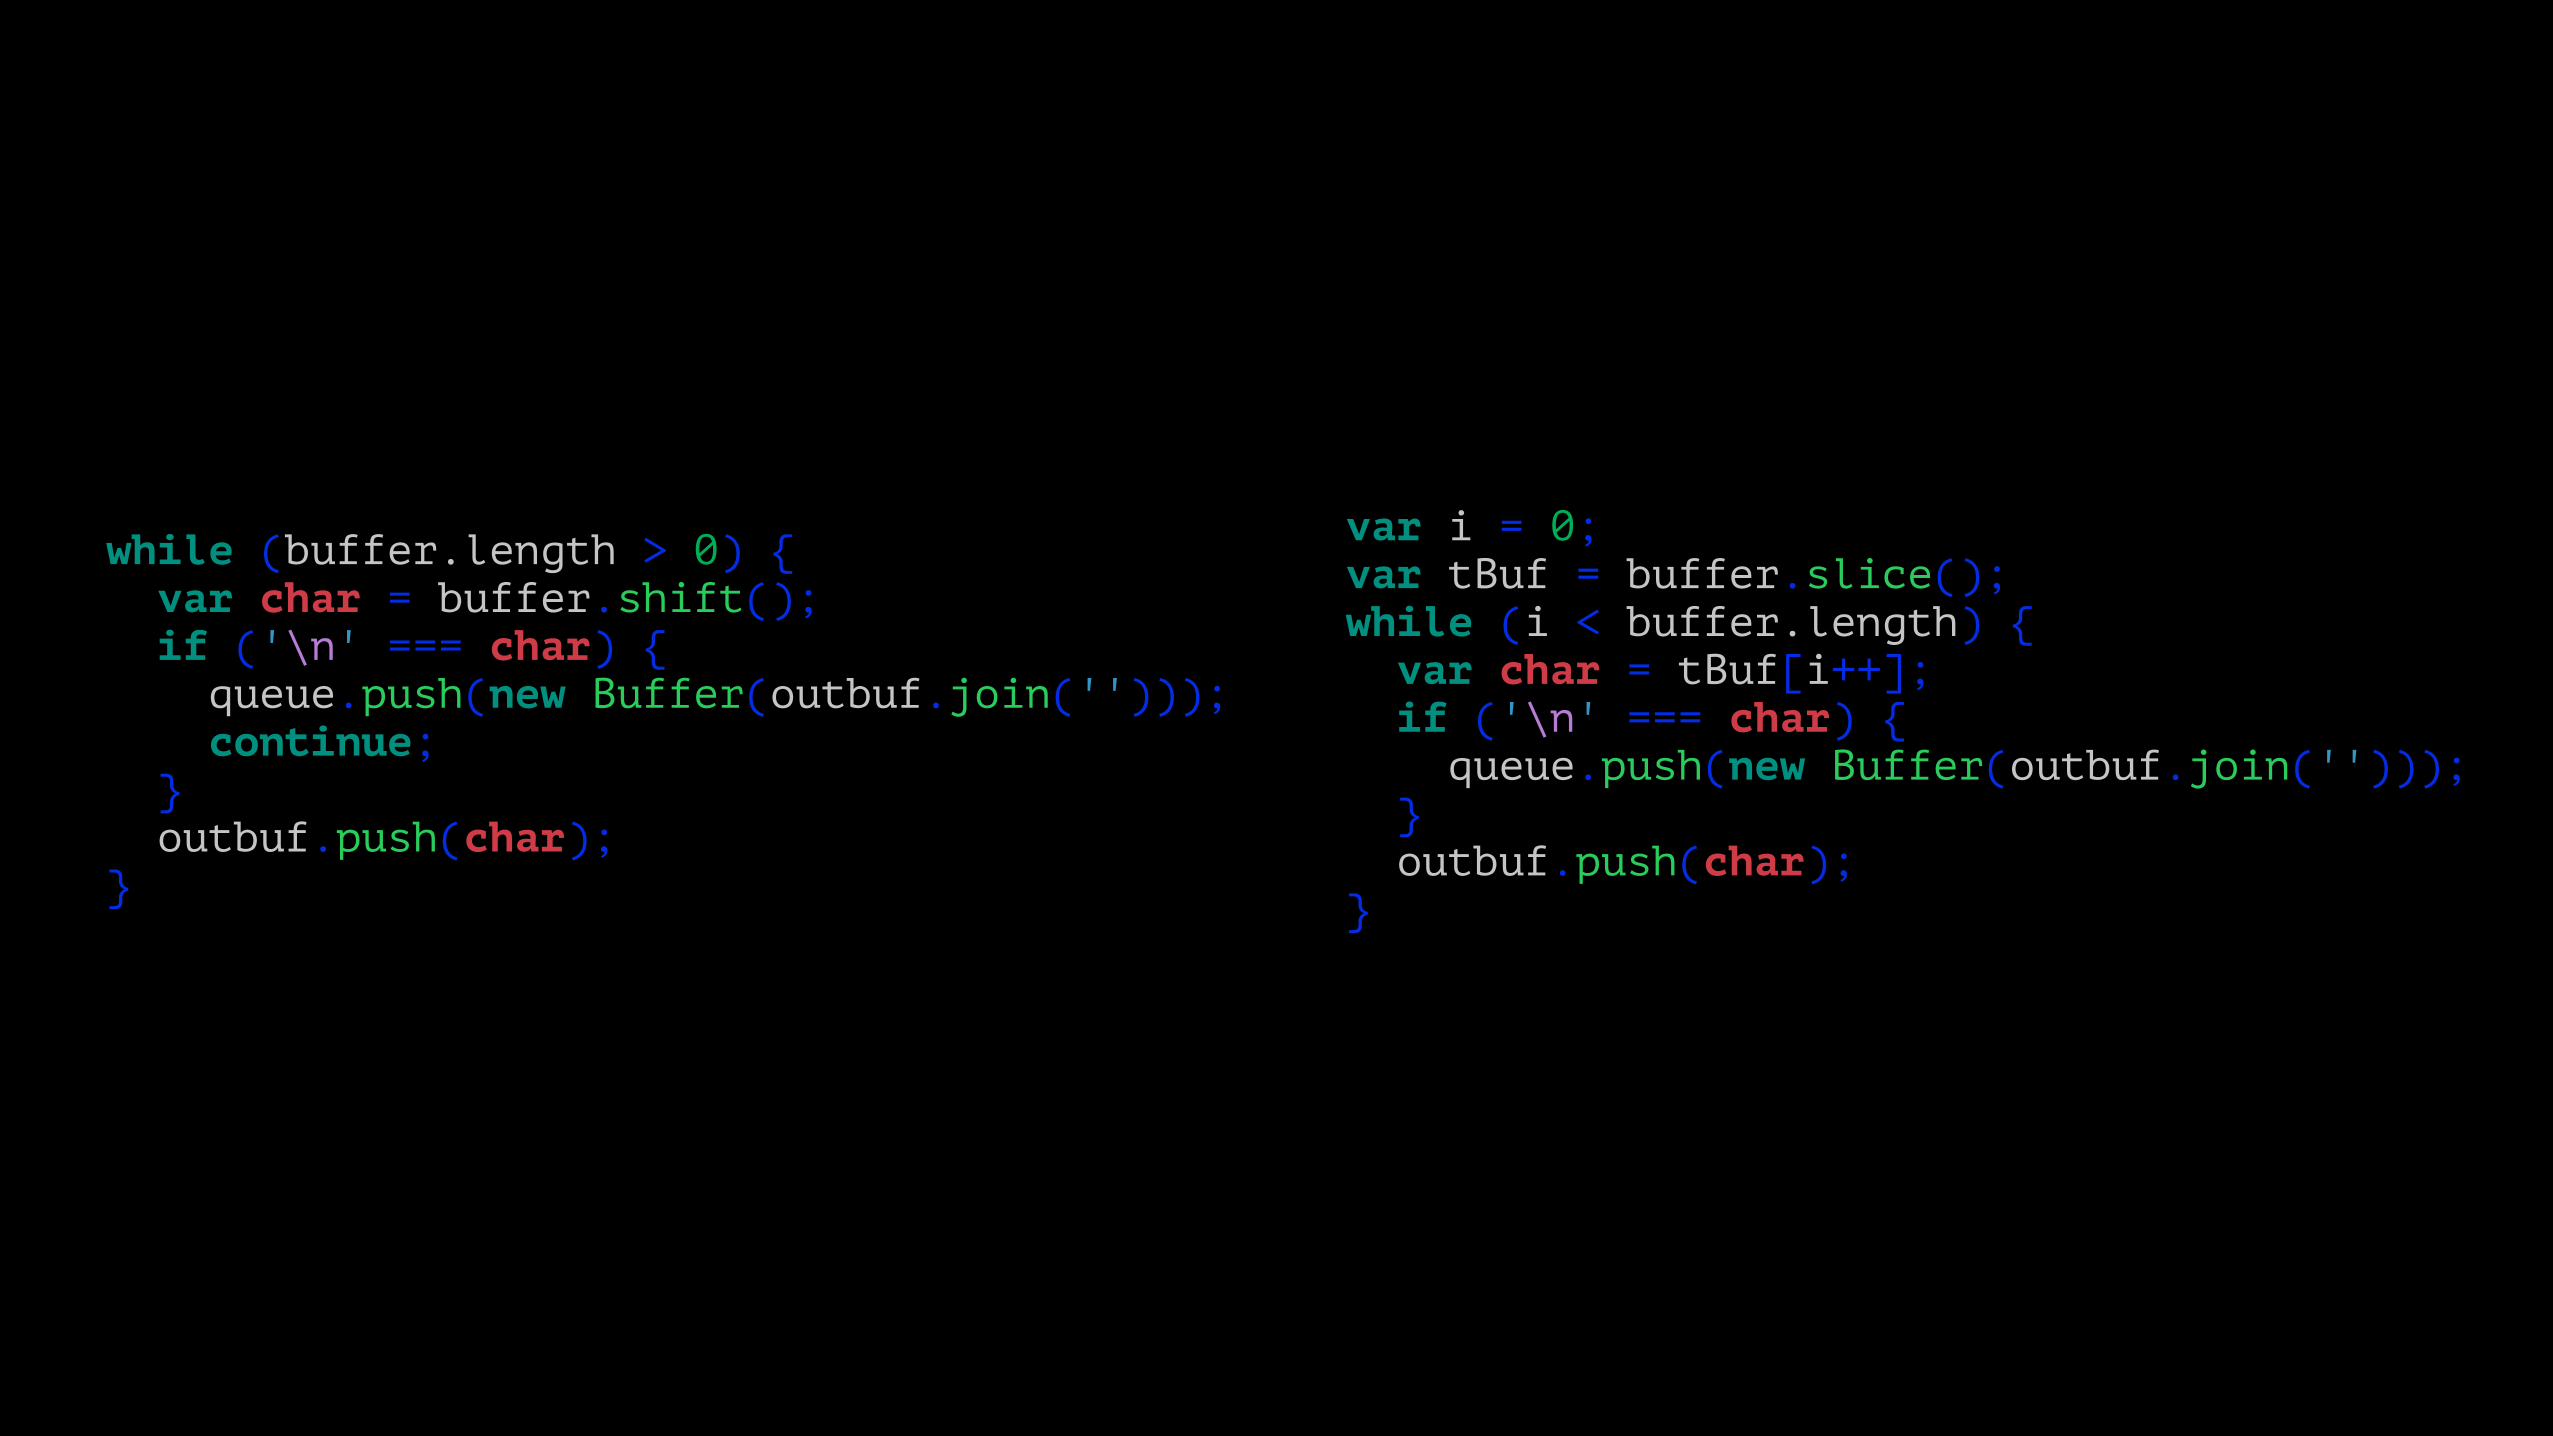
while (buffer.length > 0) { var char = buffer.shift(); if ('\n' === char) { queue.push(new Buffer(outbuf.join(''))); continue; } outbuf.push(char); }
var i = 0; var tBuf = buffer.slice(); while (i < buffer.length) { var char = tBuf[i++]; if ('\n' === char) { queue.push(new Buffer(outbuf.join(''))); } outbuf.push(char); }
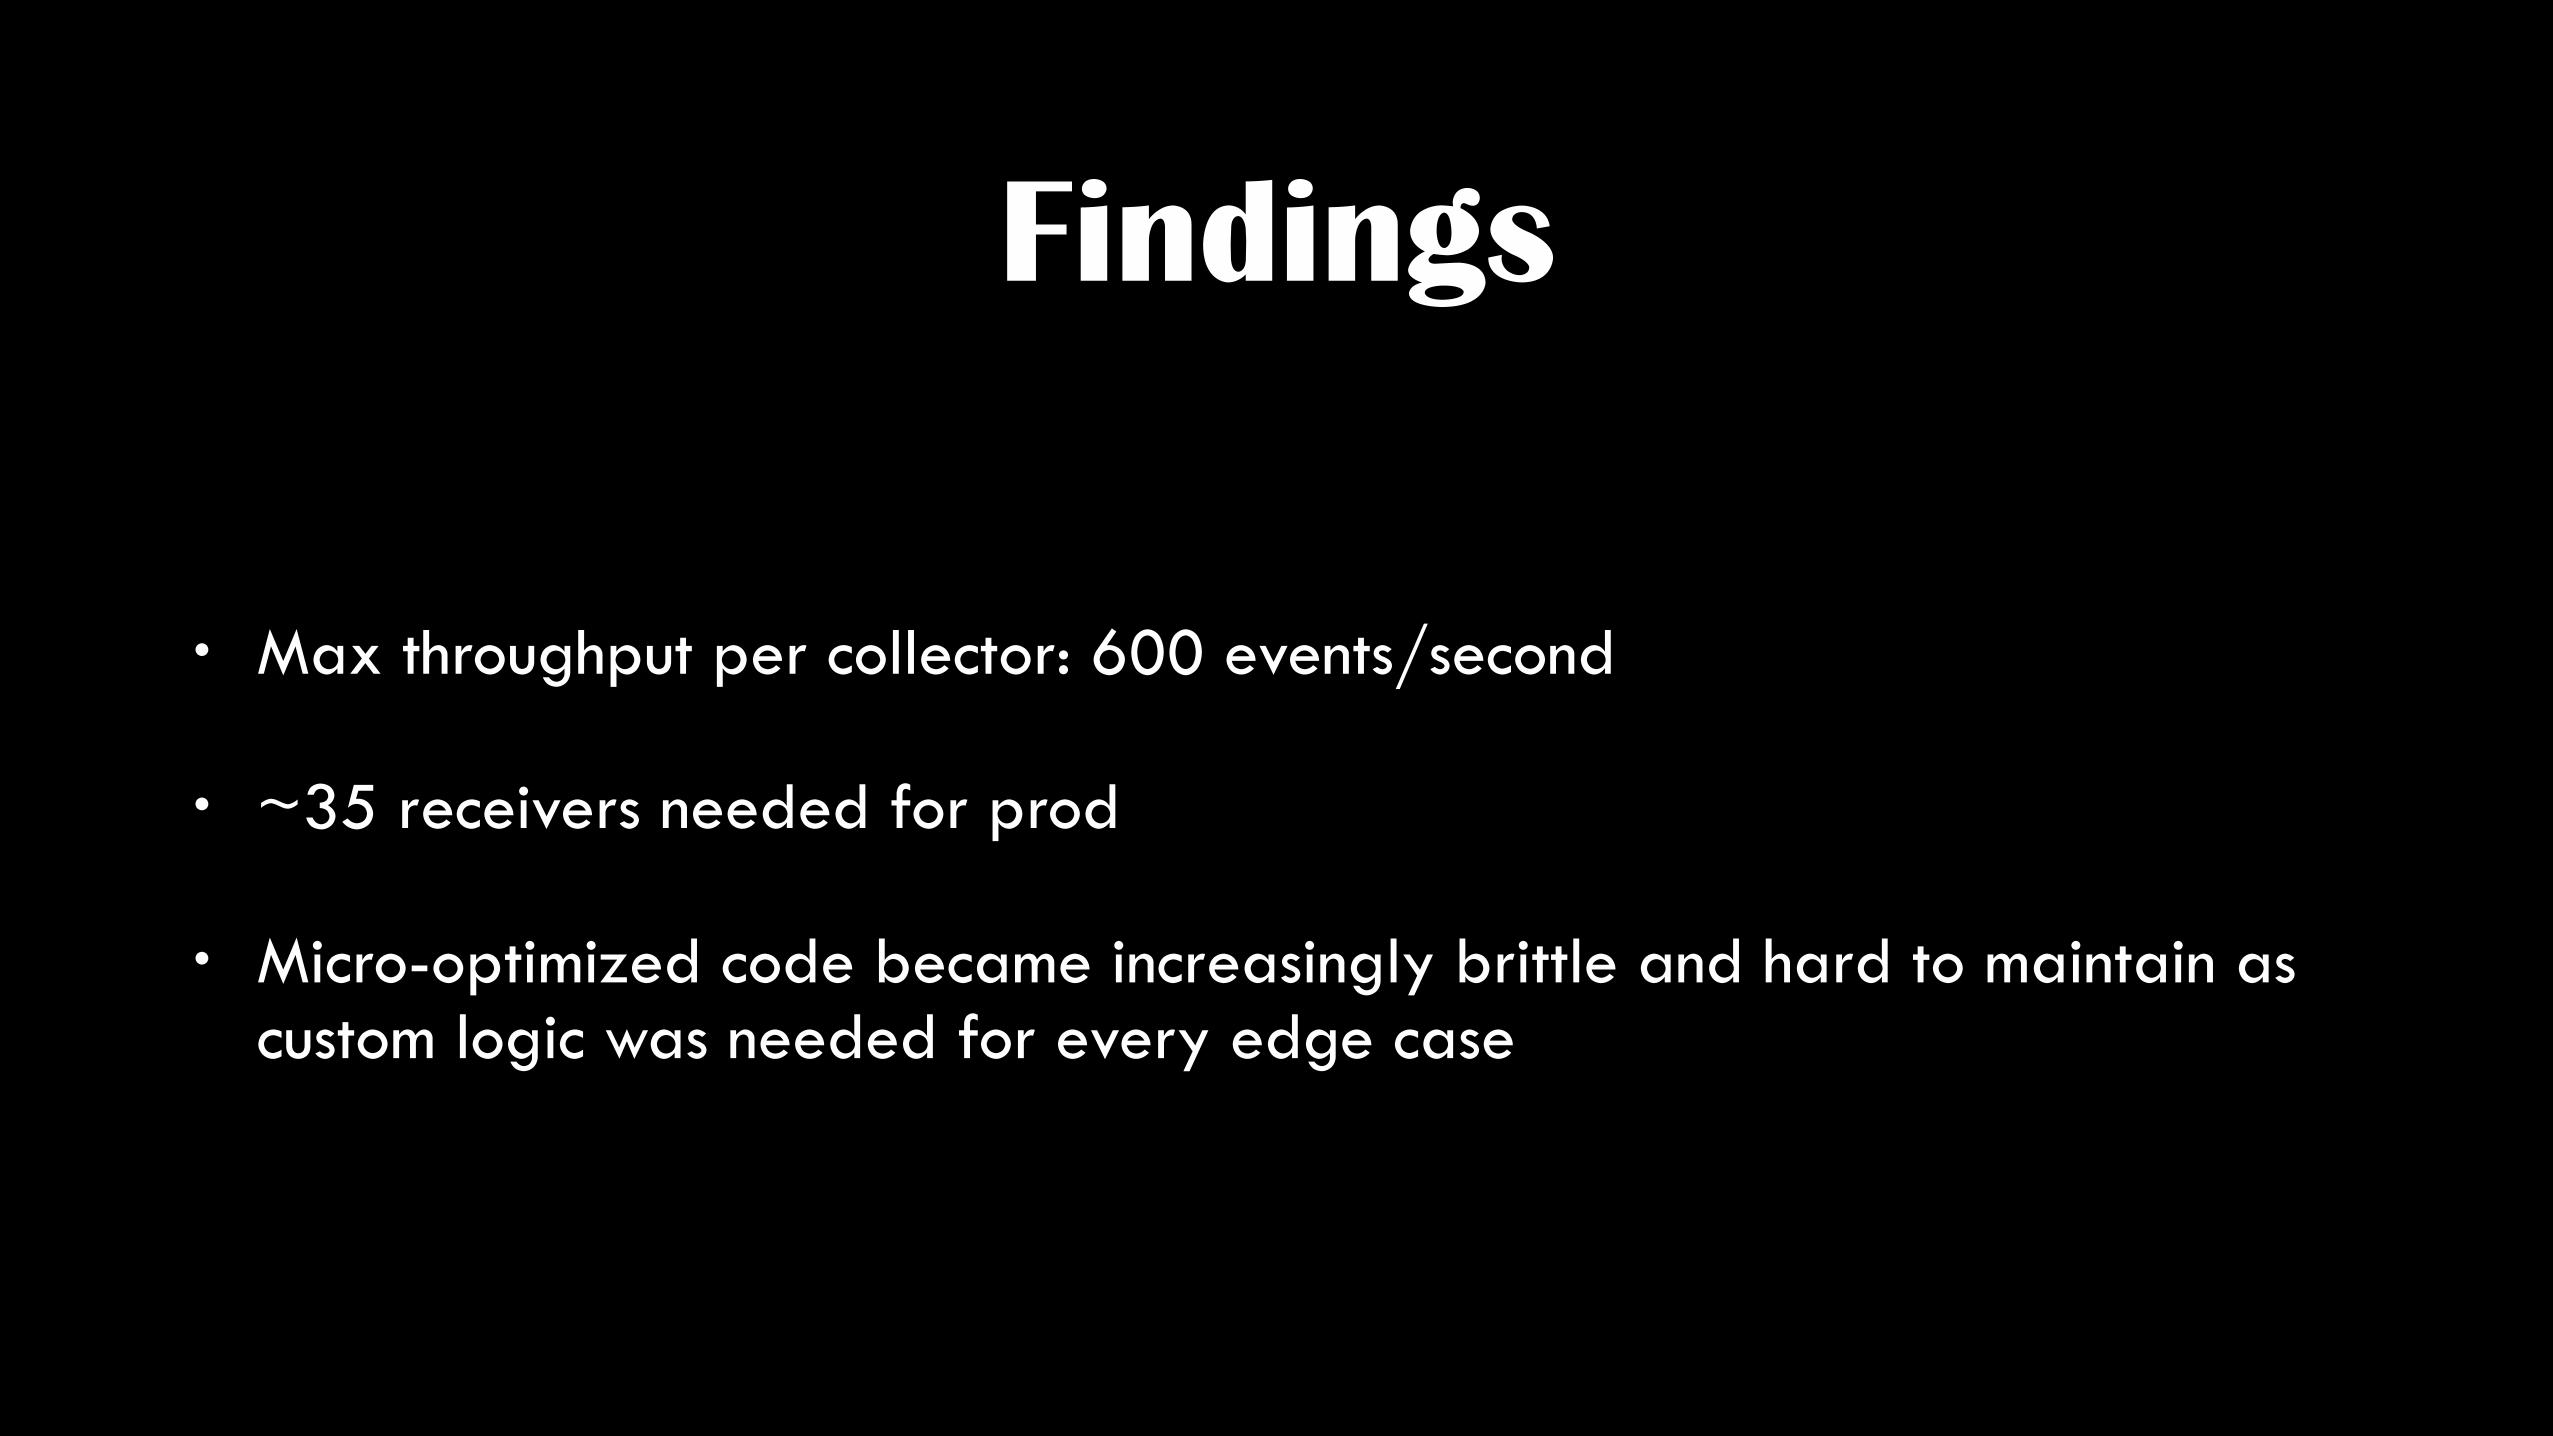
Findings
• Max throughput per collector: 600 events/second
• ~35 receivers needed for prod
• Micro-optimized code became increasingly brittle and hard to maintain as custom logic was needed for every edge case

Version 2
CollectorCollectorCollectorStreamer CollectorCollectorCollectorReceiver ElasticSearchRabbitMQ

Need to Get Serious
• Very high throughput
• Multi-threaded worker pool with large memory buffers
• Static & dynamic optimization
• Efficient memory management for extremely volatile in-memory data
• Eliminate any processing overhead. Receiver must be a Transit

And also…
• Not GoLang (because no one on the team is familiar with it)
• Not Rust (because no one on the team wants to be familiar with it)
• Not C (because C)

mfw java :(


Why Java?
• Solid static & dynamic analysis and optimizations in the S2BC & JIT compilers
• Clients for the stuff I needed to talk to
• Well-supported within AOL & within my team
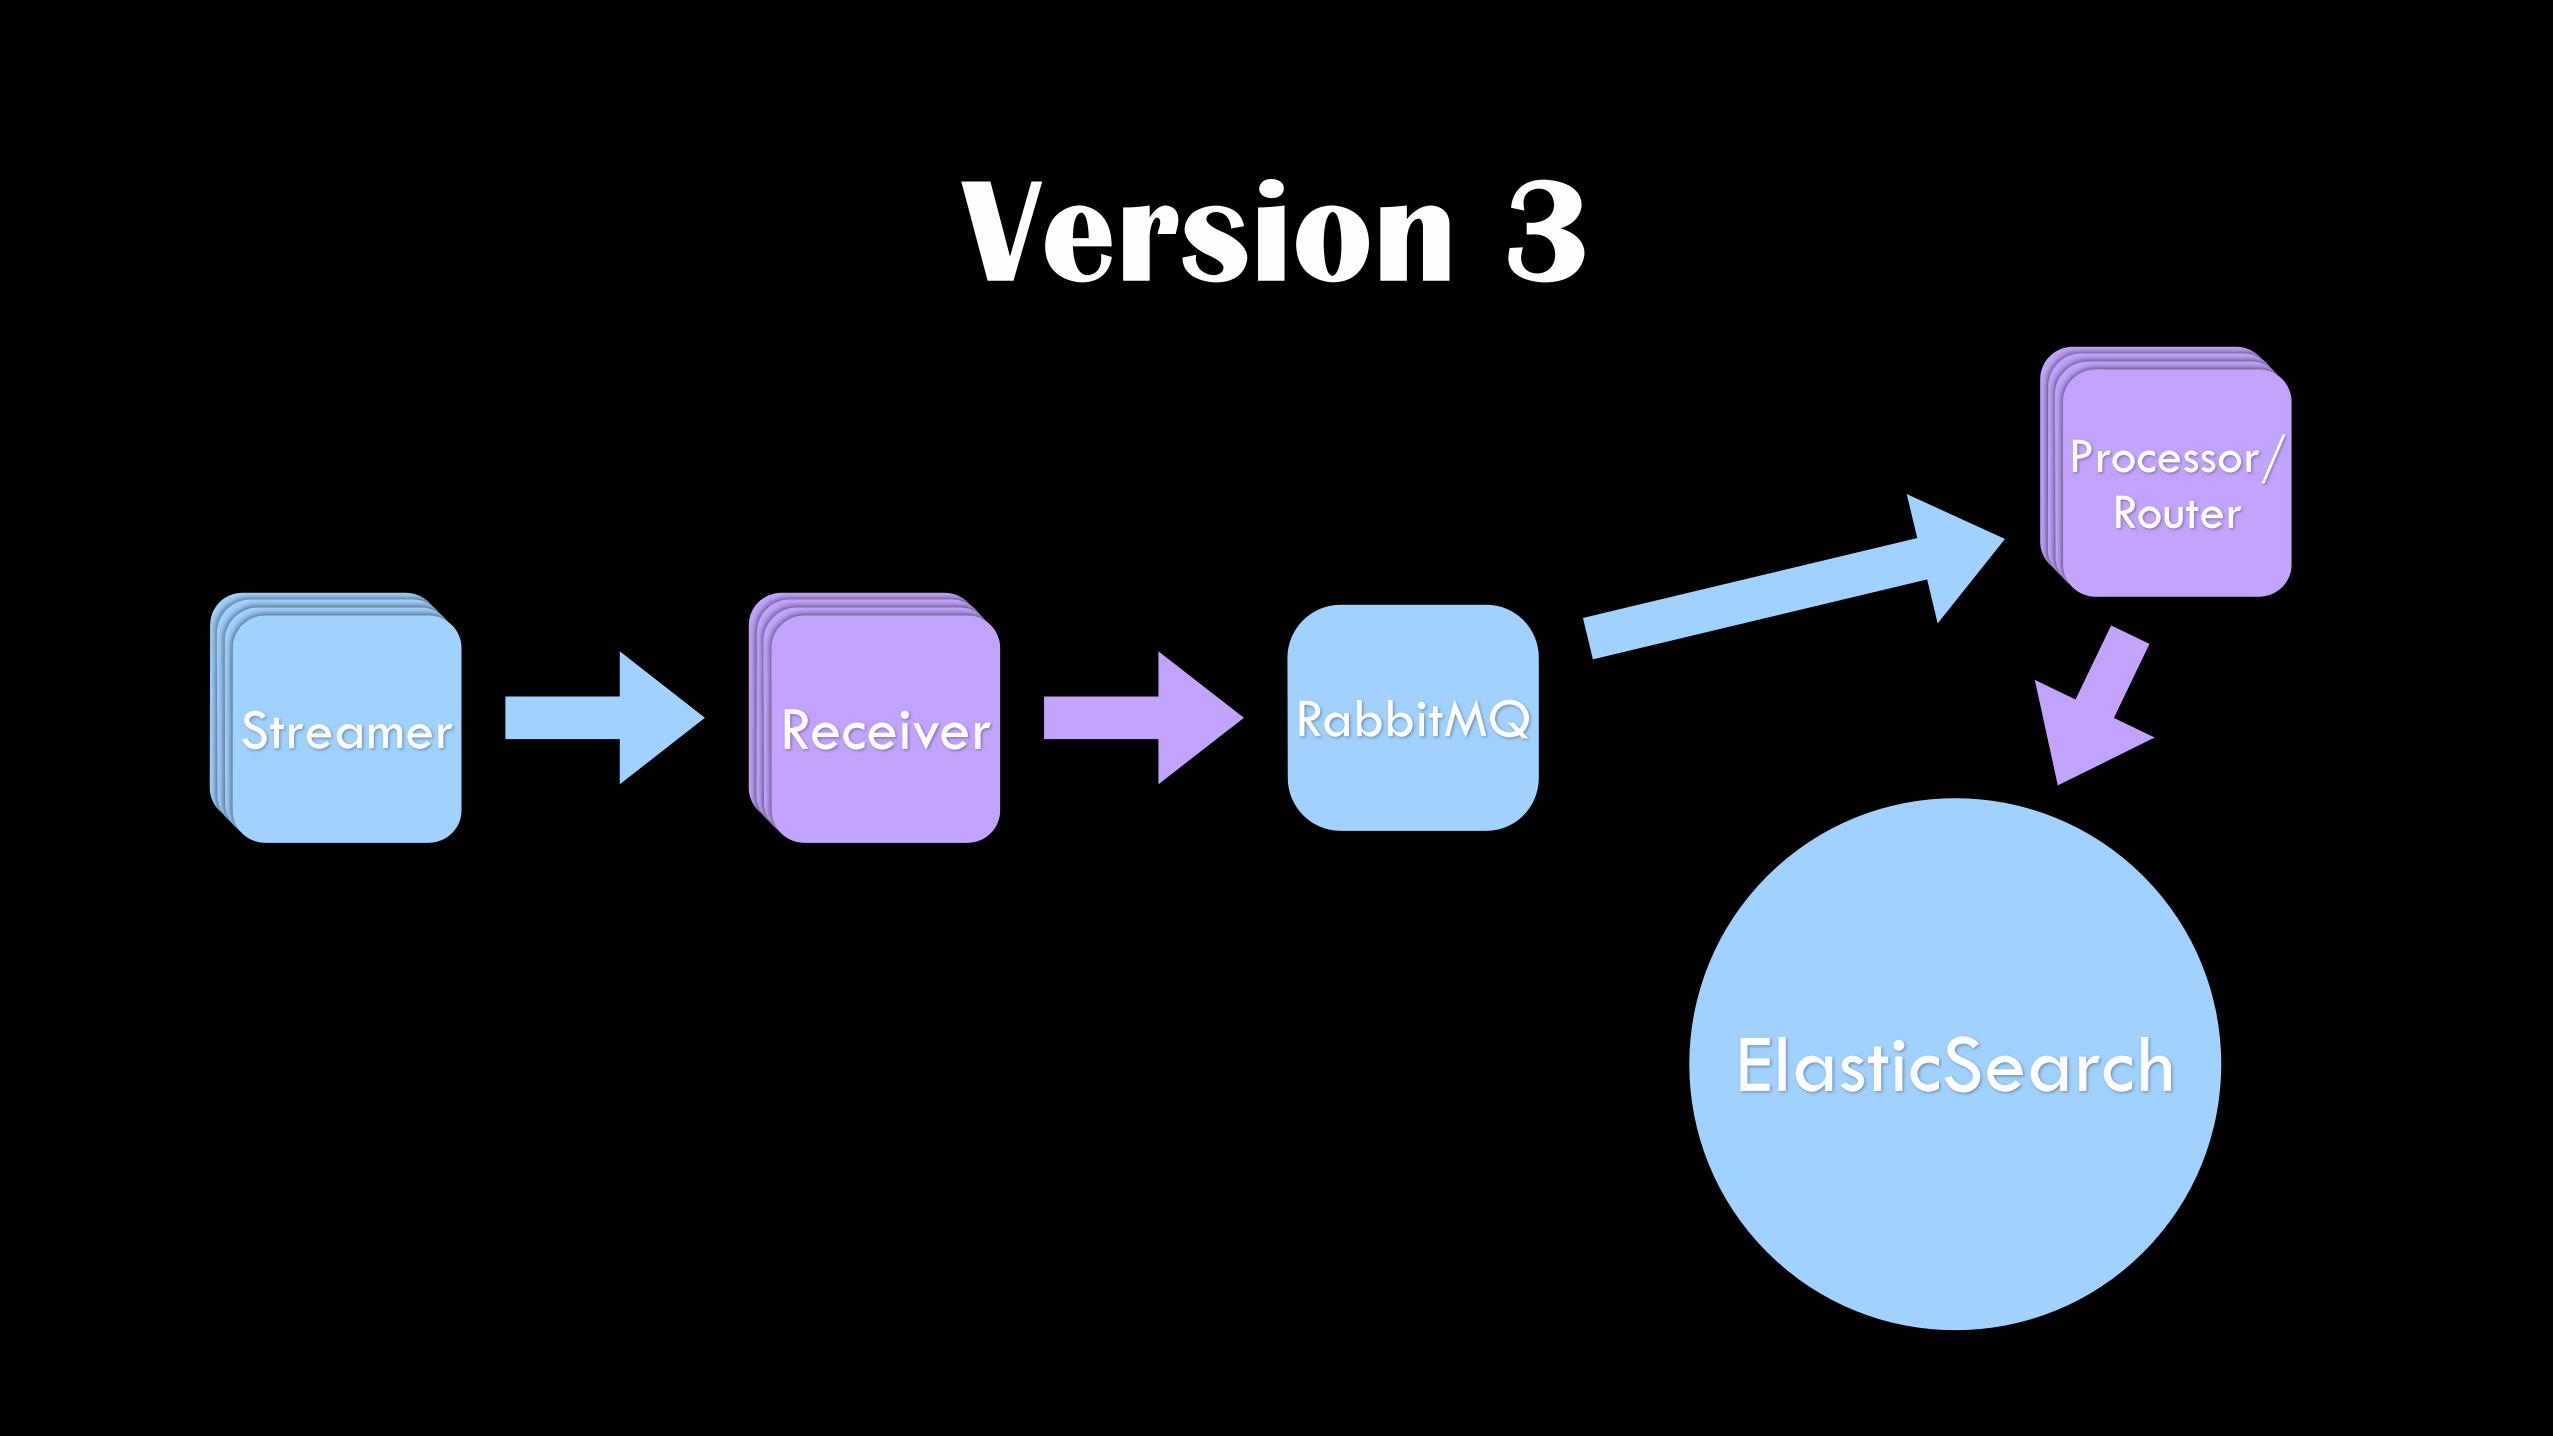
Version 3
CollectorCollectorCollectorStreamer CollectorCollectorCollectorReceiver
ElasticSearch
RabbitMQ
CollectorCollectorCollectorProcessor/ Router


public class StreamReader { private static final Logger logger = Logger.getLogger(StreamReader.class.getName()); private StreamerQueue queue = new StreamerQueue(); private StreamProcessor processor; private List<StreamReader.BeaconWorkerThread> workerThreads = new ArrayList(); private RtStreamerClient client;
public StreamReader(String streamerURI, AmqpClient amqpClient, String appID, String tpcFltrs, String rfFltrs, String bt) { ArrayList queueList = new ArrayList(); this.processor = new StreamProcessor(amqpClient); byte numThreads = 8;
for(int i = 0; i < numThreads; ++i) { StreamReader.BeaconWorkerThread worker = new StreamReader.BeaconWorkerThread(); this.workerThreads.add(worker); worker.start(); }
queueList.add(this.queue); this.client = new RtStreamerClient(streamerURI, appID, tpcFltrs, rfFltrs, bt, queueList); } }
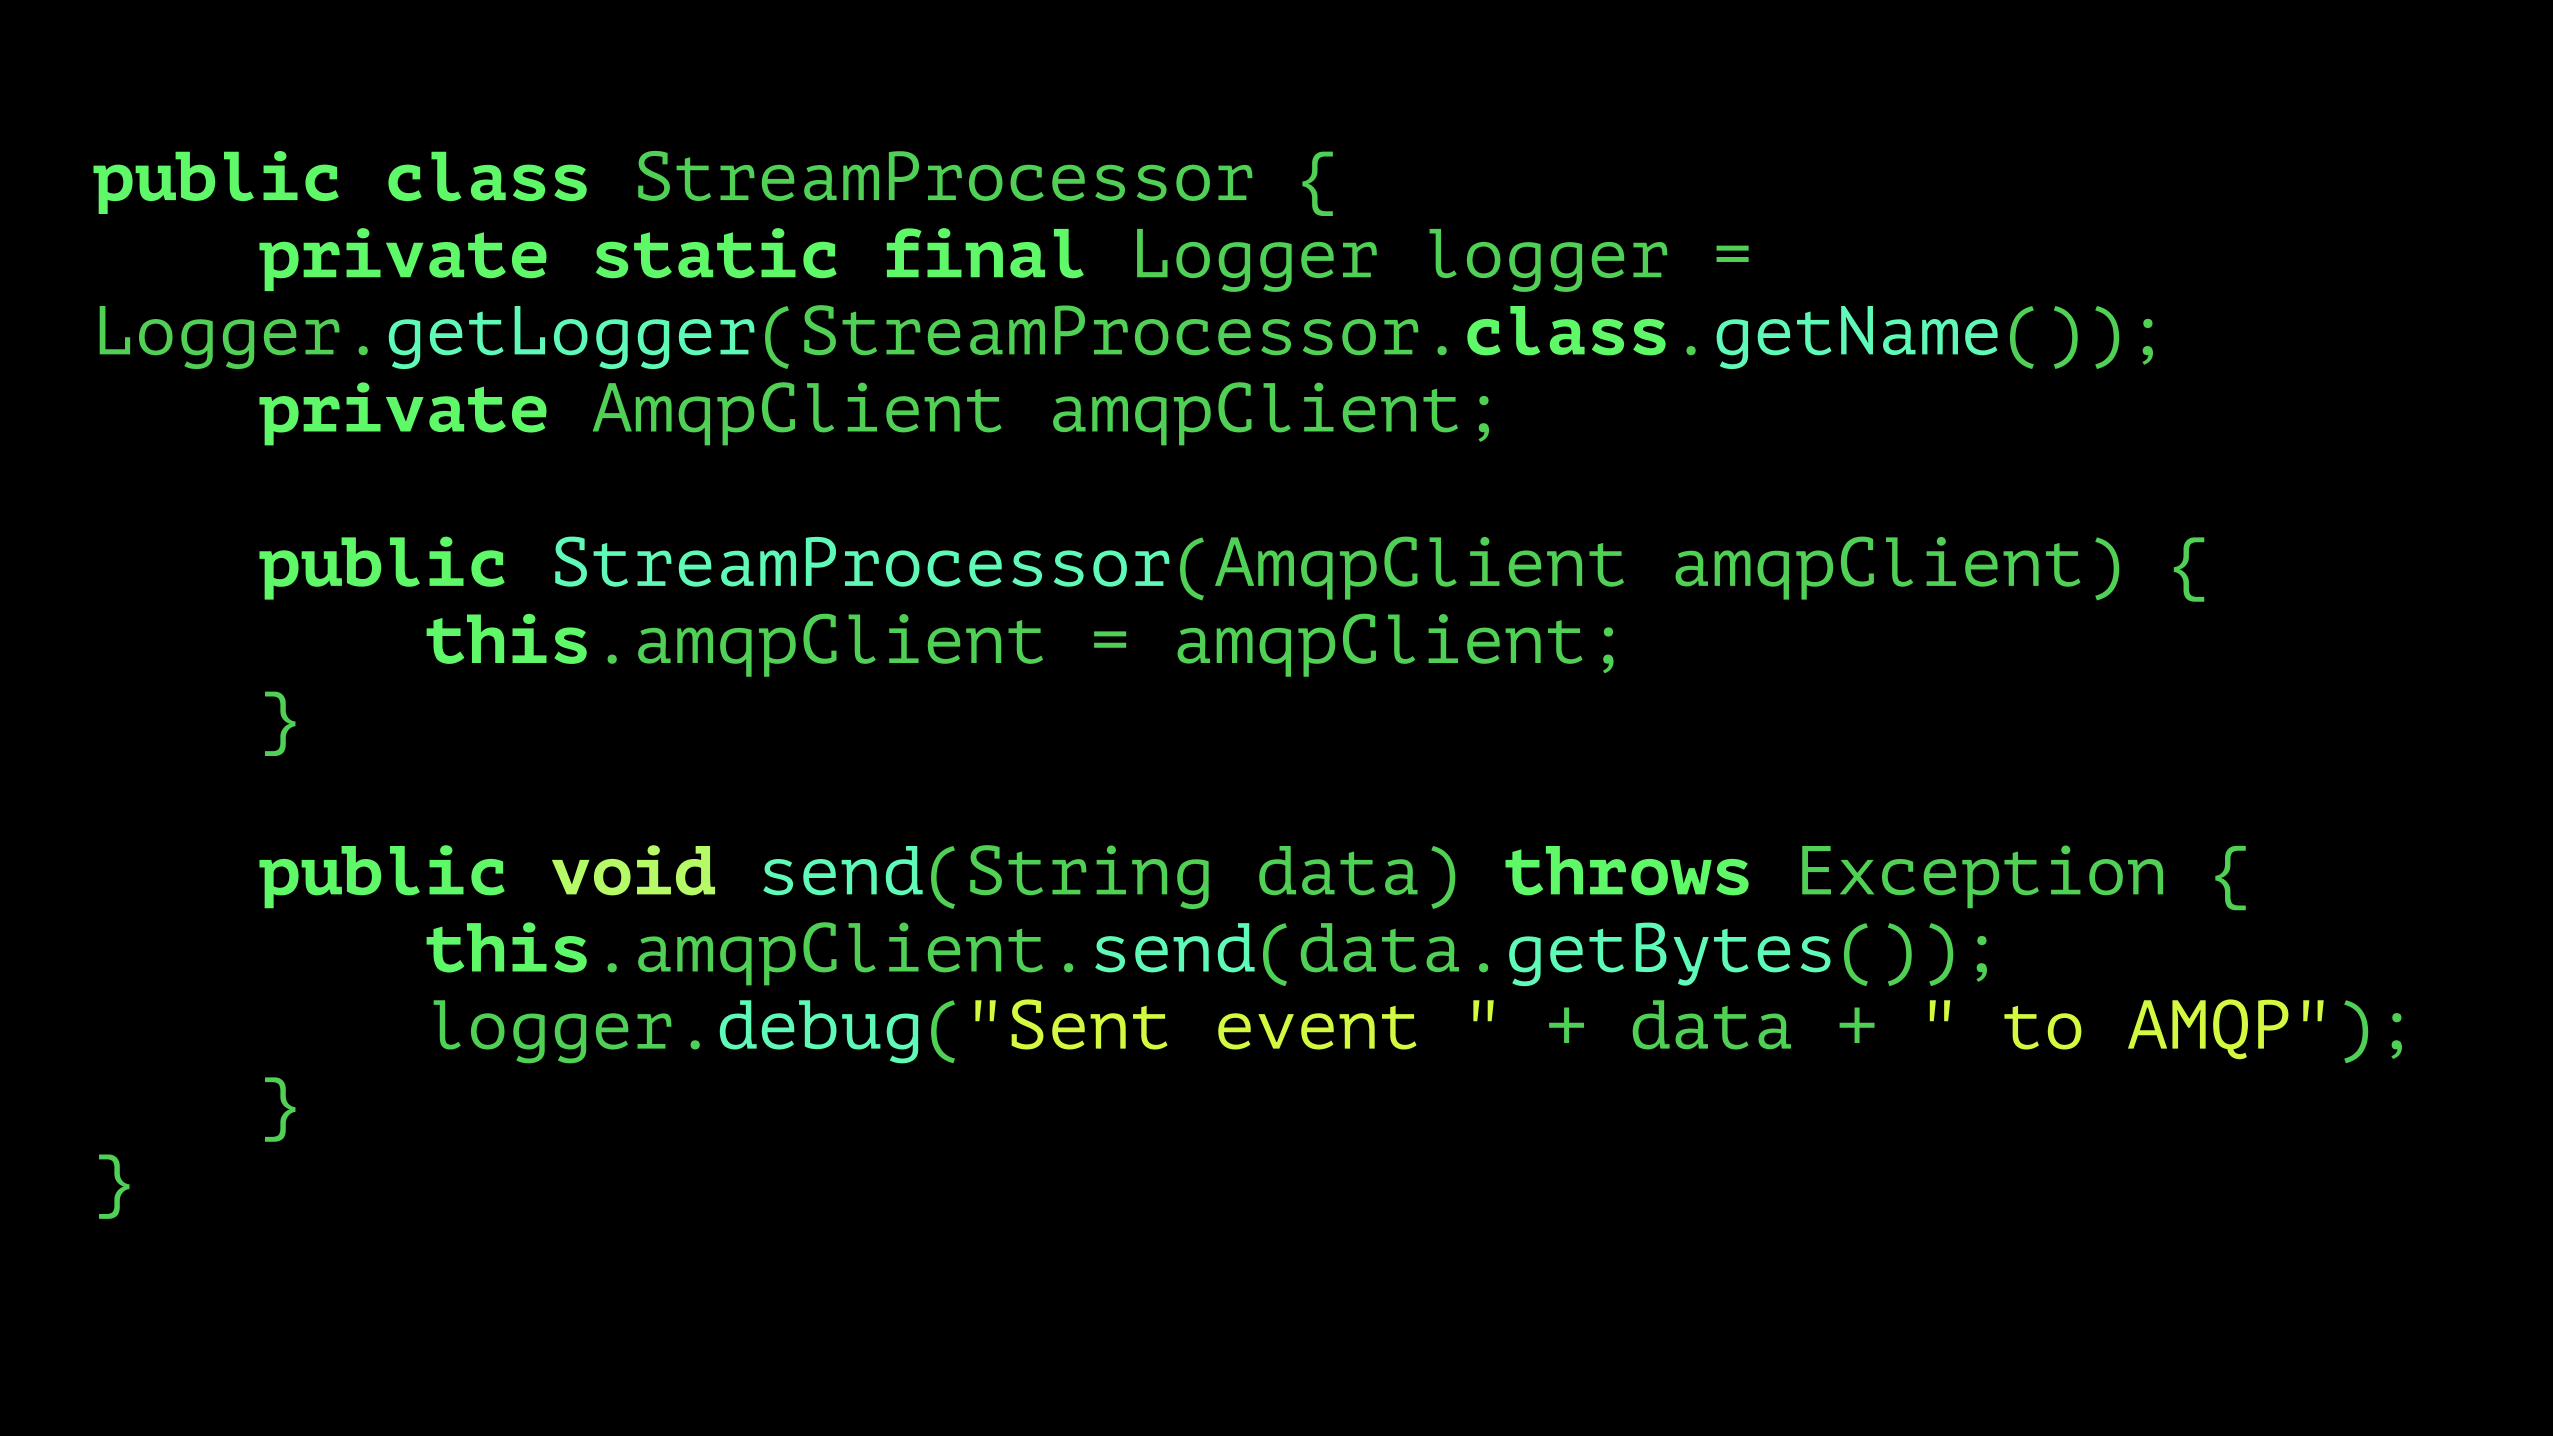
public class StreamProcessor { private static final Logger logger = Logger.getLogger(StreamProcessor.class.getName()); private AmqpClient amqpClient;
public StreamProcessor(AmqpClient amqpClient) { this.amqpClient = amqpClient; }
public void send(String data) throws Exception { this.amqpClient.send(data.getBytes()); logger.debug("Sent event " + data + " to AMQP"); } }

Que
ue
Que
ue
Que
ue
Que
ue
Que
ue
Que
ue
Que
ue
Que
ue
Que
ue
Que
ue
Que
ue
Network Input
Network Output
Linked List Queues
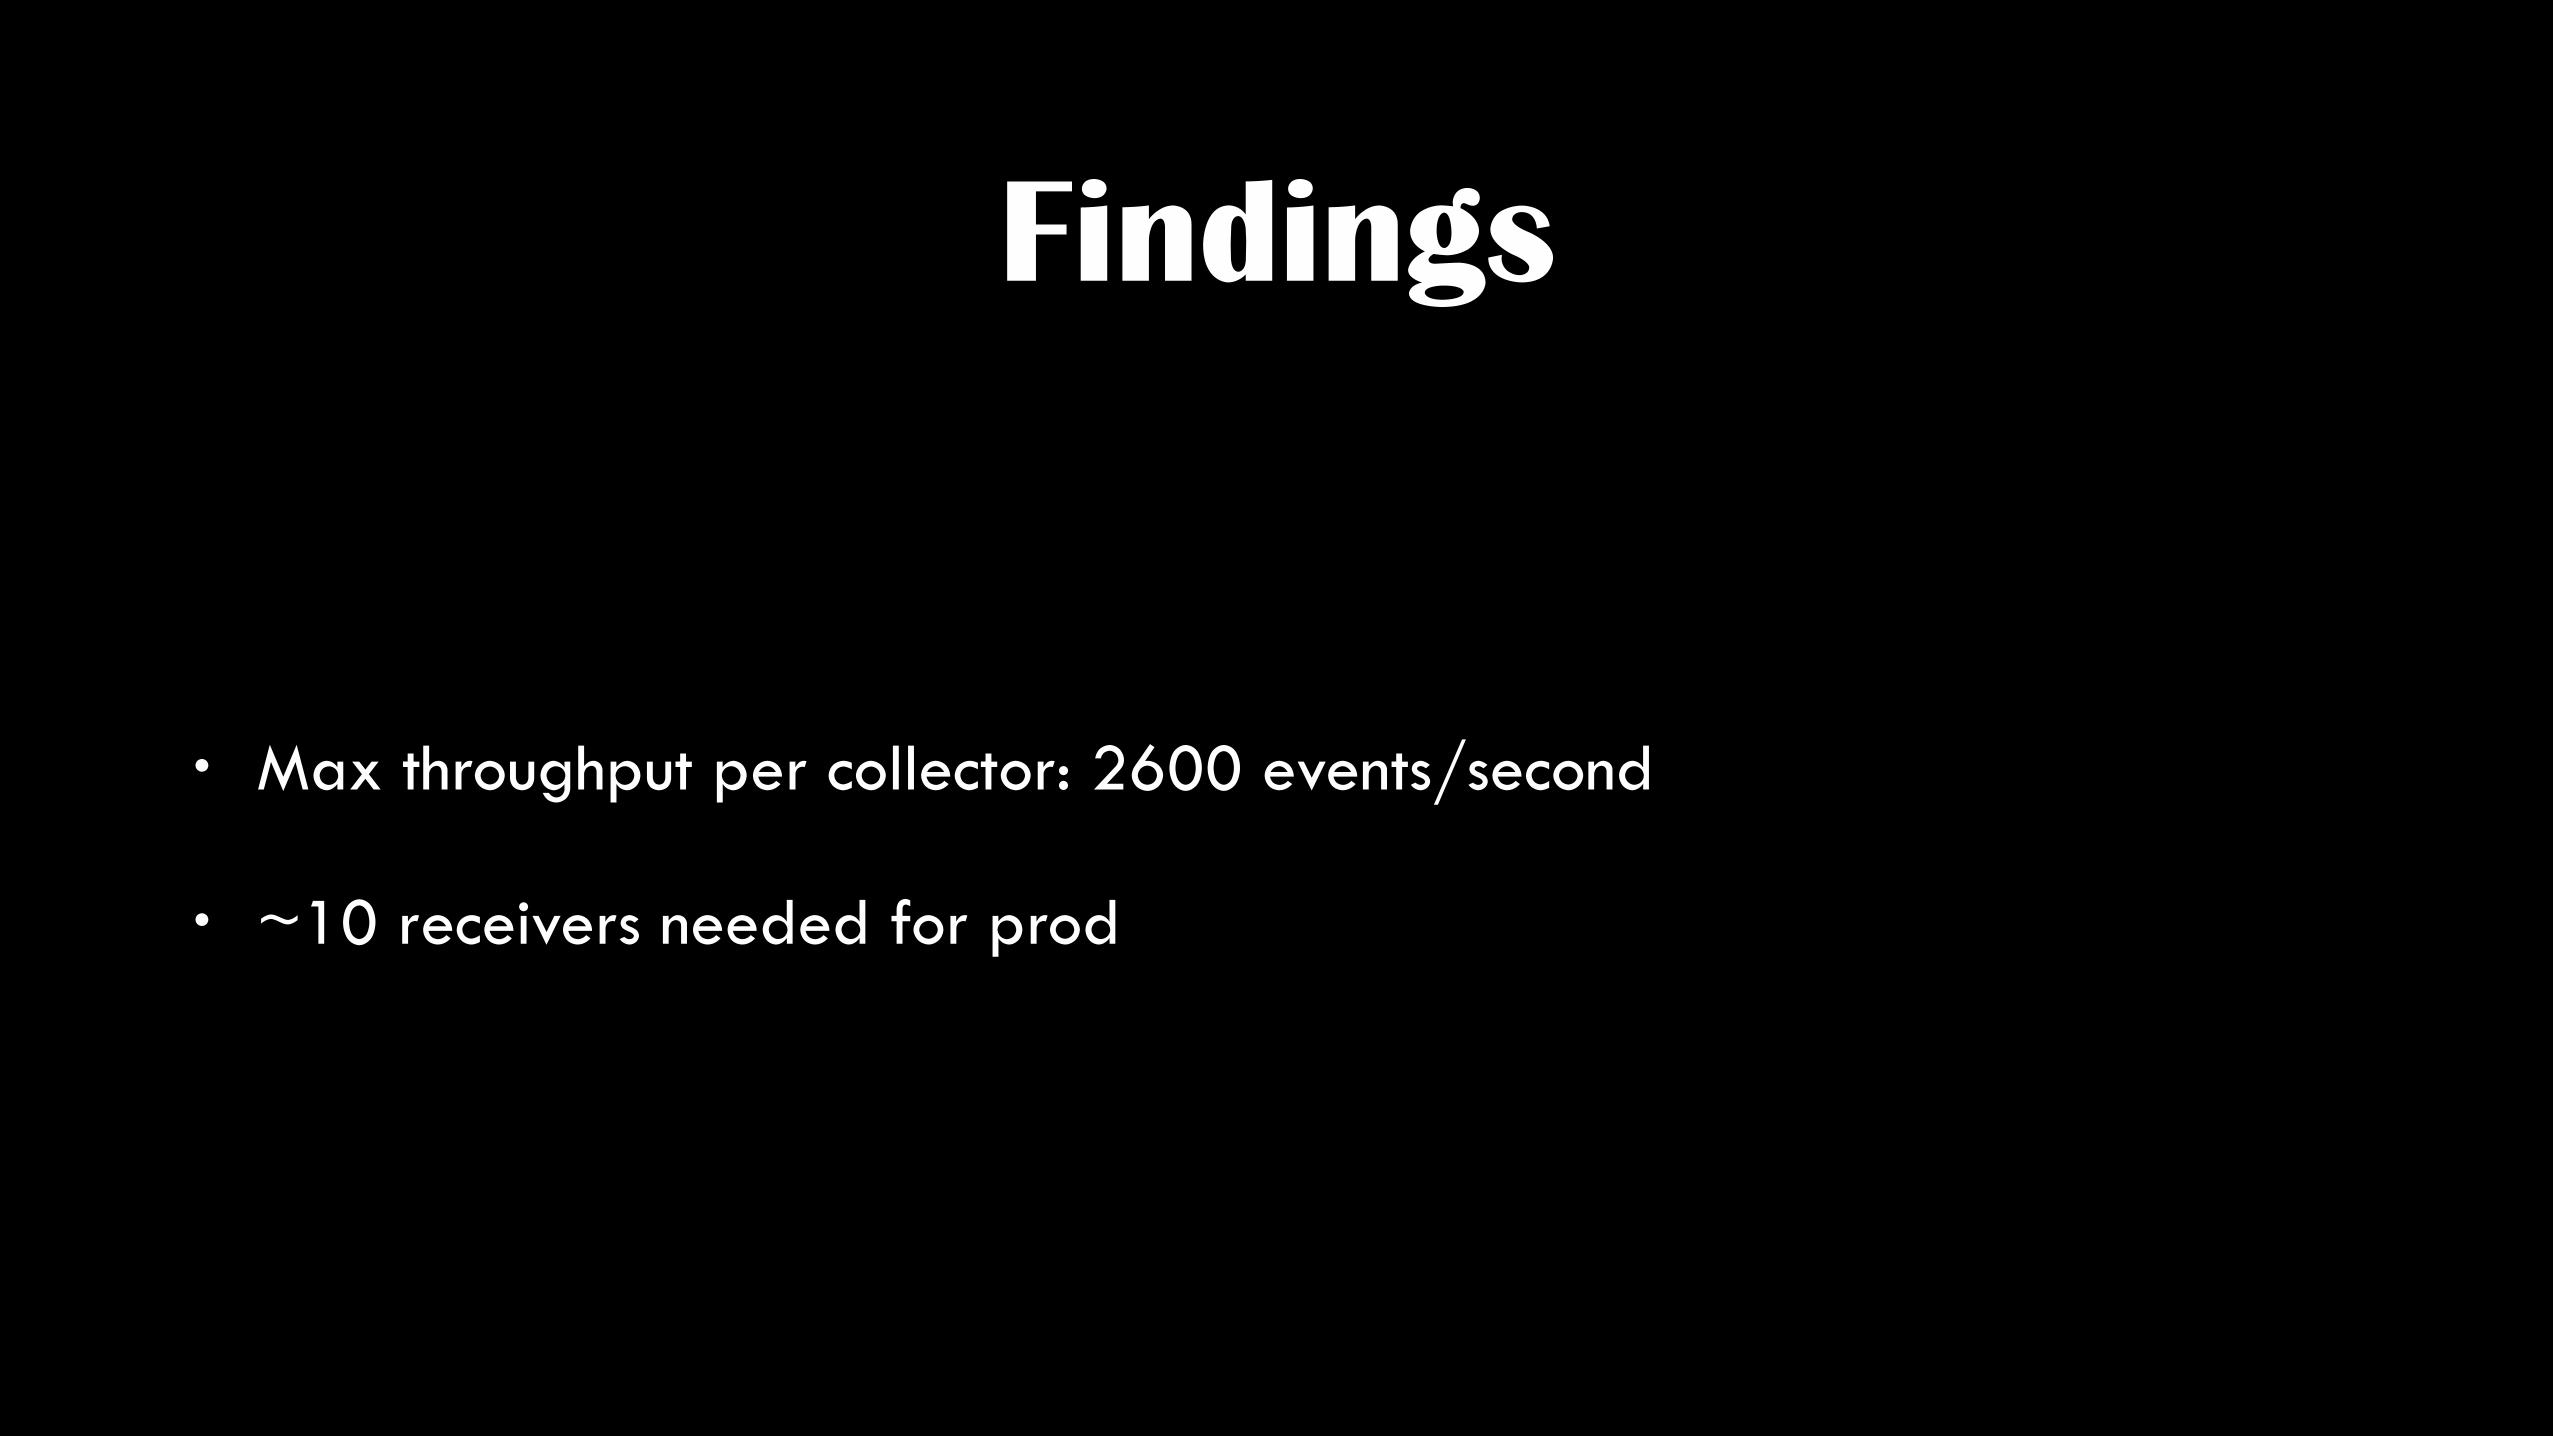
Findings
• Max throughput per collector: 2600 events/second
• ~10 receivers needed for prod


Why ElasticSearch
• Open-source Lucene search engine
• Highly-distributed storage engine
• Clusters nicely
• Built-in aggregations like whoa

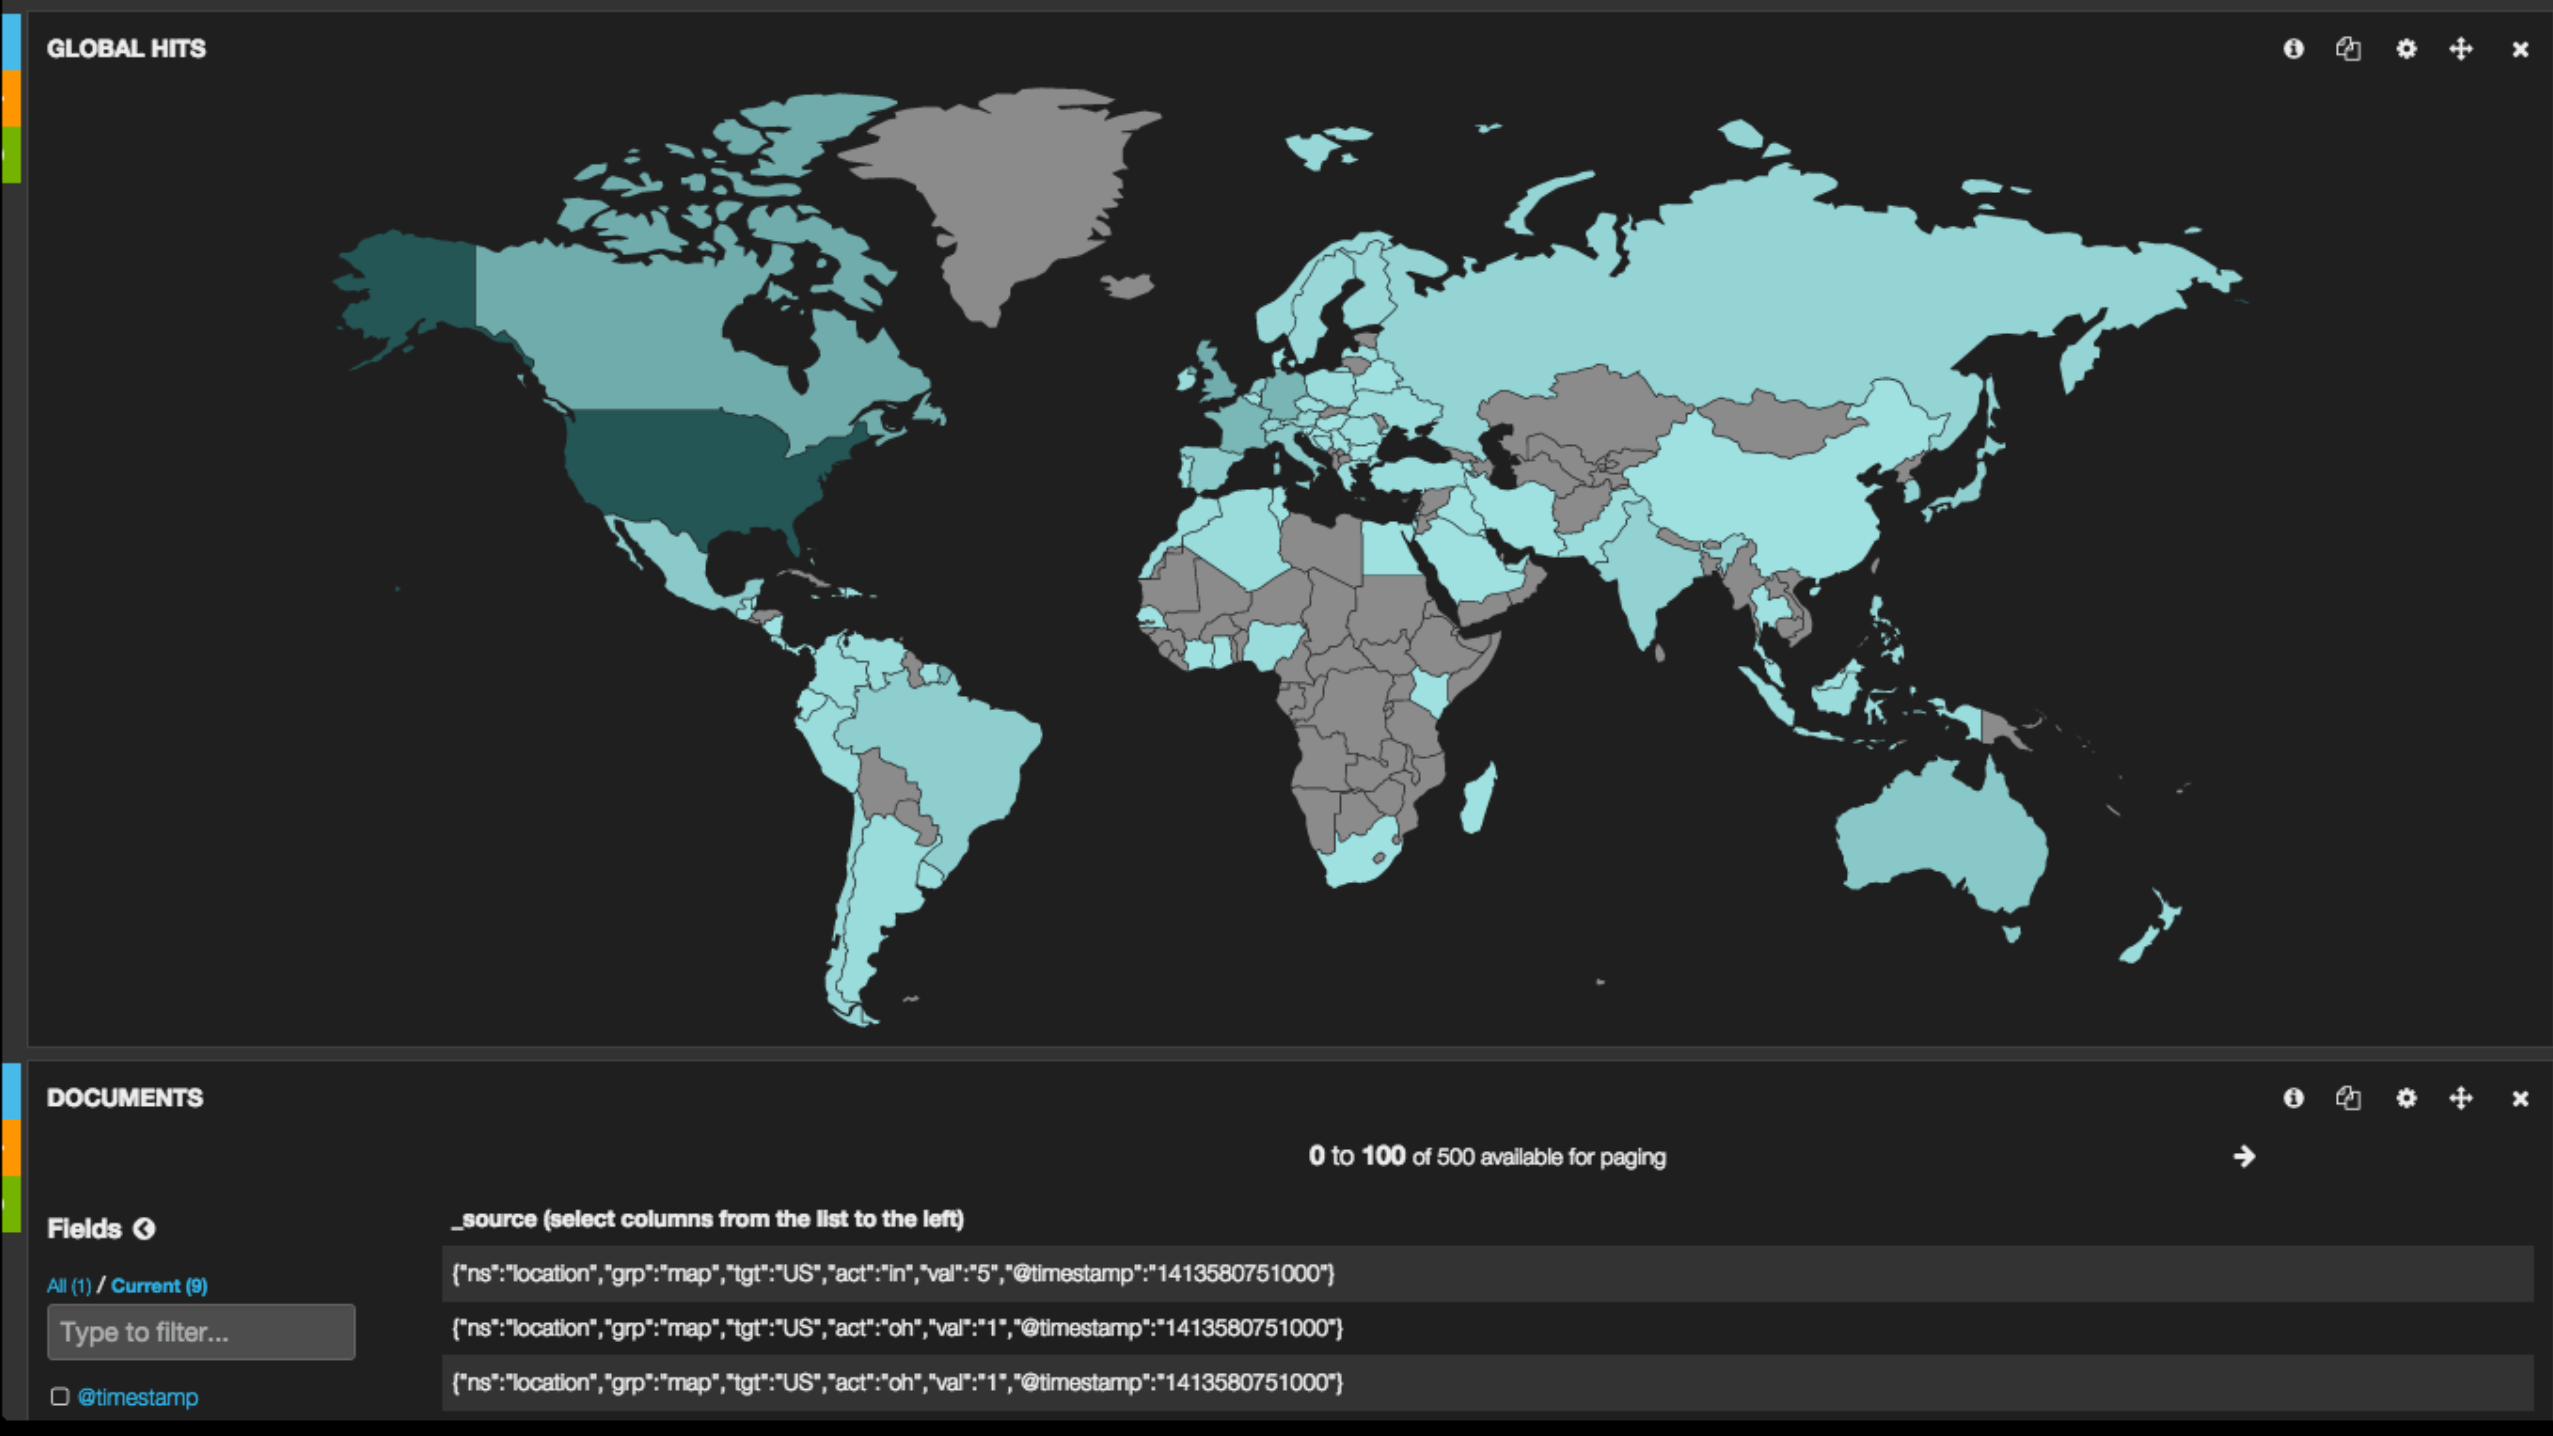
Aggregations
• Geographic Boxing & Radius Grouping
• Time-Series
• Histograms
• Min/Max/Avg Statistical Evaluation
• MapReduce (coming soon!)

• How many users viewed my post on an android tablet in portrait mode within 10 miles of Denton, TX?
• What is the average time from start of page-load to first click for readers on linux desktops between 3am and 5am?
• Given two sets of link texts, which has the higher CTR for a randomized sample of readers on tablet devices?

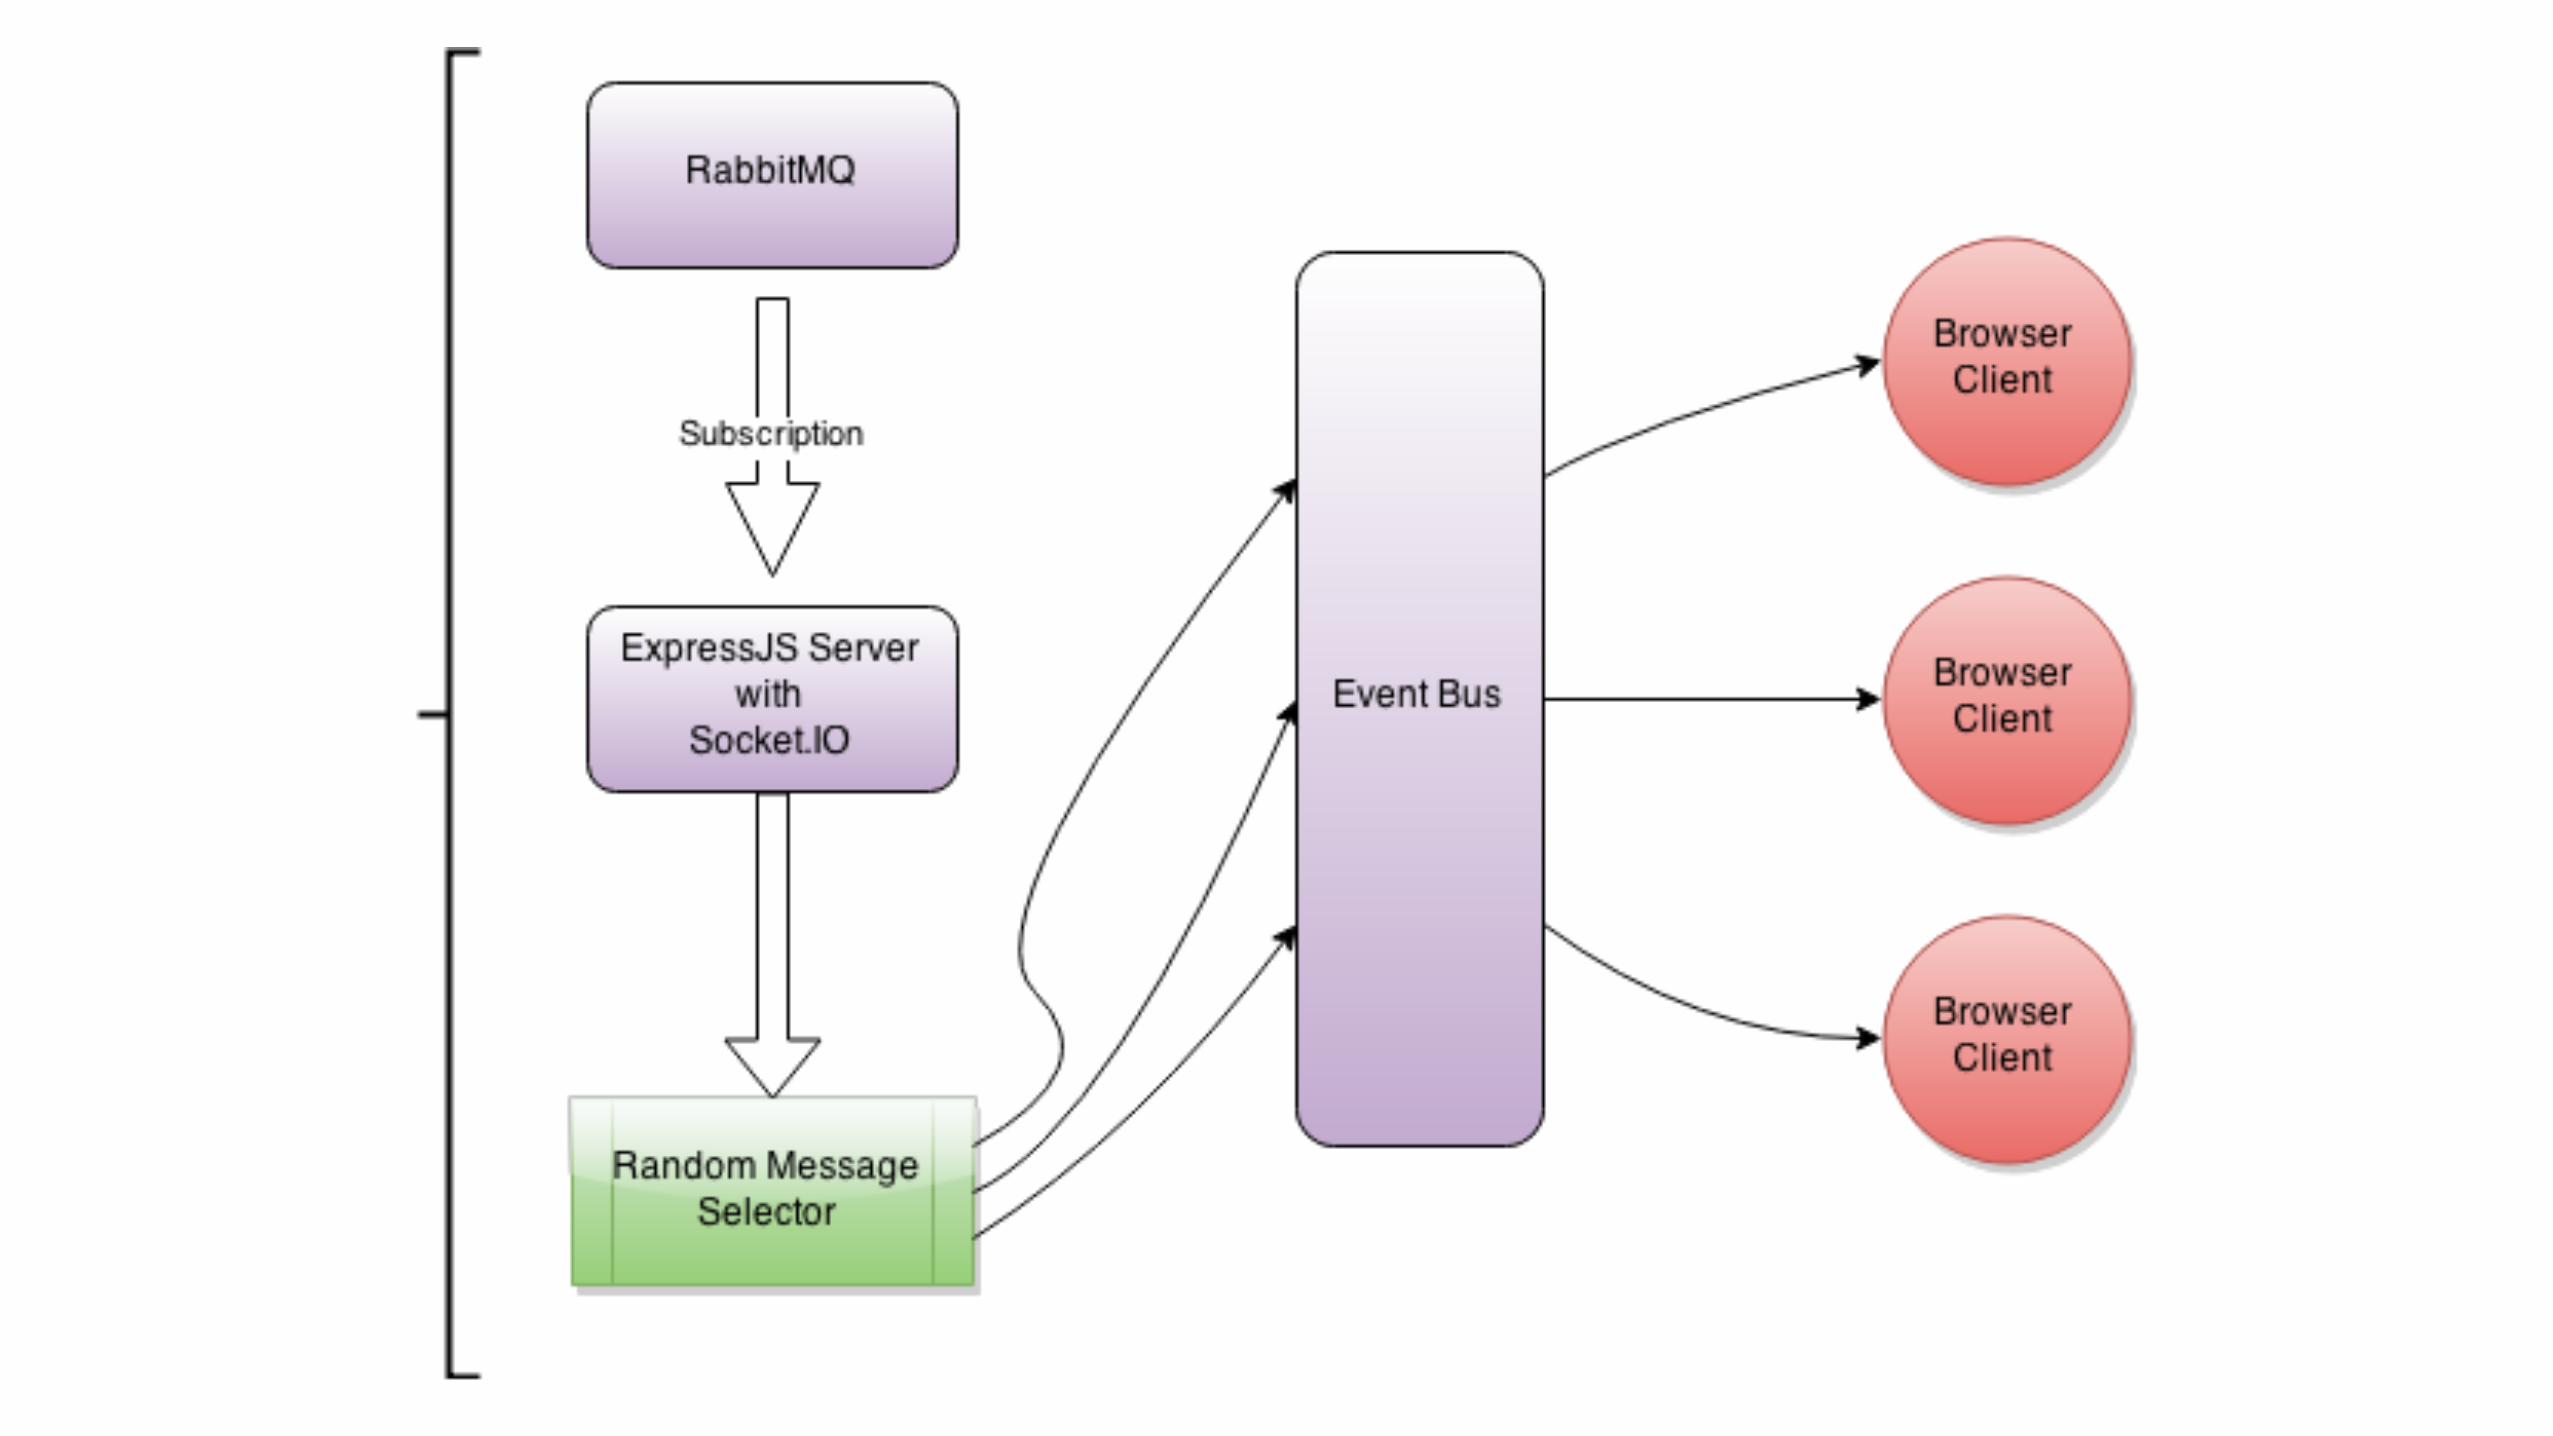
Browser to Browser in < 5 seconds
But wait…
Is that “real-time”?

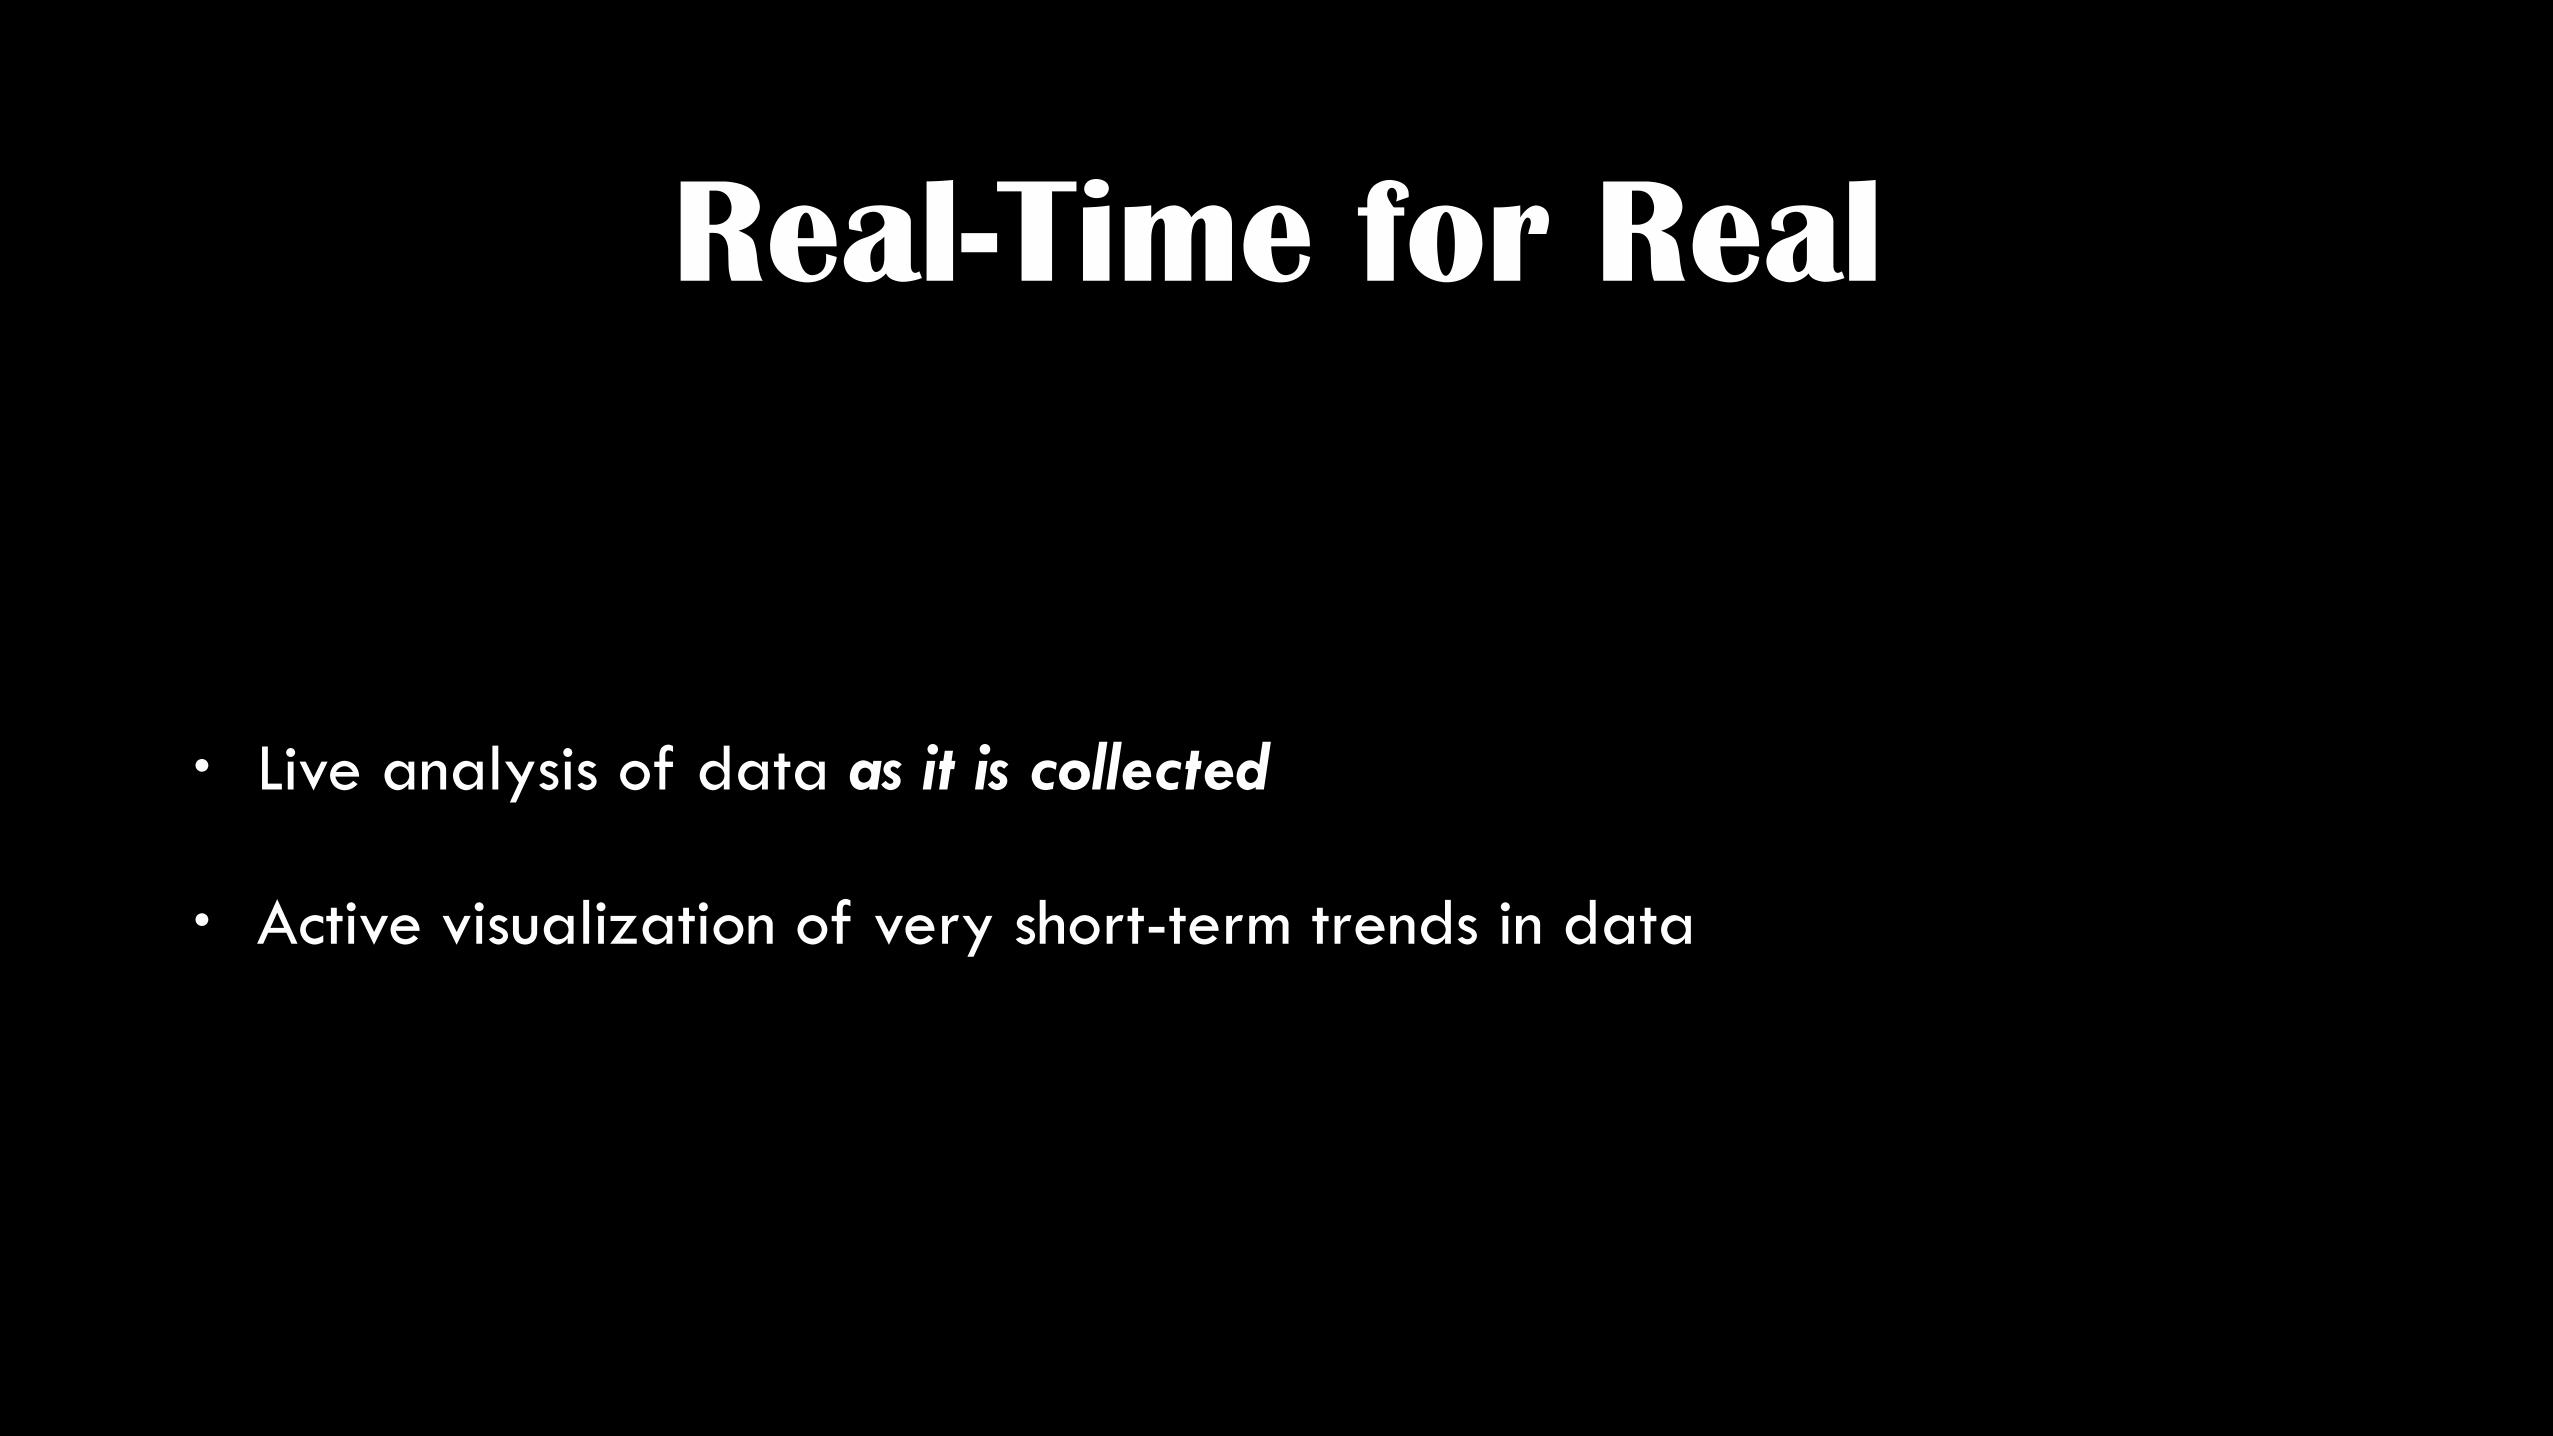
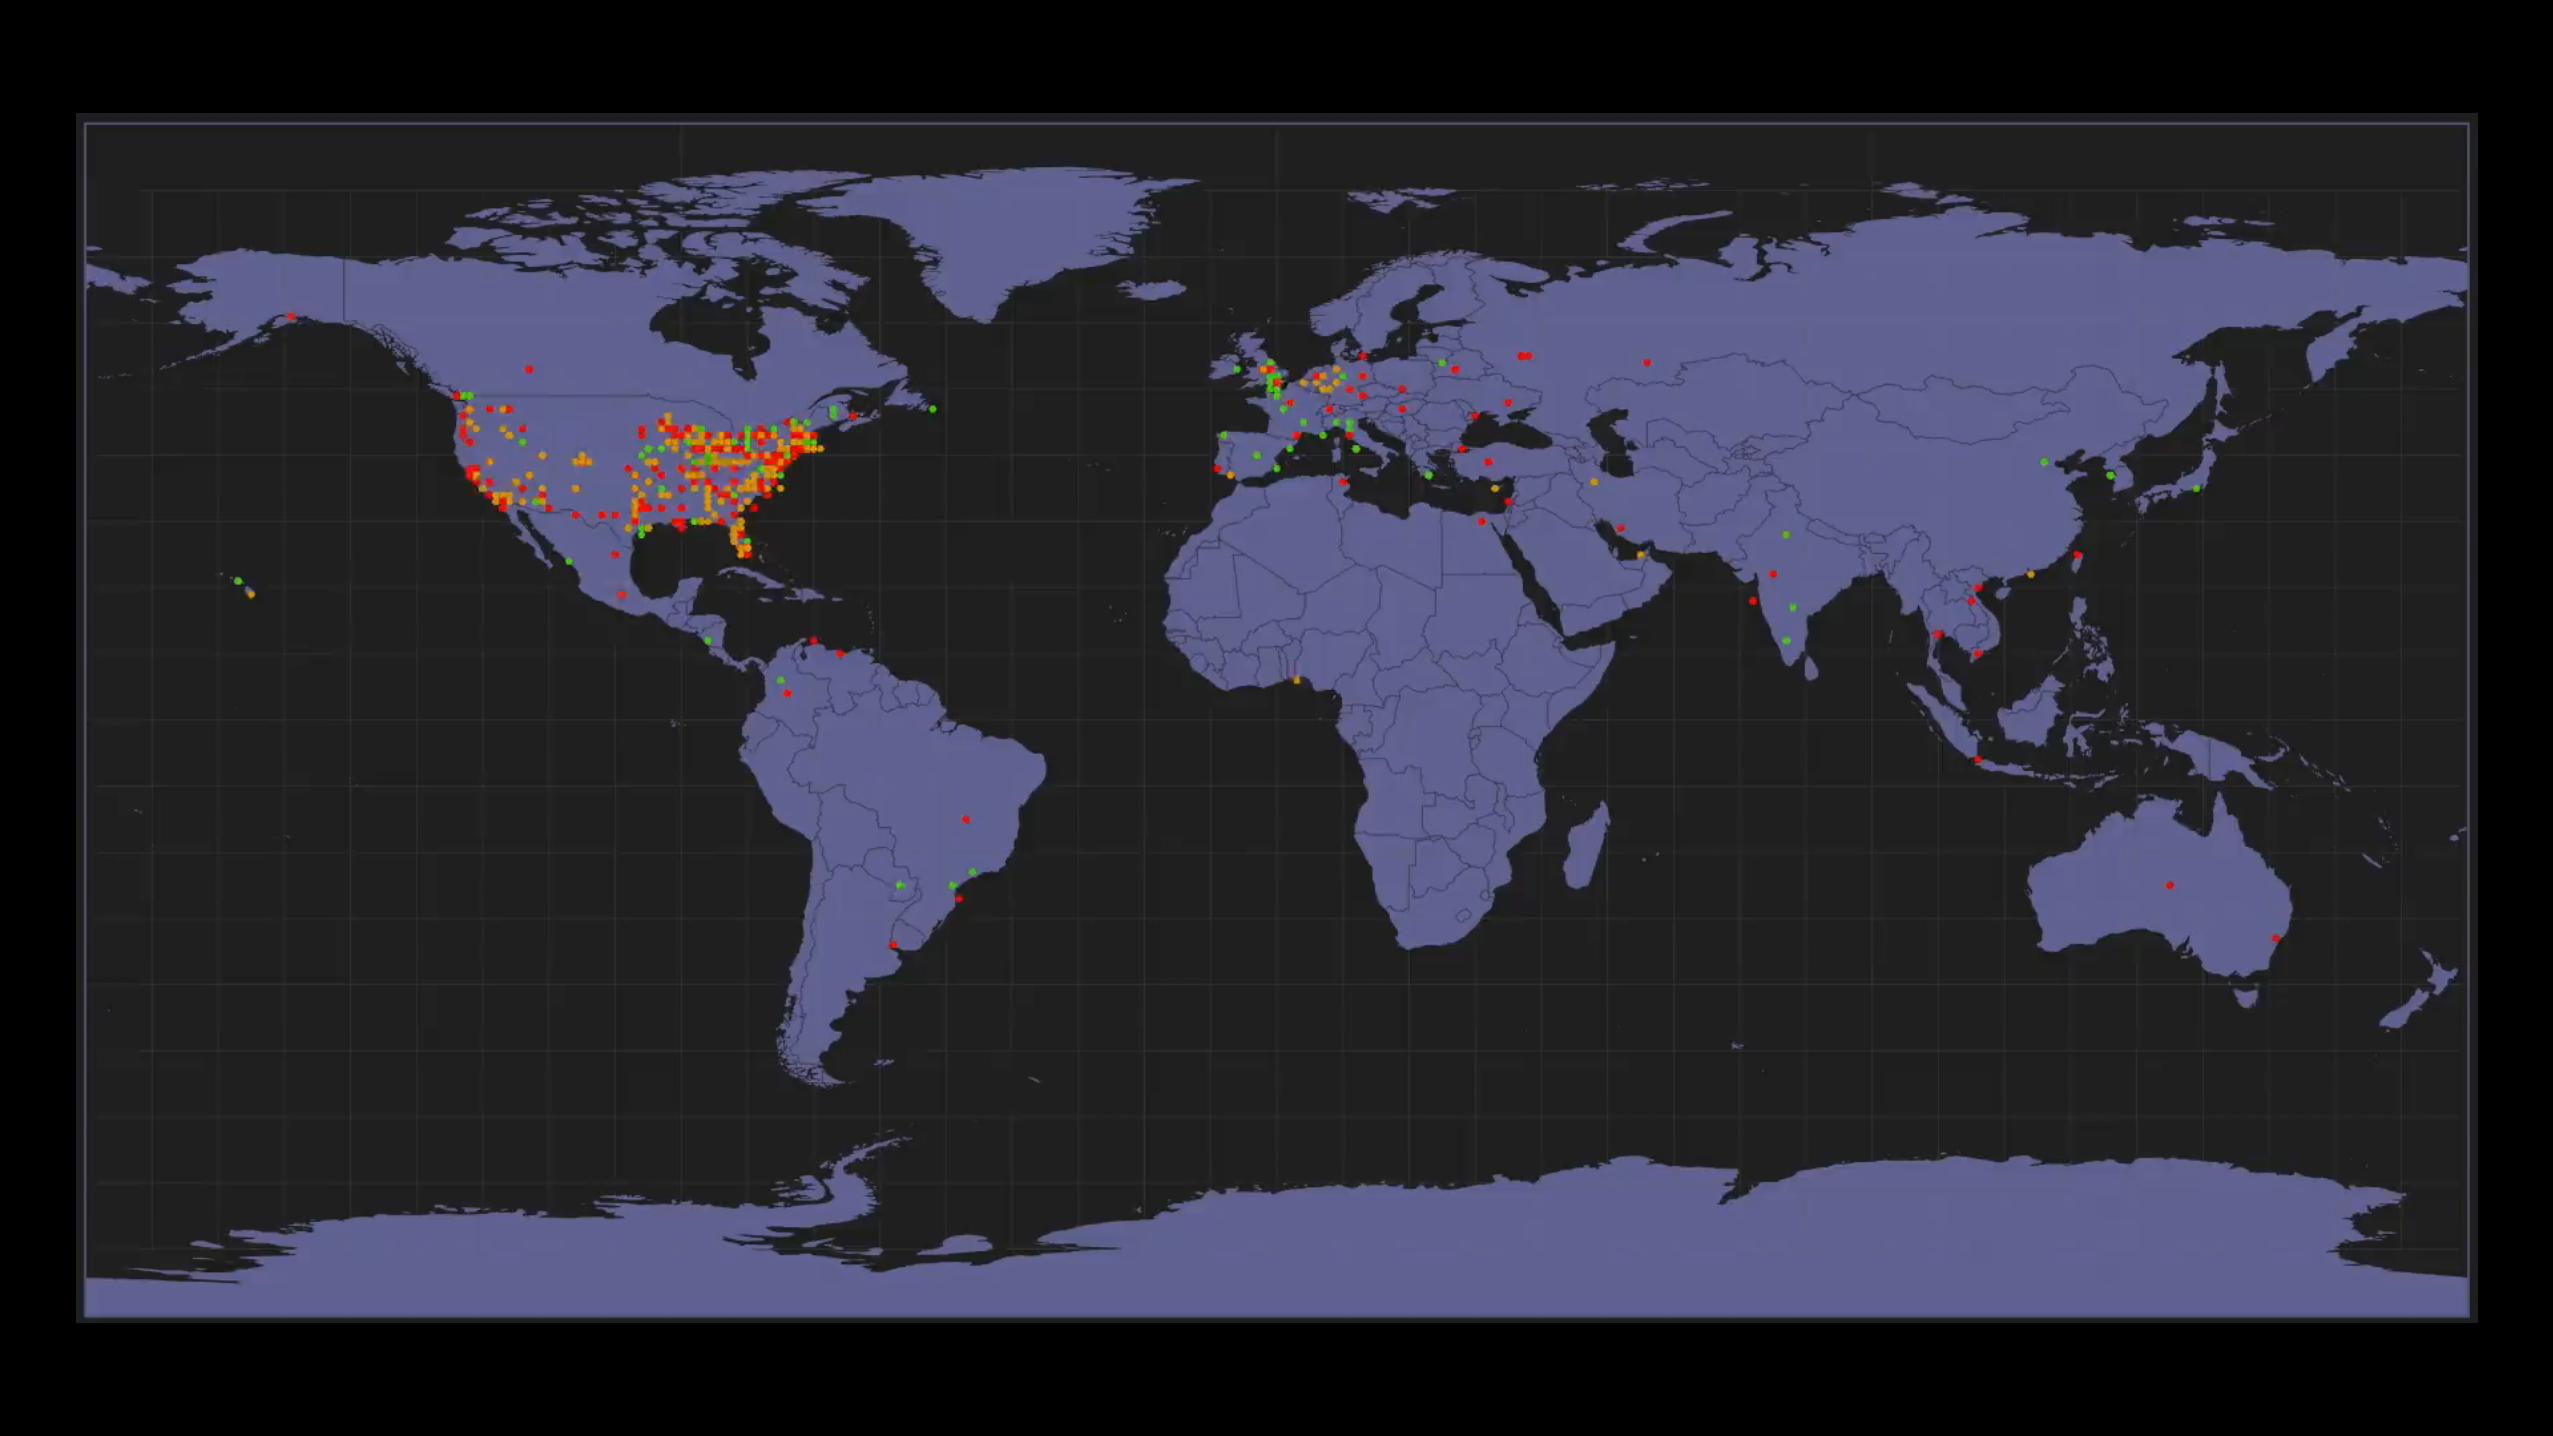
Real-Time for Real
• Live analysis of data as it is collected
• Active visualization of very short-term trends in data
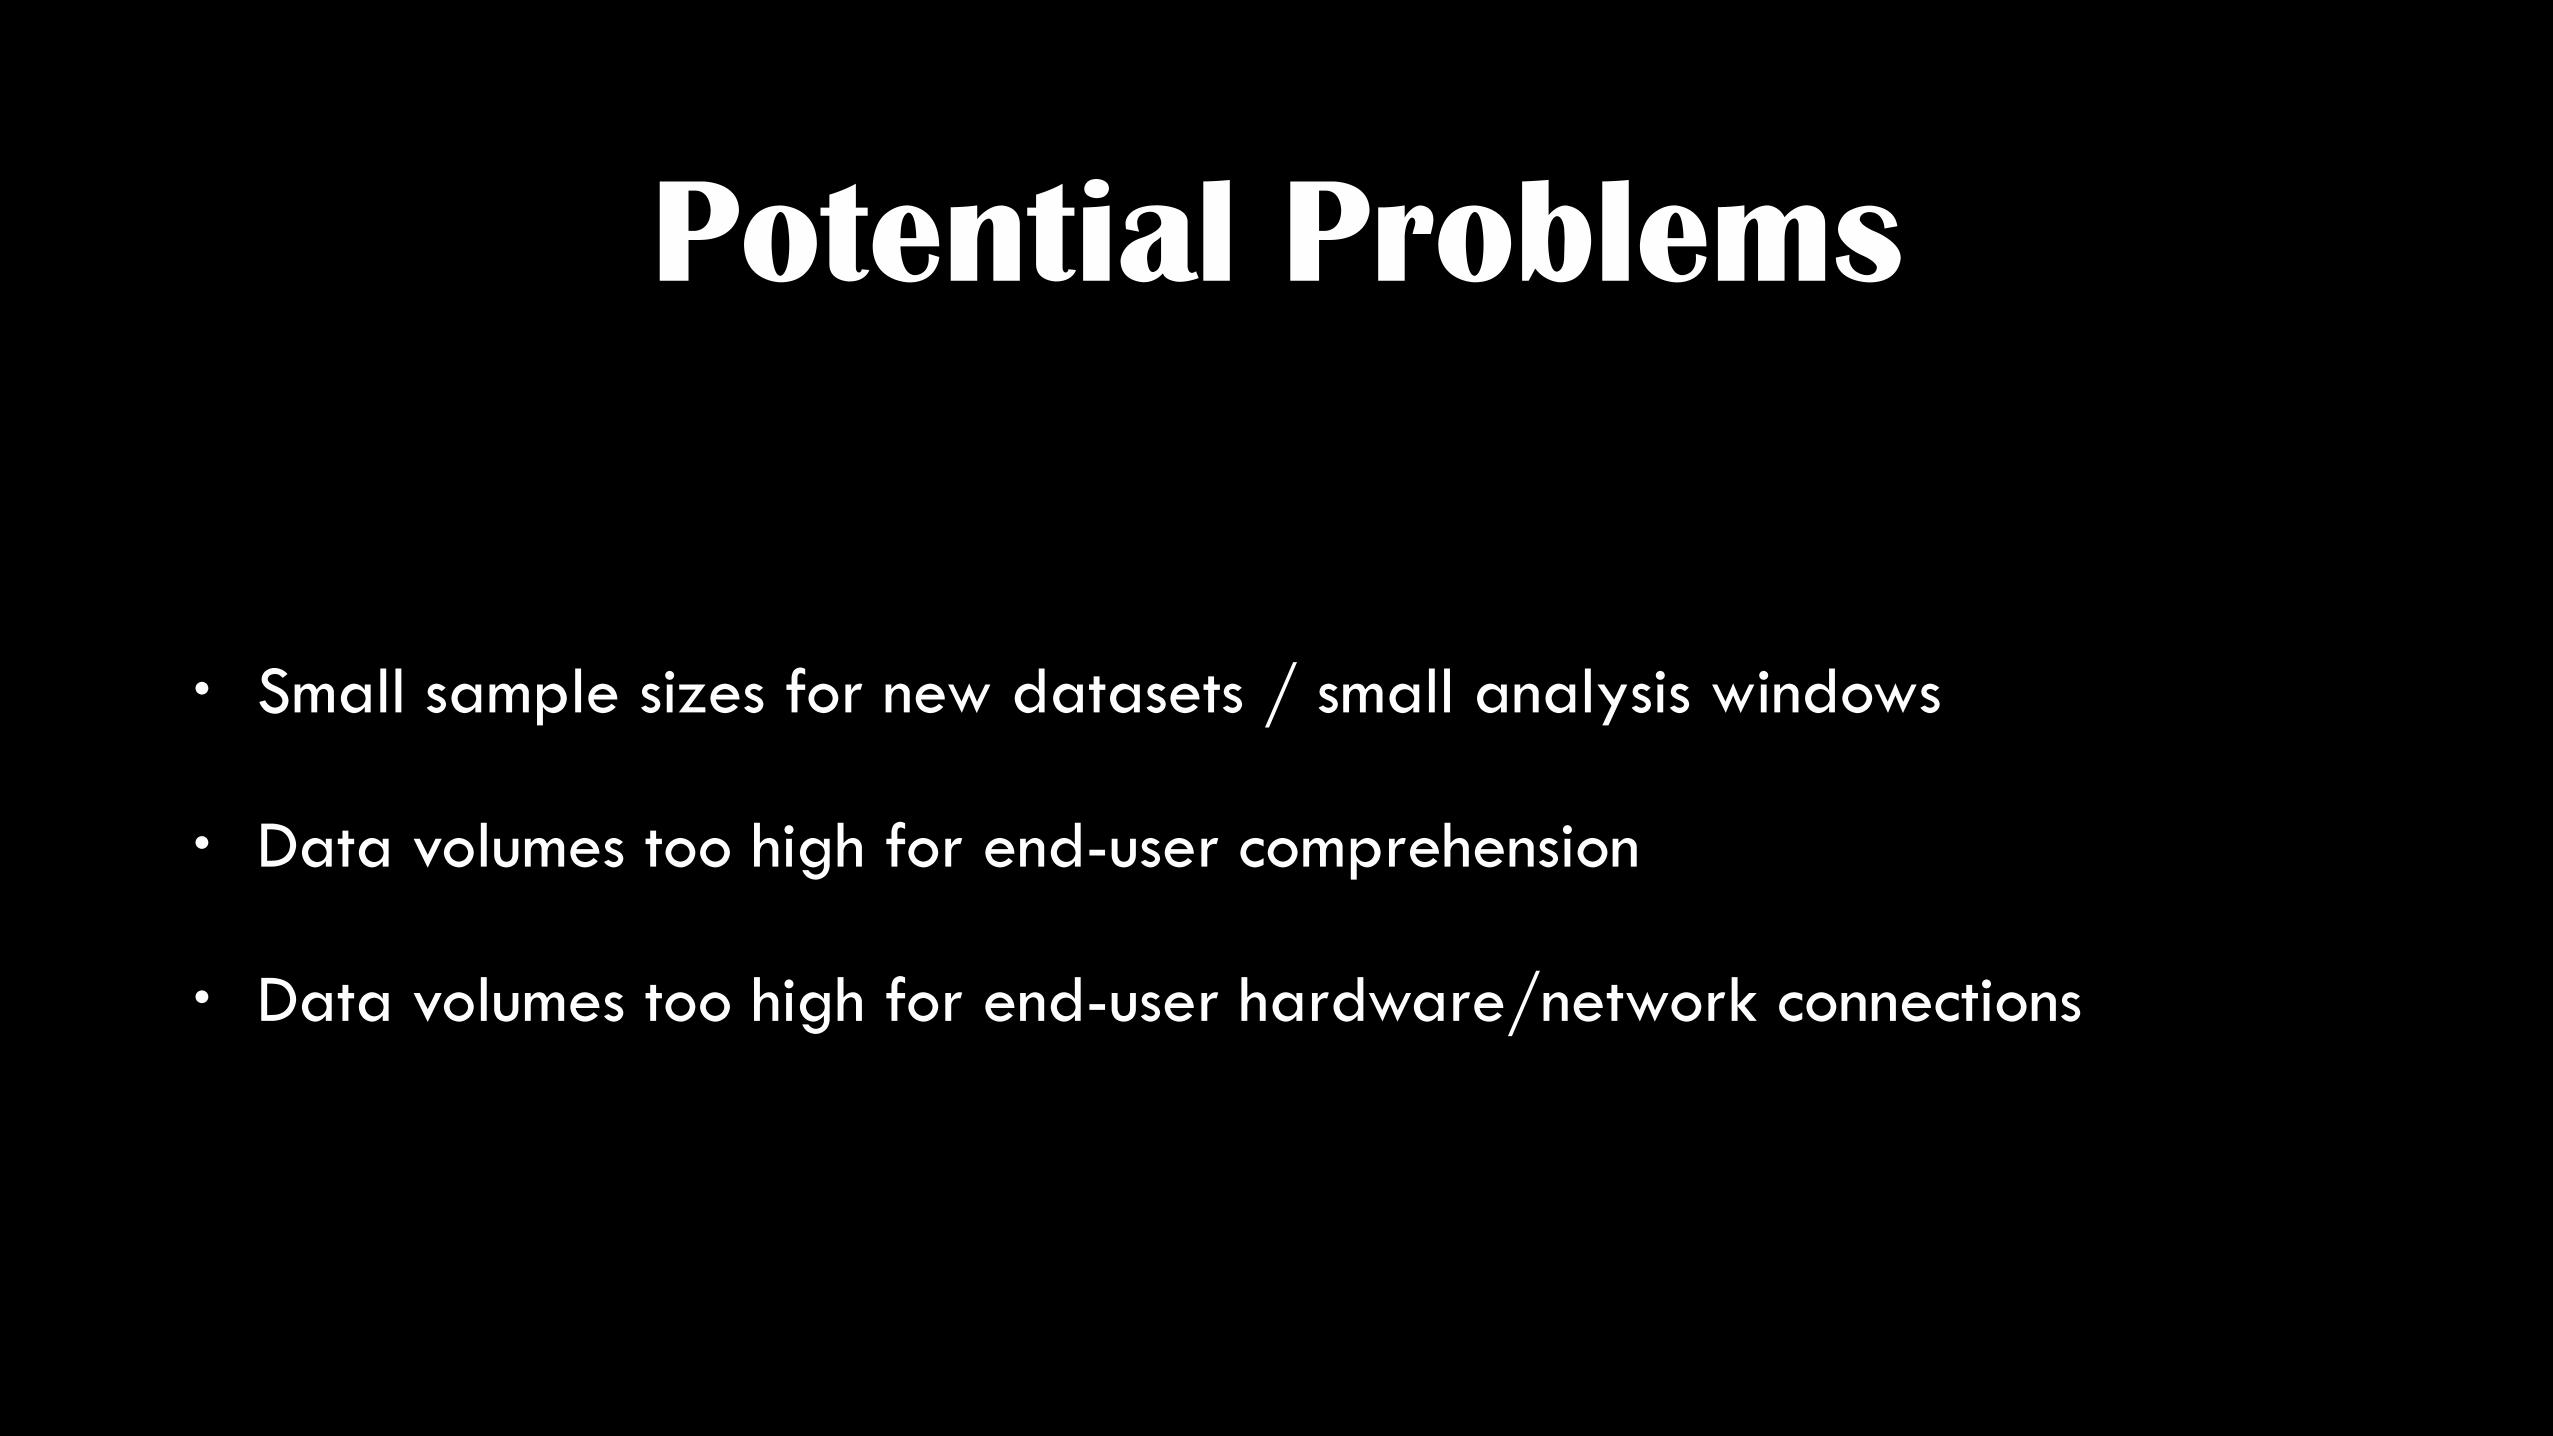
Potential Problems
• Small sample sizes for new datasets / small analysis windows
• Data volumes too high for end-user comprehension
• Data volumes too high for end-user hardware/network connections
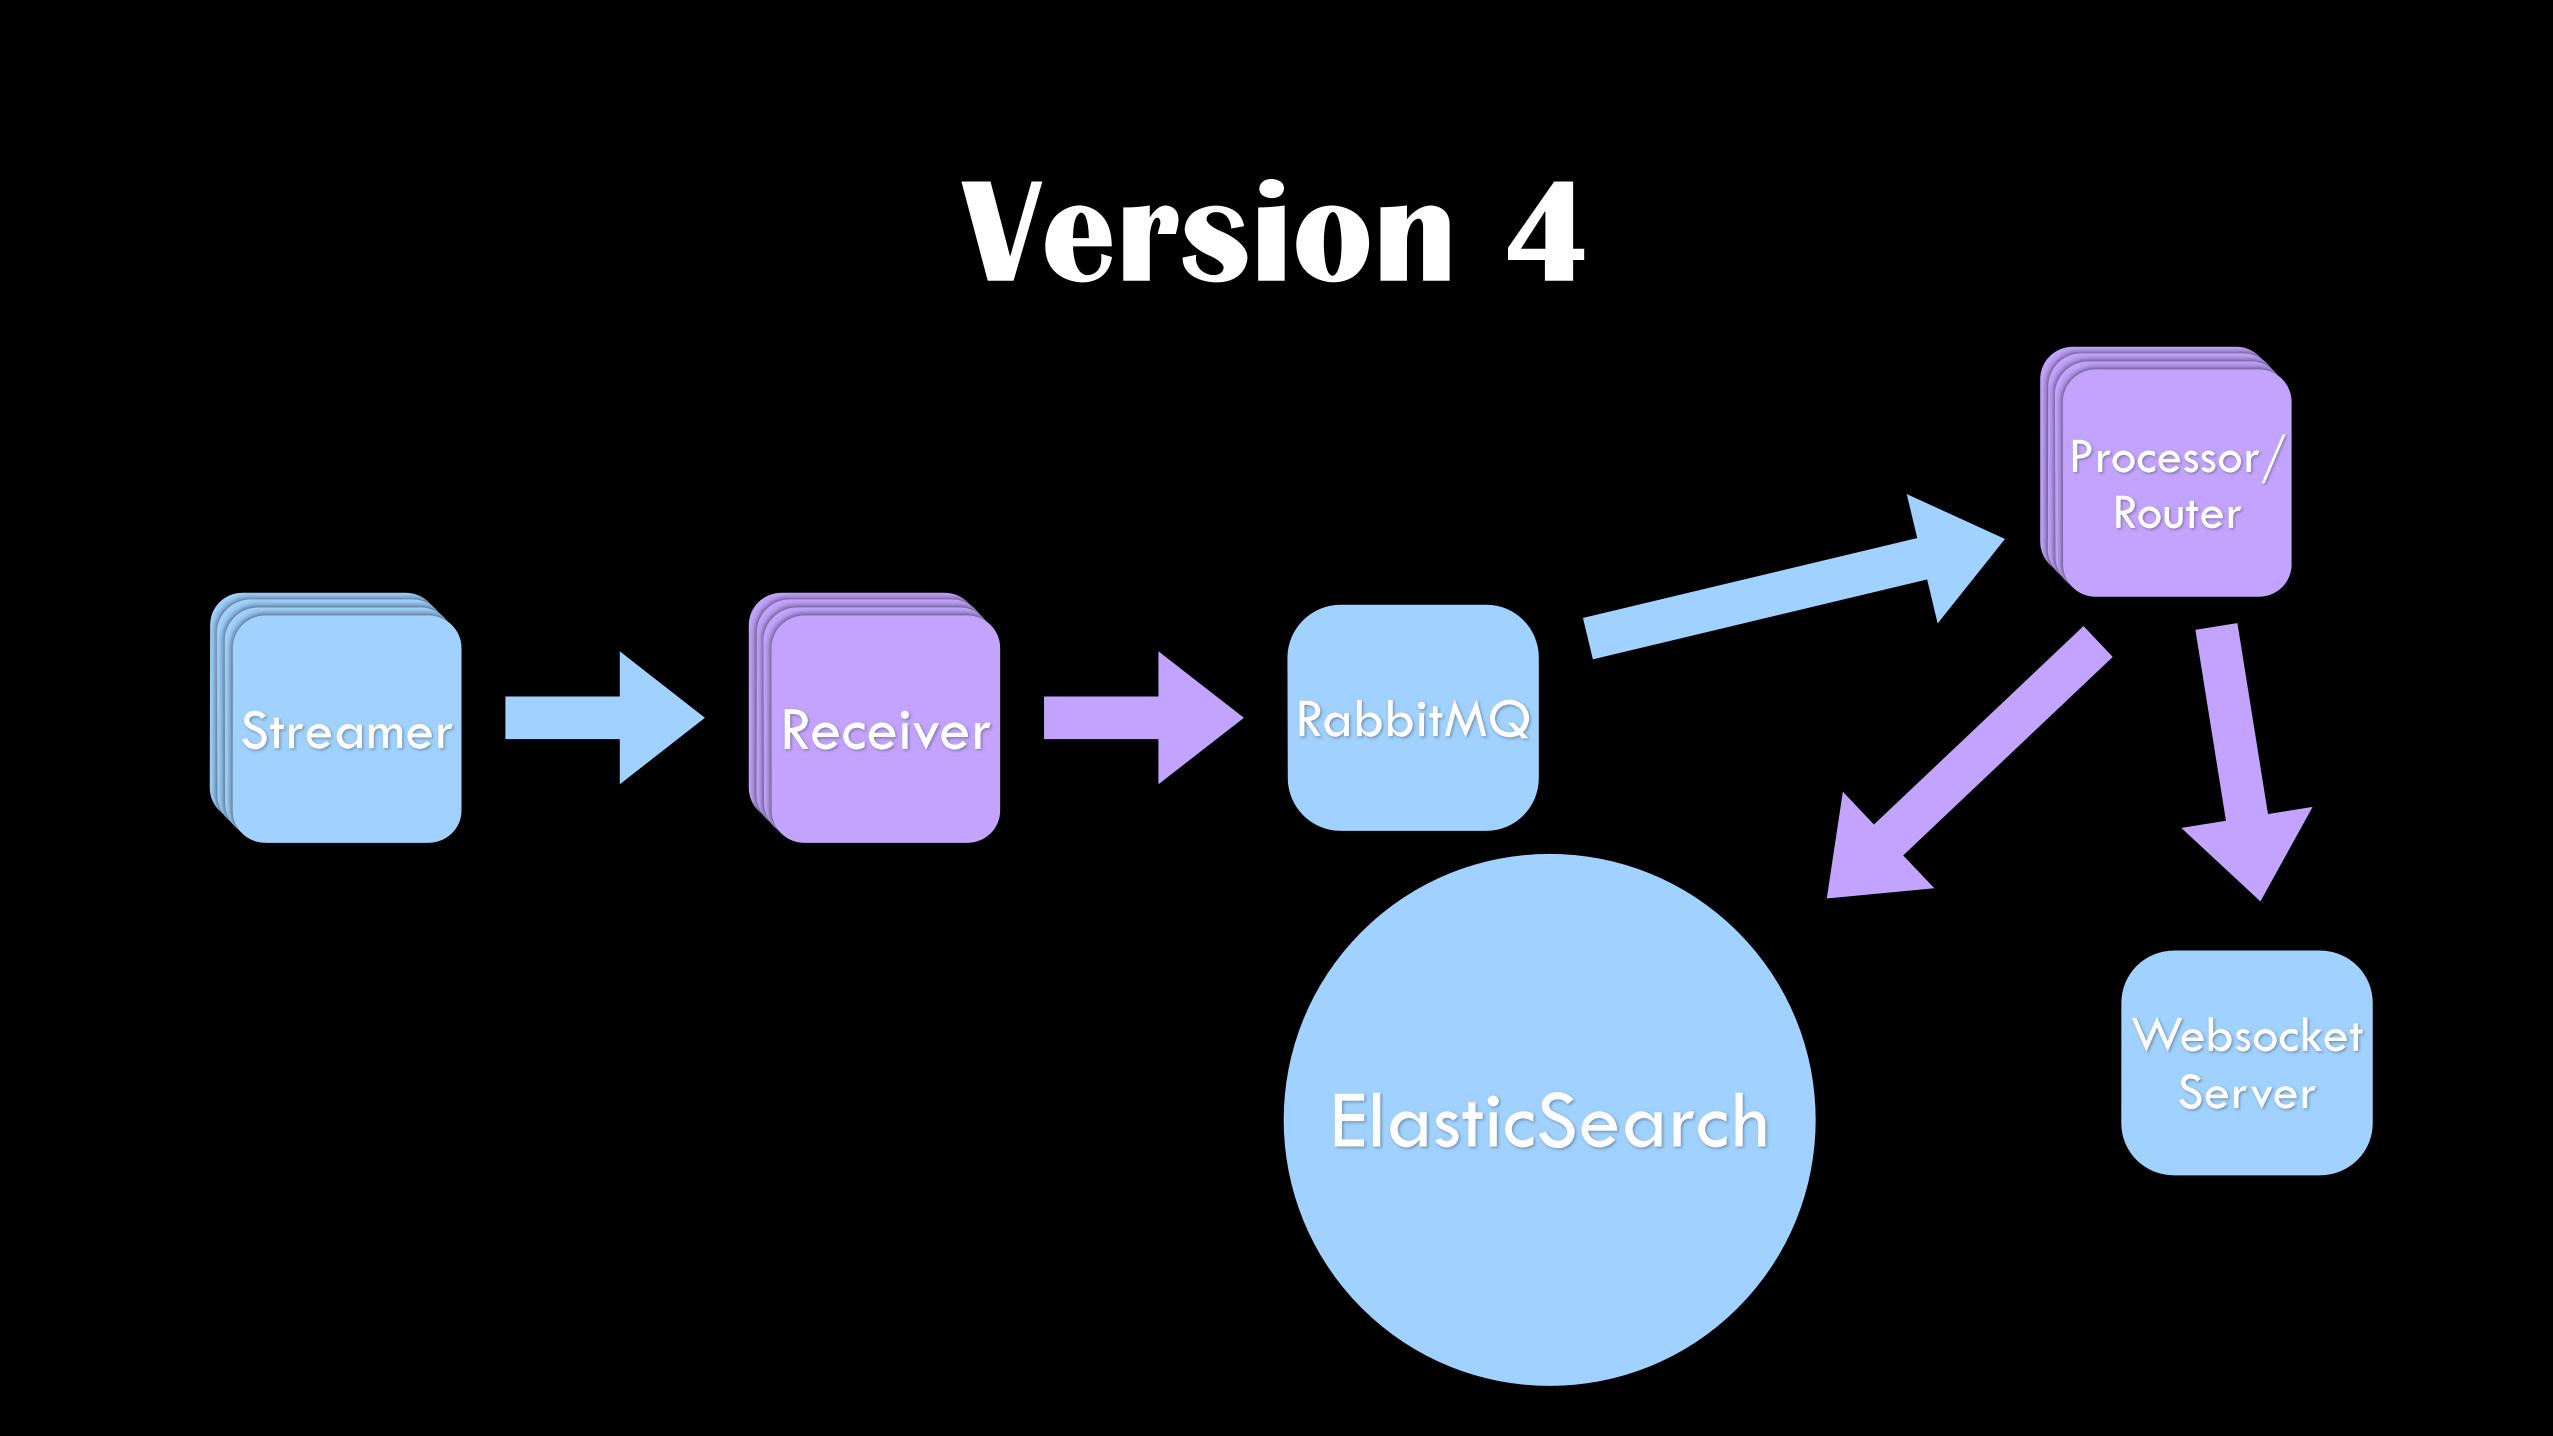
Version 4
CollectorCollectorCollectorStreamer CollectorCollectorCollectorReceiver
ElasticSearch
RabbitMQ
CollectorCollectorCollectorProcessor/ Router
Websocket Server
D3JS
• Open-source data visualization library written in JavaScript
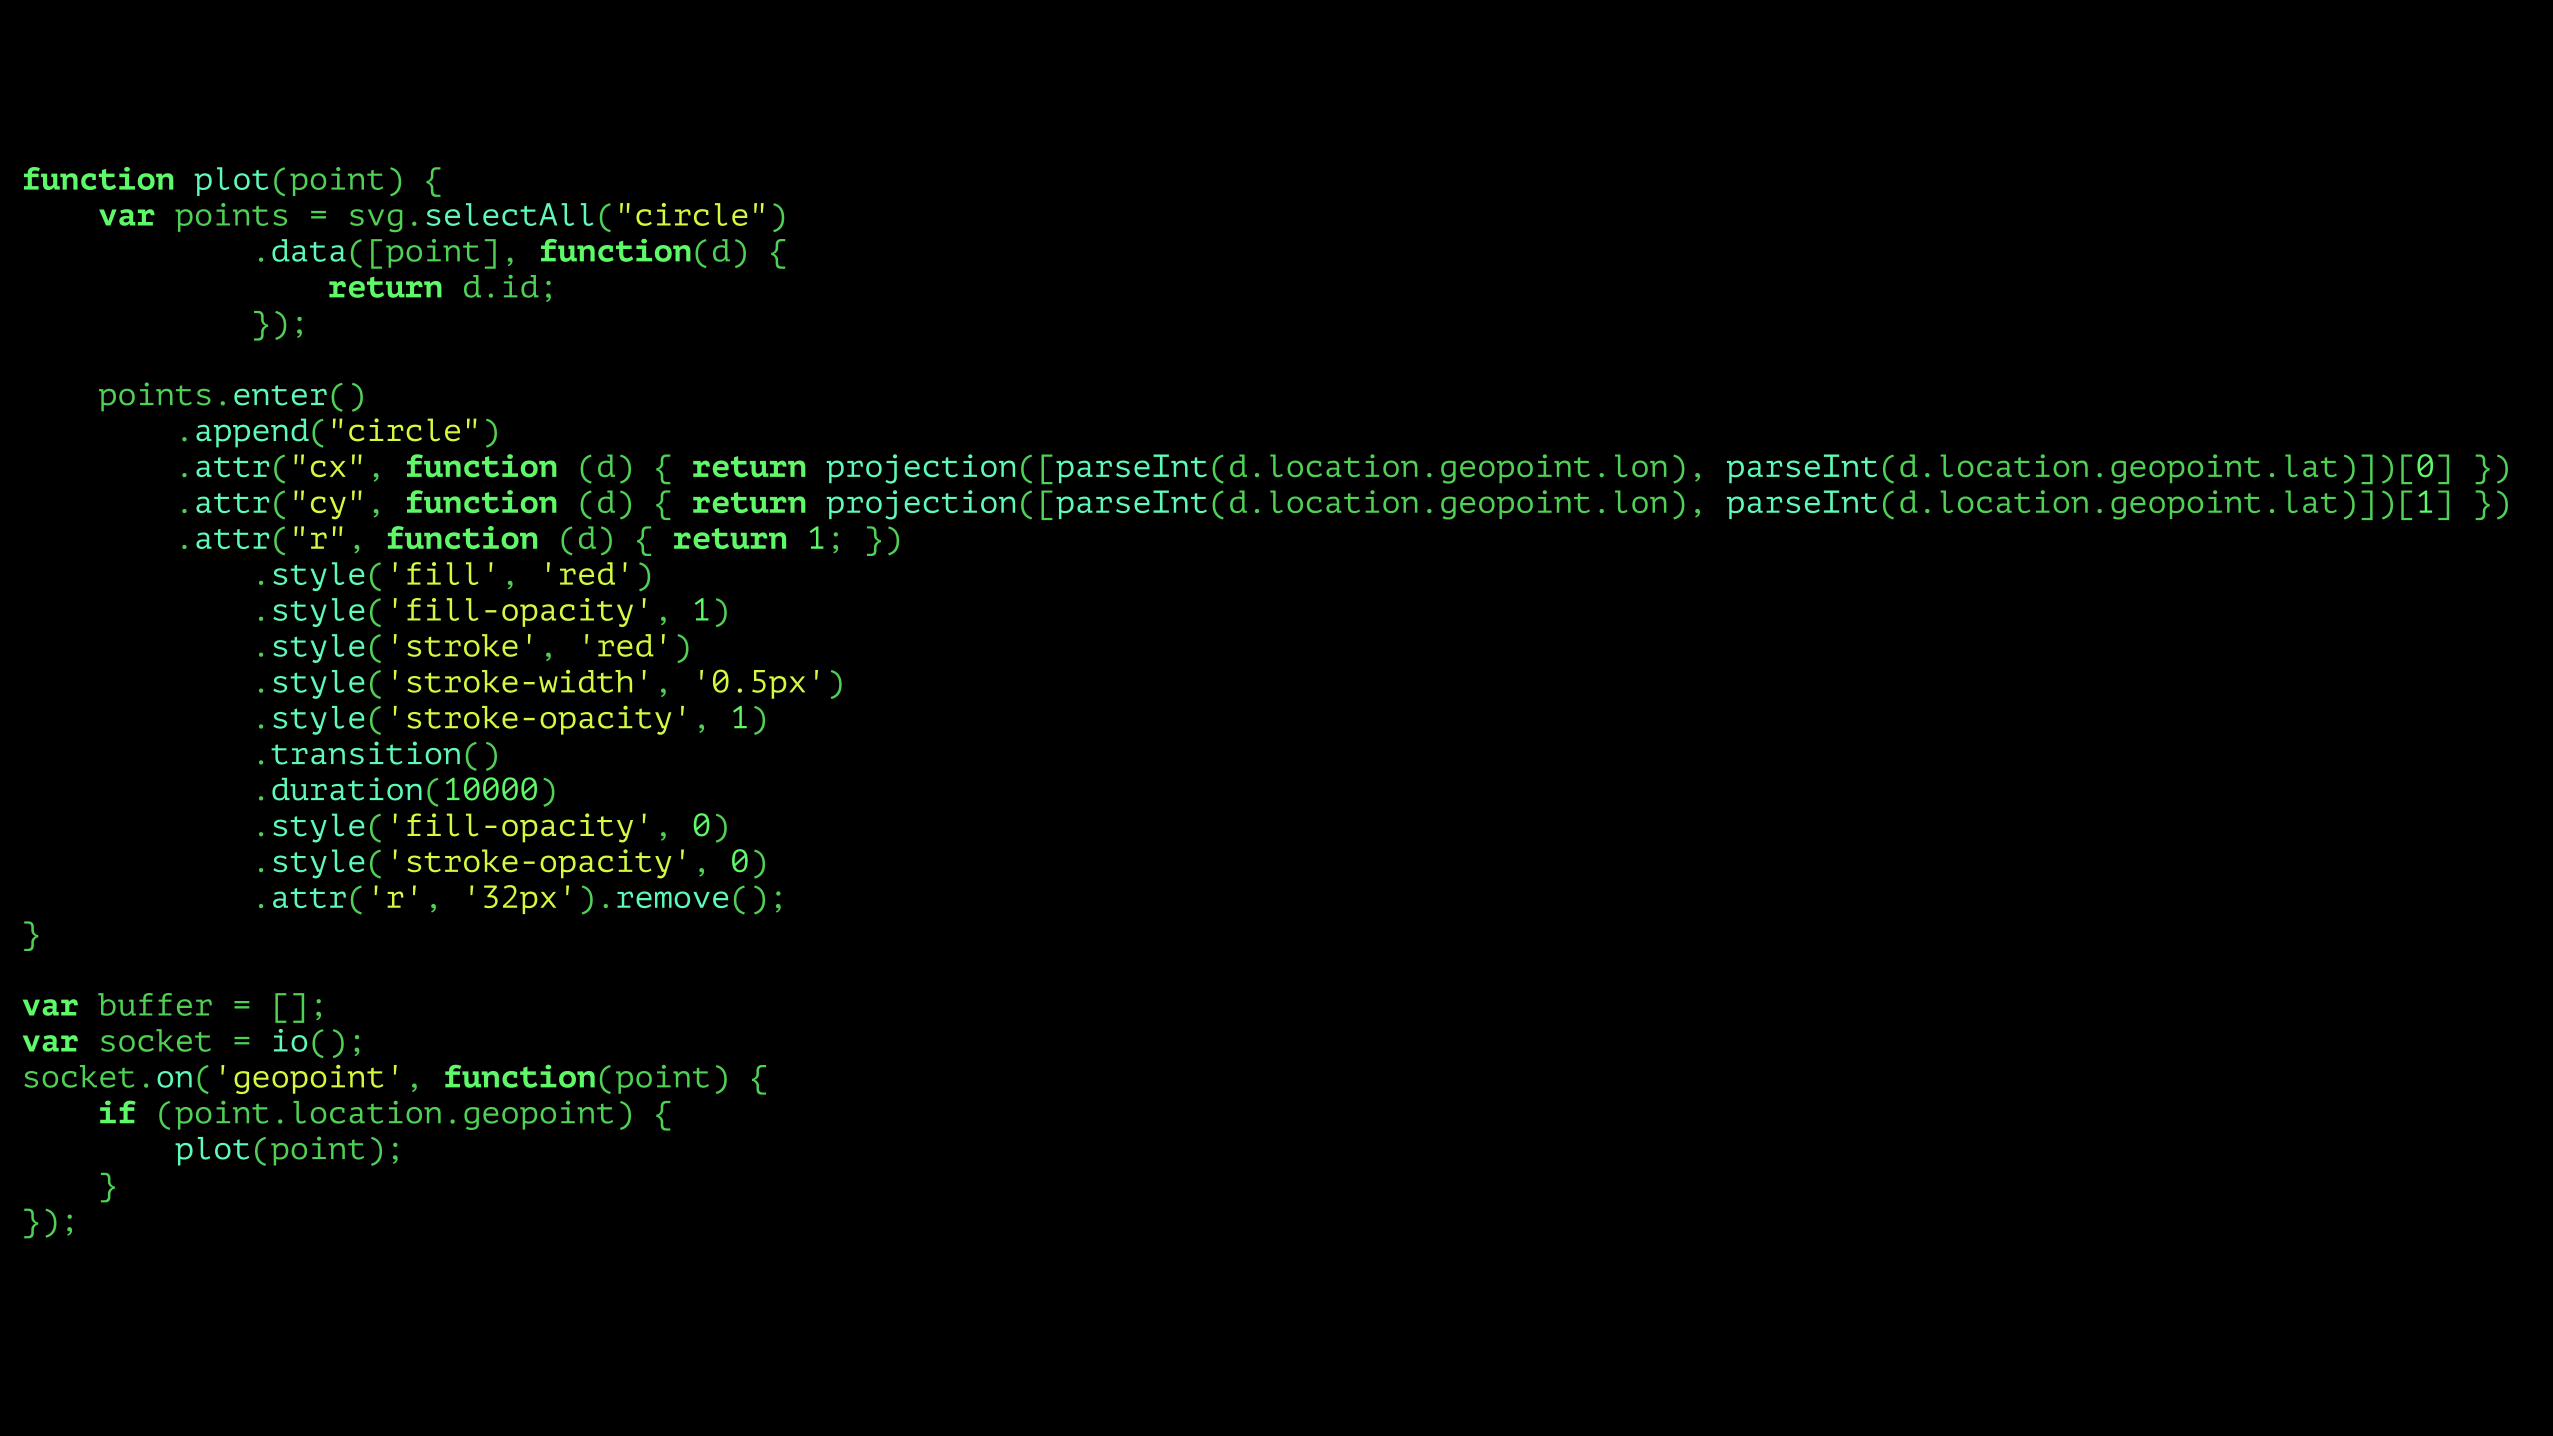
function plot(point) { var points = svg.selectAll("circle") .data([point], function(d) { return d.id; });
points.enter() .append("circle") .attr("cx", function (d) { return projection([parseInt(d.location.geopoint.lon), parseInt(d.location.geopoint.lat)])[0] }) .attr("cy", function (d) { return projection([parseInt(d.location.geopoint.lon), parseInt(d.location.geopoint.lat)])[1] }) .attr("r", function (d) { return 1; }) .style('fill', 'red') .style('fill-opacity', 1) .style('stroke', 'red') .style('stroke-width', '0.5px') .style('stroke-opacity', 1) .transition() .duration(10000) .style('fill-opacity', 0) .style('stroke-opacity', 0) .attr('r', '32px').remove(); }
var buffer = []; var socket = io(); socket.on('geopoint', function(point) { if (point.location.geopoint) { plot(point); } });


By the way…
xn = x + (r * COS(2π * n / v)) yn = y + (r * COS(2π * n / v))
where n = ordinal of vertex and where v = number of vertices and
x,y = center of the polygon

var views = 0; var socket = io(); socket.on('pageview', function(point) { views++; });
function tick() { data.push(views); views = 0;
path .attr("d", line) .attr("transform", null) .transition() .duration(500) .ease("linear") .attr("transform", "translate(" + x(0) + ",0)") .each("end", tick);
data.shift(); }
tick();

Pageview Heartbeat


Real-Time Profiling
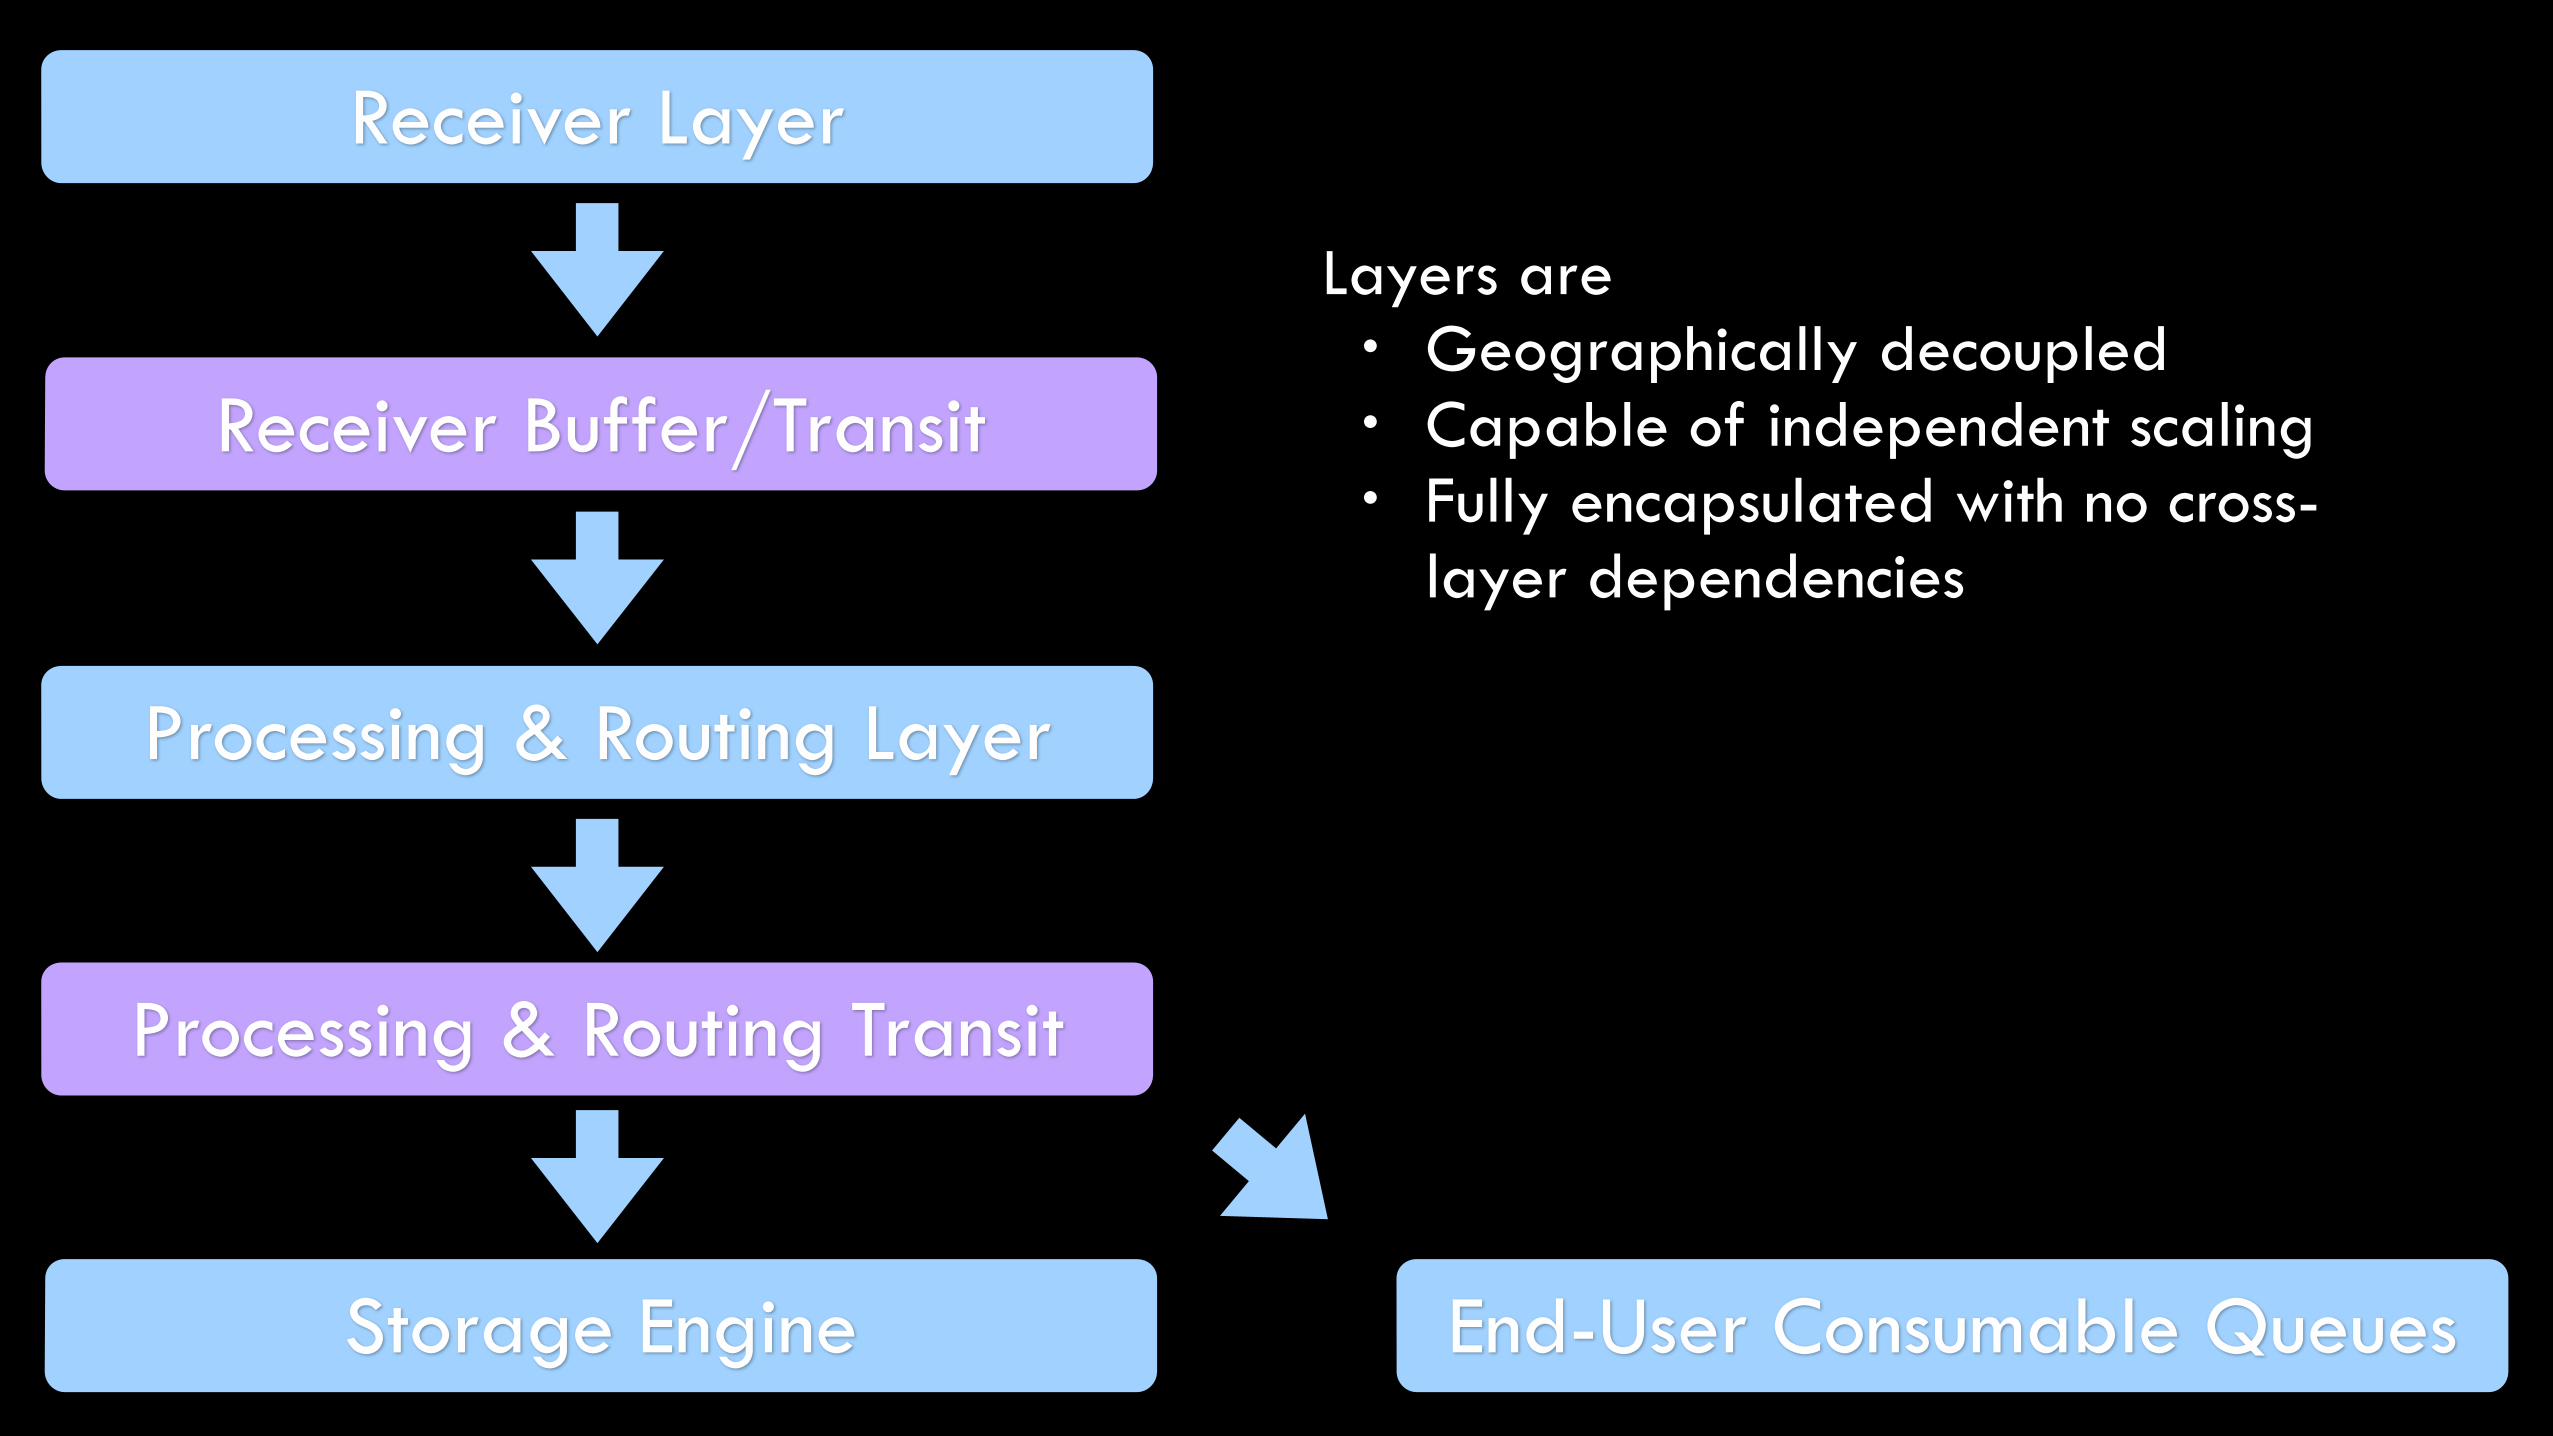
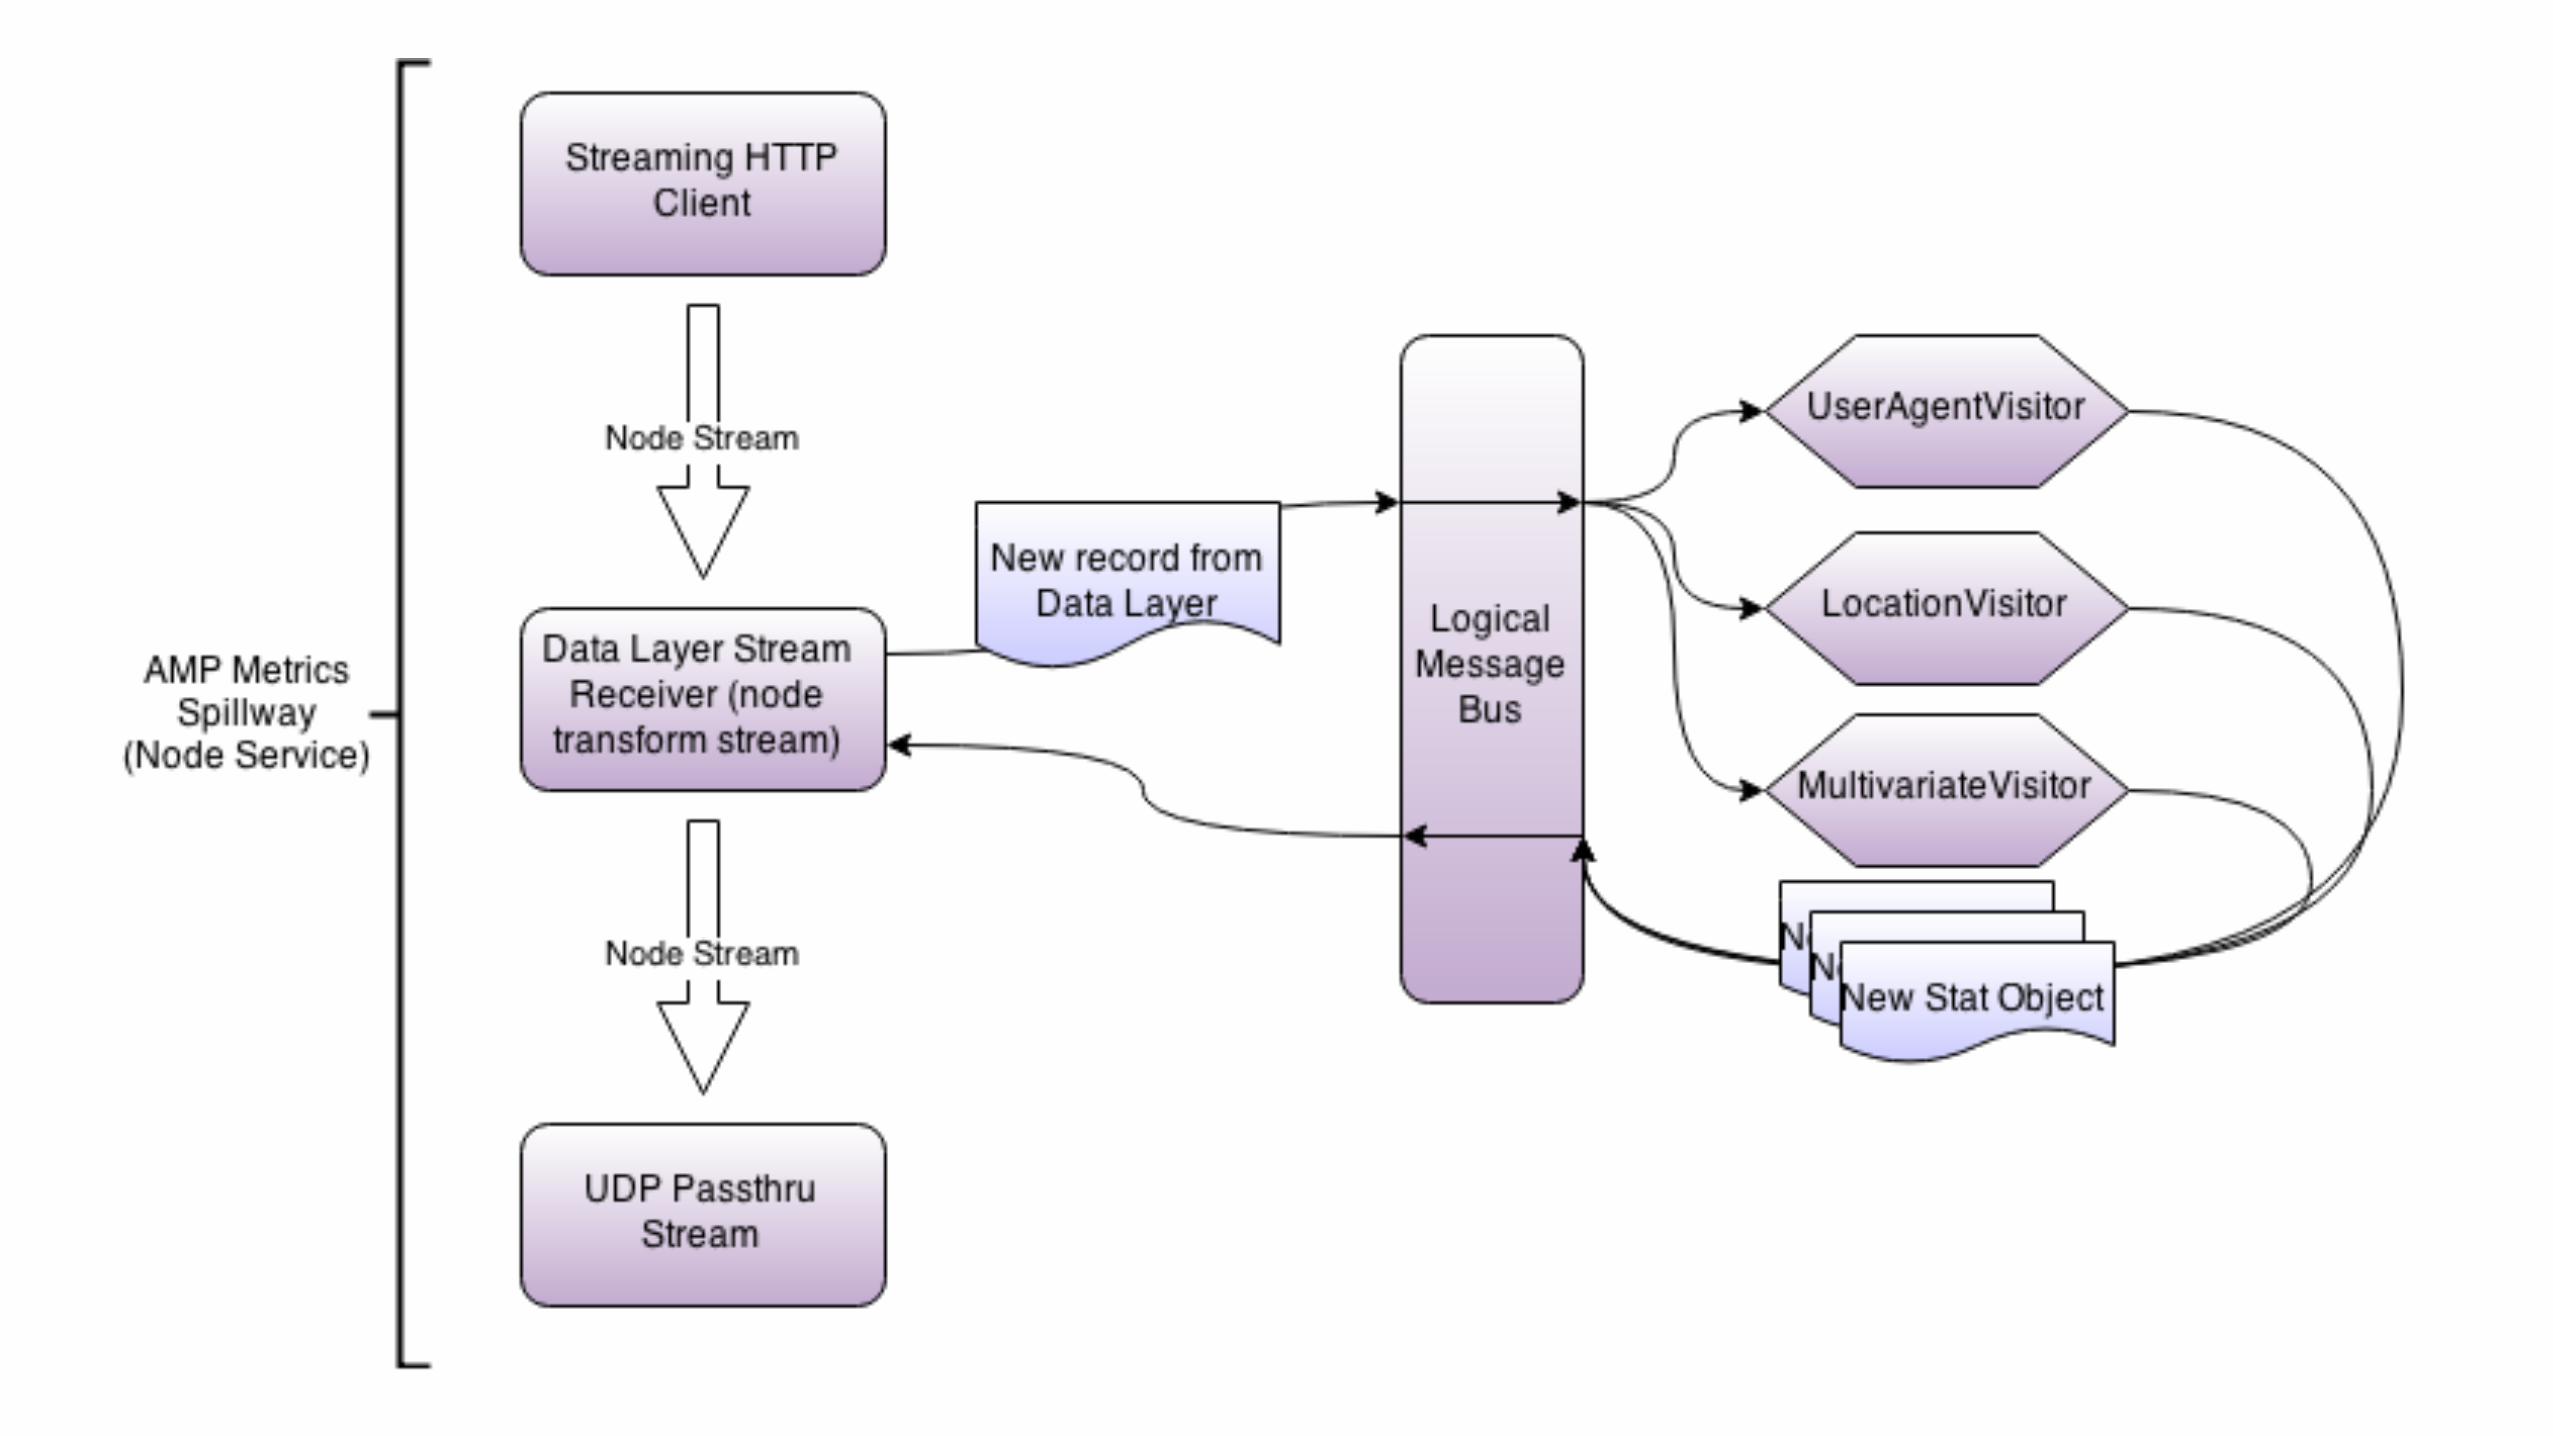
Receiver Layer
Receiver Buffer/Transit
Processing & Routing Layer
Processing & Routing Transit
Storage Engine End-User Consumable Queues
Layers are • Geographically decoupled • Capable of independent scaling • Fully encapsulated with no cross-
layer dependencies

Interfaces
Input Stream (Java)
Routing (node.js)
Filtering (node.js)
Aggregation (PHP)
Visualization (D3JS)
MV Testing (PHP)

Languages & Tools
RabbitMQ
Hadoop
Elastic Search
PHP
JS (node)
JS (D3)
Java
MySQL
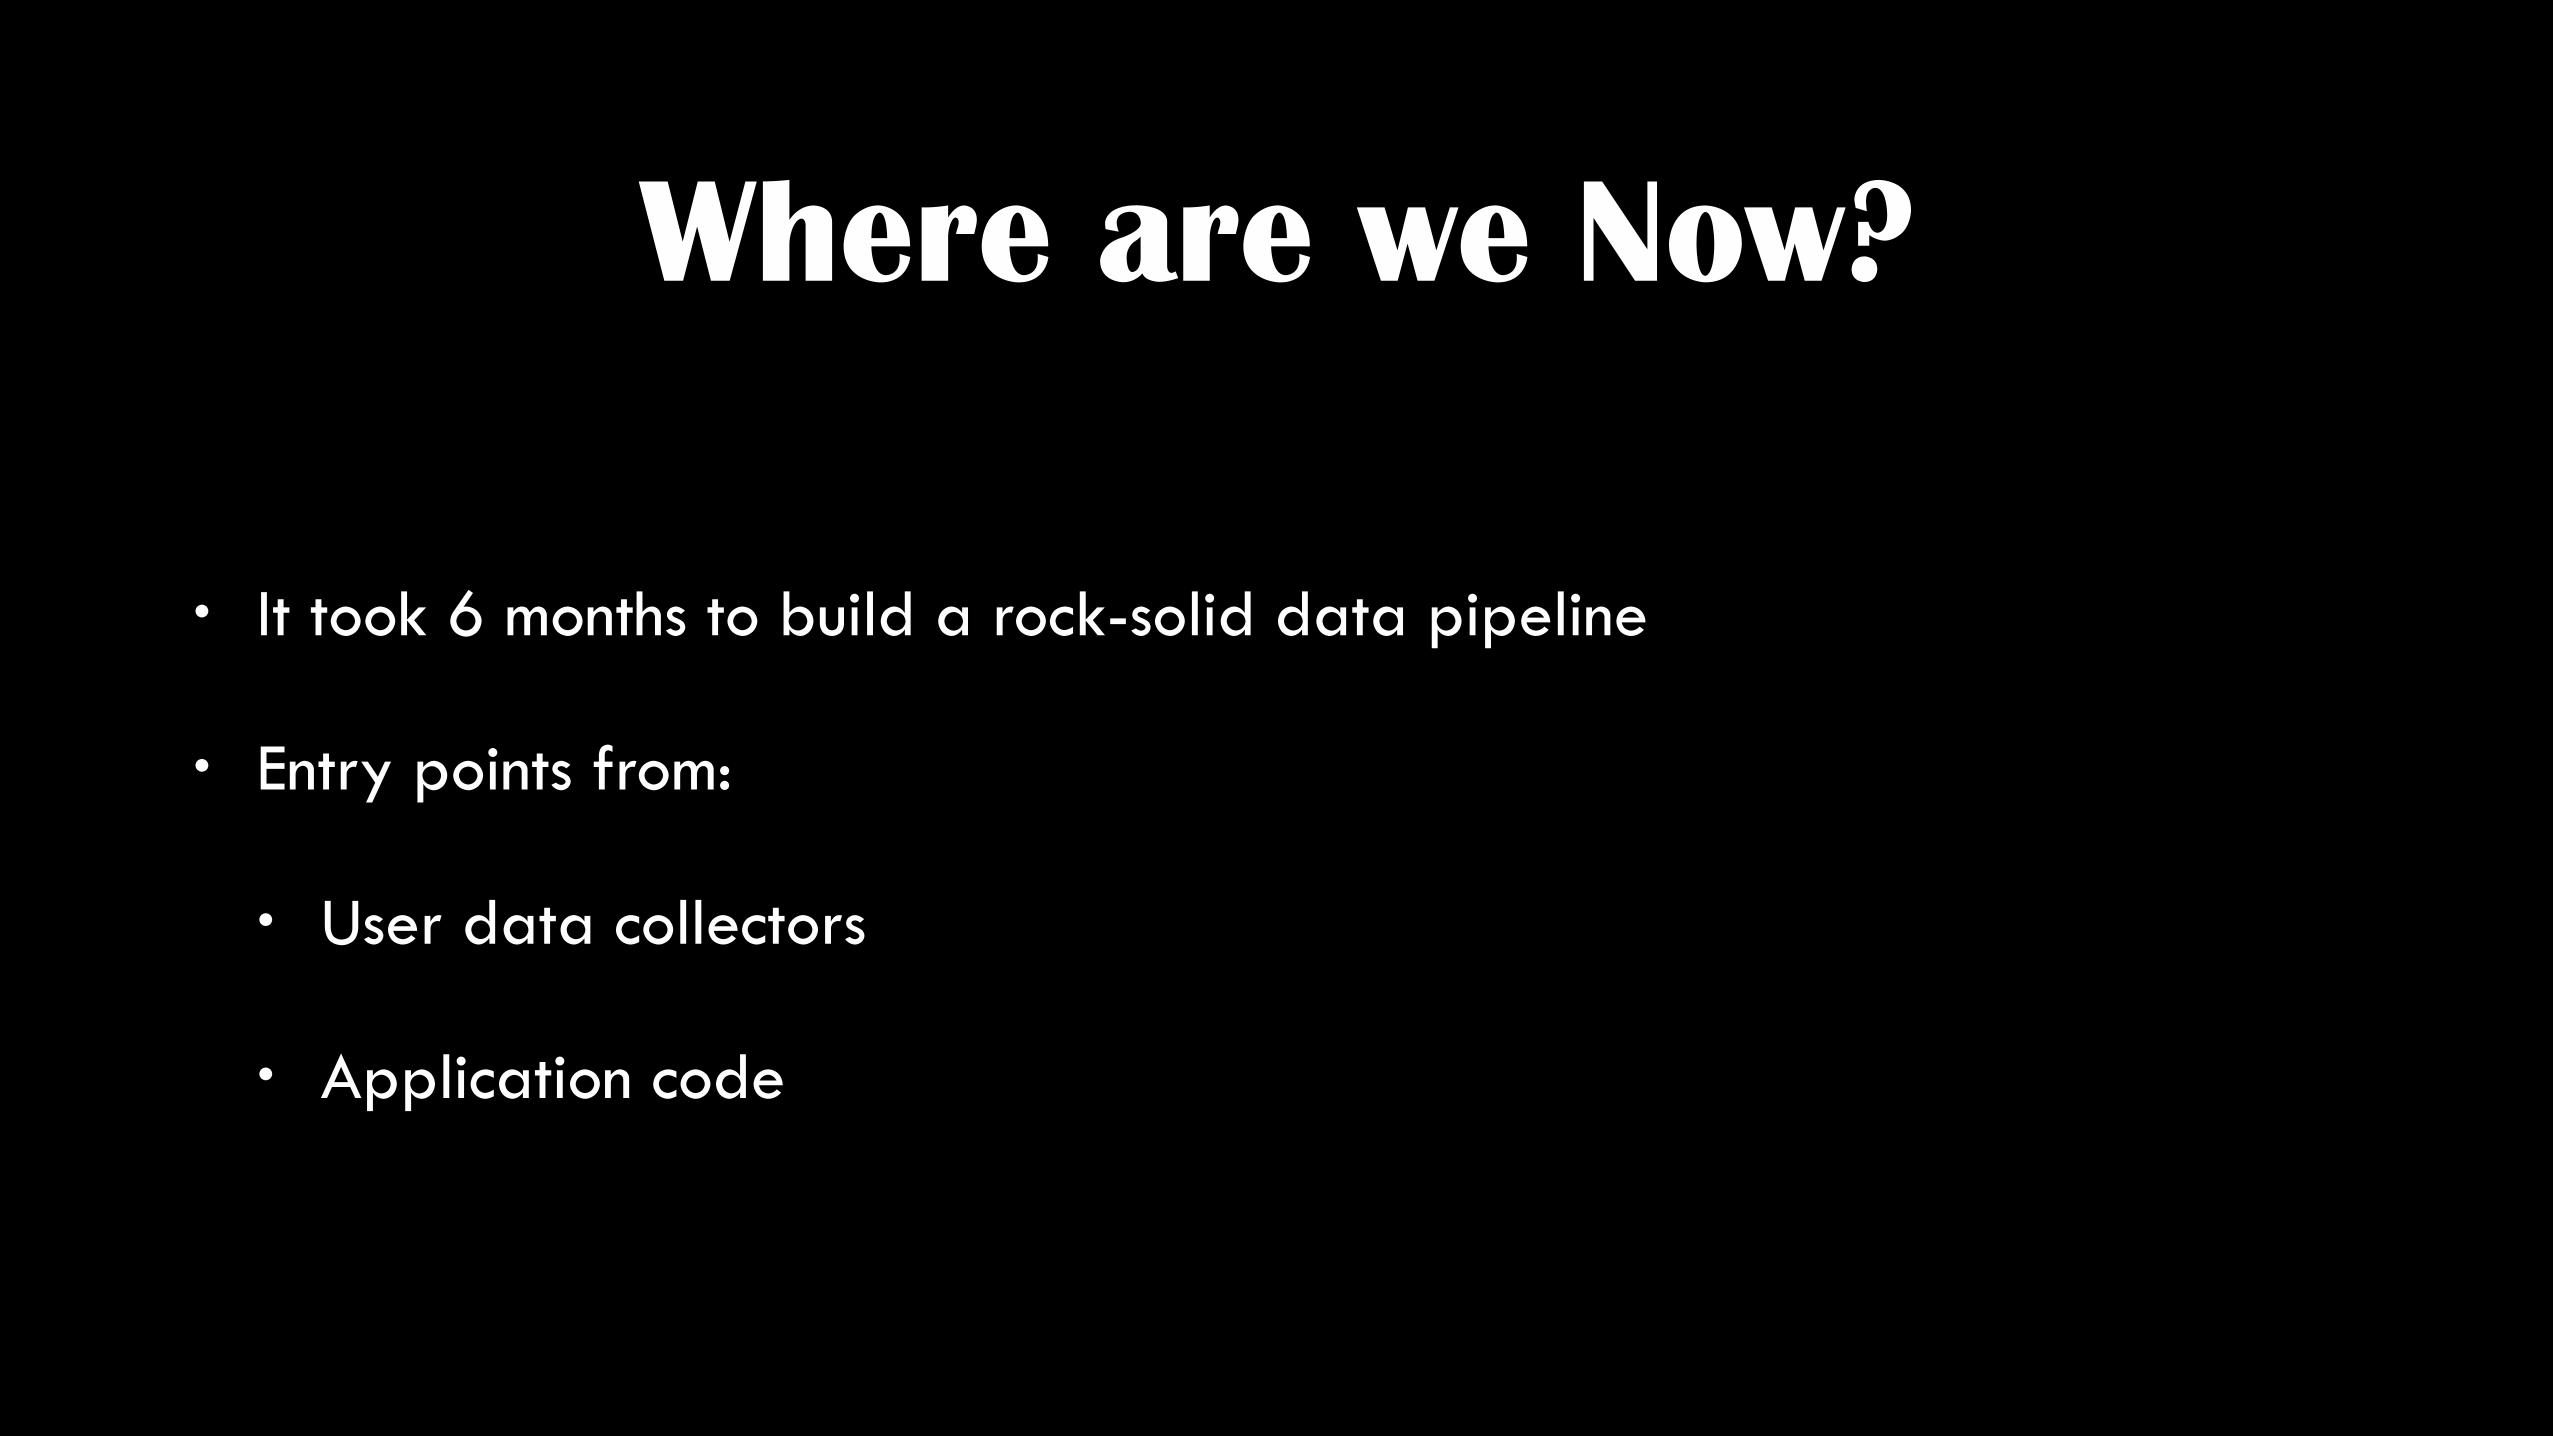
Where are we Now?
• It took 6 months to build a rock-solid data pipeline
• Entry points from:
• User data collectors
• Application code

That was the easy part.

What’s next?
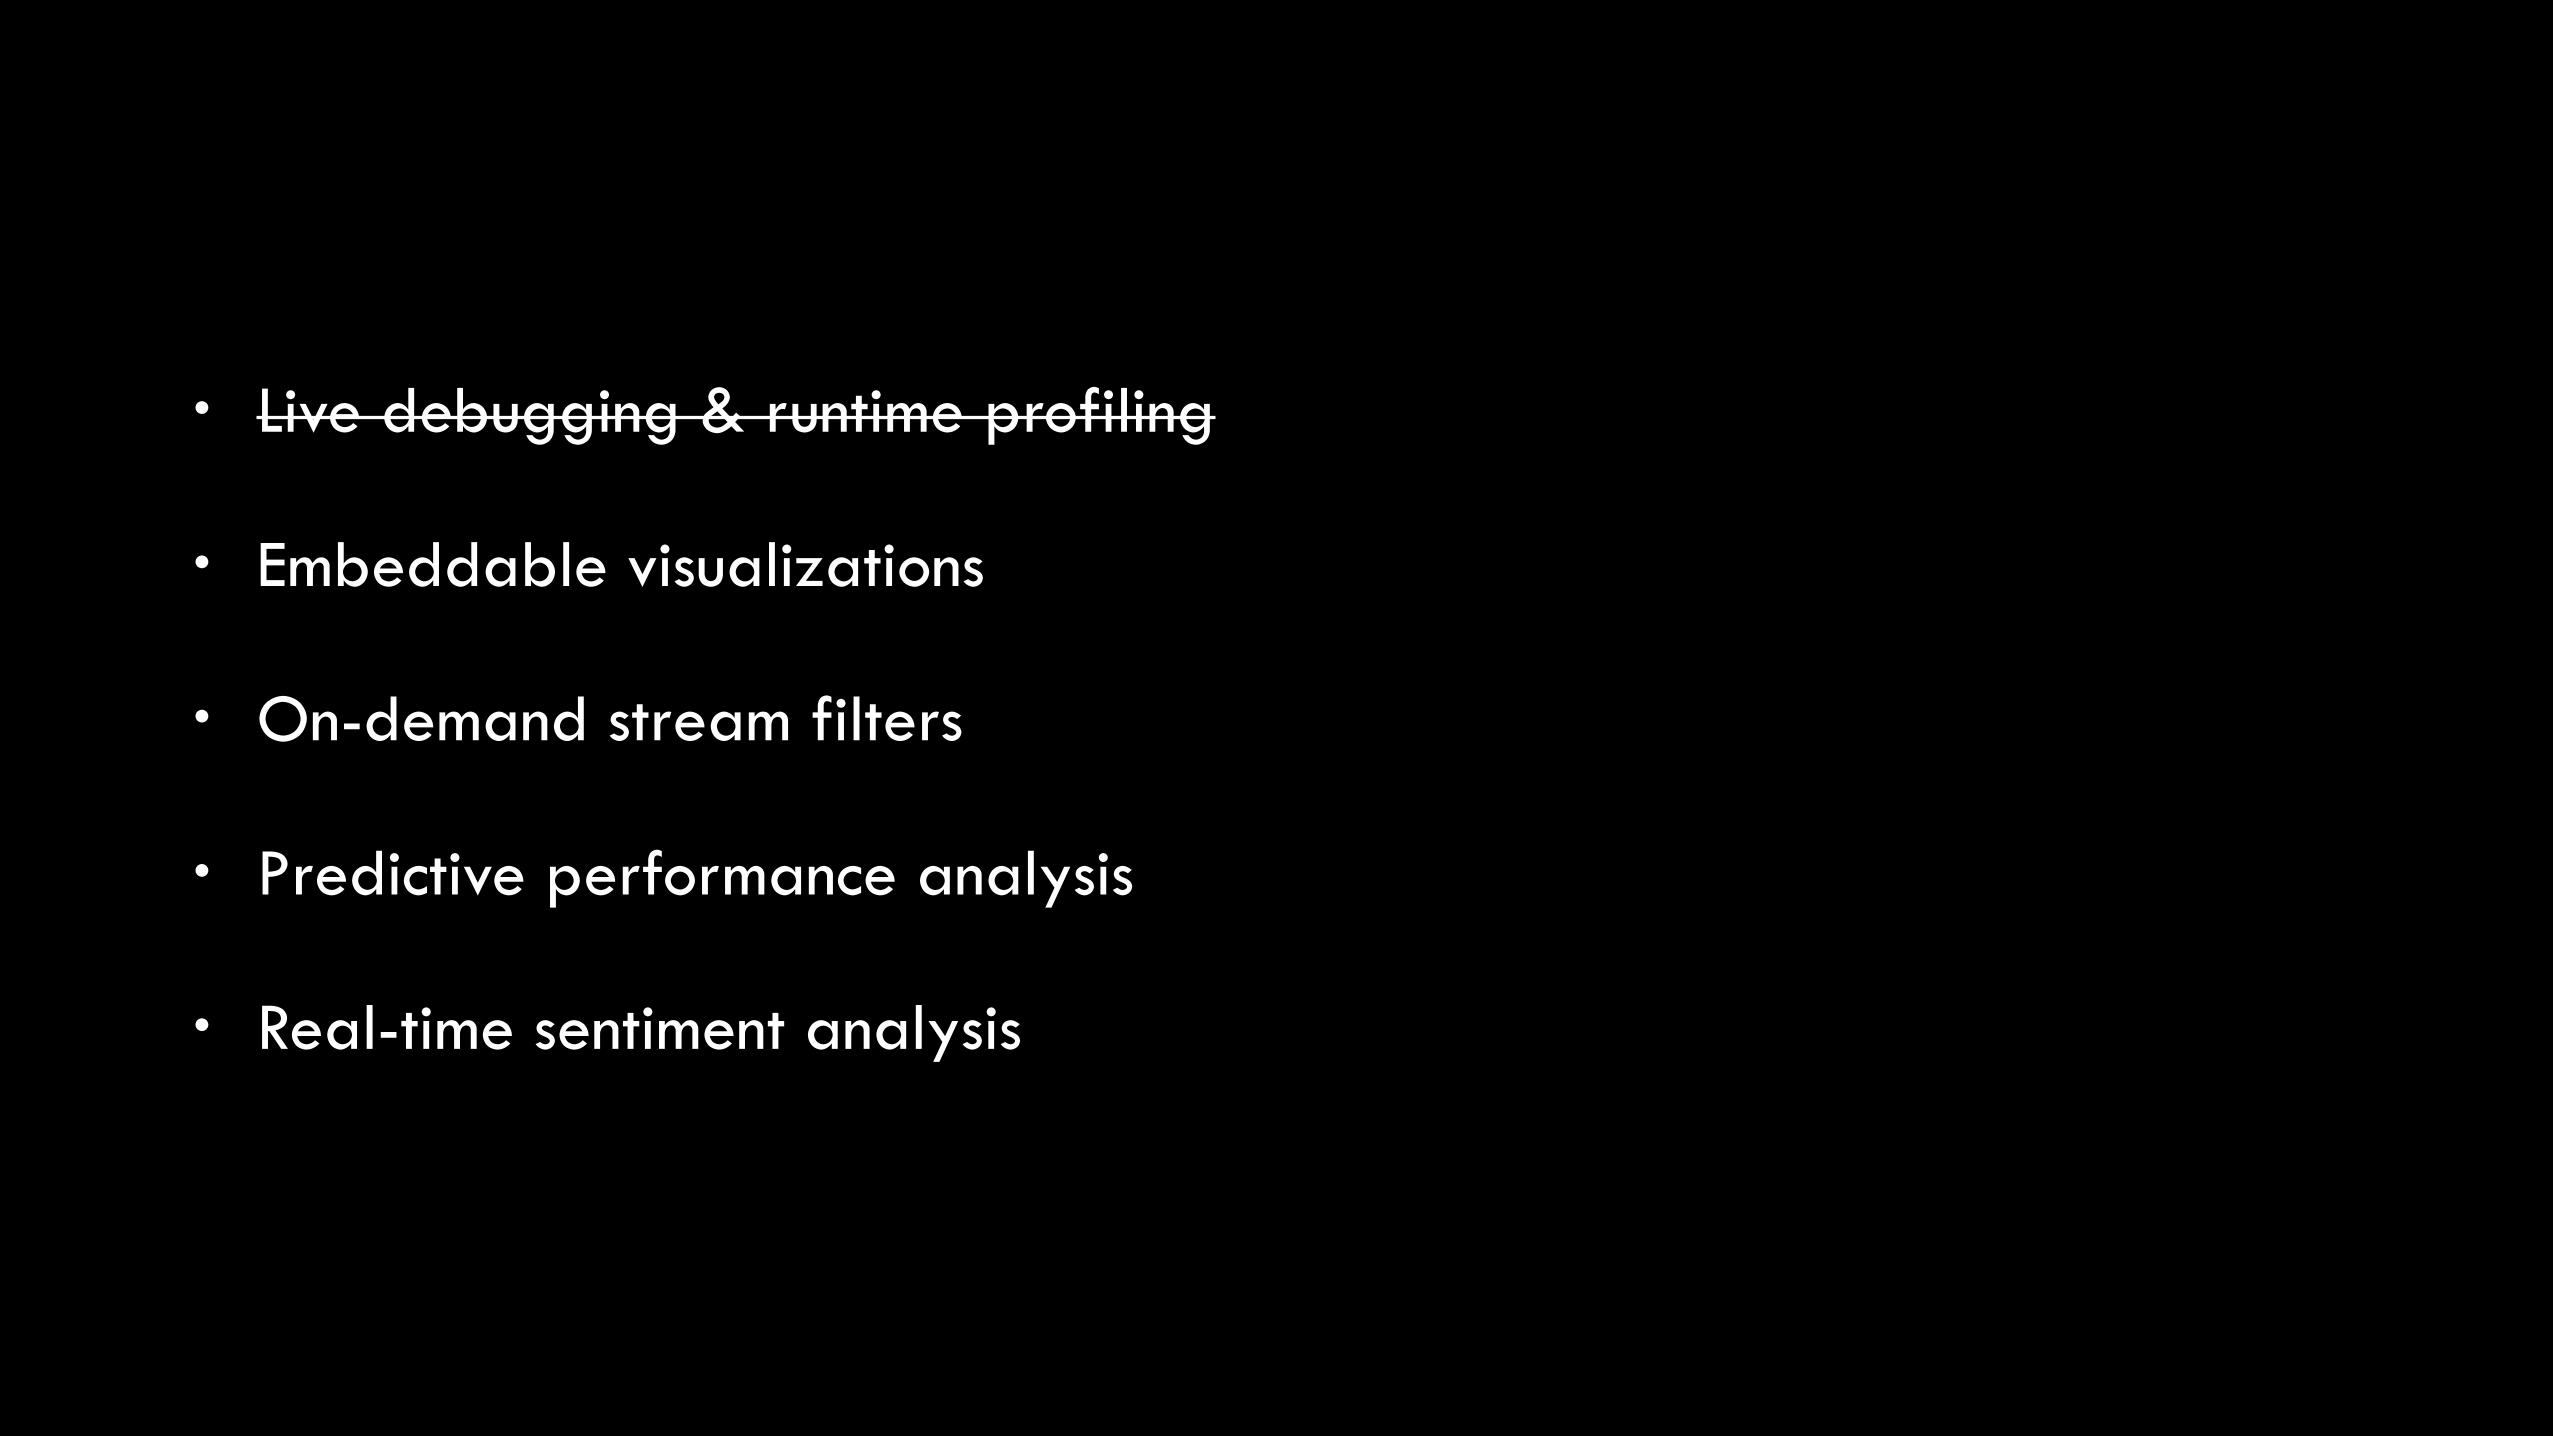
• Live debugging & runtime profiling
• Embeddable visualizations
• On-demand stream filters
• Predictive performance analysis
• Real-time sentiment analysis

???

@ieatkillerbees http://samanthaquinones.com
https://joind.in/13742