drinking water master plan - westfield, indiana watercad model ... drinking water master plan...
TRANSCRIPT
CITY OF WESTFIELD, INDIANA
DRINKING WATER MASTER PLAN
FEBRUARY 2010

CITY OF WESTFIELD, INDIANA
DRINKING WATER MASTER PLAN
FEBRUARY 2010
ARCHITECTS ENGINEERS PLANNERS 111 MONUMENT CIRCLE, SUITE 1200
INDIANAPOLIS, INDIANA 46204 (317) 636-4682
HNTB Job No. 38713-PL-002-119

City of Westfield, Indiana Table of Contents Drinking Water Master Plan i February 2010
TABLE OF CONTENTS Page No. CHAPTER 1 – INTRODUCTION... ................................................................................................................ 1-1 1.1 Background .................................................................................................................................. 1-1 1.2 Purpose and Scope ...................................................................................................................... 1-1 1.3 Study Area 1-2 CHAPTER 2 – METHODOLOGY ................................................................................................................... 2-1 2.1 WaterCAD Model ....................................................................................................................... 2-1 2.1.1 Calibration ..................................................................................................................... 2-1 2.1.2 Scenarios ........................................................................................................................ 2-2 2.2 Assumptions ................................................................................................................................ 2-3 CHAPTER 3 – DEMAND ANALYSIS ............................................................................................................ 3-1 3.1 Population .................................................................................................................................... 3-1 3.2 Demand ........................................................................................................................................ 3-4 CHAPTER 4 - SUPPLY ANALYSIS ................................................................................................................. 4-1 4.1 Evaluation of Supply ................................................................................................................... 4-1 4.1.1 Sources of Supply .......................................................................................................... 4-1 4.1.2 Source Planning for Full Development of the Study Area ................................... 4-3 4.2 Evaluation of Treatment Capacity ........................................................................................... 4-4 4.2.1 River Road Water Treatment Plant .......................................................................... 4-4 4.2.2 Cherry Tree Water Treatment Plant ........................................................................ 4-5 4.2.3 Greyhound Pass Water Treatment Plant ................................................................. 4-5 4.2.4 North Water Treatment Plant ................................................................................... 4-5 4.2.5 Future Treatment Facilities ........................................................................................ 4-6 4.3 Evaluation of Pumping Capacity ............................................................................................. 4-6 4.3.1 Southeast Pressure Zone ............................................................................................. 4-7 4.3.2 Southwest Pressure Zone ............................................................................................ 4-8 4.3.3 North Pressure Zone .................................................................................................... 4-9

City of Westfield, Indiana Table of Contents Drinking Water Master Plan ii February 2010
CHAPTER 5 - DISTRIBUTION SYSTEM ANALYSIS ................................................................................ 5-1 5.1 Background .................................................................................................................................. 5-1 5.2 Fire-Flow Analysis ...................................................................................................................... 5-1 5.3 Evaluation of Storage Capacity ................................................................................................. 5-1 5.4 Distribution System Planning ................................................................................................... 5-5 5.5 Special Projects ............................................................................................................................ 5-5 5.5.1 Proposed River Road WTP/Cherry Tree WTP Interconnection ........................ 5-6 5.5.2 Proposed 30-Inch Water Main from River Road WTP ........................................ 5-6 CHAPTER 6 – SUMMARY OF RECOMMENDATIONS ......................................................................... 6-1 6.1 Supply and Treatment ................................................................................................................ 6-1 6.2 Distribution System .................................................................................................................... 6-1 6.3 Proposed Timeline for Improvements .................................................................................... 6-2
LIST OF FIGURES
Figure No. Description Page No. 1-1 Study Area 1-3 2-1 Pressure Zones 2-4 3-1
Historical Population of Westfield in Hamilton County, Indiana 3-1
3-2 Historical Population of Washington Township in Hamilton County, Indiana
3-2
3-3 Historical Population of Hamilton County, Indiana 3-2 3-4 Projected Land Use Map 3-6 4-1 Existing Drinking Water Infrastructure 4-2 5-1 Maximum Day Diurnal Demand 5-2 5-2 Future Drinking Water Facilities 5-4 5-3 Proposed WTP Interconnection 5-7 5-4 Proposed 30-inch Water Main 5-8 6-1 Assumed Expansion Sequence 6-3

City of Westfield, Indiana Table of Contents Drinking Water Master Plan iii February 2010
LIST OF TABLES
Table No. Description Page No.
3.1 Summary of Historical Population Data 3-3 3.2 Breakdown of Projected System Demand 3-5 4.1 Summary of Raw Water Production 4-3 4.2 Summary of Existing Treatment 4-4 4.3 Summary of Future Treatment 4-6 4.4 Summary of Southeast Zone Pumping 4-7 4.5 Summary of Southwest Zone Pumping 4-8 4.6 Summary of North Zone Pumping 4-9 5.1 Equalization Storage Analysis 5-3 5.2 Summary of System Storage 5-3 5.3 Future System Storage 5-5 5.4 Future Distribution Piping 5-5 6.1 Proposed System Improvements Timeline 6-2
LIST OF APPENDICES
Appendix A Hydrologic Capacity Analysis by Eagon & Associates Appendix B DeWitt Property Well Field Capacity Estimate

City of Westfield, Indiana Introduction Drinking Water Master Plan 1-1 February 2010
CHAPTER 1 INTRODUCTION
1.1 BACKGROUND The City of Westfield is a quickly growing suburban community within Washington Township in Hamilton County, Indiana. As the number of residents and businesses in this community continues to grow, the importance of having a master plan in place for utilities in the area grows as well. Previous master planning efforts have been completed in 2001 and 2003 to help Westfield’s distribution system grow effectively with their population. This report has been created to document the analysis and evaluations performed in the master planning process. The Drinking Water Master Plan evaluates needed improvements to the City of Westfield’s raw water production, water treatment facilities, and finished water distribution system which would allow for potential full buildout of the study area shown in Figure 1-1. The timeframe and the possibility of realizing full development of this study area is difficult to predict since it depends on various demographic and economic factors both locally and regionally. Therefore, instead of a chronological approach, a geographical approach has been taken to evaluate development of this system. 1.2 PURPOSE AND SCOPE The purpose of this master plan is to identify raw water sources, treatment capacity, water main routing, pumping capacity, and storage requirements that would be needed to fully buildout the study area. Since much of the area is undeveloped, the planning analysis included determining water main routes and finished water storage locations, and determining water main and storage tank sizes. The sizing of future infrastructure was determined by utilizing the Equivalent Dwelling Unit (EDU) assignments developed in the Wastewater Master Plan completed in September of 2006. These EDU assignments were developed based on existing land use of developed areas and projected land use in undeveloped areas. The Westfield-Washington Township Comprehensive Plan was used to assign the projected land use for undeveloped areas. These assignments were then used to determine how much capacity would be required if the study area is to fully develop. A portion of the planning area for the City’s drinking water system lies outside of Washington Township, and therefore outside of the scope of the Westfield-Washington Township Comprehensive Plan. This area, which resides within Noblesville Township in Hamilton County, is covered in the City of Noblesville’s Comprehensive Plan. This document was referenced to determine the proposed land use for the distribution system area outside of Washington Township. The number of EDUs per acre was assigned in the same manner as for areas in Washington Township and Noblesville Township. The methodology used in assigning EDUs is described in Chapter 2.
City of Westfield, Indiana Introduction Drinking Water Master Plan 1-2 February 2010
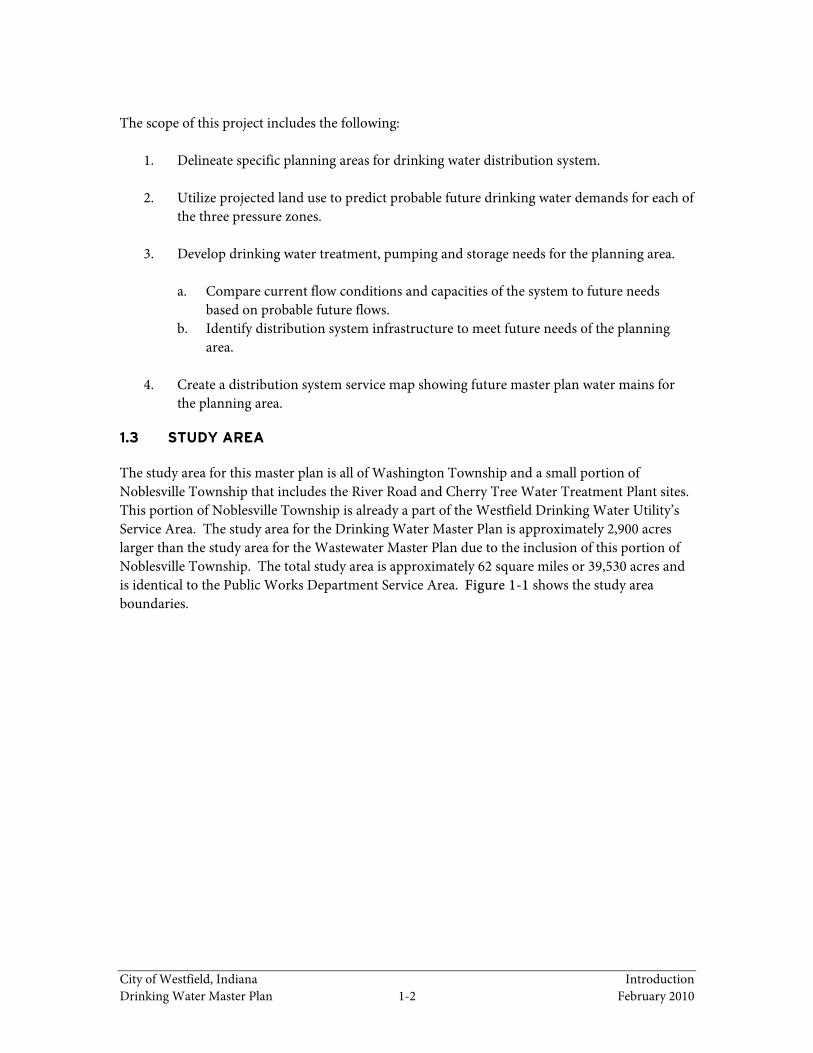
The scope of this project includes the following:
1. Delineate specific planning areas for drinking water distribution system. 2. Utilize projected land use to predict probable future drinking water demands for each of
the three pressure zones. 3. Develop drinking water treatment, pumping and storage needs for the planning area.
a. Compare current flow conditions and capacities of the system to future needs
based on probable future flows. b. Identify distribution system infrastructure to meet future needs of the planning
area.
4. Create a distribution system service map showing future master plan water mains for the planning area.
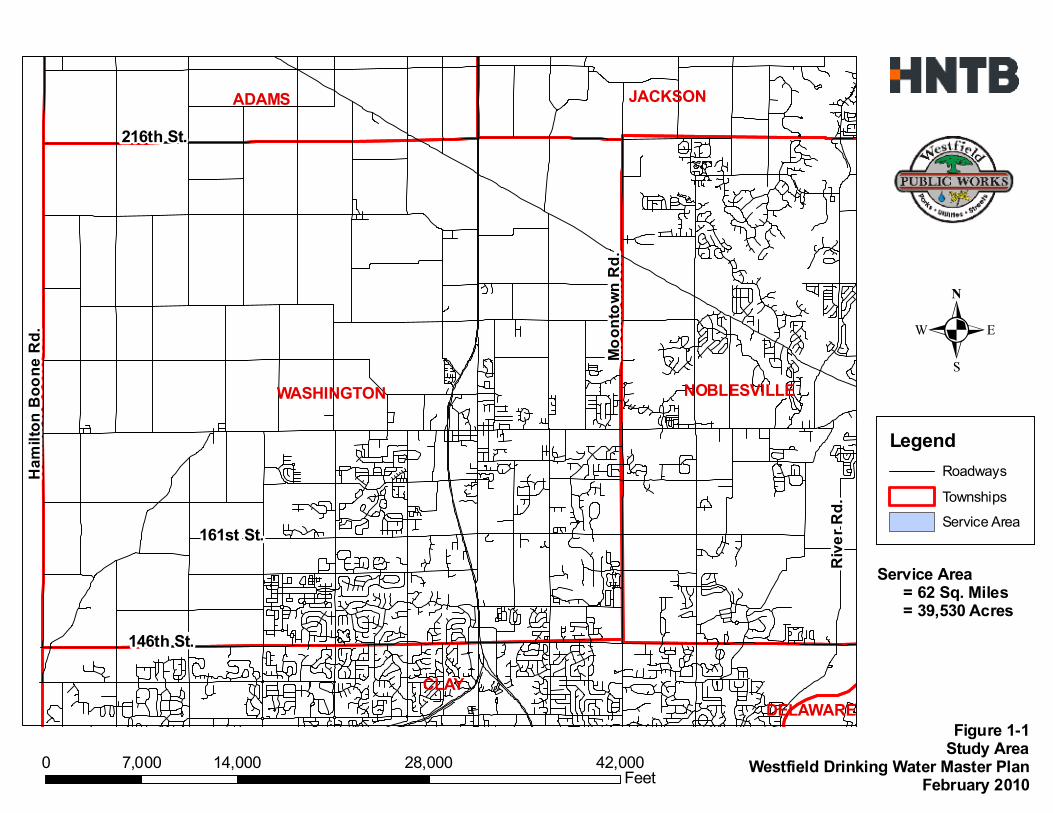
1.3 STUDY AREA The study area for this master plan is all of Washington Township and a small portion of Noblesville Township that includes the River Road and Cherry Tree Water Treatment Plant sites. This portion of Noblesville Township is already a part of the Westfield Drinking Water Utility’s Service Area. The study area for the Drinking Water Master Plan is approximately 2,900 acres larger than the study area for the Wastewater Master Plan due to the inclusion of this portion of Noblesville Township. The total study area is approximately 62 square miles or 39,530 acres and is identical to the Public Works Department Service Area. Figure 1-1 shows the study area boundaries.
WASHINGTON
CLAY
NOBLESVILLE
ADAMS JACKSON
DELAWARE
0 14,000 28,000 42,0007,000 Feet
.Legend
RoadwaysTownshipsService Area
Figure 1-1Study Area
Westfield Drinking Water Master PlanFebruary 2010
Service Area = 62 Sq. Miles = 39,530 Acres
216th St.
Hami
lton B
oone
Rd.
Rive
r Rd.
Moon
town
Rd.
146th St.
161st St.

City of Westfield, Indiana Methodology Drinking Water Master Plan 2-1 February 2010
CHAPTER 2 METHODOLOGY
2.1 WATERCAD MODEL The City of Westfield has an existing hydraulic model which is currently maintained by HNTB. A hydraulic model allows the user to simulate the functioning of the distribution network it models and to study the effect of changes on the network’s operation through changes in user input. Modeling software such as WaterCAD utilizes the laws of conservation of mass and energy to determine pressure and flow distribution throughout the system. The City of Westfield’s hydraulic model was created and has been maintained in the WaterCAD software platform. The City’s distribution network model is periodically updated and evaluated using data from AutoCAD and GIS files which are kept up to date by Westfield staff as water mains and other drinking water infrastructure are installed, replaced, or taken out of service. The model also includes the locations of proposed future mains and elevated tanks which have been planned by master-planning efforts. The locations and sizes of these proposed mains and tanks are evaluated and updated as necessary. 2.1.1 Calibration In order to verify that the system model scenario analyses will provide results that will simulate actual conditions, the model must be calibrated using current field data. The City of Westfield’s Supervisory Control and Data Acquisition (SCADA) system was used to collect field data for this purpose. Data including the system’s tank levels, pump operational conditions, and pressure readings throughout the system were used to calibrate the hydraulic model by comparing measured data to simulated results and making any necessary corrections or modifications to the model input parameters until the model results matched observed field data. Typically, input parameters such as pipe roughness and specific node demand are adjusted in the calibration process. As a first step, head-loss tests were performed on representative mains throughout the system to verify the accuracy of the C-factors used in the model for various pipe materials and ages. The two-hydrant method was used to measure C-factor. In the two-hydrant method, a pipe section is isolated by closing downstream valves and placing pressure gauges on an upstream and a downstream fire hydrant. The pressure at each of the two hydrants is first recorded in the static condition and then a measured flow is released from the downstream end and the change in pressure is recorded at both hydrants. The Hazen-Williams equation can then be used to calculate the C-factor for that specific pipe section and then the C-factors in the hydraulic model are corrected. Once the pipe C-factors had been determined, the second step in the calibration process involved setting the pipe C-factors to those values calculated from the head-loss tests. These values are used not only for the exact mains upon which the tests were performed, but also other mains in the system of similar age and composition within the same pressure zone. As a part of this step,

City of Westfield, Indiana Methodology Drinking Water Master Plan 2-2 February 2010
the operational conditions of the model system were set to match the operational conditions of the calibration data set (i.e., tank levels and plant and booster station flows). The third step in calibrating the hydraulic model involved comparing measured pressures in the distribution system to the pressures at the same locations in the simulated system (the hydraulic model). To make this comparison, a steady-state scenario was analyzed with all of the operational conditions in the simulated system set to match the operational conditions of the pumps, tanks, and valves in the actual system for the period during which the calibration data was taken. When the scenario analysis results are evaluated, adjustments are made to the C-factors and node demands in the areas in which the simulated pressures differ from the measured pressures. Usually, there are several iterations of changes until good agreement is reached between the measured and simulated results. The calibration of the Westfield distribution system was performed using data from the SCADA system including tank levels, plant and booster station flow rates, and pressure measurements. The calibration data used was collected at one specific time during an average weekday to best exemplify the standard behavior of the system. After the final scenario analysis, the simulated pressures are compared to the measured pressures from the calibration data set to determine the fitness of the simulated to measured results and hence the accuracy of the calibration. When the Westfield distribution system model was calibrated, there were nine locations at which the simulated and measured pressures were compared. Of these nine locations, all but one was found to be accurate to within six percent of the measured values. The one higher value resulted from a pressure taken at the 161st Booster Station where it pumps into the North Pressure Zone. This node’s simulated pressure matched the measured pressure with 11.3-percent accuracy. 2.1.2 Scenarios Several scenarios have been designed to assist in the analysis of existing and future system components. The scenarios described below will be used to evaluate the correct sizing and proper operation of existing system components and to evaluate the needed sizes for future system components. Each scenario that has been developed for Westfield’s distribution system is designed for a specific purpose. A total of five scenarios have been developed. The first scenario is based on the current condition of the system including the current average demand of the system, the physical condition of the system components, and the operations currently in effect. This scenario includes only the infrastructure currently installed. This scenario was developed as a base scenario from which the other scenarios are developed. The base scenario, called the 2008 Average Day Scenario, is used when calibrating the model. Second, the 2008 Maximum Day Scenario was developed using a global multiplying factor to increase the demand across the system from the average day to the maximum day demand. This scenario is developed in order to evaluate the functioning of the distribution system in its current condition during a maximum-demand day and to determine if there are any signs of system stress which might denote undersized or deteriorated components within the distribution system.

City of Westfield, Indiana Methodology Drinking Water Master Plan 2-3 February 2010
System stress is demonstrated by the following: 1) pressure less than 35 psi; 2) pipe velocity greater than 10 ft/sec; and 3) head loss greater than 10 ft/1,000 ft. A third scenario was developed in order to run a fire-flow analysis to determine the current availability of fire flow to each node in the system. This scenario is identical to the 2008 Maximum Day Scenario except that when the calculation is run, the model calculates the available fire flow at each node while maintaining residual pressure of 20 psi at the node being tested and in the rest of the system. The 20 psi lower limit on system pressure is a requirement of the Ten States Recommended Standards for Water Works suggested by IDEM as a basis for design of water supply systems in Indiana. The fire-flow analysis was performed using the 2008 Maximum Day Scenario because the occurrence of a fire during a high-demand day is considered to be the worst-case scenario for the system. For the full buildout of the system two additional scenarios were developed. The physical conditions of these scenarios were developed using the future piping layouts from past master-planning efforts which followed major roadways throughout Washington Township. The system demand was then developed as described in Chapter 3 for the fourth scenario, called the Ultimate Buildout Average Day Scenario, which has a projected demand of 22.14 million gallons per day (MGD). The fifth scenario, the Ultimate Buildout Maximum Day Scenario was developed by using a global multiplying factor (equivalent to the system-peaking factor discussed in Chapter 3) to increase the demand across the system to the maximum-day demand of 33.23 MGD for the full buildout condition. These two final scenarios were used to develop and examine the future proposed components of the system at the buildout condition. 2.2 ASSUMPTIONS This section summarizes the assumptions that were made for the master plan. Pressure Zones
Current pressure zone divisions are due mostly to the combination of the Hamilton Western Utilities distribution system and the Westfield distribution system. The Hamilton Western Utilities system, acquired in 2002, was bounded by 161st Street and 146th Street to the north and south, respectively, and consisted of two pressure zones, now the Southwest and Southeast pressure zones. The Westfield system was bounded to the south by 161st Street and consisted mostly of what is now considered the Northern pressure zone. Existing pressure-zone boundaries were extrapolated outward, toward the Washington Township boundaries, to create the ultimate buildout pressure-zone delineations shown in Figure 2-1. The Northern pressure zone is delineated by the extents of Washington Township to the north, west and east, and approximately by 161st Street to the south. The Southeast and Southwest pressure zones are delineated by approximately 161st Street and 166th Street to the north and by the Washington Township boundary to the south.

0 8,000 16,000 24,0004,000 Feet
.Legend
RoadwaysPressure Zones
NorthernSoutheastSouthwest
Figure 2-1Pressure Zones
Westfield Drinking Water Master PlanFebruary 2010
US 31
SR 32
SR 38
161st St.
146th St.
216th St.
166th St.

City of Westfield, Indiana Methodology Drinking Water Master Plan 2-5 February 2010
Equivalent Dwelling Units (EDUs)
The EDUs assigned to each area are net EDUs (meaning that roads and green space are not included). Gross EDUs (including roads and green space) were utilized for the main EDU assumption. For instance, if the undeveloped land was to be single-family homes, it was assigned a gross EDU of 3.0 EDUs per acre. However, the actual EDU assignment for that land was calculated based upon 3.0 gross EDUs per acre multiplied by 85 percent (assume that 15 percent will be used for roads), which computes to 2.6 net EDUs per acre.
All land was considered to be developable. Therefore, the factor of 20-percent undevelopable that has been utilized in previous master plans was not utilized.
A development class was determined for each area. The development classes included: D=developed; A=assumed development (future part of a subdivision, for instance); ES=existing served; EN=existing non-served; U=undeveloped.
For development class D, the following assumptions were made:
The parcels were counted to determine the number of houses within the development. This parcel count is equal to the EDUs assigned to the development.
For development class A, the following assumptions were made: If a Planned Urban Development (PUD) exists for the planned development, then the
PUD was utilized to determine the number of EDUs to assign to the development. If the subdivision is partially developed, then the part that is parceled was assigned
development class D, and the un-parceled portion was assigned development class A. The PUD was utilized to determine the number of EDUs remaining for the un-parceled portion.
For development class ES or EN, the following assumptions were made: If the ES/EN parcel was a residential parcel, then the EDUs were determined by the
land use (one EDU if a single family home, 7.0 gross EDUs per acre if apartments). If the ES/EN parcel was a commercial parcel, then the EDUs were assumed to be 3.0
gross EDUs per acre. If the ES/EN parcel was a church or a school, then the EDUs were based upon the
water usage, 10-month average. The water usage data were provided by the Westfield Public Works Department.
If the ES/EN parcel was thought to be currently served, then it was assigned development class ES. If it was thought to not be served currently, then it was assigned development class EN.
For development class U, the following assumptions were made. If the parcel was in a projected residential area, then the following residential land
uses were utilized. The boundaries listed here are general guidelines. East of Towne Road/Centennial Road – 3.0 gross EDUs per acre

City of Westfield, Indiana Methodology Drinking Water Master Plan 2-6 February 2010
West of Towne Road/Centennial Road and south of 186th Street – 2.5 gross EDUs per acre
West of Towne Road/Centennial Road and north of 186th Street – 1.5 gross EDUs per acre. This lower land use was utilized to reflect the fact that this section of the study area is remote from the City center and will likely keep its rural nature.
If the parcel was in the commercial area, then the land use was assumed to be 3.0 gross EDUs per acre.
If the parcel was in the employment area, then the land use was assumed to be 1.5 gross EDUs per acre.

City of Westfield, Indiana Demand Analysis Drinking Water Master Plan 3-1 February 2010
CHAPTER 3 DEMAND ANALYSIS
3.1 POPULATION One of the ways to evaluate whether or not the expectation of future increase in finished water demand is practical is by looking at population trends in the area. The community of Westfield has experienced steady population growth since approximately the 1940s as illustrated in the Census data shown in Figure 3-1. This growth is comparable to both Washington Township and Hamilton County in which it resides (see Figures 3-2 and 3-3). The most marked growth has occurred most recently as shown by the 230-percent increase in population between the 2000 Census and the most recent population estimate in 2008, which estimated 21,171 residents in Westfield, Indiana. More recent growth has been due in part to the annexation of southern portions of Washington Township as well as rapid population growth in Westfield’s established neighborhoods. On January 1, 2008 the Town of Westfield was incorporated and is now the City of Westfield, Indiana. All decennial Census data reference in this report has been procured from the U.S. Census bureau web site: http://www.census.gov.
Figure 3-1
HISTORICAL POPULATION OF WESTFIELD IN HAMILTON COUNTY, INDIANA
0
1,000
2,000
3,000
4,000
5,000
6,000
7,000
8,000
9,000
10,000
1890 1900 1910 1920 1930 1940 1950 1960 1970 1980 1990 2000 2010
Num
ber
of P
erso
ns
Time

City of Westfield, Indiana Demand Analysis Drinking Water Master Plan 3-2 February 2010
Figure 3-2
HISTORICAL POPULATION OF WASHINGTON TOWNSHIP IN HAMILTON COUNTY, INDIANA
Figure 3-3
HISTORICAL POPULATION OF HAMILTON COUNTY, INDIANA
0
2,000
4,000
6,000
8,000
10,000
12,000
14,000
16,000
18,000
20,000
1890 1900 1910 1920 1930 1940 1950 1960 1970 1980 1990 2000 2010
Num
ber
of P
erso
ns
Time
0
20,000
40,000
60,000
80,000
100,000
120,000
140,000
160,000
180,000
200,000
1890 1900 1910 1920 1930 1940 1950 1960 1970 1980 1990 2000 2010
Num
ber
of P
erso
ns
Time

City of Westfield, Indiana Demand Analysis Drinking Water Master Plan 3-3 February 2010
Decennial Census data, as well as more recent yearly estimates of the population of Westfield, Washington Township, and Hamilton County, Indiana have been included in Table 3.1 to illustrate the continued growth occurring in the City of Westfield and the surrounding area since the last Census in 2000. As shown in this table, the percentage of Washington Township residents living in Westfield has increased steadily, from approximately 26 percent in 1940, to 51 percent in 2000, and an estimated 64 percent according to the most recent population estimate in 2008.
Table 3.1 SUMMARY OF HISTORICAL POPULATION DATA
Year Hamilton County
Washington Township
Westfield
1900 29,914 3,696 670
1910 27,026 3,402 700
1920 24,222 2,874 574
1930 23,444 2,706 688
1940 24,614 2,714 709
1950 28,491 3,032 849
1960 40,132 3,651 1,217
1970 54,532 4,789 1,837
1980 82,027 7,425 2,783
1990 108,936 9,272 3,304
2000 182,740 18,358 9,293
2001* 196,259 20,217 15,793
2002* 207,733 22,237 16,477
2003* 219,631 24,206 17,107
2004* 231,568 26,396 17,886
2005* 241,796 28,330 18,564
2006* 251,611 29,805 19,134
2007* 260,804 31,079 19,980
2008* 269,785 32,948 21,171 *Yearly estimates have been obtained from STATS Indiana, the information utility for the State of Indiana which is maintained by the Indiana Business Research Center at Indiana University’s Kelley School of Business.
City of Westfield, Indiana Demand Analysis Drinking Water Master Plan 3-4 February 2010
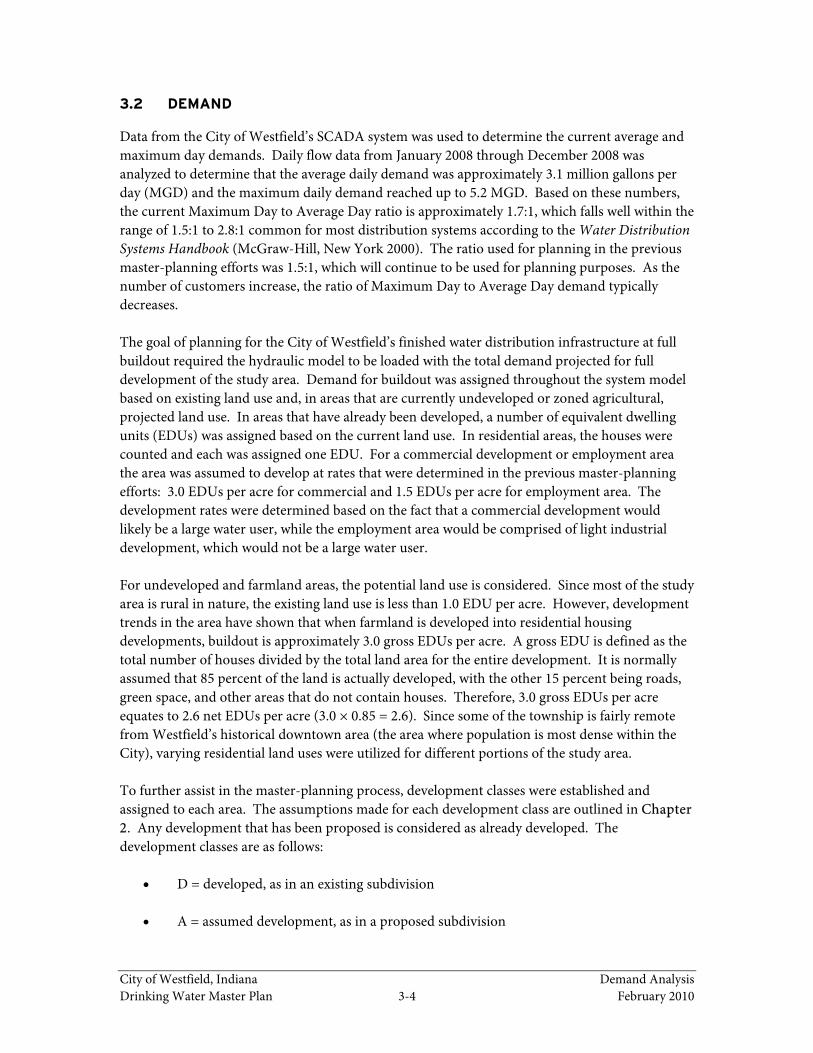
3.2 DEMAND Data from the City of Westfield’s SCADA system was used to determine the current average and maximum day demands. Daily flow data from January 2008 through December 2008 was analyzed to determine that the average daily demand was approximately 3.1 million gallons per day (MGD) and the maximum daily demand reached up to 5.2 MGD. Based on these numbers, the current Maximum Day to Average Day ratio is approximately 1.7:1, which falls well within the range of 1.5:1 to 2.8:1 common for most distribution systems according to the Water Distribution Systems Handbook (McGraw-Hill, New York 2000). The ratio used for planning in the previous master-planning efforts was 1.5:1, which will continue to be used for planning purposes. As the number of customers increase, the ratio of Maximum Day to Average Day demand typically decreases. The goal of planning for the City of Westfield’s finished water distribution infrastructure at full buildout required the hydraulic model to be loaded with the total demand projected for full development of the study area. Demand for buildout was assigned throughout the system model based on existing land use and, in areas that are currently undeveloped or zoned agricultural, projected land use. In areas that have already been developed, a number of equivalent dwelling units (EDUs) was assigned based on the current land use. In residential areas, the houses were counted and each was assigned one EDU. For a commercial development or employment area the area was assumed to develop at rates that were determined in the previous master-planning efforts: 3.0 EDUs per acre for commercial and 1.5 EDUs per acre for employment area. The development rates were determined based on the fact that a commercial development would likely be a large water user, while the employment area would be comprised of light industrial development, which would not be a large water user. For undeveloped and farmland areas, the potential land use is considered. Since most of the study area is rural in nature, the existing land use is less than 1.0 EDU per acre. However, development trends in the area have shown that when farmland is developed into residential housing developments, buildout is approximately 3.0 gross EDUs per acre. A gross EDU is defined as the total number of houses divided by the total land area for the entire development. It is normally assumed that 85 percent of the land is actually developed, with the other 15 percent being roads, green space, and other areas that do not contain houses. Therefore, 3.0 gross EDUs per acre equates to 2.6 net EDUs per acre (3.0 × 0.85 = 2.6). Since some of the township is fairly remote from Westfield’s historical downtown area (the area where population is most dense within the City), varying residential land uses were utilized for different portions of the study area. To further assist in the master-planning process, development classes were established and assigned to each area. The assumptions made for each development class are outlined in Chapter 2. Any development that has been proposed is considered as already developed. The development classes are as follows:
D = developed, as in an existing subdivision A = assumed development, as in a proposed subdivision

City of Westfield, Indiana Demand Analysis Drinking Water Master Plan 3-5 February 2010
ES = existing served, as in an existing house/business that is connected EN = existing non-served, as in an existing house/business that is not connected
U = undeveloped
To determine the size of future water mains, the fully developed condition for each area was evaluated. The fully developed condition is the condition in which all of the currently undeveloped (or agricultural) area is developed at the land uses shown in Figure 3-4. For each EDU, it is assumed that 310 gallons per day (gpd) is the average demand based on an average of 3.1 persons per household and 100 gpd per capita water usage. Full development of the study area shown in Figure 3-4 would increase the total number of EDUs served to approximately 71,425. This equates to an increased average day demand of approximately 22.2 MGD for the design condition based on 310 gpd per EDU. Given a Maximum Day to Average Day ratio of 1.5:1, the projected maximum daily demand for full buildout of the study area is 33.3 MGD. Table 3.2 shows a breakdown of system demand into each pressure zone.
Table 3.2 BREAKDOWN OF PROJECTED SYSTEM DEMAND
Zone EDUs Average Day
(MGD) Maximum Day
(MGD) Southeast 4,603 1.43 2.15 Southwest 12,578 3.90 5.85
North 54,246 16.81 25.23 TOTAL 71,425 22.14 33.23

0 8,400 16,800 25,2004,200 Feet
.
LegendLand Use
IndustrialCommercialLow Density ResidentialMedium Density ResidentialHigh Density ResidentialMobile Home ParkMultifamily ResidentialTax Exempt Property
Figure 3-4Projected Land Use Map
Westfield Drinking Water Master PlanFebruary 2010
216th Street
146th Street
Hami
lton B
oone
Roa
d
US 31
SR 38
SR 32

City of Westfield, Indiana Supply Analysis Drinking Water Master Plan 4-1 February 2010
CHAPTER 4 SUPPLY ANALYSIS
4.1 EVALUATION OF SUPPLY Raw water supply to the City of Westfield is currently solely supported by groundwater. It is beneficial to the City to continue to take advantage of the groundwater in the area for raw water supply due to the additional facilities, and associated costs, which would be required to treat surface water for potable water use. In order to evaluate the available groundwater in the area to meet the future demands of the Westfield System, Eagon & Associates was contracted to prepare a well field capacity analysis for the River Road area well fields. This analysis has been included as Appendix A of this report. 4.1.1 Sources of Supply
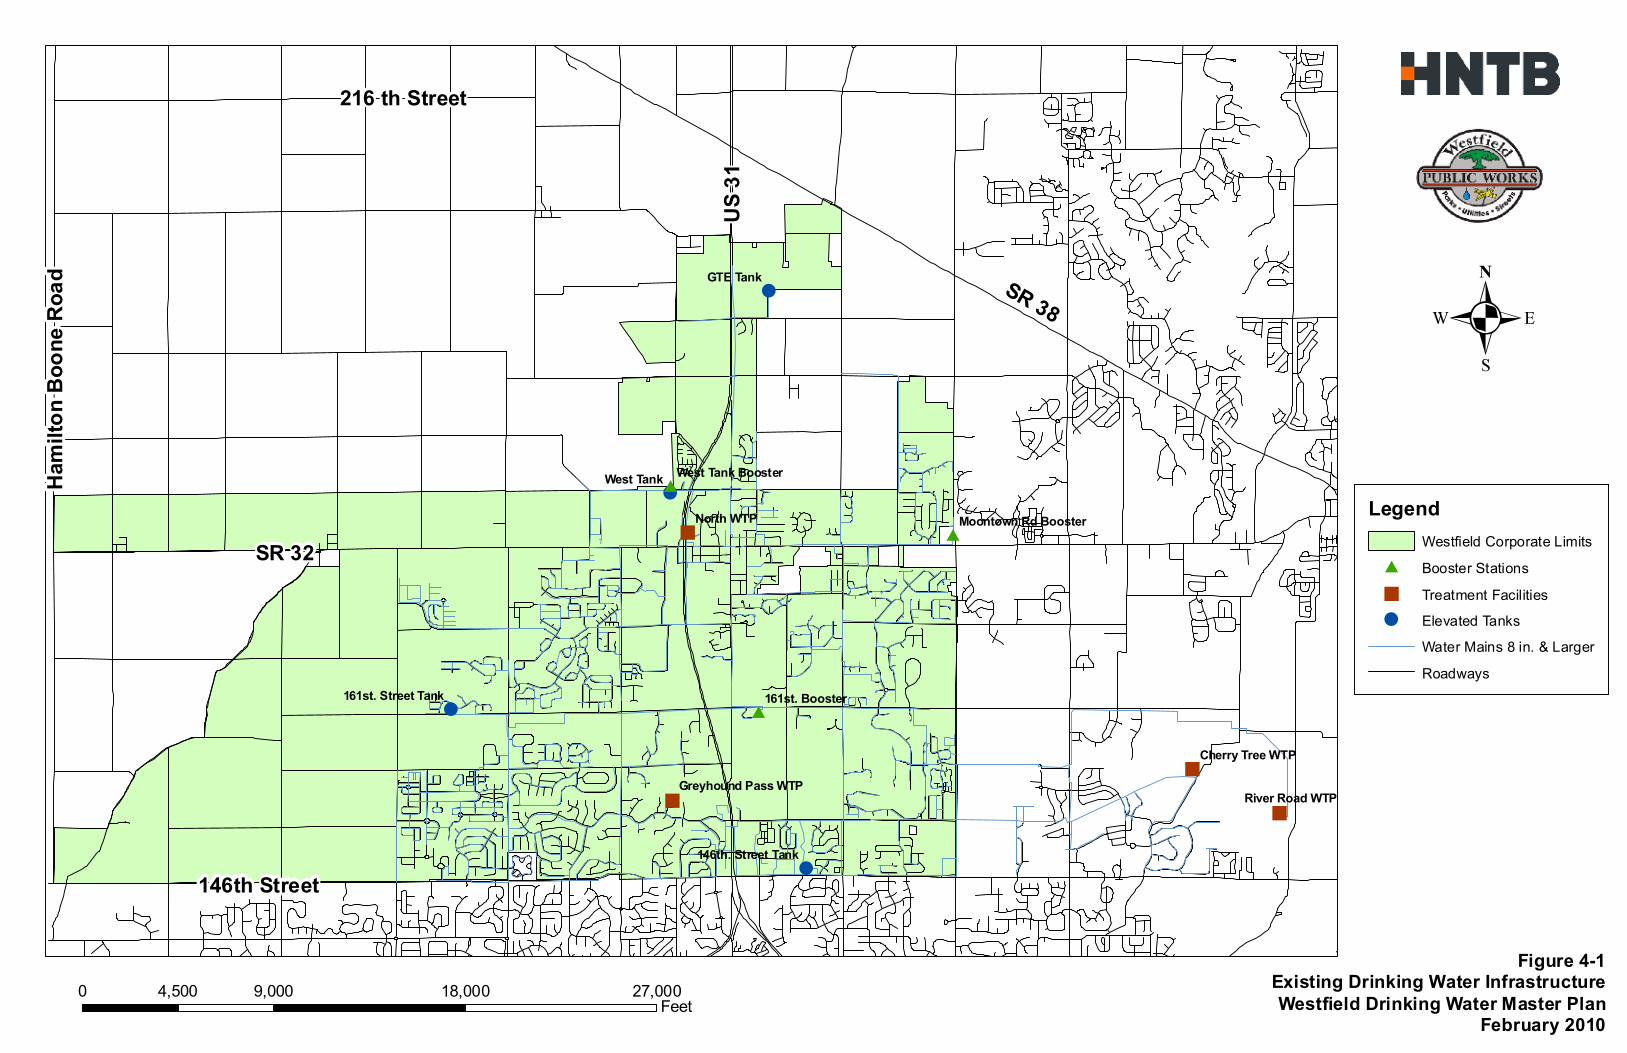
Currently, the City of Westfield draws water from two unconsolidated aquifers: the Tipton Till Plain Aquifer System and the White River and Tributaries Outwash Aquifer System (Eagon & Associates, 2009). Within these two aquifers there are 11 wells from which the City currently pumps raw water for drinking water supply and wholesale. One well is located at the North Treatment Plant site, one is located at the Greyhound Pass Treatment Plant, three are located at the Cherry Tree Well Field at Cherry Tree Avenue and East 160th Street, and six are located along River Road, north of 146th Street, at the River Road and Welcome Well Fields. The raw water mains serving the wells at the Cherry Tree, River Road and Welcome locations are interconnected to provide these facilities with the ability to delegate additional raw water flow to either the Cherry Tree or River Road treatment facilities, or to the Indianapolis Water connection at River Road. Table 4.1 provides a listing of the existing and planned wells within Westfield’s system, and their respective capacities. The North and Greyhound Pass well fields are located on the same site as their respective treatment facilities as shown in Figure 4-1. The Cherry Tree, River Road, Welcome, and Horseshoe (DeWitt) well fields are located in the vicinity of the River Road Treatment Plant as shown on Figure 1 in Appendix A. The combined production capacity of Westfield’s wells is a maximum of approximately 18 million gallons per day (MGD). Five MGD of that raw water capacity is contracted to Indianapolis Water to supplement their raw water supply until 2017. Indianapolis has a 24-inch main running along River Road to which the contracted water is pumped via a combination of vertical turbine pumps at Wells 5, 7, 8, 11, 12 and 13. Plans are currently underway to add another 5 to 6 MGD of raw water production to the existing Westfield system. A new well field is planned for the Horseshoe Property along 160th Street near the west bank of the White River. This site contains several observation wells and one test / production well (Well No. 14). Both a stepped-rate test and a 48-hour pumping test were performed at Well No. 14 in 2009. The Well Field Capacity Estimate prepared by Eagon & Associates is included in this report in Appendix B.
!
!
!
!
"
"
"
"
#
#
#
GTE Tank
West Tank
161st. Street Tank
146th. Street Tank
North WTP
River Road WTP
Cherry Tree WTP
Greyhound Pass WTP
161st. Booster
West Tank Booster
Moontown Rd Booster
0 9,000 18,000 27,0004,500 Feet
.Legend
Westfield Corporate Limits# Booster Stations" Treatment Facilities! Elevated Tanks
Water Mains 8 in. & LargerRoadways
Figure 4-1Existing Drinking Water InfrastructureWestfield Drinking Water Master Plan
February 2010
SR 38
SR 32
US 31
146th Street
Hami
lton B
oone
Roa
d216 th Street

City of Westfield, Indiana Supply Analysis Drinking Water Master Plan 4-3 February 2010
Table 4.1 SUMMARY OF RAW WATER PRODUCTION
Well Field Well ID Sustainable Flow (gpm)
Max Flow (gpm)
North North Well 100 gpm 100 gpm Greyhound Pass Well No. 4 300 gpm 300 gpm
Cherry Tree Well No. 5 1,600 gpm 1,800 gpm Well No. 6 1,320 gpm 1,475 gpm Well No. 7 850 gpm 970 gpm
River Road Well No. 8 2,000 gpm 2,055 gpm Well No. 9 2,100 gpm 2,150 gpm Well No. 10 2,000 gpm 2,000 gpm
Welcome Well No. 11 1,400 gpm 1,400 gpm Well No. 12 700 gpm 700 gpm Well No. 13 700 gpm 700 gpm
Horseshoe Well No. 14* TBD 1,400 gpm Well No. 15* TBD 1,400 gpm Well No. 16* TBD 1,400 gpm
*Wells at the Horseshoe well field (also referred to as the DeWitt Property) have not yet been installed as of the date of this report.
4.1.2 Source Planning for Full Development of the Study Area
The addition of the Horseshoe property wells will add another 5 to 6 MGD to the City’s raw water supply, increasing the total raw water supply to approximately 24 MGD. This will boost raw water supply above the 22.14 MGD projected for the full buildout average day demand of the study area shown in Chapter 1. However, an additional 9 MGD of raw water would be needed to supply the 33.23 MGD projected for the maximum day demand. The aquifer which supplies the wells at the Cherry Tree, River Road, Welcome, and Horseshoe well fields is the White River and Tributaries Outwash Aquifer according to the capacity analysis performed by Eagon & Associates. The analysis indicates that this aquifer is capable of providing the projected maximum day demand under high recharge conditions. The installation of additional wells within this aquifer or the acquisition of existing nearby wells will be required in order to access the available capacity. In addition, one new well on the River Road site, east of the existing Well No. 9, has been proposed and a test boring has been completed to verify that the correction formation exists at this location. The Tipton Till Plain Aquifer System, which supplies the North and Greyhound Pass well fields, has a recharge rate that will most likely not exceed two inches per year and is not likely to provide a reliable source of additional raw water.
City of Westfield, Indiana Supply Analysis Drinking Water Master Plan 4-4 February 2010
4.2 EVALUATION OF TREATMENT CAPACITY Prior to the acquisition of Hamilton Western Utilities (HWU) and its inclusion into the Westfield distribution system, the Westfield system had two water treatment facilities each with its own well or wells: the North Plant and the South Plant. The North Plant is located directly east of US 31 and North of State Road 32, on the site of the Westfield-Washington Schools (see Figure 4-1). The South Plant is no longer in use, but was formerly located on the site of the Westfield Utilities Office on East 171st Street. As a part of the HWU acquisition, three existing treatment plants were added to Westfield’s system: Greyhound Pass, Cherry Tree, and River Road. These plants’ locations are shown on Figure 4-1. All three of these plants are still in operation and have received some upgrades since being brought into the Westfield system. Further discussion of the treatment plants currently in operation has been provided in subsequent sections. A summary of the currently available treatment capacity in Westfield’s system is given in Table 4.2.
Table 4.2 SUMMARY OF EXISTING TREATMENT
Facility ID Treatment Capacity
River Road WTP 7.5 MGDCherry Tree WTP 3.5 MGDGreyhound Pass WTP 0.43 MGDNorth Plant 0.14 MGD
TOTAL 11.57 MGD 4.2.1 River Road Water Treatment Plant The River Road Water Treatment Plant (WTP) is located in the Southeast Pressure Zone and is currently the largest finished water producer in Westfield’s distribution system. The plant is located outside of Washington Township, in neighboring Noblesville Township. This plant is primarily fed by the River Road Well Field which has a maximum capacity of approximately 8.2 MGD, but can draw additional water from the Cherry Tree and Welcome well fields via mains that interconnect them. Treatment at this facility consists of aeration, detention, filtration, chlorination, and fluoride addition. A 500,000-gallon clearwell is also housed at this facility. Recent upgrades to this facility include the addition of a new chlorine building, two 34,500-gallon detention tanks, a new aeration unit, two low-pressure filters, various electrical and instrumentation and controls upgrades, a new security system, and improvements to increase the chlorine and fluoride feed systems capacities to treat as much as 10 MGD at the maximum daily feed rate. The rated capacity of this facility remains at 7.5 MGD due to the limitation of available detention time. Currently, there is a total of 138,000 gallons of tank volume which allows for 26.5 minutes of detention time for 7.5 MGD. For a full 10 MGD, the detention time in these tanks drops to approximately 20 minutes. It can be shown that iron and manganese oxidation reactions are

City of Westfield, Indiana Supply Analysis Drinking Water Master Plan 4-5 February 2010
complete in the 20 minutes of detention time currently available at this facility, but a demonstration of this to the state permitting agency must be completed before the facility can increase its capacity rating to the full 10 MGD. 4.2.2 Cherry Tree Water Treatment Plant The Cherry Tree Treatment Plant provides up to 3.5 MGD of finished water to Westfield’s Southeast Pressure Zone. Treatment at this facility consists of aeration, detention, filtration, and chlorination. Approximately 30,000 gallons of finished water storage is housed at this facility in the underground clearwell which feeds the high-service pumps. A future expansion of this facility could increase treatment capacity to 5 MGD to more closely match the output of the Cherry Tree Well Field. Expansion of the distributive pumping capabilities at this site would not be necessary since capacity already exceeds 5 MGD. Facilities requiring expansion are the aeration, detention, filtration, and chemical feed. In addition, a 300,000-gallon clearwell is being considered at the site of the treatment plant. 4.2.3 Greyhound Pass Water Treatment Plant The Greyhound Pass Treatment Plant provides finished water to the Southwest Zone and has a treatment capacity of approximately 330 gallons per minute (gpm). Treatment at this facility consists of chlorination as well as aeration, detention, and filtration which is implemented via a packaged treatment plant called a Unilator. Typical production from this plant is usually around 300 gpm due to the limited production of the onsite wells. Finished water storage is also housed at this facility in the form of two ground-level reservoirs, one 150,000-gallon reservoir and one more recently constructed 300,000-gallon reservoir which was installed in 2007. A unique feature of this treatment facility is that the finished water reservoirs are fed both from the treatment plant and from the adjacent Southeast Pressure Zone. Finished water from the Southeast Pressure Zone is fed to the reservoirs via a 4-inch main located directly to the east of the plant. This main was installed in 2006 to provide additional finished water capacity to the Southwest Pressure Zone. There are no plans for expansion of this facility. 4.2.4 North Water Treatment Plant The North Water Treatment Plant is the only treatment facility currently providing finished water directly to Westfield’s North Pressure Zone. This plant originally used pressure filter treatment technology and has the capacity to treat and pump more water than the onsite well can supply. The maximum amount of finished water that can be provided by this facility is therefore approximately 330 gpm; however, this facility typically produces around 140,000 gpd (0.14 MGD). The last major rehabilitation of this facility was completed in 2005 when a Unilator was added to the treatment train to replace the original pressure filter. There are no plans for expansion of this facility.

City of Westfield, Indiana Supply Analysis Drinking Water Master Plan 4-6 February 2010
4.2.5 Future Treatment Facilities Ultimately, the projected maximum day demand for full buildout of the study area would require a maximum of 33.23 MGD of treatment capacity within the Westfield System. There is currently 11.57 MGD of treatment capacity in the system from the four treatment plants described above. Since the current maximum day demand reaches approximately 5.1 MGD, there is still room for the distribution system to grow without the construction of additional treatment facilities. One example of the amount of growth that would be possible with the existing capacity of the system would be the following scenario: 100-percent buildout of the Southeast Pressure Zone, 100-percent buildout of the Southwest Pressure Zone, and 15-percent buildout of the North Pressure Zone. These zones are currently built out to 47 percent, 17 percent and 4 percent, respectively, with the majority of development occurring in the Southwest and Southeast Pressure Zones. In order to reach the capacity projected for full buildout of the study area, additional treatment facilities are required. To add capacity, the River Road and Cherry Tree treatment plants can be expanded to reach their full buildout capacities of 10 MGD and 5 MGD, respectively. The total available treatment capacity within the distribution system would increase to 15.57 MGD (or 47 percent of full buildout) after the expansion of these facilities. The proposed future treatment facilities for expanding system treatment capacity to 33.23 MGD are both located in the Southeast Pressure Zone due to the availability of raw water in the area. One new facility would consist of a second 10.0 MGD treatment plant at the River Road site. This new facility would be nearly identical to the existing River Road WTP with aeration, detention, filtration and chemical addition including chlorine and fluoride. The other proposed facility would be located at the Horseshoe property. This property is the site of the new wells proposed for installation in 2010; Well No. 14, Well No. 15, and Well No. 16. Projected capacity for this site is currently around 6 MGD, but an additional amount of raw water could be diverted from nearby well fields by connecting the raw water mains between existing wells in the area. Table 4.3 gives a summary of the treatment facilities that would be in operation at full buildout.
Table 4.3 SUMMARY OF FUTURE TREATMENT
Facility ID Maximum Treatment Capacity
River Road WTP No. 1 10.0 MGDRiver Road WTP No. 2* 10.0 MGDCherry Tree WTP 5.0 MGDGreyhound Pass WTP 0.43 MGDNorth Plant 0.14 MGDHorseshoe WTP* 8.0 MGD
TOTAL 33.57 MGD*Future treatment facilities
4.3 EVALUATION OF PUMPING CAPACITY According to Ten States Standards, pumping facilities should be designed to provide a sufficient amount of finished water to the distribution system during the system’s maximum day demand

City of Westfield, Indiana Supply Analysis Drinking Water Master Plan 4-7 February 2010
with the largest pump out of service. This assessment of the pumping capacity with the largest pump taken out is also called firm capacity. In the City of Westfield, finished water is pumped into the distribution system by way of the four existing treatment plants discussed above and supplemented through two booster stations: the 161st Street Booster Station and the West Tank Booster Station. Firm capacity for this system has been evaluated for each pressure zone in the subsequent sections. One unique feature in this system that should be mentioned is the operational flexibility of the 161st Street Booster Station. This booster station has three pumps, one of which can be used to pump water to either the North Pressure Zone or the Southwest Pressure Zone, depending on demand. The pump can be switched between pressure zones by changing the configuration of opened and closed valves at the station. These valves are manually operated and therefore require the presence of Westfield staff to make the switch. Each of the other two pumps at the station are dedicated, one to the North Pressure Zone and one to the Southwest Pressure Zone. The Westfield distribution system’s pumping facilities are summarized in Tables 4.4, 4.5 and 4.6 for each pressure zone. 4.3.1 Southeast Pressure Zone Any finished water that is required in the Southwest and North Pressures Zones but not produced in them is currently produced in the Southeast Pressure Zone and then pumped into the others. Currently as much as 18.8 MGD (15.8 MGD firm capacity) can be pumped into the Southeast Zone directly from the Cherry Tree and River Road water treatment plants if that amount of supply and treatment were available.
Table 4.4 SUMMARY OF SOUTHEAST ZONE PUMPING
Facility ID Pump ID Design Flow Design TDH
River Road WTP
HSP No. 4 2,100 gpm (3.0 MGD) 366 feet HSP No. 5 2,100 gpm (3.0 MGD) 366 feet HSP No. 6 2,100 gpm (3.0 MGD) 347 feet HSP No. 7 2,100 gpm (3.0 MGD) 366 feet
Cherry Tree WTP HSP No. 1 1,700 gpm (2.4 MGD) 242 feet HSP No. 2 1,700 gpm (2.4 MGD) 242 feet HSP No. 3 1,400 gpm (2.0 MGD) 242 feet
Total Capacity 18.8 MGDFirm Capacity 15.8 MGD
The future average day demand of the Southeast Zone is 1.43 MGD, and the future maximum day demand is 2.15 MGD. Therefore, this zone does not currently have need for additional pumping facilities to meets its own customer demands for the projected future demand condition. However, increasing the pumping and treatment capacity of the River Road WTP, the Cherry Tree WTP, or both, will be a part of the solution to increasing the capacity available to the Southwest and North pressure zones provided that additional booster facilities are constructed to feed those zones.

City of Westfield, Indiana Supply Analysis Drinking Water Master Plan 4-8 February 2010
4.3.2 Southwest Pressure Zone The Southwest Zone is currently served by the Greyhound Pass WTP and the 161st Street Booster Station. Table 4.5 summarizes the pumps currently in use at these two facilities. The Greyhound Pass WTP has one well that produces approximately 300 gpm; however, this facility also serves as a booster station. In 2006, a 4-inch line was installed to connect the Southeast Zone to the Greyhound Pass finished water reservoir. This new connection allows finished water from the Southeast Zone to fill Reservoir No. 1 which can then be pumped into the Southwest Zone via the WTP’s high-service pumps. A second reservoir (Reservoir No. 2) was added in 2007 to increase the storage capacity of this facility from 150,000 gallons to 450,000 gallons.
Table 4.5 SUMMARY OF SOUTHWEST ZONE PUMPING
Facility ID Pump ID Design Flow Design TDH
Greyhound Pass WTP
HSP No. 1 160 gpm (0.23 MGD) 150 feet HSP No. 2 200 gpm (0.29 MGD) 150 feet HSP No. 3 300 gpm (0.43 MGD) 150 feet
161st Street Booster
Pump No. 1 2,000 gpm (2.9 MGD) 120 feet Pump No. 2* 1,000 gpm (1.4 MGD) 120 feet Total Capacity 5.25 MGDFirm Capacity 2.35 MGD
*Can be used for North or Southwest Pressure Zone. The combination of flow from the 161st Street Booster Station and the Greyhound Pass WTP is capable of providing the 3.9 MGD average day demand projected for full buildout of this pressure zone. However, to meet Ten States Standards requirements, these two facilities must be able to supply the maximum day demand with the largest pump out of service. The firm pumping capacity into this pressure zone is 2.35 MGD. The projected maximum day demand for full buildout in this pressure zone is approximately 5.85 MGD. This future demand will be met via booster facilities designed to supply water to the Southwest Pressure Zone from the Southeast Pressure Zone. The Greyhound Pass facility in conjunction with the 161st Street Booster Station is capable of meeting the projected maximum day demand provided that all flow from the booster station is directed to the Southwest Pressure Zone. This can be achieved by closing the gate valve on the 12-inch line to the North Pressure Zone and opening both of the butterfly valves on the 12-inch discharge header at the station. The 20-inch main, which connects the 161st Street Booster Station to the Southwest Pressure Zone, is capable of conveying the entire projected demand of that zone while staying below a velocity of 6 feet per second (fps). If all of the flow from this existing booster station is redirected to the Southwest Pressure Zone, additional facilities will need to be constructed to convey finished water to the North Pressure Zone.

City of Westfield, Indiana Supply Analysis Drinking Water Master Plan 4-9 February 2010
4.3.3 North Pressure Zone Existing demand in the North Pressure Zone is met via the combination of flows from the North Water Treatment Plant and the 161st Street Booster Station. The North WTP is currently capable of supplying 0.14 MGD and the 161st Street Booster Station has the capability of supplying as much as 2.9 MGD if Pump No. 2 and No. 3 at that station are both set to pump into the North Zone (1.4 MGD if only Pump No. 3 is directed into the North Zone). This pressure zone, because of its size compared to the other two zones, has the most growth potential in terms of both land development and demand. Currently, the North Zone average day demand is less than 2 MGD.
Table 4.6 SUMMARY OF NORTH ZONE PUMPING
Facility ID Pump ID Design Flow Design TDH
North WTP HSP No. 1 300 gpm (0.43 MGD) 168 feet HSP No. 2 300 gpm (0.43 MGD) 160 feet
161st Street Booster
Pump No. 2* 1,000 gpm (1.4 MGD) 120 feet Pump No. 3 1,000 gpm (1.4 MGD) 120 feet Total Capacity 3.66 MGDFirm Capacity 2.26 MGD
*Can be used for North or Southwest Pressure Zone. The full buildout condition for the North Pressure Zone is calculated to have an average day demand of as much as 16.81 MGD with a maximum day demand of 25.23 MGD. Providing for this amount of projected demand will require additional infrastructure to either produce more finished water within the pressure zone, or to increase the amount of finished water being pumped into the zone. Since the Wabash Tributaries Aquifer along the White River in the Southeast Pressure Zone will continue to be the most abundant source of raw water within the service area, according to the Capacity Analysis completed by Eagon & Associates, the construction of additional booster pumping facilities to convey finished water from the Southeast Pressure Zone to the North Pressure Zone is the best option.

City of Westfield, Indiana Distribution System Analysis Drinking Water Master Plan 5-1 February 2010
CHAPTER 5 DISTRIBUTION SYSTEM ANALYSIS
5.1 BACKGROUND
The Westfield Distribution System contains several types of pipe materials including cast iron, cement-asbestos, ductile iron and PVC. Some of the first water mains installed in the system were installed as early as the 1930s. These older mains are generally the smaller mains in this system and cause the most frequent maintenance issues, such as main breaks and pressure problems. -Newer mains, those installed after the 1970s, are in generally good condition and typically cement lined ductile iron or PVC pipe materials. 5.2 FIRE-FLOW ANALYSIS Analysis of the current condition of the City of Westfield’s distribution system revealed favorable results regarding the capability of existing infrastructure to provide needed fire flows. As discussed in Section 2.1.2 a fire-flow analysis was calculated using the 2008 Maximum Day Scenario to determine available fire flow. The results of the analysis indicate that 45 percent of the system nodes have more than 3,000 gallons per minute (gpm) of available fire flow, approximately 72 percent had more than 2,000 gpm available and 99.5 percent had 1,000 gpm or more available fire flow. Only 30 out of a total of approximately 1,500 system nodes had less than 1,000 gpm of available fire flow. Of those 30, all but two small groupings of nodes were limited by the fact that they were fed by 4-inch or smaller mains. The first grouping is the Maple Knoll subdivision off of Spring Mill Road just south of 169th Street in the Southwest Pressure Zone, which is served by 8-inch mains throughout. The other grouping is the Ashfield subdivision off of Moontown Road, just north of SR 32, which is fed by 8-inch mains with courts that are served by 6-inch mains. Both areas have more than 800 gpm of available fire flow at each node, according to the model, and both will have access to a greatly increased amount of fire flow once planned infrastructure is put in place that provides looping back to larger mains in the system. 5.3 EVALUATION OF STORAGE CAPACITY The required storage volume for Westfield’s distribution system was assessed based on the amount necessary for fire storage plus the amount needed to equalize the usage peaks during the maximum day demand. According to the Insurance Services Office (ISO) which rates communities’ ability to suppress fires, the maximum basic fire flow is 3,500 gpm. The American Waterworks Association’s Manual titled ‘Distribution Requirements for Fire Protection’ states that for a modest-sized fire requiring up to 3,500 gpm, the duration is three hours. Thus, the fire storage requirement is calculated to be 3,500 gpm over 3 hours or 0.63 million gallons (MG). The amount of storage needed to provide equalization for diurnal fluctuations during a maximum demand day is called equalization storage. The equalization storage in a system allows the system’s pumps to continue running at constant speed while demands increase above or
City of Westfield, Indiana Distribution System Analysis Drinking Water Master Plan 5-2 February 2010
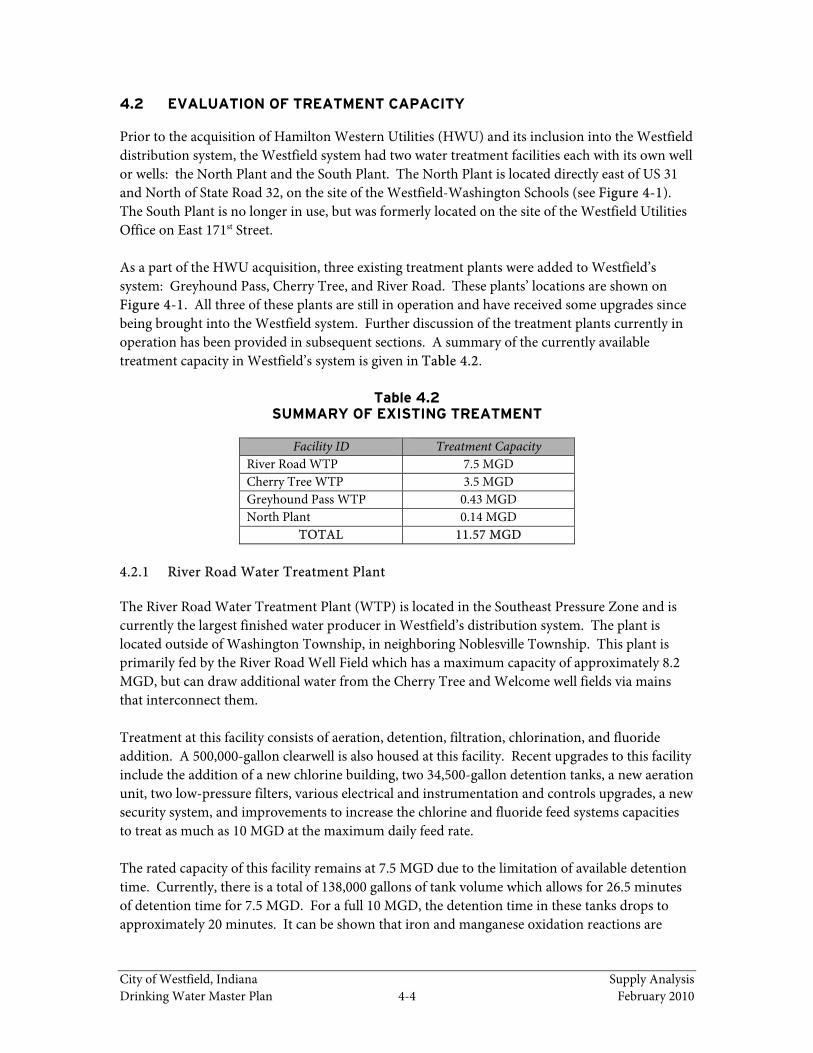
decrease below their design capacities (i.e., without pumps turning on and shutting off as demand fluctuates). This allows tank levels to rise and fall with varying demand instead of pumps turning off when demand drops and turning back on when demand rises. Thus, the peak-hour demand is met via the storage in the system. For this system, equalization storage requirements are evaluated based on the percentage of the total day’s demand that would have been needed to serve the peak-hour demands for several maximum demand days in 2008. The maximum day demand in 2008 was determined to be 5.2 MGD from data collected through the City of Westfield’s SCADA system. Three days in 2008 reached this maximum demand: Thursday, July 17th; Friday, August 22nd; and Sunday, September 28th. Figure 5-1 illustrates the variations in demand experienced by the distribution system during these three days. In this figure the demand for each hour is normalized based on the total demand for that day, so that 1.00 is the average demand flow for that day. In this way we can compare each of the days based on their variation from the average.
Figure 5-1
MAXIMUM DAY DIURNAL DEMAND
-0.20
0.00
0.20
0.40
0.60
0.80
1.00
1.20
1.40
1.60
1.80
0 2 4 6 8 10 12 14 16 18 20 22 24
Dem
and
Mu
ltip
lier
Hour of the Day
7/17/2008 8/22/2008

City of Westfield, Indiana Distribution System Analysis Drinking Water Master Plan 5-3 February 2010
Table 5.1 EQUALIZATION STORAGE ANALYSIS
Day Storage Needed % Equalization
Thurs. 07/17/2008 0.42 MG 13.6 %Fri. 08/22/2008 0.56 MG 18.8 %Sun. 09/28/2008 0.50 MG 9.7 %
Table 5.1 lists the equalization storage that was needed for each of the three days reviewed and the percentage of the total day’s demand. The equalization percentages average out to approximately 14 percent, which fits well within the range of 5 to 15 percent typical for a system using constant speed pumps set to follow demand throughout the day. A somewhat more conservative value of 15 percent has been chosen to evaluate the needed storage capacity. Based on this, the Westfield distribution system’s current condition requires approximately 15 percent of 5.2 MGD, or 0.78 MG of equalization storage. This amount plus the amount of fire storage needed (0.63 MG) gives the City of Westfield’s current storage need: 1.41 MG of finished water. Table 5.2 contains a summary of the system’s existing finished water storage which currently totals approximately 2.6 MG.
Table 5.2 SUMMARY OF SYSTEM STORAGE
Tank ID Pressure Zone Volume Type
146th Street Southeast 500,000 gallons Elevated 161st Street Southwest 500,000 gallons Elevated 181st Street (West) North 300,000 gallons Elevated and BoostedGTE North 300,000 gallons Elevated River Road Clearwell Southeast 500,000 gallons Ground Cherry Tree Clearwell Southeast 30,000 gallons Ground Greyhound Pass Reservoir No. 1 Southwest 150,000 gallons Ground Greyhound Pass Reservoir No. 2 Southwest 300,000 gallons Ground
TOTAL 2.58 MG For the full buildout condition, which we have determined has a projected maximum day demand of 33.23 MGD, the City of Westfield would need to increase its storage capacity to 5.6 MG (0.63 MG for fire, plus 15 percent of 33.23 MGD) to meet equalization and fire storage needs. In order to obtain this amount of storage, additional tanks have been placed in the system hydraulic model; the planned and previously designed 1.0 MG tank at Maple Knoll Subdivision, as well as three 0.75 MG elevated tanks in the locations shown on Figure 5-2: Towne Road, 186th Street, and 206th Street.

!
!
!
!
SR 32
146THUS 31
SR 38
161ST
191ST
186TH
216TH
206TH
GRAY
DITC
H
193RD
OAK
141ST
CARE
Y
166TH
HAGU
E
169TH
RIVE
R
JOLIE
T
TOWN
E196TH
UNIO
N
MULE
BAR
N
HAMI
LTON
BOON
E
HORT
ON HINK
LE
151ST
221ST
LAMO
NG
HAZE
L DEL
L
CHER
RY TR
EE
CASE
Y
SIX P
OINT
S
LITTL
E CH
ICAG
O
CENT
ENNI
AL
181ST
EAST
199TH
GREYHOUND
GRAS
SY BR
ANCH
171ST
156TH
MOON
TOW
N
203RD
ANTH
ONY
TOML
INSO
N
SHEL
BORN
E
SPRI
NGMI
LL
FREE
MONT
MOO
RE
OAK R
IDGE
MILL
CRE
EK
211TH
214TH
SHAD
Y NO
OK
159TH
BANBURY
SCHU
LLEY
160THBAYS
PARK
COX
209TH
MILL
FARM
DUNB
AR
LAKE
VILLE
LIBERTY
OAKM
ONT
EAGL
ETOW
N
VILLAGE
KINSEY
COLUMBINE
ROHR
ER
BRUCE
MIDLAND
PINE HILL
PETE DYE
EAGL
ETW
ON
CHER
RY
BUTTONWOODJ
OAKBAY
ESPRIT
SEMI
NOLE
DADO
SANI
BEL
SENATOR
WYTHE
DAKOTA
PINE RIDGE
JASON
WEST
DART
OWN
JOHN SUE
LITTLE
EAGLE CREEK
FLIP
PINS
KEYSTONE
ROXBURY
EDGE WATER
ADMIRAL
SETTERS REDC
LIFF
EAGL
E CR
EEK
AVIAN
FOX
CAPT
IVA
CATLIN
WHEE
LER
COUNTRYS
IDE
PARK
31
OAK M
ANOR
FLIP
PENS
EDENSHALL
CAMM
ACK
CHERRY CREEK
MILL OAK PATH
WAY
NATASHA
SLY
HADLEIGHSO
UTHP
ARK
PUNTLEDGE
MARALICEGU
NTHE
R
MIA
RICHLAND
CLEAR LAKE
LONG COVE
SAPPHIRE
SPRUCE
SUMMITT
BIRCH
MYERS LAKE
ROWAN
PENN
HOWE
CARRIGAN
BROOKHOLLOW
DRAYTON
FMERRIMAC
KERF
PALMYRAEL
M
OAKV
IEW
TWIN OAKS
CURRY
JENA
BEACON
RAMSEY
BIG C
IRCL
E
WILL
OWVI
EW
ASHBROOK
VIKIN
G LA
IR
BAYLEY
SMITH
FIELD
DUBL
IN
ELMWOOD
DAW
MILL
RUN
DOVER
LINDA
PENNAN
DOVERTON
DORCHESTER
BLUESTONE
FUTC
H
ZEPH
YR
BLADEN
EMERALD PINES
CARL
OW
ADIO
S
CEDAR
BIXBY
CIRCLE
OVERBROOK
MARASCHINO
GLEN
HAW
KS
KAILE
Y
BLADSTONE
HOOVER
IVYBR
IDGE
WHITNEY
WHISTLING
DEER RIDGE
BAYWOOD
ELNORA
MUSTANG CHASE
HAMPTON
PIEDMONT
WEST
ERN
CYCLAMEN
SHINING SPRING
WOODSIDE
BEXL
EY
LIONS
BALD
WIN
ROBINSON
APPOLO
REDBAY
BENTON OAK
MAE
GRAY
LAN
METZKER
CURRANT
MARIE
WININGS
BRIGG
BURLAT
YEOM
AN
MORLEY
SANDBROOK
BRACKNEY
SUGG
INS
NUTTAL
DEERWOOD
LUCAS
PORTMAN
ADARE
BATA
AN
COLFAX
FALLS
TILBU
RY
SABEN
TRACE
ALLISON
CITATION
186TH186THEAGL
ETOW
N
US 31
161ST
156TH
216TH
JOLIE
T211TH
171ST
196TH
211TH
169TH
MILL
CRE
EK
151ST
156TH
SPRI
NGMI
LL
206TH
LITTL
E EAG
LE CR
EEK
HAZEL DELL
MILL
CRE
EK
203RD
ASHBROOK
Maple Knoll Tank (1 MG)
Towne Road Tank (0.75 MG)
186th Street Tank (0.75 MG)
206th Street Tank (0.75 MG)
0 9,000 18,000 27,0004,500 Feet
.
LegendService AreaRoadways
! Future Water TanksFuture Water Mains
12 inch 16 inch30 inch
Figure 5-2Future Drinking Water Facilities
Westfield Drinking Water Master PlanFebruary 2010

City of Westfield, Indiana Distribution System Analysis Drinking Water Master Plan 5-5 February 2010
The current storage capacity of the distribution system is sufficient to serve Westfield until the system’s maximum day demand begins to approach 13 MGD according to the design criteria described above. Table 5.3 illustrates what additional storage infrastructure should be installed at what times in the growth of the system’s maximum day demand. The order in which the three 0.75 MG elevated storage tanks is built will depend on the area of the distribution system that develops first. For instance, as demand nears the 19.7 MGD milestone, if development has continued to spread mostly to the west, the Towne Road Tank would be the next to be installed.
Table 5.3 FUTURE SYSTEM STORAGE
Maximum Day
Demand Reached Infrastructure to Be
Added New Storage Volume
Total 13.0 MGD 1 MG (Maple Knoll) 3.58 MG
19.7 MGD 0.75 MG Tank 4.33 MG
24.7 MGD 0.75 MG Tank 5.08 MG
29.7 MGD 0.75 MG Tank 5.83 MG
5.4 DISTRIBUTION SYSTEM PLANNING Figure 5-2 shows the Westfield distribution system as it is projected for full buildout of the study area. The distribution mains shown can be used as a pattern for the Utilities staff as development occurs in areas not yet served. However, development will most likely occur somewhat randomly and may therefore not initially have the benefits of the looping that is built in to the current full buildout scenario. It is for this reason that each new development should be individually considered, and planned mains that are not yet constructed should be given special consideration. The total amount of new piping needed for the proposed layout of the full buildout distribution system is approximately 590,000 feet. This planned piping network consists of two sizes of distribution piping in the amounts listed in Table 5.4.
Table 5.4 FUTURE DISTRIBUTION PIPING
Pipe Size Length (feet) 16-inch 60,000 12-inch 530,000
5.5 SPECIAL PROJECTS
Several large water main projects have been discussed as projects that would provide improvement to the functioning of the distribution system. Two specific projects will be discussed here: the Proposed River Road Water Treatment Plant (WTP)/Cherry Tree WTP Interconnection; and the Proposed 30-Inch Water Main from River Road.

City of Westfield, Indiana Distribution System Analysis Drinking Water Master Plan 5-6 February 2010
5.5.1 Proposed River Road WTP/Cherry Tree WTP Interconnection
The River Road WTP/Cherry Tree WTP Interconnection project seeks to connect the existing 12-inch main running northeast along Cherry Tree Road to the 24-inch main running west along 160th Street as shown in Figure 5-3. The project involves the installation of approximately 2,600 feet of 12-inch main. The existing 16-inch main connecting the Cherry Tree WTP to the distribution system travels approximately 6,500 feet before connecting into a looped portion of the system. The connection of this 12-inch main would provide a secondary supply / connection point for both the Cherry Tree WTP and the River Road WTP. Currently, the Cherry Tree WTP discharges into a 16-inch main that extends approximately 3,000 feet before connecting to a point in the distribution system that is looped within the system. The 24-inch main connecting the River Road WTP to the distribution system travels for approximately 17,000 feet before connecting into a looped portion of the system. Making the proposed connection would eliminate the reliance on a large portion of the 16- and 24-inch mains as the single point of connection from each plant, allowing water to be provided from both plants during the event of a main break or similar instance at any point west of the interconnect point. In addition, analysis using the WaterCAD model of the distribution system reveals that the high-service pumps at both the Cherry Tree WTP and the River Road WTP will run at more efficient points on their curves as a result of the proposed main.
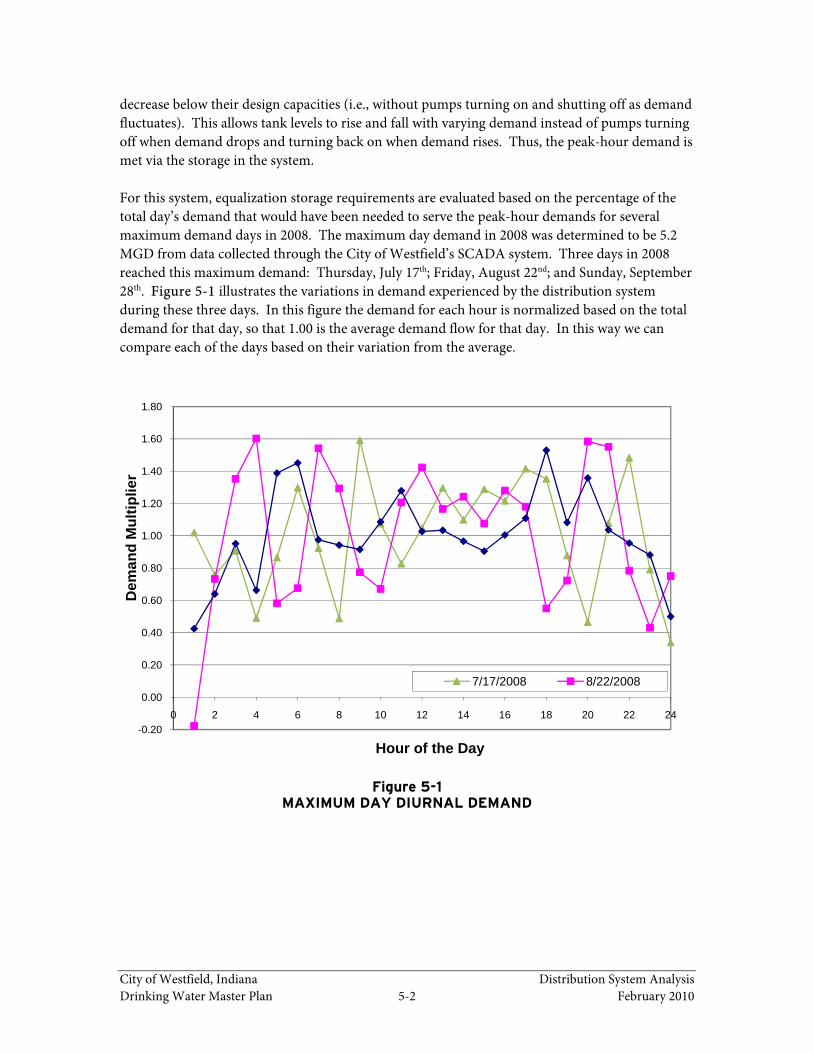
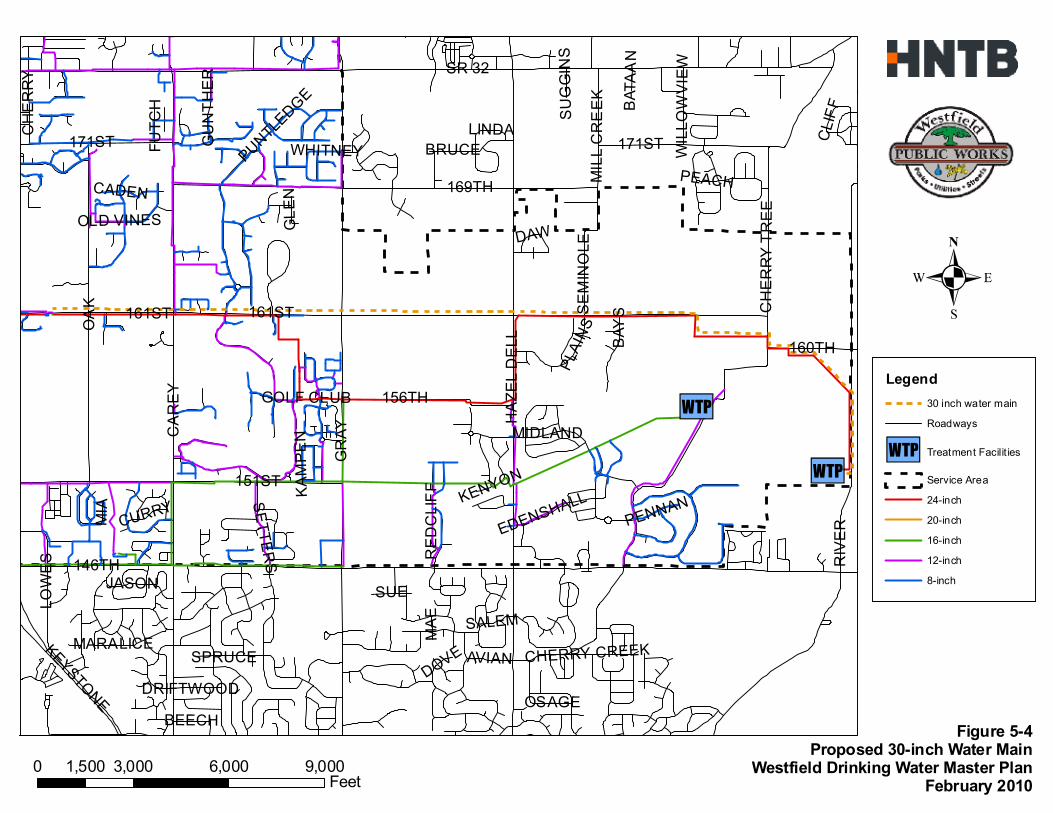
5.5.2 Proposed 30-Inch Water Main from River Road WTP This project is based on the need for additional finished water in the North and Southwest Pressure Zones which are both fed by the 161st Street Booster Station. The new 30-inch main will travel north along River Road from the River Road WTP and then travel west along 161st Street to the 161st Street Booster Station. The necessity for this project will not become a high priority until the overall demand of the system has reached approximately 15 MGD. As flow from the River Road WTP increases, the head that is required to overcome friction losses in the 24-inch main will increase causing the high-service pumps to operate further back on their curves, which will decrease the available output. The addition of this proposed main would reduce the overall friction losses that the River Road high-service pumps must overcome, allowing the pumps to operate farther out on their curves and increasing available output. In addition, the proposed main would provide a secondary connection from the River Road WTP to the distribution system providing redundancy in the case of a main break. This redundancy is especially critical for this facility due to the fact that the River Road WTP provides the majority of the finished water to the Westfield distribution system. This new main will also be essential to the utility’s ability to transport additional flow to the distribution system’s three pressure zones as new treatment facilities are constructed in the area to meet increasing demand.

3Q
3Q
146TH
RIVE
R
161ST
HAZE
L DEL
L
CHER
RY TR
EE
160TH
BAYS
MIDLANDCATLIN
PLAIN
S
EDENSHALL
BRAE
MAR
POLK
156TH RAMSEY
SEMI
NOLE
BOUN
DS
PENNAN
BLADEN
SPAYSIDEKENYON
SALISBURYMERRITT
BLAD
STON
E
KIPPFORD
PORTER
GRAY
LAN
NEWARK
MACDUFF
BURLEIGH
ALNW
ICK
STOUT
0 1,400 2,800 4,200700 Feet
.Legend
3Q Treatment Facilit ies
WTP InterconnectRoadwaysService Area24-inch20-inch16-inch12-inch8-inch
Figure 5-3Proposed WTP Interconnection
Westfield Drinking Water Master PlanFebruary 2010
3Q
3Q
SR 32
146TH
GRAYCA
REY
161STOAK
RIVE
R
169TH
HAZE
L DEL
L151ST
CHER
RY TR
EE
171ST
156TH
KEYSTONE
BAYS
160TH
BRUCE
MIDLAND
AVIAN
CHER
RY
MILL
CRE
EKSE
MINO
LEJASON SUE
SETTERS REDC
LIFF
PLAIN
S
EDENSHALL
GOLF CLUB
CHERRY CREEK
PUNTLEDGE
MARALICE
GUNT
HER
MIA
SPRUCEDOVE
OSAGE
OLD VINES
CURRY
CLIFF
DRIFTWOODWI
LLOW
VIEW
DAW
LINDA
PENNAN
BEECH
FUTC
HCADEN
PEACH
KENYON
GLEN
SALEM
WHITNEY
KAMP
EN
LOWE
S
MAE
SUGG
INS
BATA
AN
161ST
171ST
0 3,000 6,000 9,0001,500 Feet
.Legend
30 inch water mainRoadways
3Q Treatment Facilit ies
Service Area24-inch20-inch16-inch12-inch8-inch
Figure 5-4Proposed 30-inch Water Main
Westfield Drinking Water Master PlanFebruary 2010
City of Westfield, Indiana Summary of Recommendations Drinking Water Master Plan 6-1 February 2010
CHAPTER 6 SUMMARY OF RECOMMENDATIONS
6.1 SUPPLY AND TREATMENT Analysis of the system’s existing components shows that in terms of raw water availability, treatment capacity, and pumping capacity the City of Westfield’s system either meets or exceeds requirements for current demand conditions. The existing raw water supply will be able to keep up with drinking water demand of up to 18 MGD without the Horseshoe wells, or up to approximately 24 MGD after the Horseshoe wells have been constructed. As maximum day demands of the system increase above the amount of available treatment (11.57 MGD or 14.07 MGD with River Road at 10 MGD), either existing facilities will need to be expanded or new facilities will need to be constructed. The existing pumping capacities of the system could last for some time into the future depending upon where future development occurs since each of the zones is not equally equipped to handle future increases in demand. As maximum day demand in the Southwest Pressure Zone reaches approximately 4 MGD, new or expanded pumping facilities will be needed to transport additional finished water from the Southeast Zone unless the full flow capacity of the 161st Street Booster Station is directed to the Southwest. A new booster pumping facility designed to convey finished water to the North Pressure Zone would have to be completed before the 161st Street Booster Station could be repurposed in this fashion. As the system is currently arranged, the North Pressure Zone pumps can handle up to nearly 3 MGD before additional pumping facilities will be required. In contrast, the Southeast Pressure Zone already has more pumping capacity than required for the full buildout scenario. Any new pumping facilities incorporated into this pressure zone would be installed with the intent of conveying an increased amount of finished water to the other two pressure zones. 6.2 DISTRIBUTION SYSTEM Like many communities, the City of Westfield’s oldest distribution infrastructure lies in the heart of the City in the downtown area just east of US 31 at State Road 32. The City’s older mains do not currently cause any serious maintenance issues for the City and do not have imminent need of replacement based on the distribution system’s capability of meeting demand in that area. However, as future unrelated infrastructure projects (roadway reconstruction, sidewalk replacement, etc.) are proposed in the areas of these older cast-iron and cement pipes, it would be considered prudent to replace some of these pipes with newer, and in some instances, larger pipes. As development occurs in the remote parts of the Westfield Public Works Department (WPWD) Service Area, the map of future drinking-water facilities provided in Chapter 5 can be used to determine the appropriate size of water distribution mains that should be installed in the area. It is advantageous for the WPWD staff to continue their practice of crafting agreements with developers to pay the cost of upsizing some water mains as this approach provides cost savings and future distribution infrastructure for the utility. Future interconnect and large water main

City of Westfield, Indiana Summary of Recommendations Drinking Water Master Plan 6-2 February 2010
projects as described in Chapter 5, will require appropriate planning and funding to be put in place so that the projects can be completed in the necessary timeframe. Existing system storage will continue to provide adequate capacity to the WPWD distribution system until the maximum demand of the system approaches 13 MGD. 6.3 PROPOSED TIMELINE FOR IMPROVEMENTS In order to outline future drinking water infrastructure projects in a way that prescribes a timeline which can be used for planning purposes, it is first necessary to make some assumptions about the geographical way in which development will grow. Figure 6-1 shows five areas, numbered in the sequence in which they are expected to develop. Each area also corresponds to a milestone in the percentage of full buildout reached. For example, once Area 1 has been developed, we expect the system to be 20 percent built out; once Area 2 has been developed, the system should be approximately 40 percent built out, and so on. By designating which portions of the currently undeveloped service area will develop first, we have the ability to plan on a more meaningful timeframe for infrastructure projects. Table 6.1 shows the improvements that would be required prior to reaching each of the demand milestones.
Table 6.1 PROPOSED SYSTEM IMPROVEMENTS TIMELINE
%
Buildout Maximum Demand
Projects
20 6.65 MGD Obtain IDEM Approval for 20-minute detention time at River Road WTP
40 13.29 MGD Towne Road Tank (0.75 MG) New Booster Station from Southeast to North Pressure Zone (8 to 9 MGD)
60 19.94 MGD
30-inch Water Main River Road WTP No. 2 (10 MGD) Maple Knoll Tank (1 MG) Horseshoe Wells (5 to 6 MGD)
80 26.58 MGD 186th Street Tank (0.75 MG) New 5 to 6 MGD well field Direct all flow from 161st Booster Station to Southwest Zone
100 33.23 MGD
206th Street Tank (0.75 MG) New 5 to 6 MGD well field New Booster Station from Southeast to North Pressure Zone (8 to 9 MGD) Horseshoe WTP (8 MGD)

!
!
!
!
Maple Knoll Tank (1 MG)
Towne Road Tank (0.75 MG)
186th Street Tank (0.75 MG)
206th Street Tank (0.75 MG)
0 14,000 28,000 42,0007,000 Feet
.Legend
! Future TanksExisting MainsRoadwaysService Area
Figure 6-1Assumed Expansion Sequence
Westfield Drinking Water Master PlanFebruary 2010
216th St.
Hami
lton B
oone
Rd.
Rive
r Rd.
Moon
town
Rd.
146th St.
161st St.
1
23
4
5
SR 32

APPENDIX A
HYDROLOGIC CAPACITY ANALYSIS BY EAGON & ASSOCIATES


EAGON & ASSOCIATES, INC. 100 Old Wilson Bridge Road, Suite 115
Worthington, Ohio 43085 (614) 888-5760

TABLE OF CONTENTS
Eagon & Associates, Inc. -i- November 3, 2009
Page
INTRODUCTION......................................................................................................................... 1 BACKGROUND ........................................................................................................................... 1 HYDROGEOLOGIC SETTING................................................................................................. 2 WELL-FIELD CAPACITY ......................................................................................................... 4
High Recharge Conditions.................................................................................................. 5 Reduced Recharge Conditions............................................................................................ 7 Drought Conditions............................................................................................................. 8
CONCLUSIONS AND RECOMMENDATIONS.................................................................... 10 REFERENCES............................................................................................................................ 13
FIGURES Figure 1. Well Field Location Map
TABLES Table 1. Well Construction Summary Table 2. Elevations and Available Drawdown Table 3. 18 MGD Drawdown Estimates – High Recharge Conditions Table 4. 18 MGD Drawdown Estimates – Reduced Recharge Conditions Table 5. 18 MGD Drawdown Estimates – Drought Conditions

Eagon & Associates, Inc. -1- November 3, 2009
INTRODUCTION
The purpose of this report is to present the results of a well-field capacity evaluation for the
City of Westfield Well Fields in the River Road area. Existing facilities are the River Road Well
Field, the Cherry Tree Well Field, and the Welcome Well Field. The locations of wells and well
fields are shown on Figure 1. Included in this report are an evaluation of current well-field capacity
under various hydrologic conditions and an analysis of the additional capacity that might be
developed in the River Road area to achieve the projected ground-water demand described in
Section 2.0 of the Drinking Water Master Plan. Based on growth projections, the future demand for
potable water will be approximately 22 million gallons per day (MGD) on average with a peak day
demand of as much as 33 MGD. Additional model simulations also were performed to assess the
impact on well-field production from filling of the Kinsey pond and the Heritage gravel pit.
BACKGROUND
As shown on Figure 1, there are currently nine production wells (Wells 5 through 13) at the
three Westfield well fields in the River Road area. Well 14 has been installed and tested on the
DeWitt property east of River Road between the gravel pit and the White River, but has not yet been
put into production. Well construction details and current production rates are summarized on Table 1.
Wells at the Cherry Tree Well Field were installed between 1986 and 1988 and production
rates vary from about 700 gpm for Well 7 to 1400 gpm for Well 5. Wells 8 and 9 at the River Road
Well Field were installed in 1997 and 1998, respectively. Well 10 was installed in 2003. Pumping
rates for each of the River Road Wells are around 2100 gpm. The Welcome Well Field was
developed in 2007 and 2008. Well 11 has a production capacity of 1400 gpm and Wells 12 and 13
can produce 700 gpm each. The total capacity of all of the existing wells is approximately 18 MGD
assuming good well performance and recharge.

Eagon & Associates, Inc. -2- November 3, 2009
Well 14 at the DeWitt Well Field was installed and tested in 2009. Analysis of the pumping-
test data from the test of Well 14 indicates that between 5 and 6 MGD production can be achieved at
the DeWitt Well Field with the installation of additional wells.
HYDROGEOLOGIC SETTING
The Westfield Well Fields are located within the Tipton Till Plain physiographic region
(Fenelon & Bobay et. al., 1994). This area is characterized by relatively low surface relief and thick
glacial deposits above bedrock. The thickness of the glacial drift in the area is generally between
100 to 250 feet. However, the depth to bedrock can also be quite shallow as is the case along the
White River near Noblesville and at the Martin Marietta limestone mine west of Cherry Tree
Avenue, just north of the Cherry Tree water treatment facility.
Unconsolidated aquifers within the study area can be separated into two aquifer systems as
described in “Ground-Water Resources in the White and West Fork White River Basin, Indiana”
(IDNR, 2002): the Tipton Till Plain Aquifer System and the White River and Tributaries Outwash
Aquifer System.
The Tipton Till Plain Aquifer System consists of intratill sand and gravel deposits. These
deposits are highly variable in depth and lateral extent and generally exist under confined aquifer
conditions. Well logs indicate that these deposits can reach a thickness of up to 60 feet, but are
typically 10 to 15 feet thick. The Westfield North Water Treatment Plant wells and Greyhound Pass
wells are completed in this type of aquifer. The North Water Treatment Plant wells are near the
northeast corner of the intersection of State Route 32 and U.S. 31 approximately five miles
northwest of the Cherry Tree Well Field. Greyhound Pass Well 4 (GP-4) is located west of U.S. 31
just north of the intersection with 156th Street about five miles west of the Cherry Tree Well Field.
Well GP-4 can produce about 300 gpm and this is probably as much as can be expected from these
intratill deposits. Recharge to these deposits will vary depending on the depth to the deposit, but
will most likely not exceed two inches per year.

Eagon & Associates, Inc. -3- November 3, 2009
The second unconsolidated aquifer system in the study area is the White River and
Tributaries Outwash Aquifer System. This aquifer system generally parallels the White River and
contains large volumes of sand and gravel that were deposited by meltwater from the retreating
glaciers that filled the stream valleys. The aquifer in the White River Valley has a saturated
thickness of up to 150 feet and is generally unconfined. This aquifer system is capable of providing
large quantities of ground water to properly constructed wells. Well 8 at the River Road Well Field
was tested at over 1800 gpm. The unconfined conditions allow for a relatively high recharge rate
including recharge that is available under pumping conditions from induced infiltration of surface
water from the White River.
Numerous gravel pits, both active and inactive, are present in the River Road area. The
gravel pits represent a large volume of water in storage and offer the opportunity for rapid recharge
from precipitation and run off. Recharge through the gravel pits also will occur if the river floods
high enough to enter the gravel pits. According to Martin Marietta, most of the water pumped from
the limestone mine is pumped into the gravel pits in the vicinity of the River Road Well Field,
although some is discharged to Vestal Ditch and flows to the west, away from the well fields.
Evaporation from the gravel pits depletes the volume of water in the pits. The evaporation rate from
surface water in central Indiana is approximately 33 inches per year, according to "Ground-Water
Resources of the United States" (Todd, 1983).
In places there is no unconsolidated aquifer material and the underlying carbonate bedrock is
used as a ground-water supply for residential wells. The bedrock is generally not considered to be a
good source for relatively higher yield wells. However, Indiana American Water (INAW) operates a
bedrock well in Noblesville that produces about 700 gpm. Martin Marietta also pumps ground water
from the bedrock at the underground limestone mine west of the River Road Well Field, but the
amount of water coming from the bedrock is difficult to determine since discharge from the mine
includes surface-water runoff and ground-water discharge is not metered.

Eagon & Associates, Inc. -4- November 3, 2009
WELL-FIELD CAPACITY
This well-field capacity analysis was performed using pumping-test data from the wells
combined with the results of ground-water flow model simulations to determine steady-state
drawdowns under conditions of high recharge, reduced recharge, and drought. Available
drawdowns were determined for each well based on well construction data and static water–level
elevations. The static-water levels, screen elevations, and available drawdown for each well are
shown on Table 2. These values of available drawdown were used for the analysis of well-field
capacity under high recharge conditions and were reduced based on changes in model non-pumping
water-level elevations for the analyses of well-field capacity under reduced recharge and drought
conditions.
Pumping-test data from the production wells were analyzed to determine long-term
drawdowns and well loss at the pumping rates shown on Table 1. The time-drawdown trend of the
data from the constant-rate tests was extrapolated to 180 days. The assumption of this analysis is
that after 180 days the cone-of-influence will have spread far enough to capture sufficient recharge
to balance pumping withdrawals and the system will be at steady-state. Well loss determined from
the stepped-rate test data from each well was then subtracted from the 180 day drawdown. Well loss
is the portion of drawdown in a pumped well that results from the turbulent flow of water into the
well. The remaining drawdown is the formation drawdown. Formation drawdown was adjusted
proportionally to determine drawdown at the current production rate of each well. Well loss was
then recalculated for the production rate and added to the formation drawdown to determine the total
steady-state drawdown for each well.
A ground-water flow model was used to determine interference drawdown between wells.
The ground-water flow model was originally developed for the Wellhead Protection Area
delineation performed in 2001. The model has been updated based on more recent test drilling and
aquifer testing and has been calibrated to the pumping tests of the Westfield wells. To determine
interference drawdowns, each well was pumped at the production rate shown on Table 1 and the
drawdown at the other well locations was recorded for each pumping simulation. The total
Eagon & Associates, Inc. -5- November 3, 2009
interference drawdown at each well is the sum of interference drawdowns from each individual well
pumping simulation.
High Recharge Conditions
The results of the analysis for 18 MGD production and conditions of high recharge are
shown on Table 3. High recharge conditions simulate observed water-levels typical of spring and
early summer. High recharge conditions as simulated in the model are:
Recharge from precipitation of 10 inches per year (in/yr) over the outwash aquifer.
Recharge from precipitation of 4 in/yr over areas outside of the outwash aquifer.
River depth of three feet.
Gravel pit depth of 20 feet.
As shown on Table 3, there is available remaining drawdown at all wells, however only
Well 9 has more than 30 percent of the available drawdown remaining. Our standard practice is to
leave 30 percent of the available drawdown remaining for loss of well efficiency over time and
seasonal low water levels. For most of the wells where the remaining available drawdown is less
than 30 percent it will be very important to maintain the condition of the wells at a high level of
efficiency in order to achieve 18 MGD from these wells. A relatively small increase in well loss can
be significant for wells with only a few feet of remaining available drawdown.
Simulation of 6 MGD production from three wells at the DeWitt Well Field also was
performed under high recharge conditions. Interference drawdown at the other production wells
ranged from 0.10 to 0.37 feet. So under high recharge conditions, production from the DeWitt Well
Field will have a minimal affect on production from the other Westfield wells.
Model simulations were performed to assess drawdown from operation of Veolia Water
Wells WRN-1, WRN-2, and WRN-3A. These wells are located south of the River Road Well Field,
as shown on Figure 1. They were installed in 2007, but have not been used for production and we

Eagon & Associates, Inc. -6- November 3, 2009
have no information regarding the performance characteristics of these wells. According to the
Phase 2- Yield and Demand Study for Veolia Water (Black & Veatch, October 2008), individual
well capacities are between 1100 to 1500 gpm. Simulations of 1400 gpm production from each of
the Veolia wells (6 MGD total) resulted in additional interference of 3.35 feet at Well 9, 2.81 feet at
Well 10, 1.84 feet at Well 8 and between 0.10 and 0.49 feet at the other Westfield production well
locations.
If Westfield were to acquire the Veolia Wells and the production rates used here are realistic,
an additional 12 MGD production can be achieved from the DeWitt and Veolia Wells bringing the
total production to 30 MGD under high recharge conditions. Combined with the approximately
1 MGD production from Greyhound Pass Well GP-4 and North Water Treatment Wells 2 and 4, that
would leave a 2 MGD deficit compared to the maximum day demand of 33 MGD.
It is likely that this additional 2 MGD capacity can be developed in the River Road area to
meet peak demand, but suitable well sites are becoming scarce due to existing land use and the
limited extent of the best part of the aquifer. A test well was drilled for Indianapolis Water about
2100 feet south of the DeWitt test well (Well 14) on the east side of the White River. The depth to
bedrock at that location is 66 feet and sand and gravel was logged from 32 to 66 feet. This is similar
to the conditions that were encountered at the DeWitt property. Test borings completed west of the
White River and North of 146th Street show that bedrock is very shallow (less than 30 feet)in that
area.
In the past, the potential for a well west of Well No. 9 at the River Road Well Field has been
evaluated. A well at this location would affect pumping levels at Wells 8, 9, and 10 and Veolia
Wells WRN-1 and WRN-3A. It is likely that a well at this location would supply some additional
capacity during high recharge conditions. Under conditions of reduced recharge or drought, a well
west of Well No. 9 may only provide redundancy and the ability to distribute production between
more wells.

Eagon & Associates, Inc. -7- November 3, 2009
Model simulations also were performed using the high recharge conditions to assess the
effect of filling of the Kinsey pond and the Heritage gravel pit. For each simulation, recharge was
reduced to two inches per year where the ponds were to represent reduced recharge that would occur
due to the placement of low permeable compacted fill material in the ponds. The recharge rate
through these materials could be even less. Model hydraulic conductivities also were reduced
proportional to the reduction in aquifer saturated thickness. For the simulation of filling of the
Kinsey pond, drawdown at Well 5 would be about 2.4 feet greater and drawdown at Well 13 would
be about 3.2 feet greater. Drawdowns at Wells 6, 7, and 12 would increase by one to two feet and
Wells 8, 9, 10, and 11 would be relatively unaffected. Filling of the Heritage gravel pit had no effect
on pumping levels or interference drawdowns at the DeWitt property or any of the other Westfield
Wells.
Reduced Recharge Conditions
The results of the analysis for 18 MGD production and conditions of reduced recharge are
shown on Table 4. Reduced recharge conditions simulate observed water-levels typical of late
summer and early autumn. Reduced recharge conditions as simulated in the model are:
Recharge from precipitation of 7.4 inches per year (in/yr) over the outwash aquifer.
Recharge from precipitation of 3 in/yr over areas outside of the outwash aquifer.
River depth of 1.5 feet.
Gravel pit depth of 15 feet (heads reduced by five feet).
The reduction of recharge used for this scenario and the drought scenario are based on
evaluation of drought conditions using the Palmer Drought Index data for the Central Indiana
Region. The data covers the time period from 1895 to the present. The most extensive drought in
the period of record occurred between July 1933 and August 1936. Mild to extreme drought
conditions prevailed throughout the 37 month period. The precipitation departure from normal
throughout the drought was -10.56 inches per year, which is about a 26 percent reduction in
precipitation compared to current normal precipitation amounts.

Eagon & Associates, Inc. -8- November 3, 2009
Table 4 shows that under reduced recharge conditions, pumping levels exceed available
drawdown at Well 6 and are very close to exceeding available drawdowns at most of the other wells.
Only Well 9 has a significant amount of remaining available drawdown. Since these projections are
based on pumping well drawdowns when the wells were new, a relatively small increase in well loss
from like-new conditions will result in pumping levels that exceed available drawdowns at many of
the other wells.
This is consistent with what has been observed at the Welcome and Cherry Tree Well Fields
over the last two years. A model scenario based on recent production from the Cherry Tree and
Welcome Well Fields was performed to check the accuracy of the model. The simulation included
total production of 6 MGD; 4 MGD from the Welcome Wells and 2 MGD from Well 5. Observation
Well 07-2 at the Welcome Well Field is equipped with a transducer and data logger for continuous
water-level monitoring. The results from this model scenario were consistent with the observed
water level at Observation Well 07-2 in October 2009.
Drought Conditions
To simulate drought conditions, water levels in the gravel pits were reduced by an additional
three feet. River depth and recharge from precipitation used for this scenario are the same as were
used for the reduced recharge scenario. The precipitation amounts used for the reduced recharge
scenario were based on drought conditions and flow on the White River is supported by discharge
from Morse Reservoir and so the depth is unlikely to drop significantly lower than 1.5 feet.
The results of the analysis for 18 MGD production during drought conditions are shown on
Table 5. Under the simulated drought conditions, available drawdown is exceeded at all of the wells
except Wells 9 and 13. This indicates that production of 18 MGD from the existing production
wells is not possible on a consistent basis during drought conditions. Depending on actual
conditions and well performance at the time, it may not even be possible to meet a peak demand of
18 MGD.

Eagon & Associates, Inc. -9- November 3, 2009
The simulated drought conditions seem to be fairly extreme, but conditions could be even
worse than simulated. To make a reality check of the model results, an empirical analysis of
recharge available under drought conditions was performed. Sources of recharge to support well-
field production are estimated as follows:
Recharge from precipitation (2.35 MGD),
Runoff to the gravel pits (0.65 MGD),
Riverbed infiltration (1.9 MGD),
Water pumped into the gravel pits from the limestone mine (3.5 MGD),
Water in storage in the gravel pits (2.7 MGD), and
Water in storage in the aquifer (6.7 MGD).
The ground-water flow model was used to determine the amount of water available from
recharge and riverbed infiltration. Recharge was determined for the approximate area encompassed
by the one foot drawdown contour for an 18 MGD pumping scenario. Total recharge was
2.35 MGD.
Runoff is a very complex parameter to estimate because it depends on the amount of rainfall
in a particular precipitation event, the ground conditions, land use, and topography. As a rough
approximation, runoff is about one third of total precipitation. Normal precipitation in the central
Indiana area is about 40 inches per year, but that amount is reduced by about 26 percent during
drought conditions. If precipitation during drought conditions is 30 inches per year, runoff would be
about 10 inches per year. For the purpose of this analysis, we have assumed that 50 percent of
runoff makes it to the gravel pits over an area of approximately 1750 acres west of the White River
generally centered on the Westfield Well Fields, which results in a total of 0.65 MGD of recharge
from runoff.
The amount of water available from induced riverbed infiltration was estimated based on the
difference in the amount of water entering the model from the White River and Cicero Creek

Eagon & Associates, Inc. -10- November 3, 2009
between a simulation without the Westfield Wells pumping and a simulation of 18 MGD production
from the Westfield wells. The difference in riverbed infiltration was 1.9 MGD.
According to Martin-Marietta most of the water pumped from the limestone mine is pumped
to the gravel pits and the reported pumpage from the gravel pits in 2007 was 4.3 MGD. We used
3.5 MGD for this analysis, because Martin-Marietta claims that most of the water pumped from the
mine is pumped to the gravel pits around the River Road Well Field.
The area of the gravel pits was calculated from aerial photos and the depth of the gravel pits
was assumed to be 20 feet. The Heritage gravel pit and gravel pits north of the Heritage gravel pit
were not used in this calculation. We assumed that 50 percent of water in the gravel pits could be
captured resulting in 2.7 MGD of water available for recharge to pumping wells.
For the estimation of water available from aquifer storage, the amount of water per foot of
aquifer over an area of 164 million square feet (3765 acres) was calculated using a storage
coefficient of 0.2. This amount is 0.67 MGD per foot of aquifer so if 10 feet of aquifer is dewatered
the rate of dewatering would be 6.7 MGD. The total amount of water available based on this
analysis is 17.1 MGD.
CONCLUSIONS AND RECOMMENDATIONS
Based on the analyses presented in this report, the projected average and peak day demands
of 22MGD and 33 MGD, respectively, can be achieved under high recharge conditions. Additional
capacity will be required to maximize production potential. Acquisition of Veolia Wells WRN-1, 2,
and 3A should be pursued and the DeWitt Well Field should be developed to help meet the projected
future demand. Depending on the actual capacity that is available from the Veolia wells, it will most
likely be necessary to develop some additional capacity. The best location would be south of the
DeWitt wells between the gravel pit and the White River. Wells there would need to be sufficiently
far from the DeWitt wells to avoid interference drawdown between the Well Fields (1000 to
2000 feet). An additional well at River Road Well Field could be installed. A test boring has

Eagon & Associates, Inc. -11- November 3, 2009
already been completed at this location so we know the formation is there. There will be
interference between that well and the existing River Road wells and Veolia Wells WRN-2 and
WRN-3A. The new well will probably supply some additional capacity during high recharge
conditions, but may only provide redundancy under low recharge or drought conditions. At peak
demand it may not be possible to continue selling water to Indianapolis, even under high recharge
conditions.
Under reduced recharge conditions, it will most likely be possible to meet average daily
demands with expansion of the system as suggested. It may be possible to meet peak demands, but
probably not for extended periods of time. In either case, flexibility within the system will be very
important. Future planning should include modifications to the distribution system that will allow
water from any well to be pumped to any zone so that pumping can be distributed to maximize
production based on water levels and well performance.
Wells also should be equipped with variable frequency drives (VFDs) so that pumping rates
can be optimized to maximize production. Well maintenance also will be very important. A routine
maintenance schedule should be developed so that the wells can be maintained at a high level of
performance.
For new or replacement wells, well design using shorter, larger diameter well screens should
be considered. Gravel pack designs, such as has been used at Well No. 9, can also be used. In
theory a larger diameter well screen and gravel pack should increase the effective well radius and
decrease well screen entrance velocities that should result in a decrease in drawdown due to well
loss. Shorter well screens will allow for more available drawdown, but could result in lower specific
capacities, so potentially there are some theoretical trade-offs that are difficult to quantify in advance
of their implementation.
Under drought conditions, the recharge analysis shows that approximately 17.1 MGD is
available. Adding in the approximately one MGD from GP-4 and the Water Treatment Plant wells,
this leaves a deficit of about 4 MGD. Meeting even the projected average day demand will require

Eagon & Associates, Inc. -12- November 3, 2009
either development of additional sources of supply, possibly the use of surface water from the White
River, or innovative methods to enhance recharge to the wells.
One way to enhance recharge to meet demands during times of low recharge or drought
would be to use the gravel pits as artificial recharge basins. Water from the White River could be
pumped into the gravel pits to keep heads in the ponds higher and supply recharge to the aquifer
when it is most needed. Stream withdrawals during dry seasons might not be possible, but
recharging during periods of high stream flow to increase aquifer storage to support pumpage during
dry seasons may be beneficial. Based on recent observations, pumping into the DeWitt gravel pit
pond and the Kinsey pond would have the most direct influence on pumping levels at the Westfield
wells. If discharge from the limestone mine increases as the mine expands, this could also increase
recharge to the aquifer as long as that discharge is directed into the gravel pits in the River Road
area. Artificial recharge may also avoid the need for treatment as surface water as opposed to a
direct surface-water supply. It might also be possible to construct an up-ground storage reservoir
that could be used to pump water to the ponds during low recharge or drought conditions.
As new wells are added and more data is collected this analysis should be updated to include
production and performance characteristics of the new wells. Continuing analysis of water-level
data from the production and observation wells combined with production data, surface-water, and
climate data will help to further refine our understanding of the ground-water and surface-water
hydrology that affect well-field capacity in this area. It is clear that prudent planning and
management will be required in order to meet demands for the water resources from this area.

Eagon & Associates, Inc. -13- November 3, 2009
REFERENCES
Black & Veatch, 2008, Phase II Yield and Demand Study, Final Technical Memorandum, Veolia
Water, LLC, Consultants Report. Fenelon, Joseph M.; Kieth E. Bobay, and others, 1994, Hydrogeologic Atlas of Aquifers in Indiana,
U.S. Geological Survey Water Resources Investigations Report 92-4142. Indiana Department of Natural Resources, Division of Water, 2002, Ground-Water Resources in the
White and West Fork White River Basin, Indiana, Water Resource Assessment 2002-6. McDonald, Michael G. and Harbaugh, Arlen W., 1988. A Modular Three Dimensional Finite
Difference Ground-Water Flow Model, U.S. Geological Survey Techniques of Water-Resources Investigations, Book 6, Chapter A1. (Provided by Geraghty & Miller, Inc.).
Todd, David Keith, 1983, Ground-Water Resources of the United States, Premier Press.

FIGURES

Cherr
y Tree
Ave.
146th Street
Cherry Tree Well Field
River Road Well Field
WelcomeWell Field
13
1112
10
Kinsey Pond
HeritageGravel Pit
DeWitt Well Field
9
8
657
14
WRN-2
WRN-1
WRN-3A
³0 2,000 4,000
Scale in FeetFigure 1. Well Field Location Map
EAGON & ASSOCIATES, INC.AR
CGIS\
Westf
ield\W
ell Lo
catio
n Aeri
al2.m
xd
Rive
r Rd.
160th Street
LegendWestfield Production WellsVeolia WellsWell Field Property Boundaries

TABLES

TABLE 1.WELL CONSTRUCTION SUMMARY
CITY OF WESTFIELD
Well Ground Well Depth to Screen Screen Current
Number Well Field Elevation Depth1 Top of Screen Length Slot-Size Pumping Rate(feet, MSL) (feet, bgl) (feet, bgl) (feet) (inches) (gpm)
WELL 5 CHERRY TREE 764 78.0 55.0 23.0 0.100 1400
WELL 6 CHERRY TREE 766 75.5 52.0 23.5 0.100 1320
WELL 7 CHERRY TREE 764 72.0 50.0 22.0 0.100 700
WELL 8 RIVER ROAD 754 98.0 48.0 50.0 0.130 2100
WELL 9 RIVER ROAD 754 92.0 62.0 30.0 0.200 2100
WELL 10 RIVER ROAD 754 97.0 55.0 47.00.080 - 55-70 ft 0.040 - 70 -90 ft 0.100 - 90-97 ft
2050
WELL 11 WELCOME 767 84.0 62.0 20.00.100 - 62 - 76 ft 0.140 - 76 - 84 ft
1400
WELL 12 WELCOME 764 78.0 56.0 22.00.110 - 56 - 71 ft 0.090 - 71 - 78 ft
700
WELL 13 WELCOME 759 85.0 60.5 24.50.050 - 60.5 - 68 ft 0.120 - 68 - 85 ft
700
WELL 14 DeWITT 752 76.0 56.0 20.0 0.140 --
Westfield/well construction summary.xls:11/3/2009 Eagon & Associates, Inc.

TABLE 2.ELEVATIONS AND AVAILABLE DRAWDOWN
CITY OF WESTFIELD
Well Ground Static Depth Water-Level Depth to Top of Screen AvailableNumber Well Field Elevation to Water Elevation Top of Screen Elevation Drawdown
(feet, MSL) (feet, bgl) (feet, MSL) (feet, bgl) (feet, MSL) (feet)
WELL 5 CHERRY TREE 764 16.5 747.5 55.0 709.0 38.5
WELL 6 CHERRY TREE 766 17.5 748.5 52.0 714.0 34.5
WELL 7 CHERRY TREE 764 17.5 746.5 50.0 714.0 32.5
WELL 8 RIVER ROAD 754 8.9 745.1 48.0 706.0 39.1
WELL 9 RIVER ROAD 754 11.8 742.2 62.0 692.0 50.2
WELL 10 RIVER ROAD 754 9.0 745 55.0 699.0 46.0
WELL 11 WELCOME 767 25.3 741.7 62.0 705.0 36.7
WELL 12 WELCOME 764 23.3 740.7 56.0 708.0 32.7
WELL 13 WELCOME 759 14.7 744.3 60.5 698.5 45.8
WELL 14 DeWITT 752 12.1 739.9 56.0 696.0 --
Westfield/ELEVATIONS AND AVAILABLE DRAWDOWN.xls:11/3/2009 Eagon & Associates, Inc.

TABLE 3.18 MGD DRAWDOWN ESTIMATES - HIGH RECHARGE CONDITIONS
CITY OF WESTFIELD
Well Pumping Available Pumping Well Interference Total Remaining RemainingNumber Well Field Rate Drawdown Drawdown Drawdown Drawdown Available Drawdown Available Drawdown
(gpm) (feet) (feet) (feet) (feet) (feet) (percent)
WELL 5 CHERRY TREE 1400 38.5 21.99 9.95 31.94 6.56 17.0
WELL 6 CHERRY TREE 1320 34.5 21.00 11.26 32.26 2.24 6.5
WELL 7 CHERRY TREE 700 32.5 12.59 15.88 28.47 4.03 12.4
WELL 8 RIVER ROAD 2100 39.1 23.24 9.66 32.90 6.20 15.9
WELL 9 RIVER ROAD 2100 50.2 17.94 11.56 29.50 20.70 41.2
WELL 10 RIVER ROAD 2050 46.0 26.96 13.33 40.29 5.71 12.4
WELL 11 WELCOME 1400 36.7 23.68 7.84 31.52 5.18 14.1
WELL 12 WELCOME 700 32.7 17.22 12.77 29.99 2.71 8.3
WELL 13 WELCOME 700 45.8 25.85 10.81 36.66 9.14 20.0
Westfield/18 MGD DRAWDOWN EST NORMAL CONDITIONS.xls:11/3/2009 Eagon & Associates, Inc.

TABLE 4.18 MGD DRAWDOWN ESTIMATES - REDUCED RECHARGE CONDITIONS
CITY OF WESTFIELD
Well Pumping Available Pumping Well Interference Total Remaining RemainingNumber Well Field Rate Drawdown Drawdown Drawdown Drawdown Available Drawdown Available Drawdown
(gpm) (feet) (feet) (feet) (feet) (feet) (percent)
WELL 5 CHERRY TREE 1400 33.74 21.99 9.88 31.87 1.87 5.5
WELL 6 CHERRY TREE 1320 29.71 21.00 11.20 32.20 -2.49 -8.4
WELL 7 CHERRY TREE 700 28.75 12.59 15.85 28.44 0.31 1.1
WELL 8 RIVER ROAD 2100 34.34 23.24 9.68 32.92 1.42 4.1
WELL 9 RIVER ROAD 2100 45.52 17.94 11.49 29.43 16.09 35.3
WELL 10 RIVER ROAD 2050 41.30 26.96 13.29 40.25 1.05 2.5
WELL 11 WELCOME 1400 31.96 23.68 7.30 30.98 0.98 3.1
WELL 12 WELCOME 700 28.01 17.22 11.79 29.01 -1.00 -3.6
WELL 13 WELCOME 700 41.15 25.85 10.57 36.42 4.73 11.5
Westfield/18 MGD DRAWDOWN EST REDUCED RECHARGE CONDITIONS.xls:11/3/2009 Eagon & Associates, Inc.

TABLE 5.18 MGD DRAWDOWN ESTIMATES - DROUGHT CONDITIONS
CITY OF WESTFIELD
Well Pumping Available Pumping Well Interference Total Remaining RemainingNumber Well Field Rate Drawdown Drawdown Drawdown Drawdown Available Drawdown Available Drawdown
(gpm) (feet) (feet) (feet) (feet) (feet) (percent)
WELL 5 CHERRY TREE 1400 31.24 21.99 9.97 31.96 -0.72 0.0
WELL 6 CHERRY TREE 1320 27.28 21.00 11.17 32.17 -4.89 0.0
WELL 7 CHERRY TREE 700 26.40 12.59 15.83 28.42 -2.02 0.0
WELL 8 RIVER ROAD 2100 31.64 23.24 9.69 32.93 -1.29 0.0
WELL 9 RIVER ROAD 2100 42.90 17.94 11.44 29.38 13.52 31.5
WELL 10 RIVER ROAD 2050 38.66 26.96 13.45 40.41 -1.75 0.0
WELL 11 WELCOME 1400 29.28 23.68 7.14 30.82 -1.54 0.0
WELL 12 WELCOME 700 25.36 17.22 11.87 29.09 -3.73 0.0
WELL 13 WELCOME 700 38.53 25.85 10.59 36.44 2.09 5.4
Westfield/18 MGD DRAWDOWN EST DROUGHT CONDITIONS.xls:11/3/2009 Eagon & Associates, Inc.

APPENDIX B
DEWITT PROPERTY WELL FIELD CAPACITY ESTIMATE


