driver alcohol detection system for safety (dadss...
TRANSCRIPT

1
DRIVER ALCOHOL DETECTION SYSTEM FOR SAFETY (DADSS) – PRELIMINARY HUMAN TESTING RESULTS Scott E. Lukas, Ph.D. Behavioral Psychopharmacology Research Laboratory (BPRL), McLean Hospital/Harvard Medical School, Belmont, MA, 02478, USA Abdullatif Zaouk, Ph.D. KEA Technologies, Inc., Marlborough, MA 01752, USA Elizabeth Ryan, Ph.D. Jane McNeil, M.S. Justin Shepherd, M.S. Behavioral Psychopharmacology Research Laboratory (BPRL), McLean Hospital/Harvard Medical School, Belmont, MA, 02478, USA Michael Willis, B.S. Neeraj Dalal, B.S. Kelly Schwartz, Ph.D. KEA Technologies, Inc., Marlborough, MA 01752, USA Paper Number 17-0304 ABSTRACT
Alcohol-related traffic crashes and deaths remain a major problem in the United States as 2014 data revealed that there were 32,675 traffic fatalities that year, with 31% of them being related to alcohol. The National Highway Traffic Safety Administration (NHTSA) and the Automotive Coalition for Traffic Safety (ACTS) began research in February 2008 aimed at identifying potential in-vehicle approaches to the problem of alcohol-impaired driving that are sensitive, reliable and less intrusive than ignition interlocks. The Driver Alcohol Detection System for Safety (DADSS) was created, and two passive technologies based on breath- and touch (tissue)- based systems for detecting alcohol were selected to be tested against a research grade hand-held breathalyzer device and venous blood.
Healthy male and female volunteers (age 21-40) signed an Institutional Review Board (IRB)-approved informed consent and participated in experiments in which they consumed 0.9 g/kg of alcohol (vodka) under a variety of drinking regimens and scenarios that mimicked real-life situations. The volunteers then provided passive breath and tissue (i.e., finger touch) samples and had their blood drawn for subsequent quantification of alcohol via gas chromatography. The lag time of appearance of alcohol in each sample as well as peak concentration, time to peak, and elimination rate were the primary dependent variables. The overall aim of the experiments was to test whether the alcohol levels measured by the two prototype devices correlate with venous blood under the following scenarios: lag time, eating a snack, eating a full meal, exercising, and “last call”.
The lag time experiment revealed that the order of alcohol appearance after drinking was (from quickest to slowest): breath, blood, and tissue, although the early breath samples were contaminated by mouth alcohol. However, the concentration-time curves for both prototype devices paralleled that of blood. Similar profiles were observed in the “last call” experiment with a “surge” of alcohol being observed after an extra drink was consumed during the distribution phase. The exercise scenario revealed similar profiles, although the touch-based device registered a slightly higher alcohol level. Finally, the two eating scenarios indicated that blood alcohol concentrations were lower after consuming a meal compared to a snack, and breath and touch samples reflected these patterns. The sample size of 10 individual participants is small, but individuals served as their own controls by participating in more than one experiment. Furthermore, the study is ongoing and so the sampling limitation will be addressed. The data support the proof-of-concept that passive technologies can detect alcohol quickly and are not affected by many of the common scenarios that alter blood alcohol concentrations. Such devices, if proven to be reliable and reproducible with additional human testing, represent a significant technological breakthrough in strategies to reduce alcohol-impaired individuals from driving a vehicle and causing injuries and/or deaths.
2
INTRODUCTION Excessive alcohol consumption is responsible for approximately 88,000 deaths and 2.5 million years of potential life lost (YPLL) in the United States each year (CDC, 2013). Binge drinking (consuming 4 or more drinks per occasion for women; 5 or more drinks per occasion for men) is responsible for more than half of the deaths and two-thirds of the YPLL due to excessive drinking (Stahre et al., 2004) and is associated with many health and social problems, including alcohol-impaired driving, interpersonal violence, risky sexual activity, and unintended pregnancy (Naimi et al., 2003). Most people under age 21 who drink, report binge drinking, usually on 2-3 times per week (Miller et al., 2006). Alcohol-related traffic accidents and deaths remain a major problem in the United States as recent data indicate that there were 35,092 traffic fatalities in 2015, with 29% (10,176) of them alcohol related (DOT, 2016). This report also revealed that every day, almost 30 people in the United States die in motor vehicle crashes that involve an alcohol-impaired driver. This translates to one death every 51.5 minutes. The annual cost of alcohol-related crashes totals more than $59 billion (Blincoe et al., 2015). And while the focus is often on the number of deaths attributed to alcohol-impaired driving, the number of injuries and destruction to personal and public property is staggering:
1. In 2015 10,176 people were killed in alcohol-impaired driving crashes, accounting for 29% of all traffic-related deaths in the United States, but an increase of 3.2% from the previous year (DOT, 2016).
2. Alcohol-related fatalities on the highway by state ranged from 16% in Utah to 43% in Rhode Island (DOT, 2016).
3. Of the traffic fatalities among children under the age of 14 years and younger in 2014, 19% involved an alcohol-impaired driver (DOT, 2015).
4. Of those 200 children ages 0 to 14 years who died in alcohol-impaired driving crashes in 2013, over half (121) were riding in the vehicle with the alcohol-impaired driver (DOT, 2014).
5. Drunk driving costs the United States $199 billion a year (NHTSA, 2015).
6. In 2010, over 1.4 million drivers were arrested for driving under the influence of alcohol or narcotics (DOT, 2011). This only represents 1% of the 112 million self-reported episodes of alcohol-impaired driving among U.S. adults each year (Bergen et al., 2011).
7. Drugs other than alcohol (e.g., marijuana,
cocaine) are involved in approximately 18% of motor vehicle driver deaths. These other drugs are often used in combination with alcohol (Jones et al., 2003).
What makes these data even more important is the fact that alcohol-related deaths on the highway are vastly underreported (Castle et al., 2014) because many states do not require blood alcohol testing on all fatalities. Laboratory and on-road research shows that the vast majority of drivers, even experienced drivers, are significantly impaired at the blood alcohol concentration (BAC) legal limit of 0.08% with regard to critical driving tasks such as braking, steering, lane changing, judgment and divided attention. Decrements in performance for drivers at a BAC of 0.08% are on the order of 40 - 60% worse than when they are at a BAC of 0.00%. Research findings suggest that the most crucial aspect of impairment is the reduction in the ability to handle several tasks at once. This skill is precisely what driving a motor vehicle requires. Case studies reveal that an elevated relative risk of crashing begins at 0.05 – 0.06% BACs with an accelerating increase in risk at BACs greater than 0.10% (Blomberg et al., 2005) and that the impact of alcohol is much greater than other drugs (Romano et al., 2013). Drivers with a BAC of 0.08% or higher involved in fatal crashes were seven times more likely to have a prior conviction for driving while intoxicated (DWI) than were drivers with no alcohol in their system (7% and 1%, respectively) (DOT, 2014). Thus, there is overwhelming evidence that ethyl alcohol adversely affects driving performance by impairing skills that are critical to properly operating a motor vehicle. These include judgment, visuospatial recognition, reaction time and time estimation. In the aggregate, the effects of alcohol significantly interfere with an individual’s ability to divide his or her attention to the many rapidly changing elements that occur while driving. There are three fundamentally different types of individuals who drive while under the influence of alcohol (Hedlund, 1994):
1. “normal” drivers who are social drinkers. Such drivers may miscalculate the effects of alcohol on their performance. Alcohol increases their crash risk and their crash rates would decrease substantially if they did not drive after drinking.
2. “high-risk” drivers. These are frequent drinkers, for whom alcohol abuse “may be just another manifestation of risk-taking behavior or may enable this behavior by removing what inhibitions they have.” Abstaining may not have as much of an
3
impact on reducing their crash rates. 3. “alcoholics”, for whom alcohol abuse is an
integral part of life and abstaining would require a complete lifestyle change. If they abstained, their crash rates should drop significantly.
A passive alcohol detection system could easily help all three of the above types of drinkers. The challenges presented to law enforcement and the medical community is to minimize the impact that alcohol has on driving performance. Treatment for alcohol abuse or dependence is desirable, but that might not be realistic because it if often sought only after a significant event has happened. Thus, it is deemed far more desirable to prevent the disease or disorder than to have to deal with the consequences. The prevention model is significantly favorable to the treatment model when you consider the burden to health and well-being as well as the substantial financial impact of alcohol use disorders. As an analogy, every dollar invested in school-based substance abuse prevention programs has the potential to save up to $18 in costs related to substance use disorders (Miller and Hendrie, 2009), which translates into saving $7 in future costs for every $1 spent on prevention measures. This valuable epidemiological data from over three decades of research in the drug abuse field is now being applied to contend with the issue of the alcohol-impaired driver. The historical perspective of both regulatory (i.e., interlock systems) and voluntary methods to reduce the impact of driving while intoxicated has been well documented (Ferguson et al., 2009). The focus is on developing a passive system that requires little or no action by the driver in order to quickly and accurately assess BAC in order to render the vehicle inoperable if the reading is above the legal limit. The fundamental aims and goals of the Driver Alcohol Detection System for Safety (DADSS) program have been articulated and punctuated with successful initial Phase I testing completed (Ferguson et al., 2011). The Challenge to In-Vehicle Technology—DADSS The Driver Alcohol Detection System for Safety (DADSS) Program is a cooperative research partnership that was initially signed in 2008 and renewed in 2013 between the National Highway Traffic Safety Administration (NHTSA) and the Automotive Coalition for Traffic Safety (ACTS) that was formed to conduct research on the feasibility of using in-vehicle, noninvasive, passive technology to reduce and/or prevent alcohol-impaired driving. The DADSS website can be found at http://www.dadss.org. Members of ACTS comprise motor vehicle manufacturers representing approximately 99 percent of light vehicle sales in the U.S (BMW, Chrysler, Fiat Chrysler Automobiles, Ford,
General Motors, Honda, Hyundai, Jaguar/Land Rover, Kia, Mazda, Mercedes Benz, Mitsubishi Motors, Nissan, Porsche, Subaru, Toyota, Volkswagen, and Volvo). The success of this program will depend upon driver acceptability (many of whom do not drink alcohol), which means that the system must be reliable as well as unobtrusive and not interfere with driving mechanics. Furthermore, the system must be durable and require little or no maintenance. The cooperative agreement’s first task was to select the technologies on which to base the program, and then determine if they are consistent with concurrent blood alcohol concentrations (BAC). The coalition elected to pursue both a breath-based (BrAC) and a tissue-based (TiAC) system and support the development and testing of two prototypes that could be installed in vehicles. A more extensive review and update of the program is provided by Zaouk et al., 2015). The fundamental challenge is to ensure that the levels of alcohol that are detected by the passive technology incorporated into the DADSS system do, in fact, reflect the concentration that is in venous blood, which is the gold standard of measurement. However, it is important to note that many of the factors identified below will also affect any standard method of measuring BAC that would be used by law enforcement. What is critical to this examination is to identify factors that could have a differential effect on the BAC measured by passive alcohol detection devices from levels measured via blood or breath using conventional methods. The next step is to design and carry out experiments that will improve their precision and reliability under a wide number of conditions. One of the major goals of the DADSS system is to avoid a false negative (that is, allow an individual whose BAC is above the legal limit of 0.08% to drive the vehicle). This defeats the underlying purpose of the program. However, a false positive (that is, preventing the vehicle from being driven when the driver’s BAC is below the legal limit of 0.08%), will undoubtedly raise concern and may deter public support for the program. In order to assess the reliability, reproducibility, precision, and accuracy of these technologies, they must be tested under different “scenarios” in which the public is likely to engage. As previously mentioned, the gold standard for quantifying the amount of alcohol in an individual’s system is via a blood sample that is processed using gas chromatography with a Flame Ionization detector (Lex et al., 1988; Lukas et al., 1986, 1992; Penetar et al., 2008). We incorporated the serial sampling technique developed over the past three decades to test the performance of these prototype devices under real-life conditions.
4
Blood Alcohol Concentration (BAC) Standards BAC remains the standard for documenting the amount of alcohol in the body (Tiscione et al., 2011) because alcohol is ubiquitous with water and so alcohol concentrations equilibrate throughout the body and brain very quickly once absorbed. Because of this direct relationship, BACs parallel changes in psychomotor performance and subjective reports of intoxication (Grant et al., 2000; Tagawa et al., 2000; Lukas et al., 1986, 1989a, b). While blood is the standard biological sample, it is not the most convenient to collect. For many years forced breath samples have been an accepted surrogate for BAC, though breath is more closely related to arterial than venous blood (Martin et al., 1984). This is because the air in the lungs exchanges with the alveoli capillaries that are an extension of the pulmonary arteries. Forced breath sampling is the basis behind a wide range of hand-held breathalyzers, evidentiary breath (e.g., Nanopuls Evidenzer™), and the Breath Alcohol Ignition Interlock Devices (BAIID). A DWI offender is required to use a BAIID by either a court or by state law administered by the state licensing agency. While the method used to quantify alcohol concentrations in breath samples differ, these devices share one common element—the subject must exhale forcibly into a mouthpiece for a specified amount of time to obtain a valid reading. These devices lack the appeal of measuring alcohol passively and therefore limit their utility in a continuous drunk driving deterrent system. Transdermal sampling (i.e., sweat) has been explored, (Swift, 1993), but reflects alcohol vapor that evaporates from the skin surface and so is not temporally linked to blood. In contrast, tissue measurements that use an optical probe to direct NIR radiation into the dermal layer of the tissue and collect the radiation that is diffusely reflected to the tissue surface directly interrogates the aqueous alcohol present in the interstitial fluid of the dermis (Ridder et al., 2005, 2009, 2011). In this regard, the critical distinction between transdermal and tissue alcohol measurements is that the latter is more dynamically related to the rapidly changing BAC while the former is more sluggish and therefore cannot be equated to alcohol-induced impairment. The Technologies In an attempt to provide a comprehensive coverage to increase accuracy, two different technologies were selected to be integrated. The first is a passive breath-based system and the second is a touch-based system that detects tissue alcohol concentration.
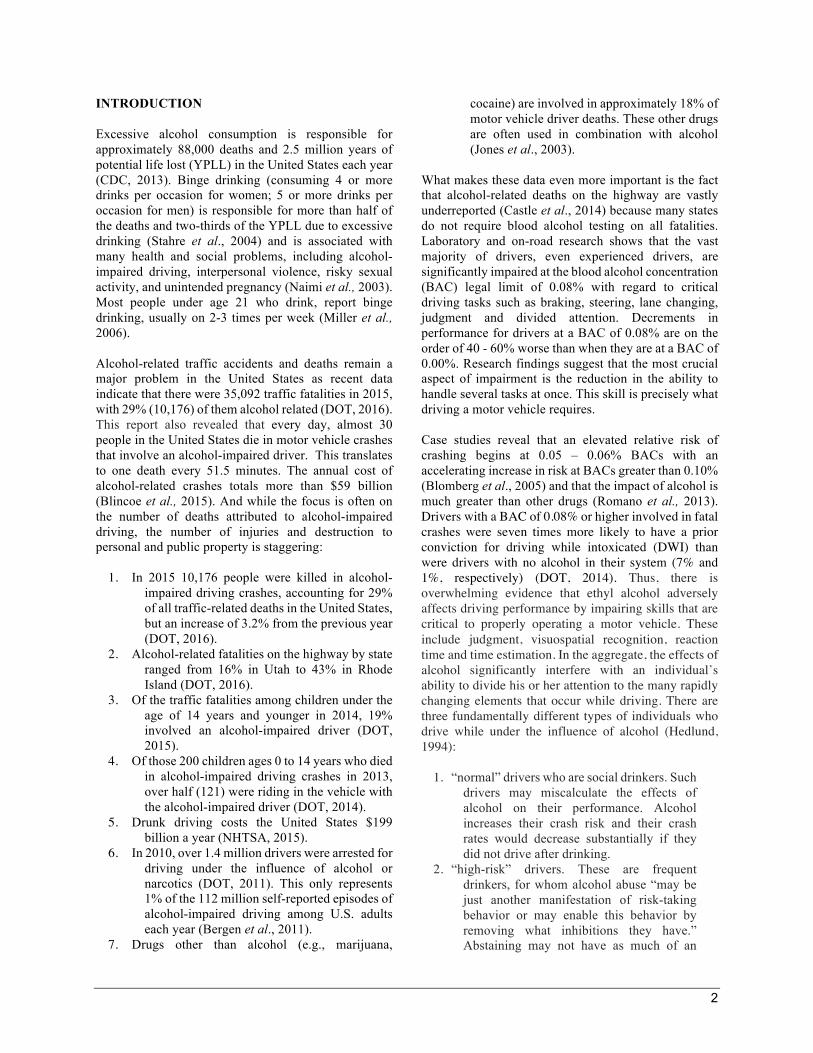
Breath-Based Technology Breath-based systems use an approach similar to tissue spectrometry, in that they utilize the mid infrared (MIR) region of the electromagnetic spectrum (2.5 - 25 µm), but no skin contact is required. The approach under development aim to remotely analyze alcohol in breath within the vehicle cabin without the driver having to specifically provide a deep-lung breath sample. The working principle of the sensor is to use measurements of expired carbon dioxide (CO2) as an indication of the degree of dilution of the alcohol in expired air. Normal concentration of CO2 in ambient air is close to zero. Furthermore, CO2 concentration in alveolar air is both known and predictable, and remarkably constant. Thus, by simultaneously measuring CO2 and alcohol, the degree of dilution can be compensated for using a mathematical algorithm. According to Hök (2006), the ratio between the measured concentrations of CO2 and alcohol, together with the known value of CO2 in alveolar air, can provide the alveolar air alcohol concentration. The sensor technologies under development use MIR spectroscopy for both alcohol and CO2 and is manufactured by the Autoliv team comprised of Hök Instrument and Sensair (Sweden). The MIR-based sensors can be stable over the full product lifetime, eliminating the need for recurrent calibrations (Figure 1).
Figure 1. Passive breath detector (Autoliv). For in-vehicle use, the system could employ multiple sensors placed strategically around the cabin of the vehicle close to the driver. The challenge is to determine the number and placement of sensors needed to measure alcohol quickly and accurately given the dynamics of the cabin air, and to ensure that there is no potential bias introduced as a result of passengers who may have been drinking. Touch-Based Technology Tissue spectrometry systems, also known as near infrared (NIR) spectrometry, this is a noninvasive

5
approach that utilizes the near infrared region of the electromagnetic spectrum (from about 0.7 to 2.5 µm) to measure substances of interest in bodily tissue. The measurement begins by illuminating the user’s skin with NIR light which propagates into the tissue (the skin must be in contact with the device). The beam of light can penetrate tissue at depths of up to 5 mm to reach the dermal layer where alcohol that is dissolved in water resides. A portion of the light is diffusely reflected back to the skin’s surface and collected by an optical touch pad. The light contains information on the unique chemical information and tissue structure of the user. This light is analyzed to determine the alcohol concentration and, when applicable, verify the identity of the user. Because of the complex nature of tissue composition, the challenge is to measure the concentration of alcohol (sensitivity) while ignoring all the other interfering analytes or signals (selectivity). Although the entire NIR spectrum spans the wavelengths from 0.7 - 2.5 µm, the device currently under study (TruTouch Inc., Riverside, CA) uses the 1.25 - 2.5 µm region because of its high sensitivity and selectivity for alcohol. The 0.7 - 1.25 µm region of the NIR spectrum is limited by the presence of skin pigments such as melanin that can create large differences among people, particularly of different ethnicities. In contrast, the longer wavelength portion of the NIR, from 1.25 - 2.5 µm, is virtually unaffected by skin pigmentation (Anderson et al., 1981). One other advantage of using this region of the spectrum is that the alcohol signal in the 1.25 - 2.5 µm region is hundreds of times stronger than the signal in the 0.7 - 1.25 µm part of the NIR. The TruTouch prototype system is based on a proprietary Fourier transform spectrometer coupled with a compact, fiber optic touchpad with which the user interfaces. To conduct a test, the user places an intermediate phalange of the index finger onto the fiber optic touchpad (Figure 2). The prototype automatically detects the presence of the finger and initiates an alcohol test. Once the spectral data have been collected, automated quality control metrics ensure that the test sample is a valid human finger and that all test parameters are within acceptable limits. An alcohol test result then is calculated and displayed on-screen. The prototype system is a stand-alone test unit with the sensor, data processing unit, and operating software fully contained inside the unit. For operation in benchmark testing, a PC-based application is run on an external computer and communicates with the prototype via a wired Ethernet connection. This setup allows for flexible configuration and data logging requirements for this phase of testing. All data collection, quality control
screening, and measurement calculations are performed within the prototype itself.
Figure 2. The Touch-based system currently being
studied (TruTouch). METHODS Participants A total of 10 healthy adult male and female volunteers between the ages of 21-40 were recruited via online advertisements to participate in the studies, for which they were compensated. Most individuals participated in more than one experiment, providing within-subject comparisons. All participants were well matched by age, sex, ethnicity, body mass index (BMI), and current alcohol consumption (Table 1). The protocol and informed consents were approved by the Partners Healthcare Institutional Review Board (IRB). Individuals received a full physical and mental evaluation before being admitted. On each test day, they received a breath alcohol test, a urine toxicology screen, and urine pregnancy test (women) – all had to be negative before the study could proceed.
Table 1. Demographic profile of participants in each of the drinking scenarios

6
Participants were not permitted to drive themselves to the laboratory but were instead required to take a taxicab. Participants were required to remain in the laboratory until their BAC dropped to below 0.04% and they were able to pass a field sobriety test. General Procedure Each of the scenarios involved inserting an indwelling intravenous catheter (Dakmed-Kowarski Thrombo-Resistant Catheter) into participants’ arms that was then attached to an exfusion pump and set to draw blood at a rate of 1 mL/min. Participants were seating in a comfortable recliner chair (except for the exercise scenario) while they had their blood sampled, breathed into the Auto-Liv and reference breath device, and placed the back of their index finger (first intermediate phalange) on the TruTouch device's touchpad. Blood Alcohol Concentrations Blood alcohol levels were analyzed in our laboratory (Penetar et al., 2008). Briefly, each sample was collected at either 2- or 5-minute intervals, transferred to a gray top blood collection tube (containing EDTA to prevent the blood from clotting), and then inverted 10 times to ensure proper mixing of the anticoagulant to ensure that a blood sample remained intact. Whole blood is extracted with an internal standard prepared in acid in the presence of sodium tungstate to precipitate out the proteins (Berkman et al., 1954). After centrifugation, the clear supernatant is transferred to vials, injected onto a gas chromatograph (GC) (Model 7890A, Agilent Technologies) and analyzed with the use of capillary chromatography and flame ionization detection (FID) (Folin and Wu, 1919). Intra-assay CVs were 1.61% and inter-assay CVs were 2.43% Tru-Touch Tissue Measurements At designated time intervals (approximately every 2 or 5 minutes), participants were instructed to place their index finger (using the limb that did not have the intravenous catheter inserted) on the touch pad and keep it there for approximately 30 - 60 seconds. Auto-Live Breath Measurements At the designated times (approximately every 2 or 5 minutes), participants were instructed to exhale towards the Auto-Liv collection funnel, capturing a relatively passive breath sample. Reference Breath Samples As an added control, breath samples were also collected via a hand-held research-grade device (Alco-Sensor FST®, Intoximeter Corp., St. Louis, MO) at the same time intervals as the other measures. Participants were required to breath directly into the mouthpiece at a steady force for at least 8 seconds.
Alcohol Dosing All participants were dosed on the basis of their body weight (0.9 g/kg). Drinks were prepared fresh immediately prior to the experiments and included 40% vodka that was either taken as straight shots or mixed with orange juice to maintain a total volume of 400 mL. As the drinking scenarios differed slightly, participants were provided specific instructions for the rate and volume of the beverage that was consumed (either as a large bolus dose or as three drinks spread out over the course of 90 minutes. Scenario #1—Lag Time Participants consumed the entire 0.9 g/kg dose in a rapid manner such that all alcohol was ingested by 90 seconds. Because of the artificial elevations in breath alcohol concentration due to buccal absorption, participants were provided with a plain water rinse before the first breath sample was taken. Furthermore, only the first sample after two minutes had passed was recorded. Scenario #2—Social Snacking Participants consumed the alcohol in three different episodes over a 90-minute period. During each drinking episode (that lasted 20 minutes), participants consumed 1/3 of the total dose and they were asked to snack on pretzels and Goldfish® crackers (for a total of 220 calories) while drinking. Scenario #3—Full Meal This protocol was similar to the social snacking except that the first 1/3 of the alcohol dose was consumed on an empty stomach. The next 1/3 of the total dose was consumed along with a first course of a typical breakfast (275 calories) consisting of an English muffin with butter and a cup of fruit. The last 1/3 dose was consumed along with the second course of the breakfast and consisted of an omelet with vegetables and cheese accompanied by a side order of two chicken sausages (375 calories for women, 500 calories for men). Scenario #4—Exercise (Simulated Dancing) This protocol involved having the participants consume the entire drink in a single bolus and then immediately engage in three bouts of exercise during which they maintained a steady energy expenditure of 450 kcal/hr by operating a recumbent elliptical machine. The first exercise episode lasted eight minutes, followed by a four-minute break to collect breath and tissue samples, followed by two additional four-minute exercise episodes with a four-minute break to collect samples. After the participant completed the exercise, they were moved to a comfortable chair where they remained for the duration of the study; blood, breath and tissue samples were sampled as before.

7
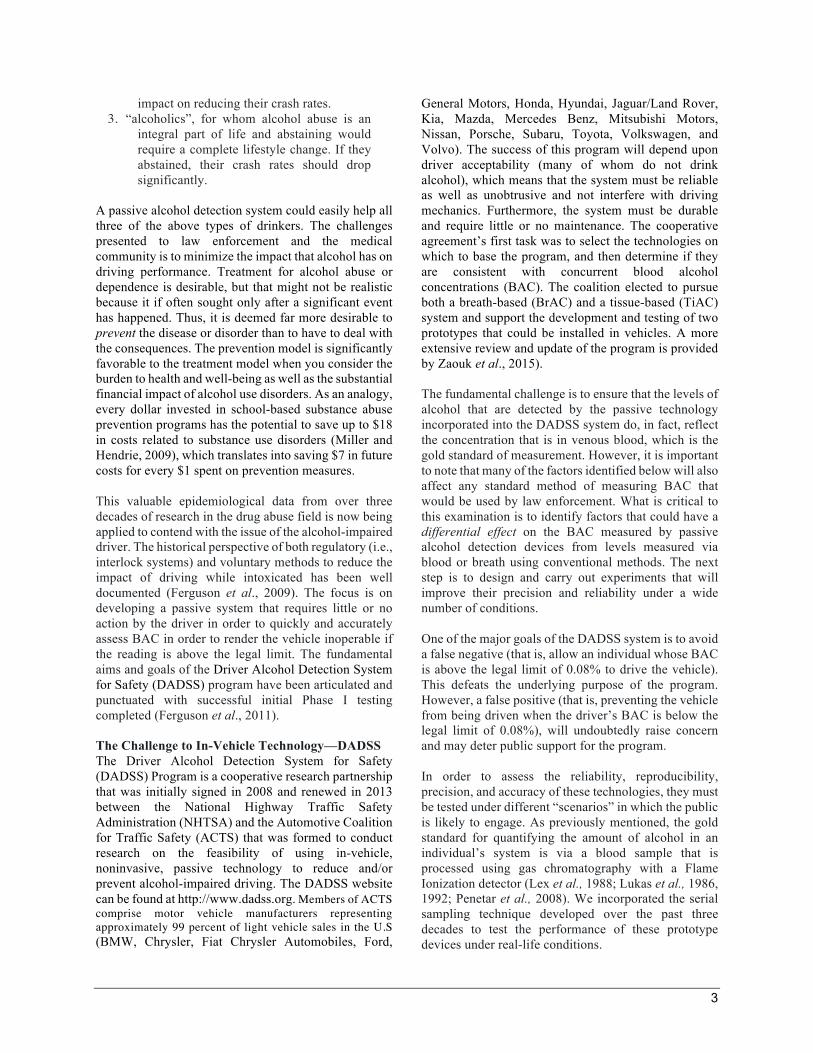
Scenario #5—Last Call This scenario was conducted by having the participants consume 2/3 of the total drink as a bolus beverage, and then wait for 70 minutes at which time the last 1/3 of the dose was consumed, also as a bolus. This last drink simulated a “last call” drink that would be consumed just before the individual would leave a bar and drive home. RESULTS General Results Alcohol concentration data points were averaged by compartment (i.e., blood, the two different breath, and tissue) across all participants and then were plotted over time. Scenario #1 Lag Time Results This experiment was conducted to determine in which of the compartments (blood, breath, or tissue) the alcohol would first appear after consuming a bolus dose of alcohol. However, because of the difficulties with breath sampling (due to buccal absorption), the accuracy of the lag time in breath was difficult to determine. As can be seen in Figure 3, the first appearance of alcohol in the breath was difficult to establish due to the very rapid rise in breath concentration immediately after consumption. Alcohol appeared in the blood within 6 minutes, but did not show up in tissue until 14 minutes had passed. Peak alcohol concentrations in blood and breath samples were attained between 1.25 and 1.5 hours after consumption, while the peak alcohol concentration in tissue occurred 15 to 20 minutes later. These differences were not significant.
Figure 3. Lag Time. Alcohol concentration/time curves in blood, breath and tissue after a bolus dose of 0.9 g/kg of alcohol.
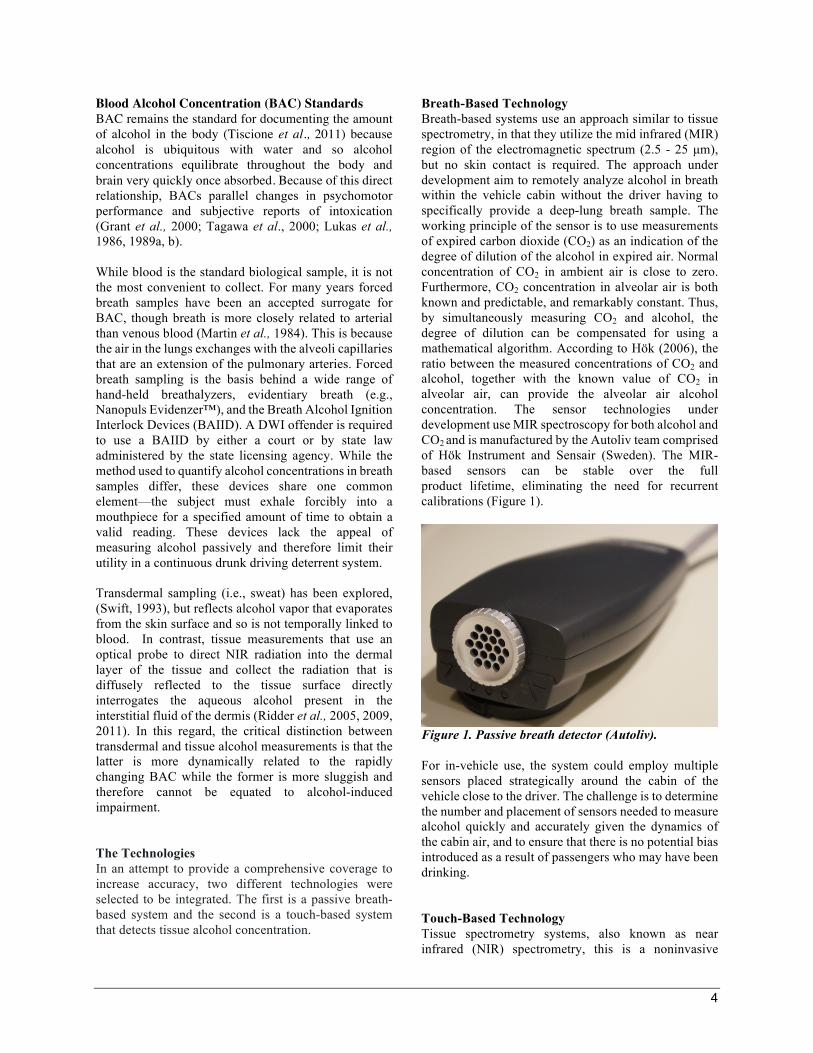
Scenario #2 Social Snacking Results This experiment was conducted to determine if alcohol concentrations are different in blood, breath, or tissue after consuming a small snack over an extended period of time. In addition, the participants were required to remain sedentary, which is designed to simulate drinking alcohol while sitting at a bar. Figure 4 depicts the alcohol concentration by time curves for each of the compartments. Note that because of the continuous snacking and drinking protocol, it was impossible to obtain accurate measures of breath and tissue, so only the blood alcohol concentrations were obtained throughout the snacking period. Breath and tissue samples were obtained between the two breaks from snacking; all samples were collected once the third epoch had finished.
Figure 4. Social Snacking. Alcohol concentration/ time curves in blood, breath and tissue during snacking and drinking a total dose of 0.9 g/kg of alcohol, distributed over three epochs. The rate of alcohol absorption during the social snacking scenario was significantly slower than the bolus drinking, but it must be remembered that the alcohol was consumed more slowly over a longer time interval. Even though the tissue sample at the 30-minute time point was higher than the other compartments, all achieved the same peak alcohol concentration within 10 to 15 minutes after the third epoch of drinking and snacking. Scenario #3 Full Meal Results This experiment was conducted to determine if alcohol concentrations in each of the three compartments are altered after consuming alcohol along with a full meal. As with the social snacking, the alcohol dose was divided into thirds, but in this scenario, they consumed the first 1/3 dose on an empty stomach. After a short break the they started to eat the first course of the meal while consuming 1/3 of the alcohol dose. Finally, after a second short break, they consumed the second course
0.00
0.02
0.04
0.06
0.08
0.10
0.12
0.14
0:10 0:26 0:42 0:58 1:14 1:30 1:46 2:02 2:18 2:34 2:50
%BAC
TimeAfterAlcoholAdministration(h:min)
BloodTruTouchAutoLivRefBrAC
Alcohol(0.9 g/kg)
0.00
0.02
0.04
0.06
0.08
0.10
0.12
0.14
0:15 0:35 0:55 1:15 1:35 1:55 2:15 2:35 2:55
%BAC
TimeAfterAlcoholAdministration(h:min)
BloodTruTouchAutoLivRefBrAC
Alcohol(0.34 g/kg);1stSnack
Alcohol(0.33 g/kg);2ndSnack
Alcohol(0.33 g/kg);3rdSnack

8
while simultaneously consuming the last third of the 0.9 g/kg dose of alcohol. Breath and tissue samples were collected during the breaks while blood samples were collected throughout the meal period.
Figure 5. Full Meal. Alcohol concentration/time curves in blood, breath and tissue during a full meal and drinking a total dose of 0.9 g/kg of alcohol, spaced over three epochs. Figure 5 shows the concentration/time curves for all compartments. The absorption rates were similar to those attained during the social snacking scenario, but the peak alcohol concentration after the full meal was lower than when the participants snacked. Scenario #4 Exercise Results This experiment was conducted to determine if alcohol concentrations in each compartment was affected by exercise. The use of a recumbent elliptical machine was selected for both safety and to simulate dancing with both arm and leg motion. Participants were given a bolus dose of alcohol to consume (as in the Lag Time experiment) and then engaged in three epochs of exercise. Participants were given two short breaks between exercising in order to permit collecting breath and tissue samples for alcohol determination. Figure 6 depicts the effects of exercise on alcohol concentrations in each of the compartments. The rate of alcohol absorption during exercising is steeper than the lag time control rate. In addition, the rate appears to accelerate as soon as the participants cease exercising. Peak alcohol concentrations were attained at about the same time after drinking (approximately 60-75 minutes) and the actual peak concentrations did not differ among the compartments.
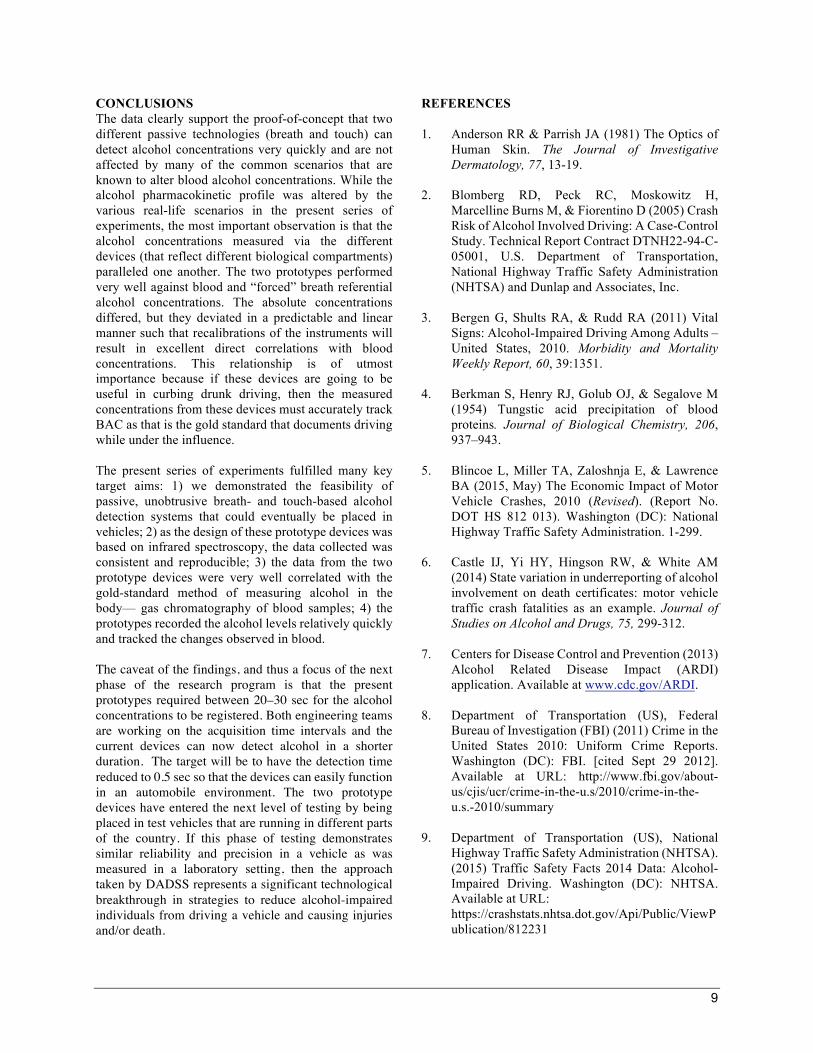
Figure 6. Exercise. Alcohol concentration/time curves in blood, breath and tissue after exercising and drinking a bolus dose of 0.9 g/kg of alcohol. Scenario #5 Last Call Results This experiment was conducted to determine the pharmacokinetic profile of drinking a last alcoholic beverage after peak alcohol concentrations had been attained from drinking earlier. Participants consumed 2/3 of the total dose as a bolus and then the last 1/3 (i.e., “last call”) when the distribution phase had been attained, approximately 70 minutes after the initial drink. The two breath-based devices recorded the artificially high concentrations right after drinking, but then returned to concentrations that were detected in blood and tissue (Figure 7). Consuming the last drink caused an immediate rise in alcohol concentration in all compartments.
Figure 7. Last Call. Alcohol concentration/time curves in blood, breath and tissue after in a simulated "Last call" scenario in which 1/3 of the dose was consumed 70 minutes after consuming 2/3 of the total dose of 0.9 g/kg of alcohol.
0.00
0.02
0.04
0.06
0.08
0.10
0.12
0.14
0:10 0:25 0:40 0:55 1:10 1:25 1:40 1:55 2:10 2:25 2:40 2:55
%BAC
TimeAfterAlcoholAdministration(h:min)
BloodTruTouchAutoLivRefBrAC
Alcohol(0.34 g/kg)
Alcohol(0.33 g/kg);1stCourse
Alcohol(0.33 g/kg);2ndCourse
0.00
0.02
0.04
0.06
0.08
0.10
0.12
0.14
0:10 0:26 0:42 0:58 1:14 1:30 1:46 2:02 2:18 2:34 2:50
%BAC
TimeAfterAlcoholAdministration(h:min)
BloodTruTouchAutoLivRefBrAC
0.00
0.02
0.04
0.06
0.08
0.10
0.12
0.14
0:10 0:26 0:42 0:58 1:14 1:30 1:46 2:02 2:18 2:34 2:50
%BAC
TimeAfterAlcoholAdministration(h:min)
BloodTruTouchAutoLivEvidenzer
Alcohol(0.33 g/kg)
Alcohol(0.64 g/kg)
9
CONCLUSIONS The data clearly support the proof-of-concept that two different passive technologies (breath and touch) can detect alcohol concentrations very quickly and are not affected by many of the common scenarios that are known to alter blood alcohol concentrations. While the alcohol pharmacokinetic profile was altered by the various real-life scenarios in the present series of experiments, the most important observation is that the alcohol concentrations measured via the different devices (that reflect different biological compartments) paralleled one another. The two prototypes performed very well against blood and “forced” breath referential alcohol concentrations. The absolute concentrations differed, but they deviated in a predictable and linear manner such that recalibrations of the instruments will result in excellent direct correlations with blood concentrations. This relationship is of utmost importance because if these devices are going to be useful in curbing drunk driving, then the measured concentrations from these devices must accurately track BAC as that is the gold standard that documents driving while under the influence. The present series of experiments fulfilled many key target aims: 1) we demonstrated the feasibility of passive, unobtrusive breath- and touch-based alcohol detection systems that could eventually be placed in vehicles; 2) as the design of these prototype devices was based on infrared spectroscopy, the data collected was consistent and reproducible; 3) the data from the two prototype devices were very well correlated with the gold-standard method of measuring alcohol in the body— gas chromatography of blood samples; 4) the prototypes recorded the alcohol levels relatively quickly and tracked the changes observed in blood. The caveat of the findings, and thus a focus of the next phase of the research program is that the present prototypes required between 20–30 sec for the alcohol concentrations to be registered. Both engineering teams are working on the acquisition time intervals and the current devices can now detect alcohol in a shorter duration. The target will be to have the detection time reduced to 0.5 sec so that the devices can easily function in an automobile environment. The two prototype devices have entered the next level of testing by being placed in test vehicles that are running in different parts of the country. If this phase of testing demonstrates similar reliability and precision in a vehicle as was measured in a laboratory setting, then the approach taken by DADSS represents a significant technological breakthrough in strategies to reduce alcohol-impaired individuals from driving a vehicle and causing injuries and/or death.
REFERENCES 1. Anderson RR & Parrish JA (1981) The Optics of
Human Skin. The Journal of Investigative Dermatology, 77, 13-19.
2. Blomberg RD, Peck RC, Moskowitz H,
Marcelline Burns M, & Fiorentino D (2005) Crash Risk of Alcohol Involved Driving: A Case-Control Study. Technical Report Contract DTNH22-94-C-05001, U.S. Department of Transportation, National Highway Traffic Safety Administration (NHTSA) and Dunlap and Associates, Inc.
3. Bergen G, Shults RA, & Rudd RA (2011) Vital
Signs: Alcohol-Impaired Driving Among Adults – United States, 2010. Morbidity and Mortality Weekly Report, 60, 39:1351.
4. Berkman S, Henry RJ, Golub OJ, & Segalove M
(1954) Tungstic acid precipitation of blood proteins. Journal of Biological Chemistry, 206, 937–943.
5. Blincoe L, Miller TA, Zaloshnja E, & Lawrence
BA (2015, May) The Economic Impact of Motor Vehicle Crashes, 2010 (Revised). (Report No. DOT HS 812 013). Washington (DC): National Highway Traffic Safety Administration. 1-299.
6. Castle IJ, Yi HY, Hingson RW, & White AM
(2014) State variation in underreporting of alcohol involvement on death certificates: motor vehicle traffic crash fatalities as an example. Journal of Studies on Alcohol and Drugs, 75, 299-312.
7. Centers for Disease Control and Prevention (2013)
Alcohol Related Disease Impact (ARDI) application. Available at www.cdc.gov/ARDI.
8. Department of Transportation (US), Federal
Bureau of Investigation (FBI) (2011) Crime in the United States 2010: Uniform Crime Reports. Washington (DC): FBI. [cited Sept 29 2012]. Available at URL: http://www.fbi.gov/about-us/cjis/ucr/crime-in-the-u.s/2010/crime-in-the-u.s.-2010/summary
9. Department of Transportation (US), National
Highway Traffic Safety Administration (NHTSA). (2015) Traffic Safety Facts 2014 Data: Alcohol-Impaired Driving. Washington (DC): NHTSA. Available at URL: https://crashstats.nhtsa.dot.gov/Api/Public/ViewPublication/812231
10
10. Department of Transportation (US), National Highway Traffic Safety Administration (NHTSA) (2016) Traffic Safety Facts: 2015 Motor Vehicle Crashes: Overview. Washington (DC): NHTSA. Available at URL: https://crashstats.nhtsa.dot.gov/Api/Public/ViewPublication/812318.
11. Ferguson SA, Traube E, Zaouk A, & Strassburger
R (2009) Driver Alcohol Detection System for Safety (DADSS) – A non-regulatory approach in the development and deployment of vehicle safety technology to reduce alcohol-impaired driving. In Proceedings of the 21st International Technical Conference on the Enhanced Safety of Vehicles (Stuttgart, Germany), pp. 09–0464.
12. Ferguson SA, Zaouk A, Dalal N, Strohl C, Traube,
E, & Strassburger R (2011) Driver Alcohol Detection System for Safety (DADSS) – Phase I Prototype testing and findings. In Proceedings of the 22rd International Technical Conference on the Enhanced Safety of Vehicles, (Washington, DC), pp. 11–0230.
13. Folin O & Wu H (1919) A system of blood
analysis. Journal of Biological Chemistry, 38, 81–87.
14. Grant SA, Millar K, & Kenny GN (2000) Blood
alcohol concentration and psychomotor effects. British Journal of Anaesthiology, 85, 401-416.
15. Hök B, Pettersson H, & Andersson G (2006)
Contactless measurement of breath alcohol. In Proceedings of the Micro Structure Workshop, Västerås, Sweden.
16. Hedlund JH (1994) If they didn’t drink, would
they crash anyway? – The role of alcohol in traffic crashes. Alcohol Drugs Driving, 110, 115-125.
17. Jones AW & Andersson L (2003) Comparison of
ethanol concentrations in venous blood and end-expired breath during a controlled drinking study. Forensic Science International, 132,18-25.
18. Lex BW, Greenwald N, Lukas SE, Slater J, &
Mendelson JH (1988) Blood ethanol levels, self-rated ethanol effects, and cognitive-perceptual tasks. Pharmacology Biochemistry and Behavior, 29, 509-515.
19. Lukas SE, Benedikt R, Mendelson JH, Kouri E, Sholar M, & Amass L (1992) Marihuana attenuates the rise in plasma ethanol levels in
human subjects. Neuropsychopharmacology, 7, 77-81.
20. Lukas SE, Lex BW, Slater J, Greenwald N, &
Mendelson JH (1989a) A microanalysis of ethanol-induced disruption of body sway and psychomotor performance in women. Psychopharmacology, 98, 169-175.
21. Lukas SE, Mendelson JH, Woods BT, Mello NK,
& Teoh SK (1989b) Topographic distribution of EEG alpha activity during ethanol-induced intoxication in women. Journal of Studies of Alcohol, 50, 176-185.
22. Lukas SE, Mendelson JH, Benedikt RA, & Jones
B (1986) EEG alpha activity increases during transient episodes of ethanol-induced euphoria. Pharmacology, Biochemistry & Behavior, 25:889-895.
23. Lukas SE, Mendelson JH, & Benedikt RA (1986)
Instrumental analysis of ethanol-induced intoxication in human males. Psychopharmacology, 89, 8-13.
24. Martin E, Moll W, Schmid P, & Dettli L (1984)
The pharmacokinetics of alcohol in human breath, venous and arterial blood after oral ingestion. European Journal of Clinical Pharmacology, 26, 619-626.
25. Miller TR & Hendrie D (2009) Substance abuse
prevention dollars and cents: A cost-benefit analysis. Substance Abuse and Mental Health Services Administration, Center for Substance Abuse Prevention. Rockville, MD: DHHS. Pub.No (SMA) 07-4298.
26. Miller JW, Naimi TS, Brewer RD, & Jones SE
(2006) Binge drinking and associated health risk behaviors among high school students. Pediatrics, 119, 76-85.
27. Naimi TS, Brewer RB, Mokdad A, Denny C,
Serdula MK, & Marks JS (2003) Binge drinking among U.S. Adults. Journal of American Medical Association, 289, 70–75.
28. National Highway Traffic Safety Administration
(2015) “The Economic and Societal Impact of Motor Vehicle Crashes, 2010 (Revised).” National Highway Traffic Safety Administration, DOT HS 812 013. http://www-nrd.nhtsa.dot.gov/Pubs/812013.pdf.

11
29. Penetar DM, McNeil JF, Ryan ET, & Lukas SE (2008) Comparison among plasma, serum, and whole blood ethanol concentrations: impact of storage conditions and collection tubes. Journal of Analytical Toxicology, 32, 505-10.
30. Ridder TD, Hendee SP, & Brown CD (2005)
Noninvasive alcohol testing using diffuse reflectance near-infrared spectroscopy. Applied Spectroscopy, 59, 181-189.
31. Ridder TD, Hull EL, Ver Steeg BJ, & Laaksonen
BD (2011) Comparison of spectroscopically measured finger and forearm tissue ethanol concentration to blood and breath ethanol measurements. Journal of Biomedical Optics, 16, 028003.
32. Ridder TD, Ver Steeg BJ, & Laaksonen BD (2009)
Comparison of spectroscopically measured tissue alcohol concentration to blood and breath alcohol measurements. Journal of Biomedical Optics, 14, 054039-1 – 11.
33. Romano E, Torres-Saavedra P, Voas RB, & Lacey
JH (2014) Drugs and alcohol: their relative crash risk. Journal of Studies of Alcohol and Drugs, 75, 56-64.
34. Stahre M, Brewer R, Naimi T, & Miller J (2004)
Alcohol-Attributable Deaths and Years of Potential Life Lost due to Excessive Alcohol Use in the U.S. Morbidity and Mortality Weekly Report, 53, 866-870.
35. Swift R (2000) Transdermal alcohol measurement
for estimation of blood alcohol concentration. Alcoholism Clinical & Experimental Research, 24, 422–423.
36. Tagawa M, Kano M, Okamura N, Itoh M, Sakurai
E, Watanabe T, & Yanai K (2000) Relationship Between Effects of Alcohol on Psychomotor Performances and Blood Alcohol Concentrations. Japanese Journal of Pharmacology, 83, 253-260.
37. Tiscione NB, Alford I, Yeatman DT, & Xiaoqin
Shan X (2011) Ethanol Analysis by Headspace Gas Chromatography with Simultaneous Flame-Ionization and Mass Spectrometry Detection. Journal of Analytical Toxicology, 35, 501-511.
38. Zaouk AK, Willis M, Traube E, & Strassburger R
(2015) Driver Alcohol Detection System for Safety (DADSS) – A Status Update. Presented to ESV 2015 Conference.