driver and vehicle behaviour to power train failures in electric vehicles experimental ...€¦ ·...
TRANSCRIPT
EVERSAFE
Everyday Safety for Electric Vehicles
Driver and vehicle behaviour to power train failures
in electric vehicles – experimental results of field
and simulator studies
Deliverable No. 2.1
Work Package No. 2
Work Package Title Vehicle stability and driver response
Editor Isabel Neuman ([email protected])
Authors Peter Cocron, Isabel Neumann, Maria Kreußlein, Marta Pereira, Daniel Wanner, Lars Drugge, Maxim Bierbach, Bruno Augusto
Status Final
Reviewed and approved for submission
Marcus Wisch (03/09/2014)
An ERA-Net collaborative project. Work programme:Electromobility +

Page 2 of 104
Document History Table
Version No.
Date Details
Page 3 of 104
List of abbreviations ANOVA Analysis of variance ANCOVA Analysis of covariance BASt Federal Highway Research Institute (Bundesanstalt für Straßenwesen) CG Control group ci Left wheel hub motor failure in a left curve (curve inward) CI Confidence interval co Right wheel hub motor in a left curve (curve outward) d Cohen’s measure of sample effect size for comparing two sample means df Degrees of freedom DRS Disturbance rating scale ESS Energy storage system EV Electric vehicle EVERSAFE Everyday Safety for Electric Vehicles e.g. Exempli gratia etc. Et cetera EG Experimental group f Cohens´s f: measure for effect sizefor ANOVA F F-Value ICE Internal combustion engine i.e. Id est km Kilometre KTH Royal Institute of Technology, Stockholm M Mean Max Maximum Min Minimum NASA-TLX Task load index of the National Aeronautics and Space Administration P Probability RB Regenerative braking RMANOVA Repeated-measures analysis of variance RMANCOVA Repeated-measures analysis of covariance s Seconds SD Standard deviation si Left wheel hub motor failure on a straight (straight inward) tACC Accelerator pedal reaction time tSW Steering wheel reaction time TUC Technische Universität Chemnitz VTI Swedish National Road and Transport Research Institute WHM Wheel hub motor φ Pitch angle of vehicle 𝜂𝑝
2 Measure of strength of partial Relationship
Δ Delta Φ Measure of association in contingency tables Ψ Yaw angle of vehicle
Page 4 of 104
Table of Contents
Everyday Safety for Electric Vehicles ...................................................................................... 1
Document History Table ........................................................................................................ 2
List of abbreviations .............................................................................................................. 3
List of Tables .......................................................................................................................... 6
List of Figures ........................................................................................................................ 8
EXECUTIVE SUMMARY .......................................................................................................... 11
1. Introduction ................................................................................................................. 13
1.1 Wheel hub motors ........................................................................................................ 13
1.2 Regenerative braking .................................................................................................... 14
1.3 Objectives ..................................................................................................................... 14
2. Definition of power train failure conditions affecting vehicle stability ........................... 15
2.1 Wheel hub motor failures ............................................................................................. 15
2.2 Regenerative braking failure......................................................................................... 17
3. Implementation of failure conditions ............................................................................ 18
3.1 Simulator study ............................................................................................................. 18
3.2 Field studies with modified electric vehicle ................................................................. 18
3.2.1 Field study wheel hub motor ............................................................................. 18
3.2.2 Field study regenerative braking ........................................................................ 19
4. Wheel hub motor failures: simulator study ................................................................... 20
4.1 Research objectives ...................................................................................................... 20
4.2 Method ......................................................................................................................... 20
4.2.1 Preparations ....................................................................................................... 21
4.2.2 Sample ................................................................................................................ 21
4.2.3 Procedure ........................................................................................................... 22
4.3 Results of the simulator study on wheel hub motor failures ....................................... 24
4.3.1 Subjective data ................................................................................................... 24 4.3.1.1 Failure perception ..................................................................................................................................... 24 4.3.1.2 Expectancy ................................................................................................................................................. 25 4.3.1.3 Perceived risk ............................................................................................................................................ 26 4.3.1.4 Perceived stress ......................................................................................................................................... 26 4.3.1.5 Controllability ............................................................................................................................................ 27 4.3.1.6 Subjective workload .................................................................................................................................. 29 4.3.1.7 Summary of subjective data ...................................................................................................................... 30
4.3.2 Objective data .................................................................................................... 31 4.3.2.1 Conventions ............................................................................................................................................... 31 4.3.2.2 Straight inward failure ............................................................................................................................... 32 4.3.2.3 Curve inward failure .................................................................................................................................. 35 4.3.2.4 Curve outward failure ................................................................................................................................ 39 4.3.2.5 Summary of objective data ........................................................................................................................ 43 4.4 Conclusion and discussion ............................................................................................ 43
4.4.1 Subjective data ................................................................................................... 43
4.4.2 Effect of failure position and curvature ............................................................. 44
4.4.3 Objective data .................................................................................................... 44
4.4.4 Implications ........................................................................................................ 45
5. Field study I: wheel hub motor failures ......................................................................... 46
5.1 Research objectives ...................................................................................................... 46
Page 5 of 104
5.2 Method ......................................................................................................................... 46
5.2.1 Sample ................................................................................................................ 46
5.2.2 Test vehicle ......................................................................................................... 47
5.2.3 Procedure ........................................................................................................... 48
5.2.4 Data collection .................................................................................................... 49
5.3 Results of the field study on wheel hub motor failures ............................................... 50
5.3.1 Subjective data ................................................................................................... 50 5.3.1.1 Failure perception ..................................................................................................................................... 50 5.3.1.2 Perceived risk ............................................................................................................................................ 51 5.3.1.3 Perceived stress ......................................................................................................................................... 52 5.3.1.4 Controllability ............................................................................................................................................ 53 5.3.1.5 Subjective workload .................................................................................................................................. 55 5.3.1.6 Summary subjective data .......................................................................................................................... 56
5.3.2 Objective data .................................................................................................... 57 5.3.2.1 Conventions ............................................................................................................................................... 57 5.3.2.2 Straight failure ........................................................................................................................................... 57 5.3.2.3 Curve inward failure .................................................................................................................................. 62 5.3.2.4 Curve outward failure ................................................................................................................................ 67 5.3.2.5 Summary results objective data ................................................................................................................ 71 5.4 Conclusion and discussion ............................................................................................ 72
6. Field study II: Regenerative braking failure ................................................................... 74
6.1 Research objectives ...................................................................................................... 74
6.2 Method ......................................................................................................................... 74
6.2.1 Test vehicle ......................................................................................................... 74
6.2.2 Test track ............................................................................................................ 75
6.2.3 Sample ................................................................................................................ 75
6.2.4 Procedure ........................................................................................................... 76 6.2.4.1 Part I .......................................................................................................................................................... 76 6.2.4.2 Part II ......................................................................................................................................................... 77 6.3 Results of the regenerative braking failure study ........................................................ 79
6.3.1 Subjective data ................................................................................................... 79 6.3.1.1 Failure notice/perception .......................................................................................................................... 79 6.3.1.2 Perceived risk ............................................................................................................................................ 79 6.3.1.3 Perceived stress ......................................................................................................................................... 81 6.3.1.4 Controllability ............................................................................................................................................ 83 6.3.1.5 Subjective workload .................................................................................................................................. 86 6.3.1.6 Summary of subjective data ...................................................................................................................... 88
6.3.2 Objective data .................................................................................................... 88 6.3.2.1 Conventions ............................................................................................................................................... 88 6.3.2.2 Accelerator pedal behaviour ..................................................................................................................... 89 6.3.2.3 Brake pedal behaviour ............................................................................................................................... 91 6.3.2.4 Steering behaviour .................................................................................................................................... 92 6.3.2.5 Lateral acceleration ................................................................................................................................... 94 6.3.2.6 Reaction times ........................................................................................................................................... 97 6.3.2.7 Vehicle and driver behaviour..................................................................................................................... 98 6.3.2.8 Summary objective data ............................................................................................................................ 99 6.4 Conclusion and discussion .......................................................................................... 100
7. Final discussion .......................................................................................................... 101
7.1 Future research ........................................................................................................... 101
7.2 References .................................................................................................................. 103
Page 6 of 104
List of Tables Table 1. Overview of conducted driving studies within work package 2 of EVERSAFE. ....................... 15 Table 2. Failure conditions of the simulator trials. ............................................................................... 16 Table 3. Failure conditions of the field study with WHM failures. ....................................................... 16 Table 4. RB failure conditions. .............................................................................................................. 17 Table 5. Manipulated order for the simulator study on WHM failures. ............................................... 21 Table 6. Variables which were assessed with questionnaires. ............................................................. 24 Table 7. Results of repeated-measures ANCOVA for a comparison of baseline and failure for si accelerator pedal behaviour (covariate = initial accelerator pedal behaviour). ................................... 32 Table 8. Results of repeated-measures ANCOVA for a comparison of baseline and failure si driving (covariate = initial steering wheel angle). ............................................................................................. 33 Table 9. Accelerator pedal and steering wheel driver reaction times for failure condition si. ............ 34 Table 10. Results of repeated-measures ANCOVA for a comparison of baseline and failure ci accelerator pedal behaviour (covariate = initial accelerator pedal behaviour). .................................. 35 Table 11. Results of repeated-measures ANCOVA for a comparison of baseline and failure ci driving (covariate = initial steering wheel angel). ............................................................................................. 36 Table 12. Accelerator pedal and steering wheel driver reaction times for failure condition ci. .......... 37 Table 13. Results of repeated-measures ANCOVA for a comparison of baseline and failure co accelerator pedal behaviour (covariate = initial accelerator pedal behaviour). .................................. 39 Table 14. Results of repeated-measures ANCOVA for a comparison of baseline and failure co driving (covariate = initial steering wheel angle). ............................................................................................. 40 Table 15. Accelerator pedal and steering wheel driver reaction times for failure conditions co. ....... 41 Table 16. Accelerator pedal and steering wheel driver reaction times for the three failure conditions in the simulator study. .......................................................................................................................... 43 Table 17. Sociodemographic data for control and experimental group (N = 51). ................................ 47 Table 18. Different orders implemented for failure activation. ........................................................... 48 Table 19. Failure perception of the first failure for each failure type. ................................................. 51 Table 20. Results of RMANCOVA regarding accelerator pedal behaviour for si failure (covariate = initial accelerator pedal behaviour). ..................................................................................................... 57 Table 21. Results of RMANCOVA regarding brake pedal behaviour for si failure (covariate = initial brake pedal behaviour). ........................................................................................................................ 58 Table 22. Results of RMANCOVA regarding steering behaviour for si failure (covariate = initial steering wheel angle). ........................................................................................................................... 59 Table 23. Reaction times for accelerator pedal position and steering wheel angle of si. .................... 60 Table 24. Results of RMANCOVA regarding accelerator pedal behaviour for ci failure (covariate = initial accelerator pedal behaviour). ..................................................................................................... 62 Table 25. Results of RMANCOVA regarding brake pedal behaviour for ci failure (covariate = initial brake pedal behaviour). ........................................................................................................................ 63 Table 26. Results of RMANCOVA regarding steering behaviour for ci failure (covariate = initial steering wheel angle). ........................................................................................................................... 64 Table 27. Reaction times for accelerator pedal position and steering wheel angle of ci. .................... 65 Table 28. Results of RMANCOVA regarding accelerator pedal behaviour for co failure (covariate = initial accelerator pedal behaviour). ..................................................................................................... 68 Table 29. Results of RMANCOVA regarding brake pedal behaviour for co failure (covariate = initial brake pedal behaviour). ........................................................................................................................ 68 Table 30. Results of RMANCOVA regarding steering behaviour for co failure (covariate = initial steering wheel angle). ........................................................................................................................... 69 Table 31. Reaction times for accelerator pedal position and steering wheel angle of co. ................... 70 Table 32. Reaction times for accelerator pedal position and steering wheel angle of the three failures during the field study. ........................................................................................................................... 72
Page 7 of 104
Table 33. Sociodemographic data for control and experimental group. .............................................. 76 Table 34. Overview of test runs and failure activation. ........................................................................ 78 Table 35. Number of participants who noticed the RB failure. ............................................................ 79 Table 36. Results of RMANCOVA regarding accelerator pedal usage (covariate = initial accelerator pedal pressure). ..................................................................................................................................... 89 Table 37. Brake pedal usage in baseline and during failure activation (Δ 5 bar = brake reaction). ..... 91 Table 38. Results of RMANCOVA regarding brake pedal usage when RB failure was active (covariate = initial brake pedal pressure). ................................................................................................................ 91 Table 39. Results of RMANCOVA regarding steering behaviour (covariate = initial steering wheel angle, 0-4 sec, 10 Hz). ........................................................................................................................... 92 Table 40. Results of RMANCOVA regarding steering behaviour (braking vs. no braking participants, covariate = initial steering wheel angle, 0-4 sec). ................................................................................. 94 Table 41. Results of RMANCOVA regarding lateral acceleration (covariate = initial lateral acceleration, 0-4 sec, 10 Hz). ................................................................................................................ 95 Table 42. Results of RMANCOVA regarding lateral acceleration comparing braking and not braking participants (covariate = initial lateral acceleration, 0-4 sec, 20 Hz.) ................................................... 96 Table 43. Brake pedal reaction times for the RB study. ....................................................................... 97
Page 8 of 104
List of Figures Figure 1. Torque characteristics of an electrical machine. ................................................................... 16 Figure 2. Implementation of auxiliary brake system on the rear axle of the Mitsubishi iMiEV. .......... 19 Figure 3. Driver cabin of the VTI moving base driving simulator. ......................................................... 21 Figure 4. Level of education for the sample. ........................................................................................ 22 Figure 5. Screenshot of the video that was shown to the participants. ............................................... 23 Figure 6. Procedure of the simulator experiment. ............................................................................... 23 Figure 7. Frequency of acknowledged unusual events. ........................................................................ 25 Figure 8. Frequency of expectancy ratings over different failure types (1 – “not expected at all” to 5 – “totally expected“). ............................................................................................................................... 25 Figure 9. Evaluation of risk (1 – “not risky at all” to 5 – “very risky”) in baseline and failure conditions for the different failure types (si, ci, co). .............................................................................................. 26 Figure 10. Evaluation of stress (1 – “no stress” to 5 – “high stress”) in baseline and failure conditions for the different failure types (si, ci, co). .............................................................................................. 27 Figure 11. Evaluation of control (1 - “driver has full control” to 10 - “driver has no control”) in baseline and failure conditions for the different failure types (si, ci, co). ............................................ 28 Figure 12. Disturbance Rating Scale (Neukum & Krüger, 2003). .......................................................... 28 Figure 13. Evaluation of disturbance (0 – “not noticeable” to 10 – “not controllable”) in failure conditions for the different failure types (si, ci, co).............................................................................. 29 Figure 14. Item for the subscale mental demand for the NASA-TLX (Hart & Staveland, 1988). .......... 29 Figure 15. Workload scores in baseline and failure conditions for the different failure types (si, ci, co). .............................................................................................................................................................. 30 Figure 16. Vehicle trajectory after the activation of the different failure types (Green line represents normal trajectory. Red line represents possible trajectory under failure conditions without the intervention of the driver.). Left: si, middle: ci, right: co. ..................................................................... 31 Figure 17. Proportion of maximum accelerator pedal travel for baseline and 3 seconds failure activation period for si WHM failures. .................................................................................................. 32 Figure 18. Steering wheel for baseline and 3 seconds failure activation period for si WHM failures. . 33 Figure 19. Accelerator pedal and steering angle input for baseline and si and their rate difference with failure activation at t = 0 s. ........................................................................................................... 34 Figure 20. Vehicle responses of baseline (blue) and failure condition si (red) with failure activation at t = 0 s (black line) and the reaction times (black dashed lines). ........................................................... 35 Figure 21. Proportion of maximum accelerator pedal travel baseline and 3 seconds failure activation period for ci WHM failures.................................................................................................................... 36 Figure 22. Steering wheel angle for baseline and 3 seconds failure activation period for ci WHM failures. ................................................................................................................................................. 37 Figure 23. Accelerator pedal and steering angle input for baseline and ci and their rate difference with failure activation at t = 0 s. ........................................................................................................... 38 Figure 24. Vehicle responses of baseline (blue) and failure condition ci (red) with failure activation at t = 0 s (black line) and the reaction times (black dashed lines). ........................................................... 39 Figure 25. Proportion of maximum accelerator pedal travel for baseline and 3 seconds failure activation period for co WHM failures. ................................................................................................ 40 Figure 26. Steering wheel angle for baseline and 3 seconds failure activation period for co WHM failures. ................................................................................................................................................. 41 Figure 27. Accelerator pedal and steering angle input for baseline and co and their rate difference with failure activation at t = 0 s. Red lines represent reaction bands, red star markers highlight mean reaction time of each parameter and dash-dotted grey lines represent baseline thresholds. ............ 42 Figure 28. Vehicle responses of baseline (blue) and failure condition co (red) with failure activation at t = 0 s (black line) and the reaction times (black dashed lines). ........................................................... 43 Figure 29. Test vehicle Mitsubishi iMiEV. ............................................................................................. 47
Page 9 of 104
Figure 30. Test track. ............................................................................................................................. 48 Figure 31. Procedure of test track study I on WHM failures. ............................................................... 49 Figure 32. Perspectives recorded with the camera system. Upper left = control box to check brake pressure, upper right = driver, lower left = foot well, lower right = frontal view................................. 50 Figure 33. Evaluation of risk (1 - “not risky at all” to 5 -“very risky”) for baseline condition and during WHM failure activation (si, ci, co). ........................................................................................................ 52 Figure 34. Evaluation of stress (1 - “no stress at all” to 5 - “very high stress”) for baseline condition and during WHM failure activation (si, ci, co). ..................................................................................... 53 Figure 35. Evaluation of lack of control (1 - “full control” to 10 - “no control”) for baseline condition and during WHM failure activation (si, ci, co). ..................................................................................... 54 Figure 36. Subjective disturbance (1 - “no disturbance” to 10 - “vehicle not under control”) during WHM failure activation (si, ci, co). ........................................................................................................ 55 Figure 37. Subjective workload for baseline condition and while WHM failure activation (si, ci, co). 56 Figure 38. Proportion of maximum accelerator pedal travel for baseline and failure conditions and while first second of failure activation for si WHM failure. .................................................................. 58 Figure 39. Brake pedal pressure for baseline condition and while the first second of failure activation for si WHM failure. ................................................................................................................................ 59 Figure 40. Steering wheel angle for baseline condition and while first second of failure activation for si WHM failure. ..................................................................................................................................... 60 Figure 41. Accelerator pedal and steering angle input for baseline and si and their rate difference with failure activation at t = 0 s. ........................................................................................................... 61 Figure 42. Vehicle responses of baseline (blue) and failure condition si (red) with failure activation at t = 0 s (black line) and the reaction times (black dashed lines). ........................................................... 62 Figure 43. Proportion of maximum accelerator pedal travel for baseline condition and while first 3 seconds of failure activation for ci WHM failure. ................................................................................. 63 Figure 44. Brake pedal pressure for baseline condition and while first 3 seconds of failure activation for ci WHM failure. ................................................................................................................................ 64 Figure 45. Steering wheel angle for baseline condition and while first 3 seconds of failure activation for ci WHM failure. ................................................................................................................................ 65 Figure 46. Accelerator pedal and steering angle input for baseline and ci and their rate difference with failure activation at t = 0 s. ........................................................................................................... 66 Figure 47. Vehicle responses of baseline (blue) and failure condition ci (red) with failure activation at t = 0 s (black line) and the reaction times (black dashed lines). ........................................................... 67 Figure 48. Proportion of maximum accelerator pedal travel for baseline condition and while first 3 seconds of failure activation for co WHM failure. ................................................................................ 68 Figure 49. Brake pedal pressure for baseline condition and while first 3 seconds of failure activation for co WHM failure. .............................................................................................................................. 69 Figure 50. Steering wheel angle for baseline condition and while first 3 seconds of failure activation for co WHM failure. .............................................................................................................................. 70 Figure 51. Accelerator pedal and steering angle input for baseline and co and their rate difference with failure activation at t = 0 s. ........................................................................................................... 71 Figure 52. Vehicle responses of baseline (blue) and failure condition co (red) with failure activation at t = 0 s (black line) and the reaction times (black dashed lines). ........................................................... 72 Figure 53. Camera Perspectives recorded with the system. Upper left = control box to check brake pressure, upper right = speedometer, lower left = foot well, lower right = frontal view. ................... 74 Figure 54. Preparation of the test track. ............................................................................................... 75 Figure 55. Route for the familiarisation drive. ...................................................................................... 77 Figure 56. Aerial view of the test track at Jahnsdorf airport. ............................................................... 78 Figure 57. Procedure of field study II on RB failure. ............................................................................. 78 Figure 58. Evaluation of risk (1 – “not risky at all” to 5 – “very risky”) in baseline and failure conditions for the different groups (info and no info) including all subjects. ...................................... 80
Page 10 of 104
Figure 59. Evaluation of risk (1 – “not risky at all” to 5 – “very risky”) in baseline and failure conditions for the different groups (info and no info) including only subjects noticing the failure. ... 81 Figure 60. Evaluation of stress (1 – “no stress at all” to 5 – “very high stress”) in baseline and failure conditions for the different groups (info and no info) including all subjects. ...................................... 82 Figure 61. Evaluation of stress (1 – “no stress at all” to 5 – “very high stress”) in baseline and failure conditions for the different groups (info and no info) including only subjects noticing the failure. ... 83 Figure 62. Evaluation of control (1 - “driver has full control” to 10 - “driver has no control”) in baseline and failure condition for the different groups (info and no info) including all subjects. ....... 84 Figure 63. Evaluation of control (1 - “driver has full control” to 10 - “driver has no control”) in baseline and failure condition for the different groups (info and no info) including only subjects noticing the failure. ............................................................................................................................... 85 Figure 64. Evaluation of disturbance (0 – “driver has full control” to 10 - “driver has no control”) in failure condition for the different groups (info and no info). ............................................................... 86 Figure 65. Workload scores in baseline and failure conditions for the different groups (info and no info) including all subjects..................................................................................................................... 87 Figure 66. Workload scores in baseline and failure conditions for the different groups (info and no info) including only subjects noticing the failure. ................................................................................. 88 Figure 67. Proportion of maximum accelerator pedal travel for baseline and a 4 seconds period after failure activation for the different groups (info and no info). .............................................................. 90 Figure 68. Proportion of maximum accelerator pedal travel for baseline and a 4 seconds period after failure activation for the different groups (info and no info). .............................................................. 90 Figure 69. Brake pressure (bar) in failure condition over a 4 seconds period after failure activation of braking (N = 19) and not braking participants (N = 23) and individual braking behaviour of braking participants marked in grey. ................................................................................................................. 92 Figure 70. Evaluation of steering behaviour (degree) in baseline condition over a 4 seconds period after failure activation for the different groups (info and no info). ..................................................... 93 Figure 71. Evaluation of steering behaviour (degree) in failure condition over a 4 seconds period after failure activation in round 1 for the different groups (info and no info). .................................... 93 Figure 72. Evaluation of steering behaviour (degree) in failure condition in round 1 for braking and not braking participants. ....................................................................................................................... 94 Figure 73. Evaluation of lateral acceleration (m/s2) in baseline condition over a 4 seconds period after failure activation for the different groups (info and no info). ..................................................... 95 Figure 74. Evaluation of lateral acceleration (m/s2) in failure condition in round 1 over a 4 seconds period after failure activation for the different groups (info and no info). .......................................... 96 Figure 75. Evaluation of lateral acceleration (m/s2) in failure condition over a 4 seconds period after failure activation in round 1 for braking and not braking participants. ............................................... 97 Figure 76. Drivers using the brake pedal during RB failure. ................................................................. 98 Figure 77. Vehicle behaviour for a RB failure without prior knowledge of the failure. Baseline (blue), failure condition (red) with failure activation at t = 0 s. ....................................................................... 98 Figure 78. Vehicle behaviour for a RB failure with prior knowledge of the failure. Baseline (blue), failure condition (red) with failure activation at t = 0 s. ....................................................................... 99
Page 11 of 104
EXECUTIVE SUMMARY New electric power trains can be subject to different failures when compared to those arising in conventional vehicles. The objectives for active safety investigations within the EVERSAFE project (work package 2) were to address vehicle stability under these failure conditions and the driver response to relevant types of failures. Failure conditions that affect the vehicle stability are believed to be significantly different from today’s conventional internal combustion engine cars, and may potentially be a substantial safety problem if not treated in a correct manner. To study these effects, two examples of system failures and their consequences on the driver response and vehicle stability were investigated with the help of three studies. The first two studies investigated a failure of wheel hub motors (WHMs), an emerging technology among the future generation of electric vehicles (EV). The main benefits of a WHM are its controllability, high efficiency, high power density and low weight. However, the direct connection to the wheel comes along with the potential disadvantage in case a failure occurs in the system. Therefore, those WHM failures are to be analysed in this study. A possible failure with severe consequences to the driving task could be a constant brake torque applied to one of the wheels, which leads to a sudden yaw torque and subsequently to a deviation from the desired path of driving. As a consequence, a compensatory control action by the driver is necessary. The impact of this failure of WHMs on the drivers was assessed twofold in the EVERSAFE project. On the one hand a driving simulator study investigated the impact of WHM failures under high speed conditions (110 km/h). On the other hand these failures were investigated in a test track study at lower speeds (30 km/h). Both studies examined the following three manoeuvres: a failure while straight line driving as well as two failures while driving in a curve, i.e. on the inner and the outer rear wheel respectively. Drivers were asked to evaluate the failure situation regarding perceived stress, risk, lack of control, workload and disturbance. Furthermore, objective data collected via the data logger (steering wheel angle, accelerator pedal travel, brake pressure, speed, yaw rate, longitudinal and lateral acceleration) contributed to shed light on the driver response and vehicle stability. The results of the subjective ratings of both studies revealed a low to medium level of perceived failure severity for all tested failures. It can be concluded from the outcomes of the simulator study, that WHM failures at speeds of 110km/h are rated more stressful, risky, disturbing and demanding than driving without an occurring failure. With regard to the test track study these differences occurred only for the straight inward failure. Comparing the subjective evaluations in the simulator and the field study, it can be assumed that failures are perceived as more severe at higher than at lower speeds. The simulator study showed steering as the main reaction to all failures. Regarding the test track study a steering reaction was only detected for the curve inward failure. Consequently, the outcomes of the subjective evaluations of the simulator study and driving data of both studies lead to the assumption that the curve inward failure is the most severe amongst the failures tested here. As participants in both studies used the accelerator pedal during failure activation, regardless of failure type, it could be concluded that drivers try to overrule the deceleration triggered by the failure at low as well as at high speeds. Whether this was an effect of the instruction to maintain a steady speed should be clarified by further research. Generally speaking, results of both studies showed that humans can compensate WHM failures well, at least for the specific settings of the studies. However, further research is needed to investigate if and how these conclusions are applicable, for instance, in case of a higher workload of the driver (e.g., in more complex driving situations). The third study conducted within the active safety focus of the EVERSAFE project examined a failure of the regenerative braking (RB) system. The latter is a system designed to convert kinetic energy to chemical energy stored in the energy storage system (i.e. battery) while the vehicle decelerates. In the tested configuration this energy recapture is triggered via the accelerator pedal and therefore decelerates the car whenever the driver releases that actuator. In case the RB system fails to operate properly, hazardous situations might occur because the driver expects a deceleration of the car which is inexistent due to the failure. In order to study the effects of a RB failure on driver
Page 12 of 104
behaviour and perception as well as on vehicle stability, a test track study was conducted. Similar to the WHM failure testing, the failure situation was evaluated with the help of subjective ratings (stress, risk, lack of control, disturbance, workload) and data logger records (steering wheel angle, accelerator pedal travel, brake pedal pressure, speed, yaw rate, longitudinal and lateral acceleration). The RB failure was implemented during a deceleration manoeuvre when entering a curve at a speed of about 50 km/h. Whereas half of the participants were informed that a RB failure might occur, the other half was not informed. Results revealed that only about 50% of the subjects noticed the RB failure, but compensation efforts were manageable. Although the situation was rated more risky than solely driving on a road, the RB failure did not induce more stress or workload. Informing people about an upcoming failure yielded a higher frequency of mild braking manoeuvres. It is important to note that failure of RB system will incur in higher vehicle speeds than the ones originally expected by the driver under normal circumstances. Depending on the road conditions (e.g., wet/icy surface) or even the road geometry (e.g., curve driving) the unexpected high velocity might even lead to vehicle instability thus compromising the safety of the occupants as well as the general traffic flow. These aspects should be considered in future research.
Page 13 of 104
1. INTRODUCTION
Electric power trains can be subject to different types of failures when compared to those arising in conventional vehicles. Failure conditions that affect vehicle stability are believed to be significantly different from today’s conventional internal combustion engine (ICE) vehicles, and may potentially be a substantial safety problem if not treated in a correct manner (Jonasson & Wallmark, 2008). As part of the active safety investigations performed in EVERSAFE the vehicle stability and driver response were analysed for these specific types of power train failures. To study these effects, two examples of system failures – both of them unique for EVs – and their implications on the driver and the driving task were investigated. A power train failure due to a failure condition of a wheel hub motor (WHM) is one condition addressed within EVERSAFE. The second one is the effect of a regenerative braking (RB) system failure. Several studies investigated the impact of system failures on the driver with focus on ICE vehicles and it is therefore important to connect the running work with previous research. For example, studies at Darmstadt and Würzburg University (Wesp, 2011; Neukum, Ufer, Paulig, & Krüger, 2008) investigated the connection between steering actuator failures, vehicle dynamics and driver behaviour for active front-wheel steering and rear-wheel steering systems. While the problem itself is not transferable, the methodologies developed within these research projects can also be applied to the research questions posed here.
1.1 Wheel hub motors
WHMs are presented as one alternative to conventional vehicle drivelines for the propulsion of electric vehicles (EVs). These are characterized by a high energy density and efficiency as well as low weight when compared to the current propulsion systems. WHMs have several advantages. Improved control of the wheel torques, increased flexibility of vehicle design due to small packaging, integration of RB as well as weight and cost reductions due to elimination of mechanical components like transmission, differential, drive shafts are some of them. One known disadvantage is the higher unsprung mass, which leads to reduced vehicle handling and comfort performance. Another potential disadvantage is the effect of a failure in the system. This can act directly on the wheel and is therefore to be analysed in this study (Borchardt, Kasper, & Heinemann, 2012). As a new technology, the consequences of potential failures are still not well defined. These can possibly affect vehicle stability in ways not comparable to failures in common ICE vehicles. For example, a possible WHM failure could be represented by a constant brake torque applied to only one of the wheels. This would lead to a sudden yaw torque and a necessary control action by the driver to compensate for this unexpected vehicle behaviour. The impact of this and other possible failures of WHMs on the driver and vehicle stability were assessed in this work. Little work has been published on the topic of WHMs and their impact on vehicle safety. Three studies (Jonasson & Wallmark, 2007; Euchler, Bonitz, Mitte, & Geyer, 2010; Wanner, Drugge & Stensson Trigell, 2014) investigated the vehicle behaviour due to WHM failures, but solely with open-loop simulations. In all studies the interaction with the driver was ignored, which could indeed help to stabilise a vehicle, but also worsen the situation.
Page 14 of 104
1.2 Regenerative braking
A main characteristic of EVs is their RB system, which is designed to convert kinetic energy into chemical energy stored in the energy storage system (i.e. batteries) while the vehicle decelerates. As a consequence, energy can be saved and vehicle emissions can be reduced (Clarke, Muneer, & Cullinane, 2010). Generally, the system can be triggered via accelerator pedal, brake pedal or both pedals. Depending on the intensity of the drag torque, the deceleration caused by RB considerably affects the driving task. Previous studies revealed that drivers quickly adapt to driving with a RB system which is triggered via accelerator pedal (Cocron et al., 2013; Witzlack, Cocron, & Krems, 2014; Schmitz, Maag, Jagiellowicz, & Hanig, 2013). As a consequence drivers also learn to rely on the deceleration caused by the RB system. If an accelerator pedal triggered RB system fails to operate when the driver expects deceleration, or if additional braking torque is needed for intense braking manoeuvres, this can lead to hazardous situations in traffic. The driver needs to quickly overtake the action originally executed by the vehicle, i.e. the deceleration of the car (takeover situations).
1.3 Objectives
This deliverable focuses on failures in the electric propulsion system that will affect the vehicle behaviour, thus require an intervention by the driver and consequently impair traffic safety. The work is initiated by the identification of diverse propulsion failures that lead to stability problems. As the driver is a key component for traffic safety, it is of great importance to study the driver behaviour during vehicle failures. Hence, the reaction of the driver to the failure mode was investigated in three experiments:
Study 1: WHM failures tested in a simulator Study 2: WHM failures tested on a test track Study 3: RB failures tested on a test track
Field tests enable a close to real setting while simulator tests enable high repeatability as well as the possibility to simulate extreme and, in real life, dangerous settings. The main objective of work package 2 of the EVERSAFE project was to analyse driver reactions to different failure conditions in an EV that influence vehicle stability. Requirements for vehicle stability under failure conditions were derived and delivered.
Page 15 of 104
2. DEFINITION OF POWER TRAIN FAILURE CONDITIONS AFFECTING VEHICLE STABILITY
This section describes the different failure conditions implemented and tested in the conducted experiments at the moving base driving simulator as well as in the modified electric vehicle (EV) on the test track. As a main objective, each failure condition had to have a distinct influence on the vehicle stability during normal driving. Three different scenarios and appropriate failure conditions were defined based on work done within work package 4 of the EVERSAFE project (problem identification and assessment; Häring & Kanat, 2013). High speed manoeuvres were exclusively tested in the driving simulator, while urban speed manoeuvres were merely allocated to the experiments on the test track with the EV. The failure conditions were separated into failures that represent wheel hub motor (WHM) failures, thus occurring on one of the four wheels, and a regenerative braking (RB) failure. Table 1 gives an overview of the different studies that were conducted in work package 2.
Table 1. Overview of conducted driving studies within work package 2 of EVERSAFE.
Name of
study Simulator study WHM Field study WHM Field study RB
Environment Moving base driving
simulator Closed test track with
modified EV
Closed test track with
modified EV
Scenario Country
road/ motorway Urban Urban
Target speed 110 km/h 30 km/h 50 km/h
Failure type WHM failure (1 wheel) WHM failure (1 wheel) RB failure (2 or 4 wheels)
2.1 Wheel hub motor failures
Failures in the power train affecting drivability were determined. As most considered failure conditions occur in or have an effect on the WHM, in this document the term WHM failure is used for all power train failures that lead to a failure condition on one of the four wheels. These failure conditions, for instance no torque on one of the four wheels, act in different ways on the vehicle stability. The different types of electrical faults in the power train of an EV that lead to WHM failures were collected and classified into various failure conditions according to Wanner et al. (2014). The two failure modes that were selected are an inverter shutdown and a three-phase balanced short circuit. They were selected mainly because of their strong influence on the wheel torque when occurring at certain speeds. Both these conditions induce a brake torque applied to the wheel under consideration, which can incur disastrous circumstances for vehicle stability. In the simulator study, the failure conditions (Table 2) were chosen according to the motorway speed of 110 km/h. The selected failure mode for this study was an inverter shutdown. This failure mode occurs when the gate signal for the power transistor device vanishes. There are several reasons that initiate an inverter shutdown, for instance a signal-cable breakdown or a loss of power to the control circuit. This failure serves mainly as protection circuit of the inverter in the event of an over-current or over-heating condition. Thus, it is a failure that is internally triggered, if such an abnormal situation is detected and is one of the more common sources for a failure. If it occurs in the field-weakening range, the WHM delivers a speed dependent braking torque. The field weakening range is defined as the working area of the electrical machine above its nominal speed. In this area, the inverter will produce a magnetic field counteracting the natural magnetic field of the
Page 16 of 104
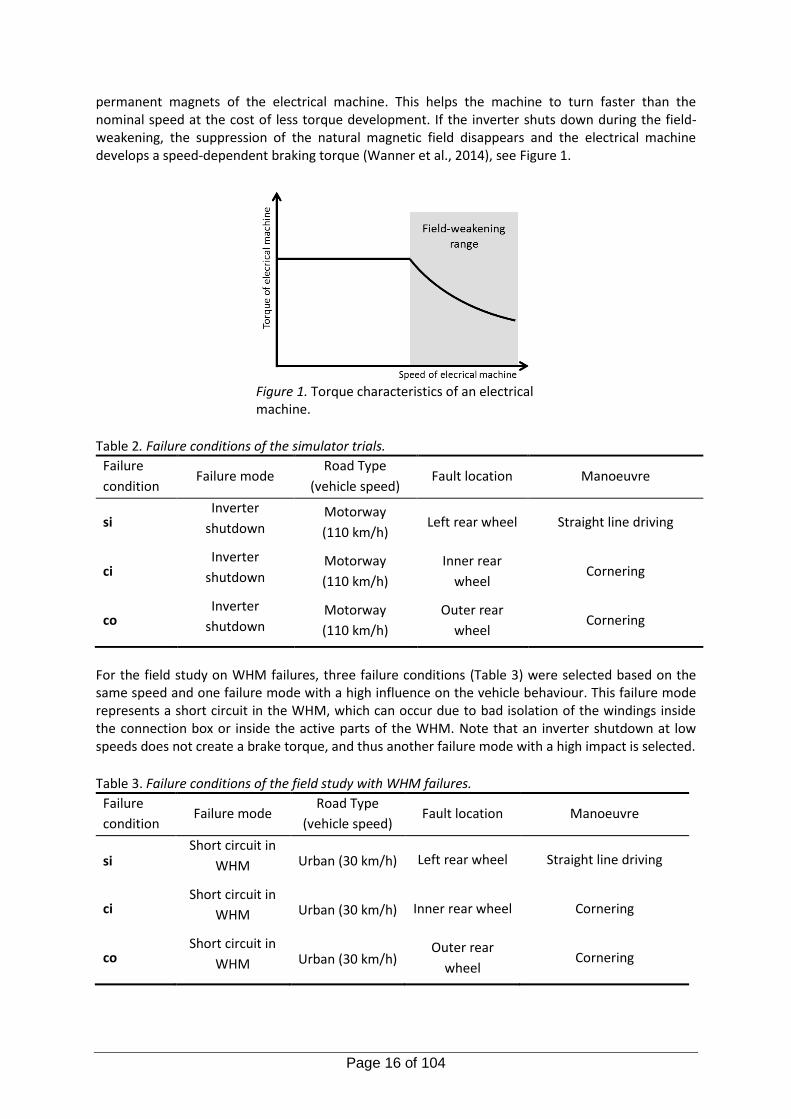
permanent magnets of the electrical machine. This helps the machine to turn faster than the nominal speed at the cost of less torque development. If the inverter shuts down during the field-weakening, the suppression of the natural magnetic field disappears and the electrical machine develops a speed-dependent braking torque (Wanner et al., 2014), see Figure 1.
Table 2. Failure conditions of the simulator trials.
Failure
condition Failure mode
Road Type
(vehicle speed) Fault location Manoeuvre
si Inverter
shutdown Motorway
(110 km/h) Left rear wheel Straight line driving
ci Inverter
shutdown Motorway
(110 km/h)
Inner rear
wheel Cornering
co Inverter
shutdown Motorway
(110 km/h)
Outer rear
wheel Cornering
For the field study on WHM failures, three failure conditions (Table 3) were selected based on the same speed and one failure mode with a high influence on the vehicle behaviour. This failure mode represents a short circuit in the WHM, which can occur due to bad isolation of the windings inside the connection box or inside the active parts of the WHM. Note that an inverter shutdown at low speeds does not create a brake torque, and thus another failure mode with a high impact is selected.
Table 3. Failure conditions of the field study with WHM failures.
Failure
condition Failure mode
Road Type
(vehicle speed) Fault location Manoeuvre
si Short circuit in
WHM Urban (30 km/h) Left rear wheel Straight line driving
ci Short circuit in
WHM Urban (30 km/h) Inner rear wheel Cornering
co Short circuit in
WHM Urban (30 km/h) Outer rear
wheel Cornering
Figure 1. Torque characteristics of an electrical machine.
Page 17 of 104
2.2 Regenerative braking failure
One key property of EVs is their RB system to recapture kinetic energy in deceleration manoeuvres. Depending on the vehicle type, the deceleration caused by RB considerably affects the driving task. The main goal of this study is to investigate the safety implications of the failure of such a system. It is questioned how the vehicle and the driver react if the deceleration caused by a RB system is missing in a failure condition. Results from past studies on user behaviour with EVs conducted by Cocron et al. (2013) indicate that drivers learn to drive with the system quickly and adapt their driving accordingly. The RB failure was only implemented in the field study as the effect of the failure was considered to be minor, when compared to the WHM failures, and therefore its characteristics were hardly reproducible in the same way in the simulator. Table 4 summarises the failure conditions for the RB failure.
Table 4. RB failure conditions.
Failure
condition Failure mode
Road Type
(vehicle speed) Fault location Manoeuvre
RB RB failure Urban (50 km/h) Both rear wheels Straight line driving
Page 18 of 104
3. IMPLEMENTATION OF FAILURE CONDITIONS
After the failure conditions were determined, they were simulated in a virtual environment to specify the braking torque for each failure mode. The simulations and failure mode definitions were conducted at the Royal Institute of Technology (KTH). The resulting brake torques were implemented in the vehicle model and the experimental vehicle respectively.
3.1 Simulator study
The simulator experiment focused on wheel hub motor (WHM) failures, as introduced previously in section 2.1. From the range of failures in this category, the ones with higher potential impact on vehicle stability were selected. These can be represented by the application of a sudden braking torque on the wheel under consideration. The exact value of braking torque was selected based on the results of vehicle dynamics simulations (Wanner et al., 2014) and the nature of the failure. An instant braking torque of 540 Nm that acts directly on one of the rear wheels was implemented in these trials. The test drivers in the Swedish National Road and Transport Research Institute (VTI) driving simulator experienced the failure in three different situations. These are presented in Table 2 and were selected based on driving conditions in terms of road positioning and geometry. All failure conditions were implemented identically. Each test subject was attributed a set of locations on the road where the failures should occur. Once arriving at said positions, the braking torque of the failure was filtered by a first order filter, with a time constant of 0.04 seconds, and applied to the target wheel. At the same time the propulsion torque active on the failure affected wheel, was set to zero and remained so until the failure simulation period is complete. The failure condition lasted 3 seconds. After this interval, the braking torque of the failure was linearly scaled down during another 3 seconds until it reached zero. Finally, once the failure torque had been removed, propulsion and external braking torques were reapplied to the wheel. Application of the latter was done during a 3 seconds interval where they were linearly scaled up until the signals reached their original values. After completion of the procedure described above, the vehicle dynamics model returned to nominal driving conditions and was ready to receive new failure requests.
3.2 Field studies with modified electric vehicle
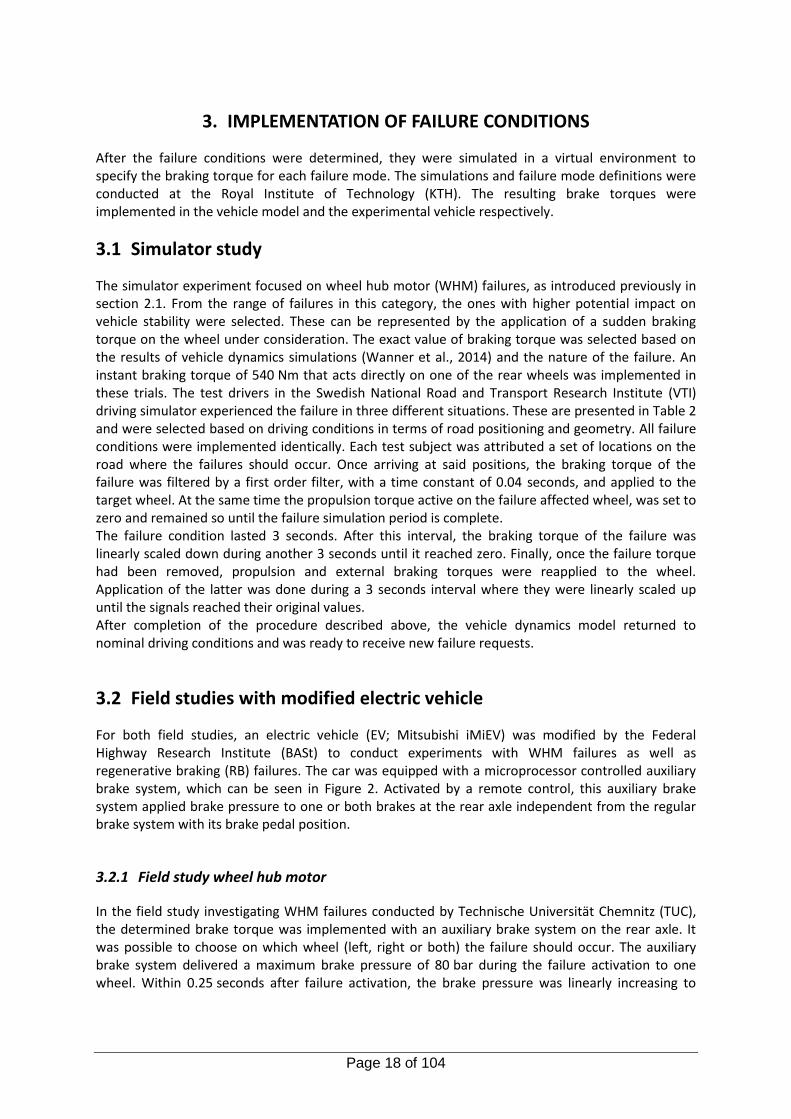
For both field studies, an electric vehicle (EV; Mitsubishi iMiEV) was modified by the Federal Highway Research Institute (BASt) to conduct experiments with WHM failures as well as regenerative braking (RB) failures. The car was equipped with a microprocessor controlled auxiliary brake system, which can be seen in Figure 2. Activated by a remote control, this auxiliary brake system applied brake pressure to one or both brakes at the rear axle independent from the regular brake system with its brake pedal position.
3.2.1 Field study wheel hub motor
In the field study investigating WHM failures conducted by Technische Universität Chemnitz (TUC), the determined brake torque was implemented with an auxiliary brake system on the rear axle. It was possible to choose on which wheel (left, right or both) the failure should occur. The auxiliary brake system delivered a maximum brake pressure of 80 bar during the failure activation to one wheel. Within 0.25 seconds after failure activation, the brake pressure was linearly increasing to
Page 19 of 104
60 bar. Thereafter, the brake pressure increased slower until the maximum was reached. After a period of 4 seconds, the additional applied brake pressure was released to regain normal conditions.
3.2.2 Field study regenerative braking
Within the field study regarding RB failure conducted by TUC, the effect of a RB brake force loss was analysed. Technically the standard equipment of the test vehicle contains a high RB (mode B), a normal RB (mode D) and a low RB (mode C). For the study on the test track mode C (with low deceleration due to RB) was chosen and in parallel the regular high deceleration of mode B was achieved by applying corresponding brake force on both rear wheels by the auxiliary brake system. To activate the failure (loss of high RB force) the artificial RB was suspended via remote control. Figure 2 illustrates the implementation of the auxiliary brakes system.
Figure 2. Implementation of auxiliary brake system on the rear axle of the Mitsubishi iMiEV.
Controller Auxiliary brake system
Data logger system
Page 20 of 104
4. WHEEL HUB MOTOR FAILURES: SIMULATOR STUDY
4.1 Research objectives
In the present experiment, the influence of failure modes in wheel hub motors (WHMs) on driver response and vehicle stability was investigated with a driving simulator study at the Swedish National Road and Transport Research Institute (VTI) in Gothenburg. The purpose of this research was the investigation of driver reactions and evaluations following the occurrence of a WHM failure, because this event might cause instability of the car (Wanner, 2013). Safety implications are a fundamental factor in the evaluation of electric vehicles (EVs) and shall be derived from this research (Cocron et al., 2011). Considering that a WHM is a new concept and failures in accordingly equipped vehicles occur unexpectedly, it is of highest importance to analyse driver reactions and evaluations in order to estimate ramifications for traffic safety. Consequences of these failures on vehicle dynamics are discussed by Wanner (2013), but the human factor is still unclear. It is conceivable that a driver might not be able to handle and hence not control the car after such an incident. As there are hardly any EVs on the market equipped with WHMs, yet, and solely little research regarding the human factor perspective (Kreußlein, 2013), this study will help to shed light on driver evaluation as well as human reactions to unexpected and expected WHM failures.
4.2 Method
The simulator experiment was implemented by using a within-subject design. Failure type (straight inward (si) vs. curve inward (ci) vs. curve outward (co)) and experience (Block 1 vs. Block 2) were introduced as within factors. Hence, the following effects were examined:
a) anticipating a failure (unexpected vs. expected) and b) three different WHM failures.
Failures on the rear wheels of the vehicles were tested. The following three failures were investigated:
1. WHM failure on the left rear side during straight line driving (straight inward = si), 2. WHM failure on the left rear wheel during a left curve (curve inward = ci) and 3. WHM failure on the right rear wheel during a left curve (curve outward = co).
Anticipation was operationalised by two test blocks. Each subject experienced all failures in each test block. Subjects were not informed about an upcoming failure before the first test block. Subsequently, the first failure in the first test block was definitely unexpected. After having experienced the first failure subjects most likely expected more failures to come. All failures in the second test block were expected because subjects received information about the occurrence of the failures before the second test block, but they did not know on which wheel and when they would occur while the simulation. In order to minimize carry over effects and to analyse the influence of diverse unexpected failure types, different orders of failure presentation were arranged by using a Latin square as suggested by Sedlmeier & Renkewitz (2013), which can be seen in Table 5. The combination of two of the six orders resulted in three groups subjects were randomly assigned to before the beginning of the experiment. Gender and age were balanced across groups. The order of failure presentation was counterbalanced across subjects. This grouping made it possible that every failure occurred at least once as the first failure.
Page 21 of 104
Table 5. Manipulated order for the simulator study on WHM failures.
Order 1 Order 2 Order 3
Block 1 si, co, ci ci, co, si co, ci, si Block 2 ci, si, co co, si, ci si, ci, co
4.2.1 Preparations
An English online version of almost all questionnaires was arranged via the LimeSurvey software (LimeSurvey Project Team, 2012). Furthermore, a Swedish translation of the questionnaires was compiled in order to clarify possible problems in understanding the English items. A badge was placed outside the vehicle door in order to create the illusion of an EV (Figure 3). Further, the vehicle dynamics model was changed to that of an EV, in particular towards a Mitsubishi iMiEV. The sounds in the simulator were also adapted to better match those of a vehicle with an electric powertrain.
Figure 3. Driver cabin of the VTI moving base driving simulator.
4.2.2 Sample
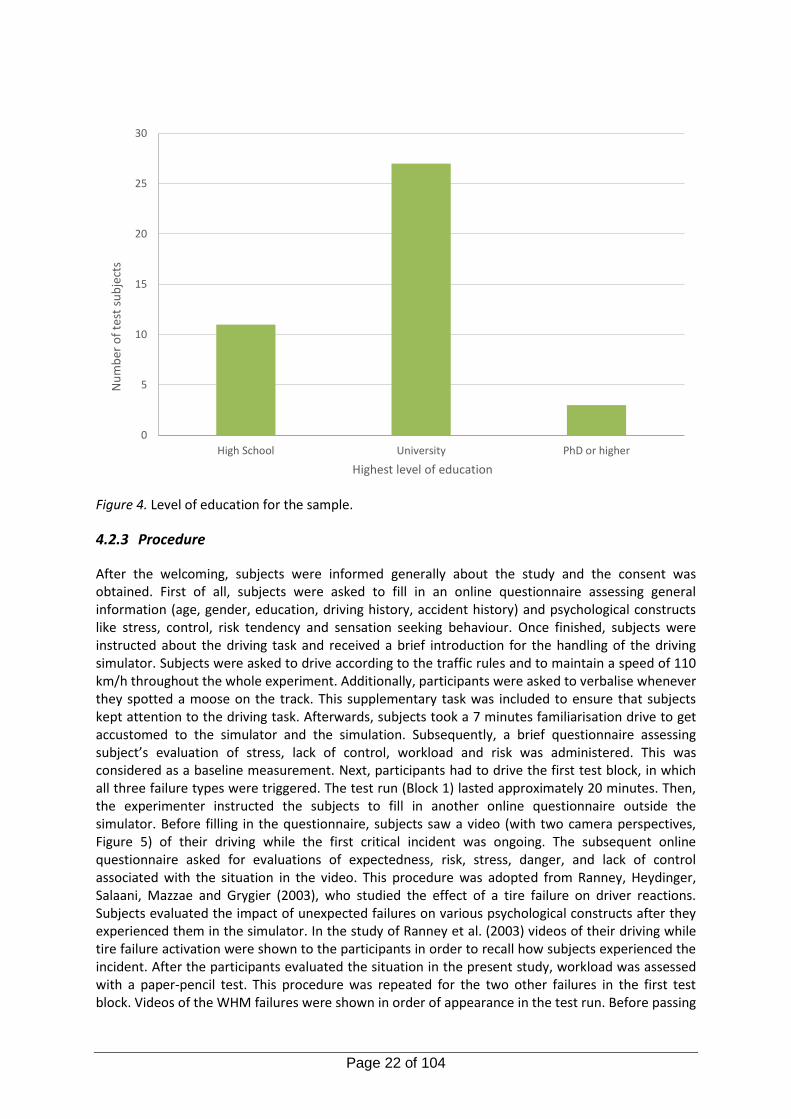
In total, 53 subjects were invited to take part in the driving simulator study. Out of these, 43 subjects accepted the invitation for participation. Two subjects were excluded from the dataset due to simulator problems and simulator sickness, which led to a complete dataset for 41 participants. Subjects were 42.12 years in average (SD = 10.88, Min = 25, Max = 59) and held their driving licences for an average of 23.44 years (SD = 11.26, Min = 7, Max = 44). The sample comprised 12 females (29 %) and 29 males (71 %), which were balanced across the different orders. Mean mileage amounted 17385.4 km a year (SD = 12294.66, Min = 800, Max = 50000), and approximately 387.3 km a week (SD = 432.61, Min = 0, Max = 2000). All subjects possessed class B driving license. Three subjects reported an accident including another car in the last three years. Solely one subject had a single car accident (e.g., run-off the road accident, rollovers, collisions with animals or fallen rocks) in the last three years. Roughly 71 % of the test subjects participated at least in one driving simulator study and approximately 61 % had driven an EV before. The majority of subjects held a university degree (65.9 %), as can be seen in Figure 4.
Page 22 of 104
Figure 4. Level of education for the sample.
4.2.3 Procedure
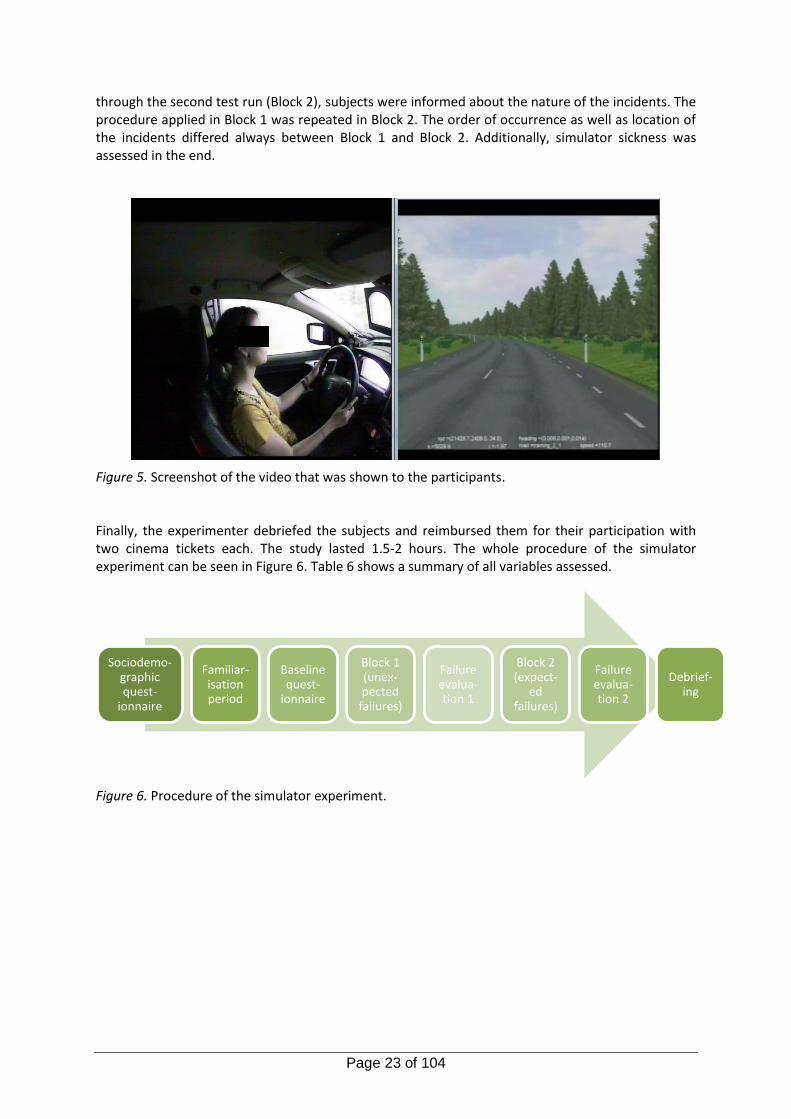
After the welcoming, subjects were informed generally about the study and the consent was obtained. First of all, subjects were asked to fill in an online questionnaire assessing general information (age, gender, education, driving history, accident history) and psychological constructs like stress, control, risk tendency and sensation seeking behaviour. Once finished, subjects were instructed about the driving task and received a brief introduction for the handling of the driving simulator. Subjects were asked to drive according to the traffic rules and to maintain a speed of 110 km/h throughout the whole experiment. Additionally, participants were asked to verbalise whenever they spotted a moose on the track. This supplementary task was included to ensure that subjects kept attention to the driving task. Afterwards, subjects took a 7 minutes familiarisation drive to get accustomed to the simulator and the simulation. Subsequently, a brief questionnaire assessing subject’s evaluation of stress, lack of control, workload and risk was administered. This was considered as a baseline measurement. Next, participants had to drive the first test block, in which all three failure types were triggered. The test run (Block 1) lasted approximately 20 minutes. Then, the experimenter instructed the subjects to fill in another online questionnaire outside the simulator. Before filling in the questionnaire, subjects saw a video (with two camera perspectives, Figure 5) of their driving while the first critical incident was ongoing. The subsequent online questionnaire asked for evaluations of expectedness, risk, stress, danger, and lack of control associated with the situation in the video. This procedure was adopted from Ranney, Heydinger, Salaani, Mazzae and Grygier (2003), who studied the effect of a tire failure on driver reactions. Subjects evaluated the impact of unexpected failures on various psychological constructs after they experienced them in the simulator. In the study of Ranney et al. (2003) videos of their driving while tire failure activation were shown to the participants in order to recall how subjects experienced the incident. After the participants evaluated the situation in the present study, workload was assessed with a paper-pencil test. This procedure was repeated for the two other failures in the first test block. Videos of the WHM failures were shown in order of appearance in the test run. Before passing
0
5
10
15
20
25
30
High School University PhD or higher
Nu
mb
er o
f te
st s
ub
ject
s
Highest level of education
Page 23 of 104
through the second test run (Block 2), subjects were informed about the nature of the incidents. The procedure applied in Block 1 was repeated in Block 2. The order of occurrence as well as location of the incidents differed always between Block 1 and Block 2. Additionally, simulator sickness was assessed in the end.
Figure 5. Screenshot of the video that was shown to the participants. Finally, the experimenter debriefed the subjects and reimbursed them for their participation with two cinema tickets each. The study lasted 1.5-2 hours. The whole procedure of the simulator experiment can be seen in Figure 6. Table 6 shows a summary of all variables assessed.
Figure 6. Procedure of the simulator experiment.
Sociodemo-graphic quest-
ionnaire
Familiar-isation period
Baseline quest-
ionnaire
Block 1 (unex-pected
failures)
Failure evalua-tion 1
Block 2 (expect-
ed failures)
Failure evalua-tion 2
Debrief-ing
Page 24 of 104
Table 6. Variables which were assessed with questionnaires.
First
Questionnaire Baseline
Evaluation after Block 1
Evaluation after Block 2
Sociodemographics (e.g., age, education, gender)
x
Driving History (e.g., km/year, accidents)
x
Knowledge about EVs x
General control x
Closeness to reality x
Expectancy x x
Risk x x x
Stress x x x
Control x x x
Disturbance Rating Scale x x
Workload (NASA-TLX) x x x
4.3 Results of the simulator study on wheel hub motor failures
4.3.1 Subjective data
The analysis of the subjective data focused on the first failure subjects experienced in the simulator.
4.3.1.1 Failure perception
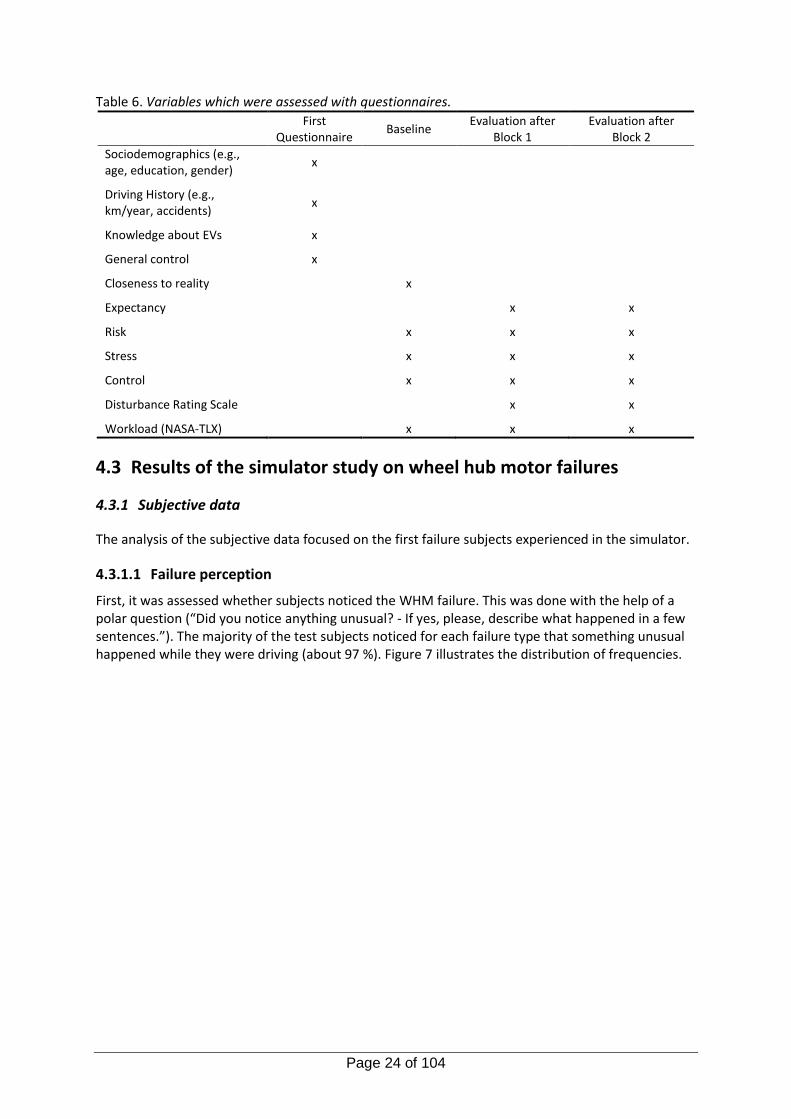
First, it was assessed whether subjects noticed the WHM failure. This was done with the help of a polar question (“Did you notice anything unusual? - If yes, please, describe what happened in a few sentences.”). The majority of the test subjects noticed for each failure type that something unusual happened while they were driving (about 97 %). Figure 7 illustrates the distribution of frequencies.
Page 25 of 104
Figure 7. Frequency of acknowledged unusual events.
4.3.1.2 Expectancy
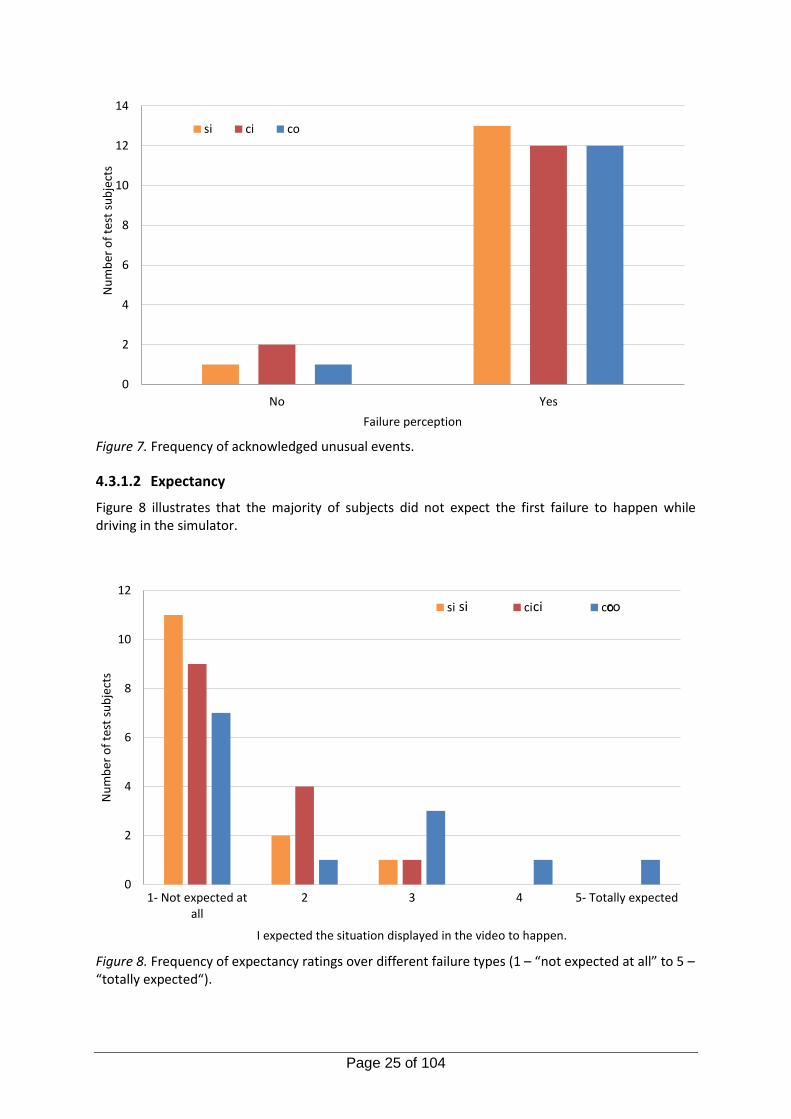
Figure 8 illustrates that the majority of subjects did not expect the first failure to happen while driving in the simulator.
Figure 8. Frequency of expectancy ratings over different failure types (1 – “not expected at all” to 5 – “totally expected“).
0
2
4
6
8
10
12
14
No Yes
Nu
mb
er o
f te
st s
ub
ject
s
Failure perception
si ci co
0
2
4
6
8
10
12
1- Not expected atall
2 3 4 5- Totally expected
I expected the situation displayed in the video to happen.
Nu
mb
er o
f te
st s
ub
ject
s
si ci cosi ci co
Page 26 of 104
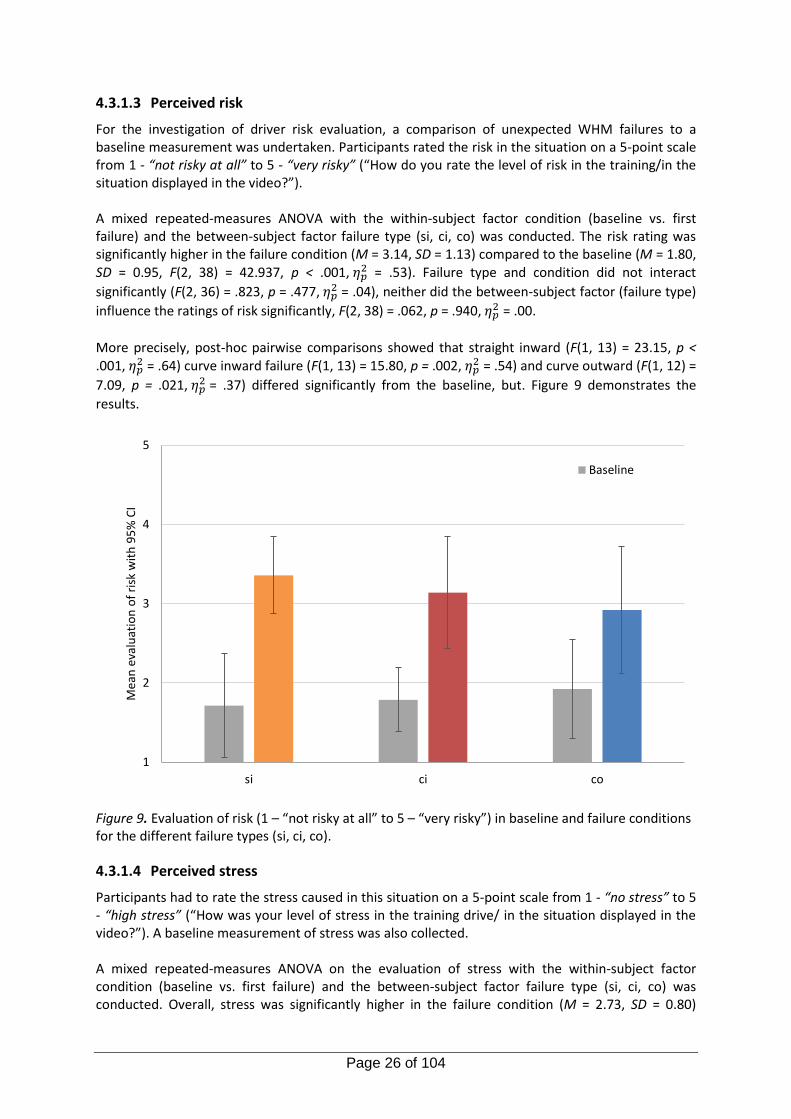
4.3.1.3 Perceived risk
For the investigation of driver risk evaluation, a comparison of unexpected WHM failures to a baseline measurement was undertaken. Participants rated the risk in the situation on a 5-point scale from 1 - “not risky at all” to 5 - “very risky” (“How do you rate the level of risk in the training/in the situation displayed in the video?”). A mixed repeated-measures ANOVA with the within-subject factor condition (baseline vs. first failure) and the between-subject factor failure type (si, ci, co) was conducted. The risk rating was significantly higher in the failure condition (M = 3.14, SD = 1.13) compared to the baseline (M = 1.80, SD = 0.95, F(2, 38) = 42.937, p < .001, 𝜂𝑝
2 = .53). Failure type and condition did not interact
significantly (F(2, 36) = .823, p = .477, 𝜂𝑝2 = .04), neither did the between-subject factor (failure type)
influence the ratings of risk significantly, F(2, 38) = .062, p = .940, 𝜂𝑝2 = .00.
More precisely, post-hoc pairwise comparisons showed that straight inward (F(1, 13) = 23.15, p < .001, 𝜂𝑝
2 = .64) curve inward failure (F(1, 13) = 15.80, p = .002, 𝜂𝑝2 = .54) and curve outward (F(1, 12) =
7.09, p = .021, 𝜂𝑝2 = .37) differed significantly from the baseline, but. Figure 9 demonstrates the
results.
Figure 9. Evaluation of risk (1 – “not risky at all” to 5 – “very risky”) in baseline and failure conditions for the different failure types (si, ci, co).
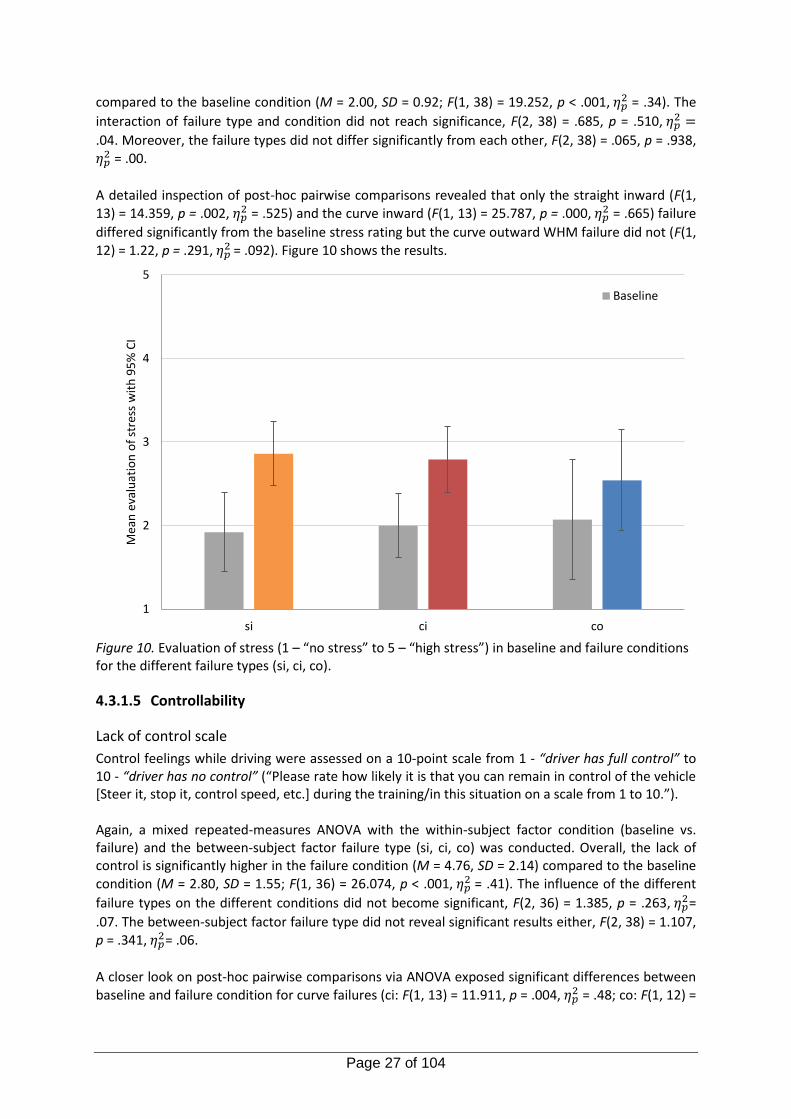
4.3.1.4 Perceived stress
Participants had to rate the stress caused in this situation on a 5-point scale from 1 - “no stress” to 5 - “high stress” (“How was your level of stress in the training drive/ in the situation displayed in the video?”). A baseline measurement of stress was also collected. A mixed repeated-measures ANOVA on the evaluation of stress with the within-subject factor condition (baseline vs. first failure) and the between-subject factor failure type (si, ci, co) was conducted. Overall, stress was significantly higher in the failure condition (M = 2.73, SD = 0.80)
1
2
3
4
5
si ci co
Mea
n e
valu
atio
n o
f ri
sk w
ith
95
% C
I
Baseline
Page 27 of 104
compared to the baseline condition (M = 2.00, SD = 0.92; F(1, 38) = 19.252, p < .001, 𝜂𝑝2 = .34). The
interaction of failure type and condition did not reach significance, F(2, 38) = .685, p = .510, 𝜂𝑝2 =
.04. Moreover, the failure types did not differ significantly from each other, F(2, 38) = .065, p = .938, 𝜂𝑝
2 = .00.
A detailed inspection of post-hoc pairwise comparisons revealed that only the straight inward (F(1, 13) = 14.359, p = .002, 𝜂𝑝
2 = .525) and the curve inward (F(1, 13) = 25.787, p = .000, 𝜂𝑝2 = .665) failure
differed significantly from the baseline stress rating but the curve outward WHM failure did not (F(1, 12) = 1.22, p = .291, 𝜂𝑝
2 = .092). Figure 10 shows the results.
Figure 10. Evaluation of stress (1 – “no stress” to 5 – “high stress”) in baseline and failure conditions for the different failure types (si, ci, co).
4.3.1.5 Controllability
Lack of control scale
Control feelings while driving were assessed on a 10-point scale from 1 - “driver has full control” to 10 - “driver has no control” (“Please rate how likely it is that you can remain in control of the vehicle [Steer it, stop it, control speed, etc.] during the training/in this situation on a scale from 1 to 10.”). Again, a mixed repeated-measures ANOVA with the within-subject factor condition (baseline vs. failure) and the between-subject factor failure type (si, ci, co) was conducted. Overall, the lack of control is significantly higher in the failure condition (M = 4.76, SD = 2.14) compared to the baseline condition (M = 2.80, SD = 1.55; F(1, 36) = 26.074, p < .001, 𝜂𝑝
2 = .41). The influence of the different
failure types on the different conditions did not become significant, F(2, 36) = 1.385, p = .263, 𝜂𝑝2=
.07. The between-subject factor failure type did not reveal significant results either, F(2, 38) = 1.107, p = .341, 𝜂𝑝
2= .06.
A closer look on post-hoc pairwise comparisons via ANOVA exposed significant differences between baseline and failure condition for curve failures (ci: F(1, 13) = 11.911, p = .004, 𝜂𝑝
2 = .48; co: F(1, 12) =
1
2
3
4
5
si ci co
Mea
n e
valu
atio
n o
f st
ress
wit
h 9
5%
CI
Baseline
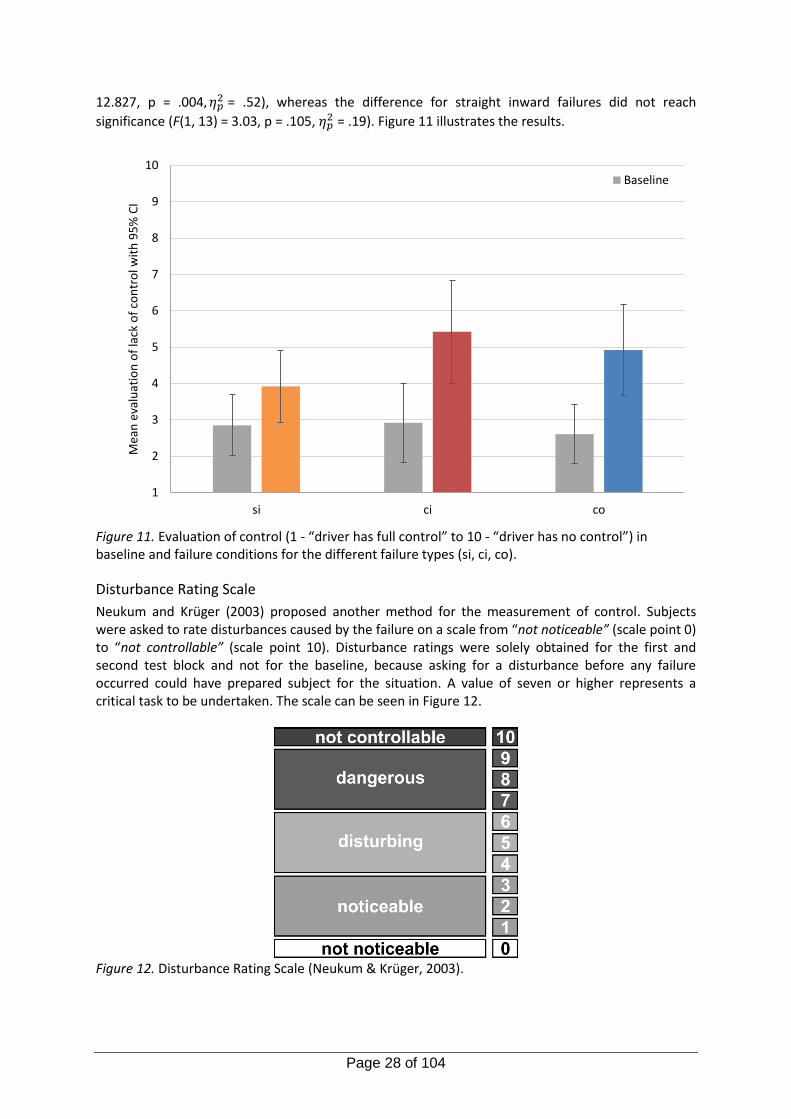
Page 28 of 104
12.827, p = .004, 𝜂𝑝2 = .52), whereas the difference for straight inward failures did not reach
significance (F(1, 13) = 3.03, p = .105, 𝜂𝑝2 = .19). Figure 11 illustrates the results.
Figure 11. Evaluation of control (1 - “driver has full control” to 10 - “driver has no control”) in baseline and failure conditions for the different failure types (si, ci, co).
Disturbance Rating Scale
Neukum and Krüger (2003) proposed another method for the measurement of control. Subjects were asked to rate disturbances caused by the failure on a scale from “not noticeable” (scale point 0) to “not controllable” (scale point 10). Disturbance ratings were solely obtained for the first and second test block and not for the baseline, because asking for a disturbance before any failure occurred could have prepared subject for the situation. A value of seven or higher represents a critical task to be undertaken. The scale can be seen in Figure 12.
Figure 12. Disturbance Rating Scale (Neukum & Krüger, 2003).
1
2
3
4
5
6
7
8
9
10
si ci co
Mea
n e
valu
atio
n o
f la
ck o
f co
ntr
ol w
ith
95
% C
I
Baseline

Page 29 of 104
A one-way ANOVA on disturbance ratings with the between-subject factor failure type was conducted. Disturbance ratings did not differ significantly between the three failure types, F(2, 32.518) = .797; p = .460, f = .463, with 𝑀𝑠𝑖 = 5.42 (𝑆𝐷𝑠𝑖 = 1.60), 𝑀𝑐𝑖 = 5.07(𝑆𝐷𝑐𝑖 = 2.84), 𝑀𝑐𝑜 = 4.30, (𝑆𝐷𝑐𝑜 = 2.42), which can be seen in Figure 13.
Figure 13. Evaluation of disturbance (0 – “not noticeable” to 10 – “not controllable”) in failure conditions for the different failure types (si, ci, co).
4.3.1.6 Subjective workload
Finally, workload associated with the failure was measured with the NASA-TLX Index (NASA-TLX; Hart & Staveland, 1988). According to Hart and Staveland (1988) workload of the task is judged on six subscales, which are mental, physical and temporal demand (from “very low” to “very high”), performance (from “perfect” to “failure”), effort and frustration (from “very low” to “very high”) on a 100-points scale with 5-point steps. The higher the rating the more workload is reported by the subjects. People are encouraged to mark the scale wherever they want. An exemplary item of the NASA-TLX can be seen in Figure 14.
Figure 14. Item for the subscale mental demand for the NASA-TLX (Hart & Staveland, 1988). The hypothesis of increased workload due to a failure was tested with mixed repeated-measures ANOVA with the within-subject factor condition (baseline vs. failure) and between-subject factor failure type (si, ci, co). Results revealed that baseline workload measurements are low in general. Overall, failures significantly differed from the baseline measurement (F(1, 38) = 42.868, p = .000, 𝜂𝑝
2
= .53). Workload in failure conditions, M = 22.45 (SD =9.68), was higher than in the baseline, M = 13.64 (SD = 8.09). An interaction between the condition and the failure type was not found (F(2, 38) = 0.618, p = .544, 𝜂𝑝
2 = .03), indicating that the different failure types do not have an impact on the
1
2
3
4
5
6
7
8
9
10
si ci co
Mea
n e
valu
atio
n o
f d
istu
rban
ce w
ith
95
% C
I
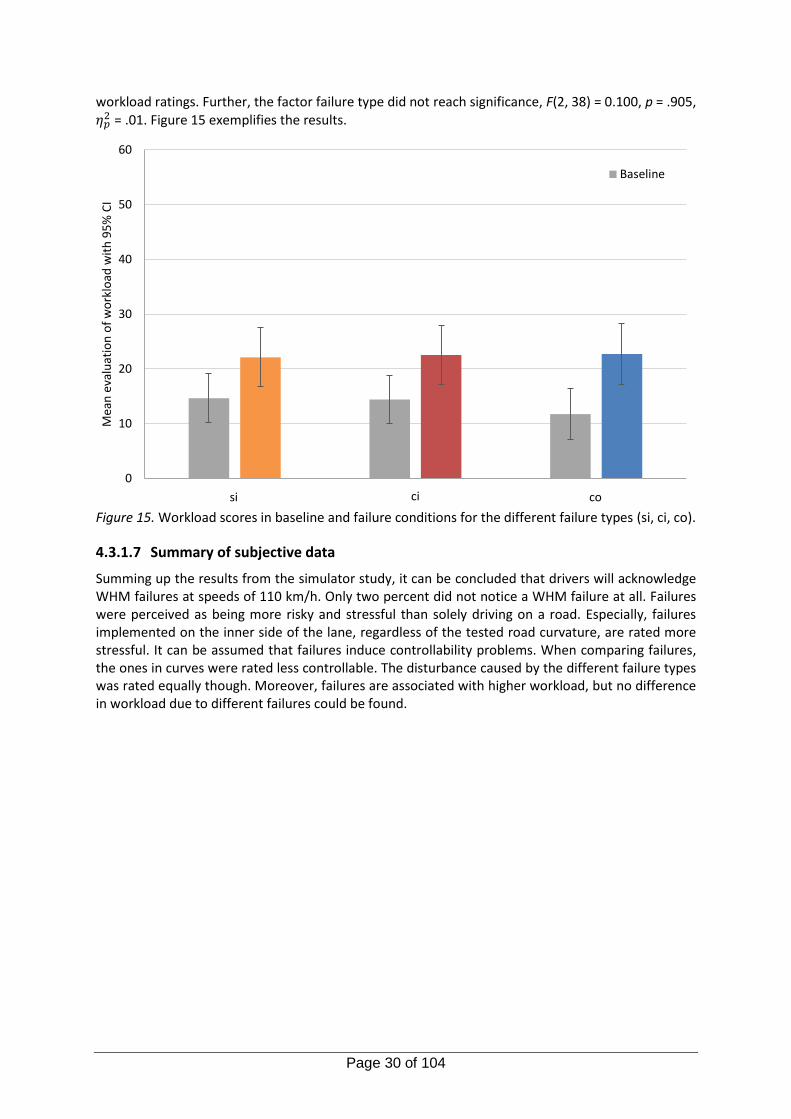
Page 30 of 104
workload ratings. Further, the factor failure type did not reach significance, F(2, 38) = 0.100, p = .905, 𝜂𝑝
2 = .01. Figure 15 exemplifies the results.
Figure 15. Workload scores in baseline and failure conditions for the different failure types (si, ci, co).
4.3.1.7 Summary of subjective data
Summing up the results from the simulator study, it can be concluded that drivers will acknowledge WHM failures at speeds of 110 km/h. Only two percent did not notice a WHM failure at all. Failures were perceived as being more risky and stressful than solely driving on a road. Especially, failures implemented on the inner side of the lane, regardless of the tested road curvature, are rated more stressful. It can be assumed that failures induce controllability problems. When comparing failures, the ones in curves were rated less controllable. The disturbance caused by the different failure types was rated equally though. Moreover, failures are associated with higher workload, but no difference in workload due to different failures could be found.
0
10
20
30
40
50
60
Straight Curve Inward Curve Outward
Mea
n e
valu
atio
n o
f w
ork
load
wit
h 9
5%
CI
Baseline
si ci co
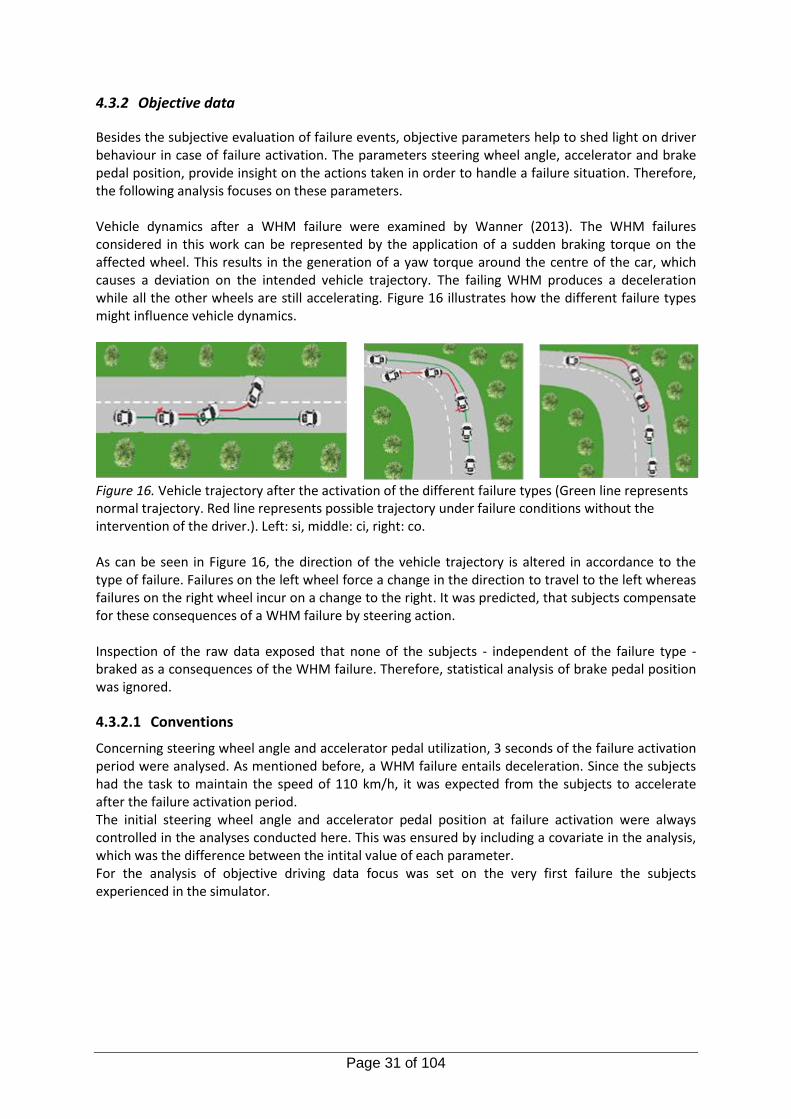
Page 31 of 104
4.3.2 Objective data
Besides the subjective evaluation of failure events, objective parameters help to shed light on driver behaviour in case of failure activation. The parameters steering wheel angle, accelerator and brake pedal position, provide insight on the actions taken in order to handle a failure situation. Therefore, the following analysis focuses on these parameters. Vehicle dynamics after a WHM failure were examined by Wanner (2013). The WHM failures considered in this work can be represented by the application of a sudden braking torque on the affected wheel. This results in the generation of a yaw torque around the centre of the car, which causes a deviation on the intended vehicle trajectory. The failing WHM produces a deceleration while all the other wheels are still accelerating. Figure 16 illustrates how the different failure types might influence vehicle dynamics.
Figure 16. Vehicle trajectory after the activation of the different failure types (Green line represents normal trajectory. Red line represents possible trajectory under failure conditions without the intervention of the driver.). Left: si, middle: ci, right: co. As can be seen in Figure 16, the direction of the vehicle trajectory is altered in accordance to the type of failure. Failures on the left wheel force a change in the direction to travel to the left whereas failures on the right wheel incur on a change to the right. It was predicted, that subjects compensate for these consequences of a WHM failure by steering action. Inspection of the raw data exposed that none of the subjects - independent of the failure type - braked as a consequences of the WHM failure. Therefore, statistical analysis of brake pedal position was ignored.
4.3.2.1 Conventions
Concerning steering wheel angle and accelerator pedal utilization, 3 seconds of the failure activation period were analysed. As mentioned before, a WHM failure entails deceleration. Since the subjects had the task to maintain the speed of 110 km/h, it was expected from the subjects to accelerate after the failure activation period. The initial steering wheel angle and accelerator pedal position at failure activation were always controlled in the analyses conducted here. This was ensured by including a covariate in the analysis, which was the difference between the intital value of each parameter. For the analysis of objective driving data focus was set on the very first failure the subjects experienced in the simulator.
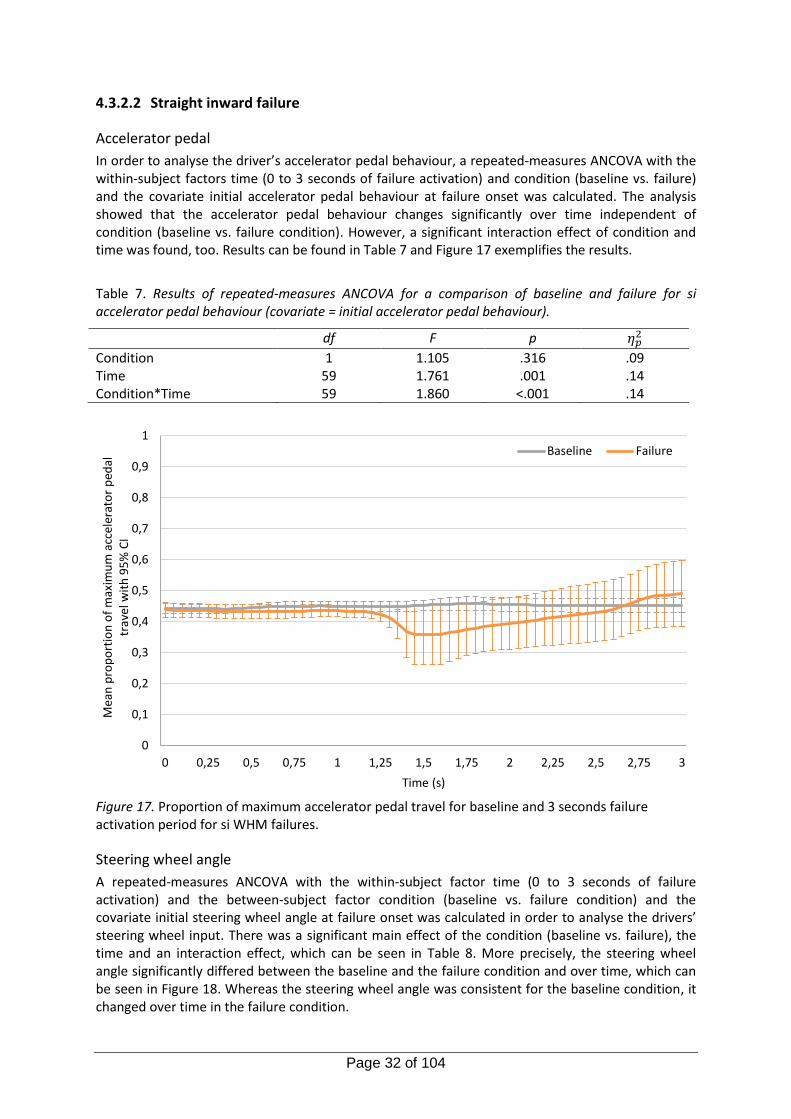
Page 32 of 104
4.3.2.2 Straight inward failure
Accelerator pedal
In order to analyse the driver’s accelerator pedal behaviour, a repeated-measures ANCOVA with the within-subject factors time (0 to 3 seconds of failure activation) and condition (baseline vs. failure) and the covariate initial accelerator pedal behaviour at failure onset was calculated. The analysis showed that the accelerator pedal behaviour changes significantly over time independent of condition (baseline vs. failure condition). However, a significant interaction effect of condition and time was found, too. Results can be found in Table 7 and Figure 17 exemplifies the results.
Table 7. Results of repeated-measures ANCOVA for a comparison of baseline and failure for si accelerator pedal behaviour (covariate = initial accelerator pedal behaviour).
df F p 𝜂𝑝2
Condition 1 1.105 .316 .09 Time 59 1.761 .001 .14 Condition*Time 59 1.860 <.001 .14
Figure 17. Proportion of maximum accelerator pedal travel for baseline and 3 seconds failure activation period for si WHM failures.
Steering wheel angle
A repeated-measures ANCOVA with the within-subject factor time (0 to 3 seconds of failure activation) and the between-subject factor condition (baseline vs. failure condition) and the covariate initial steering wheel angle at failure onset was calculated in order to analyse the drivers’ steering wheel input. There was a significant main effect of the condition (baseline vs. failure), the time and an interaction effect, which can be seen in Table 8. More precisely, the steering wheel angle significantly differed between the baseline and the failure condition and over time, which can be seen in Figure 18. Whereas the steering wheel angle was consistent for the baseline condition, it changed over time in the failure condition.
0
0,1
0,2
0,3
0,4
0,5
0,6
0,7
0,8
0,9
1
0 0,25 0,5 0,75 1 1,25 1,5 1,75 2 2,25 2,5 2,75 3
Mea
n p
rop
ort
ion
of
max
imu
m a
ccel
erat
or
ped
al
trav
el w
ith
95
% C
I
Time (s)
Baseline Failure
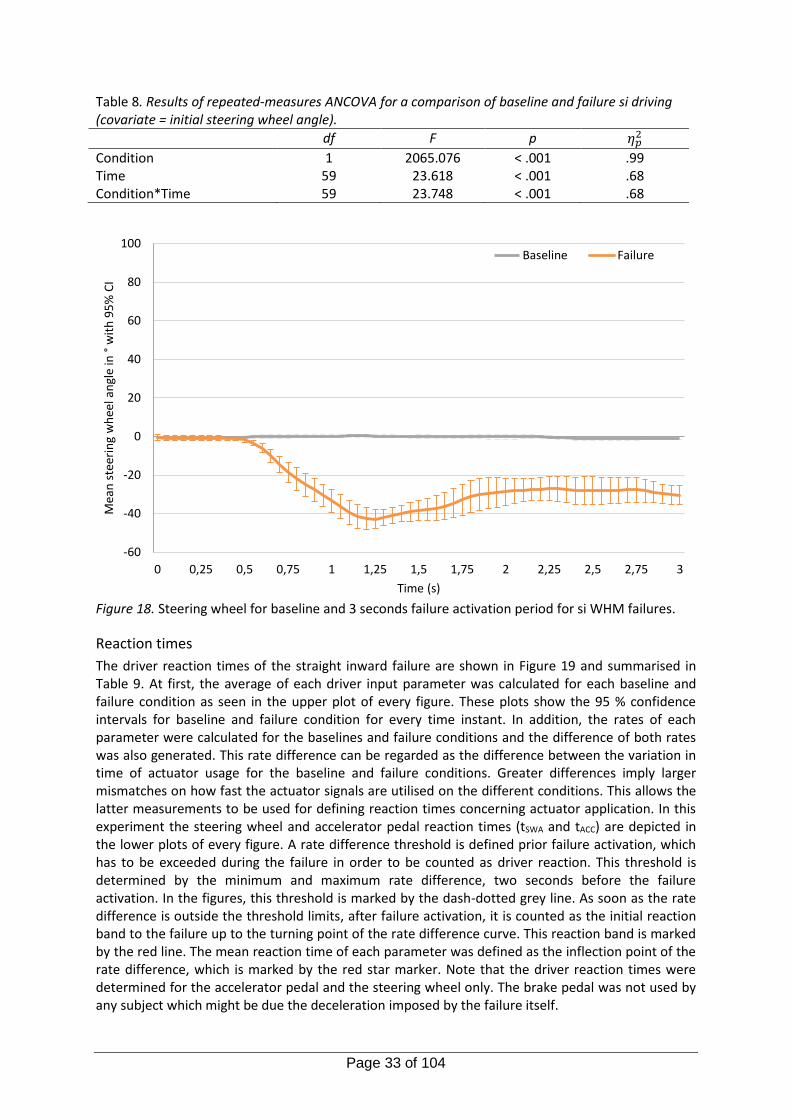
Page 33 of 104
Table 8. Results of repeated-measures ANCOVA for a comparison of baseline and failure si driving (covariate = initial steering wheel angle).
df F p 𝜂𝑝2
Condition 1 2065.076 < .001 .99 Time 59 23.618 < .001 .68 Condition*Time 59 23.748 < .001 .68
Figure 18. Steering wheel for baseline and 3 seconds failure activation period for si WHM failures.
Reaction times
The driver reaction times of the straight inward failure are shown in Figure 19 and summarised in Table 9. At first, the average of each driver input parameter was calculated for each baseline and failure condition as seen in the upper plot of every figure. These plots show the 95 % confidence intervals for baseline and failure condition for every time instant. In addition, the rates of each parameter were calculated for the baselines and failure conditions and the difference of both rates was also generated. This rate difference can be regarded as the difference between the variation in time of actuator usage for the baseline and failure conditions. Greater differences imply larger mismatches on how fast the actuator signals are utilised on the different conditions. This allows the latter measurements to be used for defining reaction times concerning actuator application. In this experiment the steering wheel and accelerator pedal reaction times (tSWA and tACC) are depicted in the lower plots of every figure. A rate difference threshold is defined prior failure activation, which has to be exceeded during the failure in order to be counted as driver reaction. This threshold is determined by the minimum and maximum rate difference, two seconds before the failure activation. In the figures, this threshold is marked by the dash-dotted grey line. As soon as the rate difference is outside the threshold limits, after failure activation, it is counted as the initial reaction band to the failure up to the turning point of the rate difference curve. This reaction band is marked by the red line. The mean reaction time of each parameter was defined as the inflection point of the rate difference, which is marked by the red star marker. Note that the driver reaction times were determined for the accelerator pedal and the steering wheel only. The brake pedal was not used by any subject which might be due the deceleration imposed by the failure itself.
-60
-40
-20
0
20
40
60
80
100
0 0,25 0,5 0,75 1 1,25 1,5 1,75 2 2,25 2,5 2,75 3
Mea
n s
teer
ing
wh
eel a
ngl
e in
°w
ith
95
% C
I
Time (s)
Baseline Failure
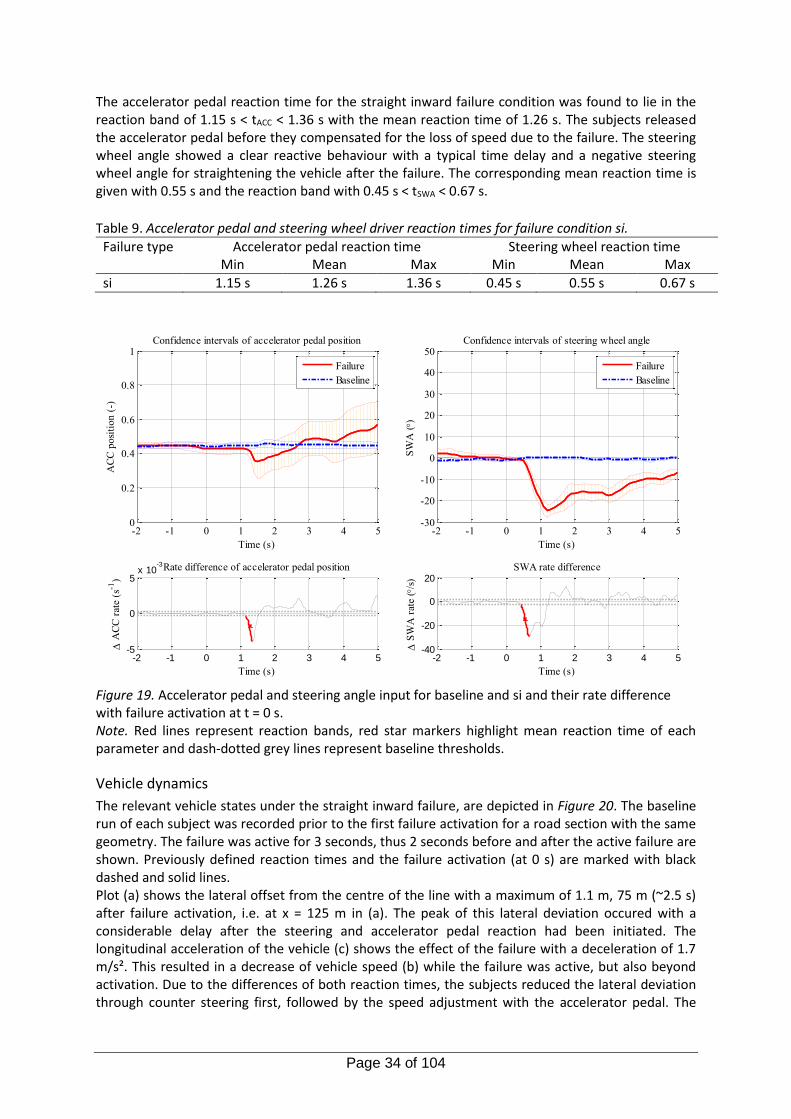
Page 34 of 104
The accelerator pedal reaction time for the straight inward failure condition was found to lie in the reaction band of 1.15 s < tACC < 1.36 s with the mean reaction time of 1.26 s. The subjects released the accelerator pedal before they compensated for the loss of speed due to the failure. The steering wheel angle showed a clear reactive behaviour with a typical time delay and a negative steering wheel angle for straightening the vehicle after the failure. The corresponding mean reaction time is given with 0.55 s and the reaction band with 0.45 s < tSWA < 0.67 s.
Table 9. Accelerator pedal and steering wheel driver reaction times for failure condition si.
Failure type Accelerator pedal reaction time Steering wheel reaction time Min Mean Max Min Mean Max
si 1.15 s 1.26 s 1.36 s 0.45 s 0.55 s 0.67 s
Figure 19. Accelerator pedal and steering angle input for baseline and si and their rate difference with failure activation at t = 0 s. Note. Red lines represent reaction bands, red star markers highlight mean reaction time of each parameter and dash-dotted grey lines represent baseline thresholds.
Vehicle dynamics
The relevant vehicle states under the straight inward failure, are depicted in Figure 20. The baseline run of each subject was recorded prior to the first failure activation for a road section with the same geometry. The failure was active for 3 seconds, thus 2 seconds before and after the active failure are shown. Previously defined reaction times and the failure activation (at 0 s) are marked with black dashed and solid lines. Plot (a) shows the lateral offset from the centre of the line with a maximum of 1.1 m, 75 m (~2.5 s) after failure activation, i.e. at x = 125 m in (a). The peak of this lateral deviation occured with a considerable delay after the steering and accelerator pedal reaction had been initiated. The longitudinal acceleration of the vehicle (c) shows the effect of the failure with a deceleration of 1.7 m/s². This resulted in a decrease of vehicle speed (b) while the failure was active, but also beyond activation. Due to the differences of both reaction times, the subjects reduced the lateral deviation through counter steering first, followed by the speed adjustment with the accelerator pedal. The
-2 -1 0 1 2 3 4 50
0.2
0.4
0.6
0.8
1
Time (s)
AC
C p
osi
tion (
-)
Confidence intervals of accelerator pedal position
Failure
Baseline
-2 -1 0 1 2 3 4 5-5
0
5x 10
-3
Time (s)
A
CC
rat
e (s
-1)
Rate difference of accelerator pedal position
-2 -1 0 1 2 3 4 5-30
-20
-10
0
10
20
30
40
50
Time (s)
SW
A ()
Confidence intervals of steering wheel angle
Failure
Baseline
-2 -1 0 1 2 3 4 5-40
-20
0
20
Time (s)
S
WA
rat
e (
/s)
SWA rate difference
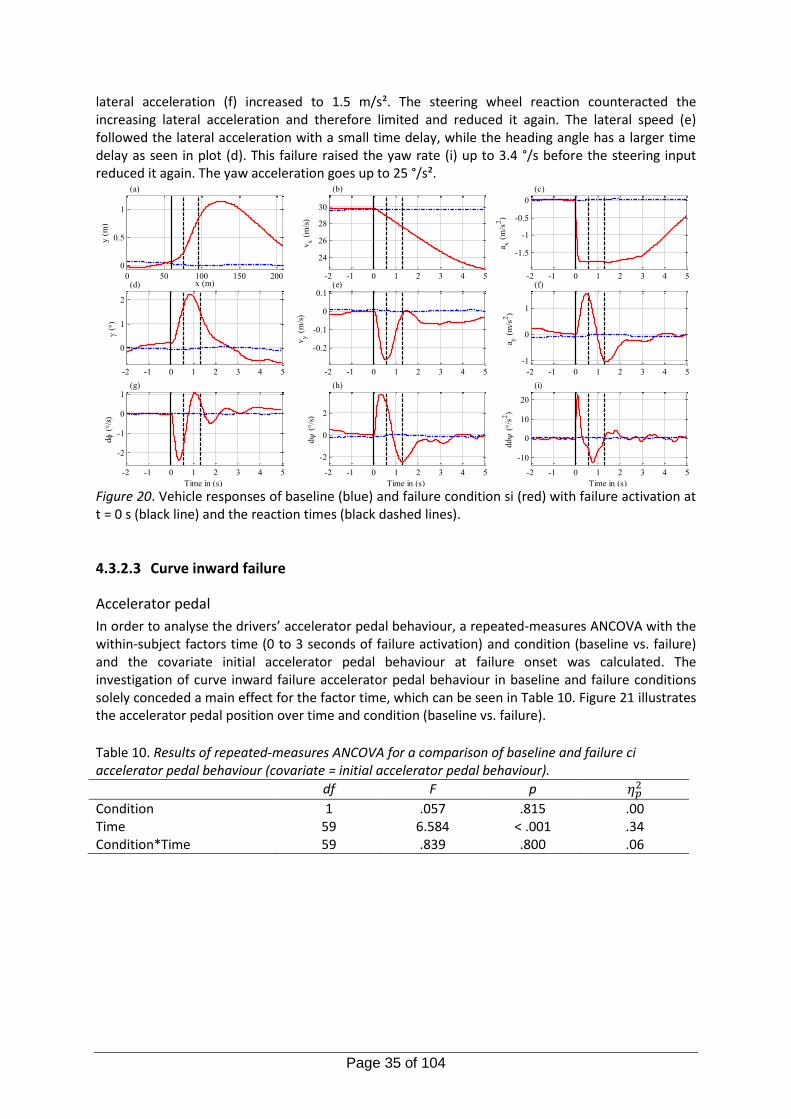
Page 35 of 104
lateral acceleration (f) increased to 1.5 m/s². The steering wheel reaction counteracted the increasing lateral acceleration and therefore limited and reduced it again. The lateral speed (e) followed the lateral acceleration with a small time delay, while the heading angle has a larger time delay as seen in plot (d). This failure raised the yaw rate (i) up to 3.4 °/s before the steering input reduced it again. The yaw acceleration goes up to 25 °/s².
Figure 20. Vehicle responses of baseline (blue) and failure condition si (red) with failure activation at t = 0 s (black line) and the reaction times (black dashed lines).
4.3.2.3 Curve inward failure
Accelerator pedal
In order to analyse the drivers’ accelerator pedal behaviour, a repeated-measures ANCOVA with the within-subject factors time (0 to 3 seconds of failure activation) and condition (baseline vs. failure) and the covariate initial accelerator pedal behaviour at failure onset was calculated. The investigation of curve inward failure accelerator pedal behaviour in baseline and failure conditions solely conceded a main effect for the factor time, which can be seen in Table 10. Figure 21 illustrates the accelerator pedal position over time and condition (baseline vs. failure).
Table 10. Results of repeated-measures ANCOVA for a comparison of baseline and failure ci accelerator pedal behaviour (covariate = initial accelerator pedal behaviour).
df F p 𝜂𝑝2
Condition 1 .057 .815 .00 Time 59 6.584 < .001 .34 Condition*Time 59 .839 .800 .06
-2 -1 0 1 2 3 4 5
24
26
28
30
(b)
vx (
m/s
)
-2 -1 0 1 2 3 4 5
-1.5
-1
-0.5
0
(c)
a x (
m/s
2)
-2 -1 0 1 2 3 4 5
0
1
2
(d)
(
)
-2 -1 0 1 2 3 4 5
-0.2
-0.1
0
0.1(e)
vy (
m/s
)
-2 -1 0 1 2 3 4 5
-1
0
1
(f)
a y (
m/s
2)
-2 -1 0 1 2 3 4 5
-2
-1
0
1(g)
Time in (s)
d
(/
s)
-2 -1 0 1 2 3 4 5
-2
0
2
(h)
Time in (s)
d
(/
s)
-2 -1 0 1 2 3 4 5
-10
0
10
20
(i)
Time in (s)
dd
(/
s2)
0 50 100 150 200
0
0.5
1
y (
m)
x (m)
(a)
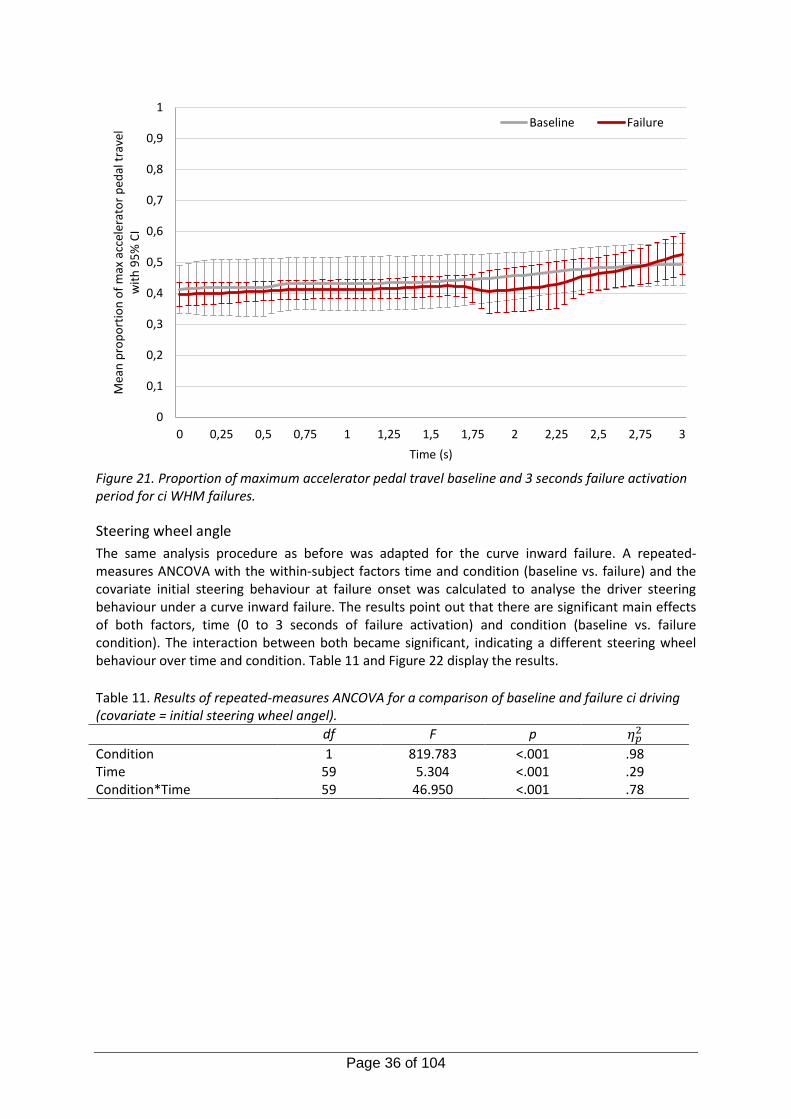
Page 36 of 104
Figure 21. Proportion of maximum accelerator pedal travel baseline and 3 seconds failure activation period for ci WHM failures.
Steering wheel angle
The same analysis procedure as before was adapted for the curve inward failure. A repeated-measures ANCOVA with the within-subject factors time and condition (baseline vs. failure) and the covariate initial steering behaviour at failure onset was calculated to analyse the driver steering behaviour under a curve inward failure. The results point out that there are significant main effects of both factors, time (0 to 3 seconds of failure activation) and condition (baseline vs. failure condition). The interaction between both became significant, indicating a different steering wheel behaviour over time and condition. Table 11 and Figure 22 display the results.
Table 11. Results of repeated-measures ANCOVA for a comparison of baseline and failure ci driving (covariate = initial steering wheel angel).
df F p 𝜂𝑝2
Condition 1 819.783 <.001 .98 Time 59 5.304 <.001 .29 Condition*Time 59 46.950 <.001 .78
0
0,1
0,2
0,3
0,4
0,5
0,6
0,7
0,8
0,9
1
0 0,25 0,5 0,75 1 1,25 1,5 1,75 2 2,25 2,5 2,75 3
Mea
n p
rop
ort
ion
of
max
acc
eler
ato
r p
edal
tra
vel
wit
h 9
5%
CI
Time (s)
Baseline Failure
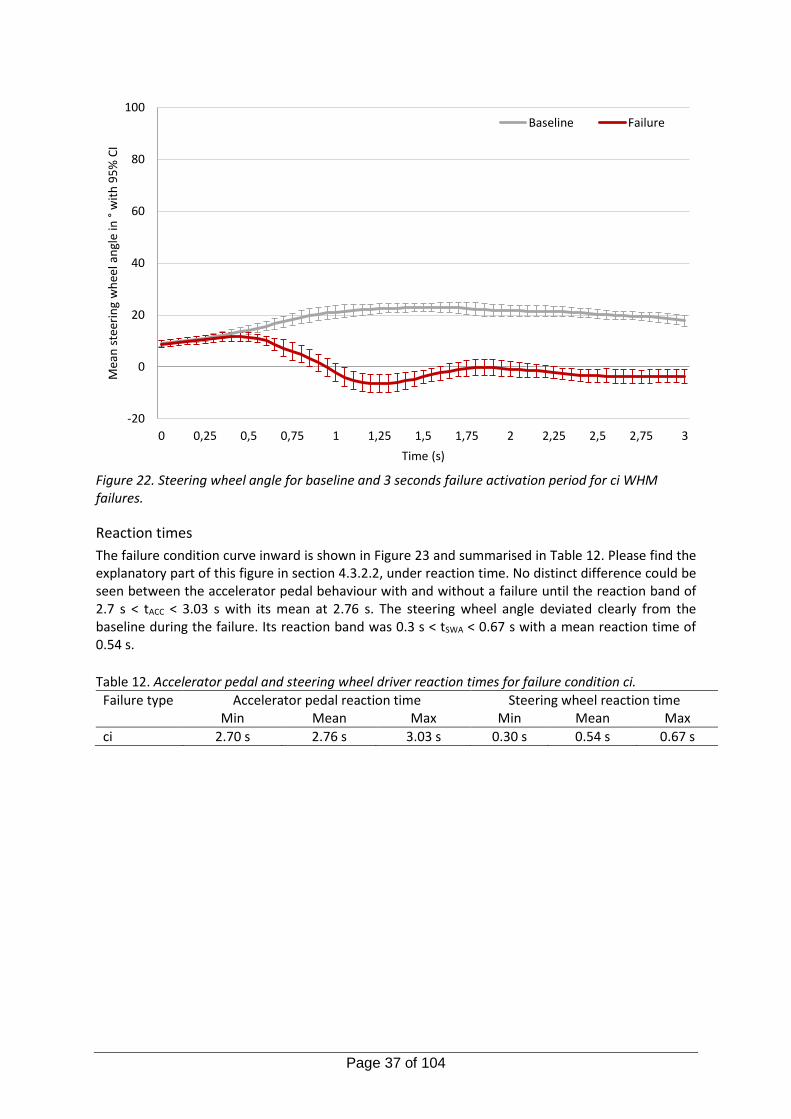
Page 37 of 104
Figure 22. Steering wheel angle for baseline and 3 seconds failure activation period for ci WHM failures.
Reaction times
The failure condition curve inward is shown in Figure 23 and summarised in Table 12. Please find the explanatory part of this figure in section 4.3.2.2, under reaction time. No distinct difference could be seen between the accelerator pedal behaviour with and without a failure until the reaction band of 2.7 s < tACC < 3.03 s with its mean at 2.76 s. The steering wheel angle deviated clearly from the baseline during the failure. Its reaction band was 0.3 s < tSWA < 0.67 s with a mean reaction time of 0.54 s.
Table 12. Accelerator pedal and steering wheel driver reaction times for failure condition ci. Failure type Accelerator pedal reaction time Steering wheel reaction time Min Mean Max Min Mean Max
ci 2.70 s 2.76 s 3.03 s 0.30 s 0.54 s 0.67 s
-20
0
20
40
60
80
100
0 0,25 0,5 0,75 1 1,25 1,5 1,75 2 2,25 2,5 2,75 3
Mea
n s
teer
ing
wh
eel a
ngl
e in
°w
ith
95
% C
I
Time (s)
Baseline Failure
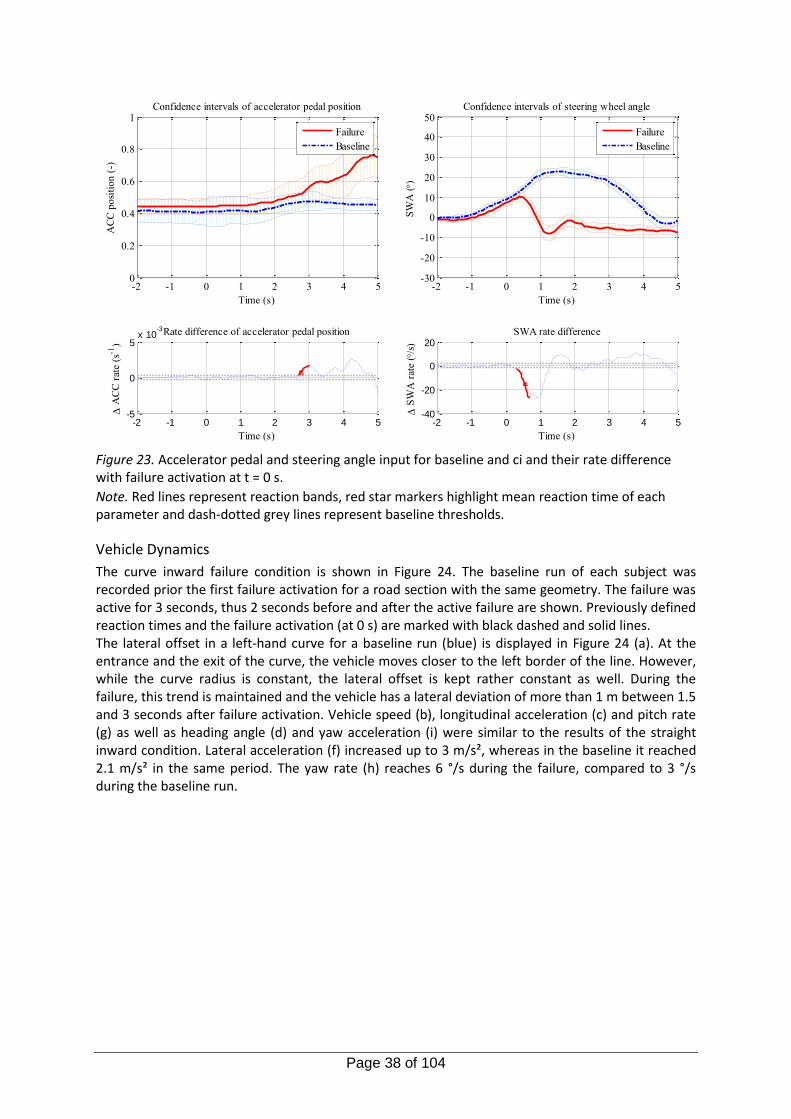
Page 38 of 104
Figure 23. Accelerator pedal and steering angle input for baseline and ci and their rate difference with failure activation at t = 0 s.
Note. Red lines represent reaction bands, red star markers highlight mean reaction time of each parameter and dash-dotted grey lines represent baseline thresholds.
Vehicle Dynamics
The curve inward failure condition is shown in Figure 24. The baseline run of each subject was recorded prior the first failure activation for a road section with the same geometry. The failure was active for 3 seconds, thus 2 seconds before and after the active failure are shown. Previously defined reaction times and the failure activation (at 0 s) are marked with black dashed and solid lines. The lateral offset in a left-hand curve for a baseline run (blue) is displayed in Figure 24 (a). At the entrance and the exit of the curve, the vehicle moves closer to the left border of the line. However, while the curve radius is constant, the lateral offset is kept rather constant as well. During the failure, this trend is maintained and the vehicle has a lateral deviation of more than 1 m between 1.5 and 3 seconds after failure activation. Vehicle speed (b), longitudinal acceleration (c) and pitch rate (g) as well as heading angle (d) and yaw acceleration (i) were similar to the results of the straight inward condition. Lateral acceleration (f) increased up to 3 m/s², whereas in the baseline it reached 2.1 m/s² in the same period. The yaw rate (h) reaches 6 °/s during the failure, compared to 3 °/s during the baseline run.
-2 -1 0 1 2 3 4 50
0.2
0.4
0.6
0.8
1
Time (s)
AC
C p
osi
tion (
-)Confidence intervals of accelerator pedal position
Failure
Baseline
-2 -1 0 1 2 3 4 5-5
0
5x 10
-3
Time (s)
A
CC
rat
e (s
-1)
Rate difference of accelerator pedal position
-2 -1 0 1 2 3 4 5-30
-20
-10
0
10
20
30
40
50
Time (s)
SW
A ()
Confidence intervals of steering wheel angle
Failure
Baseline
-2 -1 0 1 2 3 4 5-40
-20
0
20
Time (s)
S
WA
rat
e (
/s)
SWA rate difference
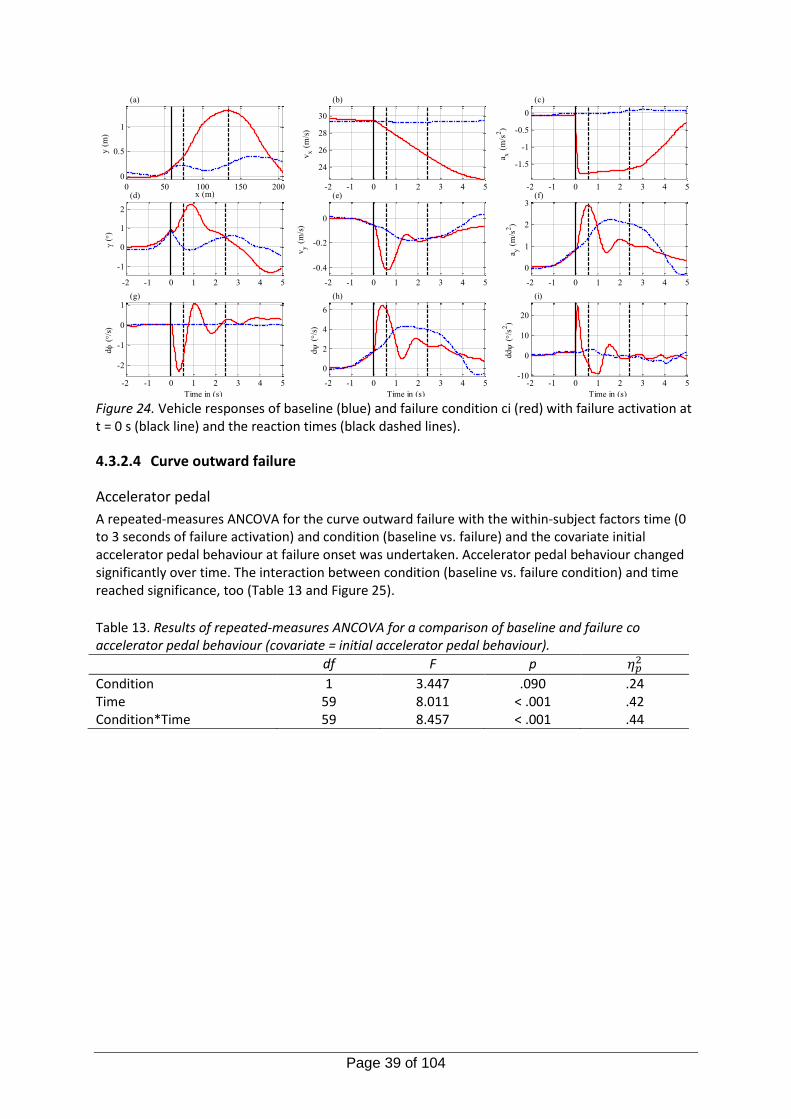
Page 39 of 104
Figure 24. Vehicle responses of baseline (blue) and failure condition ci (red) with failure activation at t = 0 s (black line) and the reaction times (black dashed lines).
4.3.2.4 Curve outward failure
Accelerator pedal
A repeated-measures ANCOVA for the curve outward failure with the within-subject factors time (0 to 3 seconds of failure activation) and condition (baseline vs. failure) and the covariate initial accelerator pedal behaviour at failure onset was undertaken. Accelerator pedal behaviour changed significantly over time. The interaction between condition (baseline vs. failure condition) and time reached significance, too (Table 13 and Figure 25).
Table 13. Results of repeated-measures ANCOVA for a comparison of baseline and failure co accelerator pedal behaviour (covariate = initial accelerator pedal behaviour).
df F p 𝜂𝑝2
Condition 1 3.447 .090 .24 Time 59 8.011 < .001 .42 Condition*Time 59 8.457 < .001 .44
-2 -1 0 1 2 3 4 5
24
26
28
30
(b)
vx (
m/s
)
-2 -1 0 1 2 3 4 5
-1.5
-1
-0.5
0
(c)
a x (
m/s
2)
-2 -1 0 1 2 3 4 5
-1
0
1
2
(d)
(
)
-2 -1 0 1 2 3 4 5
-0.4
-0.2
0
(e)
vy (
m/s
)
-2 -1 0 1 2 3 4 5
0
1
2
3(f)
a y (
m/s
2)
-2 -1 0 1 2 3 4 5
-2
-1
0
1(g)
Time in (s)
d
(/
s)
-2 -1 0 1 2 3 4 5
0
2
4
6
(h)
Time in (s)
d
(/
s)
-2 -1 0 1 2 3 4 5-10
0
10
20
(i)
Time in (s)
dd
(/
s2)
0 50 100 150 200
0
0.5
1
y (
m)
x (m)
(a)
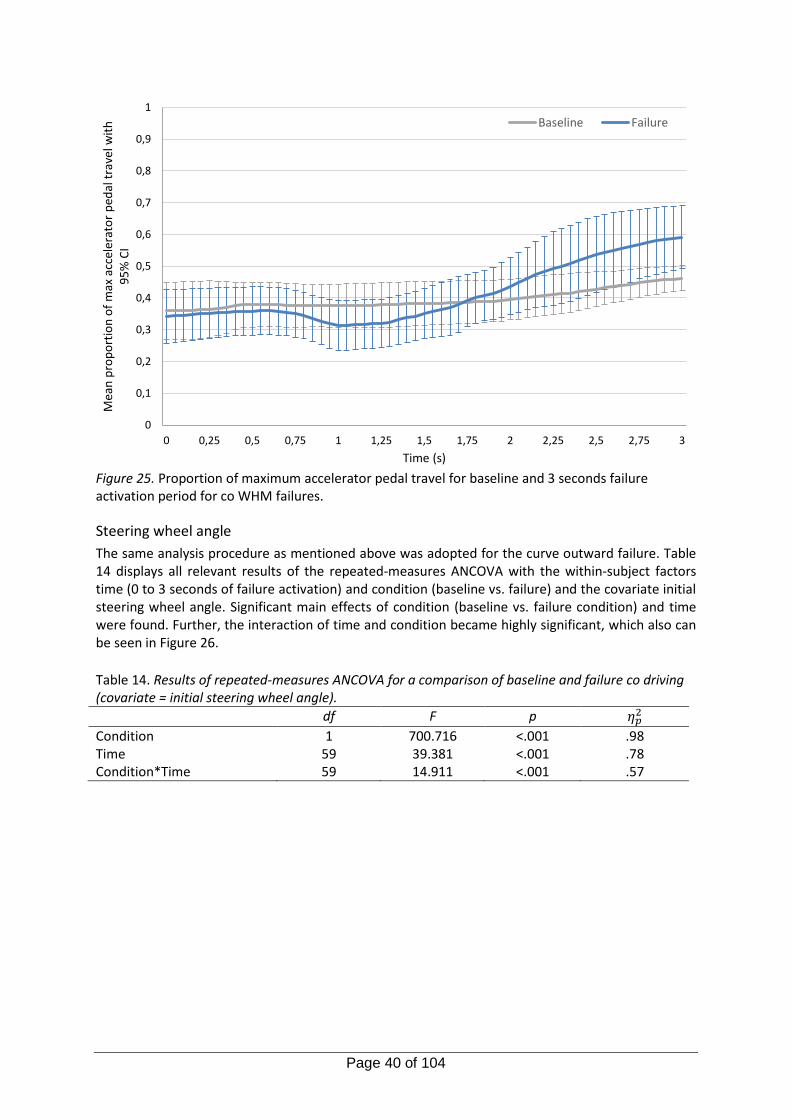
Page 40 of 104
Figure 25. Proportion of maximum accelerator pedal travel for baseline and 3 seconds failure activation period for co WHM failures.
Steering wheel angle
The same analysis procedure as mentioned above was adopted for the curve outward failure. Table 14 displays all relevant results of the repeated-measures ANCOVA with the within-subject factors time (0 to 3 seconds of failure activation) and condition (baseline vs. failure) and the covariate initial steering wheel angle. Significant main effects of condition (baseline vs. failure condition) and time were found. Further, the interaction of time and condition became highly significant, which also can be seen in Figure 26.
Table 14. Results of repeated-measures ANCOVA for a comparison of baseline and failure co driving (covariate = initial steering wheel angle).
df F p 𝜂𝑝2
Condition 1 700.716 <.001 .98 Time 59 39.381 <.001 .78 Condition*Time 59 14.911 <.001 .57
0
0,1
0,2
0,3
0,4
0,5
0,6
0,7
0,8
0,9
1
0 0,25 0,5 0,75 1 1,25 1,5 1,75 2 2,25 2,5 2,75 3
Mea
n p
rop
ort
ion
of
max
acc
eler
ato
r p
edal
tra
vel w
ith
95
% C
I
Time (s)
Baseline Failure
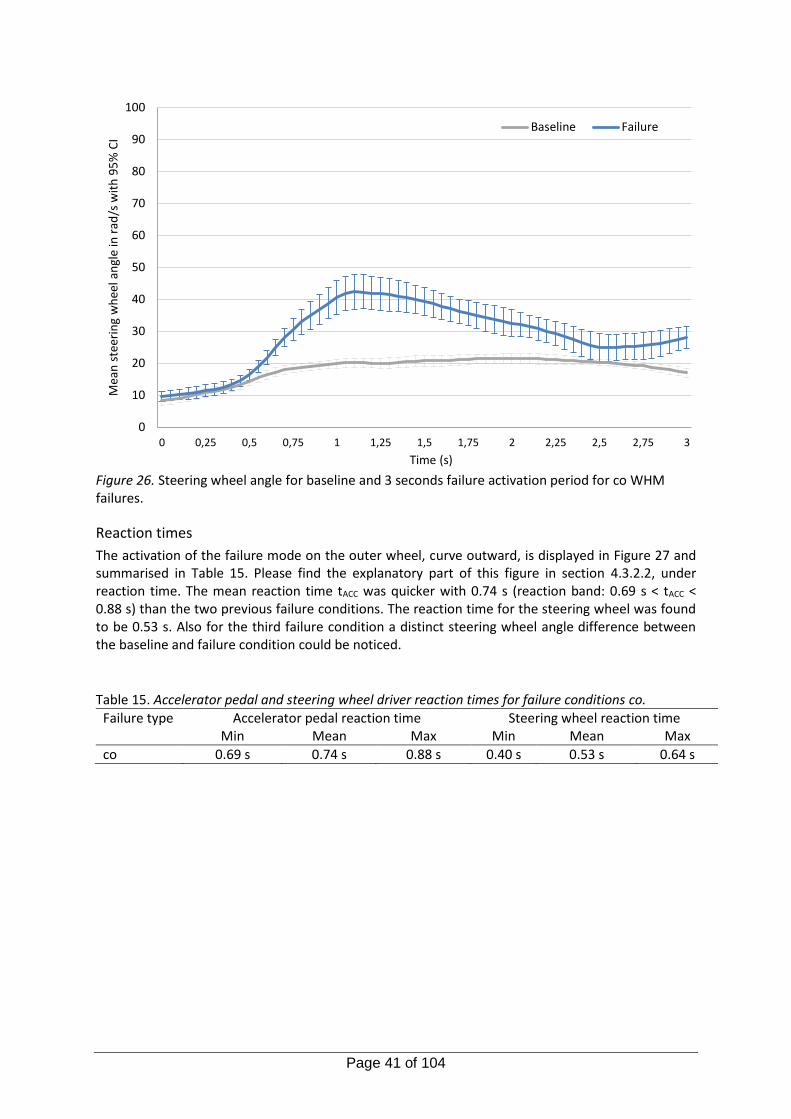
Page 41 of 104
Figure 26. Steering wheel angle for baseline and 3 seconds failure activation period for co WHM failures.
Reaction times
The activation of the failure mode on the outer wheel, curve outward, is displayed in Figure 27 and summarised in Table 15. Please find the explanatory part of this figure in section 4.3.2.2, under reaction time. The mean reaction time tACC was quicker with 0.74 s (reaction band: 0.69 s < tACC < 0.88 s) than the two previous failure conditions. The reaction time for the steering wheel was found to be 0.53 s. Also for the third failure condition a distinct steering wheel angle difference between the baseline and failure condition could be noticed.
Table 15. Accelerator pedal and steering wheel driver reaction times for failure conditions co.
Failure type Accelerator pedal reaction time Steering wheel reaction time Min Mean Max Min Mean Max
co 0.69 s 0.74 s 0.88 s 0.40 s 0.53 s 0.64 s
0
10
20
30
40
50
60
70
80
90
100
0 0,25 0,5 0,75 1 1,25 1,5 1,75 2 2,25 2,5 2,75 3
Mea
n s
teer
ing
wh
eel a
ngl
e in
rad
/s w
ith
95
% C
I
Time (s)
Baseline Failure
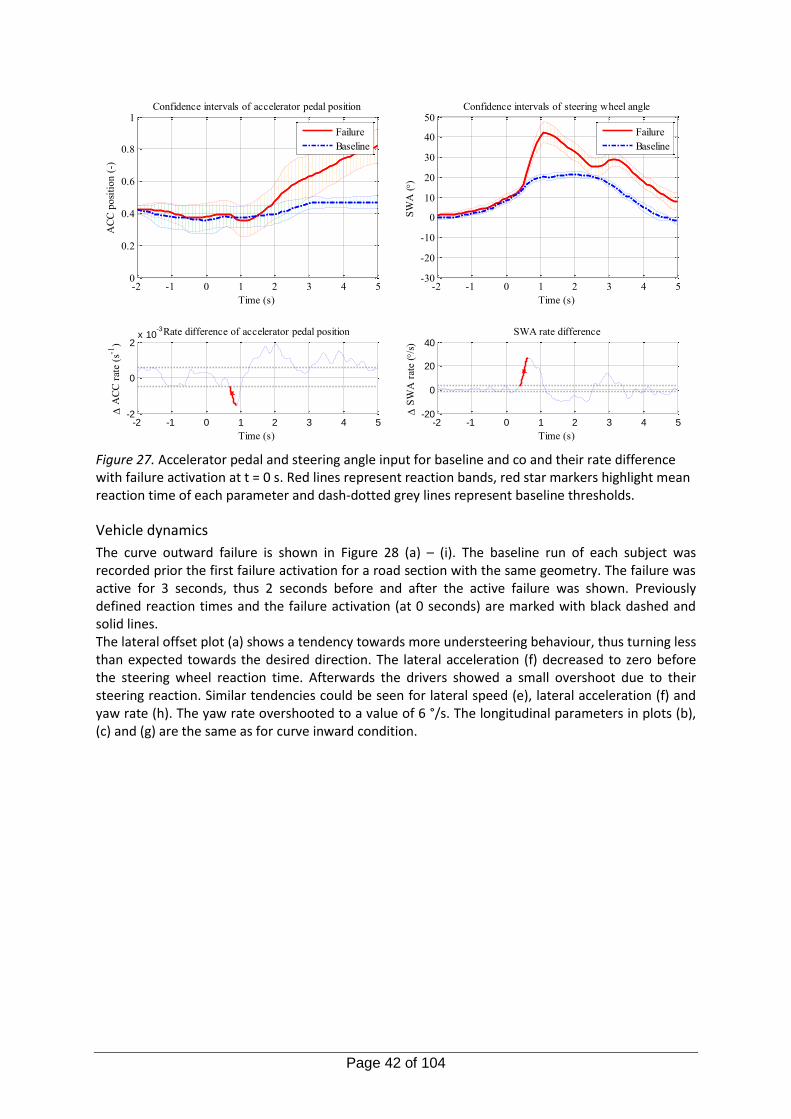
Page 42 of 104
Figure 27. Accelerator pedal and steering angle input for baseline and co and their rate difference with failure activation at t = 0 s. Red lines represent reaction bands, red star markers highlight mean reaction time of each parameter and dash-dotted grey lines represent baseline thresholds.
Vehicle dynamics
The curve outward failure is shown in Figure 28 (a) – (i). The baseline run of each subject was recorded prior the first failure activation for a road section with the same geometry. The failure was active for 3 seconds, thus 2 seconds before and after the active failure was shown. Previously defined reaction times and the failure activation (at 0 seconds) are marked with black dashed and solid lines. The lateral offset plot (a) shows a tendency towards more understeering behaviour, thus turning less than expected towards the desired direction. The lateral acceleration (f) decreased to zero before the steering wheel reaction time. Afterwards the drivers showed a small overshoot due to their steering reaction. Similar tendencies could be seen for lateral speed (e), lateral acceleration (f) and yaw rate (h). The yaw rate overshooted to a value of 6 °/s. The longitudinal parameters in plots (b), (c) and (g) are the same as for curve inward condition.
-2 -1 0 1 2 3 4 50
0.2
0.4
0.6
0.8
1
Time (s)
AC
C p
osi
tion (
-)Confidence intervals of accelerator pedal position
Failure
Baseline
-2 -1 0 1 2 3 4 5-2
0
2x 10
-3
Time (s)
A
CC
rat
e (s
-1)
Rate difference of accelerator pedal position
-2 -1 0 1 2 3 4 5-30
-20
-10
0
10
20
30
40
50
Time (s)
SW
A ()
Confidence intervals of steering wheel angle
Failure
Baseline
-2 -1 0 1 2 3 4 5-20
0
20
40
Time (s)
S
WA
rat
e (
/s)
SWA rate difference
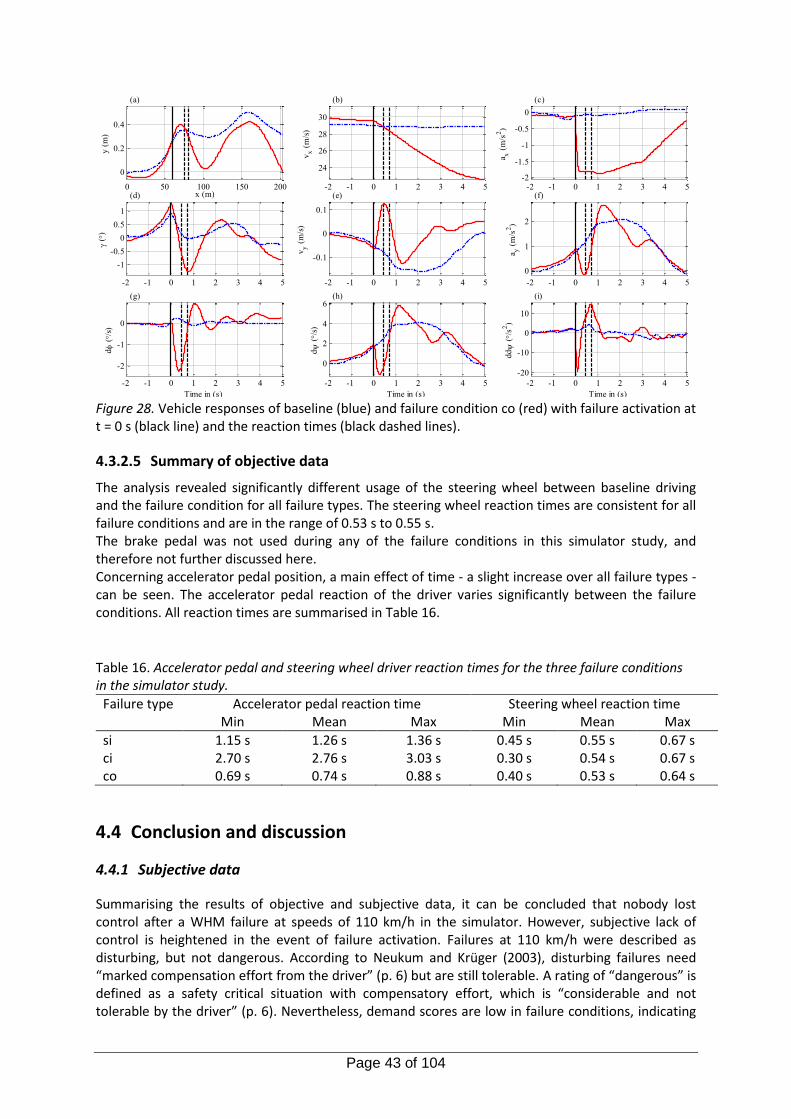
Page 43 of 104
Figure 28. Vehicle responses of baseline (blue) and failure condition co (red) with failure activation at t = 0 s (black line) and the reaction times (black dashed lines).
4.3.2.5 Summary of objective data
The analysis revealed significantly different usage of the steering wheel between baseline driving and the failure condition for all failure types. The steering wheel reaction times are consistent for all failure conditions and are in the range of 0.53 s to 0.55 s. The brake pedal was not used during any of the failure conditions in this simulator study, and therefore not further discussed here. Concerning accelerator pedal position, a main effect of time - a slight increase over all failure types - can be seen. The accelerator pedal reaction of the driver varies significantly between the failure conditions. All reaction times are summarised in Table 16.
Table 16. Accelerator pedal and steering wheel driver reaction times for the three failure conditions in the simulator study.
Failure type Accelerator pedal reaction time Steering wheel reaction time Min Mean Max Min Mean Max
si 1.15 s 1.26 s 1.36 s 0.45 s 0.55 s 0.67 s ci 2.70 s 2.76 s 3.03 s 0.30 s 0.54 s 0.67 s co 0.69 s 0.74 s 0.88 s 0.40 s 0.53 s 0.64 s
4.4 Conclusion and discussion
4.4.1 Subjective data
Summarising the results of objective and subjective data, it can be concluded that nobody lost control after a WHM failure at speeds of 110 km/h in the simulator. However, subjective lack of control is heightened in the event of failure activation. Failures at 110 km/h were described as disturbing, but not dangerous. According to Neukum and Krüger (2003), disturbing failures need “marked compensation effort from the driver” (p. 6) but are still tolerable. A rating of “dangerous” is defined as a safety critical situation with compensatory effort, which is “considerable and not tolerable by the driver” (p. 6). Nevertheless, demand scores are low in failure conditions, indicating
-2 -1 0 1 2 3 4 5
24
26
28
30
(b)
vx (
m/s
)
-2 -1 0 1 2 3 4 5-2
-1.5
-1
-0.5
0
(c)
a x (
m/s
2)
-2 -1 0 1 2 3 4 5
-1
-0.5
0
0.5
1
(d)
(
)
-2 -1 0 1 2 3 4 5
-0.1
0
0.1
(e)
vy (
m/s
)
-2 -1 0 1 2 3 4 5
0
1
2
(f)
a y (
m/s
2)
-2 -1 0 1 2 3 4 5
-2
-1
0
(g)
Time in (s)
d
(/
s)
-2 -1 0 1 2 3 4 5
0
2
4
6(h)
Time in (s)
d
(/
s)
-2 -1 0 1 2 3 4 5
-20
-10
0
10
(i)
Time in (s)
dd
(/
s2)
0 50 100 150 200
0
0.2
0.4
y (
m)
x (m)
(a)
Page 44 of 104
reasonable demands drivers have to cope with. Compared to normal conditions subjects are more engrossed in driving while failure activation, which is in line with the assumptions. In this study the baseline NASA-TLX scores represent a combination of straight and curve workload. Single workload scores for straights and curves were not assessed. It is conceivable that workload might differ when considering these manoeuvres individually.
4.4.2 Effect of failure position and curvature
Interestingly, inward failures significantly differ in the level of stress compared to their baseline, but the outward failure did not. This result could be possibly explained by an effect of failure position. It is reasonable that subjects are more concerned about inward failures because entering the adjacent driving lane or interfering with oncoming traffic represents a more critical situation than ending up in the roadside verge. Oncoming traffic in the event of failure activation was not simulated in the presented simulator study. It is assumed though, that these situations will be rated more stressful and risky than the ones tested here. Inward failures force the car to the adjacent lane, out of the driver’s comfort-zone. Failures on the right vehicle side push the car to the roadside verge. According to Dijksterhuis, Brookhuis and De Waard (2011) it is a natural reaction of drivers to steer more towards the roadside edge in case of higher demands, which they operationalised with decreasing lane width and oncoming traffic. Another explanation for a less severe rating for the outward failure is that trajectory corrections can be achieved with continued steering input in the initial direction of driving, whereas an inward failure requires a counter steering action. Taking a closer look on controllability, it is possible to identify an effect of curvature. Failures in curves significantly differ from their baseline, but the straight failures do not. Combining the results, it seems as if the curve inward failure is the most critical one. Further research on different failure types (front wheels, different wheels at same time, road geometry) should be undertaken to corroborate this claim.
4.4.3 Objective data
Regarding vehicle control, it can be assumed that steering is the major compensatory action for all failure types tested here. Referring to the figures in the steering wheel angle analysis section, steering wheel angle adjustment takes place approximately 0.5 seconds after failure activation and is significantly different from normal driving while failure activation for all failure types. These results are in line with findings from research dealing with reactions to wind gusts (Wierwille, Casali & Repa, 1983). None of the subjects used the brake, which might be a consequence of the combination of the decelerating vehicle and the driving task to maintain speed. On average, subjects release the accelerator pedal (after 0.7 - 1.25 seconds) and accelerate again shortly after that. This could be caused by the driving simulator as longitudinal accelerations are not experienced to the same extent as in a real vehicle. For the failure conditions straight inward and curve outward failure, the driver lifts the foot off the accelerator pedal before realising that the vehicle is slowing down, resulting in an increasing accelerator pedal position again. Further, the straight inward and curve inward failure have long accelerator pedal reaction times, while the curve outward failure is significantly shorter. The overall long accelerator pedal reaction times indicate that the subjects made a conscious decision for increasing the speed after the vehicle was under control again. One explanation could be that the perception of the longitudinal motion is sensed to a different extent by the drivers compared to the perception of lateral and yaw motion. This can be explained by the different human sensory systems that are responsible for sensing signals, namely the visual system, the vestibular system in the ear as well as proprioception, to acquire information about spatial position and motion as well as force exposure. Another aspect is the omitted pedal movement time in case of a steering response, and thus the reaction time is lower (Green, 2000). Further, the steering reaction seems to be a reflex to the unexpected error in yaw motion and heading angle. The accelerator pedal reaction
Page 45 of 104
appears to be consciously taken after the reduction in speed was noticed. Note, that the reduction in speed is scaled down in the driving simulator, and thus experienced less than in a real vehicle. The vehicle behaviour shows that each of the failure conditions affect the lateral and yaw motion. At the speed of 110 km/h and dry road conditions, it can be concluded that lateral and yaw motion do not lead to vehicle instabilities. However, a lateral offset of more than 1 meter is reached for both, straight inward and curve inward. It takes more than 4 s to guide the vehicle back into its own lane. Firstly, no risk of meeting a car in the oncoming lane during the failure was apparent. The good visibility on this road section made the driver aware of this factor. Therefore, the steering input back to the original lane could be done in a not so urgent manoeuvre when compared with a situation including opposing traffic. Further, the subjects might have been aware of operating a simulator. The motion cueing system does represent a real vehicle, but with certain constraints that make the simulator not feel exactly the same for demanding dynamic situations. In case of oncoming traffic, this can therefore lead to dangerous outcomes for the driver and other traffic participants. Different road conditions (e.g., a partly wet road) might lead to critical situations as well. Failure curve outward condition seems to be least critical from a vehicle dynamics perspective. However, this does not mean that this failure condition is less critical as the outside of a left-hand curve usually has strict borders such as crash barriers, ditches or bike lanes, among others.
4.4.4 Implications
Generally, the handling of the vehicle after WHM failure at a speed of 110 km/h in a simulator was still possible. Contemplating that the failure (torque on a specific wheel) was only active for 3 seconds, feelings of lack of control in real life failure event might be more pronounced than in the scenarios tested in the present study. In the event of a total system failure there is no more power transmitted to the wheel, resulting in permanent effects on the vehicle, thus, induced stress, risk, lack of control, workload and disturbance ratings might be increased. Moreover, impact of oncoming traffic and other factors influencing driving on these ratings should be considered. Also, consequences for following cars and oncoming vehicles are to be considered in future research. The question arises if and how other cars can be informed about the unexpected vehicle behaviour while the failure occurs.
Page 46 of 104
5. FIELD STUDY I: WHEEL HUB MOTOR FAILURES
5.1 Research objectives
In the scope of test track study I different wheel hub motor (WHM) failures in an electric vehicle (EV) were tested. The main objective of the study was to assess the impact of such a failure on the driver (cognition and behaviour) as well as the impact on vehicle dynamics and traffic safety. Participants’ driving reactions to the failure onset and their subjective evaluations of the situation of failure activation were examined.
5.2 Method
In order to study the WHM failure, a mixed-design was used. Failure type (straight inward (si) vs. curve inward (ci) vs. curve outward (co)) and experience (Block 1 vs. Block 2) were introduced as within factors. The between factor was the presence of a warning tone (no warning tone vs. warning tone shortly before failure activation). Subjects in the experimental group were informed about the upcoming failure by a warning tone; subjects in the control group were not. All participants experienced each of the three failure types twice, first time on Block 1 and second time on Block 2. The three failures are parallel to the simulator study on WHM failures:
a) rear left WHM failure during straight line driving,
b) rear left WHM failure in a left curve and
c) rear right WHM failure in a left curve.
5.2.1 Sample
Participants for the test track experiment at Technische Universität Chemnitz (TUC) were selected via an online questionnaire (screener), which was published on the university’s homepage. There was also an article in the regional newspaper informing and inviting drivers for the experiment. Out of 210 people who filled in the screener, 51 participants were selected to take part in the study. The sample consisted of 37 males and 14 females with an average age of 31.25 years (SD = 6.08). The education background of the participants was as follows: 70.6 % held a university degree, 9.8% completed a technical school, 11.8 % finished their vocational training and 5.9% were still in education. There was only one participant who stated to have none of the given qualifications. Participants held their driving licence for 12.29 years (SD = 5.92) on average. The average annual mileage was approximately 17000 km (SD = 10764.30). One third (33.3 %) had experience with an electric car (M = 138.53 km; SD = 144.89, Min = 5.00, Max = 600.00). About one fifth (21.6 %) already drove a hybrid electric vehicle (M = 252.73 km; SD = 586.85, Min = 5, Max = 2000) before. Only nine subjects (17.6 %) drove an electric bike or scooter before (M = 24.89 km; SD = 32.38, Min = 1, Max = 100). Descriptive data for the experimental and control group can be found in Table 17. There was one drop out throughout the experiment due to technical reasons.
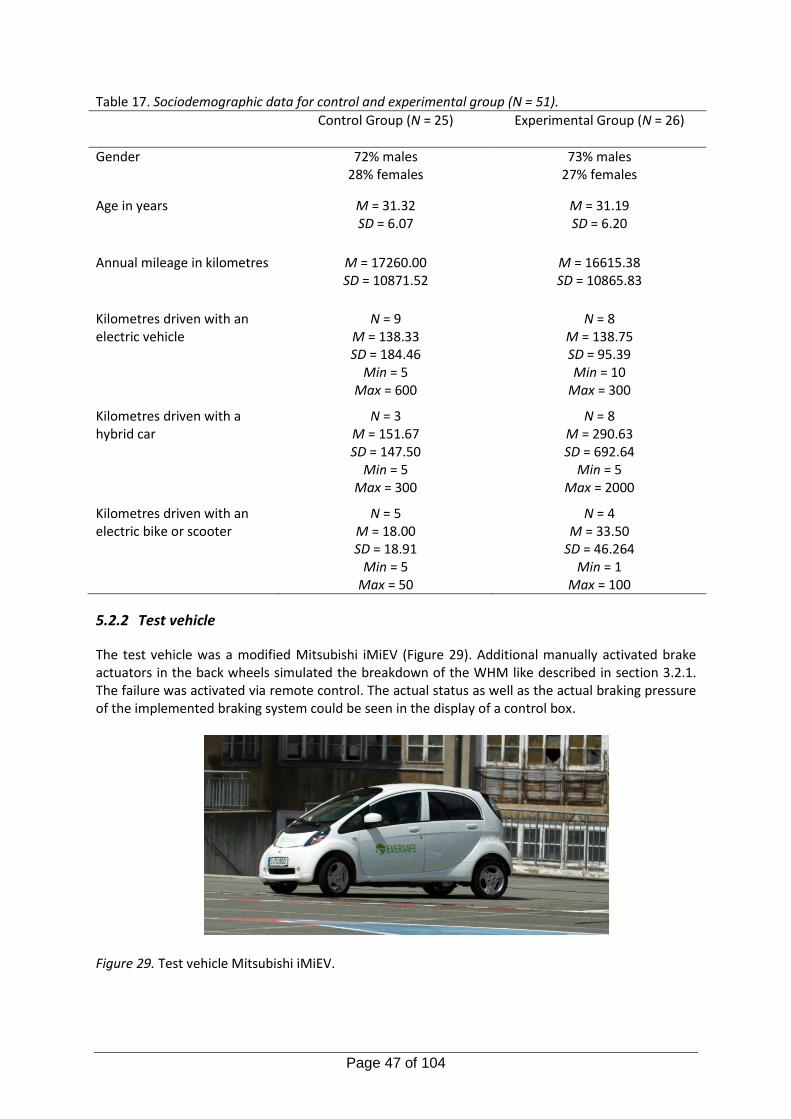
Page 47 of 104
Table 17. Sociodemographic data for control and experimental group (N = 51).
Control Group (N = 25) Experimental Group (N = 26)
Gender 72% males 28% females
73% males 27% females
Age in years M = 31.32 SD = 6.07
M = 31.19 SD = 6.20
Annual mileage in kilometres M = 17260.00 SD = 10871.52
M = 16615.38 SD = 10865.83
Kilometres driven with an electric vehicle
N = 9 M = 138.33 SD = 184.46
Min = 5 Max = 600
N = 8 M = 138.75 SD = 95.39 Min = 10
Max = 300
Kilometres driven with a hybrid car
N = 3 M = 151.67 SD = 147.50
Min = 5 Max = 300
N = 8 M = 290.63 SD = 692.64
Min = 5 Max = 2000
Kilometres driven with an electric bike or scooter
N = 5 M = 18.00 SD = 18.91
Min = 5 Max = 50
N = 4 M = 33.50
SD = 46.264 Min = 1
Max = 100
5.2.2 Test vehicle
The test vehicle was a modified Mitsubishi iMiEV (Figure 29). Additional manually activated brake actuators in the back wheels simulated the breakdown of the WHM like described in section 3.2.1. The failure was activated via remote control. The actual status as well as the actual braking pressure of the implemented braking system could be seen in the display of a control box.
Figure 29. Test vehicle Mitsubishi iMiEV.
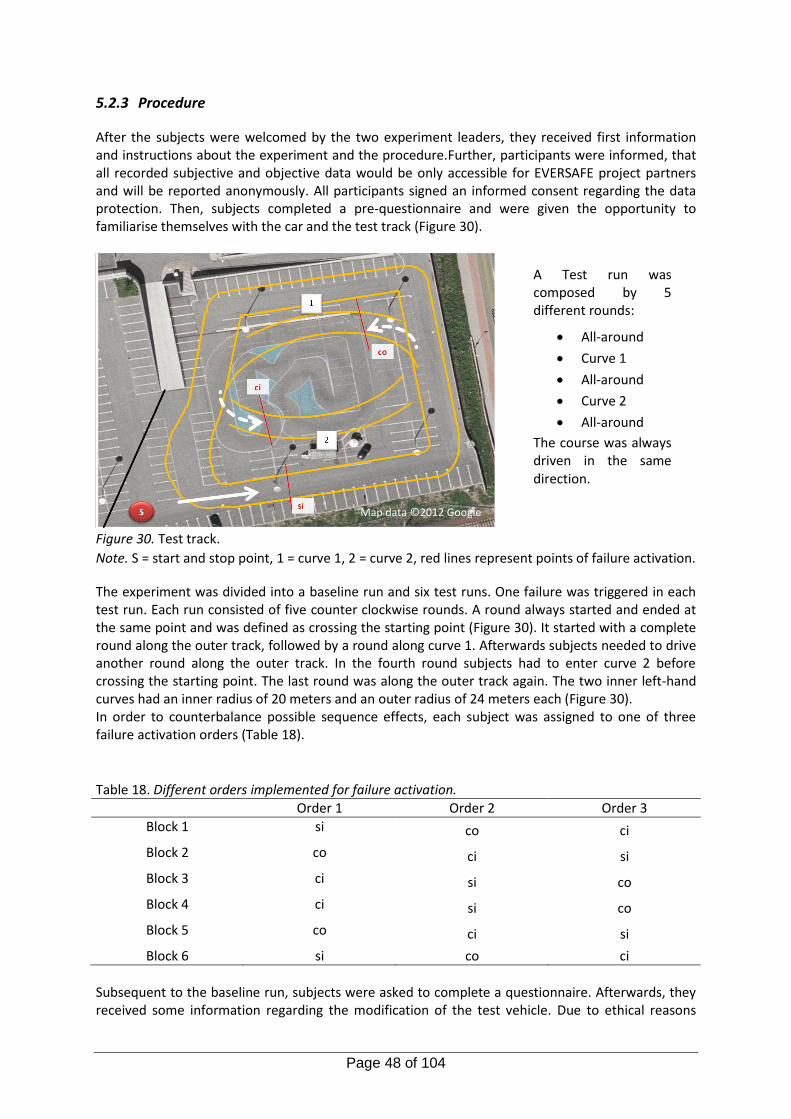
Page 48 of 104
5.2.3 Procedure
After the subjects were welcomed by the two experiment leaders, they received first information and instructions about the experiment and the procedure.Further, participants were informed, that all recorded subjective and objective data would be only accessible for EVERSAFE project partners and will be reported anonymously. All participants signed an informed consent regarding the data protection. Then, subjects completed a pre-questionnaire and were given the opportunity to familiarise themselves with the car and the test track (Figure 30).
Figure 30. Test track.
Note. S = start and stop point, 1 = curve 1, 2 = curve 2, red lines represent points of failure activation.
The experiment was divided into a baseline run and six test runs. One failure was triggered in each test run. Each run consisted of five counter clockwise rounds. A round always started and ended at the same point and was defined as crossing the starting point (Figure 30). It started with a complete round along the outer track, followed by a round along curve 1. Afterwards subjects needed to drive another round along the outer track. In the fourth round subjects had to enter curve 2 before crossing the starting point. The last round was along the outer track again. The two inner left-hand curves had an inner radius of 20 meters and an outer radius of 24 meters each (Figure 30). In order to counterbalance possible sequence effects, each subject was assigned to one of three failure activation orders (Table 18).
Table 18. Different orders implemented for failure activation. Order 1 Order 2 Order 3
Block 1 si co ci
Block 2 co ci si
Block 3 ci si co
Block 4 ci si co
Block 5 co ci si
Block 6 si co ci
Subsequent to the baseline run, subjects were asked to complete a questionnaire. Afterwards, they received some information regarding the modification of the test vehicle. Due to ethical reasons
A Test run was composed by 5 different rounds:
All-around
Curve 1
All-around
Curve 2
All-around
The course was always driven in the same direction.
Map data ©2012 Google
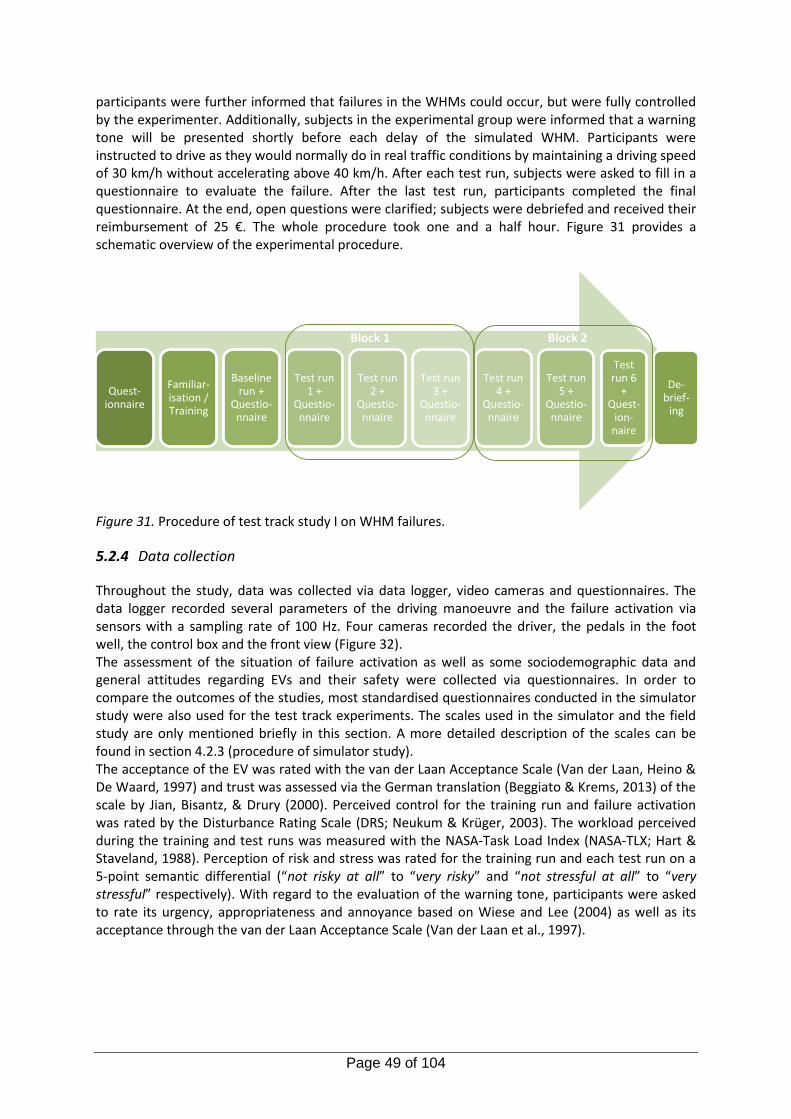
Page 49 of 104
participants were further informed that failures in the WHMs could occur, but were fully controlled by the experimenter. Additionally, subjects in the experimental group were informed that a warning tone will be presented shortly before each delay of the simulated WHM. Participants were instructed to drive as they would normally do in real traffic conditions by maintaining a driving speed of 30 km/h without accelerating above 40 km/h. After each test run, subjects were asked to fill in a questionnaire to evaluate the failure. After the last test run, participants completed the final questionnaire. At the end, open questions were clarified; subjects were debriefed and received their reimbursement of 25 €. The whole procedure took one and a half hour. Figure 31 provides a schematic overview of the experimental procedure.
Figure 31. Procedure of test track study I on WHM failures.
5.2.4 Data collection
Throughout the study, data was collected via data logger, video cameras and questionnaires. The data logger recorded several parameters of the driving manoeuvre and the failure activation via sensors with a sampling rate of 100 Hz. Four cameras recorded the driver, the pedals in the foot well, the control box and the front view (Figure 32). The assessment of the situation of failure activation as well as some sociodemographic data and general attitudes regarding EVs and their safety were collected via questionnaires. In order to compare the outcomes of the studies, most standardised questionnaires conducted in the simulator study were also used for the test track experiments. The scales used in the simulator and the field study are only mentioned briefly in this section. A more detailed description of the scales can be found in section 4.2.3 (procedure of simulator study). The acceptance of the EV was rated with the van der Laan Acceptance Scale (Van der Laan, Heino & De Waard, 1997) and trust was assessed via the German translation (Beggiato & Krems, 2013) of the scale by Jian, Bisantz, & Drury (2000). Perceived control for the training run and failure activation was rated by the Disturbance Rating Scale (DRS; Neukum & Krüger, 2003). The workload perceived during the training and test runs was measured with the NASA-Task Load Index (NASA-TLX; Hart & Staveland, 1988). Perception of risk and stress was rated for the training run and each test run on a 5-point semantic differential (“not risky at all” to “very risky” and “not stressful at all” to “very stressful” respectively). With regard to the evaluation of the warning tone, participants were asked to rate its urgency, appropriateness and annoyance based on Wiese and Lee (2004) as well as its acceptance through the van der Laan Acceptance Scale (Van der Laan et al., 1997).
Quest-ionnaire
Familiar-isation / Training
Baseline run +
Questio-nnaire
Test run 1 +
Questio-nnaire
Test run 2 +
Questio-nnaire
Test run 3 +
Questio-nnaire
Test run 4 +
Questio-nnaire
Test run 5 +
Questio-nnaire
Test run 6
+ Quest-
ion-naire
De-brief-
ing
Block 2 Block 1
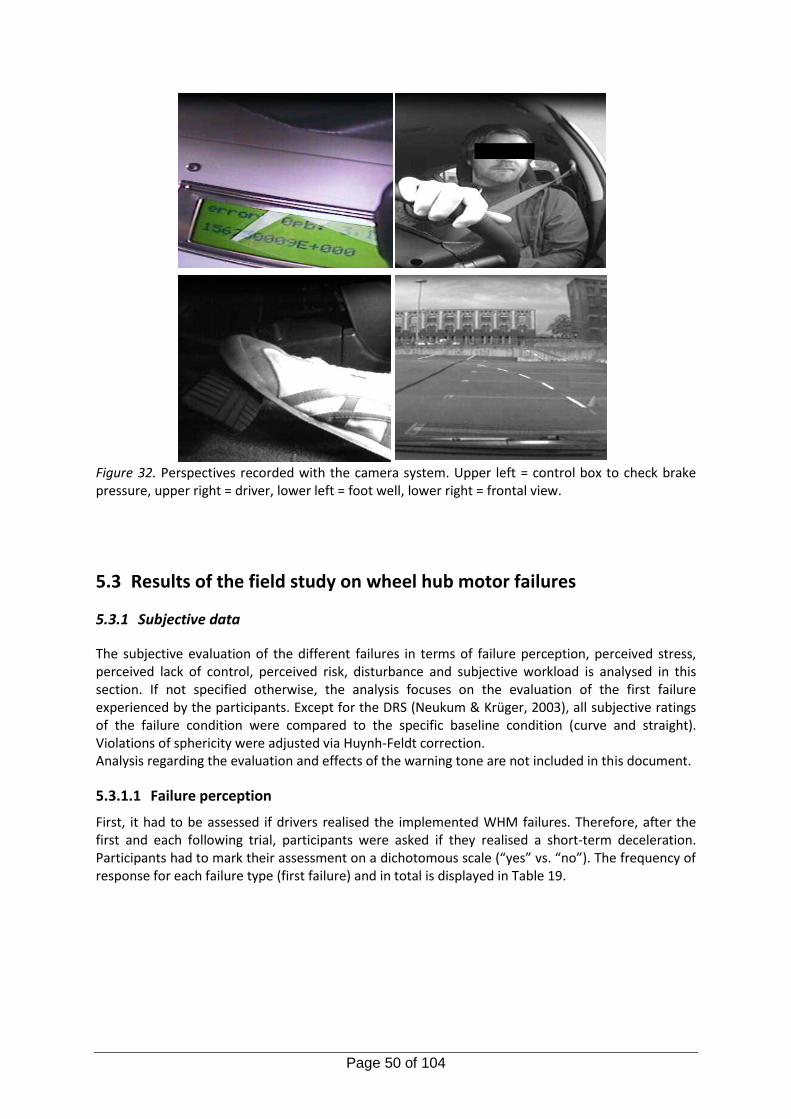
Page 50 of 104
Figure 32. Perspectives recorded with the camera system. Upper left = control box to check brake pressure, upper right = driver, lower left = foot well, lower right = frontal view.
5.3 Results of the field study on wheel hub motor failures
5.3.1 Subjective data
The subjective evaluation of the different failures in terms of failure perception, perceived stress, perceived lack of control, perceived risk, disturbance and subjective workload is analysed in this section. If not specified otherwise, the analysis focuses on the evaluation of the first failure experienced by the participants. Except for the DRS (Neukum & Krüger, 2003), all subjective ratings of the failure condition were compared to the specific baseline condition (curve and straight). Violations of sphericity were adjusted via Huynh-Feldt correction. Analysis regarding the evaluation and effects of the warning tone are not included in this document.
5.3.1.1 Failure perception
First, it had to be assessed if drivers realised the implemented WHM failures. Therefore, after the first and each following trial, participants were asked if they realised a short-term deceleration. Participants had to mark their assessment on a dichotomous scale (“yes” vs. “no”). The frequency of response for each failure type (first failure) and in total is displayed in Table 19.
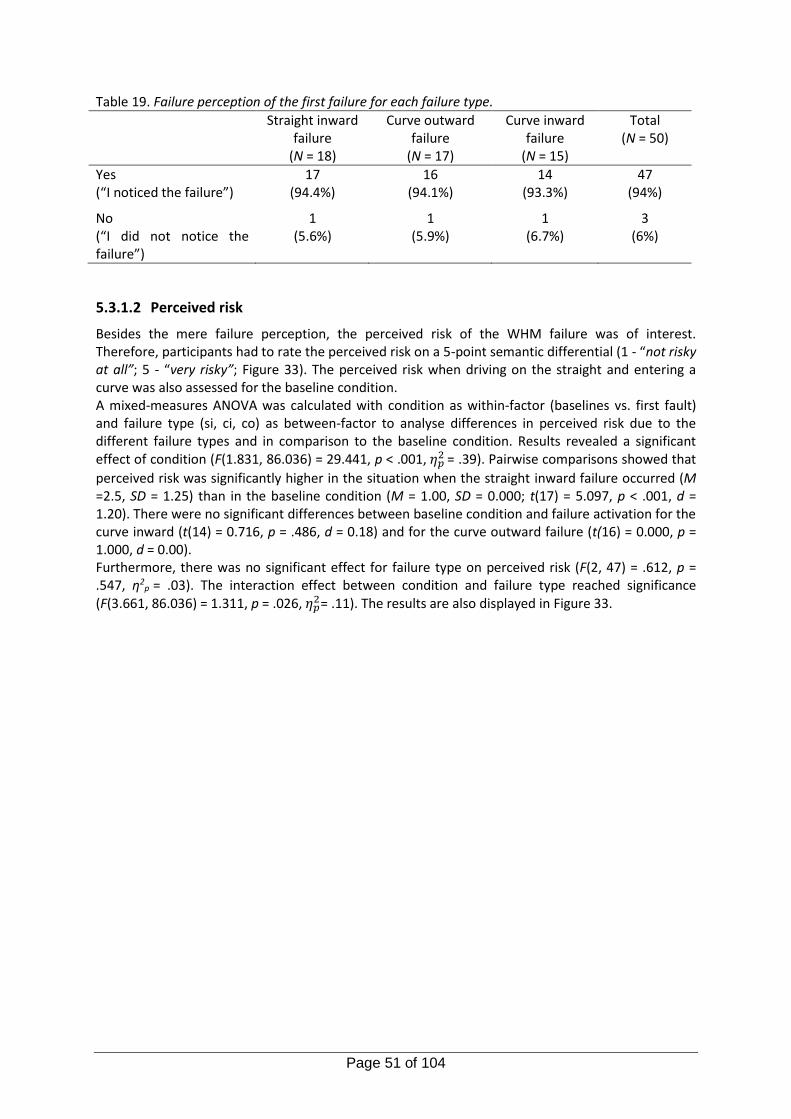
Page 51 of 104
Table 19. Failure perception of the first failure for each failure type.
Straight inward failure
(N = 18)
Curve outward failure
(N = 17)
Curve inward failure
(N = 15)
Total (N = 50)
Yes (“I noticed the failure”)
17 (94.4%)
16 (94.1%)
14 (93.3%)
47 (94%)
No (“I did not notice the failure”)
1 (5.6%)
1 (5.9%)
1 (6.7%)
3 (6%)
5.3.1.2 Perceived risk
Besides the mere failure perception, the perceived risk of the WHM failure was of interest. Therefore, participants had to rate the perceived risk on a 5-point semantic differential (1 - “not risky at all”; 5 - “very risky”; Figure 33). The perceived risk when driving on the straight and entering a curve was also assessed for the baseline condition. A mixed-measures ANOVA was calculated with condition as within-factor (baselines vs. first fault) and failure type (si, ci, co) as between-factor to analyse differences in perceived risk due to the different failure types and in comparison to the baseline condition. Results revealed a significant effect of condition (F(1.831, 86.036) = 29.441, p < .001, 𝜂𝑝
2 = .39). Pairwise comparisons showed that
perceived risk was significantly higher in the situation when the straight inward failure occurred (M =2.5, SD = 1.25) than in the baseline condition (M = 1.00, SD = 0.000; t(17) = 5.097, p < .001, d = 1.20). There were no significant differences between baseline condition and failure activation for the curve inward (t(14) = 0.716, p = .486, d = 0.18) and for the curve outward failure (t(16) = 0.000, p = 1.000, d = 0.00). Furthermore, there was no significant effect for failure type on perceived risk (F(2, 47) = .612, p = .547, η2
p = .03). The interaction effect between condition and failure type reached significance
(F(3.661, 86.036) = 1.311, p = .026, 𝜂𝑝2= .11). The results are also displayed in Figure 33.
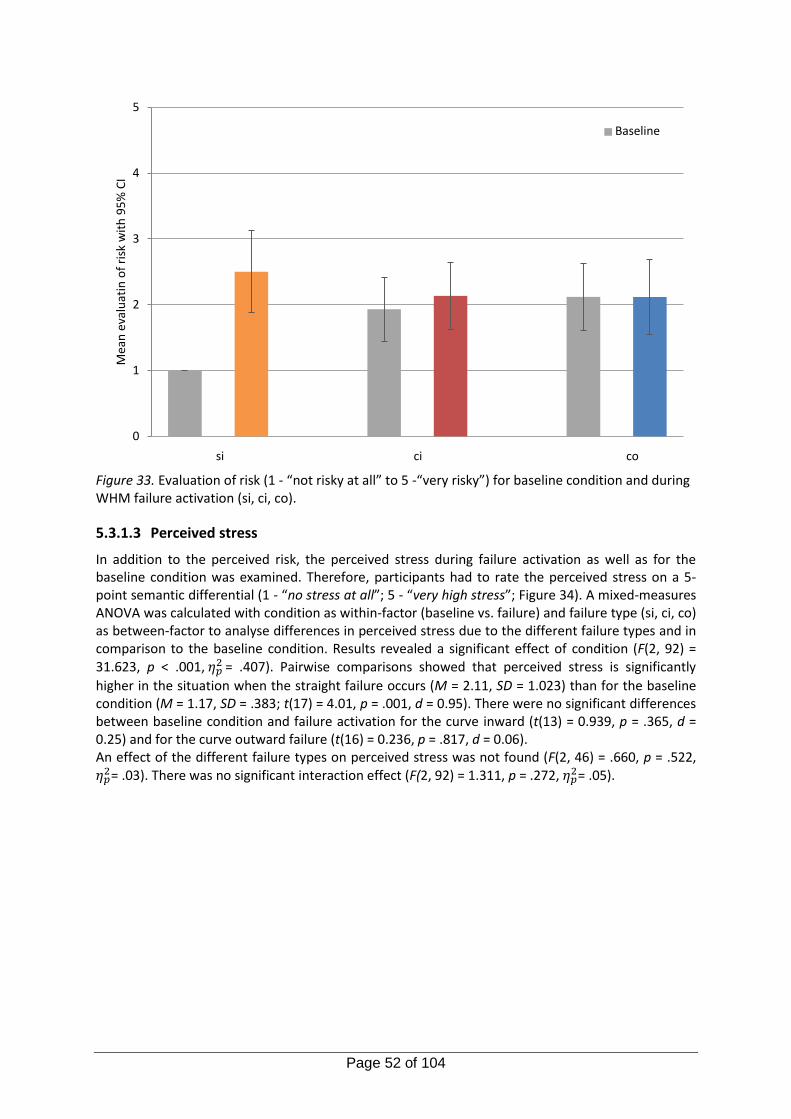
Page 52 of 104
Figure 33. Evaluation of risk (1 - “not risky at all” to 5 -“very risky”) for baseline condition and during WHM failure activation (si, ci, co).
5.3.1.3 Perceived stress
In addition to the perceived risk, the perceived stress during failure activation as well as for the baseline condition was examined. Therefore, participants had to rate the perceived stress on a 5-point semantic differential (1 - “no stress at all”; 5 - “very high stress”; Figure 34). A mixed-measures ANOVA was calculated with condition as within-factor (baseline vs. failure) and failure type (si, ci, co) as between-factor to analyse differences in perceived stress due to the different failure types and in comparison to the baseline condition. Results revealed a significant effect of condition (F(2, 92) = 31.623, p < .001, 𝜂𝑝
2 = .407). Pairwise comparisons showed that perceived stress is significantly
higher in the situation when the straight failure occurs (M = 2.11, SD = 1.023) than for the baseline condition (M = 1.17, SD = .383; t(17) = 4.01, p = .001, d = 0.95). There were no significant differences between baseline condition and failure activation for the curve inward (t(13) = 0.939, p = .365, d = 0.25) and for the curve outward failure (t(16) = 0.236, p = .817, d = 0.06). An effect of the different failure types on perceived stress was not found (F(2, 46) = .660, p = .522, 𝜂𝑝
2= .03). There was no significant interaction effect (F(2, 92) = 1.311, p = .272, 𝜂𝑝2= .05).
0
1
2
3
4
5M
ean
eva
luat
in o
f ri
sk w
ith
95
% C
I
si ci co
Baseline
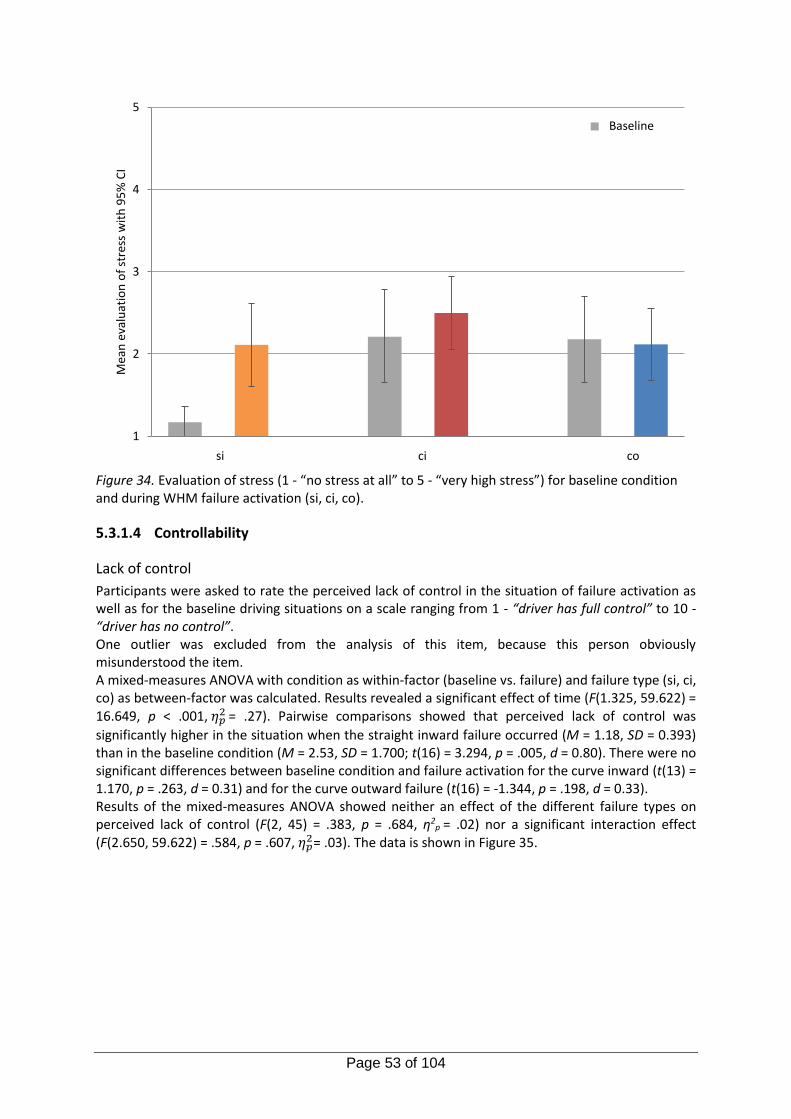
Page 53 of 104
Figure 34. Evaluation of stress (1 - “no stress at all” to 5 - “very high stress”) for baseline condition and during WHM failure activation (si, ci, co).
5.3.1.4 Controllability
Lack of control
Participants were asked to rate the perceived lack of control in the situation of failure activation as well as for the baseline driving situations on a scale ranging from 1 - “driver has full control” to 10 - “driver has no control”. One outlier was excluded from the analysis of this item, because this person obviously misunderstood the item. A mixed-measures ANOVA with condition as within-factor (baseline vs. failure) and failure type (si, ci, co) as between-factor was calculated. Results revealed a significant effect of time (F(1.325, 59.622) = 16.649, p < .001, 𝜂𝑝
2 = .27). Pairwise comparisons showed that perceived lack of control was
significantly higher in the situation when the straight inward failure occurred (M = 1.18, SD = 0.393) than in the baseline condition (M = 2.53, SD = 1.700; t(16) = 3.294, p = .005, d = 0.80). There were no significant differences between baseline condition and failure activation for the curve inward (t(13) = 1.170, p = .263, d = 0.31) and for the curve outward failure (t(16) = -1.344, p = .198, d = 0.33). Results of the mixed-measures ANOVA showed neither an effect of the different failure types on perceived lack of control (F(2, 45) = .383, p = .684, η2
p = .02) nor a significant interaction effect (F(2.650, 59.622) = .584, p = .607, 𝜂𝑝
2= .03). The data is shown in Figure 35.
1
2
3
4
5
S S CI CI CO CO
Mea
n e
valu
atio
n o
f st
ress
wit
h 9
5%
CI
Baseline
si ci co
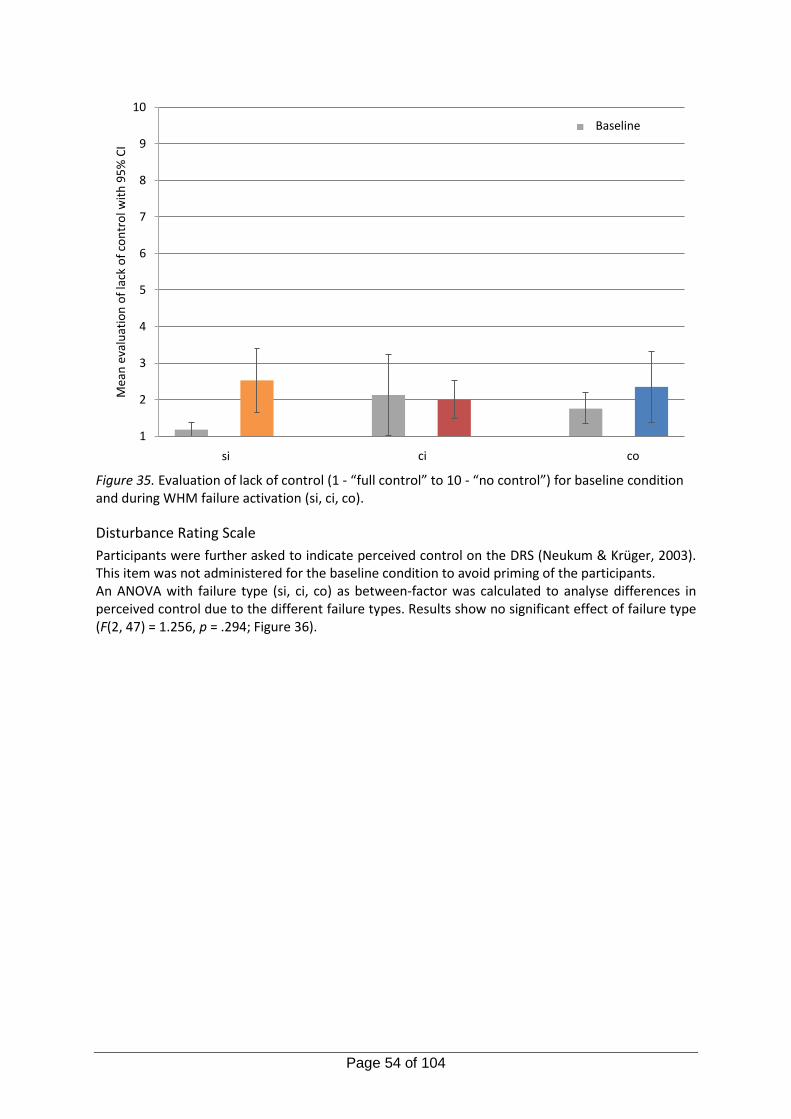
Page 54 of 104
Figure 35. Evaluation of lack of control (1 - “full control” to 10 - “no control”) for baseline condition and during WHM failure activation (si, ci, co).
Disturbance Rating Scale
Participants were further asked to indicate perceived control on the DRS (Neukum & Krüger, 2003). This item was not administered for the baseline condition to avoid priming of the participants. An ANOVA with failure type (si, ci, co) as between-factor was calculated to analyse differences in perceived control due to the different failure types. Results show no significant effect of failure type (F(2, 47) = 1.256, p = .294; Figure 36).
1
2
3
4
5
6
7
8
9
10
S S CI CI CO CO
Mea
n e
valu
atio
n o
f la
ck o
f co
ntr
ol w
ith
95
% C
I Baseline
si ci co
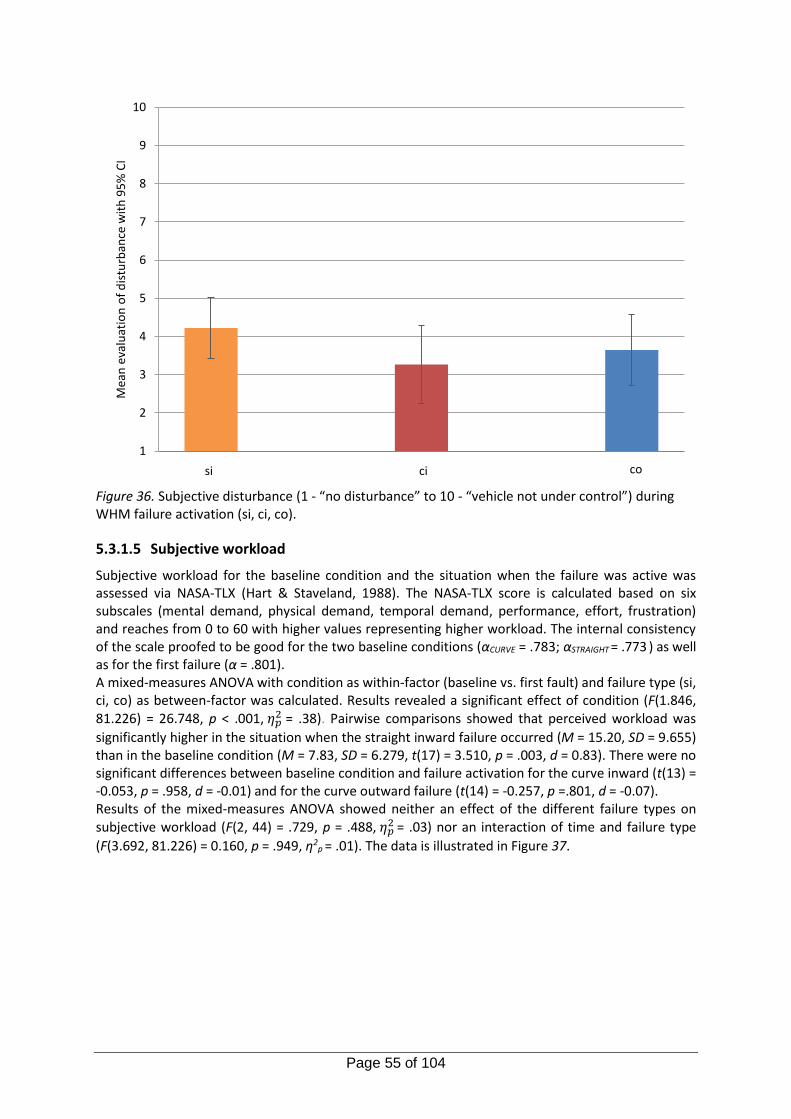
Page 55 of 104
Figure 36. Subjective disturbance (1 - “no disturbance” to 10 - “vehicle not under control”) during WHM failure activation (si, ci, co).
5.3.1.5 Subjective workload
Subjective workload for the baseline condition and the situation when the failure was active was assessed via NASA-TLX (Hart & Staveland, 1988). The NASA-TLX score is calculated based on six subscales (mental demand, physical demand, temporal demand, performance, effort, frustration) and reaches from 0 to 60 with higher values representing higher workload. The internal consistency of the scale proofed to be good for the two baseline conditions (αCURVE = .783; αSTRAIGHT = .773 ) as well as for the first failure (α = .801). A mixed-measures ANOVA with condition as within-factor (baseline vs. first fault) and failure type (si, ci, co) as between-factor was calculated. Results revealed a significant effect of condition (F(1.846, 81.226) = 26.748, p < .001, 𝜂𝑝
2 = .38). Pairwise comparisons showed that perceived workload was
significantly higher in the situation when the straight inward failure occurred (M = 15.20, SD = 9.655) than in the baseline condition (M = 7.83, SD = 6.279, t(17) = 3.510, p = .003, d = 0.83). There were no significant differences between baseline condition and failure activation for the curve inward (t(13) = -0.053, p = .958, d = -0.01) and for the curve outward failure (t(14) = -0.257, p =.801, d = -0.07). Results of the mixed-measures ANOVA showed neither an effect of the different failure types on subjective workload (F(2, 44) = .729, p = .488, 𝜂𝑝
2 = .03) nor an interaction of time and failure type
(F(3.692, 81.226) = 0.160, p = .949, η2p = .01). The data is illustrated in Figure 37.
1
2
3
4
5
6
7
8
9
10
S CI CO
Mea
n e
valu
atio
n o
f d
istu
rban
ce w
ith
95
% C
I
si ci co
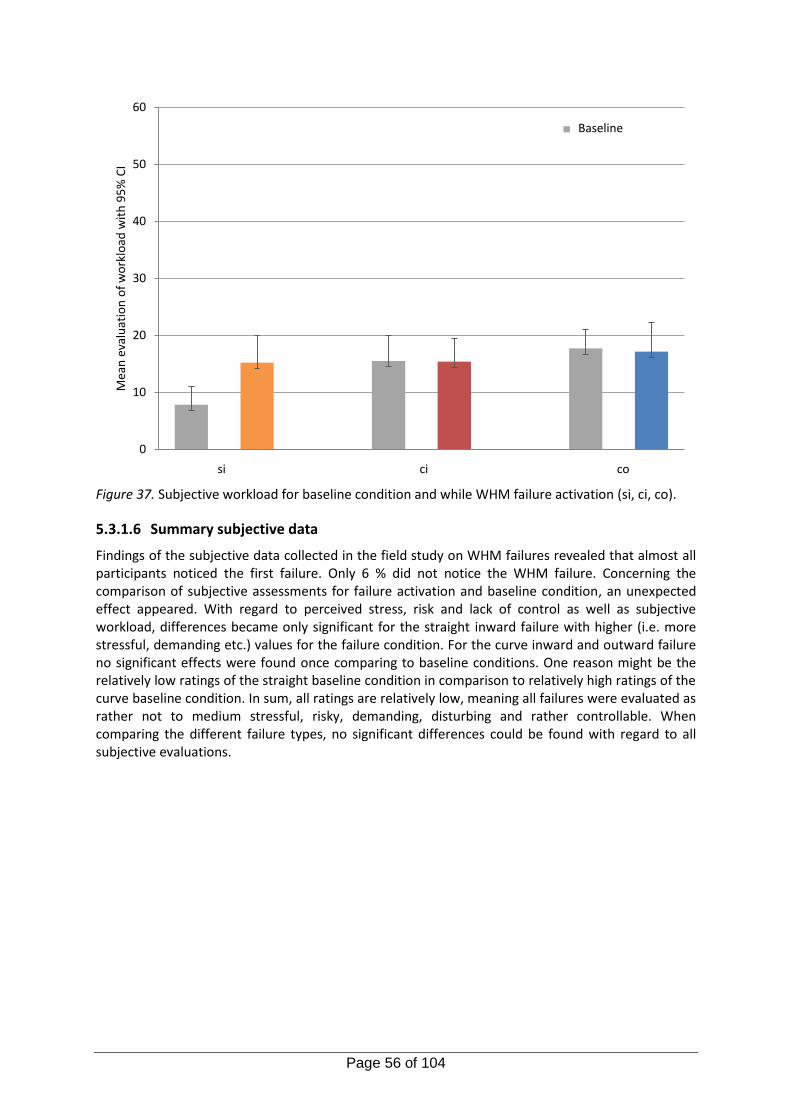
Page 56 of 104
Figure 37. Subjective workload for baseline condition and while WHM failure activation (si, ci, co).
5.3.1.6 Summary subjective data
Findings of the subjective data collected in the field study on WHM failures revealed that almost all participants noticed the first failure. Only 6 % did not notice the WHM failure. Concerning the comparison of subjective assessments for failure activation and baseline condition, an unexpected effect appeared. With regard to perceived stress, risk and lack of control as well as subjective workload, differences became only significant for the straight inward failure with higher (i.e. more stressful, demanding etc.) values for the failure condition. For the curve inward and outward failure no significant effects were found once comparing to baseline conditions. One reason might be the relatively low ratings of the straight baseline condition in comparison to relatively high ratings of the curve baseline condition. In sum, all ratings are relatively low, meaning all failures were evaluated as rather not to medium stressful, risky, demanding, disturbing and rather controllable. When comparing the different failure types, no significant differences could be found with regard to all subjective evaluations.
0
10
20
30
40
50
60
S S CI CI CO CO
Mea
n e
valu
atio
n o
f w
ork
load
wit
h 9
5%
CI
Baseline
si ci co
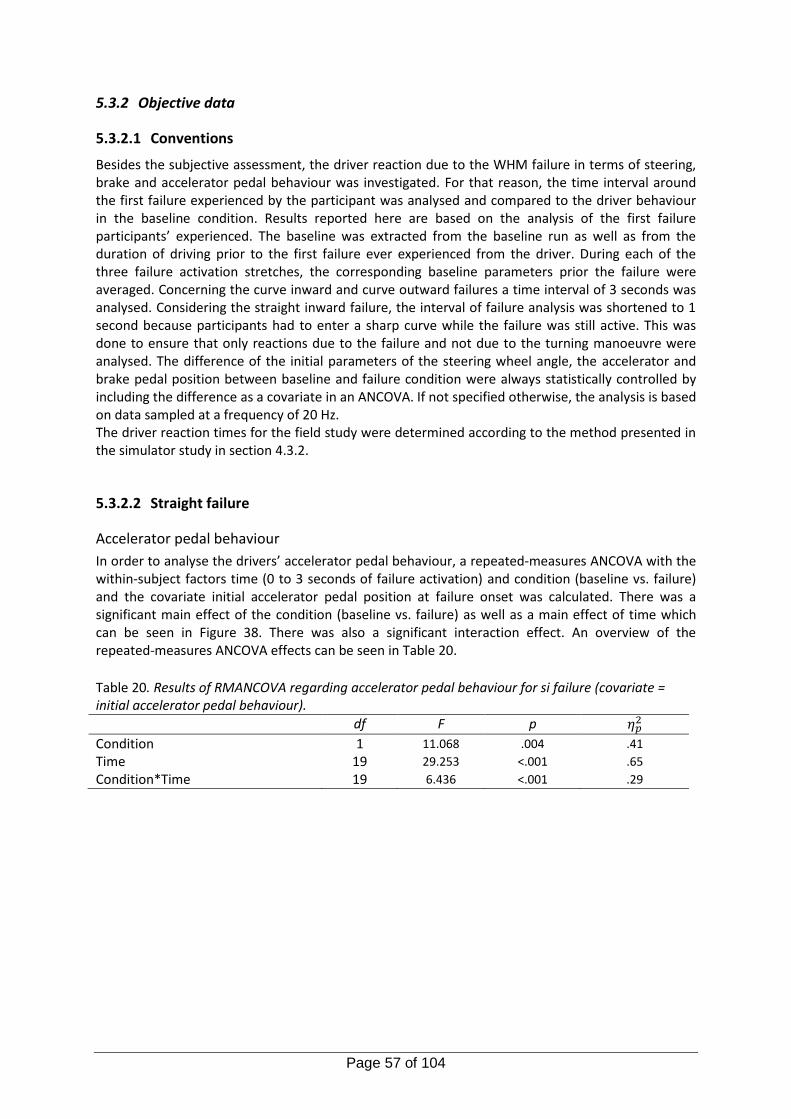
Page 57 of 104
5.3.2 Objective data
5.3.2.1 Conventions
Besides the subjective assessment, the driver reaction due to the WHM failure in terms of steering, brake and accelerator pedal behaviour was investigated. For that reason, the time interval around the first failure experienced by the participant was analysed and compared to the driver behaviour in the baseline condition. Results reported here are based on the analysis of the first failure participants’ experienced. The baseline was extracted from the baseline run as well as from the duration of driving prior to the first failure ever experienced from the driver. During each of the three failure activation stretches, the corresponding baseline parameters prior the failure were averaged. Concerning the curve inward and curve outward failures a time interval of 3 seconds was analysed. Considering the straight inward failure, the interval of failure analysis was shortened to 1 second because participants had to enter a sharp curve while the failure was still active. This was done to ensure that only reactions due to the failure and not due to the turning manoeuvre were analysed. The difference of the initial parameters of the steering wheel angle, the accelerator and brake pedal position between baseline and failure condition were always statistically controlled by including the difference as a covariate in an ANCOVA. If not specified otherwise, the analysis is based on data sampled at a frequency of 20 Hz. The driver reaction times for the field study were determined according to the method presented in the simulator study in section 4.3.2.
5.3.2.2 Straight failure
Accelerator pedal behaviour
In order to analyse the drivers’ accelerator pedal behaviour, a repeated-measures ANCOVA with the within-subject factors time (0 to 3 seconds of failure activation) and condition (baseline vs. failure) and the covariate initial accelerator pedal position at failure onset was calculated. There was a significant main effect of the condition (baseline vs. failure) as well as a main effect of time which can be seen in Figure 38. There was also a significant interaction effect. An overview of the repeated-measures ANCOVA effects can be seen in Table 20.
Table 20. Results of RMANCOVA regarding accelerator pedal behaviour for si failure (covariate = initial accelerator pedal behaviour).
df F p 𝜂𝑝2
Condition 1 11.068 .004 .41
Time 19 29.253 <.001 .65
Condition*Time 19 6.436 <.001 .29
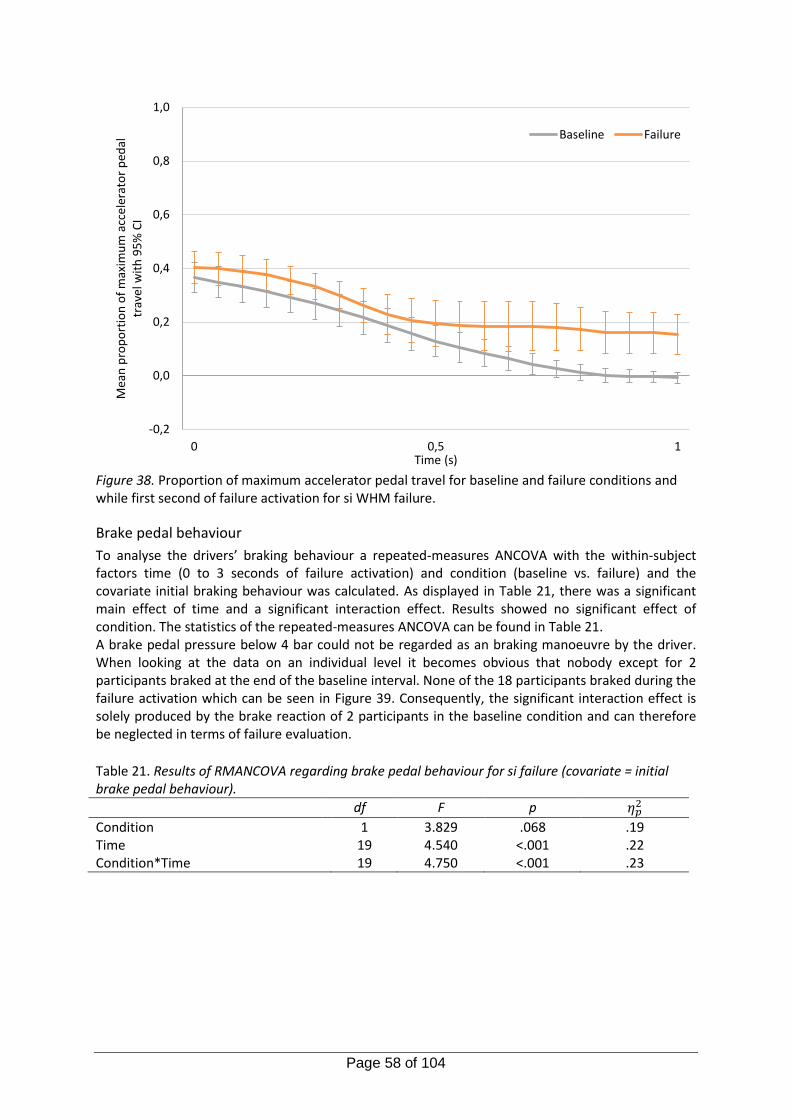
Page 58 of 104
Figure 38. Proportion of maximum accelerator pedal travel for baseline and failure conditions and while first second of failure activation for si WHM failure.
Brake pedal behaviour
To analyse the drivers’ braking behaviour a repeated-measures ANCOVA with the within-subject factors time (0 to 3 seconds of failure activation) and condition (baseline vs. failure) and the covariate initial braking behaviour was calculated. As displayed in Table 21, there was a significant main effect of time and a significant interaction effect. Results showed no significant effect of condition. The statistics of the repeated-measures ANCOVA can be found in Table 21. A brake pedal pressure below 4 bar could not be regarded as an braking manoeuvre by the driver. When looking at the data on an individual level it becomes obvious that nobody except for 2 participants braked at the end of the baseline interval. None of the 18 participants braked during the failure activation which can be seen in Figure 39. Consequently, the significant interaction effect is solely produced by the brake reaction of 2 participants in the baseline condition and can therefore be neglected in terms of failure evaluation.
Table 21. Results of RMANCOVA regarding brake pedal behaviour for si failure (covariate = initial brake pedal behaviour).
df F p 𝜂𝑝2
Condition 1 3.829 .068 .19 Time 19 4.540 <.001 .22 Condition*Time 19 4.750 <.001 .23
-0,2
0,0
0,2
0,4
0,6
0,8
1,0
0 0,5 1
Mea
n p
rop
ort
ion
of
max
imu
m a
ccel
erat
or
ped
al
trav
el w
ith
95
% C
I
Time (s)
Baseline Failure
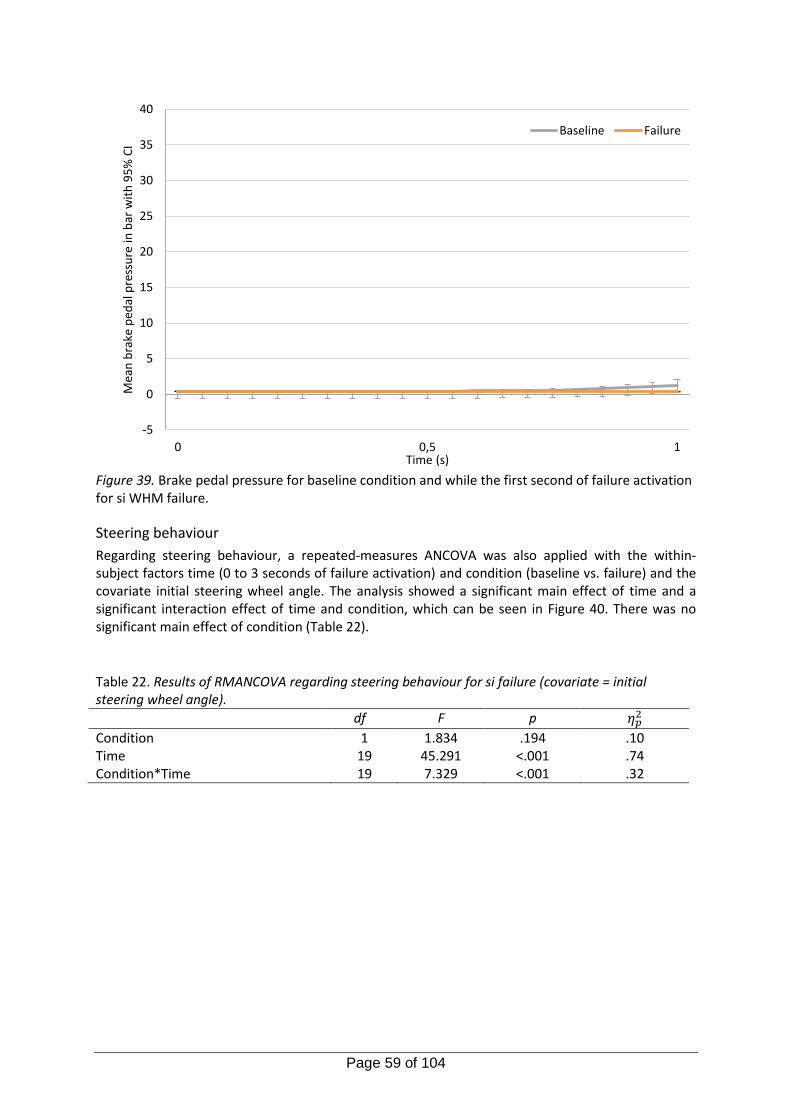
Page 59 of 104
Figure 39. Brake pedal pressure for baseline condition and while the first second of failure activation for si WHM failure.
Steering behaviour
Regarding steering behaviour, a repeated-measures ANCOVA was also applied with the within-subject factors time (0 to 3 seconds of failure activation) and condition (baseline vs. failure) and the covariate initial steering wheel angle. The analysis showed a significant main effect of time and a significant interaction effect of time and condition, which can be seen in Figure 40. There was no significant main effect of condition (Table 22).
Table 22. Results of RMANCOVA regarding steering behaviour for si failure (covariate = initial steering wheel angle).
df F p 𝜂𝑝2
Condition 1 1.834 .194 .10 Time 19 45.291 <.001 .74 Condition*Time 19 7.329 <.001 .32
-5
0
5
10
15
20
25
30
35
40
0 0,5 1
Mea
n b
rake
ped
al p
ress
ure
in b
ar w
ith
95
% C
I
Time (s)
Baseline Failure
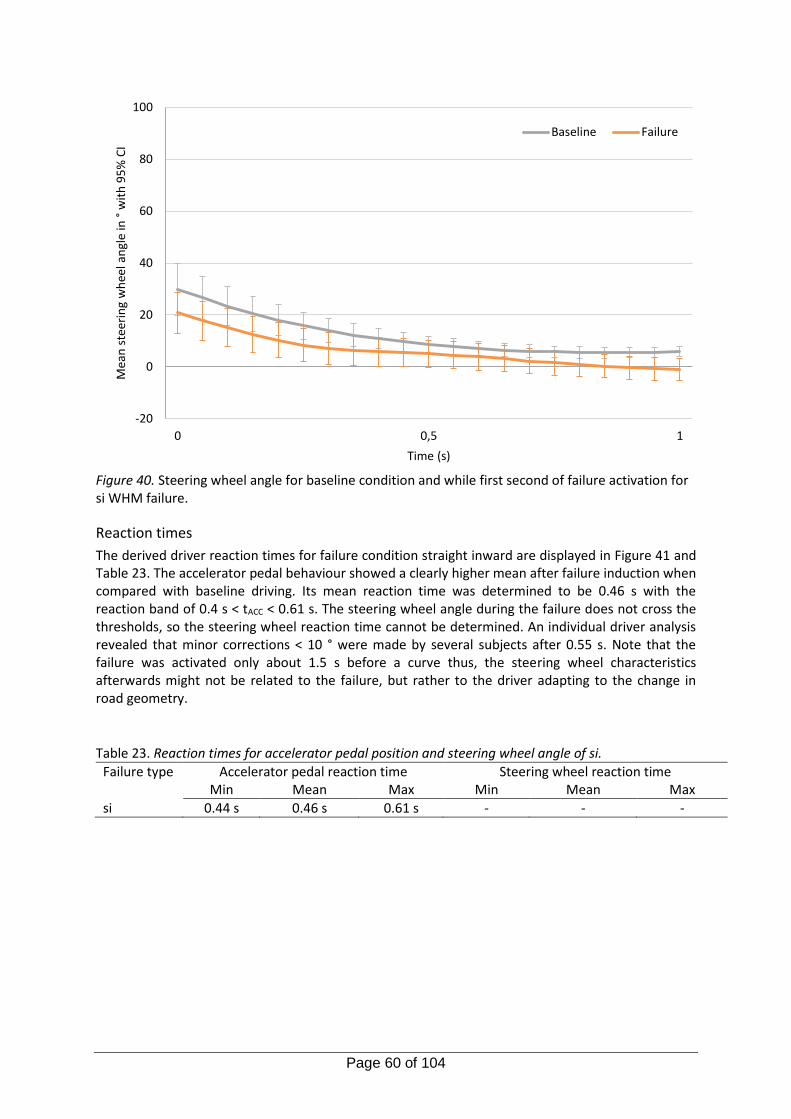
Page 60 of 104
Figure 40. Steering wheel angle for baseline condition and while first second of failure activation for si WHM failure.
Reaction times
The derived driver reaction times for failure condition straight inward are displayed in Figure 41 and Table 23. The accelerator pedal behaviour showed a clearly higher mean after failure induction when compared with baseline driving. Its mean reaction time was determined to be 0.46 s with the reaction band of 0.4 s < tACC < 0.61 s. The steering wheel angle during the failure does not cross the thresholds, so the steering wheel reaction time cannot be determined. An individual driver analysis revealed that minor corrections < 10 ° were made by several subjects after 0.55 s. Note that the failure was activated only about 1.5 s before a curve thus, the steering wheel characteristics afterwards might not be related to the failure, but rather to the driver adapting to the change in road geometry.
Table 23. Reaction times for accelerator pedal position and steering wheel angle of si.
Failure type Accelerator pedal reaction time Steering wheel reaction time Min Mean Max Min Mean Max
si 0.44 s 0.46 s 0.61 s - - -
-20
0
20
40
60
80
100
0 0,5 1
Mea
n s
teer
ing
wh
eel a
ngl
e in
°w
ith
95
% C
I
Time (s)
Baseline Failure
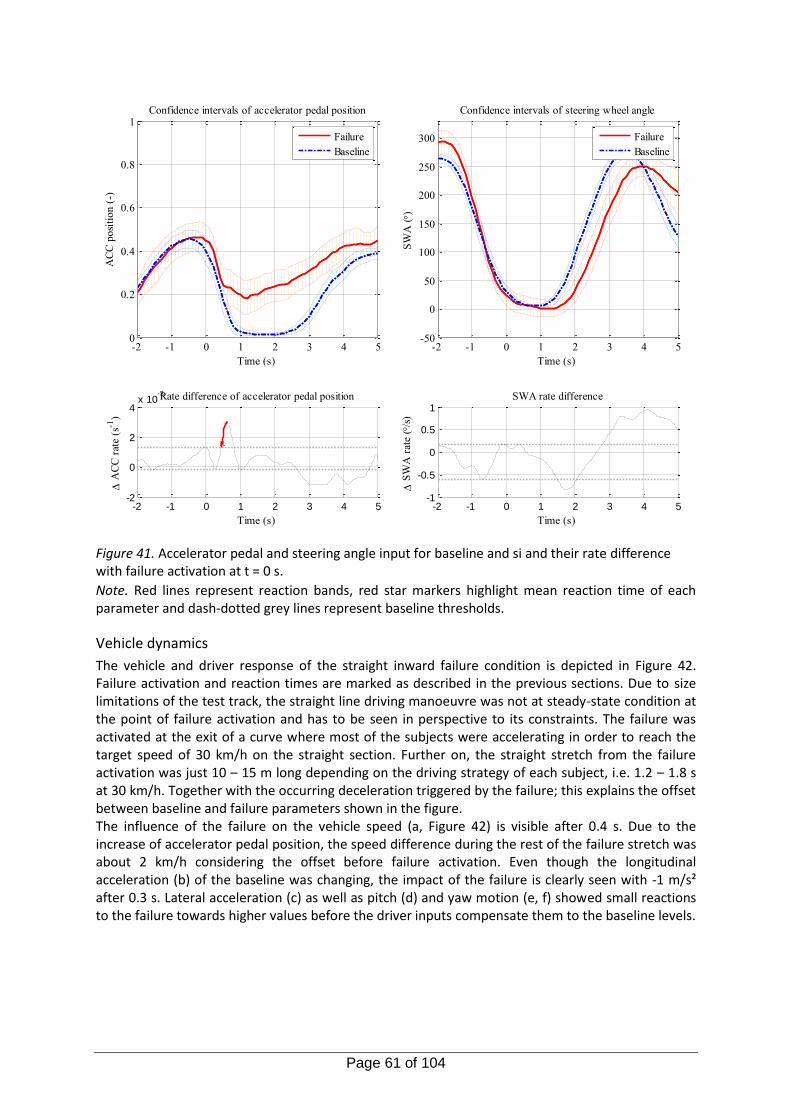
Page 61 of 104
Figure 41. Accelerator pedal and steering angle input for baseline and si and their rate difference with failure activation at t = 0 s.
Note. Red lines represent reaction bands, red star markers highlight mean reaction time of each parameter and dash-dotted grey lines represent baseline thresholds.
Vehicle dynamics
The vehicle and driver response of the straight inward failure condition is depicted in Figure 42. Failure activation and reaction times are marked as described in the previous sections. Due to size limitations of the test track, the straight line driving manoeuvre was not at steady-state condition at the point of failure activation and has to be seen in perspective to its constraints. The failure was activated at the exit of a curve where most of the subjects were accelerating in order to reach the target speed of 30 km/h on the straight section. Further on, the straight stretch from the failure activation was just 10 – 15 m long depending on the driving strategy of each subject, i.e. 1.2 – 1.8 s at 30 km/h. Together with the occurring deceleration triggered by the failure; this explains the offset between baseline and failure parameters shown in the figure. The influence of the failure on the vehicle speed (a, Figure 42) is visible after 0.4 s. Due to the increase of accelerator pedal position, the speed difference during the rest of the failure stretch was about 2 km/h considering the offset before failure activation. Even though the longitudinal acceleration (b) of the baseline was changing, the impact of the failure is clearly seen with -1 m/s² after 0.3 s. Lateral acceleration (c) as well as pitch (d) and yaw motion (e, f) showed small reactions to the failure towards higher values before the driver inputs compensate them to the baseline levels.
-2 -1 0 1 2 3 4 50
0.2
0.4
0.6
0.8
1
Time (s)
AC
C p
osi
tion (
-)Confidence intervals of accelerator pedal position
Failure
Baseline
-2 -1 0 1 2 3 4 5-2
0
2
4x 10
-3
Time (s)
A
CC
rat
e (s
-1)
Rate difference of accelerator pedal position
-2 -1 0 1 2 3 4 5-50
0
50
100
150
200
250
300
Time (s)
SW
A ()
Confidence intervals of steering wheel angle
Failure
Baseline
-2 -1 0 1 2 3 4 5-1
-0.5
0
0.5
1
Time (s)
S
WA
rat
e (
/s)
SWA rate difference
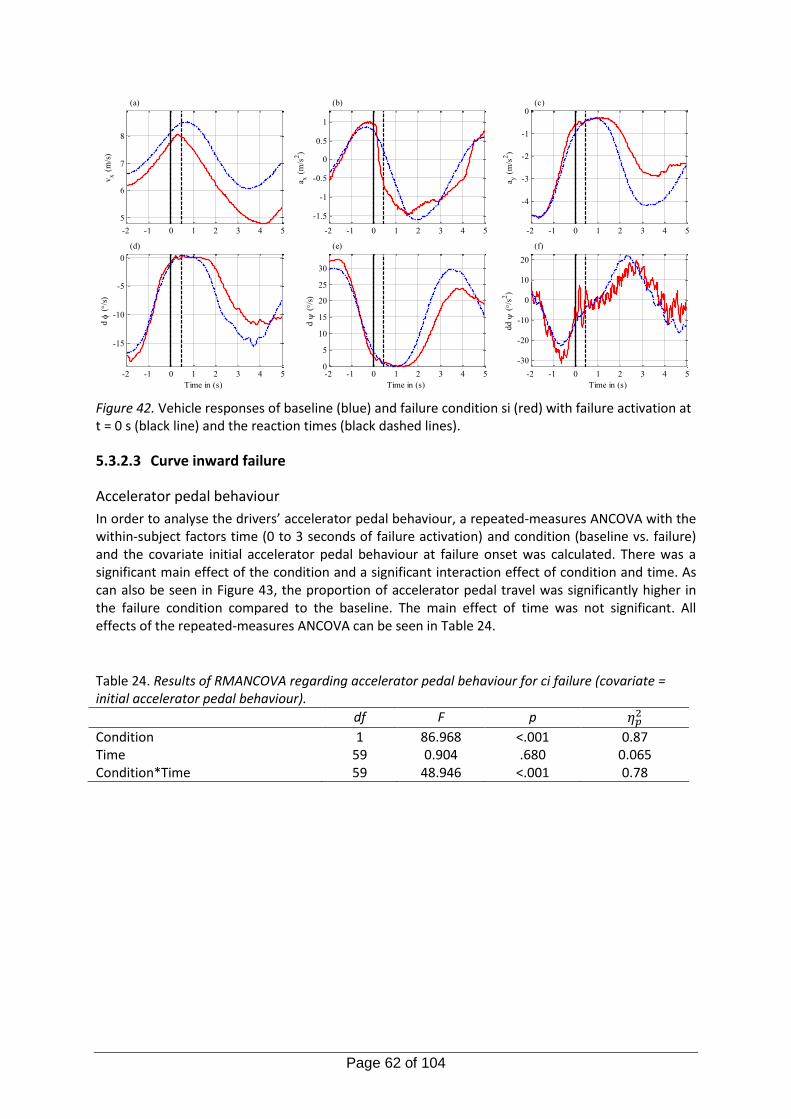
Page 62 of 104
Figure 42. Vehicle responses of baseline (blue) and failure condition si (red) with failure activation at t = 0 s (black line) and the reaction times (black dashed lines).
5.3.2.3 Curve inward failure
Accelerator pedal behaviour
In order to analyse the drivers’ accelerator pedal behaviour, a repeated-measures ANCOVA with the within-subject factors time (0 to 3 seconds of failure activation) and condition (baseline vs. failure) and the covariate initial accelerator pedal behaviour at failure onset was calculated. There was a significant main effect of the condition and a significant interaction effect of condition and time. As can also be seen in Figure 43, the proportion of accelerator pedal travel was significantly higher in the failure condition compared to the baseline. The main effect of time was not significant. All effects of the repeated-measures ANCOVA can be seen in Table 24.
Table 24. Results of RMANCOVA regarding accelerator pedal behaviour for ci failure (covariate = initial accelerator pedal behaviour).
df F p 𝜂𝑝2
Condition 1 86.968 <.001 0.87 Time 59 0.904 .680 0.065 Condition*Time 59 48.946 <.001 0.78
-2 -1 0 1 2 3 4 5
5
6
7
8
(a)v
x (
m/s
)
-2 -1 0 1 2 3 4 5
-1.5
-1
-0.5
0
0.5
1
(b)
a x (
m/s
2)
-2 -1 0 1 2 3 4 5
-4
-3
-2
-1
0(c)
a y (
m/s
2)
-2 -1 0 1 2 3 4 5
-15
-10
-5
0
(d)
Time in (s)
d
(/
s)
-2 -1 0 1 2 3 4 50
5
10
15
20
25
30
(e)
Time in (s)
d
(/
s)
-2 -1 0 1 2 3 4 5
-30
-20
-10
0
10
20
(f)
Time in (s)
dd
(/
s2)
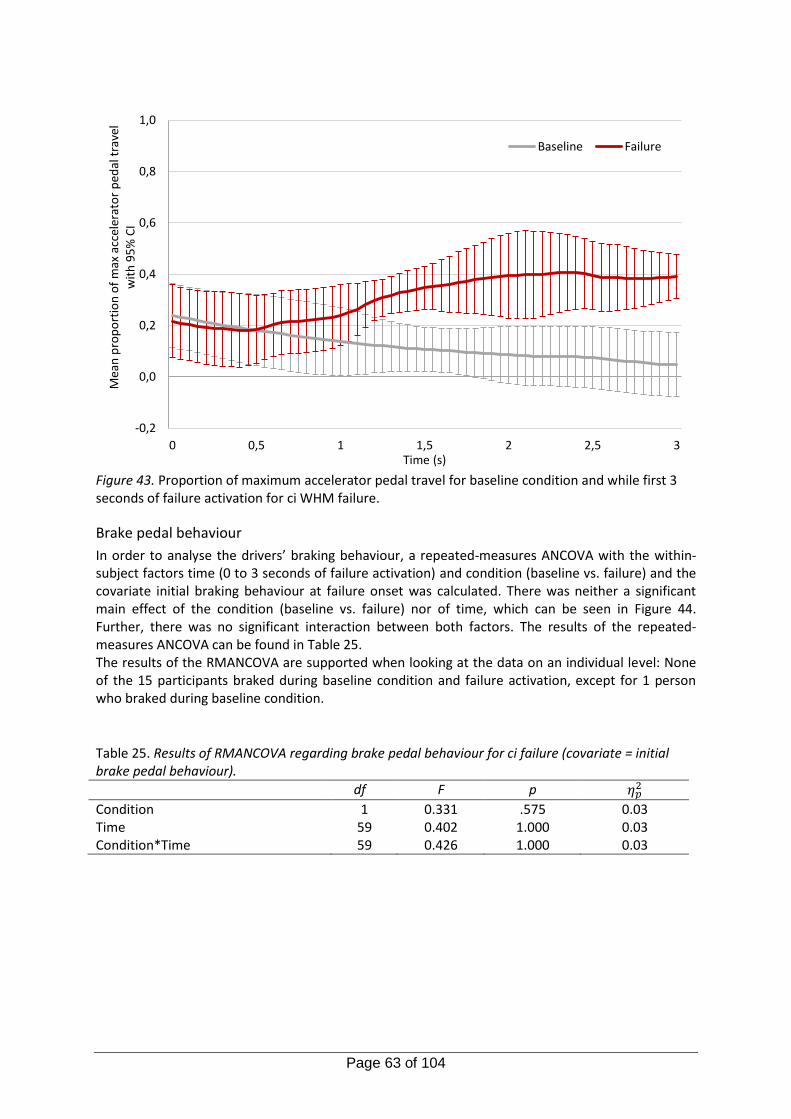
Page 63 of 104
Figure 43. Proportion of maximum accelerator pedal travel for baseline condition and while first 3 seconds of failure activation for ci WHM failure.
Brake pedal behaviour
In order to analyse the drivers’ braking behaviour, a repeated-measures ANCOVA with the within-subject factors time (0 to 3 seconds of failure activation) and condition (baseline vs. failure) and the covariate initial braking behaviour at failure onset was calculated. There was neither a significant main effect of the condition (baseline vs. failure) nor of time, which can be seen in Figure 44. Further, there was no significant interaction between both factors. The results of the repeated-measures ANCOVA can be found in Table 25. The results of the RMANCOVA are supported when looking at the data on an individual level: None of the 15 participants braked during baseline condition and failure activation, except for 1 person who braked during baseline condition.
Table 25. Results of RMANCOVA regarding brake pedal behaviour for ci failure (covariate = initial brake pedal behaviour).
df F p 𝜂𝑝2
Condition 1 0.331 .575 0.03 Time 59 0.402 1.000 0.03 Condition*Time 59 0.426 1.000 0.03
-0,2
0,0
0,2
0,4
0,6
0,8
1,0
0 0,5 1 1,5 2 2,5 3
Mea
n p
rop
ort
ion
of
max
acc
eler
ato
r p
edal
tra
vel
wit
h 9
5%
CI
Time (s)
Baseline Failure
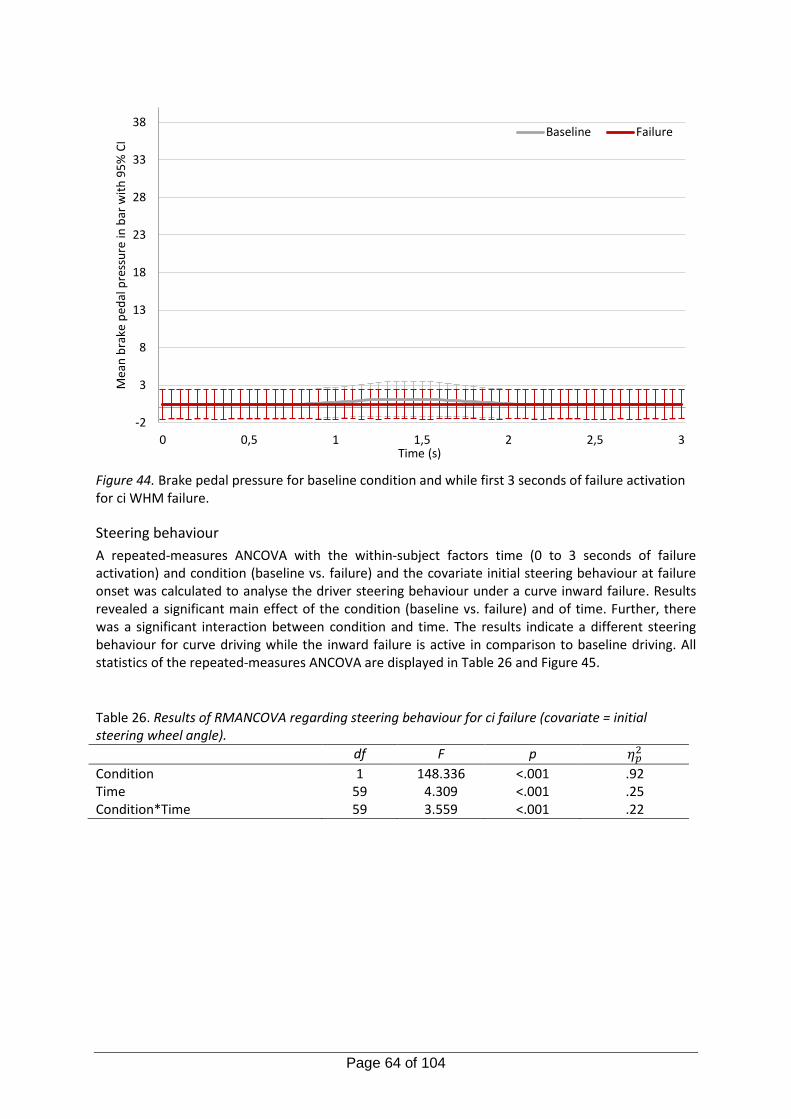
Page 64 of 104
Figure 44. Brake pedal pressure for baseline condition and while first 3 seconds of failure activation for ci WHM failure.
Steering behaviour
A repeated-measures ANCOVA with the within-subject factors time (0 to 3 seconds of failure activation) and condition (baseline vs. failure) and the covariate initial steering behaviour at failure onset was calculated to analyse the driver steering behaviour under a curve inward failure. Results revealed a significant main effect of the condition (baseline vs. failure) and of time. Further, there was a significant interaction between condition and time. The results indicate a different steering behaviour for curve driving while the inward failure is active in comparison to baseline driving. All statistics of the repeated-measures ANCOVA are displayed in Table 26 and Figure 45.
Table 26. Results of RMANCOVA regarding steering behaviour for ci failure (covariate = initial steering wheel angle).
df F p 𝜂𝑝2
Condition 1 148.336 <.001 .92 Time 59 4.309 <.001 .25 Condition*Time 59 3.559 <.001 .22
-2
3
8
13
18
23
28
33
38
0 0,5 1 1,5 2 2,5 3
Mea
n b
rake
ped
al p
ress
ure
in b
ar w
ith
95
% C
I
Time (s)
Baseline Failure
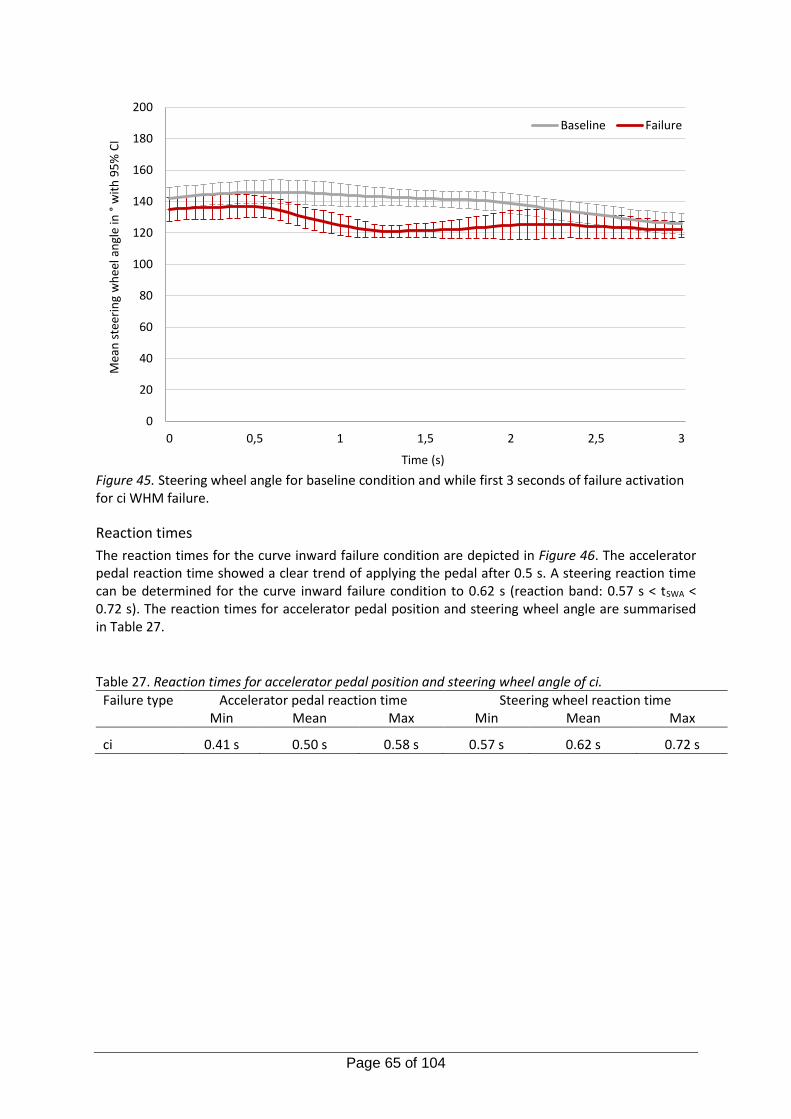
Page 65 of 104
Figure 45. Steering wheel angle for baseline condition and while first 3 seconds of failure activation for ci WHM failure.
Reaction times
The reaction times for the curve inward failure condition are depicted in Figure 46. The accelerator pedal reaction time showed a clear trend of applying the pedal after 0.5 s. A steering reaction time can be determined for the curve inward failure condition to 0.62 s (reaction band: 0.57 s < tSWA < 0.72 s). The reaction times for accelerator pedal position and steering wheel angle are summarised in Table 27.
Table 27. Reaction times for accelerator pedal position and steering wheel angle of ci. Failure type Accelerator pedal reaction time Steering wheel reaction time Min Mean Max Min Mean Max
ci 0.41 s 0.50 s 0.58 s 0.57 s 0.62 s 0.72 s
0
20
40
60
80
100
120
140
160
180
200
0 0,5 1 1,5 2 2,5 3
Mea
n s
teer
ing
wh
eel a
ngl
e in
°w
ith
95
% C
I
Time (s)
Baseline Failure
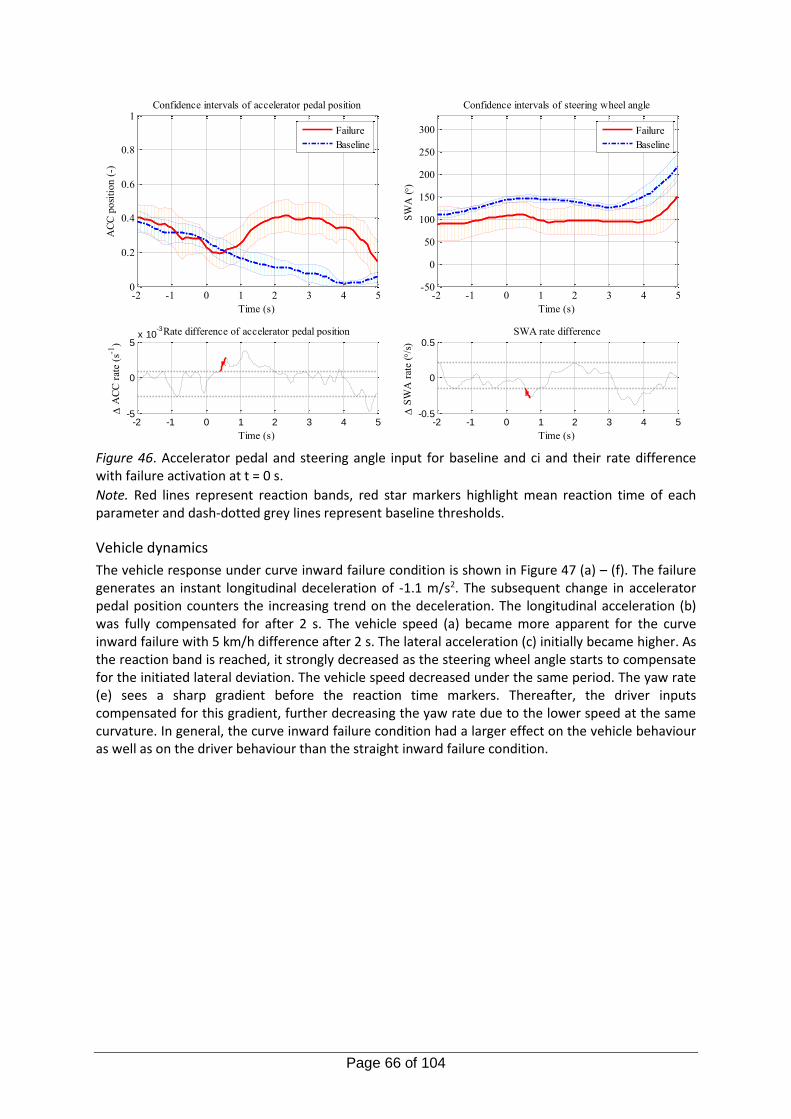
Page 66 of 104
Figure 46. Accelerator pedal and steering angle input for baseline and ci and their rate difference with failure activation at t = 0 s.
Note. Red lines represent reaction bands, red star markers highlight mean reaction time of each parameter and dash-dotted grey lines represent baseline thresholds.
Vehicle dynamics
The vehicle response under curve inward failure condition is shown in Figure 47 (a) – (f). The failure generates an instant longitudinal deceleration of -1.1 m/s2. The subsequent change in accelerator pedal position counters the increasing trend on the deceleration. The longitudinal acceleration (b) was fully compensated for after 2 s. The vehicle speed (a) became more apparent for the curve inward failure with 5 km/h difference after 2 s. The lateral acceleration (c) initially became higher. As the reaction band is reached, it strongly decreased as the steering wheel angle starts to compensate for the initiated lateral deviation. The vehicle speed decreased under the same period. The yaw rate (e) sees a sharp gradient before the reaction time markers. Thereafter, the driver inputs compensated for this gradient, further decreasing the yaw rate due to the lower speed at the same curvature. In general, the curve inward failure condition had a larger effect on the vehicle behaviour as well as on the driver behaviour than the straight inward failure condition.
-2 -1 0 1 2 3 4 50
0.2
0.4
0.6
0.8
1
Time (s)
AC
C p
osi
tio
n (
-)Confidence intervals of accelerator pedal position
Failure
Baseline
-2 -1 0 1 2 3 4 5-5
0
5x 10
-3
Time (s)
A
CC
rat
e (s
-1)
Rate difference of accelerator pedal position
-2 -1 0 1 2 3 4 5-50
0
50
100
150
200
250
300
Time (s)
SW
A ()
Confidence intervals of steering wheel angle
Failure
Baseline
-2 -1 0 1 2 3 4 5-0.5
0
0.5
Time (s)
S
WA
rat
e (
/s)
SWA rate difference
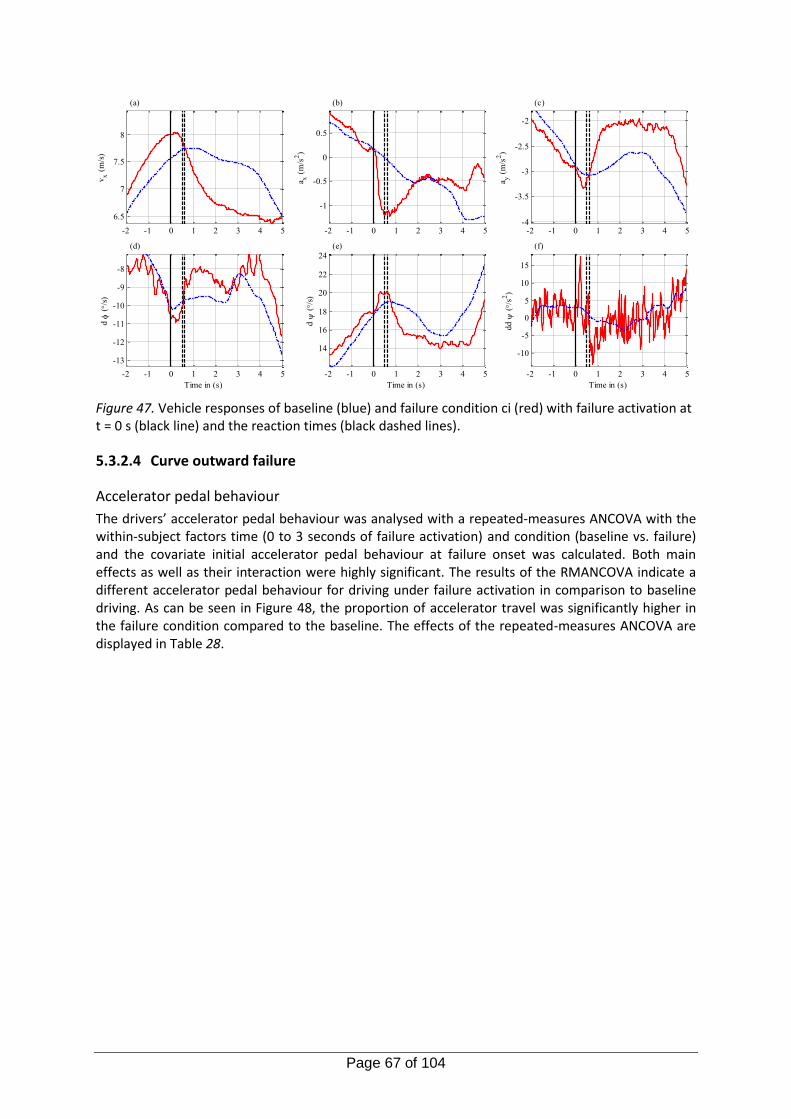
Page 67 of 104
Figure 47. Vehicle responses of baseline (blue) and failure condition ci (red) with failure activation at t = 0 s (black line) and the reaction times (black dashed lines).
5.3.2.4 Curve outward failure
Accelerator pedal behaviour
The drivers’ accelerator pedal behaviour was analysed with a repeated-measures ANCOVA with the within-subject factors time (0 to 3 seconds of failure activation) and condition (baseline vs. failure) and the covariate initial accelerator pedal behaviour at failure onset was calculated. Both main effects as well as their interaction were highly significant. The results of the RMANCOVA indicate a different accelerator pedal behaviour for driving under failure activation in comparison to baseline driving. As can be seen in Figure 48, the proportion of accelerator travel was significantly higher in the failure condition compared to the baseline. The effects of the repeated-measures ANCOVA are displayed in Table 28.
-2 -1 0 1 2 3 4 5
6.5
7
7.5
8
(a)v
x (
m/s
)
-2 -1 0 1 2 3 4 5
-1
-0.5
0
0.5
(b)
a x (
m/s
2)
-2 -1 0 1 2 3 4 5-4
-3.5
-3
-2.5
-2
(c)
a y (
m/s
2)
-2 -1 0 1 2 3 4 5
-13
-12
-11
-10
-9
-8
(d)
Time in (s)
d
(/
s)
-2 -1 0 1 2 3 4 5
14
16
18
20
22
24
(e)
Time in (s)
d
(/
s)
-2 -1 0 1 2 3 4 5
-10
-5
0
5
10
15
(f)
Time in (s)
dd
(/
s2)
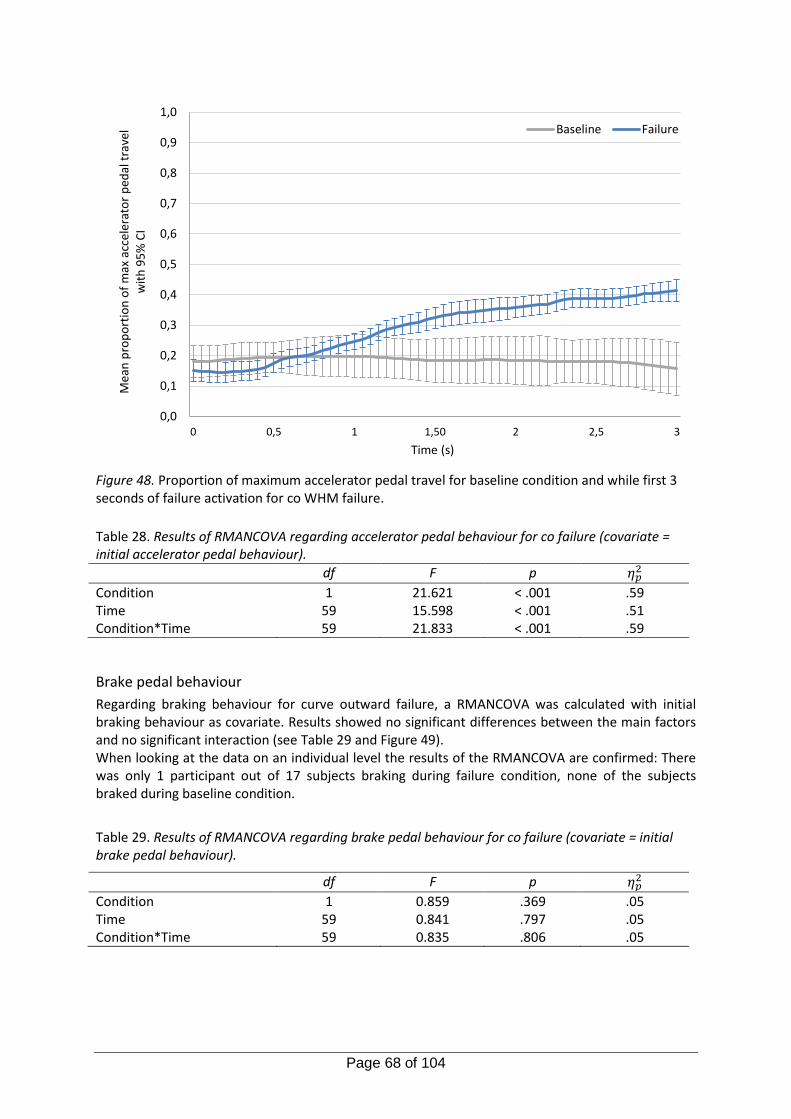
Page 68 of 104
Figure 48. Proportion of maximum accelerator pedal travel for baseline condition and while first 3 seconds of failure activation for co WHM failure.
Table 28. Results of RMANCOVA regarding accelerator pedal behaviour for co failure (covariate = initial accelerator pedal behaviour).
df F p 𝜂𝑝2
Condition 1 21.621 < .001 .59 Time 59 15.598 < .001 .51 Condition*Time 59 21.833 < .001 .59
Brake pedal behaviour
Regarding braking behaviour for curve outward failure, a RMANCOVA was calculated with initial braking behaviour as covariate. Results showed no significant differences between the main factors and no significant interaction (see Table 29 and Figure 49). When looking at the data on an individual level the results of the RMANCOVA are confirmed: There was only 1 participant out of 17 subjects braking during failure condition, none of the subjects braked during baseline condition.
Table 29. Results of RMANCOVA regarding brake pedal behaviour for co failure (covariate = initial brake pedal behaviour).
df F p 𝜂𝑝2
Condition 1 0.859 .369 .05 Time 59 0.841 .797 .05 Condition*Time 59 0.835 .806 .05
0,0
0,1
0,2
0,3
0,4
0,5
0,6
0,7
0,8
0,9
1,0
0 0,5 1 1,50 2 2,5 3
Mea
n p
rop
ort
ion
of
max
acc
eler
ato
r p
edal
tra
vel
wit
h 9
5%
CI
Time (s)
Baseline Failure
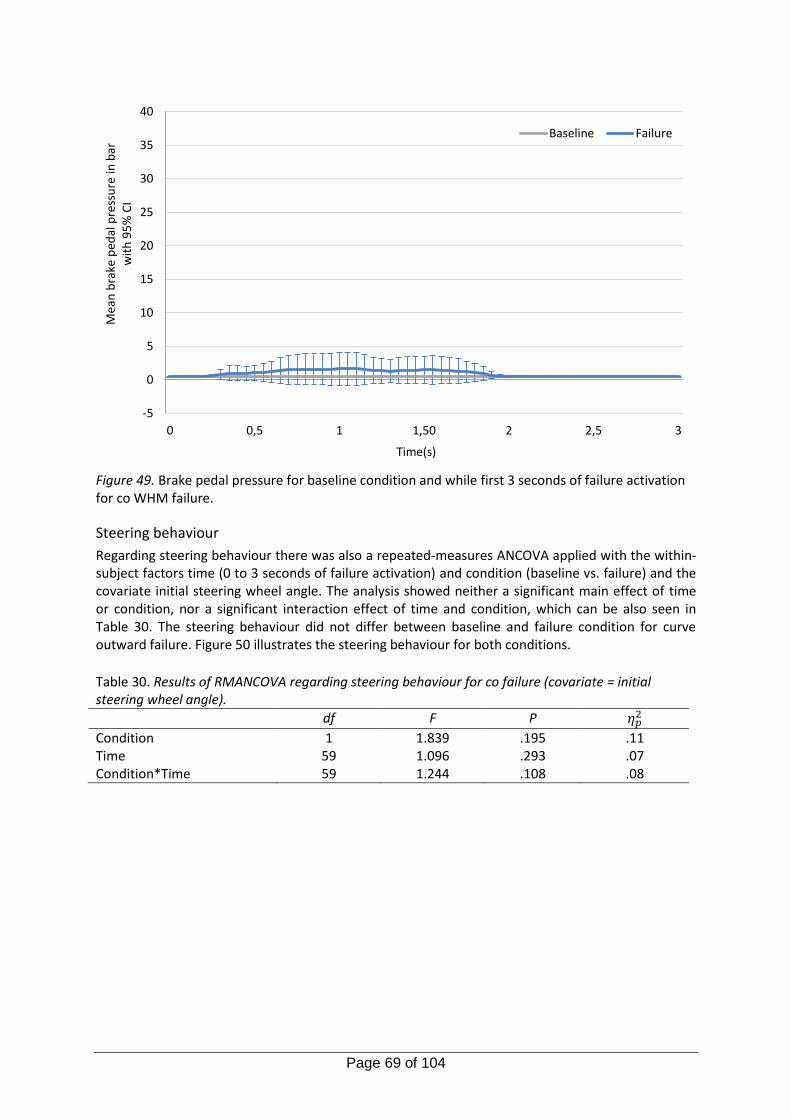
Page 69 of 104
Figure 49. Brake pedal pressure for baseline condition and while first 3 seconds of failure activation for co WHM failure.
Steering behaviour
Regarding steering behaviour there was also a repeated-measures ANCOVA applied with the within-subject factors time (0 to 3 seconds of failure activation) and condition (baseline vs. failure) and the covariate initial steering wheel angle. The analysis showed neither a significant main effect of time or condition, nor a significant interaction effect of time and condition, which can be also seen in Table 30. The steering behaviour did not differ between baseline and failure condition for curve outward failure. Figure 50 illustrates the steering behaviour for both conditions.
Table 30. Results of RMANCOVA regarding steering behaviour for co failure (covariate = initial steering wheel angle).
df F P 𝜂𝑝2
Condition 1 1.839 .195 .11 Time 59 1.096 .293 .07 Condition*Time 59 1.244 .108 .08
-5
0
5
10
15
20
25
30
35
40
0 0,5 1 1,50 2 2,5 3
Mea
n b
rake
ped
al p
ress
ure
in b
ar
wit
h 9
5%
CI
Time(s)
Baseline Failure
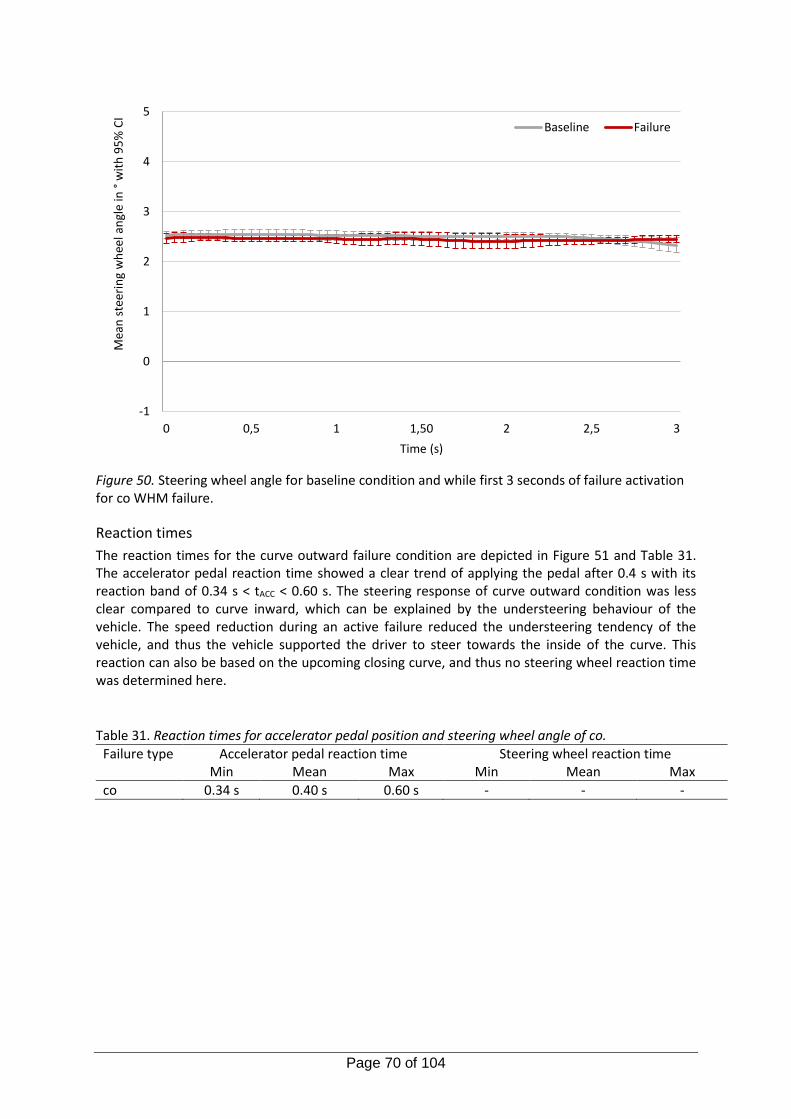
Page 70 of 104
Figure 50. Steering wheel angle for baseline condition and while first 3 seconds of failure activation for co WHM failure.
Reaction times
The reaction times for the curve outward failure condition are depicted in Figure 51 and Table 31. The accelerator pedal reaction time showed a clear trend of applying the pedal after 0.4 s with its reaction band of 0.34 s < tACC < 0.60 s. The steering response of curve outward condition was less clear compared to curve inward, which can be explained by the understeering behaviour of the vehicle. The speed reduction during an active failure reduced the understeering tendency of the vehicle, and thus the vehicle supported the driver to steer towards the inside of the curve. This reaction can also be based on the upcoming closing curve, and thus no steering wheel reaction time was determined here.
Table 31. Reaction times for accelerator pedal position and steering wheel angle of co.
Failure type Accelerator pedal reaction time Steering wheel reaction time Min Mean Max Min Mean Max
co 0.34 s 0.40 s 0.60 s - - -
-1
0
1
2
3
4
5
0 0,5 1 1,50 2 2,5 3
Mea
n s
teer
ing
wh
eel a
ngl
e in
°w
ith
95
% C
I
Time (s)
Baseline Failure
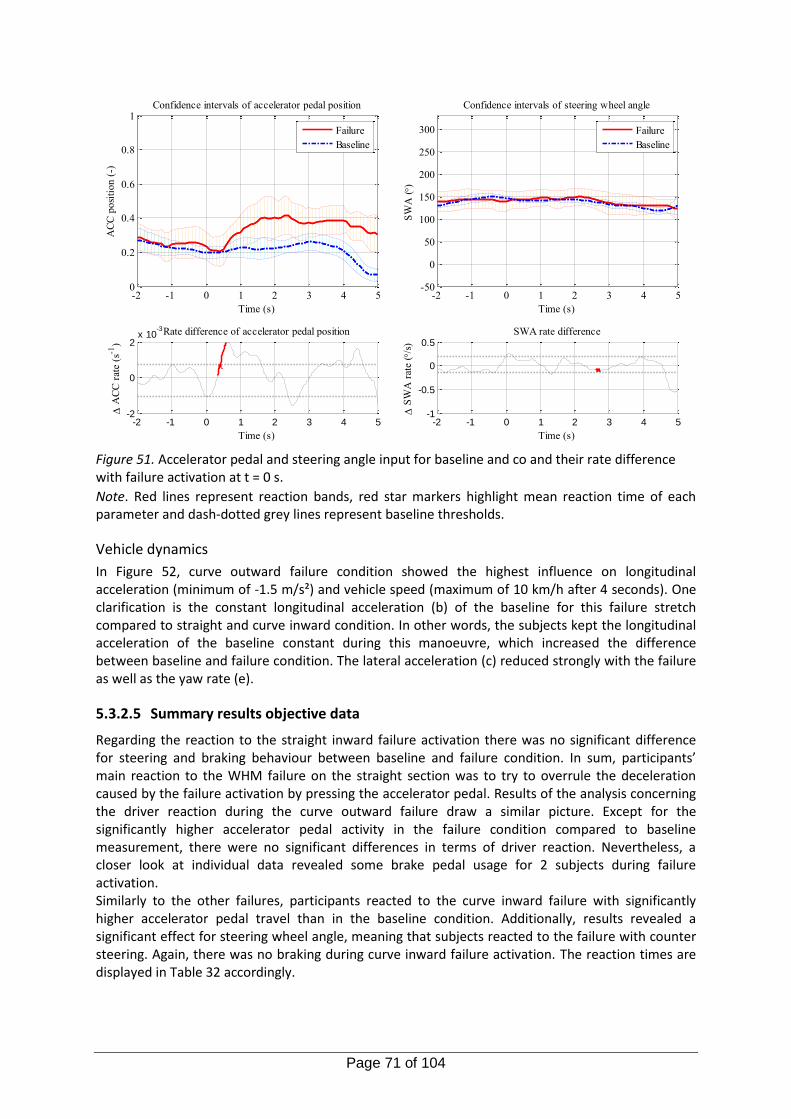
Page 71 of 104
Figure 51. Accelerator pedal and steering angle input for baseline and co and their rate difference with failure activation at t = 0 s.
Note. Red lines represent reaction bands, red star markers highlight mean reaction time of each parameter and dash-dotted grey lines represent baseline thresholds.
Vehicle dynamics
In Figure 52, curve outward failure condition showed the highest influence on longitudinal acceleration (minimum of -1.5 m/s²) and vehicle speed (maximum of 10 km/h after 4 seconds). One clarification is the constant longitudinal acceleration (b) of the baseline for this failure stretch compared to straight and curve inward condition. In other words, the subjects kept the longitudinal acceleration of the baseline constant during this manoeuvre, which increased the difference between baseline and failure condition. The lateral acceleration (c) reduced strongly with the failure as well as the yaw rate (e).
5.3.2.5 Summary results objective data
Regarding the reaction to the straight inward failure activation there was no significant difference for steering and braking behaviour between baseline and failure condition. In sum, participants’ main reaction to the WHM failure on the straight section was to try to overrule the deceleration caused by the failure activation by pressing the accelerator pedal. Results of the analysis concerning the driver reaction during the curve outward failure draw a similar picture. Except for the significantly higher accelerator pedal activity in the failure condition compared to baseline measurement, there were no significant differences in terms of driver reaction. Nevertheless, a closer look at individual data revealed some brake pedal usage for 2 subjects during failure activation. Similarly to the other failures, participants reacted to the curve inward failure with significantly higher accelerator pedal travel than in the baseline condition. Additionally, results revealed a significant effect for steering wheel angle, meaning that subjects reacted to the failure with counter steering. Again, there was no braking during curve inward failure activation. The reaction times are displayed in Table 32 accordingly.
-2 -1 0 1 2 3 4 50
0.2
0.4
0.6
0.8
1
Time (s)
AC
C p
osi
tio
n (
-)Confidence intervals of accelerator pedal position
Failure
Baseline
-2 -1 0 1 2 3 4 5-2
0
2x 10
-3
Time (s)
A
CC
rat
e (s
-1)
Rate difference of accelerator pedal position
-2 -1 0 1 2 3 4 5-50
0
50
100
150
200
250
300
Time (s)
SW
A ()
Confidence intervals of steering wheel angle
Failure
Baseline
-2 -1 0 1 2 3 4 5-1
-0.5
0
0.5
Time (s)
S
WA
rat
e (
/s)
SWA rate difference
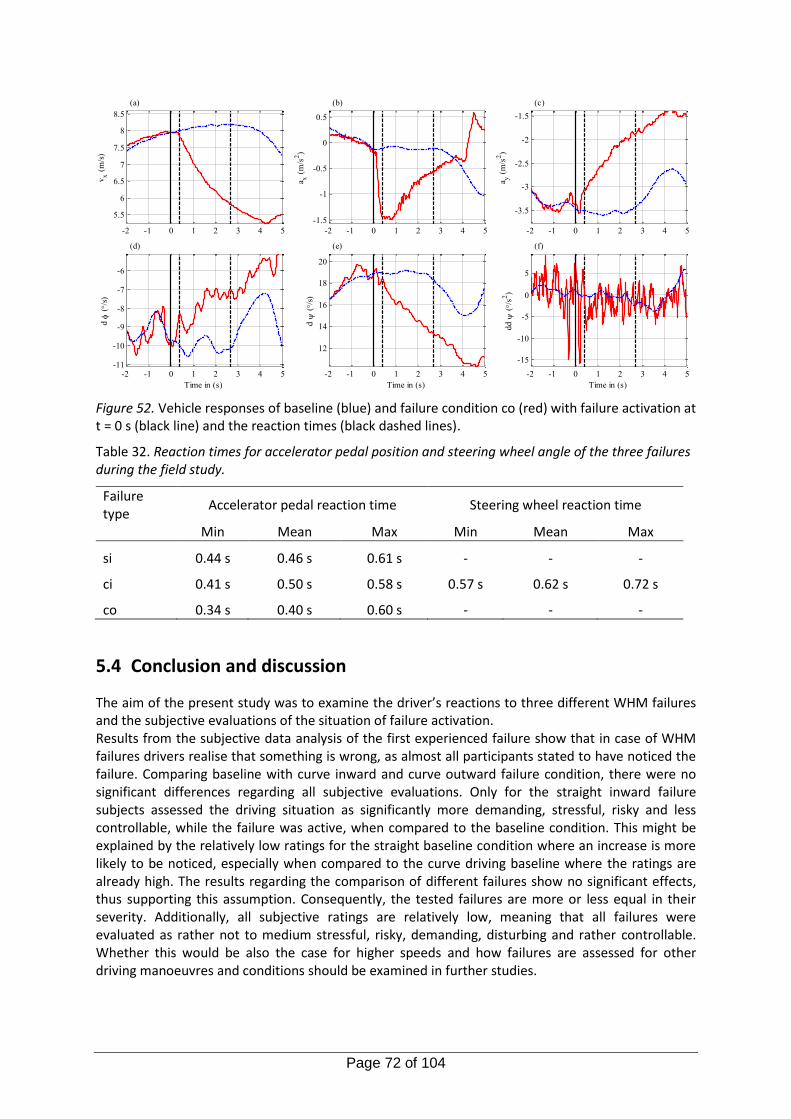
Page 72 of 104
Figure 52. Vehicle responses of baseline (blue) and failure condition co (red) with failure activation at t = 0 s (black line) and the reaction times (black dashed lines).
Table 32. Reaction times for accelerator pedal position and steering wheel angle of the three failures during the field study.
Failure type
Accelerator pedal reaction time Steering wheel reaction time
Min Mean Max Min Mean Max
si 0.44 s 0.46 s 0.61 s - - -
ci 0.41 s 0.50 s 0.58 s 0.57 s 0.62 s 0.72 s
co 0.34 s 0.40 s 0.60 s - - -
5.4 Conclusion and discussion
The aim of the present study was to examine the driver’s reactions to three different WHM failures and the subjective evaluations of the situation of failure activation. Results from the subjective data analysis of the first experienced failure show that in case of WHM failures drivers realise that something is wrong, as almost all participants stated to have noticed the failure. Comparing baseline with curve inward and curve outward failure condition, there were no significant differences regarding all subjective evaluations. Only for the straight inward failure subjects assessed the driving situation as significantly more demanding, stressful, risky and less controllable, while the failure was active, when compared to the baseline condition. This might be explained by the relatively low ratings for the straight baseline condition where an increase is more likely to be noticed, especially when compared to the curve driving baseline where the ratings are already high. The results regarding the comparison of different failures show no significant effects, thus supporting this assumption. Consequently, the tested failures are more or less equal in their severity. Additionally, all subjective ratings are relatively low, meaning that all failures were evaluated as rather not to medium stressful, risky, demanding, disturbing and rather controllable. Whether this would be also the case for higher speeds and how failures are assessed for other driving manoeuvres and conditions should be examined in further studies.
-2 -1 0 1 2 3 4 5
5.5
6
6.5
7
7.5
8
8.5
(a)v
x (
m/s
)
-2 -1 0 1 2 3 4 5
-1.5
-1
-0.5
0
0.5
(b)
a x (
m/s
2)
-2 -1 0 1 2 3 4 5
-3.5
-3
-2.5
-2
-1.5
(c)
a y (
m/s
2)
-2 -1 0 1 2 3 4 5-11
-10
-9
-8
-7
-6
(d)
Time in (s)
d
(/
s)
-2 -1 0 1 2 3 4 5
12
14
16
18
20
(e)
Time in (s)
d
(/
s)
-2 -1 0 1 2 3 4 5
-15
-10
-5
0
5
(f)
Time in (s)
dd
(/
s2)
Page 73 of 104
The analysis of objective data revealed, that participants’ main reaction to the WHM failure in the test track study was to try to overrule the deceleration caused by the failure activation through pressing the accelerator pedal. One reason for this reaction might be the instruction to maintain a speed of 30 km/h all the time. Whether drivers would also try to overrule the failure when not instructed to drive at a steady speed and whether there are differences for different speeds should be investigated in further research. The accelerator pedal reaction time ranged between 0.34 s and 0.61 s for all three failure conditions, thus having a shorter reaction time than the simulator study. This could be caused by the higher workload during fast driving manoeuvres on motorways. The lateral deviation is more pronounced during high speed manoeuvres, while the effect of a failure at low speeds is mainly longitudinal deceleration. Further, longitudinal accelerations are not experienced to the same extent in the driving simulator as in a real vehicle. Apart from a few exceptions, the drivers did not step on the brake pedal as a reaction to the failure, which seems quite intuitive as the failure itself causes a deceleration of the vehicle. As mentioned earlier, further studies should clarify, whether this effect persists without the instruction to maintain speed. Results show that participants did not steer on straight inward and curve outward failure conditions. There was only a steering reaction detected for the curve inward failure, which leads to the assumption that this was the most severe failure – at least when looking at the objective data. The question remains open on why this implied higher severity in terms of driver reaction and is not reflected in the subjective ratings. A possible explanation might be the low speed of 30 km/h in combination with highly controlled traffic situations, like for example only one lane and no oncoming or following traffic. The effect of a failure at 30 km/h on the straight and in a curve is not critical to the driving safety of the vehicle. Objective and subjective results underline this hypothesis. However, the following restriction has to be considered. All subjects were informed that a failure will happen to the vehicle. Further, the field study was conducted on the closed-off car park without any other road users or obstacles. Therefore, these reaction times might not be comparable to reaction times that would occur during a failure in regular traffic. However, the results give a good indication how humans react to such failure conditions. The reported findings show that drivers could handle a WHM failure as it was implemented in the study and under the given driving conditions while driving at low speeds. One could assume that WHM failures could have more severe consequences under more complex driving conditions, for instance at higher speeds and with other traffic, especially when vulnerable road users are involved. Furthermore, a WHM failure induces sudden deceleration of the EV that could also have serious consequences for following traffic. It should be kept in mind though, that the failure activation period in case of a real failure might not be limited to 3 seconds and might instead occur permanently, exposing the driver and vehicle to situations which have not been covered in the current study.
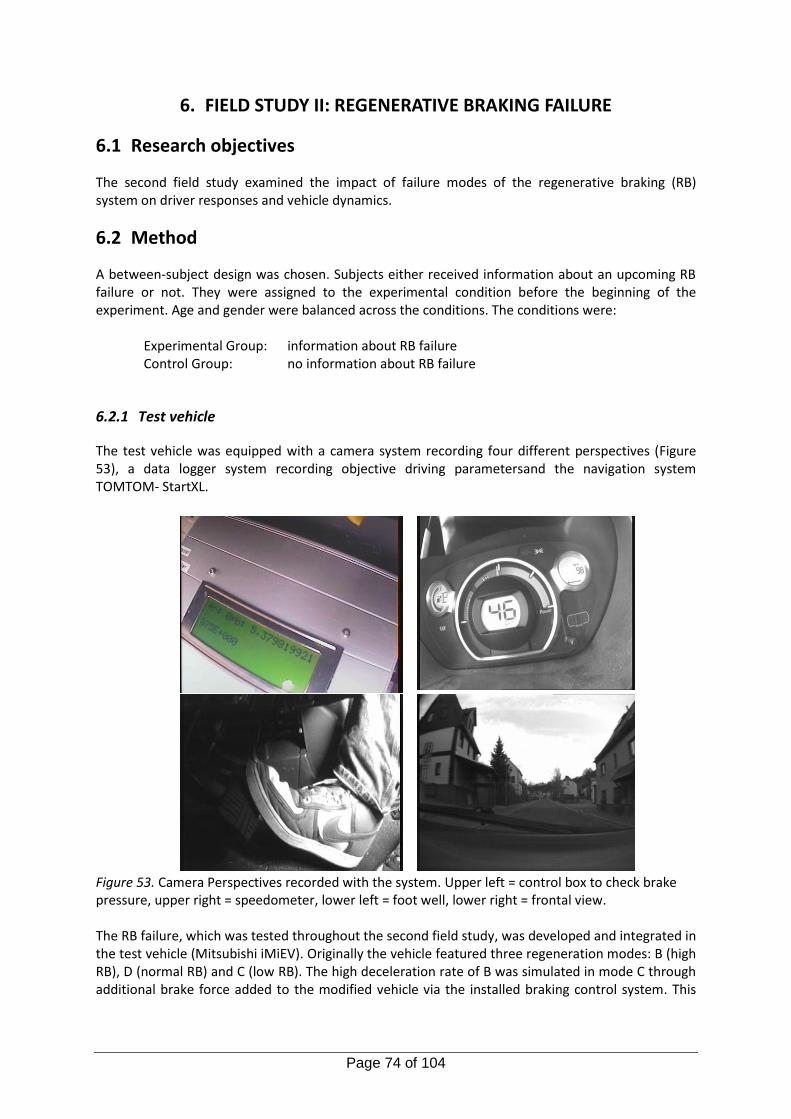
Page 74 of 104
6. FIELD STUDY II: REGENERATIVE BRAKING FAILURE
6.1 Research objectives
The second field study examined the impact of failure modes of the regenerative braking (RB) system on driver responses and vehicle dynamics.
6.2 Method
A between-subject design was chosen. Subjects either received information about an upcoming RB failure or not. They were assigned to the experimental condition before the beginning of the experiment. Age and gender were balanced across the conditions. The conditions were:
Experimental Group: information about RB failure Control Group: no information about RB failure
6.2.1 Test vehicle
The test vehicle was equipped with a camera system recording four different perspectives (Figure 53), a data logger system recording objective driving parametersand the navigation system TOMTOM- StartXL.
Figure 53. Camera Perspectives recorded with the system. Upper left = control box to check brake pressure, upper right = speedometer, lower left = foot well, lower right = frontal view. The RB failure, which was tested throughout the second field study, was developed and integrated in the test vehicle (Mitsubishi iMiEV). Originally the vehicle featured three regeneration modes: B (high RB), D (normal RB) and C (low RB). The high deceleration rate of B was simulated in mode C through additional brake force added to the modified vehicle via the installed braking control system. This
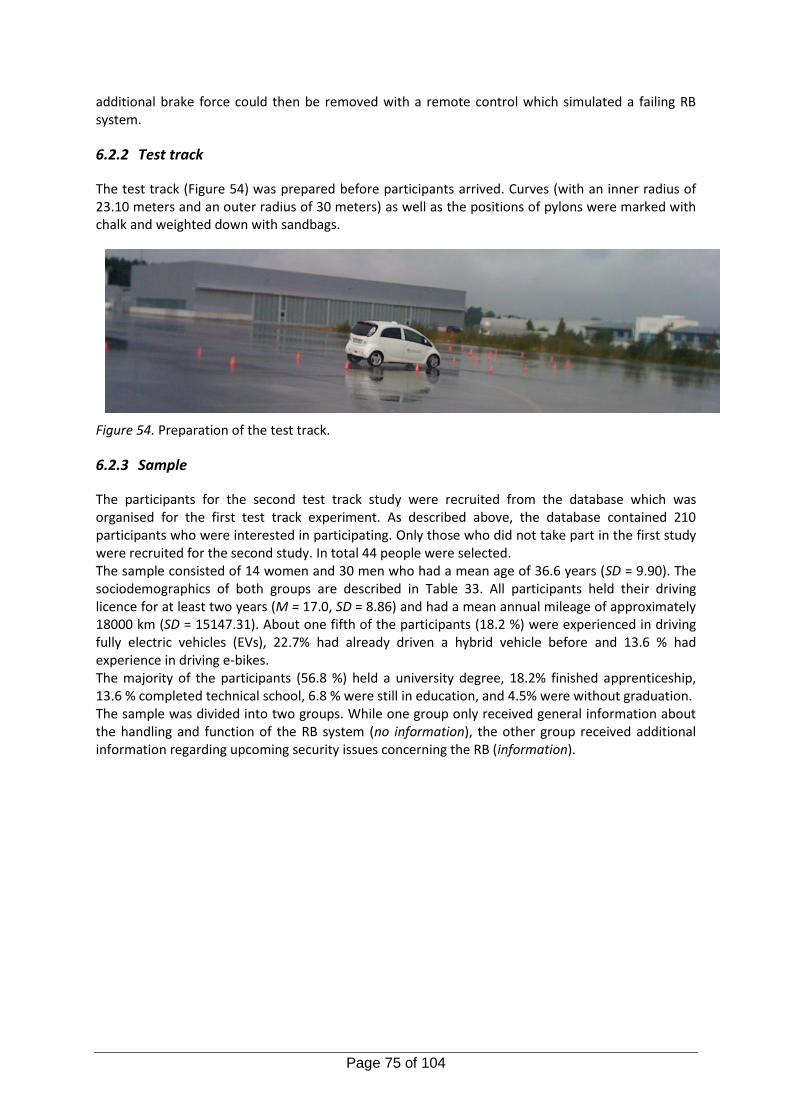
Page 75 of 104
additional brake force could then be removed with a remote control which simulated a failing RB system.
6.2.2 Test track
The test track (Figure 54) was prepared before participants arrived. Curves (with an inner radius of 23.10 meters and an outer radius of 30 meters) as well as the positions of pylons were marked with chalk and weighted down with sandbags.
Figure 54. Preparation of the test track.
6.2.3 Sample
The participants for the second test track study were recruited from the database which was organised for the first test track experiment. As described above, the database contained 210 participants who were interested in participating. Only those who did not take part in the first study were recruited for the second study. In total 44 people were selected. The sample consisted of 14 women and 30 men who had a mean age of 36.6 years (SD = 9.90). The sociodemographics of both groups are described in Table 33. All participants held their driving licence for at least two years (M = 17.0, SD = 8.86) and had a mean annual mileage of approximately 18000 km (SD = 15147.31). About one fifth of the participants (18.2 %) were experienced in driving fully electric vehicles (EVs), 22.7% had already driven a hybrid vehicle before and 13.6 % had experience in driving e-bikes. The majority of the participants (56.8 %) held a university degree, 18.2% finished apprenticeship, 13.6 % completed technical school, 6.8 % were still in education, and 4.5% were without graduation. The sample was divided into two groups. While one group only received general information about the handling and function of the RB system (no information), the other group received additional information regarding upcoming security issues concerning the RB (information).
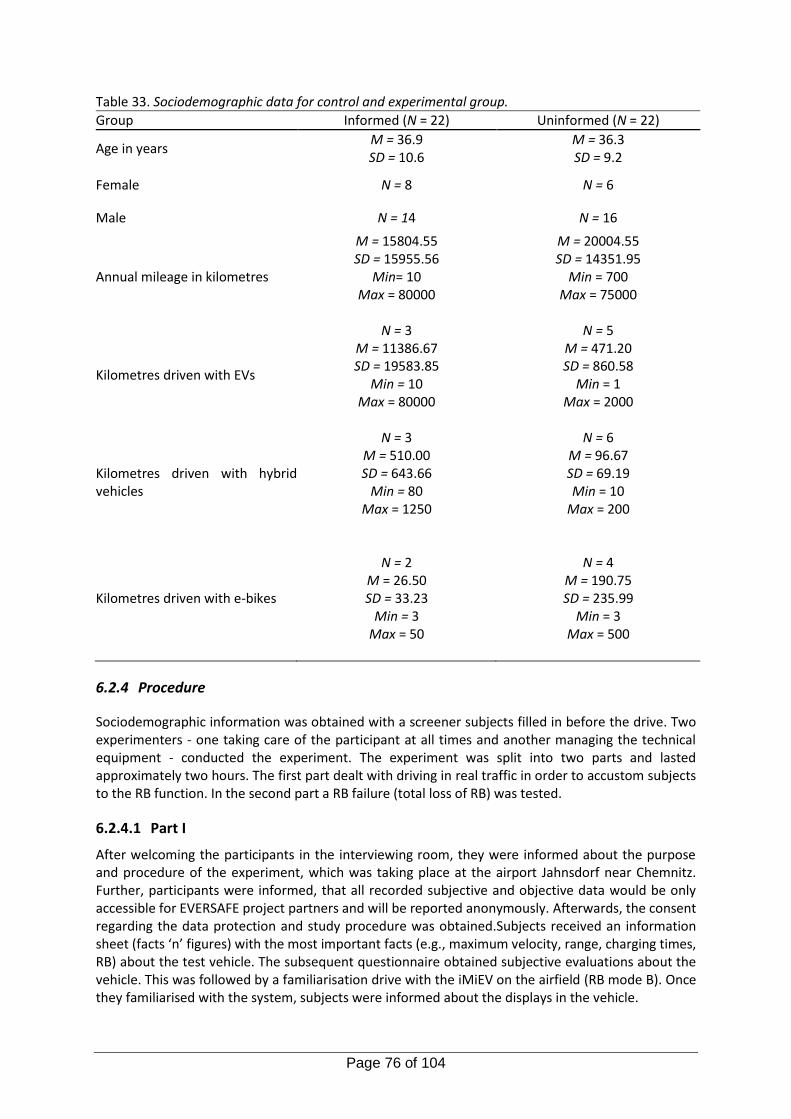
Page 76 of 104
Table 33. Sociodemographic data for control and experimental group.
Group Informed (N = 22) Uninformed (N = 22)
Age in years M = 36.9 SD = 10.6
M = 36.3 SD = 9.2
Female N = 8 N = 6
Male N = 14 N = 16
Annual mileage in kilometres
M = 15804.55 SD = 15955.56
Min= 10 Max = 80000
M = 20004.55 SD = 14351.95
Min = 700 Max = 75000
Kilometres driven with EVs
N = 3 M = 11386.67 SD = 19583.85
Min = 10 Max = 80000
N = 5 M = 471.20 SD = 860.58
Min = 1 Max = 2000
Kilometres driven with hybrid vehicles
N = 3 M = 510.00 SD = 643.66
Min = 80 Max = 1250
N = 6 M = 96.67 SD = 69.19 Min = 10
Max = 200
Kilometres driven with e-bikes
N = 2 M = 26.50 SD = 33.23
Min = 3 Max = 50
N = 4
M = 190.75 SD = 235.99
Min = 3 Max = 500
6.2.4 Procedure
Sociodemographic information was obtained with a screener subjects filled in before the drive. Two experimenters - one taking care of the participant at all times and another managing the technical equipment - conducted the experiment. The experiment was split into two parts and lasted approximately two hours. The first part dealt with driving in real traffic in order to accustom subjects to the RB function. In the second part a RB failure (total loss of RB) was tested.
6.2.4.1 Part I
After welcoming the participants in the interviewing room, they were informed about the purpose and procedure of the experiment, which was taking place at the airport Jahnsdorf near Chemnitz. Further, participants were informed, that all recorded subjective and objective data would be only accessible for EVERSAFE project partners and will be reported anonymously. Afterwards, the consent regarding the data protection and study procedure was obtained.Subjects received an information sheet (facts ‘n’ figures) with the most important facts (e.g., maximum velocity, range, charging times, RB) about the test vehicle. The subsequent questionnaire obtained subjective evaluations about the vehicle. This was followed by a familiarisation drive with the iMiEV on the airfield (RB mode B). Once they familiarised with the system, subjects were informed about the displays in the vehicle.
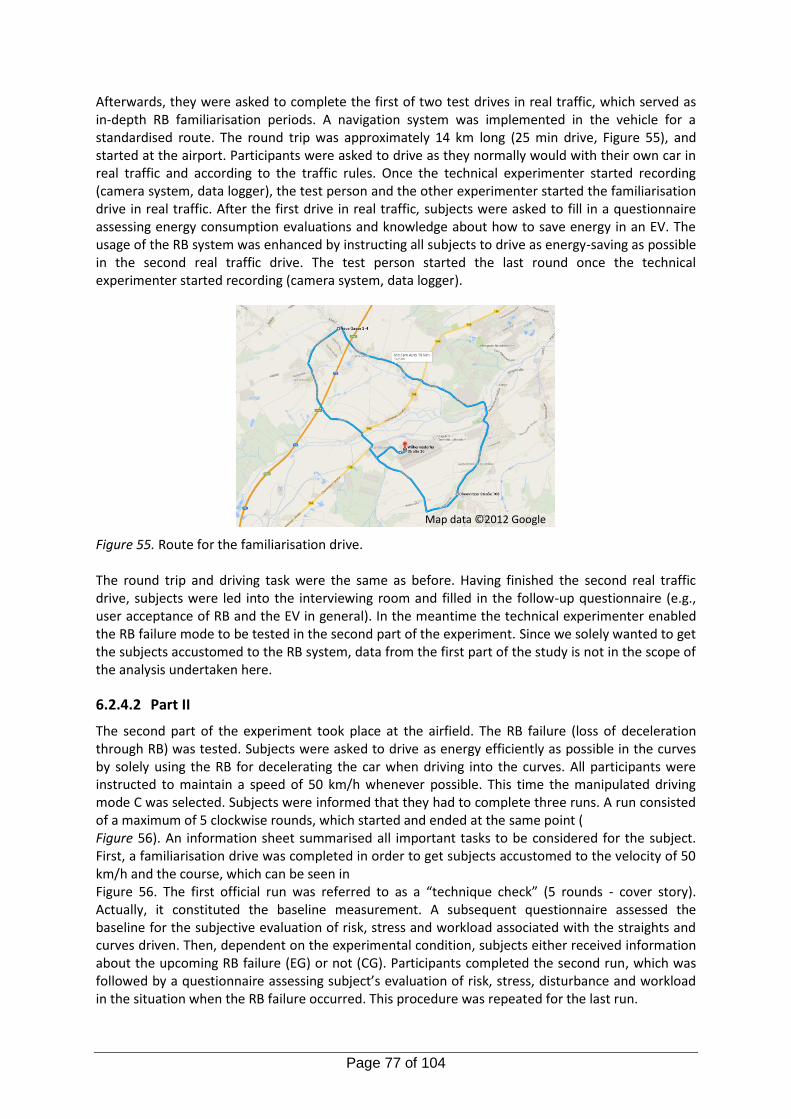
Page 77 of 104
Afterwards, they were asked to complete the first of two test drives in real traffic, which served as in-depth RB familiarisation periods. A navigation system was implemented in the vehicle for a standardised route. The round trip was approximately 14 km long (25 min drive, Figure 55), and started at the airport. Participants were asked to drive as they normally would with their own car in real traffic and according to the traffic rules. Once the technical experimenter started recording (camera system, data logger), the test person and the other experimenter started the familiarisation drive in real traffic. After the first drive in real traffic, subjects were asked to fill in a questionnaire assessing energy consumption evaluations and knowledge about how to save energy in an EV. The usage of the RB system was enhanced by instructing all subjects to drive as energy-saving as possible in the second real traffic drive. The test person started the last round once the technical experimenter started recording (camera system, data logger).
Figure 55. Route for the familiarisation drive. The round trip and driving task were the same as before. Having finished the second real traffic drive, subjects were led into the interviewing room and filled in the follow-up questionnaire (e.g., user acceptance of RB and the EV in general). In the meantime the technical experimenter enabled the RB failure mode to be tested in the second part of the experiment. Since we solely wanted to get the subjects accustomed to the RB system, data from the first part of the study is not in the scope of the analysis undertaken here.
6.2.4.2 Part II
The second part of the experiment took place at the airfield. The RB failure (loss of deceleration through RB) was tested. Subjects were asked to drive as energy efficiently as possible in the curves by solely using the RB for decelerating the car when driving into the curves. All participants were instructed to maintain a speed of 50 km/h whenever possible. This time the manipulated driving mode C was selected. Subjects were informed that they had to complete three runs. A run consisted of a maximum of 5 clockwise rounds, which started and ended at the same point ( Figure 56). An information sheet summarised all important tasks to be considered for the subject. First, a familiarisation drive was completed in order to get subjects accustomed to the velocity of 50 km/h and the course, which can be seen in Figure 56. The first official run was referred to as a “technique check” (5 rounds - cover story). Actually, it constituted the baseline measurement. A subsequent questionnaire assessed the baseline for the subjective evaluation of risk, stress and workload associated with the straights and curves driven. Then, dependent on the experimental condition, subjects either received information about the upcoming RB failure (EG) or not (CG). Participants completed the second run, which was followed by a questionnaire assessing subject’s evaluation of risk, stress, disturbance and workload in the situation when the RB failure occurred. This procedure was repeated for the last run.
Map data ©2012 Google
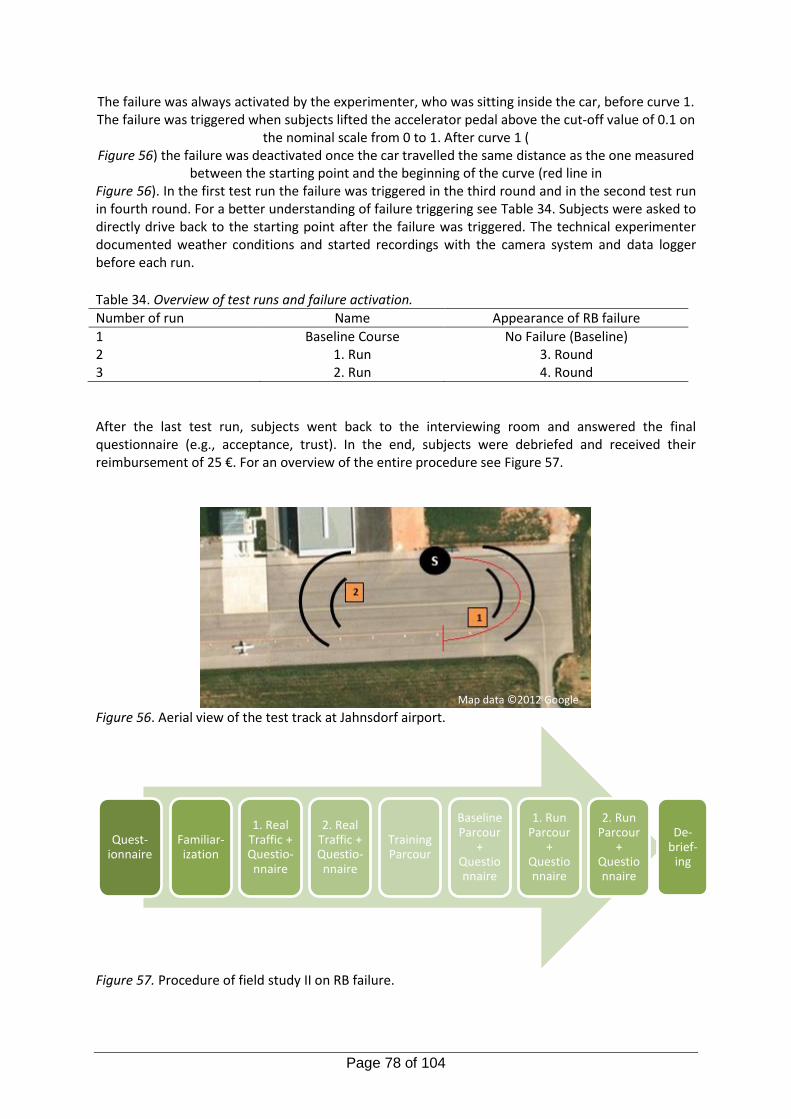
Page 78 of 104
The failure was always activated by the experimenter, who was sitting inside the car, before curve 1. The failure was triggered when subjects lifted the accelerator pedal above the cut-off value of 0.1 on
the nominal scale from 0 to 1. After curve 1 ( Figure 56) the failure was deactivated once the car travelled the same distance as the one measured
between the starting point and the beginning of the curve (red line in Figure 56). In the first test run the failure was triggered in the third round and in the second test run in fourth round. For a better understanding of failure triggering see Table 34. Subjects were asked to directly drive back to the starting point after the failure was triggered. The technical experimenter documented weather conditions and started recordings with the camera system and data logger before each run.
Table 34. Overview of test runs and failure activation. Number of run Name Appearance of RB failure
1 Baseline Course No Failure (Baseline) 2 1. Run 3. Round 3 2. Run 4. Round
After the last test run, subjects went back to the interviewing room and answered the final questionnaire (e.g., acceptance, trust). In the end, subjects were debriefed and received their reimbursement of 25 €. For an overview of the entire procedure see Figure 57.
Figure 56. Aerial view of the test track at Jahnsdorf airport.
Figure 57. Procedure of field study II on RB failure.
Quest-ionnaire
Familiar-ization
1. Real Traffic + Questio-nnaire
2. Real Traffic + Questio-nnaire
Training Parcour
Baseline Parcour
+ Questionnaire
1. Run Parcour
+ Questionnaire
2. Run Parcour
+ Questionnaire
De-brief-
ing
Map data ©2012 Google
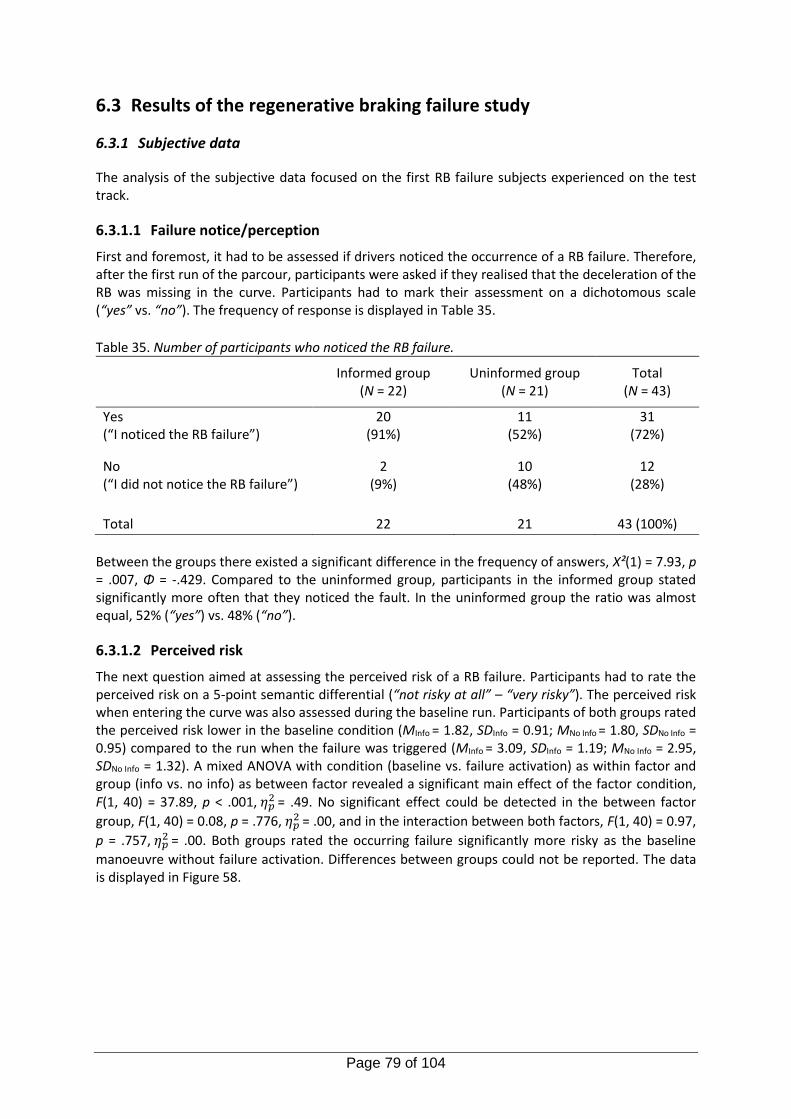
Page 79 of 104
6.3 Results of the regenerative braking failure study
6.3.1 Subjective data
The analysis of the subjective data focused on the first RB failure subjects experienced on the test track.
6.3.1.1 Failure notice/perception
First and foremost, it had to be assessed if drivers noticed the occurrence of a RB failure. Therefore, after the first run of the parcour, participants were asked if they realised that the deceleration of the RB was missing in the curve. Participants had to mark their assessment on a dichotomous scale (“yes” vs. “no”). The frequency of response is displayed in Table 35.
Table 35. Number of participants who noticed the RB failure.
Informed group
(N = 22) Uninformed group
(N = 21) Total
(N = 43)
Yes (“I noticed the RB failure”)
20 (91%)
11 (52%)
31 (72%)
No (“I did not notice the RB failure”)
2 (9%)
10 (48%)
12 (28%)
Total 22 21 43 (100%)
Between the groups there existed a significant difference in the frequency of answers, Χ²(1) = 7.93, p = .007, Φ = -.429. Compared to the uninformed group, participants in the informed group stated significantly more often that they noticed the fault. In the uninformed group the ratio was almost equal, 52% (“yes”) vs. 48% (“no”).
6.3.1.2 Perceived risk
The next question aimed at assessing the perceived risk of a RB failure. Participants had to rate the perceived risk on a 5-point semantic differential (“not risky at all” – “very risky”). The perceived risk when entering the curve was also assessed during the baseline run. Participants of both groups rated the perceived risk lower in the baseline condition (MInfo = 1.82, SDInfo = 0.91; MNo Info = 1.80, SDNo Info = 0.95) compared to the run when the failure was triggered (MInfo = 3.09, SDInfo = 1.19; MNo Info = 2.95, SDNo Info = 1.32). A mixed ANOVA with condition (baseline vs. failure activation) as within factor and group (info vs. no info) as between factor revealed a significant main effect of the factor condition, F(1, 40) = 37.89, p < .001, 𝜂𝑝
2 = .49. No significant effect could be detected in the between factor
group, F(1, 40) = 0.08, p = .776, 𝜂𝑝2
= .00, and in the interaction between both factors, F(1, 40) = 0.97,
p = .757, 𝜂𝑝2
= .00. Both groups rated the occurring failure significantly more risky as the baseline
manoeuvre without failure activation. Differences between groups could not be reported. The data is displayed in Figure 58.
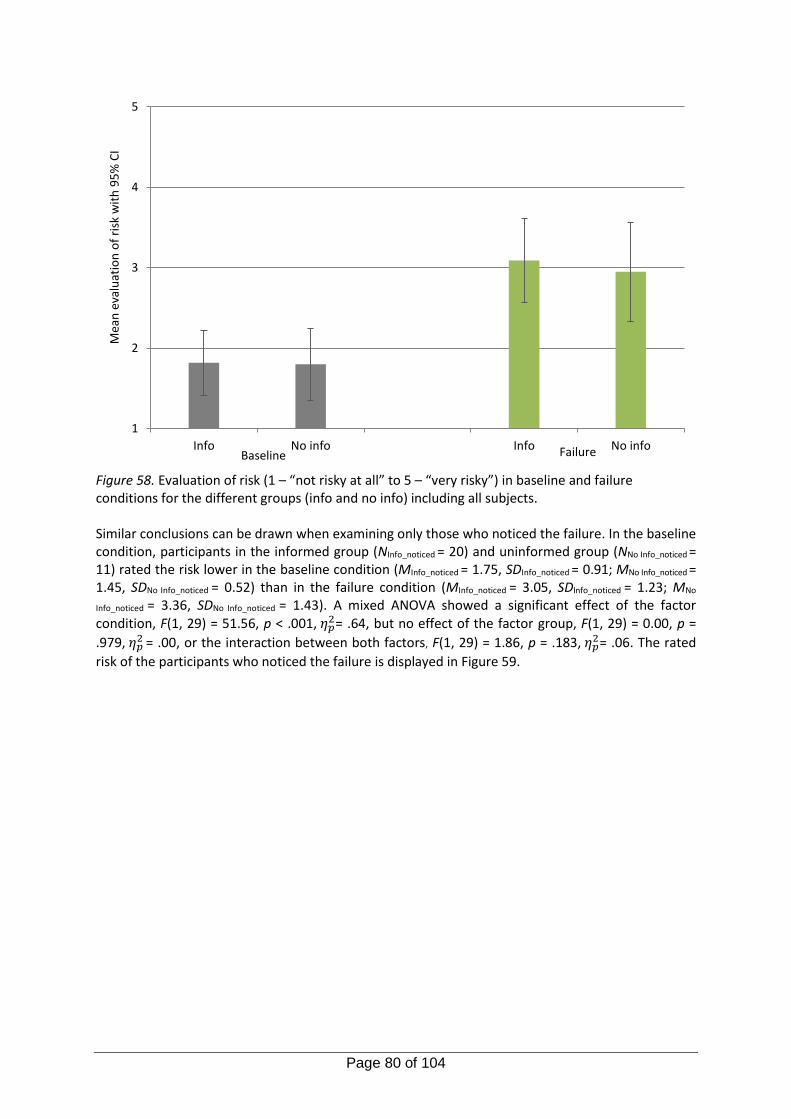
Page 80 of 104
Figure 58. Evaluation of risk (1 – “not risky at all” to 5 – “very risky”) in baseline and failure conditions for the different groups (info and no info) including all subjects. Similar conclusions can be drawn when examining only those who noticed the failure. In the baseline condition, participants in the informed group (NInfo_noticed = 20) and uninformed group (NNo Info_noticed = 11) rated the risk lower in the baseline condition (MInfo_noticed = 1.75, SDInfo_noticed = 0.91; MNo Info_noticed = 1.45, SDNo Info_noticed = 0.52) than in the failure condition (MInfo_noticed = 3.05, SDInfo_noticed = 1.23; MNo
Info_noticed = 3.36, SDNo Info_noticed = 1.43). A mixed ANOVA showed a significant effect of the factor condition, F(1, 29) = 51.56, p < .001, 𝜂𝑝
2= .64, but no effect of the factor group, F(1, 29) = 0.00, p =
.979, 𝜂𝑝2
= .00, or the interaction between both factors, F(1, 29) = 1.86, p = .183, 𝜂𝑝2= .06. The rated
risk of the participants who noticed the failure is displayed in Figure 59.
1
2
3
4
5
Info No info Info No info
Mea
n e
valu
atio
n o
f ri
sk w
ith
95
% C
I
Baseline Failure
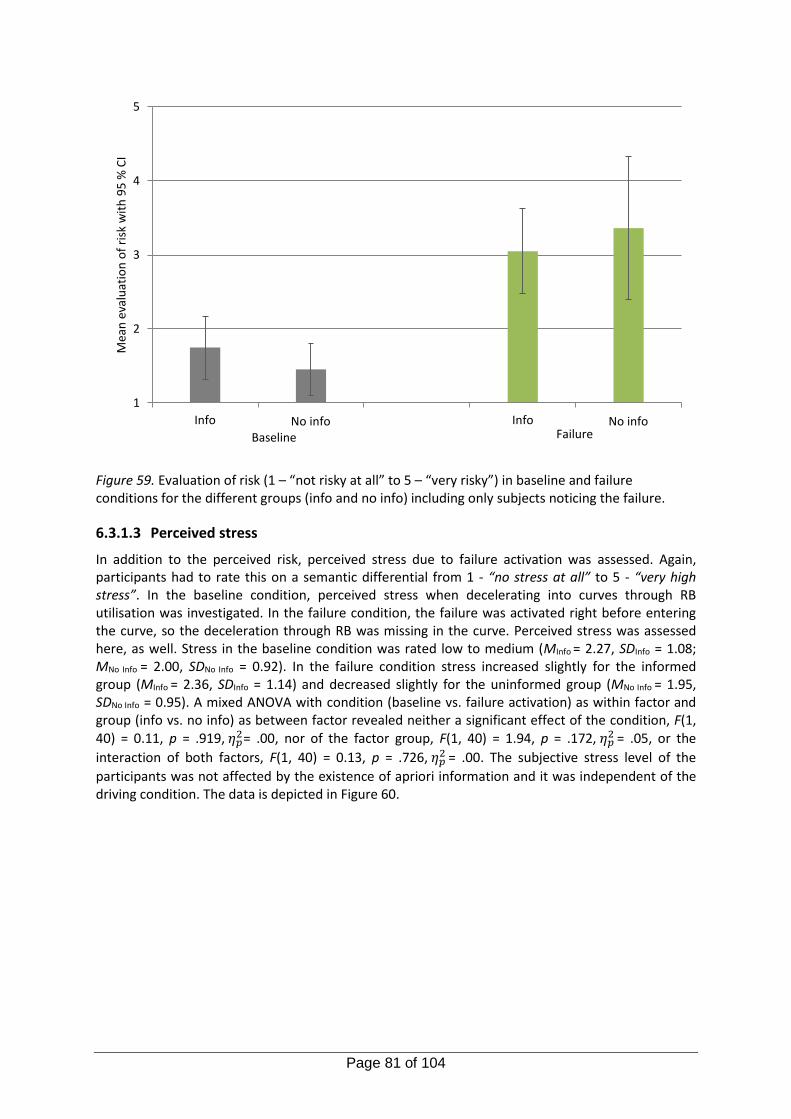
Page 81 of 104
Figure 59. Evaluation of risk (1 – “not risky at all” to 5 – “very risky”) in baseline and failure conditions for the different groups (info and no info) including only subjects noticing the failure.
6.3.1.3 Perceived stress
In addition to the perceived risk, perceived stress due to failure activation was assessed. Again, participants had to rate this on a semantic differential from 1 - “no stress at all” to 5 - “very high stress”. In the baseline condition, perceived stress when decelerating into curves through RB utilisation was investigated. In the failure condition, the failure was activated right before entering the curve, so the deceleration through RB was missing in the curve. Perceived stress was assessed here, as well. Stress in the baseline condition was rated low to medium (MInfo = 2.27, SDInfo = 1.08; MNo Info = 2.00, SDNo Info = 0.92). In the failure condition stress increased slightly for the informed group (MInfo = 2.36, SDInfo = 1.14) and decreased slightly for the uninformed group (MNo Info = 1.95, SDNo Info = 0.95). A mixed ANOVA with condition (baseline vs. failure activation) as within factor and group (info vs. no info) as between factor revealed neither a significant effect of the condition, F(1, 40) = 0.11, p = .919, 𝜂𝑝
2= .00, nor of the factor group, F(1, 40) = 1.94, p = .172, 𝜂𝑝2
= .05, or the
interaction of both factors, F(1, 40) = 0.13, p = .726, 𝜂𝑝2
= .00. The subjective stress level of the
participants was not affected by the existence of apriori information and it was independent of the driving condition. The data is depicted in Figure 60.
1
2
3
4
5
Info No Info Info No Info
Mea
n e
valu
atio
n o
f ri
sk w
ith
95
% C
I
Baseline FailureNo info No info
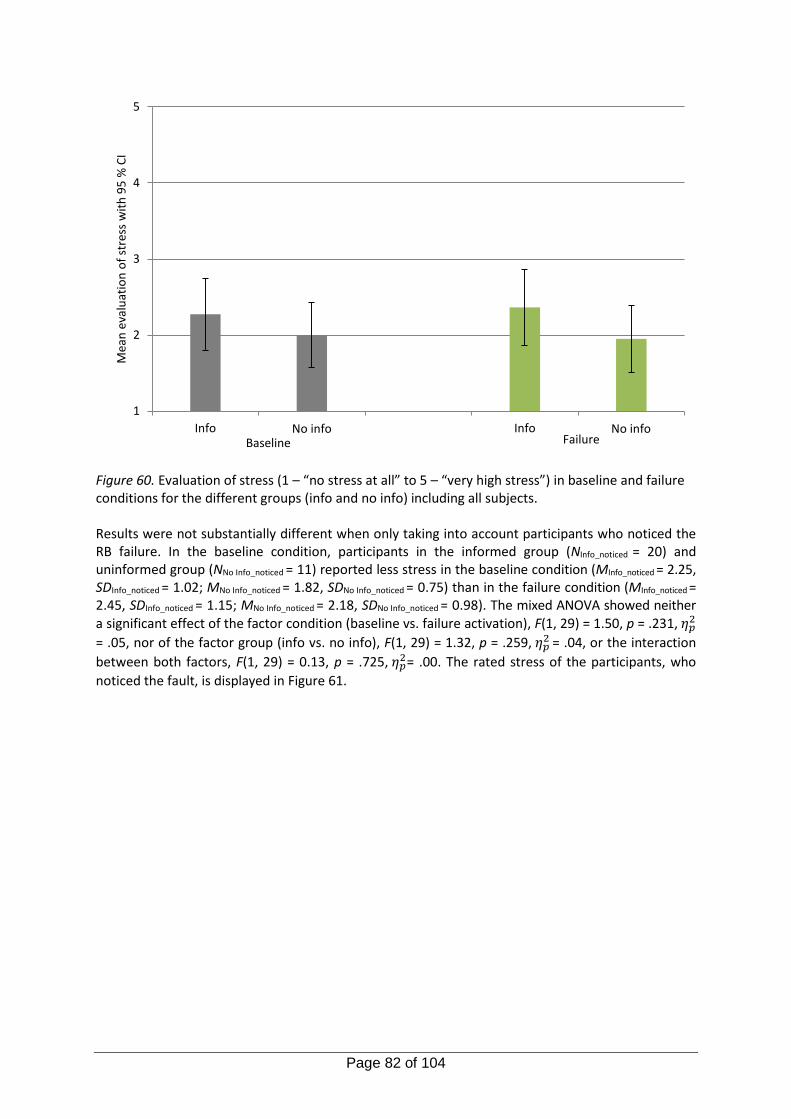
Page 82 of 104
Figure 60. Evaluation of stress (1 – “no stress at all” to 5 – “very high stress”) in baseline and failure conditions for the different groups (info and no info) including all subjects. Results were not substantially different when only taking into account participants who noticed the RB failure. In the baseline condition, participants in the informed group (NInfo_noticed = 20) and uninformed group (NNo Info_noticed = 11) reported less stress in the baseline condition (MInfo_noticed = 2.25, SDInfo_noticed = 1.02; MNo Info_noticed = 1.82, SDNo Info_noticed = 0.75) than in the failure condition (MInfo_noticed = 2.45, SDInfo_noticed = 1.15; MNo Info_noticed = 2.18, SDNo Info_noticed = 0.98). The mixed ANOVA showed neither a significant effect of the factor condition (baseline vs. failure activation), F(1, 29) = 1.50, p = .231, 𝜂𝑝
2
= .05, nor of the factor group (info vs. no info), F(1, 29) = 1.32, p = .259, 𝜂𝑝2
= .04, or the interaction
between both factors, F(1, 29) = 0.13, p = .725, 𝜂𝑝2= .00. The rated stress of the participants, who
noticed the fault, is displayed in Figure 61.
1
2
3
4
5
Info No Info Info No Info
Mea
n e
valu
atio
n o
f st
ress
wit
h 9
5 %
CI
Baseline FailureNo info No info
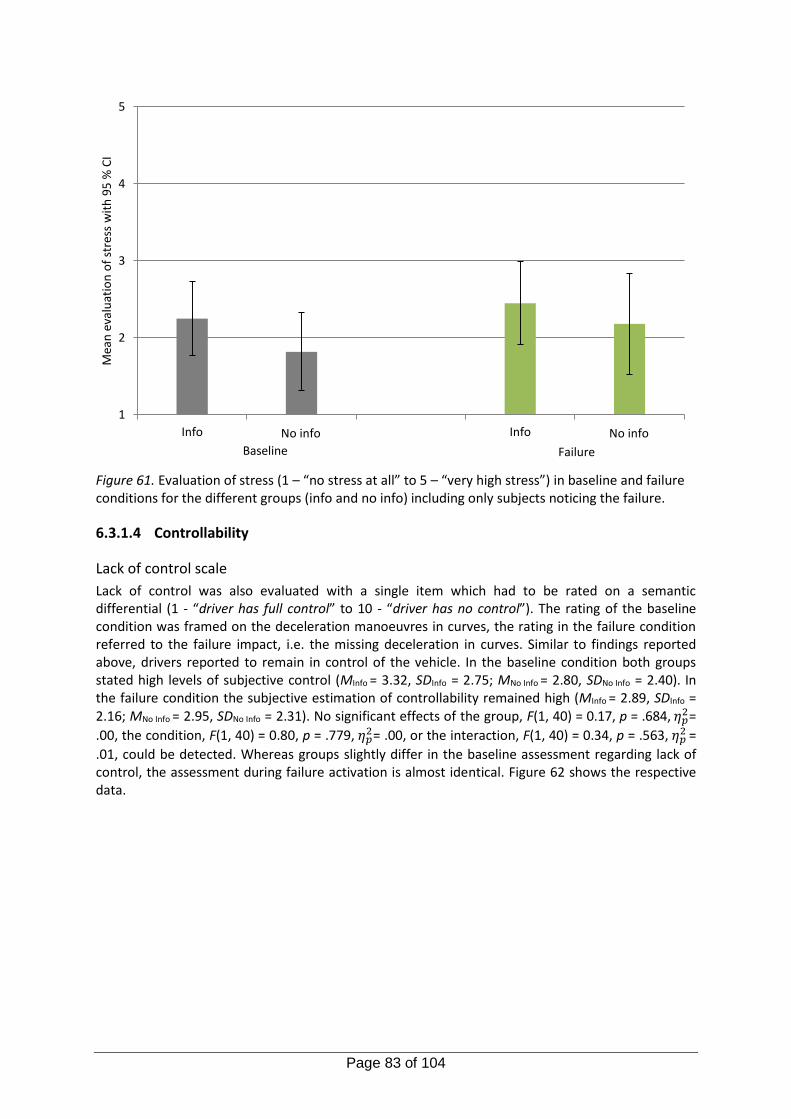
Page 83 of 104
Figure 61. Evaluation of stress (1 – “no stress at all” to 5 – “very high stress”) in baseline and failure conditions for the different groups (info and no info) including only subjects noticing the failure.
6.3.1.4 Controllability
Lack of control scale
Lack of control was also evaluated with a single item which had to be rated on a semantic differential (1 - “driver has full control” to 10 - “driver has no control”). The rating of the baseline condition was framed on the deceleration manoeuvres in curves, the rating in the failure condition referred to the failure impact, i.e. the missing deceleration in curves. Similar to findings reported above, drivers reported to remain in control of the vehicle. In the baseline condition both groups stated high levels of subjective control (MInfo = 3.32, SDInfo = 2.75; MNo Info = 2.80, SDNo Info = 2.40). In the failure condition the subjective estimation of controllability remained high (MInfo = 2.89, SDInfo = 2.16; MNo Info = 2.95, SDNo Info = 2.31). No significant effects of the group, F(1, 40) = 0.17, p = .684, 𝜂𝑝
2=
.00, the condition, F(1, 40) = 0.80, p = .779, 𝜂𝑝2= .00, or the interaction, F(1, 40) = 0.34, p = .563, 𝜂𝑝
2 =
.01, could be detected. Whereas groups slightly differ in the baseline assessment regarding lack of control, the assessment during failure activation is almost identical. Figure 62 shows the respective data.
1
2
3
4
5
Info No Info Info No Info
Mea
n e
valu
atio
n o
f st
ress
wit
h 9
5 %
CI
Baseline Failure
No info No info
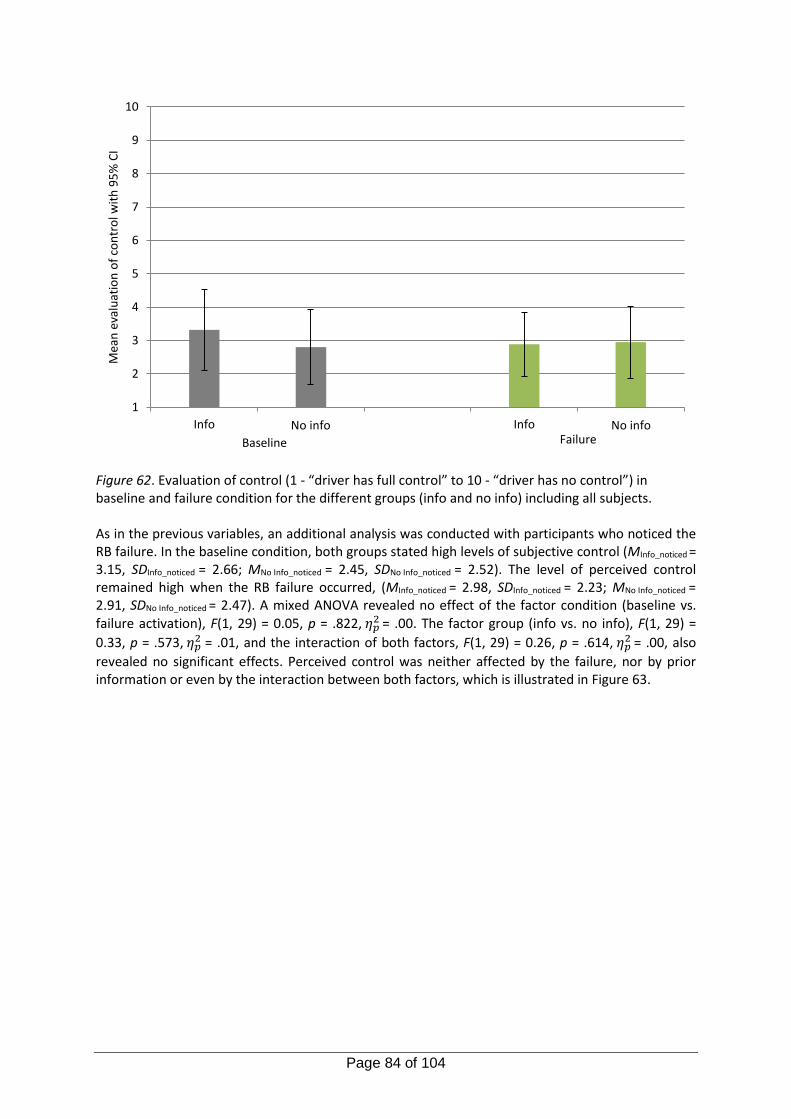
Page 84 of 104
Figure 62. Evaluation of control (1 - “driver has full control” to 10 - “driver has no control”) in baseline and failure condition for the different groups (info and no info) including all subjects. As in the previous variables, an additional analysis was conducted with participants who noticed the RB failure. In the baseline condition, both groups stated high levels of subjective control (MInfo_noticed = 3.15, SDInfo_noticed = 2.66; MNo Info_noticed = 2.45, SDNo Info_noticed = 2.52). The level of perceived control remained high when the RB failure occurred, (MInfo_noticed = 2.98, SDInfo_noticed = 2.23; MNo Info_noticed = 2.91, SDNo Info_noticed = 2.47). A mixed ANOVA revealed no effect of the factor condition (baseline vs. failure activation), F(1, 29) = 0.05, p = .822, 𝜂𝑝
2 = .00. The factor group (info vs. no info), F(1, 29) =
0.33, p = .573, 𝜂𝑝2 = .01, and the interaction of both factors, F(1, 29) = 0.26, p = .614, 𝜂𝑝
2 = .00, also
revealed no significant effects. Perceived control was neither affected by the failure, nor by prior information or even by the interaction between both factors, which is illustrated in Figure 63.
1
2
3
4
5
6
7
8
9
10
Info No Info Info No Info
Mea
n e
valu
atio
n o
f co
ntr
ol w
ith
95
% C
I
Baseline FailureNo info No info
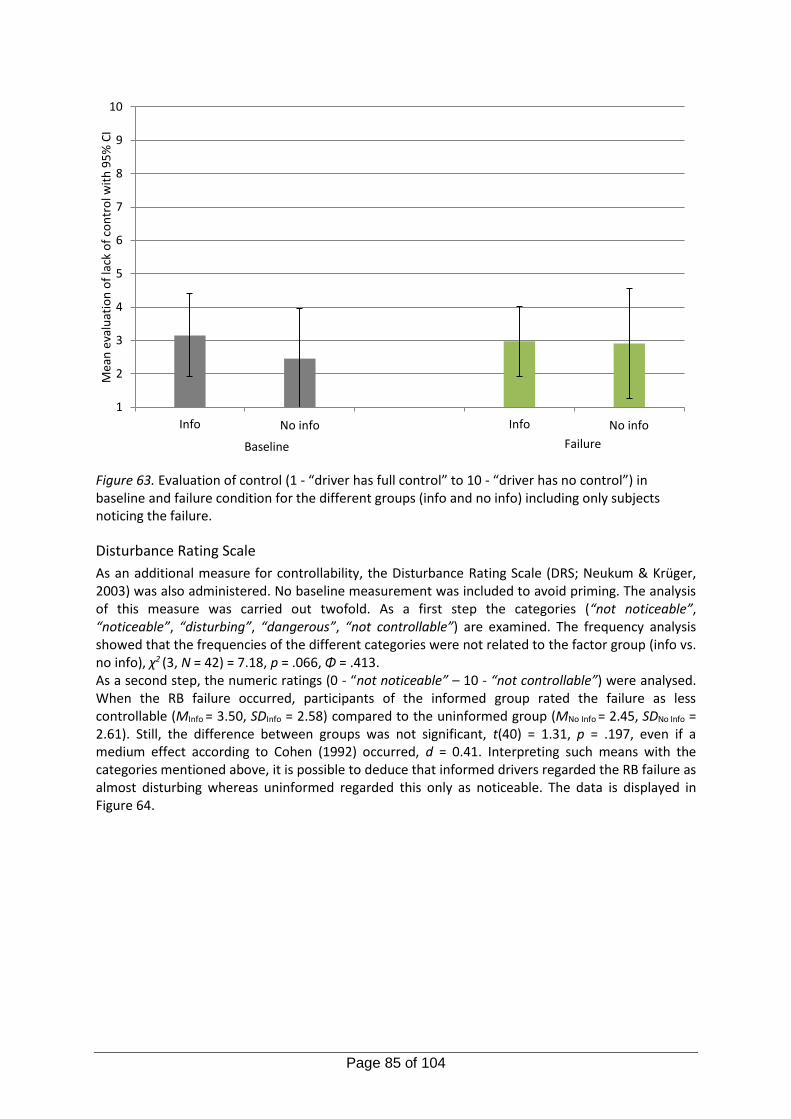
Page 85 of 104
Figure 63. Evaluation of control (1 - “driver has full control” to 10 - “driver has no control”) in baseline and failure condition for the different groups (info and no info) including only subjects noticing the failure.
Disturbance Rating Scale
As an additional measure for controllability, the Disturbance Rating Scale (DRS; Neukum & Krüger, 2003) was also administered. No baseline measurement was included to avoid priming. The analysis of this measure was carried out twofold. As a first step the categories (“not noticeable”, “noticeable”, “disturbing”, “dangerous”, “not controllable”) are examined. The frequency analysis showed that the frequencies of the different categories were not related to the factor group (info vs. no info), χ2 (3, N = 42) = 7.18, p = .066, Φ = .413. As a second step, the numeric ratings (0 - “not noticeable” – 10 - “not controllable”) were analysed. When the RB failure occurred, participants of the informed group rated the failure as less controllable (MInfo = 3.50, SDInfo = 2.58) compared to the uninformed group (MNo Info = 2.45, SDNo Info = 2.61). Still, the difference between groups was not significant, t(40) = 1.31, p = .197, even if a medium effect according to Cohen (1992) occurred, d = 0.41. Interpreting such means with the categories mentioned above, it is possible to deduce that informed drivers regarded the RB failure as almost disturbing whereas uninformed regarded this only as noticeable. The data is displayed in Figure 64.
1
2
3
4
5
6
7
8
9
10
Info No Info Info No Info
Mea
n e
valu
atio
n o
f la
ck o
f co
ntr
ol w
ith
95
% C
I
Baseline Failure
No info No info
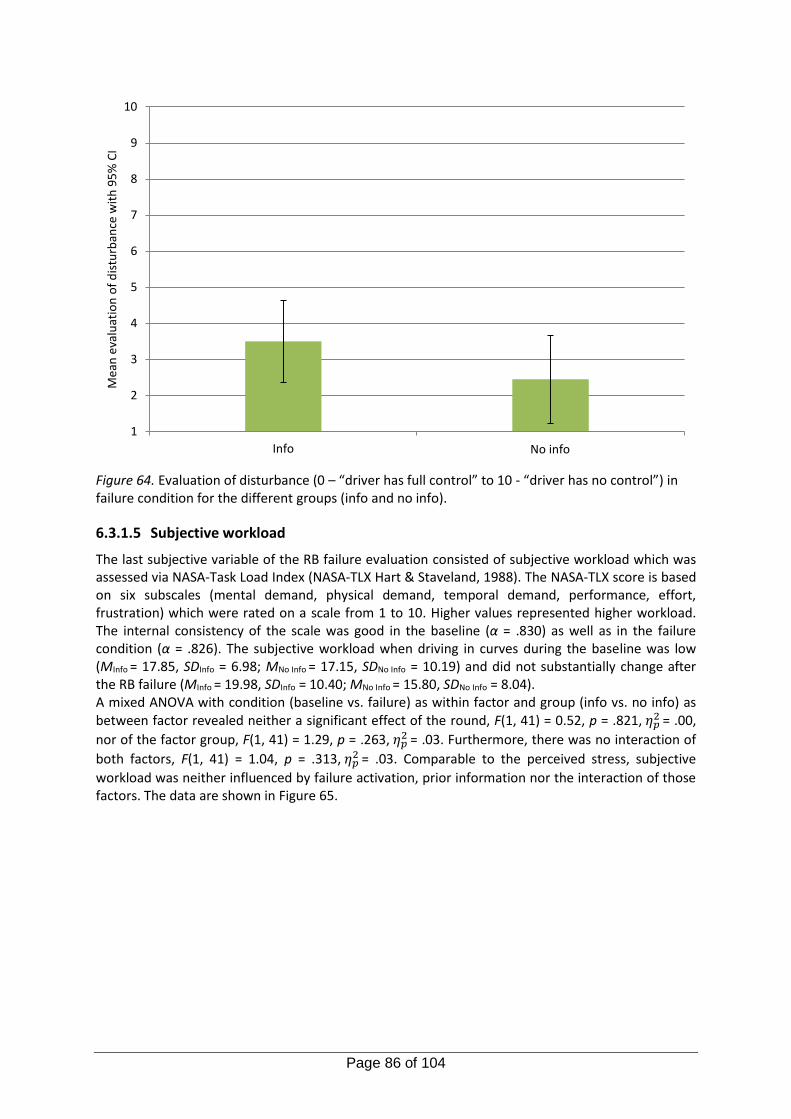
Page 86 of 104
Figure 64. Evaluation of disturbance (0 – “driver has full control” to 10 - “driver has no control”) in failure condition for the different groups (info and no info).
6.3.1.5 Subjective workload
The last subjective variable of the RB failure evaluation consisted of subjective workload which was assessed via NASA-Task Load Index (NASA-TLX Hart & Staveland, 1988). The NASA-TLX score is based on six subscales (mental demand, physical demand, temporal demand, performance, effort, frustration) which were rated on a scale from 1 to 10. Higher values represented higher workload. The internal consistency of the scale was good in the baseline (α = .830) as well as in the failure condition (α = .826). The subjective workload when driving in curves during the baseline was low (MInfo = 17.85, SDInfo = 6.98; MNo Info = 17.15, SDNo Info = 10.19) and did not substantially change after the RB failure (MInfo = 19.98, SDInfo = 10.40; MNo Info = 15.80, SDNo Info = 8.04). A mixed ANOVA with condition (baseline vs. failure) as within factor and group (info vs. no info) as between factor revealed neither a significant effect of the round, F(1, 41) = 0.52, p = .821, 𝜂𝑝
2 = .00,
nor of the factor group, F(1, 41) = 1.29, p = .263, 𝜂𝑝2
= .03. Furthermore, there was no interaction of
both factors, F(1, 41) = 1.04, p = .313, 𝜂𝑝2
= .03. Comparable to the perceived stress, subjective
workload was neither influenced by failure activation, prior information nor the interaction of those factors. The data are shown in Figure 65.
1
2
3
4
5
6
7
8
9
10
Info No Info
Mea
n e
valu
atio
n o
f d
istu
rban
ce w
ith
95
% C
I
No info
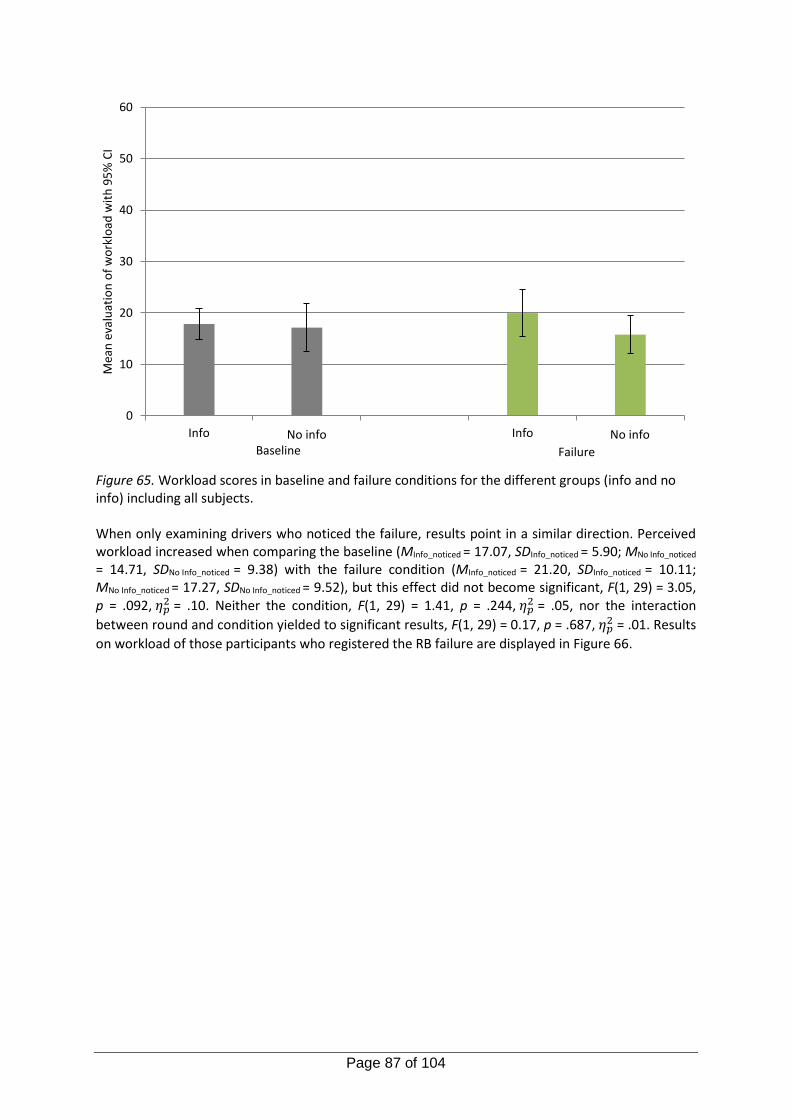
Page 87 of 104
Figure 65. Workload scores in baseline and failure conditions for the different groups (info and no info) including all subjects. When only examining drivers who noticed the failure, results point in a similar direction. Perceived workload increased when comparing the baseline (MInfo_noticed = 17.07, SDInfo_noticed = 5.90; MNo Info_noticed
= 14.71, SDNo Info_noticed = 9.38) with the failure condition (MInfo_noticed = 21.20, SDInfo_noticed = 10.11; MNo Info_noticed = 17.27, SDNo Info_noticed = 9.52), but this effect did not become significant, F(1, 29) = 3.05, p = .092, 𝜂𝑝
2 = .10. Neither the condition, F(1, 29) = 1.41, p = .244, 𝜂𝑝2 = .05, nor the interaction
between round and condition yielded to significant results, F(1, 29) = 0.17, p = .687, 𝜂𝑝2 = .01. Results
on workload of those participants who registered the RB failure are displayed in Figure 66.
0
10
20
30
40
50
60
Info No Info Info No Info
Mea
n e
valu
atio
n o
f w
ork
load
wit
h 9
5%
CI
Baseline Failure
No info No info
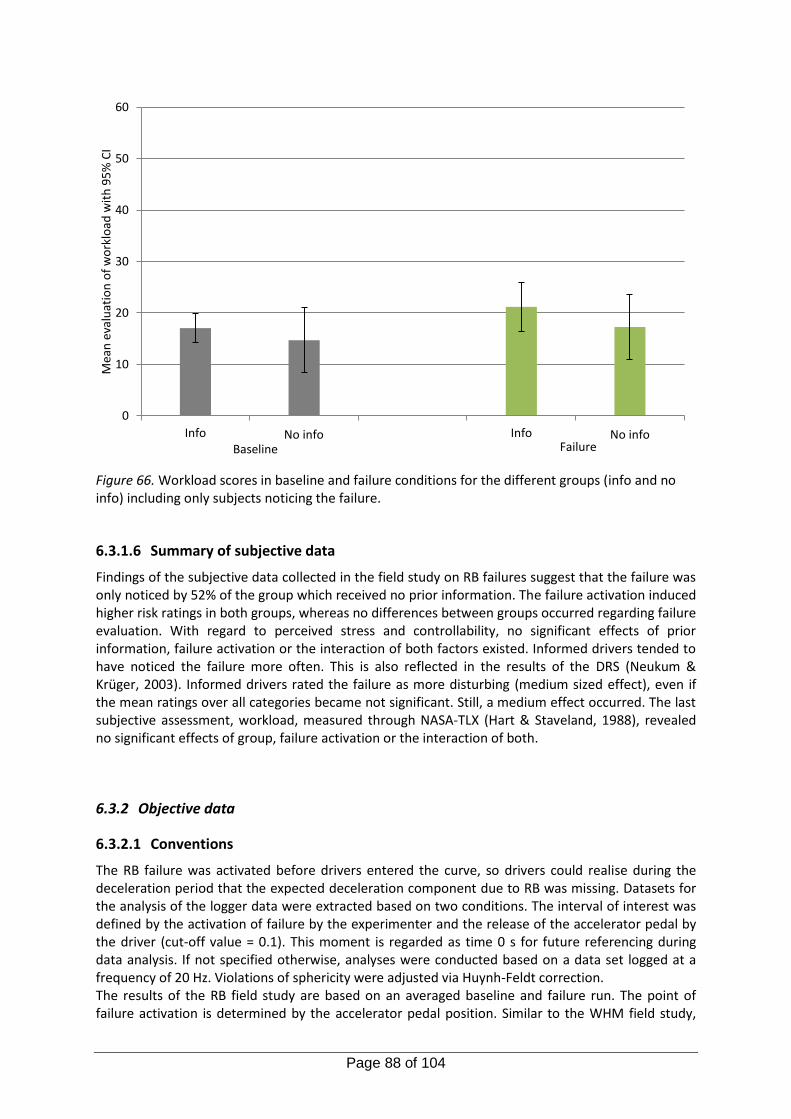
Page 88 of 104
Figure 66. Workload scores in baseline and failure conditions for the different groups (info and no info) including only subjects noticing the failure.
6.3.1.6 Summary of subjective data
Findings of the subjective data collected in the field study on RB failures suggest that the failure was only noticed by 52% of the group which received no prior information. The failure activation induced higher risk ratings in both groups, whereas no differences between groups occurred regarding failure evaluation. With regard to perceived stress and controllability, no significant effects of prior information, failure activation or the interaction of both factors existed. Informed drivers tended to have noticed the failure more often. This is also reflected in the results of the DRS (Neukum & Krüger, 2003). Informed drivers rated the failure as more disturbing (medium sized effect), even if the mean ratings over all categories became not significant. Still, a medium effect occurred. The last subjective assessment, workload, measured through NASA-TLX (Hart & Staveland, 1988), revealed no significant effects of group, failure activation or the interaction of both.
6.3.2 Objective data
6.3.2.1 Conventions
The RB failure was activated before drivers entered the curve, so drivers could realise during the deceleration period that the expected deceleration component due to RB was missing. Datasets for the analysis of the logger data were extracted based on two conditions. The interval of interest was defined by the activation of failure by the experimenter and the release of the accelerator pedal by the driver (cut-off value = 0.1). This moment is regarded as time 0 s for future referencing during data analysis. If not specified otherwise, analyses were conducted based on a data set logged at a frequency of 20 Hz. Violations of sphericity were adjusted via Huynh-Feldt correction. The results of the RB field study are based on an averaged baseline and failure run. The point of failure activation is determined by the accelerator pedal position. Similar to the WHM field study,
0
10
20
30
40
50
60
Info No Info Info No Info
Mea
n e
valu
atio
n o
f w
ork
load
wit
h 9
5%
CI
Baseline FailureNo info No info
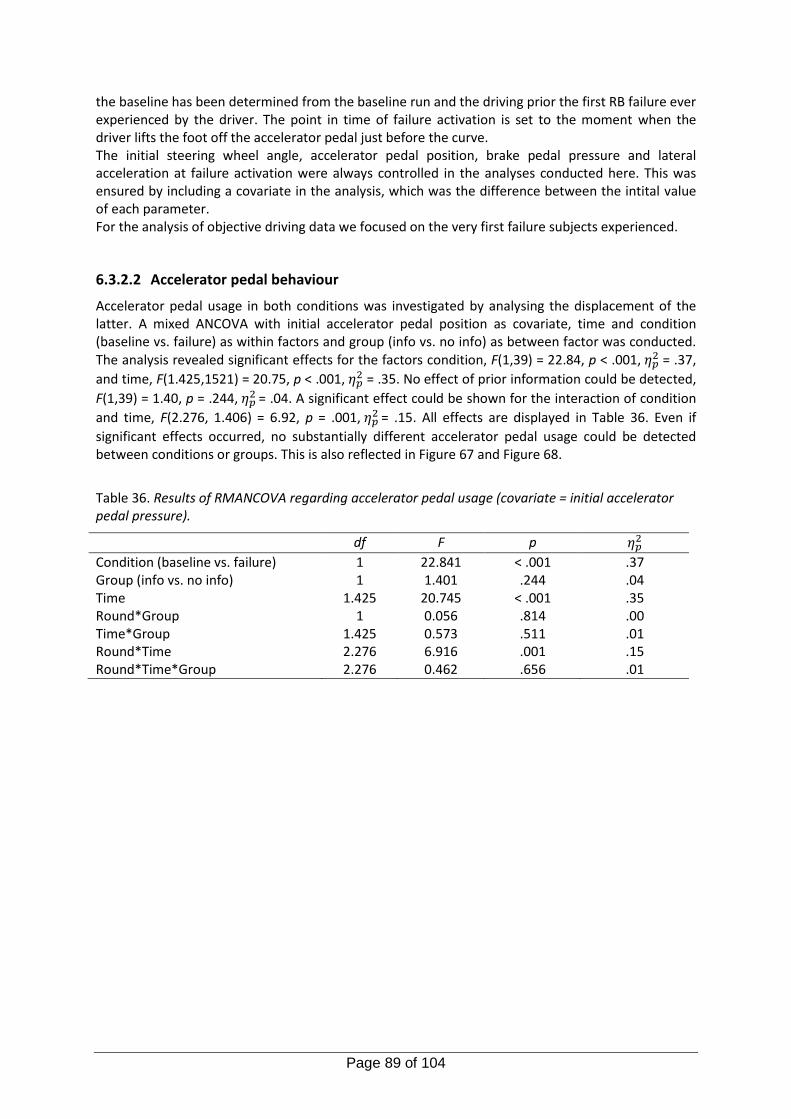
Page 89 of 104
the baseline has been determined from the baseline run and the driving prior the first RB failure ever experienced by the driver. The point in time of failure activation is set to the moment when the driver lifts the foot off the accelerator pedal just before the curve. The initial steering wheel angle, accelerator pedal position, brake pedal pressure and lateral acceleration at failure activation were always controlled in the analyses conducted here. This was ensured by including a covariate in the analysis, which was the difference between the intital value of each parameter. For the analysis of objective driving data we focused on the very first failure subjects experienced.
6.3.2.2 Accelerator pedal behaviour
Accelerator pedal usage in both conditions was investigated by analysing the displacement of the latter. A mixed ANCOVA with initial accelerator pedal position as covariate, time and condition (baseline vs. failure) as within factors and group (info vs. no info) as between factor was conducted. The analysis revealed significant effects for the factors condition, F(1,39) = 22.84, p < .001, 𝜂𝑝
2 = .37,
and time, F(1.425,1521) = 20.75, p < .001, 𝜂𝑝2 = .35. No effect of prior information could be detected,
F(1,39) = 1.40, p = .244, 𝜂𝑝2
= .04. A significant effect could be shown for the interaction of condition
and time, F(2.276, 1.406) = 6.92, p = .001, 𝜂𝑝2
= .15. All effects are displayed in Table 36. Even if
significant effects occurred, no substantially different accelerator pedal usage could be detected between conditions or groups. This is also reflected in Figure 67 and Figure 68.
Table 36. Results of RMANCOVA regarding accelerator pedal usage (covariate = initial accelerator pedal pressure).
df F p 𝜂𝑝2
Condition (baseline vs. failure) 1 22.841 < .001 .37 Group (info vs. no info) 1 1.401 .244 .04 Time 1.425 20.745 < .001 .35 Round*Group 1 0.056 .814 .00 Time*Group 1.425 0.573 .511 .01 Round*Time 2.276 6.916 .001 .15 Round*Time*Group 2.276 0.462 .656 .01
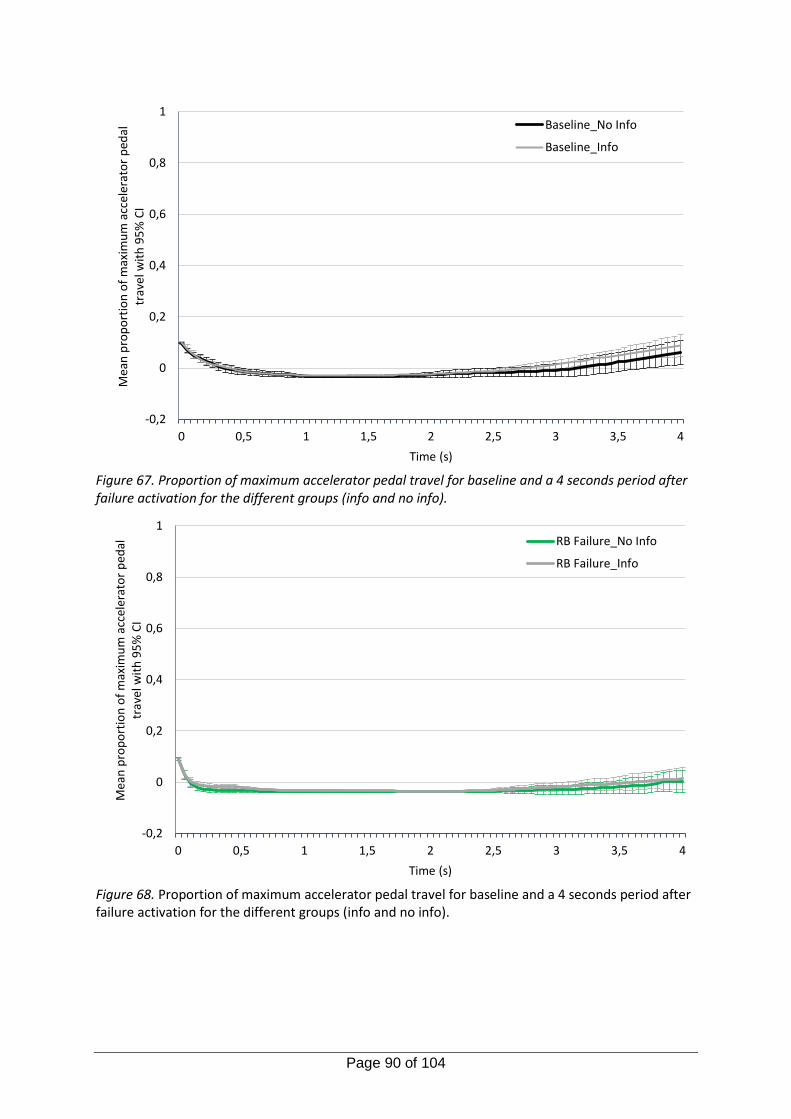
Page 90 of 104
Figure 67. Proportion of maximum accelerator pedal travel for baseline and a 4 seconds period after failure activation for the different groups (info and no info).
Figure 68. Proportion of maximum accelerator pedal travel for baseline and a 4 seconds period after failure activation for the different groups (info and no info).
-0,2
0
0,2
0,4
0,6
0,8
1
0 0,5 1 1,5 2 2,5 3 3,5 4
Mea
n p
rop
ort
ion
of
max
imu
m a
ccel
erat
or
ped
al
trav
el w
ith
95
% C
I
Time (s)
Baseline_No Info
Baseline_Info
-0,2
0
0,2
0,4
0,6
0,8
1
0 0,5 1 1,5 2 2,5 3 3,5 4
Mea
n p
rop
ort
ion
of
max
imu
m a
ccel
erat
or
ped
al
trav
el w
ith
95
% C
I
Time (s)
RB Failure_No Info
RB Failure_Info
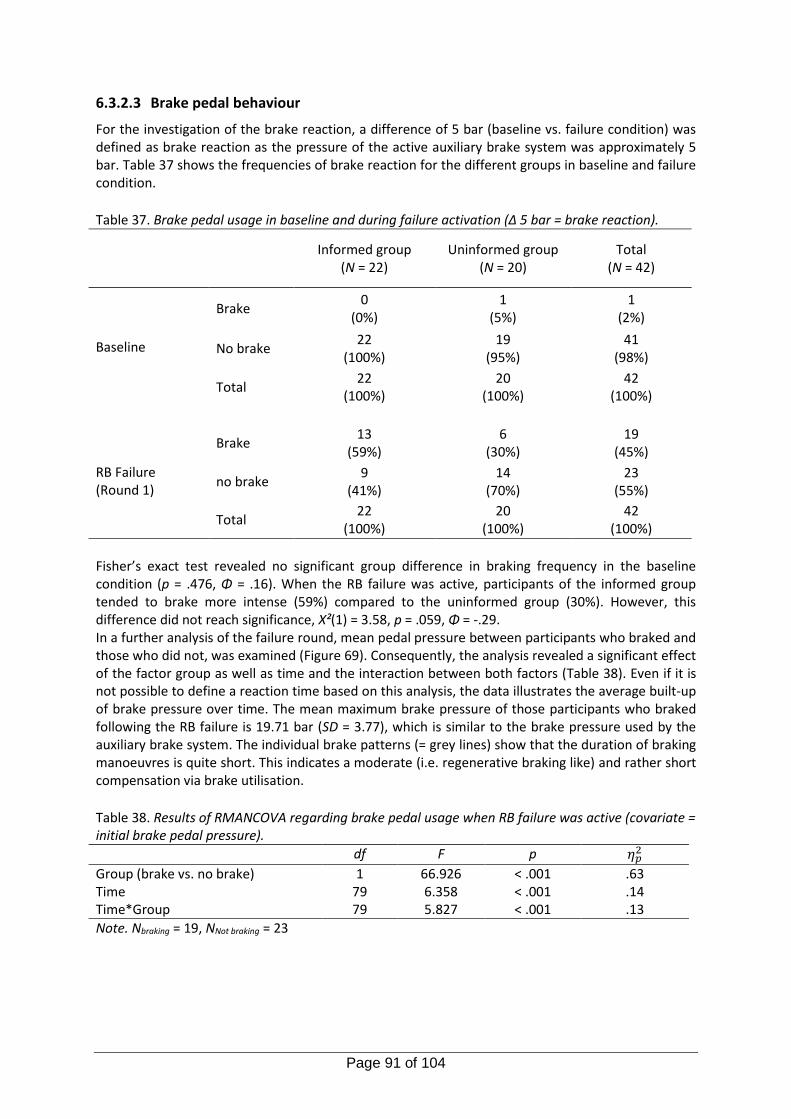
Page 91 of 104
6.3.2.3 Brake pedal behaviour
For the investigation of the brake reaction, a difference of 5 bar (baseline vs. failure condition) was defined as brake reaction as the pressure of the active auxiliary brake system was approximately 5 bar. Table 37 shows the frequencies of brake reaction for the different groups in baseline and failure condition.
Table 37. Brake pedal usage in baseline and during failure activation (Δ 5 bar = brake reaction).
Informed group
(N = 22) Uninformed group
(N = 20) Total
(N = 42)
Baseline
Brake 0
(0%) 1
(5%) 1
(2%)
No brake 22
(100%) 19
(95%) 41
(98%)
Total 22
(100%) 20
(100%) 42
(100%)
RB Failure (Round 1)
Brake 13
(59%) 6
(30%) 19
(45%)
no brake 9
(41%) 14
(70%) 23
(55%)
Total 22
(100%) 20
(100%) 42
(100%)
Fisher’s exact test revealed no significant group difference in braking frequency in the baseline condition (p = .476, Φ = .16). When the RB failure was active, participants of the informed group tended to brake more intense (59%) compared to the uninformed group (30%). However, this difference did not reach significance, Χ²(1) = 3.58, p = .059, Φ = -.29. In a further analysis of the failure round, mean pedal pressure between participants who braked and those who did not, was examined (Figure 69). Consequently, the analysis revealed a significant effect of the factor group as well as time and the interaction between both factors (Table 38). Even if it is not possible to define a reaction time based on this analysis, the data illustrates the average built-up of brake pressure over time. The mean maximum brake pressure of those participants who braked following the RB failure is 19.71 bar (SD = 3.77), which is similar to the brake pressure used by the auxiliary brake system. The individual brake patterns (= grey lines) show that the duration of braking manoeuvres is quite short. This indicates a moderate (i.e. regenerative braking like) and rather short compensation via brake utilisation.
Table 38. Results of RMANCOVA regarding brake pedal usage when RB failure was active (covariate = initial brake pedal pressure).
df F p 𝜂𝑝2
Group (brake vs. no brake) 1 66.926 < .001 .63 Time 79 6.358 < .001 .14 Time*Group 79 5.827 < .001 .13
Note. Nbraking = 19, NNot braking = 23
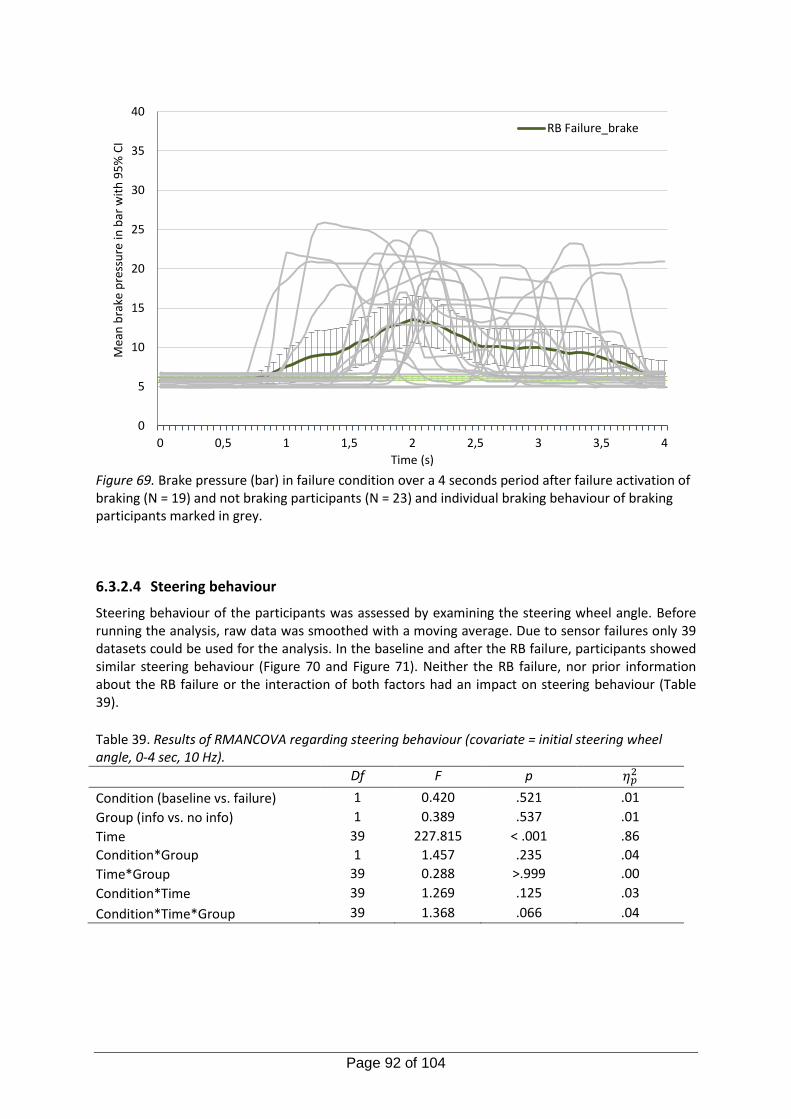
Page 92 of 104
Figure 69. Brake pressure (bar) in failure condition over a 4 seconds period after failure activation of braking (N = 19) and not braking participants (N = 23) and individual braking behaviour of braking participants marked in grey.
6.3.2.4 Steering behaviour
Steering behaviour of the participants was assessed by examining the steering wheel angle. Before running the analysis, raw data was smoothed with a moving average. Due to sensor failures only 39 datasets could be used for the analysis. In the baseline and after the RB failure, participants showed similar steering behaviour (Figure 70 and Figure 71). Neither the RB failure, nor prior information about the RB failure or the interaction of both factors had an impact on steering behaviour (Table 39).
Table 39. Results of RMANCOVA regarding steering behaviour (covariate = initial steering wheel angle, 0-4 sec, 10 Hz).
Df F p 𝜂𝑝2
Condition (baseline vs. failure) 1 0.420 .521 .01
Group (info vs. no info) 1 0.389 .537 .01
Time 39 227.815 < .001 .86
Condition*Group 1 1.457 .235 .04
Time*Group 39 0.288 >.999 .00
Condition*Time 39 1.269 .125 .03
Condition*Time*Group 39 1.368 .066 .04
0
5
10
15
20
25
30
35
40
0 0,5 1 1,5 2 2,5 3 3,5 4
Mea
n b
rake
pre
ssu
re in
bar
wit
h 9
5%
CI
Time (s)
RB Failure_brake
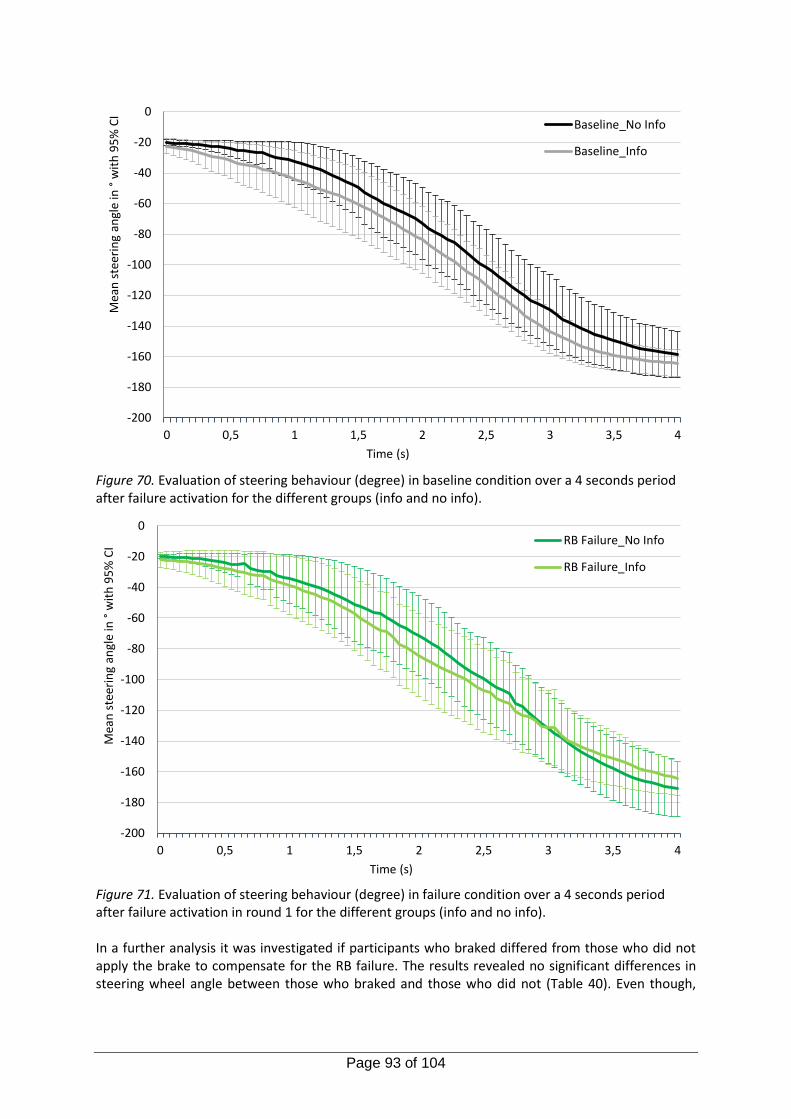
Page 93 of 104
Figure 70. Evaluation of steering behaviour (degree) in baseline condition over a 4 seconds period after failure activation for the different groups (info and no info).
Figure 71. Evaluation of steering behaviour (degree) in failure condition over a 4 seconds period after failure activation in round 1 for the different groups (info and no info). In a further analysis it was investigated if participants who braked differed from those who did not apply the brake to compensate for the RB failure. The results revealed no significant differences in steering wheel angle between those who braked and those who did not (Table 40). Even though,
-200
-180
-160
-140
-120
-100
-80
-60
-40
-20
0
0 0,5 1 1,5 2 2,5 3 3,5 4
Mea
n s
teer
ing
angl
e in
°w
ith
95
% C
I
Time (s)
Baseline_No Info
Baseline_Info
-200
-180
-160
-140
-120
-100
-80
-60
-40
-20
0
0 0,5 1 1,5 2 2,5 3 3,5 4
Mea
n s
teer
ing
angl
e in
°w
ith
95
% C
I
Time (s)
RB Failure_No Info
RB Failure_Info
Page 94 of 104
Figure 72 shows more steering among those participants who did not brake, this difference is not significant.
Table 40. Results of RMANCOVA regarding steering behaviour (braking vs. no braking participants, covariate = initial steering wheel angle, 0-4 sec).
Df F p 𝜂𝑝2
Group (braking vs. no braking) 1 2.269 .141 .06 Time 79 180.682 < .001 .83 Time*Group 79 0.477 >.999 .01
Note. Nbraking = 18, NNo braking = 21
Figure 72. Evaluation of steering behaviour (degree) in failure condition in round 1 for braking and not braking participants.
6.3.2.5 Lateral acceleration
Additionally, lateral acceleration was examined. Results indicate no significant effects due to condition (baseline vs. failure), group (information vs. no information) or the interaction of both factors (condition and group). The outcome of the mixed RMANCOVA is presented in Table 41, lateral acceleration in both rounds is displayed in Figure 73 and Figure 74.
-200
-180
-160
-140
-120
-100
-80
-60
-40
-20
0
0 0,5 1 1,5 2 2,5 3 3,5 4
Mea
n s
teer
ing
angl
e in
°w
ith
95
% C
I
Time (s)
RB Failure_Brake
RB Failure_No Brake
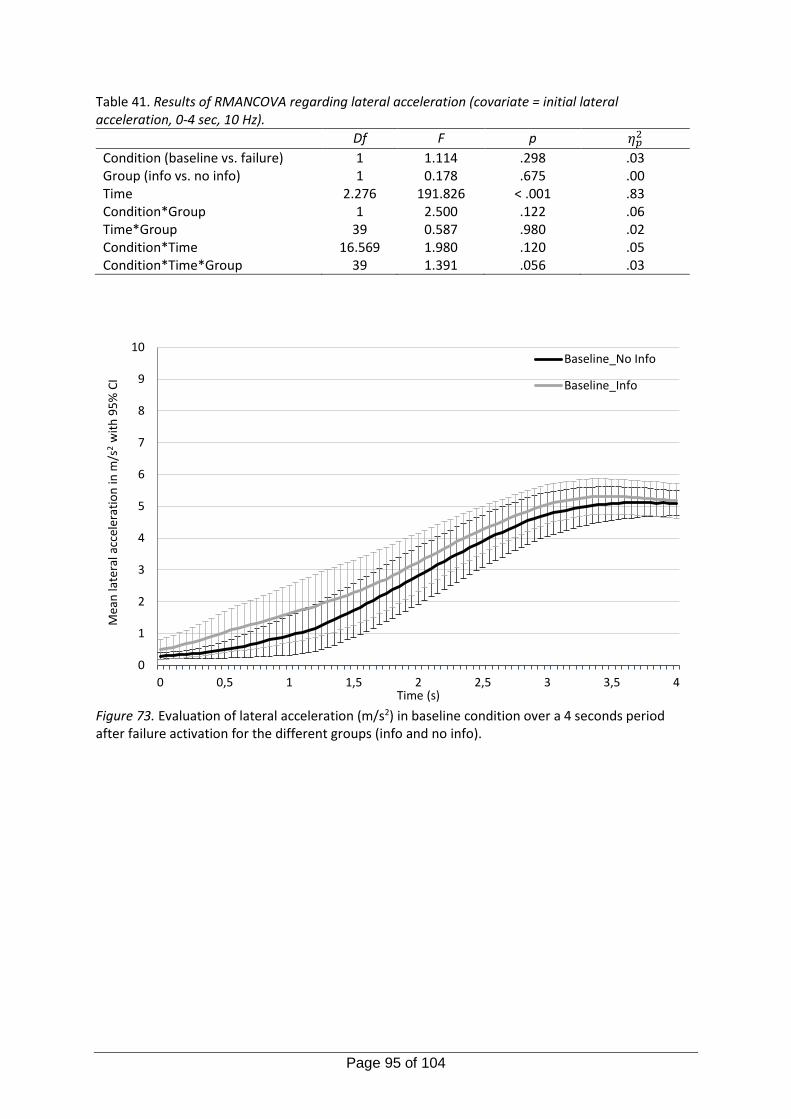
Page 95 of 104
Table 41. Results of RMANCOVA regarding lateral acceleration (covariate = initial lateral acceleration, 0-4 sec, 10 Hz).
Df F p 𝜂𝑝2
Condition (baseline vs. failure) 1 1.114 .298 .03 Group (info vs. no info) 1 0.178 .675 .00 Time 2.276 191.826 < .001 .83 Condition*Group 1 2.500 .122 .06 Time*Group 39 0.587 .980 .02 Condition*Time 16.569 1.980 .120 .05 Condition*Time*Group 39 1.391 .056 .03
Figure 73. Evaluation of lateral acceleration (m/s2) in baseline condition over a 4 seconds period after failure activation for the different groups (info and no info).
0
1
2
3
4
5
6
7
8
9
10
0 0,5 1 1,5 2 2,5 3 3,5 4
Mea
n la
tera
l acc
eler
atio
n in
m/s
2w
ith
95
% C
I
Time (s)
Baseline_No Info
Baseline_Info
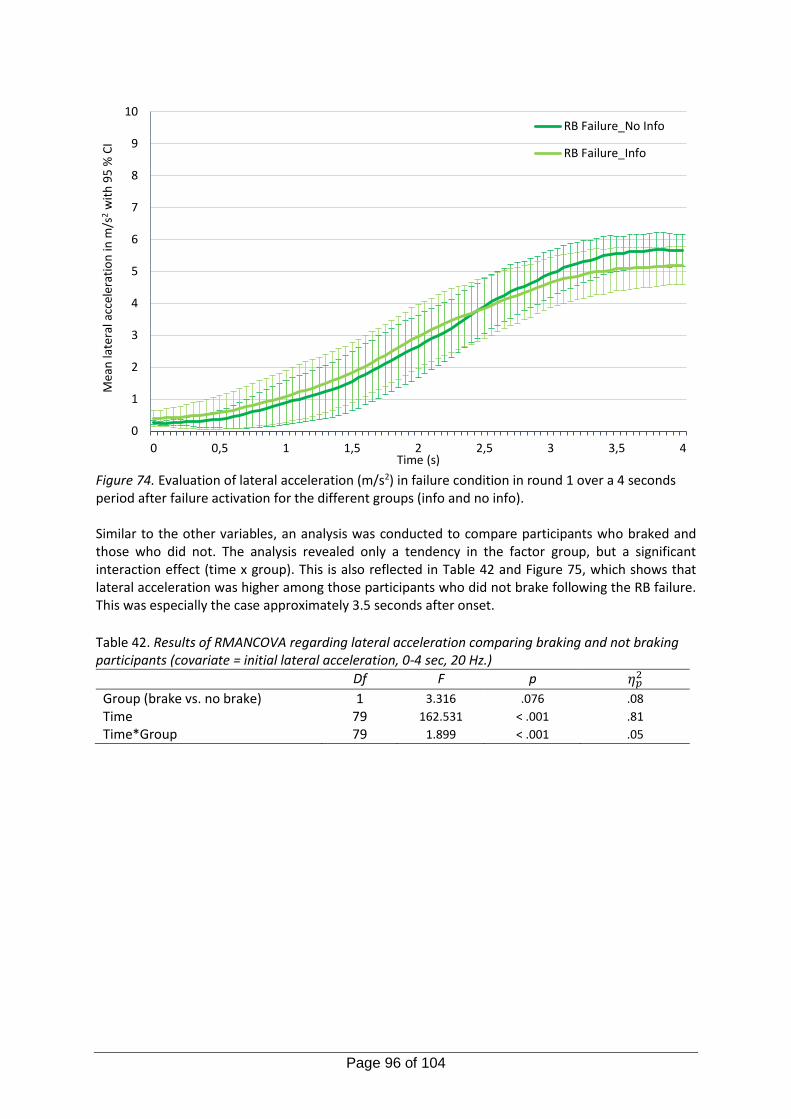
Page 96 of 104
Figure 74. Evaluation of lateral acceleration (m/s2) in failure condition in round 1 over a 4 seconds period after failure activation for the different groups (info and no info). Similar to the other variables, an analysis was conducted to compare participants who braked and those who did not. The analysis revealed only a tendency in the factor group, but a significant interaction effect (time x group). This is also reflected in Table 42 and Figure 75, which shows that lateral acceleration was higher among those participants who did not brake following the RB failure. This was especially the case approximately 3.5 seconds after onset.
Table 42. Results of RMANCOVA regarding lateral acceleration comparing braking and not braking participants (covariate = initial lateral acceleration, 0-4 sec, 20 Hz.)
Df F p 𝜂𝑝2
Group (brake vs. no brake) 1 3.316 .076 .08
Time 79 162.531 < .001 .81
Time*Group 79 1.899 < .001 .05
0
1
2
3
4
5
6
7
8
9
10
0 0,5 1 1,5 2 2,5 3 3,5 4
Mea
n la
tera
l acc
eler
atio
n in
m/s
2w
ith
95
% C
I
Time (s)
RB Failure_No Info
RB Failure_Info
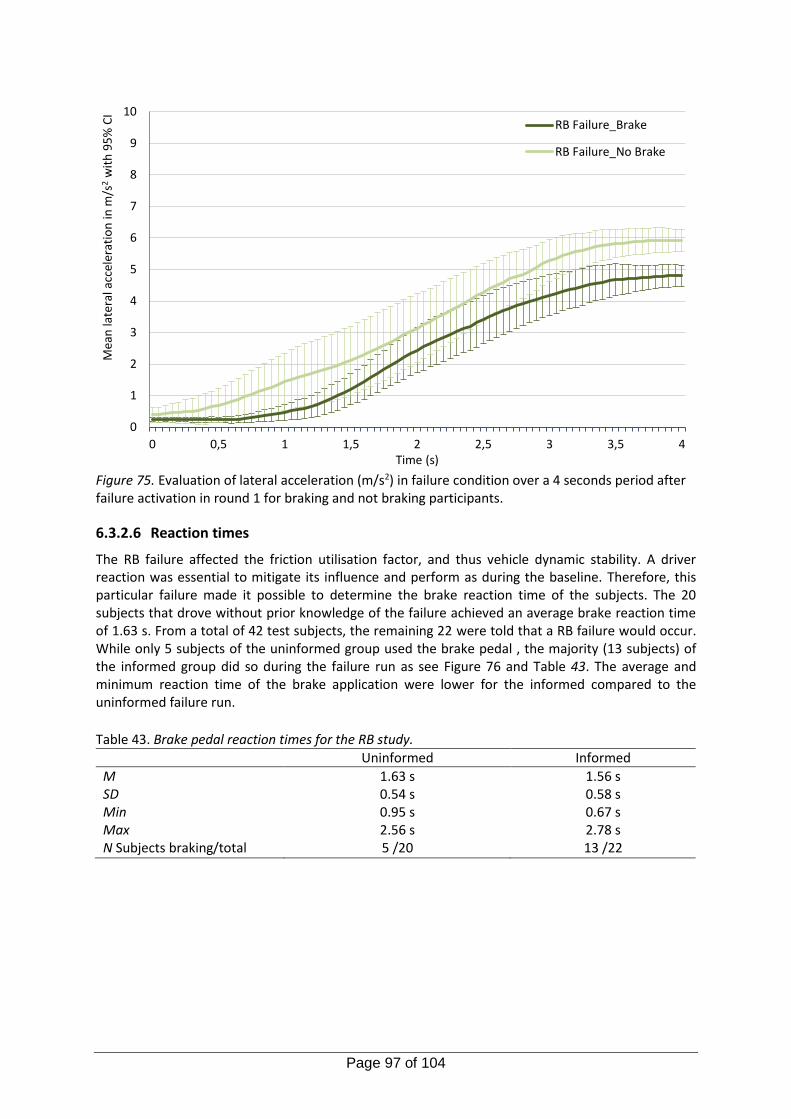
Page 97 of 104
Figure 75. Evaluation of lateral acceleration (m/s2) in failure condition over a 4 seconds period after failure activation in round 1 for braking and not braking participants.
6.3.2.6 Reaction times
The RB failure affected the friction utilisation factor, and thus vehicle dynamic stability. A driver reaction was essential to mitigate its influence and perform as during the baseline. Therefore, this particular failure made it possible to determine the brake reaction time of the subjects. The 20 subjects that drove without prior knowledge of the failure achieved an average brake reaction time of 1.63 s. From a total of 42 test subjects, the remaining 22 were told that a RB failure would occur. While only 5 subjects of the uninformed group used the brake pedal , the majority (13 subjects) of the informed group did so during the failure run as see Figure 76 and Table 43. The average and minimum reaction time of the brake application were lower for the informed compared to the uninformed failure run.
Table 43. Brake pedal reaction times for the RB study.
Uninformed Informed
M 1.63 s 1.56 s SD 0.54 s 0.58 s Min 0.95 s 0.67 s Max 2.56 s 2.78 s N Subjects braking/total 5 /20 13 /22
0
1
2
3
4
5
6
7
8
9
10
0 0,5 1 1,5 2 2,5 3 3,5 4
Mea
n la
tera
l acc
eler
atio
n in
m/s
2w
ith
95
% C
I
Time (s)
RB Failure_Brake
RB Failure_No Brake
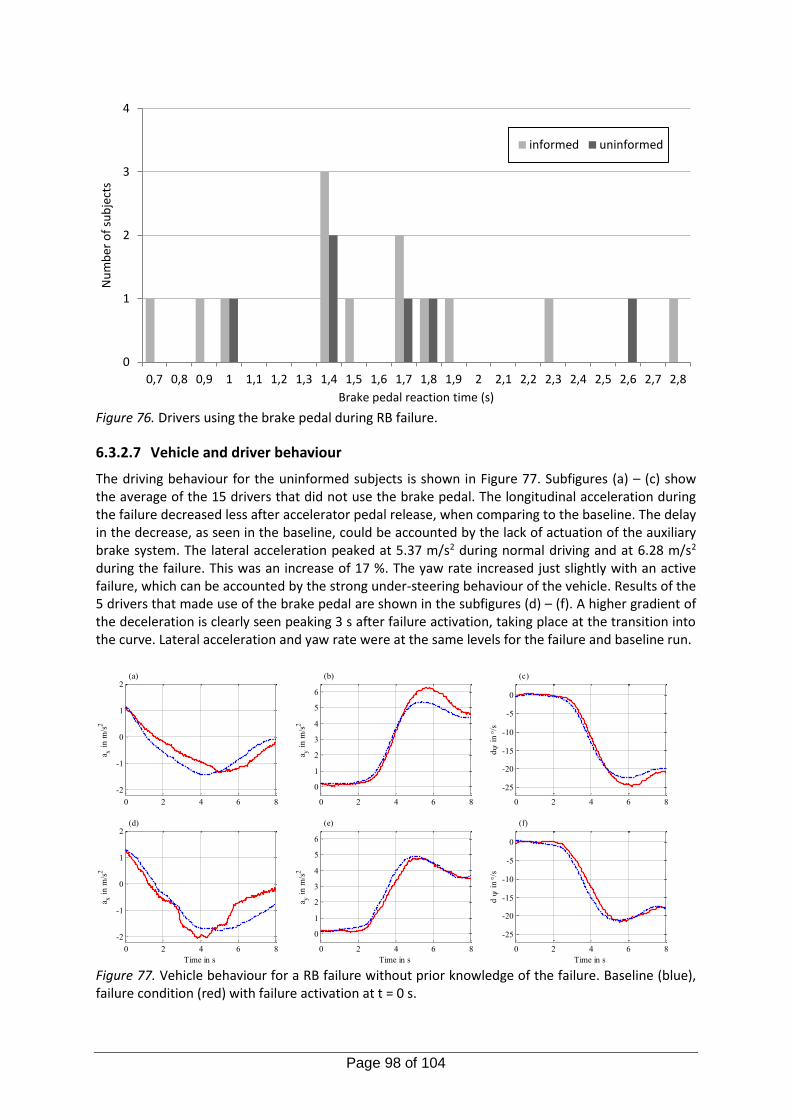
Page 98 of 104
Figure 76. Drivers using the brake pedal during RB failure.
6.3.2.7 Vehicle and driver behaviour
The driving behaviour for the uninformed subjects is shown in Figure 77. Subfigures (a) – (c) show the average of the 15 drivers that did not use the brake pedal. The longitudinal acceleration during the failure decreased less after accelerator pedal release, when comparing to the baseline. The delay in the decrease, as seen in the baseline, could be accounted by the lack of actuation of the auxiliary brake system. The lateral acceleration peaked at 5.37 m/s2 during normal driving and at 6.28 m/s2 during the failure. This was an increase of 17 %. The yaw rate increased just slightly with an active failure, which can be accounted by the strong under-steering behaviour of the vehicle. Results of the 5 drivers that made use of the brake pedal are shown in the subfigures (d) – (f). A higher gradient of the deceleration is clearly seen peaking 3 s after failure activation, taking place at the transition into the curve. Lateral acceleration and yaw rate were at the same levels for the failure and baseline run.
Figure 77. Vehicle behaviour for a RB failure without prior knowledge of the failure. Baseline (blue), failure condition (red) with failure activation at t = 0 s.
0
1
2
3
4
0,7 0,8 0,9 1 1,1 1,2 1,3 1,4 1,5 1,6 1,7 1,8 1,9 2 2,1 2,2 2,3 2,4 2,5 2,6 2,7 2,8
Nu
mb
er o
f su
bje
cts
Brake pedal reaction time (s)
informed uninformed
0 2 4 6 8
-2
-1
0
1
2
a x i
n m
/s2
(a)
0 2 4 6 8
0
1
2
3
4
5
6
a y i
n m
/s2
(b)
0 2 4 6 8
-25
-20
-15
-10
-5
0
d
in
/s
(c)
0 2 4 6 8
-2
-1
0
1
2
Time in s
a x i
n m
/s2
(d)
0 2 4 6 8
0
1
2
3
4
5
6
Time in s
a y i
n m
/s2
(e)
0 2 4 6 8
-25
-20
-15
-10
-5
0
Time in s
d
in
/s
(f)
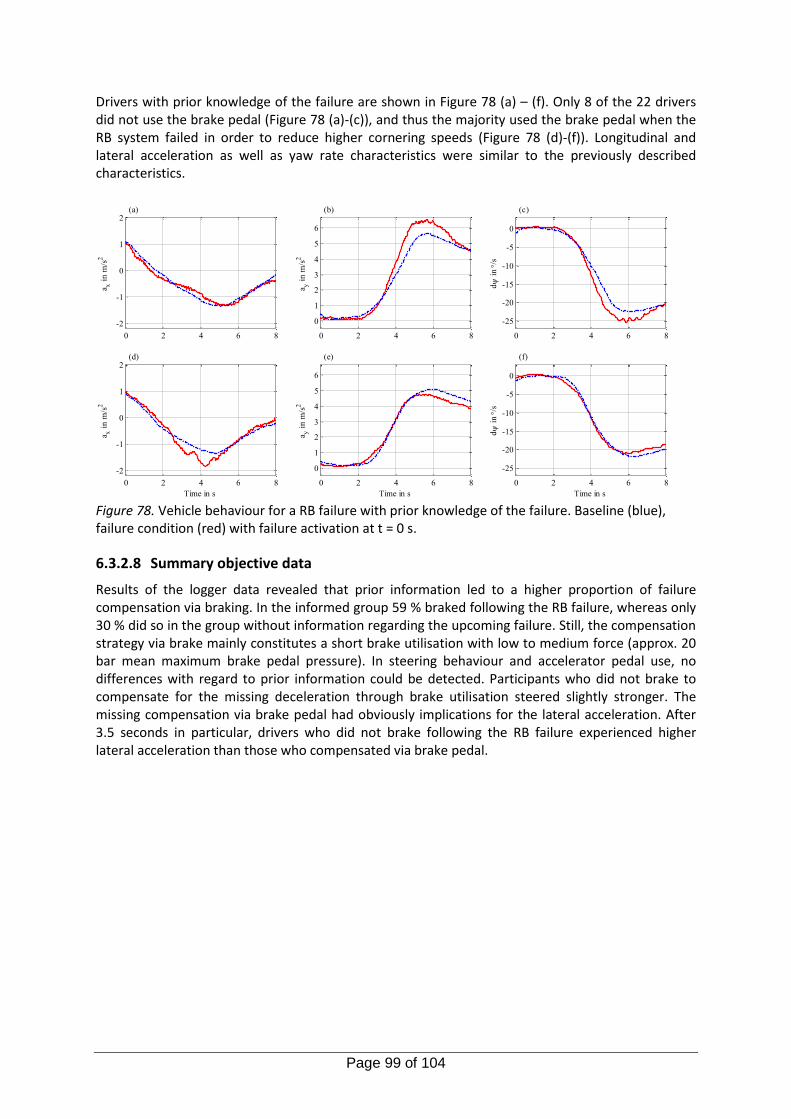
Page 99 of 104
Drivers with prior knowledge of the failure are shown in Figure 78 (a) – (f). Only 8 of the 22 drivers did not use the brake pedal (Figure 78 (a)-(c)), and thus the majority used the brake pedal when the RB system failed in order to reduce higher cornering speeds (Figure 78 (d)-(f)). Longitudinal and lateral acceleration as well as yaw rate characteristics were similar to the previously described characteristics.
Figure 78. Vehicle behaviour for a RB failure with prior knowledge of the failure. Baseline (blue), failure condition (red) with failure activation at t = 0 s.
6.3.2.8 Summary objective data
Results of the logger data revealed that prior information led to a higher proportion of failure compensation via braking. In the informed group 59 % braked following the RB failure, whereas only 30 % did so in the group without information regarding the upcoming failure. Still, the compensation strategy via brake mainly constitutes a short brake utilisation with low to medium force (approx. 20 bar mean maximum brake pedal pressure). In steering behaviour and accelerator pedal use, no differences with regard to prior information could be detected. Participants who did not brake to compensate for the missing deceleration through brake utilisation steered slightly stronger. The missing compensation via brake pedal had obviously implications for the lateral acceleration. After 3.5 seconds in particular, drivers who did not brake following the RB failure experienced higher lateral acceleration than those who compensated via brake pedal.
0 2 4 6 8
-2
-1
0
1
2
a x i
n m
/s2
(a)
0 2 4 6 8
0
1
2
3
4
5
6
a y i
n m
/s2
(b)
0 2 4 6 8
-25
-20
-15
-10
-5
0
d
in
/s
(c)
0 2 4 6 8
-2
-1
0
1
2
Time in s
a x i
n m
/s2
(d)
0 2 4 6 8
0
1
2
3
4
5
6
Time in s
a y i
n m
/s2
(e)
0 2 4 6 8
-25
-20
-15
-10
-5
0
Time in sd
in
/s
(f)
Page 100 of 104
6.4 Conclusion and discussion
The aim of the present study on RB failures was to examine how drivers react towards a RB failure and how they perceived it. The findings show that only half of the participants without prior information realised that the deceleration due to the RB function was missing. All drivers associated higher risks with the failure condition. Still, the RB failure induced no increased stress level or workload among the participants. Drivers with and without prior information felt in control even when the RB failure was active. The findings from the subjective data imply that the RB failure was not easily perceivable, but drivers felt they could handle the situation well. One possible explanation for the higher perceived risk without increased stress or workload could be that drivers evaluate the situation against the background of driving in real traffic. Therefore, it is reasonable that a situation could be perceived as risky in real traffic, but is evaluated as not stressful under the conditions of the experiment. Results of the objective data also suggest that drivers remained in control of the vehicle. Prior information about the upcoming failure had an impact on braking behaviour. More drivers (59 %) stepped on the brake when they received information that a failure was going to occur in comparison to drivers that were not informed (30 % braked). Thus, critical situations can effectively be reduced by informing the driver about these kinds of failures. Still, these braking manoeuvres were mainly short and of moderate intensity; no full braking occurred. Participants who did not brake following the RB failure were also able of keeping to the lane and appeared to have experienced higher lateral acceleration values. This study showed that a substantially higher lateral acceleration is achieved, if the regenerative brake system would fail prior and in a cornering manoeuvre. Applying the brake pedal reduces the lateral acceleration from 6.3 m/s2 to 4.8 m/s2, and thus the lower lateral acceleration leads to less risk for critical situations. In comparison, lateral accelerations up to 4 m /s² are considered to be comfortable for car drivers. The reported findings show that drivers could handle a RB failure as it was tested in the study. Nevertheless, one could argue that different situations or road conditions might have more severe effects on the drivers. Participants in the current study completed a familiarisation drive of approximately 25 minutes to get accustomed to the RB, twice. Nevertheless, in-depth adaptation to RB is believed to be higher after driving a longer time or distance. Hence, ratings of risk, danger and control might be increased. When approaching a traffic light or a braking vehicle ahead a failure of the RB system might have detrimental consequences. Moreover, when driving under suboptimal road conditions, like wet or icy roads, the impact of a RB failure could be much more severe. An increase in lateral acceleration, as observed in the RB study, would have a higher impact on the car and could lead to a loss of control when driving on non-ideal road conditions (low or mixed friction values). Such scenarios need to be addressed in future studies. Furthermore, it would be interesting to investigate the effects of different levels of implemented RB decelerations.
Page 101 of 104
7. FINAL DISCUSSION
The objective of the research undertaken within the EVERSAFE project, was to investigate failure modes in electric vehicles (EVs) - namely wheel hub motor (WHM) failures and regenerative braking (RB) failures - and their impact on the driver and the vehicle dynamics. This was performed with the help of one simulator and two field studies. Results of the WHM studies always refer to the situation of first failure occurrence. Three different WHM failures were tested (straight inward, curve inward, curve outward). It can be concluded from the outcomes of the simulator study, that WHM failures at speeds of 110 km/h are rated more stressful, risky, disturbing and demanding than simply driving without a failure. Combining the outcomes of the subjective evaluations, the curve inward failures are rated the most severe. The study showed that steering is the principal reaction to all types of failures. The usage of the brake pedal was neglected, which might be due to the deceleration caused by the failure itself. Generally speaking, results of both studies showed that humans can compensate WHM failures well. In contrast to the simulator study, which was implemented at higher vehicle speeds, no significant differences between baseline and failure condition were found for curve failures regarding subjective evaluation for the field study. Only for the straight inward failure, subjects perceived the driving situation significantly more demanding, stressful, risky and less controllable than in the baseline condition. Comparing the subjective evaluations from the simulator and the field study, it can be assumed that failures are perceived as more severe at higher speeds compared to lower ones. Furthermore, subjective evaluation of the different failure types was more differentiated at higher speeds. Regarding the results of analysis performed on the objective data collected during the field study, it appeared that in contrast to the simulator study, participants did not steer due to straight inward and curve outward failure in the field study. There was only a steering reaction detected for the curve inward failure, which leads to the assumption that this was the most severe failure in field and simulator study – at least while only considering the objective data. The steering wheel reaction times of both studies are in the same range between 0.53 s and 0.62 s. As participants in both studies used the accelerator pedal during failure activation, regardless of failure type, it could be concluded that drivers try to overrule the failure triggered deceleration at low and high speeds. Whether this was an effect of the instruction to maintain a steady speed should be clarified by further research. The accelerator pedal reaction time has further a shorter reaction time in the field study. This could be caused by the higher workload during fast driving manoeuvres on motorways, but also by the differences of simulator and test track experiment. In the driving simulator, longitudinal accelerations are not experienced to the same extent as in a real vehicle. Concerning the RB failure field test, results reveal that only half of the subjects noticed the failure, but compensation efforts were manageable, meaning that no incident or accidents occurred. Although the situation was rated as more risky than solely driving on a road, the RB failure did not induce more stress or workload in the drivers. Informing people about an upcoming failure yielded in a higher frequency of mild braking manoeuvres. Road and traffic conditions can influence the perception of this failure and highly influence the behaviour of the vehicle. This will most likely influence the driver’s perception of the situation and have consequences on the regulatory actions.
7.1 Future research
Based on the results of all studies summarised above some potential for further research could be identified. In both WHM failure studies, drivers were instructed to maintain a certain speed. As mentioned earlier, it would be interesting to see whether drivers also try to overrule the WHM failure by pressing the accelerator pedal, when not asked to follow a certain speed profile. As in the current studies all WHM tests were implemented without any compensatory systems, the interaction effects
Page 102 of 104
of WHM failures with active safety systems, like electronic stability control, could be examined in future studies. With regard to the RB failure, the investigated RB level was relatively soft in comparison to other EV models. As it could be assumed that with increased level of deceleration through RB, the severity of failure consequences can also increase. Different levels of RB deceleration and the respective consequences of potential failures should be investigated in further studies. Regardless of failure type (RB and WHM), all current studies tested the failures with a relatively low level of driver workload. For instance, there was no oncoming traffic or vehicles driving in front during failure activation and participants drove under good and comfortable road conditions (e.g., large road width, no traffic during failure activation, good weather conditions) without any secondary tasks for the drivers (e.g., talking to a passenger). As the driver reaction and assessment might worsen with higher workload levels, further research should investigate the influence of different workload levels on the consequences of a failure. Furthermore, different traffic conditions are not only relevant in terms of the driver’s workload, but also raise the question regarding consequences of failures for following traffic. For instance, the driver reactions and vehicle dynamics as well as time to collision while driving behind an EV that suddenly decelerates due to failing WHM(s), are highly relevant for traffic safety and are therefore considered interesting to be investigated in further research. Additionally, there is more research needed regarding the tested failures in different driving manoeuvres. Finally, important human factors research question arises when thinking of informing the driver about the failure. Further studies should investigate whether or not a driver should be warned and in what way.
Page 103 of 104
7.2 References
Beggiato, M., & Krems, J. F. (2013). The evolution of mental model, trust and acceptance of adaptive cruise control in relation to initial information. Transportation research part F: traffic psychology and behaviour, 18, 47-57.
Borchardt, N., Kasper, R. and Heinemann, R. (2012). Design of a Wheel-hub Motor with Air Gap Winding and Simultaneous Utilization of all Magnetic Poles. Electric Vehicle Conference (IEVC), 2012 IEEE International. IEEE.
Clarke, P., Muneer, T., & Cullinane, K. (2010). Cutting vehicle emissions with regenerative braking. Transportation Research Part D(15), 160-167.
Cocron, P., Bühler, F., Franke, T., Neumann, I., Dielmann, B., & Krems, J. F. (2013). Energy recapture through deceleration – regenerative braking in electric vehicles from a user perspective. Ergonomics 56(8), 1203-1215.
Cocron, P., Bühler, F., Neumann, I., Franke, T., Krems, J. F., Schwalm, M., & Keinath, A. (2011). Methods of evaluating electric vehicles from a user's perspective - the MINI E field trial in Berlin. IET Intelligent Transport Systems, 5(2), 127-133.
Cohen, J. (1992). A power primer. Psychological bulletin, 112(1), 155-159. Dijksterhuis, C., Brookhuis, A. K., & De Waard, D. (2011). Effects of steering demand on lane keeping
behaviour, self-reports and physiology. A simulator study. Accident Analysis & Prevention, 43(3), 1074-1081.
Euchler, M., Bonitz, T., Mitte, D., & Geyer, M. (2010). Bewertung der Fahrsicherheit eines Elektrofahrzeugs bei stationärer Kreisfahrt [Assessment of driving safety of an electric vehicle in steady-state cornering]. ATZ Automobiltechnische Zeitschrift 2010(3), 207.
Green, M. (2000) How Long Does It Take to Stop? Methodological Analysis of Driver Perception-Brake Times, Transportation Human Factors, 2(3), 195-216.
Hart, S. G., & Staveland, L. (1988). Development of a multidimensional workload scale: Results of emiprical and theoretical research. In I. P. Hancock, & N. Meshkati (Eds), Human mental workload (pp. 139-183). Amsterdam: North Holland.
Jian, J. Y., Bisantz, A. M., & Drury, C. G. (2000). Foundations for an empirically determined scale of trust in automated systems. International Journal of Cognitive Ergonomics, 4(1), 53-71.
Jonasson, M., & Wallmark, O. (2008). Control of electric vehicles with autonomous corner modules: implementation aspects and fault handling. Vehicle Systems Modelling and Testing 3(1), 213-228.
Jonasson, M., & Wallmark, O. (2007). Vehicles with autonomous corner modules - control an fault handling aspects. Proceedings Program Review Meeting - MIT Industry Consortium on Advanced Automotive Electrical/Electronic Components and Systems. Seattle, USA.
Häring, I., & Kanat, B. (2013). Risk management approach (Deliverable No. 4.1. within the EVERSAFE project). Freiburg: Fraunhofer EMI institute.
Kreußlein, M. (2013). Failures in electric vehicles and their impact on the driver. Master thesis. Deutschland, Chemnitz: Technische Universität Chemnitz.
LimeSurvey Project Team (2012). LimeSurvey: An Open Source survey tool /LimeSurvey Project [computer software]. Hamburg, Germany. Retrieved from http://www.limesurvey.org
Neukum, A. ,& Krüger, H. P. (2003). Fahrerreaktionen bei Lenksystemstörungen- Untersuchungsmethoden und Bewertungskriterien.VDI- Berichte 1791, (S. 297-318).
Neukum, A., Ufer, E., Paulig, J., & Krüger, H. (2008). Controllability of superposition steering system failures. Steering.tech. Munich, Garching.
Ranney, T., Heydinger, G., Salaani, K., Mazzae, E. N., & Grygier, P. (2003). Investigation of Driver Reactions to Tread Separation Scenarios in the National Advanced Driving Simulator (NADS). National Highway Traffic Safety Administration.
Schmitz, M., Maag, C., Jagiellowicz, M., & Hanig, M. (2013). Impact of a combined accelerator–brake pedal solution on efficient driving. IET Intelligent Transport Systems, 7(2), 203-209.
Page 104 of 104
Sedlmeier, P. & Renkewitz, F. (2013). Ein Lehrbuch für Forschungsmethoden und Statistik. München: Pearson.
Van Der Laan, J. D., Heino, A., & De Waard, D. (1997). A simple procedure for the assessment of acceptance of advanced transport telematics. Transportation Research Part C: Emerging Technologies, 5(1), 1-10.
Wanner, D. (2013). Faults and their influence on the dynamic behaviour of electric vehicles. Licentiate Thesis. Sweden, Stockholm: KTH Royal Institute of Technology.
Wanner, D., Drugge, L., & Stensson Trigell, A. (2014). Fault classification method for the driving safety of electrified vehicles. In Vehicle System Dynamics 52(5), 704-732.
Wesp, A. (2011). Analyse fahrerwirksamer Systemauslegungen und -störungen eines Fahrzeugs mit Hinterradlenkung bei gleichzeitiger Fahrerbeanspruchung durch eine Fahraufgabe. [Analysis of driver relevant system designs and failures of a vehicle with rear-wheel steering while the driver performs a driving task]. Ph.D. Thesis, Darmstadt University. Darmstadt, Germany.
Wierwille, W. W., Casali, J. G., & Repa, B. S. (1983). Driver Steering Reaction Time to Abrupt-Onset Crosswinds, as Measured In a Moving-Base Driving Simulator. Human Factors: The Journal of the Human Factors and Ergonomics Society 25(1), 103-116.
Wiese, E. E., & Lee, J. D. (2004). Auditory alerts for in-vehicle information systems: The effects of temporal conflict and sound parameters on driver attitudes and performance. Ergonomics, 47(9), 965-986.
Witzlack, C., Cocron, P. & Krems, J. F. (2014, Jul 19-23 ). Pushing the limits? Regenerative braking in takeover situations. Proceedings of the 5th International Conference on Applied Human Factors and Ergonomics. (T. Ahram, W. Karwowski, & T. Marek, Eds.). Krakow, Poland.