druid: a real-time analytical data storestatic.druid.io/docs/druid.pdf · druid a real-time...
TRANSCRIPT

Druid
A Real-time Analytical Data Store
Fangjin YangMetamarkets Group, Inc.
Eric [email protected]
Xavier LéautéMetamarkets Group, Inc.
[email protected] Merlino
Metamarkets Group, [email protected]
Deep GanguliMetamarkets Group, Inc.
ABSTRACTDruid is an open source1 data store designed for real-time exploratory
analytics on large data sets. The system combines a column-oriented
storage layout, a distributed, shared-nothing architecture, and an
advanced indexing structure to allow for the arbitrary exploration
of billion-row tables with sub-second latencies. In this paper, we
describe Druid’s architecture, and detail how it supports fast aggre-
gations, flexible filters, and low latency data ingestion.
Categories and Subject DescriptorsH.2.4 [Database Management]: Systems—Distributed databases
Keywordsdistributed; real-time; fault-tolerant; highly available; open source;
analytics; column-oriented; OLAP
1. INTRODUCTIONIn recent years, the proliferation of internet technology has cre-
ated a surge inmachine-generated events. Individually, these events
contain minimal useful information and are of low value. Given the
time and resources required to extract meaning from large collec-
tions of events, many companies were willing to discard this data in-
stead. Although infrastructure has been built to handle event-based
data (e.g. IBM’s Netezza[37], HP’s Vertica[5], and EMC’s Green-
plum[29]), they are largely sold at high price points and are only
targeted towards those companies who can afford the offering.
A few years ago, Google introduced MapReduce [11] as their
mechanism of leveraging commodity hardware to index the inter-
net and analyze logs. The Hadoop [36] project soon followed and
was largely patterned after the insights that came out of the original
MapReduce paper. Hadoop is currently deployed in many orga-
nizations to store and analyze large amounts of log data. Hadoop
has contributed much to helping companies convert their low-value
1http://druid.io/ https://github.com/metamx/druid
Permission to make digital or hard copies of all or part of this work for personal orclassroom use is granted without fee provided that copies are not made or distributedfor profit or commercial advantage and that copies bear this notice and the full citationon the first page. Copyrights for components of this work owned by others than theauthor(s) must be honored. Abstracting with credit is permitted. To copy otherwise, orrepublish, to post on servers or to redistribute to lists, requires prior specific permissionand/or a fee. Request permissions from [email protected]’14, June 22–27, 2014, Snowbird, UT, USA.Copyright is held by the owner/author(s). Publication rights licensed to ACM.ACM 978-1-4503-2376-5/14/06 ...$15.00.http://dx.doi.org/10.1145/2588555.2595631.
event streams into high-value aggregates for a variety of applica-
tions such as business intelligence and A-B testing.
As with many great systems, Hadoop has opened our eyes to
a new space of problems. Specifically, Hadoop excels at storing
and providing access to large amounts of data, however, it does not
make any performance guarantees around how quickly that data can
be accessed. Furthermore, although Hadoop is a highly available
system, performance degrades under heavy concurrent load. Lastly,
while Hadoop works well for storing data, it is not optimized for in-
gesting data and making that data immediately readable.
Early on in the development of the Metamarkets product, we ran
into each of these issues and came to the realization that Hadoop is
a great back-office, batch processing, and data warehousing sys-
tem. However, as a company that has product-level guarantees
around query performance and data availability in a highly concur-
rent environment (1000+ users), Hadoop wasn’t going to meet our
needs. We explored different solutions in the space, and after trying
both Relational Database Management Systems and NoSQL archi-
tectures, we came to the conclusion that there was nothing in the
open source world that could be fully leveraged for our require-
ments. We ended up creating Druid, an open source, distributed,
column-oriented, real-time analytical data store. In many ways,
Druid shares similarities with other OLAP systems [30, 35, 22], in-
teractive query systems [28], main-memory databases [14], as well
as widely known distributed data stores [7, 12, 23]. The distribution
and query model also borrow ideas from current generation search
infrastructure [25, 3, 4].
This paper describes the architecture of Druid, explores the vari-
ous design decisions made in creating an always-on production sys-
tem that powers a hosted service, and attempts to help inform any-
onewho faces a similar problem about a potential method of solving
it. Druid is deployed in production at several technology compa-
nies2. The structure of the paper is as follows: we first describe
the problem in Section 2. Next, we detail system architecture from
the point of view of how data flows through the system in Section
3. We then discuss how and why data gets converted into a binary
format in Section 4. We briefly describe the query API in Section 5
and present performance results in Section 6. Lastly, we leave off
with our lessons from running Druid in production in Section 7, and
related work in Section 8.
2. PROBLEM DEFINITIONDruid was originally designed to solve problems around ingest-
ing and exploring large quantities of transactional events (log data).
This form of timeseries data is commonly found in OLAP work-
2http://druid.io/druid.html

Timestamp Page Username Gender City Characters Added Characters Removed
2011-01-01T01:00:00Z Justin Bieber Boxer Male San Francisco 1800 25
2011-01-01T01:00:00Z Justin Bieber Reach Male Waterloo 2912 42
2011-01-01T02:00:00Z Ke$ha Helz Male Calgary 1953 17
2011-01-01T02:00:00Z Ke$ha Xeno Male Taiyuan 3194 170
Table 1: Sample Druid data for edits that have occurred on Wikipedia.
flows and the nature of the data tends to be very append heavy. For
example, consider the data shown in Table 1. Table 1 contains data
for edits that have occurred on Wikipedia. Each time a user edits
a page in Wikipedia, an event is generated that contains metadata
about the edit. This metadata is comprised of 3 distinct compo-
nents. First, there is a timestamp column indicating when the edit
was made. Next, there are a set dimension columns indicating var-
ious attributes about the edit such as the page that was edited, the
user who made the edit, and the location of the user. Finally, there
are a set of metric columns that contain values (usually numeric)
that can be aggregated, such as the number of characters added or
removed in an edit.
Our goal is to rapidly compute drill-downs and aggregates over
this data. We want to answer questions like “How many edits were
made on the page Justin Bieber from males in San Francisco?” and
“What is the average number of characters that were added by peo-
ple from Calgary over the span of a month?”. We also want queries
over any arbitrary combination of dimensions to return with sub-
second latencies.
The need for Druid was facilitated by the fact that existing open
source Relational Database Management Systems (RDBMS) and
NoSQL key/value stores were unable to provide a low latency data
ingestion and query platform for interactive applications [40]. In the
early days of Metamarkets, we were focused on building a hosted
dashboard that would allow users to arbitrarily explore and visualize
event streams. The data store powering the dashboard needed to
return queries fast enough that the data visualizations built on top
of it could provide users with an interactive experience.
In addition to the query latency needs, the system had to be multi-
tenant and highly available. The Metamarkets product is used in a
highly concurrent environment. Downtime is costly andmany busi-
nesses cannot afford to wait if a system is unavailable in the face of
software upgrades or network failure. Downtime for startups, who
often lack proper internal operations management, can determine
business success or failure.
Finally, another challenge that Metamarkets faced in its early
days was to allow users and alerting systems to be able to make
business decisions in “real-time”. The time from when an event is
created to when that event is queryable determines how fast inter-
ested parties are able to react to potentially catastrophic situations in
their systems. Popular open source data warehousing systems such
as Hadoop were unable to provide the sub-second data ingestion
latencies we required.
The problems of data exploration, ingestion, and availability span
multiple industries. Since Druid was open sourced in October 2012,
it been deployed as a video, network monitoring, operations mon-
itoring, and online advertising analytics platform at multiple com-
panies.
3. ARCHITECTUREADruid cluster consists of different types of nodes and each node
type is designed to perform a specific set of things. We believe
this design separates concerns and simplifies the complexity of the
overall system. The different node types operate fairly independent
of each other and there is minimal interaction among them. Hence,
intra-cluster communication failures have minimal impact on data
availability.
To solve complex data analysis problems, the different node types
come together to form a fully working system. The name Druid
comes from the Druid class in many role-playing games: it is a
shape-shifter, capable of taking on many different forms to fulfill
various different roles in a group. The composition of and flow of
data in a Druid cluster are shown in Figure 1.
3.1 Real-time NodesReal-time nodes encapsulate the functionality to ingest and query
event streams. Events indexed via these nodes are immediately
available for querying. The nodes are only concerned with events
for some small time range and periodically hand off immutable
batches of events they have collected over this small time range to
other nodes in the Druid cluster that are specialized in dealing with
batches of immutable events. Real-time nodes leverage Zookeeper
[19] for coordination with the rest of the Druid cluster. The nodes
announce their online state and the data they serve in Zookeeper.
Real-time nodes maintain an in-memory index buffer for all in-
coming events. These indexes are incrementally populated as events
are ingested and the indexes are also directly queryable. Druid be-
haves as a row store for queries on events that exist in this JVM
heap-based buffer. To avoid heap overflow problems, real-time
nodes persist their in-memory indexes to disk either periodically
or after some maximum row limit is reached. This persist process
converts data stored in the in-memory buffer to a column oriented
storage format described in Section 4. Each persisted index is im-
mutable and real-time nodes load persisted indexes into off-heap
memory such that they can still be queried. This process is de-
scribed in detail in [33] and is illustrated in Figure 2.
On a periodic basis, each real-time node will schedule a back-
ground task that searches for all locally persisted indexes. The task
merges these indexes together and builds an immutable block of
data that contains all the events that have been ingested by a real-
time node for some span of time. We refer to this block of data as
a “segment”. During the handoff stage, a real-time node uploads
this segment to a permanent backup storage, typically a distributed
file system such as S3 [12] or HDFS [36], which Druid refers to as
“deep storage”. The ingest, persist, merge, and handoff steps are
fluid; there is no data loss during any of the processes.
Figure 3 illustrates the operations of a real-time node. The node
starts at 13:37 and will only accept events for the current hour or the
next hour. When events are ingested, the node announces that it is
serving a segment of data for an interval from 13:00 to 14:00. Every
10 minutes (the persist period is configurable), the node will flush
and persist its in-memory buffer to disk. Near the end of the hour,
the node will likely see events for 14:00 to 15:00. When this occurs,
the node prepares to serve data for the next hour and creates a new
in-memory index. The node then announces that it is also serving
a segment from 14:00 to 15:00. The node does not immediately
merge persisted indexes from 13:00 to 14:00, instead it waits for
a configurable window period for straggling events from 13:00 to

Real-time Nodes
Coordinator Nodes
Broker Nodes
Historical Nodes
MySQL
Zookeeper
Deep Storage
Streaming Data
BatchData
Client Queries
QueriesMetadataData/Segments
Druid Nodes
External Dependencies
Figure 1: An overview of a Druid cluster and the flow of data through the cluster.
event_23312event_23481event_23593
...
event_1234event_2345...
event_3456event_4567...
event_5678event_6789...
event_7890event_8901...
Disk and persisted indexes
Heap and in-memory index
Persist
event_34982event_35789event_36791...
event_1234event_2345...
event_3456event_4567...
event_5678event_6789...
event_7890event_8901...
Off-heap memory and persisted indexes
Load
Queries
Figure 2: Real-time nodes buffer events to an in-memory index,
which is regularly persisted to disk. On a periodic basis, per-
sisted indexes are then merged together before getting handed
off. Queries will hit both the in-memory and persisted indexes.
14:00 to arrive. This window period minimizes the risk of data loss
from delays in event delivery. At the end of the window period, the
node merges all persisted indexes from 13:00 to 14:00 into a single
immutable segment and hands the segment off. Once this segment
is loaded and queryable somewhere else in the Druid cluster, the
real-time node flushes all information about the data it collected for
13:00 to 14:00 and unannounces it is serving this data.
3.1.1 Availability and ScalabilityReal-time nodes are a consumer of data and require a correspond-
ing producer to provide the data stream. Commonly, for data dura-
bility purposes, a message bus such as Kafka [21] sits between the
producer and the real-time node as shown in Figure 4. Real-time
nodes ingest data by reading events from the message bus. The
time from event creation to event consumption is ordinarily on the
order of hundreds of milliseconds.
The purpose of the message bus in Figure 4 is two-fold. First, the
message bus acts as a buffer for incoming events. A message bus
such as Kafka maintains positional offsets indicating how far a con-
sumer (a real-time node) has read in an event stream. Consumers
can programmatically update these offsets. Real-time nodes update
this offset each time they persist their in-memory buffers to disk. In
a fail and recover scenario, if a node has not lost disk, it can reload
all persisted indexes from disk and continue reading events from
the last offset it committed. Ingesting events from a recently com-
mitted offset greatly reduces a node’s recovery time. In practice,
we see nodes recover from such failure scenarios in a few seconds.
The second purpose of the message bus is to act as a single end-
point from which multiple real-time nodes can read events. Multi-
ple real-time nodes can ingest the same set of events from the bus,
creating a replication of events. In a scenario where a node com-
pletely fails and loses disk, replicated streams ensure that no data
is lost. A single ingestion endpoint also allows for data streams
to be partitioned such that multiple real-time nodes each ingest a
portion of a stream. This allows additional real-time nodes to be
seamlessly added. In practice, this model has allowed one of the
largest production Druid clusters to be able to consume raw data at
approximately 500 MB/s (150,000 events/s or 2 TB/hour).
3.2 Historical NodesHistorical nodes encapsulate the functionality to load and serve
the immutable blocks of data (segments) created by real-time nodes.
In many real-world workflows, most of the data loaded in a Druid
cluster is immutable and hence, historical nodes are typically the
main workers of a Druid cluster. Historical nodes follow a shared-
nothing architecture and there is no single point of contention among
the nodes. The nodes have no knowledge of one another and are
operationally simple; they only know how to load, drop, and serve
immutable segments.
Similar to real-time nodes, historical nodes announce their on-
line state and the data they are serving in Zookeeper. Instructions to
load and drop segments are sent over Zookeeper and contain infor-
mation about where the segment is located in deep storage and how
to decompress and process the segment. Before a historical node
downloads a particular segment from deep storage, it first checks a
local cache that maintains information about what segments already
exist on the node. If information about a segment is not present in
the cache, the historical node will proceed to download the segment
from deep storage. This process is shown in Figure 5. Once pro-
cessing is complete, the segment is announced in Zookeeper. At
this point, the segment is queryable. The local cache also allows
for historical nodes to be quickly updated and restarted. On startup,
the node examines its cache and immediately serves whatever data
it finds.

13:00 14:00 15:0013:37- node starts- announce segment for data 13:00-14:00
13:47persist data for 13:00-14:00
~14:00- announce segment for data 14:00-15:00
14:10- merge and handoff for data 13:00-14:00- persist data for 14:00-15:00
~14:11- unannounce segment for data 13:00-14:00
13:57persist data for 13:00-14:00
14:07persist data for 13:00-14:00
Figure 3: The node starts, ingests data, persists, and periodically hands data off. This process repeats indefinitely. The time periods
between different real-time node operations are configurable.
event_12345
event_23456
event_34567
event_35582
event_37193
event_78901
event_79902
event_79932
event_89012
event_2849219event_120202…
event_90192
Real-timeNode 1
Real-timeNode 2
offset 1
offset 2
events events
events
Kafka
Streaming events
Figure 4: Multiple real-time nodes can read from the samemes-
sage bus. Each node maintains its own offset.
Deep Storage
Segment
Memory
Disk
Cache Entries
Segment
Segment
download
create key
Load
Figure 5: Historical nodes download immutable segments from
deep storage. Segments must be loaded in memory before they
can be queried.
Historical nodes can support read consistency because they only
deal with immutable data. Immutable data blocks also enable a sim-
ple parallelization model: historical nodes can concurrently scan
and aggregate immutable blocks without blocking.
3.2.1 TiersHistorical nodes can be grouped in different tiers, where all nodes
in a given tier are identically configured. Different performance and
fault-tolerance parameters can be set for each tier. The purpose of
tiered nodes is to enable higher or lower priority segments to be dis-
tributed according to their importance. For example, it is possible
to spin up a “hot” tier of historical nodes that have a high num-
ber of cores and large memory capacity. The “hot” cluster can be
configured to download more frequently accessed data. A parallel
“cold” cluster can also be created with much less powerful backing
hardware. The “cold” cluster would only contain less frequently
accessed segments.
3.2.2 AvailabilityHistorical nodes depend on Zookeeper for segment load and un-
load instructions. Should Zookeeper become unavailable, histor-
ical nodes are no longer able to serve new data or drop outdated
data, however, because the queries are served over HTTP, histori-
cal nodes are still able to respond to query requests for the data they
are currently serving. This means that Zookeeper outages do not
impact current data availability on historical nodes.
3.3 Broker NodesBroker nodes act as query routers to historical and real-time nodes.
Broker nodes understand themetadata published in Zookeeper about
what segments are queryable and where those segments are located.
Broker nodes route incoming queries such that the queries hit the
right historical or real-time nodes. Broker nodes also merge partial
results from historical and real-time nodes before returning a final
consolidated result to the caller.
3.3.1 CachingBroker nodes contain a cache with a LRU [31, 20] invalidation
strategy. The cache can use local heap memory or an external dis-

tributed key/value store such as Memcached [16]. Each time a bro-
ker node receives a query, it first maps the query to a set of seg-
ments. Results for certain segments may already exist in the cache
and there is no need to recompute them. For any results that do
not exist in the cache, the broker node will forward the query to the
correct historical and real-time nodes. Once historical nodes return
their results, the broker will cache these results on a per segment ba-
sis for future use. This process is illustrated in Figure 6. Real-time
data is never cached and hence requests for real-time data will al-
ways be forwarded to real-time nodes. Real-time data is perpetually
changing and caching the results is unreliable.
The cache also acts as an additional level of data durability. In
the event that all historical nodes fail, it is still possible to query
results if those results already exist in the cache.
3.3.2 AvailabilityIn the event of a total Zookeeper outage, data is still queryable.
If broker nodes are unable to communicate to Zookeeper, they use
their last known view of the cluster and continue to forward queries
to real-time and historical nodes. Broker nodes make the assump-
tion that the structure of the cluster is the same as it was before the
outage. In practice, this availability model has allowed our Druid
cluster to continue serving queries for a significant period of time
while we diagnosed Zookeeper outages.
3.4 Coordinator NodesDruid coordinator nodes are primarily in charge of data manage-
ment and distribution on historical nodes. The coordinator nodes
tell historical nodes to load new data, drop outdated data, replicate
data, and move data to load balance. Druid uses a multi-version
concurrency control swapping protocol for managing immutable
segments in order to maintain stable views. If any immutable seg-
ment contains data that is wholly obsoleted by newer segments, the
outdated segment is dropped from the cluster. Coordinator nodes
undergo a leader-election process that determines a single node that
runs the coordinator functionality. The remaining coordinator nodes
act as redundant backups.
A coordinator node runs periodically to determine the current
state of the cluster. It makes decisions by comparing the expected
state of the cluster with the actual state of the cluster at the time
of the run. As with all Druid nodes, coordinator nodes maintain a
Zookeeper connection for current cluster information. Coordinator
nodes also maintain a connection to a MySQL database that con-
tains additional operational parameters and configurations. One of
the key pieces of information located in the MySQL database is a
table that contains a list of all segments that should be served by
historical nodes. This table can be updated by any service that cre-
ates segments, for example, real-time nodes. The MySQL database
also contains a rule table that governs how segments are created,
destroyed, and replicated in the cluster.
3.4.1 RulesRules govern how historical segments are loaded and dropped
from the cluster. Rules indicate how segments should be assigned to
different historical node tiers and howmany replicates of a segment
should exist in each tier. Rules may also indicate when segments
should be dropped entirely from the cluster. Rules are usually set
for a period of time. For example, a user may use rules to load the
most recent one month’s worth of segments into a “hot” cluster, the
most recent one year’s worth of segments into a “cold” cluster, and
drop any segments that are older.
The coordinator nodes load a set of rules from a rule table in the
MySQL database. Rules may be specific to a certain data source
and/or a default set of rules may be configured. The coordinator
node will cycle through all available segments and match each seg-
ment with the first rule that applies to it.
3.4.2 Load BalancingIn a typical production environment, queries often hit dozens or
even hundreds of segments. Since each historical node has limited
resources, segments must be distributed among the cluster to en-
sure that the cluster load is not too imbalanced. Determining opti-
mal load distribution requires some knowledge about query patterns
and speeds. Typically, queries cover recent segments spanning con-
tiguous time intervals for a single data source. On average, queries
that access smaller segments are faster.
These query patterns suggest replicating recent historical seg-
ments at a higher rate, spreading out large segments that are close
in time to different historical nodes, and co-locating segments from
different data sources. To optimally distribute and balance seg-
ments among the cluster, we developed a cost-based optimization
procedure that takes into account the segment data source, recency,
and size. The exact details of the algorithm are beyond the scope of
this paper and may be discussed in future literature.
3.4.3 ReplicationCoordinator nodes may tell different historical nodes to load a
copy of the same segment. The number of replicates in each tier
of the historical compute cluster is fully configurable. Setups that
require high levels of fault tolerance can be configured to have a
high number of replicas. Replicated segments are treated the same
as the originals and follow the same load distribution algorithm. By
replicating segments, single historical node failures are transparent
in the Druid cluster. We use this property for software upgrades.
We can seamlessly take a historical node offline, update it, bring it
back up, and repeat the process for every historical node in a cluster.
Over the last two years, we have never taken downtime in our Druid
cluster for software upgrades.
3.4.4 AvailabilityDruid coordinator nodes have Zookeeper andMySQL as external
dependencies. Coordinator nodes rely on Zookeeper to determine
what historical nodes already exist in the cluster. If Zookeeper be-
comes unavailable, the coordinator will no longer be able to send
instructions to assign, balance, and drop segments. However, these
operations do not affect data availability at all.
The design principle for responding to MySQL and Zookeeper
failures is the same: if an external dependency responsible for co-
ordination fails, the cluster maintains the status quo. Druid uses
MySQL to store operational management information and segment
metadata information about what segments should exist in the clus-
ter. If MySQL goes down, this information becomes unavailable to
coordinator nodes. However, this does not mean data itself is un-
available. If coordinator nodes cannot communicate to MySQL,
they will cease to assign new segments and drop outdated ones.
Broker, historical, and real-time nodes are still queryable during
MySQL outages.
4. STORAGE FORMATData tables inDruid (called data sources) are collections of times-
tamped events and partitioned into a set of segments, where each
segment is typically 5–10 million rows. Formally, we define a seg-
ment as a collection of rows of data that span some period of time.
Segments represent the fundamental storage unit in Druid and repli-
cation and distribution are done at a segment level.

Query for data from 2013-01-01 to 2013-01-08
results for segment 2013-01-01/2013-01-02
results for segment 2013-01-02/2013-01-03
results for segment 2013-01-07/2013-01-08
Cache (on broker nodes)
segment for data 2013-01-03/2013-01-04
segment for data 2013-01-04/2013-01-05
segment for data 2013-01-05/2013-01-06
segment for data 2013-01-06/2013-01-07
Historical and real-time nodes
Query for data not in cache
Figure 6: Results are cached per segment. Queries combine cached results with results computed on historical and real-time nodes.
Druid always requires a timestamp column as a method of sim-
plifying data distribution policies, data retention policies, and first-
level query pruning. Druid partitions its data sources into well-
defined time intervals, typically an hour or a day, and may further
partition on values from other columns to achieve the desired seg-
ment size. The time granularity to partition segments is a function
of data volume and time range. A data set with timestamps spread
over a year is better partitioned by day, and a data set with times-
tamps spread over a day is better partitioned by hour.
Segments are uniquely identified by a data source identifer, the
time interval of the data, and a version string that increases when-
ever a new segment is created. The version string indicates the
freshness of segment data; segments with later versions have newer
views of data (over some time range) than segments with older ver-
sions. This segment metadata is used by the system for concur-
rency control; read operations always access data in a particular
time range from the segments with the latest version identifiers for
that time range.
Druid segments are stored in a column orientation. Given that
Druid is best used for aggregating event streams (all data going into
Druid must have a timestamp), the advantages of storing aggregate
information as columns rather than rows are well documented [1].
Column storage allows for more efficient CPU usage as only what
is needed is actually loaded and scanned. In a row oriented data
store, all columns associated with a row must be scanned as part of
an aggregation. The additional scan time can introduce signficant
performance degradations [1].Druid has multiple column types to represent various data for-
mats. Depending on the column type, different compression meth-ods are used to reduce the cost of storing a column in memory andon disk. In the example given in Table 1, the page, user, gender,and city columns only contain strings. Storing strings directly isunnecessarily costly and string columns can be dictionary encodedinstead. Dictionary encoding is a commonmethod to compress dataand has been used in other data stores such as PowerDrill [17]. Inthe example in Table 1, we can map each page to a unique integeridentifier.
Justin Bieber -> 0Ke$ha -> 1
This mapping allows us to represent the page column as an in-teger array where the array indices correspond to the rows of theoriginal data set. For the page column, we can represent the uniquepages as follows:
[0, 0, 1, 1]
The resulting integer array lends itself very well to compression
methods. Generic compression algorithms on top of encodings are
extremely common in column-stores. Druid uses the LZF [24] com-
pression algorithm.Similar compressionmethods can be applied to numeric columns.
For example, the characters added and characters removed columnsin Table 1 can also be expressed as individual arrays.
Characters Added -> [1800, 2912, 1953, 3194]Characters Removed -> [25, 42, 17, 170]
In this case, we compress the raw values as opposed to their dic-
tionary representations.
Integer array size (bytes)Integer array size (bytes)Integer array size (bytes)Integer array size (bytes)Integer array size (bytes)Integer array size (bytes)Integer array size (bytes)Integer array size (bytes)Integer array size (bytes)Integer array size (bytes)Integer array size (bytes)Integer array size (bytes)Integer array size (bytes)Integer array size (bytes)Integer array size (bytes)Integer array size (bytes)Integer array size (bytes)Integer array size (bytes)Integer array size (bytes)Integer array size (bytes)Integer array size (bytes)Integer array size (bytes)Integer array size (bytes)Integer array size (bytes)Integer array size (bytes)Integer array size (bytes)Integer array size (bytes)Integer array size (bytes)
1e+04
1e+06
1e+02 1e+05 1e+08Cardinality
Con
cise
com
pres
sed
size
(by
tes)
sorted
sorted
unsorted
Figure 7: Integer array size versus Concise set size.
4.1 Indices for Filtering DataIn many real world OLAP workflows, queries are issued for the
aggregated results of some set of metrics where some set of di-
mension specifications are met. An example query is: “How many
Wikipedia edits were done by users in San Francisco who are also
male?” This query is filtering theWikipedia data set in Table 1 based
on a Boolean expression of dimension values. In many real world
data sets, dimension columns contain strings and metric columns
contain numeric values. Druid creates additional lookup indices for
string columns such that only those rows that pertain to a particular
query filter are ever scanned.Let us consider the page column in Table 1. For each unique page
in Table 1, we can form some representation indicating in whichtable rows a particular page is seen. We can store this informationin a binary array where the array indices represent our rows. If aparticular page is seen in a certain row, that array index is markedas 1. For example:
Justin Bieber -> rows [0, 1] -> [1][1][0][0]Ke$ha -> rows [2, 3] -> [0][0][1][1]
Justin Bieber is seen in rows 0 and 1. This mapping of col-umn values to row indices forms an inverted index [39]. To knowwhich rows contain Justin Bieber or Ke$ha, we can OR togetherthe two arrays.
[0][1][0][1] OR [1][0][1][0] = [1][1][1][1]
This approach of performing Boolean operations on large bitmap
sets is commonly used in search engines. Bitmap indices for OLAP
workloads is described in detail in [32]. Bitmap compression al-
gorithms are a well-defined area of research [2, 44, 42] and often
utilize run-length encoding. Druid opted to use the Concise algo-
rithm [10]. Figure 7 illustrates the number of bytes using Concise
compression versus using an integer array. The results were gen-
erated on a cc2.8xlarge system with a single thread, 2G heap,
512m young gen, and a forced GC between each run. The data set
is a single day’s worth of data collected from the Twitter garden
hose [41] data stream. The data set contains 2,272,295 rows and

12 dimensions of varying cardinality. As an additional comparison,
we also resorted the data set rows to maximize compression.
In the unsorted case, the total Concise size was 53,451,144 bytes
and the total integer array size was 127,248,520 bytes. Overall,
Concise compressed sets are about 42% smaller than integer ar-
rays. In the sorted case, the total Concise compressed size was
43,832,884 bytes and the total integer array size was 127,248,520
bytes. What is interesting to note is that after sorting, global com-
pression only increased minimally.
4.2 Storage EngineDruid’s persistence components allows for different storage en-
gines to be plugged in, similar to Dynamo [12]. These storage en-
gines may store data in an entirely in-memory structure such as the
JVM heap or in memory-mapped structures. The ability to swap
storage engines allows for Druid to be configured depending on a
particular application’s specifications. An in-memory storage en-
gine may be operationally more expensive than a memory-mapped
storage engine but could be a better alternative if performance is
critical. By default, a memory-mapped storage engine is used.
When using a memory-mapped storage engine, Druid relies on
the operating system to page segments in and out of memory. Given
that segments can only be scanned if they are loaded in memory, a
memory-mapped storage engine allows recent segments to retain
in memory whereas segments that are never queried are paged out.
The main drawback with using the memory-mapped storage engine
is when a query requires more segments to be paged into memory
than a given node has capacity for. In this case, query performance
will suffer from the cost of paging segments in and out of memory.
5. QUERY APIDruid has its own query language and accepts queries as POST
requests. Broker, historical, and real-time nodes all share the same
query API.
The body of the POST request is a JSON object containing key-
value pairs specifying various query parameters. A typical query
will contain the data source name, the granularity of the result data,
time range of interest, the type of request, and the metrics to ag-
gregate over. The result will also be a JSON object containing the
aggregated metrics over the time period.
Most query types will also support a filter set. A filter set is a
Boolean expression of dimension name and value pairs. Any num-
ber and combination of dimensions and values may be specified.
When a filter set is provided, only the subset of the data that per-
tains to the filter set will be scanned. The ability to handle complex
nested filter sets is what enables Druid to drill into data at any depth.The exact query syntax depends on the query type and the infor-
mation requested. A sample count query over a week of data is asfollows:
{"queryType" : "timeseries","dataSource" : "wikipedia","intervals" : "2013-01-01/2013-01-08","filter" : {
"type" : "selector","dimension" : "page","value" : "Ke$ha"
},"granularity" : "day","aggregations" : [{"type":"count", "name":"rows"}]
}
The query shown above will return a count of the number of rowsin the Wikipedia data source from 2013-01-01 to 2013-01-08, fil-tered for only those rows where the value of the “page” dimensionis equal to “Ke$ha”. The results will be bucketed by day and willbe a JSON array of the following form:
[ {"timestamp": "2012-01-01T00:00:00.000Z","result": {"rows":393298}
},{
"timestamp": "2012-01-02T00:00:00.000Z","result": {"rows":382932}
},...{
"timestamp": "2012-01-07T00:00:00.000Z","result": {"rows": 1337}
} ]
Druid supports many types of aggregations including sums on
floating-point and integer types, minimums, maximums, and com-
plex aggregations such as cardinality estimation and approximate
quantile estimation. The results of aggregations can be combined
in mathematical expressions to form other aggregations. It is be-
yond the scope of this paper to fully describe the query API but
more information can be found online3.
As of this writing, a join query for Druid is not yet implemented.
This has been a function of engineering resource allocation and use
case decisions more than a decision driven by technical merit. In-
deed, Druid’s storage format would allow for the implementation
of joins (there is no loss of fidelity for columns included as dimen-
sions) and the implementation of them has been a conversation that
we have every few months. To date, we have made the choice that
the implementation cost is not worth the investment for our organi-
zation. The reasons for this decision are generally two-fold.
1. Scaling join queries has been, in our professional experience,
a constant bottleneck of working with distributed databases.
2. The incremental gains in functionality are perceived to be
of less value than the anticipated problems with managing
highly concurrent, join-heavy workloads.
A join query is essentially the merging of two or more streams of
data based on a shared set of keys. The primary high-level strate-
gies for join queries we are aware of are a hash-based strategy or a
sorted-merge strategy. The hash-based strategy requires that all but
one data set be available as something that looks like a hash table,
a lookup operation is then performed on this hash table for every
row in the “primary” stream. The sorted-merge strategy assumes
that each stream is sorted by the join key and thus allows for the in-
cremental joining of the streams. Each of these strategies, however,
requires the materialization of some number of the streams either in
sorted order or in a hash table form.
When all sides of the join are significantly large tables (> 1 bil-
lion records), materializing the pre-join streams requires complex
distributed memory management. The complexity of the memory
management is only amplified by the fact that we are targeting highly
concurrent, multitenant workloads. This is, as far as we are aware,
an active academic research problem that we would be willing to
help resolve in a scalable manner.
6. PERFORMANCEDruid runs in production at several organizations, and to demon-
strate its performance, we have chosen to share some real world
numbers for the main production cluster running at Metamarkets as
of early 2014. For comparison with other databases we also include
results from synthetic workloads on TPC-H data.
3http://druid.io/docs/latest/Querying.html

Data Source Dimensions Metrics
a 25 21
b 30 26
c 71 35
d 60 19
e 29 8
f 30 16
g 26 18
h 78 14
Table 2: Characteristics of production data sources.
6.1 Query Performance in ProductionDruid query performance can vary signficantly depending on the
query being issued. For example, sorting the values of a high cardi-
nality dimension based on a given metric is much more expensive
than a simple count over a time range. To showcase the average
query latencies in a production Druid cluster, we selected 8 of our
most queried data sources, described in Table 2.
Approximately 30% of queries are standard aggregates involving
different types of metrics and filters, 60% of queries are ordered
group bys over one or more dimensions with aggregates, and 10%
of queries are search queries and metadata retrieval queries. The
number of columns scanned in aggregate queries roughly follows
an exponential distribution. Queries involving a single column are
very frequent, and queries involving all columns are very rare.
A few notes about our results:
• The results are from a “hot” tier in our production cluster. There
were approximately 50 data sources in the tier and several hun-
dred users issuing queries.
• There was approximately 10.5TB of RAM available in the “hot”
tier and approximately 10TB of segments loaded. Collectively,
there are about 50 billionDruid rows in this tier. Results for every
data source are not shown.
• The hot tier uses Intel® Xeon® E5-2670 processors and consists
of 1302 processing threads and 672 total cores (hyperthreaded).
• A memory-mapped storage engine was used (the machine was
configured to memory map the data instead of loading it into the
Java heap.)
Query latencies are shown in Figure 8 and the queries per minute
are shown in Figure 9. Across all the various data sources, aver-
age query latency is approximately 550 milliseconds, with 90% of
queries returning in less than 1 second, 95% in under 2 seconds,
and 99% of queries returning in less than 10 seconds. Occasionally
we observe spikes in latency, as observed on February 19, where
network issues on the Memcached instances were compounded by
very high query load on one of our largest data sources.
6.2 Query Benchmarks on TPC-H DataWe also present Druid benchmarks on TPC-H data. Most TPC-H
queries do not directly apply to Druid, so we selected queries more
typical of Druid’s workload to demonstrate query performance. As
a comparison, we also provide the results of the same queries us-
ing MySQL using the MyISAM engine (InnoDB was slower in our
experiments).
We selected MySQL to benchmark against because of its univer-
sal popularity. We chose not to select another open source column
store because we were not confident we could correctly tune it for
optimal performance.
Our Druid setup used Amazon EC2 m3.2xlarge instance types(Intel® Xeon® E5-2680 v2 @ 2.80GHz) for historical nodes and
c3.2xlarge instances (Intel® Xeon® E5-2670 v2 @ 2.50GHz) for
0.0
0.5
1.0
Feb 03 Feb 10 Feb 17 Feb 24time
quer
y tim
e (s
)
datasource
a
b
c
d
e
f
g
h
Mean query latency
0.0
0.5
1.0
1.5
0
1
2
3
4
0
5
10
15
20
90%ile
95%ile
99%ile
Feb 03 Feb 10 Feb 17 Feb 24time
quer
y tim
e (s
econ
ds)
datasource
a
b
c
d
e
f
g
h
Query latency percentiles
Figure 8: Query latencies of production data sources.
0
500
1000
1500
Feb 03 Feb 10 Feb 17 Feb 24time
quer
ies
/ min
ute
datasource
a
b
c
d
e
f
g
h
Queries per minute
Figure 9: Queries per minute of production data sources.
0
1
2
3
4
coun
t_st
ar_i
nter
val
sum
_all
sum
_all_
filte
r
sum
_all_
year
sum
_pric
e
top_
100_
com
mitd
ate
top_
100_
part
s
top_
100_
part
s_de
tails
top_
100_
part
s_fil
ter
Query
Tim
e (s
econ
ds)
engine
Druid
MySQL
Median query time (100 runs) − 1GB data − single node
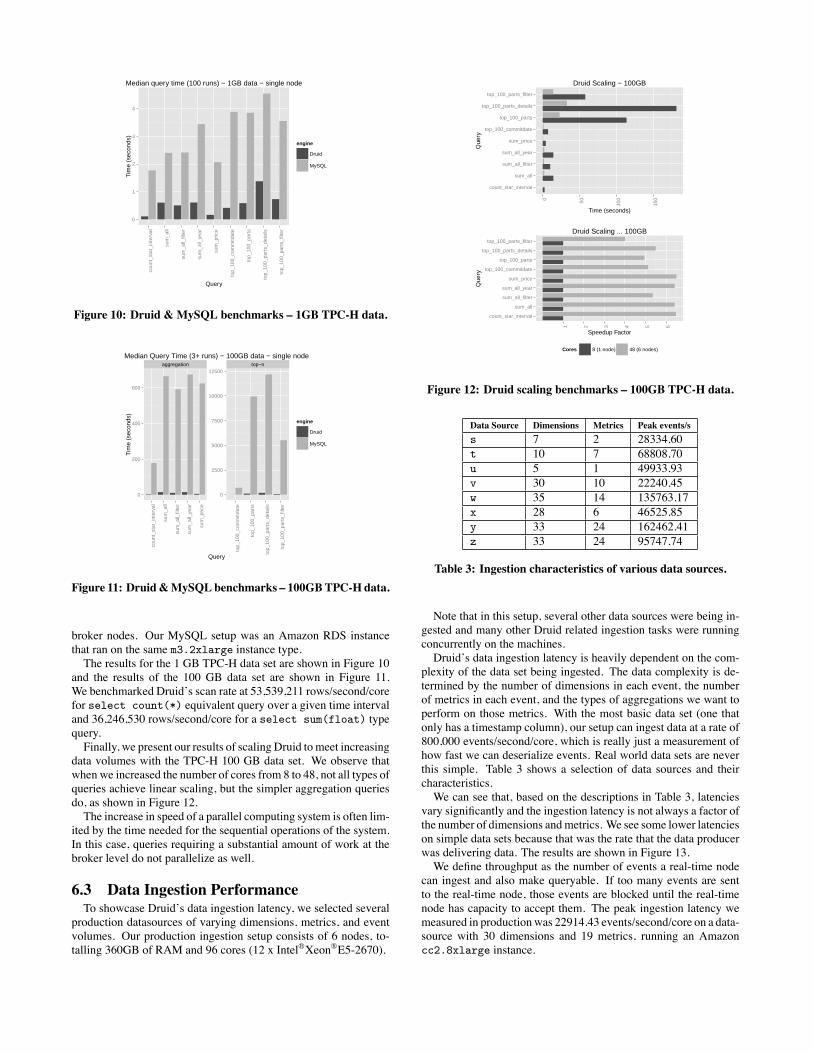
Figure 10: Druid & MySQL benchmarks – 1GB TPC-H data.
aggregation top−n
0
200
400
600
0
2500
5000
7500
10000
12500
coun
t_st
ar_i
nter
val
sum
_all
sum
_all_
filte
r
sum
_all_
year
sum
_pric
e
top_
100_
com
mitd
ate
top_
100_
part
s
top_
100_
part
s_de
tails
top_
100_
part
s_fil
ter
Query
Tim
e (s
econ
ds)
engine
Druid
MySQL
Median Query Time (3+ runs) − 100GB data − single node
Figure 11: Druid&MySQLbenchmarks – 100GBTPC-H data.
broker nodes. Our MySQL setup was an Amazon RDS instance
that ran on the same m3.2xlarge instance type.The results for the 1 GB TPC-H data set are shown in Figure 10
and the results of the 100 GB data set are shown in Figure 11.
We benchmarked Druid’s scan rate at 53,539,211 rows/second/core
for select count(*) equivalent query over a given time intervaland 36,246,530 rows/second/core for a select sum(float) typequery.
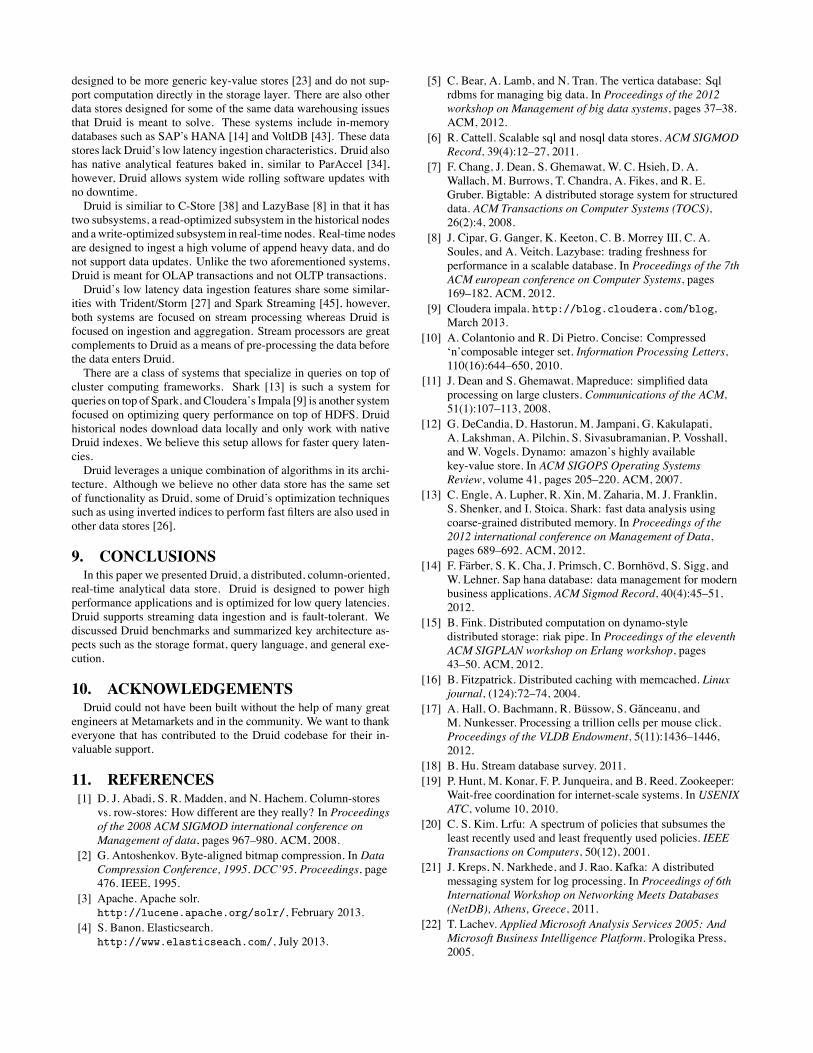
Finally, we present our results of scaling Druid tomeet increasing
data volumes with the TPC-H 100 GB data set. We observe that
when we increased the number of cores from 8 to 48, not all types of
queries achieve linear scaling, but the simpler aggregation queries
do, as shown in Figure 12.
The increase in speed of a parallel computing system is often lim-
ited by the time needed for the sequential operations of the system.
In this case, queries requiring a substantial amount of work at the
broker level do not parallelize as well.
6.3 Data Ingestion PerformanceTo showcase Druid’s data ingestion latency, we selected several
production datasources of varying dimensions, metrics, and event
volumes. Our production ingestion setup consists of 6 nodes, to-
talling 360GB of RAM and 96 cores (12 x Intel®Xeon®E5-2670).
count_star_interval
sum_all
sum_all_filter
sum_all_year
sum_price
top_100_commitdate
top_100_parts
top_100_parts_details
top_100_parts_filter
0 50 100
150
Time (seconds)
Que
ry
Druid Scaling − 100GB
count_star_interval
sum_all
sum_all_filter
sum_all_year
sum_price
top_100_commitdate
top_100_parts
top_100_parts_details
top_100_parts_filter
1 2 3 4 5 6
Speedup Factor
Que
ry
Cores 8 (1 node) 48 (6 nodes)
Druid Scaling ... 100GB
Figure 12: Druid scaling benchmarks – 100GB TPC-H data.
Data Source Dimensions Metrics Peak events/s
s 7 2 28334.60
t 10 7 68808.70
u 5 1 49933.93
v 30 10 22240.45
w 35 14 135763.17
x 28 6 46525.85
y 33 24 162462.41
z 33 24 95747.74
Table 3: Ingestion characteristics of various data sources.
Note that in this setup, several other data sources were being in-
gested and many other Druid related ingestion tasks were running
concurrently on the machines.
Druid’s data ingestion latency is heavily dependent on the com-
plexity of the data set being ingested. The data complexity is de-
termined by the number of dimensions in each event, the number
of metrics in each event, and the types of aggregations we want to
perform on those metrics. With the most basic data set (one that
only has a timestamp column), our setup can ingest data at a rate of
800,000 events/second/core, which is really just a measurement of
how fast we can deserialize events. Real world data sets are never
this simple. Table 3 shows a selection of data sources and their
characteristics.
We can see that, based on the descriptions in Table 3, latencies
vary significantly and the ingestion latency is not always a factor of
the number of dimensions andmetrics. We see some lower latencies
on simple data sets because that was the rate that the data producer
was delivering data. The results are shown in Figure 13.
We define throughput as the number of events a real-time node
can ingest and also make queryable. If too many events are sent
to the real-time node, those events are blocked until the real-time
node has capacity to accept them. The peak ingestion latency we
measured in productionwas 22914.43 events/second/core on a data-
source with 30 dimensions and 19 metrics, running an Amazon
cc2.8xlarge instance.

0
50,000
100,000
150,000
200,000
250,000
Dec 15 Jan 01 Jan 15 Feb 01 Feb 15 Mar 01time
even
ts /
sdatasource
s
t
u
v
w
x
y
z
Events per second ... 24h moving average
Figure 13: Combined cluster ingestion rates.
The latency measurements we presented are sufficient to address
the stated problems of interactivity. We would prefer the variability
in the latencies to be less. It is still possible to decrease latencies
by adding additional hardware, but we have not chosen to do so
because infrastructure costs are still a consideration for us.
7. DRUID IN PRODUCTIONOver the last few years, we have gained tremendous knowledge
about handling production workloads with Druid and have made a
couple of interesting observations.
Query Patterns.Druid is often used to explore data and generate reports on data.
In the explore use case, the number of queries issued by a single
user are much higher than in the reporting use case. Exploratory
queries often involve progressively adding filters for the same time
range to narrow down results. Users tend to explore short time in-
tervals of recent data. In the generate report use case, users query
for much longer data intervals, but those queries are generally few
and pre-determined.
Multitenancy.Expensive concurrent queries can be problematic in a multitenant
environment. Queries for large data sources may end up hitting ev-
ery historical node in a cluster and consume all cluster resources.
Smaller, cheaper queries may be blocked from executing in such
cases. We introduced query prioritization to address these issues.
Each historical node is able to prioritize which segments it needs
to scan. Proper query planning is critical for production workloads.
Thankfully, queries for a significant amount of data tend to be for
reporting use cases and can be deprioritized. Users do not expect
the same level of interactivity in this use case as when they are ex-
ploring data.
Node failures.Single node failures are common in distributed environments, but
many nodes failing at once are not. If historical nodes completely
fail and do not recover, their segments need to be reassigned, which
meanswe need excess cluster capacity to load this data. The amount
of additional capacity to have at any time contributes to the cost
of running a cluster. From our experiences, it is extremely rare to
see more than 2 nodes completely fail at once and hence, we leave
enough capacity in our cluster to completely reassign the data from
2 historical nodes.
Data Center Outages.Complete cluster failures are possible, but extremely rare. If
Druid is only deployed in a single data center, it is possible for
the entire data center to fail. In such cases, new machines need
to be provisioned. As long as deep storage is still available, clus-
ter recovery time is network bound, as historical nodes simply need
to redownload every segment from deep storage. We have experi-
enced such failures in the past, and the recovery time was several
hours in the Amazon AWS ecosystem for several terabytes of data.
7.1 Operational MonitoringProper monitoring is critical to run a large scale distributed clus-
ter. Each Druid node is designed to periodically emit a set of oper-
ational metrics. These metrics may include system level data such
as CPU usage, available memory, and disk capacity, JVM statistics
such as garbage collection time, and heap usage, or node specific
metrics such as segment scan time, cache hit rates, and data inges-
tion latencies. Druid also emits per query metrics.
We emit metrics from a production Druid cluster and load them
into a dedicated metrics Druid cluster. The metrics Druid cluster
is used to explore the performance and stability of the production
cluster. This dedicated metrics cluster has allowed us to find nu-
merous production problems, such as gradual query speed degrega-
tions, less than optimally tuned hardware, and various other system
bottlenecks. We also use a metrics cluster to analyze what queries
are made in production and what aspects of the data users are most
interested in.
7.2 Pairing Druid with a Stream ProcessorCurrently, Druid can only understand fully denormalized data
streams. In order to provide full business logic in production, Druid
can be paired with a stream processor such as Apache Storm [27].
A Storm topology consumes events from a data stream, retains
only those that are “on-time”, and applies any relevant business
logic. This could range from simple transformations, such as id
to name lookups, to complex operations such as multi-stream joins.
The Storm topology forwards the processed event stream to Druid
in real-time. Storm handles the streaming data processing work,
and Druid is used for responding to queries for both real-time and
historical data.
7.3 Multiple Data Center DistributionLarge scale production outages may not only affect single nodes,
but entire data centers as well. The tier configuration in Druid co-
ordinator nodes allow for segments to be replicated across multiple
tiers. Hence, segments can be exactly replicated across historical
nodes in multiple data centers. Similarily, query preference can be
assigned to different tiers. It is possible to have nodes in one data
center act as a primary cluster (and receive all queries) and have a
redundant cluster in another data center. Such a setup may be de-
sired if one data center is situated much closer to users.
8. RELATED WORKCattell [6] maintains a great summary about existing Scalable
SQL and NoSQL data stores. Hu [18] contributed another great
summary for streaming databases. Druid feature-wise sits some-
where between Google’s Dremel [28] and PowerDrill [17]. Druid
has most of the features implemented in Dremel (Dremel handles
arbitrary nested data structures while Druid only allows for a single
level of array-based nesting) and many of the interesting compres-
sion algorithms mentioned in PowerDrill.
Although Druid builds on many of the same principles as other
distributed columnar data stores [15], many of these data stores are
designed to be more generic key-value stores [23] and do not sup-
port computation directly in the storage layer. There are also other
data stores designed for some of the same data warehousing issues
that Druid is meant to solve. These systems include in-memory
databases such as SAP’s HANA [14] and VoltDB [43]. These data
stores lack Druid’s low latency ingestion characteristics. Druid also
has native analytical features baked in, similar to ParAccel [34],
however, Druid allows system wide rolling software updates with
no downtime.
Druid is similiar to C-Store [38] and LazyBase [8] in that it has
two subsystems, a read-optimized subsystem in the historical nodes
and awrite-optimized subsystem in real-time nodes. Real-time nodes
are designed to ingest a high volume of append heavy data, and do
not support data updates. Unlike the two aforementioned systems,
Druid is meant for OLAP transactions and not OLTP transactions.
Druid’s low latency data ingestion features share some similar-
ities with Trident/Storm [27] and Spark Streaming [45], however,
both systems are focused on stream processing whereas Druid is
focused on ingestion and aggregation. Stream processors are great
complements to Druid as a means of pre-processing the data before
the data enters Druid.
There are a class of systems that specialize in queries on top of
cluster computing frameworks. Shark [13] is such a system for
queries on top of Spark, andCloudera’s Impala [9] is another system
focused on optimizing query performance on top of HDFS. Druid
historical nodes download data locally and only work with native
Druid indexes. We believe this setup allows for faster query laten-
cies.
Druid leverages a unique combination of algorithms in its archi-
tecture. Although we believe no other data store has the same set
of functionality as Druid, some of Druid’s optimization techniques
such as using inverted indices to perform fast filters are also used in
other data stores [26].
9. CONCLUSIONSIn this paper we presented Druid, a distributed, column-oriented,
real-time analytical data store. Druid is designed to power high
performance applications and is optimized for low query latencies.
Druid supports streaming data ingestion and is fault-tolerant. We
discussed Druid benchmarks and summarized key architecture as-
pects such as the storage format, query language, and general exe-
cution.
10. ACKNOWLEDGEMENTSDruid could not have been built without the help of many great
engineers at Metamarkets and in the community. We want to thank
everyone that has contributed to the Druid codebase for their in-
valuable support.
11. REFERENCES[1] D. J. Abadi, S. R. Madden, and N. Hachem. Column-stores
vs. row-stores: How different are they really? In Proceedings
of the 2008 ACM SIGMOD international conference on
Management of data, pages 967–980. ACM, 2008.
[2] G. Antoshenkov. Byte-aligned bitmap compression. In Data
Compression Conference, 1995. DCC’95. Proceedings, page
476. IEEE, 1995.
[3] Apache. Apache solr.
http://lucene.apache.org/solr/, February 2013.[4] S. Banon. Elasticsearch.
http://www.elasticseach.com/, July 2013.
[5] C. Bear, A. Lamb, and N. Tran. The vertica database: Sql
rdbms for managing big data. In Proceedings of the 2012
workshop on Management of big data systems, pages 37–38.
ACM, 2012.
[6] R. Cattell. Scalable sql and nosql data stores. ACM SIGMOD
Record, 39(4):12–27, 2011.
[7] F. Chang, J. Dean, S. Ghemawat, W. C. Hsieh, D. A.
Wallach, M. Burrows, T. Chandra, A. Fikes, and R. E.
Gruber. Bigtable: A distributed storage system for structured
data. ACM Transactions on Computer Systems (TOCS),
26(2):4, 2008.
[8] J. Cipar, G. Ganger, K. Keeton, C. B. Morrey III, C. A.
Soules, and A. Veitch. Lazybase: trading freshness for
performance in a scalable database. In Proceedings of the 7th
ACM european conference on Computer Systems, pages
169–182. ACM, 2012.
[9] Cloudera impala. http://blog.cloudera.com/blog,March 2013.
[10] A. Colantonio and R. Di Pietro. Concise: Compressed
‘n’composable integer set. Information Processing Letters,
110(16):644–650, 2010.
[11] J. Dean and S. Ghemawat. Mapreduce: simplified data
processing on large clusters. Communications of the ACM,
51(1):107–113, 2008.
[12] G. DeCandia, D. Hastorun, M. Jampani, G. Kakulapati,
A. Lakshman, A. Pilchin, S. Sivasubramanian, P. Vosshall,
and W. Vogels. Dynamo: amazon’s highly available
key-value store. In ACM SIGOPS Operating Systems
Review, volume 41, pages 205–220. ACM, 2007.
[13] C. Engle, A. Lupher, R. Xin, M. Zaharia, M. J. Franklin,
S. Shenker, and I. Stoica. Shark: fast data analysis using
coarse-grained distributed memory. In Proceedings of the
2012 international conference on Management of Data,
pages 689–692. ACM, 2012.
[14] F. Färber, S. K. Cha, J. Primsch, C. Bornhövd, S. Sigg, and
W. Lehner. Sap hana database: data management for modern
business applications. ACM Sigmod Record, 40(4):45–51,
2012.
[15] B. Fink. Distributed computation on dynamo-style
distributed storage: riak pipe. In Proceedings of the eleventh
ACM SIGPLAN workshop on Erlang workshop, pages
43–50. ACM, 2012.
[16] B. Fitzpatrick. Distributed caching with memcached. Linux
journal, (124):72–74, 2004.
[17] A. Hall, O. Bachmann, R. Büssow, S. Gănceanu, and
M. Nunkesser. Processing a trillion cells per mouse click.
Proceedings of the VLDB Endowment, 5(11):1436–1446,
2012.
[18] B. Hu. Stream database survey. 2011.
[19] P. Hunt, M. Konar, F. P. Junqueira, and B. Reed. Zookeeper:
Wait-free coordination for internet-scale systems. In USENIX
ATC, volume 10, 2010.
[20] C. S. Kim. Lrfu: A spectrum of policies that subsumes the
least recently used and least frequently used policies. IEEE
Transactions on Computers, 50(12), 2001.
[21] J. Kreps, N. Narkhede, and J. Rao. Kafka: A distributed
messaging system for log processing. In Proceedings of 6th
International Workshop on Networking Meets Databases
(NetDB), Athens, Greece, 2011.
[22] T. Lachev. Applied Microsoft Analysis Services 2005: And
Microsoft Business Intelligence Platform. Prologika Press,
2005.

[23] A. Lakshman and P. Malik. Cassandra—a decentralized
structured storage system. Operating systems review,
44(2):35, 2010.
[24] Liblzf. http://freecode.com/projects/liblzf, March
2013.
[25] LinkedIn. Senseidb. http://www.senseidb.com/, July2013.
[26] R. MacNicol and B. French. Sybase iq multiplex-designed
for analytics. In Proceedings of the Thirtieth international
conference on Very large data bases-Volume 30, pages
1227–1230. VLDB Endowment, 2004.
[27] N. Marz. Storm: Distributed and fault-tolerant realtime
computation. http://storm-project.net/, February2013.
[28] S. Melnik, A. Gubarev, J. J. Long, G. Romer, S. Shivakumar,
M. Tolton, and T. Vassilakis. Dremel: interactive analysis of
web-scale datasets. Proceedings of the VLDB Endowment,
3(1-2):330–339, 2010.
[29] D. Miner. Unified analytics platform for big data. In
Proceedings of the WICSA/ECSA 2012 Companion Volume,
pages 176–176. ACM, 2012.
[30] K. Oehler, J. Gruenes, C. Ilacqua, and M. Perez. IBM Cognos
TM1: The Official Guide. McGraw-Hill, 2012.
[31] E. J. O’neil, P. E. O’neil, and G. Weikum. The lru-k page
replacement algorithm for database disk buffering. In ACM
SIGMOD Record, volume 22, pages 297–306. ACM, 1993.
[32] P. O’Neil and D. Quass. Improved query performance with
variant indexes. In ACM Sigmod Record, volume 26, pages
38–49. ACM, 1997.
[33] P. O’Neil, E. Cheng, D. Gawlick, and E. O’Neil. The
log-structured merge-tree (lsm-tree). Acta Informatica,
33(4):351–385, 1996.
[34] Paraccel analytic database.
http://www.paraccel.com/resources/Datasheets/ParAccel-Core-Analytic-Database.pdf, March 2013.
[35] M. Schrader, D. Vlamis, M. Nader, C. Claterbos, D. Collins,
M. Campbell, and F. Conrad. Oracle Essbase & Oracle
OLAP. McGraw-Hill, Inc., 2009.
[36] K. Shvachko, H. Kuang, S. Radia, and R. Chansler. The
hadoop distributed file system. In Mass Storage Systems and
Technologies (MSST), 2010 IEEE 26th Symposium on, pages
1–10. IEEE, 2010.
[37] M. Singh and B. Leonhardi. Introduction to the ibm netezza
warehouse appliance. In Proceedings of the 2011 Conference
of the Center for Advanced Studies on Collaborative
Research, pages 385–386. IBM Corp., 2011.
[38] M. Stonebraker, D. J. Abadi, A. Batkin, X. Chen,
M. Cherniack, M. Ferreira, E. Lau, A. Lin, S. Madden,
E. O’Neil, et al. C-store: a column-oriented dbms. In
Proceedings of the 31st international conference on Very
large data bases, pages 553–564. VLDB Endowment, 2005.
[39] A. Tomasic and H. Garcia-Molina. Performance of inverted
indices in shared-nothing distributed text document
information retrieval systems. In Parallel and Distributed
Information Systems, 1993., Proceedings of the Second
International Conference on, pages 8–17. IEEE, 1993.
[40] E. Tschetter. Introducing druid: Real-time analytics at a
billion rows per second. http://druid.io/blog/2011/04/30/introducing-druid.html, April 2011.
[41] Twitter public streams. https://dev.twitter.com/docs/streaming-apis/streams/public, March 2013.
[42] S. J. van Schaik and O. de Moor. A memory efficient
reachability data structure through bit vector compression. In
Proceedings of the 2011 international conference on
Management of data, pages 913–924. ACM, 2011.
[43] L. VoltDB. Voltdb technical overview.
https://voltdb.com/, 2010.[44] K. Wu, E. J. Otoo, and A. Shoshani. Optimizing bitmap
indices with efficient compression. ACM Transactions on
Database Systems (TODS), 31(1):1–38, 2006.
[45] M. Zaharia, T. Das, H. Li, S. Shenker, and I. Stoica.
Discretized streams: an efficient and fault-tolerant model for
stream processing on large clusters. In Proceedings of the 4th
USENIX conference on Hot Topics in Cloud Computing,
pages 10–10. USENIX Association, 2012.