dry deposition of reactive nitrogen to european ecosystems: … · 2016-01-11 · ments of air...
TRANSCRIPT

Atmos Chem Phys 11 2703ndash2728 2011wwwatmos-chem-physnet1127032011doi105194acp-11-2703-2011copy Author(s) 2011 CC Attribution 30 License
AtmosphericChemistry
and Physics
Dry deposition of reactive nitrogen to European ecosystems acomparison of inferential models across the NitroEurope network
C R Flechard1 E Nemitz2 R I Smith2 D Fowler2 A T Vermeulen3 A Bleeker3 J W Erisman3 D Simpson45L Zhang6 Y S Tang2 and M A Sutton2
1INRA Agrocampus Ouest UMR 1069 SAS Rennes France2Center for Ecology and Hydrology (CEH) Edinburgh Penicuik UK3ECN Netherlands Energy Research Foundation Petten The Netherlands4EMEP MSC-W Norwegian Meteorological Institute Norway5Department Earth amp Space Sciences Chalmers University of Technology Gothenburg Sweden6Environment Canada Toronto Canada
Received 28 October 2010 ndash Published in Atmos Chem Phys Discuss 1 December 2010Revised 14 March 2011 ndash Accepted 14 March 2011 ndash Published 23 March 2011
Abstract Inferential models have long been used to deter-mine pollutant dry deposition to ecosystems from measure-ments of air concentrations and as part of national and re-gional atmospheric chemistry and transport models and yetmodels still suffer very large uncertainties An inferentialnetwork of 55 sites throughout Europe for atmospheric reac-tive nitrogen (Nr) was established in 2007 providing ambientconcentrations of gaseous NH3 NO2 HNO3 and HONO andaerosol NH+4 and NOminus
3 as part of the NitroEurope IntegratedProject
Network results providing modelled inorganic Nr dry de-position to the 55 monitoring sites are presented using fourexisting dry deposition routines revealing inter-model dif-ferences and providing ensemble average deposition esti-mates Dry deposition is generally largest over forests inregions with large ambient NH3 concentrations exceeding30ndash40 kg N haminus1 yrminus1 over parts of the Netherlands and Bel-gium while some remote forests in Scandinavia receive lessthan 2 kg N haminus1 yrminus1 Turbulent Nr deposition to short veg-etation ecosystems is generally smaller than to forests due toreduced turbulent exchange but also because NH3 inputs tofertilised agricultural systems are limited by the presence ofa substantial NH3 source in the vegetation leading to periodsof emission as well as deposition
Differences between models reach a factor 2ndash3 and are of-ten greater than differences between monitoring sites Forsoluble Nr gases such as NH3 and HNO3 the non-stomatalpathways are responsible for most of the annual uptake overmany surfaces especially the non-agricultural land uses
Correspondence toC R Flechard(chrisflechardrennesinrafr)
but parameterisations of the sink strength vary considerablyamong models For aerosol NH+
4 and NOminus
3 discrepanciesbetween theoretical models and field flux measurements leadto much uncertainty in dry deposition rates for fine parti-cles (01ndash05 microm) The validation of inferential models atthe ecosystem scale is best achieved by comparison with di-rect long-term micrometeorological Nr flux measurementsbut too few such datasets are available especially for HNO3and aerosol NH+4 and NOminus
3
1 Introduction
The environmental effects of excess atmospheric reactive ni-trogen (Nr) deposition to terrestrial ecosystems include soilacidification the eutrophication of water bodies nutrient im-balances the leaching of base cation and nitrate loss of bio-diversity direct toxicity to plants increased N2O emissionsand the inhibition of soil CH4 oxidation (Galloway et al2003 Erisman et al 2007) Elevated Nr deposition ratesare the result of increased ambient concentrations due to in-creased emissions by intensive farming (mostly reduced Nr)
and by traffic and industry (mostly oxidised Nr) A roleof Nr deposition as a strong driver of carbon sequestrationby temperate and boreal forests has been suggested (Mag-nani et al 2007) but the magnitude of the effect (kg C se-questeredkg N deposited) has been contested (de Vries etal 2008 Sutton et al 2008) Dry and wet deposition con-trol the atmospheric life times and mean transport distancesof Nr species downwind from point and diffuse sources andtherefore affect pollutant transport across borders This isevaluated at the European scale within the framework of the
Published by Copernicus Publications on behalf of the European Geosciences Union
2704 C R Flechard et al Dry deposition of reactive nitrogen to European ecosystems
1979 Convention on Long Range Transboundary Air Pollu-tion (CLRTAP) (UNECE 1999wwwuneceorgenvlrtap)and the associated European Monitoring and EvaluationProgramme (EMEPwwwemepint) using gas and particleconcentration monitoring networks to validate atmosphericmodel simulations (eg Fagerli and Aas 2008 Simpson etal 2006a) In North America the Canadian Air and Pre-cipitation Monitoring Network (CAPMoNhttpwwwecgccars-mndefaultasplang=Enampn=752CE271-1capmon)and the US Clean Air Status and Trends Network (CAST-Net httpwwwepagovcastnet) have also been monitoringair concentrations for more than three decades
The dry deposition of Nr present in air in various inor-ganic species such as gaseous NH3 HNO3 HONO NONO2 and aerosol NH+4 and NOminus
3 as well as in a range oforganic molecules in both phases (eg gaseous peroxyacetylnitrate (PAN) and other organic nitrates amines ndash see Geet al 2011) typically contributes between one third andtwo thirds of total atmospheric N deposition (Erisman etal 1996 Simpson et al 2006a Zimmermann et al 2006Zhang et al 2009) The partitioning between dry wet andoccult (ie cloud water) deposition depends on atmosphericgas and aerosol Nr concentrations weather patterns as wellas land usevegetation characteristics such as surface rough-ness canopy leaf surface area and vegetation wetness Un-like wet deposition which is widely monitored in regionalnetworks of wet-only or bulk precipitation collectors mea-surements of dry (turbulent) Nr exchange fluxes have largelyremained experimental and limited to selected research sitesand to measurement campaigns of typically a few days toa few months due to technical complexity and to the largeequipment and operational costs involved Nr concentrationdetectors that are reliable sturdy interference-free fast andprecise have proved elusive so far at least as far as long-termmicrometeorological flux measurements are concerned Ad-ditional issues concerning inlet design sampling losses andair column chemical reactions for highly reactive and solu-ble Nr species further indicate that large-scale dry depositionmonitoring networks remain as yet impracticable
Inferential modelling has been used extensively as an op-erational tool to obviate the absence of measured dry de-position data at regional scales (Baumgardner et al 2002Sickles and Shadwick 2007 Erisman et al 2005 Zhanget al 2009) The method was originally developed to as-sess ecosystem damage in areas subjected to acid (sulphur)deposition and to compute regional pollutant mass balances(eg Wesely and Hicks 1977 Garland 1977)
Dry deposition or bi-directional surfaceatmosphere ex-change may be inferred from the knowledge of (measured)atmospheric gaseous or particulate pollutant concentrationabove vegetation (or any roughness element at the Earthrsquossurface) using various assumptions regarding transfer ratesthrough the air and the surface A number of increasinglycomplex inferential schemes have been implemented in at-mospheric transport chemical models (Meyers et al 1998
Wesely and Hicks 2000 Wu et al 2003 Zhang et al 2003)or are being proposed for implementation (Wu et al 2009Zhang et al 2010 Massad et al 2010 in the case of NH3)and these can also be used to interpret micrometeorologicalfield flux measurements These models have been parame-terised on the basis of measured field flux data but specificexchange processes and pathways are still poorly understoodand their parameterisations remain crude and largely empir-ical Also model development has taken place in differ-ent countries or continents with different land uses atmo-spheric chemistry climates so that parameterisations derivedfrom field data may not be universally valid Model develop-ment and validation tended originally to happen in paralleland be selective (rather than inclusive) in the flux datasetsthat were used in support This was partly due to the verycomplex and varied responses of ecosystems as receptors (orsources) of atmospheric pollutants observed in the few avail-able datasets which could not easily be reconciled and com-bined into a unified coherent and fully mechanistic theoryThis explains to some extent the very different existing pa-rameterisations With the increasing though still limitedavailability of Nr flux datasets the knowledge and mecha-nistic understanding of surface -atmosphere exchanges grewover time leading to increasing model complexity (big-leafto multi-layer dry deposition to bi-directional fixed resis-tances to process-oriented) Still much variation in dry de-position estimates may be expected between models hintingthat uncertainties remain rather large
In 2006 the EU-sponsored NitroEurope Integrated Project(NEU for short) established a continent-wide network of 55sites to monitor monthly ambient inorganic Nr concentra-tions over a large range of ecosystems and to estimate drydeposition fluxes using inferential techniques (Sutton et al2007 Tang et al 2009) with the final aim to interpret CO2and greenhouse gas exchange across the network in relationto atmospheric Nr inputs The primary objective of this pa-per is to provide an ensemble average estimate of Nr dry de-position for monitoring sites across the network based onmeasured concentration data from the first two years of theproject (2007ndash2008) and obtained by running four existingdry deposition schemes at the ecosystem scale
A secondary objective of this study is to explore the differ-ences in their output of modelled dry deposition and in theirresponses to input data given the comprehensive dataset andwide range of vegetation types meteorological conditionsand pollution climates described by all monitoring sites Analternative type of model intercomparison would focus onidentifying the origin of the differences ie the extent towhich differences in model formulations and parameterisa-tions contribute to the overall differences between dry depo-sition models (eg Schwede et al 2011) Such an extensiveanalysis is beyond the scope of the present paper however asthis study cannot accommodate all the comparisons of eachresistance term and their formulations for four models andfive major Nr species Instead the four routines are broadly
Atmos Chem Phys 11 2703ndash2728 2011 wwwatmos-chem-physnet1127032011
C R Flechard et al Dry deposition of reactive nitrogen to European ecosystems 2705
described and compared with a view to point out the ma-jor similarities and differences in the approaches adopted byeach model We focus on the end products of the modelsie deposition velocities and fluxes (Sect 31) the differ-ences in which can be viewed as measures of current un-certainties in dry deposition estimates from inferential net-works In addition comparisons with long-term measuredflux datasets (Sect 33) also provide scope for identifyingpriority areas of potential improvements
2 Materials and methods
21 Dry deposition models
The four dry deposition routines implemented in this studywhich are currently used as modules within chemical trans-port models (CTMs) at national or continental scales in Eu-rope and N America include the UK CBED scheme (Smithet al 2000 Vieno 2005) the Dutch IDEM model (Bleekeret al 2004 Erisman et al 1994 van Jaarsveld 2004) thedry deposition module of the Environment Canada model(Zhang et al 2001 2003) termed ldquoCDRYrdquo here and thesurface exchange scheme of the EMEP model used underthe CLRTAP (Simpson et al 2003 see also Tuovinen etal 2009 and refs therein) It should be noted that here weuse the deposition module of EMEP version rv31 as doc-umented in Simpson et al (2003) The latest code (rv37Simpson et al 2010) carries a considerably different formu-lation for aerosol deposition but is still undergoing testingTo distinguish these schemes we refer to the rv31 version asEMEP-03
Note that the ecosystemfield-scale (inferential) applica-tion of dry deposition models which is the topic here shouldnot be confused with regional (CTM) implementations of thesame models For the CTM versions of the models in whichthe dry deposition schemes are embedded the spatial pat-terns of dispersion transport chemistry and wet and dry de-position as well as the whole regional mass balance of pollu-tants are computed using input meteorological data from nu-merical weather prediction (NWP) models prescribed emis-sions and land-use data In the present application how-ever the dry deposition routines are decoupled from any re-gional framework they are driven instead at each individualsite of the NEU network by local (field-scale) measurementsof atmospheric concentrations turbulence and meteorologyThus deposition estimates that are provided in this paper forany of the 4 models refer by default to ldquolocalrdquo or ecosystem-scale runs of the dry deposition routines rather than to thegrid square average (eg 50times 50 km) that could be providedby the CTM version (unless otherwise specified) Conse-quently this analysis only assesses the parameterisations ofthe dry deposition models and not the ability of their respec-tive CTM frameworks to predict meteorology concentrationsor the built-in representations of vegetation characteristics
211 Trace gases
The surface-vegetation-atmosphere transfer (SVAT) modelsuse broadly similar resistance frameworks for pollutant tracegas exchange In its simplest form the dry deposition fluxFχ is given as the product of concentration at the referenceheight χ(zref) by the deposition velocity at the same levelVd(zref)
Fχ = minusχ (zref)timesVd(zref) (1)
with by convention negative fluxes denoting deposition andVd the inverse sum of resistances in series
Vd(zref) = [Ra(zrefd +z0)+Rb+Rc]minus1 (2)
The atmospheric aerodynamic resistance notedRa(zref d +
z0) or Ra(zref) for short characterises the efficiency of tur-bulent transfer from a reference heightzref in the surfacelayer down tod + z0 d being the displacement height andz0 being the momentum roughness length the quasi-laminarsublayer resistance (Rb) accounts for the transfer across aviscous pseudo-laminar sub layer in the immediate vicinityof the vegetation or soil surface and the surface or canopyresistance (Rc) characterises the surface affinity for pollu-tant uptake (Baldocchi et al 1987 Monteith and Unsworth1990 Seinfeld and Pandis 2006) Mathematical expressionsfor Ra andRb are well documented the method of calcu-lation is very similar in the models and the reader is re-ferred to the literature for the various formulations The maindifferences between dry deposition models reside in the pa-rameterisations forRc Differences inRa andRb do arisebetween models due to eg the use of marginally differentatmospheric stability corrections different assumptions re-garding the viscous sublayer and above all due to the modeldefault value forz0 which controls the magnitude of frictionvelocity (ulowast) The CBED model does not actually computestability corrections forRa based on the postulate that neu-tral conditions largely prevail over the windy British Isles(Smith et al 2000) For the sake of model comparabilityhowever they are included here in the base runs of the CBEDmodule and computed in an identical fashion to the EMEP-03 scheme Alternative runs of the CBED model in whichthe stability corrections were not implemented are comparedwith the base runs in Fig A3 of the Supplement publishedonline showing that stability corrections have little impacton annually averaged modelled fluxes
The canopy resistance for vegetated surfaces results froma network of sub-resistances within the canopy (Seinfeld andPandis 2006) with foliar stomatal (Rs) mesophyll (Rm)and non-stomatal (Rns) or cuticular (Rcut) or water film (Rw)
or external (Rext) resistances as well as non foliage termseg the soil or ground surface resistance (Rgr) Most mod-els (EMEP-03 IDEM CDRY) also include an in-canopyaerodynamic resistance (Rac) acting between the assumedbig-leaf and ground surface while the CBED approach is
wwwatmos-chem-physnet1127032011 Atmos Chem Phys 11 2703ndash2728 2011
2706 C R Flechard et al Dry deposition of reactive nitrogen to European ecosystems
strictly single-layered The main sub-resistances ofRc arebriefly presented here for details the reader is referred to theoriginal publications Note that all resistances are expressedin s mminus1 by default throughout this paper
Gaseous transfer through stomata
Stomatal resistances to gaseous transfer are typically derivedin the different models using a light-response function of thegeneric type (Jarvis 1976)
Rs= Rsmin
[1+
bprime
Ip
](fefwfT fs) (3)
Here Ip is light intensity taken either as the photosynthet-ically active radiation (PAR) or global radiation (St ) as itsproxybrsquo is an empirical constantRsmin is a minimum valueof the stomatal resistance to water vapour withbrsquo andRsmintaking characteristic values for each vegetation type or landuse the correction factorsfe fw andfT account for the ef-fects of increasing vapour pressure deficit (vpd) plant waterstress and temperature respectively (Jarvis 1976) Thefwfactor is set to 1 in all models except in CDRY where it isactually parameterised as a function of global radiation Thefe function is also set to 1 in CBED The last factorfs is ascaling factor to account for the difference in molecular dif-fusivity between water vapour and the trace gas consideredFor the EMEP-03 model the light response term is differentand a further factor for phenology is also included (Embersonet al 2001 Simpson et al 2003)
Note thatRs in Eq (3) is expressed on a unit leaf area (pro-jected) basis or equivalent to a unity leaf area index (LAI)All models except IDEM split PAR into its direct and diffusefractions and compute the sunlit and shaded components ofLAI such that total (or bulk) stomatal resistance is calcu-lated from sunlit and shaded resistances weighted by theirrespective LAI fractions (Baldocchi et al 1987) Thus inCBED CDRY and EMEP-03 the bulk stomatal conductanceGs (=inverse of bulk stomatal resistance) does not increaselinearly with total LAI but tends to saturate for larger LAIlevels By contrast IDEM uses by default a simplified ver-sion in which LAI is not split into sunlit and shaded frac-tions but whereGs is proportional to total LAI TheRs rou-tine by Wesely et al (1989) which only requires global ra-diation and surface temperature as input may be used as anoption in IDEM when land use and vegetation characteristicsare not well known
Non-stomatal resistances
Although non-stomatal pathways either on leaf cuticles orother non-foliar surfaces (stems bark ground etc) providean important and often dominant sink for atmospheric gaseson an annual basis (Fowler et al 2001 2009 Flechard etal 1998) there are as yet no consensual generic and fully
mechanistic parameterisations for non-stomatal resistanceswhich are variously termedRns Rext Rw Rcut Rgr in differ-ent models This is partly due to the much greater technicaland methodological difficulties and larger uncertainties in-volved in measuring trace Nr gas (eg NH3 HNO3 HONOPAN) fluxes let alone non-stomatal resistances and also dueto the resulting relative scarcity of reliable field observationsas compared with water vapour fluxes andGs Also in addi-tion to the many environmental factors that have been shownor surmised to be involved in the control of non-stomatalresistances (eg wetness temperature vegetation type pol-lution climate soil pH leaf surface chemistry) it appearsthat hysteresis or ldquomemoryrdquo effects control the rate of chargeor discharge of the surface Nr pool espcially in the case ofNH3 (Sutton et al 1998 Flechard et al 1999 Neirynckand Ceulemans 2008 Burkhardt et al 2009 Wichink Kruitet al 2010) challenging the applicability of a (static) resis-tance approach
For NH3 the four models use widely different empiricalschemes for non-stomatal resistances reflecting the spreadin mean values and functional relationships found in the lit-erature This is consistent with the different ecosystems andpollution climates in which the original NH3 flux measure-ments were made (Nemitz et al 2001 Massad et al 2010)CBED actually uses a constantRc of 20 s mminus1 for forests andmoorland while for grasslands and crops the followingRwfunction is implemented (Smith et al 2000)
RwCBED= 10log10(Ts+2)timesexp
(100minusRH
7
)(4)
with Ts surface temperature (C) and RH surface relativehumidity (in ) In frozen conditionsRw takes a con-stant value of either 1000 s mminus1 (Tslt minus5C) or 200 s mminus1
(minus5Clt Tslt 0C) The EMEP-03 model uses the same ba-sic formula EMEP-03rsquosF1 factor is the same asRw (CBED)but then modulatesRw by a correction factorF2 such that(Simpson et al 2003)
F2 = 00455times10(minus11099timesaSN+16769) (5)
Rns(EMEPminus03)=min[200max[2Rw(CBED)timesF2]] (6)
whereaSN is the ratio of atmospheric SO2 to NH3 mixing ra-tios F2 was quantified following the synthesis by Nemitz etal (2001) who showed thatRext observations across 8 UKand Dutch sites declined exponentially withaSN thus sup-porting the co-deposition hypothesis (Erisman and Wyers1993) that surface NH3 uptake was most efficient (ieRextwas smallest) at sites with a relative abundance of atmo-spheric SO2
The Rext parameterisation for NH3 in IDEM also uses afunctional dependence on RH (Eq 7) although this is oftensupplanted by default values in given circumstances relatedto land use season snow cover surface wetness and surfaceacidity as quantified by the proxyaSN (Erisman et al 1994
Atmos Chem Phys 11 2703ndash2728 2011 wwwatmos-chem-physnet1127032011
C R Flechard et al Dry deposition of reactive nitrogen to European ecosystems 2707
Bleeker et al 2004) DefaultRext values range from typi-cally 10ndash20 s mminus1 in forests moorland crops and ungrazedpasture in wet conditions to 200ndash1000 s mminus1 in fertilisedsystems in dry summer night-time (Bleeker et al 2004)
Rext(IDEM) = 19257timesexp(minus0094timesRH)+5 (7)
In CDRY explicit and specific parameterisations ofRcut existonly for SO2 and O3 as functions of leaf wetness (dry vs wetdew vs rain) relative humidity leaf area index and frictionvelocity Values ofRcut for other gases are calculated as mul-tipliers of Rcut(SO2) or Rcut(O3) or a combination of bothFor NH3 Rcut is taken to be identical to that for SO2 in boththe wet (Eq 8a) and dry (Eq 8b) cases
Rcutw(CDRY) =Rcutw0
ulowast timesLAI 05(8a)
Rcutd(CDRY) =Rcutd0
exp003timesRHulowast timesLAI 025(8b)
with Rcutw0 and Rcutd0 being land-use specific referencevalues (Zhang et al 2003)
For HNO3 the scarcity of field flux measurements to datemeans that there are few data from which to derive parame-terisations and two models use near-zeroRc values in mostcases (CBED EMEP-03) By contrast IDEM implementsa substantialRc of 10 s mminus1 by default and of 50 s mminus1 forfrozen or snow-covered surfaces while CDRY modelsRcut(HNO3) on the basis of the reference values for SO2 and O3(Zhang et al 2003) resulting inRc values that are an orderof magnitude smaller than those for SO2 For HONO thereare even less data available and it is only treated by CDRYusing anRw value a factor 5 larger than that for HNO3
Nitrogen dioxide exchange is assumed by all models to beexclusively downward (deposition only) and mostly (CDRYEMEP-03 IDEM) or entirely (CBED) controlled by stomatalopening In the EMEP-03 model however NO2 dry deposi-tion is switched off whenever the ambient concentration fallsbelow 4 ppb This reflects the pseudo compensation point be-haviour of NO2 exchange due to NO emissions from the soiland conversion within plant canopies to NO2 through reac-tion with O3 that leads to net (NOx) emissions in the field atsmall ambient concentrations (Simpson et al 2003)
212 NH3 compensation point modelling
One exception to the deposition-only (Rc) paradigm preva-lent in surfaceatmosphere Nr exchange modelling is the bi-directional canopy compensation point approach for NH3(Sutton et al 1998) implemented in the CBED modelfor crops and grass land use classes (LUC) (Smith et al2000) Here a non-zero canopy-equivalent potential termedthe canopy compensation pointχc determines the directionand sign of the flux when compared with the atmosphericconcentrationχ(zref) such that
Fχ = minusχ (zref)minusχc
Ra(zref)+Rb(9)
The canopy compensation point is a function of and quan-tifies the net bulk effect of all source and sink terms withinthe canopy but it is also a weak function of the atmosphericconcentrationχ(zref) itself (Nemitz et al 2000a) In CBEDa basic version is implemented where the stomatal compen-sation point (χs) provides the only potential NH3 source thedissolved NH3 and NH+
4 pool in the apoplast of sub-stomatalcavities (Farquhar et al 1980 Schjoslasherring et al 1998 Mas-sad et al 2008) being mediated by the stomatal resistanceRs while Rw characterises the sink strength of non-stomatalfoliar surfaces Other mechanistic models (eg Nemitz et al2000a b 2001 Personne et al 2009) consider additionalNH3 sources in eg seed pods of oilseed rape and in the leaflitter and soil under winter wheat and grassland Such ap-proaches have not been implemented in CTMs to date partlybecause this would require detailed (and generally unavail-able) knowledge of sub-grid variations in NH3 concentra-tions vegetationcrop type and fertilisation practices
The stomatal compensation point in CBED is calculatedfollowing Eq (11) assuming an apoplastic pH of 68 andintercellular NH+
4 concentration of 600 micromol lminus1 ie anapoplastic0s ratio (=[NH+
4 ][H+]) of 3785
χs=Ka(Ts)
Kh(Ts)0s (10)
with Ka(Ts) the dissociation constant of NH3 in water (Batesand Pinching 1950) andKh(Ts) the Henry coefficient forNH3 (Dasgupta and Dong 1986) The canopy compensationpoint itself is given as (Sutton et al 1998)
χc=χ(zref)
[Ra(zref)+Rb] +χsRs
[Ra(zref)+Rb]minus1+Rminus1
s +Rminus1w
(11)
The canopy compensation point approach described here isapplicable to crops and grasslands only outside periods ofmineral or organic fertilisation during which NH3 emissionis governed by very different mechanisms (see Sect 233)
213 Aerosol deposition
Aerosol dry deposition fluxes are computed as the product ofair particle concentration by deposition velocity (Eq 1) Pa-rameterisations for aerosolVd range from the strongly mech-anistic to the fully empirical depending on the model andthe ion species considered The 2003 version of the unifiedEMEP model (EMEP-03) the CDRY scheme and to someextent the IDEM model are originally based on Slinnrsquos ap-proach (Slinn 1982) but have distinctly different featuresIn EMEP-03Vd is calculated as (Simpson et al 2003)
Vd(zref) =1
Ra(zref)+Rb+[Ra(zref)timesRbtimesVg
] +Vg (12)
whereVg is the gravitational settling (or sedimentation) ve-locity (Seinfeld and Pandis 2006) calculated as a function of
wwwatmos-chem-physnet1127032011 Atmos Chem Phys 11 2703ndash2728 2011
2708 C R Flechard et al Dry deposition of reactive nitrogen to European ecosystems
particle diameter (Dp) andRb is calculated from explicit for-mulations from the literature that are particle size- and vege-tationland use-dependent
By contrast CDRY does not explicitly computeRb butuses an overall surface resistance (Rsurf) concept such that(Zhang et al 2001)
Vd(zref) =1
Ra(zref)+Rsurf+Vg (13)
Rsurf=1
ε0ulowastR1(EB +EIN +EIM )(14)
whereε0 is an empirical constant andR1 the fraction of par-ticles that stick to the surface Parameters used to calculateaerosol collection efficienciesEB (Brownian diffusion)EIN(interception) andEIM (impaction) are land-use and season-dependent
In IDEM the deposition velocity for particulate NH+4 andNOminus
3 is calculated according to Wesely et al (1985) forshort vegetation and other areas with a momentum rough-ness length smaller than 05 m For forests and other areaswith z0 gt 05 m the scheme by Ruijgrok et al (1997) is usedsuch that
Vd(zref) =1
Ra(zref)+V minus1ds
+Vg (15)
Vds= Eu2
lowast
Uhc(16)
with Vds the surface deposition velocityE the overall collec-tion efficiency andUh the wind speed at canopy height (hc)It can readily be seen thatVds is equivalent toRminus1
surf of CDRY(Eq 13) but Ruigrok et al (1997) derived simplified rela-tionships for the overall collection efficiencyE andVds forthe chemical species NH+4 SO2minus
4 NOminus
3 and Na+ and otherbase cations under various conditions For RHlt 80E is ofthe form
E = αuβlowast (17)
where the empirical constantsα andβ are chemical species-and surface wetness-dependent For relative humidity above80 they introduce a dependence on relative humidity toaccount for the observed increasedVds with growing parti-cle diameter (Dp) In IDEM the calculation scheme for thesettling velocityVg (implemented for large particles only)is similarly simplified Note that gravitational settling is in-cluded conceptually in Eqs (13) (14) and (16) although itis negligible for the fine aerosol fraction (aerodynamic diam-eterlt1 microm) where most of NH+4 and NOminus
3 mass is likelyfound and only becomes relevant for coarse particles
The CBED model currently calculates NH+
4 NOminus
3and SO2minus
4 aerosol deposition velocities using a simpleempirically-derived scheme wherebyVd is the product ofulowast times a tabulated land use- and chemical species-specific
constant (α) The parameterα is of the order of 0005for grassland and semi-natural vegetation of 001 for arableland and of 002ndash003 for forests (forulowast andVd expressedin the same unit eg m sminus1) alsoα(NOminus
3 ) is 49 36 and60 larger thanα(NH+
4 ) for grasslandsemi-natural arableland and forests respectively (R I Smith and E NemitzCEH Edinburgh unpublished data) Theseα values werederived by weighting measured curves ofVd(Dp)ulowast overdifferent ecosystems (Gallagher et al 1997 Nemitz et al2002 Joutsenoja 1992) with typical size-distributions of ni-trate and ammonium
22 NitroEurope inferential network sites
Reactive nitrogen dry deposition was estimated by field-scaleinferential modelling at the 55 monitoring sites of the Ni-troEurope network (Sutton et al 2007 Tang et al 2009)where all necessary input data including Nr atmosphericconcentrations meteorological andor micrometeorologicaldata were available for the two years 2007ndash2008 or atleast one full year The network included 29 forest (F)stations 9 semi-natural short vegetation ecosystems (SN)eg semi-arid steppe alpine or upland grasslands moorlandsand fens 8 fertilised productive grasslands (G) and 9 crop-land (C) sites (Table 1) All NEU inferential sites with theexception of DE-Hoe FI-Lom NL-Spe and UA-Pet werealso CO2 flux monitoring stations of the EU-funded Car-boEurope Integrated Project (httpwwwcarboeuropeorg)which aimed at an assessment of the European terrestrial car-bon balance (Dolman et al 2008) Sites locations and veg-etation characteristics are summarised in Table 1 as well asin Fig A1 of the online Supplement details and photographsmay be obtained from the CarboEurope-IP database (httpgaiaagrariaunitusitdatabasecarboeuropeip) or from thelist of selected references provided in Table A1 of the Sup-plement The study sites were distributed across Europefrom Ireland to Russia and from Finland to Portugal withmean annual temperatures ranging fromminus01C (FI-Lom)to 178C (ES-ES1) and mean annual rainfall ranging from464 mm (UA-Pet) to 1450 mm (IE-Dri) Sites elevationsrange fromminus2 m amsl (NL-Hor) to 1765 m amsl (ES-VDA) Measured maximum canopy heights (hc) and LAI areon average 202 m49 m2 mminus2 for forests 08 m32 m2 mminus2
for semi-natural vegetation 04 m55 m2 mminus2 for grasslandsand 18 m70 m2 mminus2 for crops
23 Input data and model implementation
231 Ecosystem and micrometeorological data
For a detailed description of the management of input dataand model implementation at the ecosystem scale for allNEU monitoring sites the reader is referred to the onlineSupplement Briefly the model base runs used measured val-ues ofhc as inputs whereas for LAI inputs the model default
Atmos Chem Phys 11 2703ndash2728 2011 wwwatmos-chem-physnet1127032011
C R Flechard et al Dry deposition of reactive nitrogen to European ecosystems 2709
Table 1 NitroEurope inferential network monitoring sites1
Site Site Land use LU2 Lat Long Altitude Temp Rainfall h3c LAI 4
Code Name Dominant vegetation N E m amsl C mm m m2 mminus2
BE-Bra Brasschaat Scots pine pedunculate oak F 5131 452 16 112 770 22 2BE-Vie Vielsalm Eur beech coast douglas fir F 5031 600 450 84 1000 30 5CH-Lae Laegeren Ash sycamore beech spruce F 4748 837 689 76 1100 30 6CZ-BK1 Bily Kriz Norway spruce F 4950 1854 908 83 1200 13 9DE-Hai Hainich Eur beech maple ash F 5108 1045 430 87 775 33 7DE-Hoe Hoglwald Norway spruce F 4830 1110 540 78 870 35 6DE-Tha Tharandt Norway spruce scots pine F 5096 1357 380 92 820 27 8DE-Wet Wetzstein Norway spruce F 5045 1146 785 67 950 22 8DK-Sor Soroe Eur beech F 5549 1165 40 90 730 31 5ES-ES1 El Saler Aleppo pine stone pine macchia F 3935minus032 5 178 551 10 3ES-LMa Las Majadas Open holm oak shrubs F 3994minus577 258 158 528 8 1FI-Hyy Hyytiala Scots pine F 6185 2430 181 48 709 14 7FI-Sod Sodankyla Scots pine F 6736 2664 180 07 499 13 1FR-Fon Fontainbleau Oak F 4848 278 92 113 690 28 5FR-Hes Hesse Eur beech F 4867 707 300 103 975 16 5FR-LBr Le Bray Maritime pine F 4472 minus077 61 129 972 22 3FR-Pue Puechabon Holm oak F 4374 360 270 137 872 6 3IT-Col Collelongo Eur beech F 4185 1359 1560 75 1140 22 7IT-Ren Renon Norway spruce stone pine F 4659 1143 1730 49 1010 29 5IT-Ro2 Roccarespampani Turkey oak downy oak F 4239 1192 224 151 876 17 4IT-SRo San Rossore Maritime pine holm oak F 4373 1028 4 152 920 18 4NL-Loo Loobos Scots Pine F 5217 574 25 104 786 17 2NL-Spe Speulderbos Douglas fir Jap larch Eur Beech F 5225 569 52 97 966 32 11PT-Esp Espirra Eucalyptus coppice F 3864minus860 95 162 709 20 5PT-Mi1 Mitra II (Evora) Cork oak F 3854 minus800 264 154 665 7 3RU-Fyo Fyodorovskoye Norway spruce F 5646 3292 265 53 711 21 3SE-Nor Norunda Norway spruce scots pine F 6008 1747 45 70 527 25 5SE-Sk2 Skyttorp Scots pine Norway spruce F 6013 1784 55 55 527 14 3UK-Gri Griffin Sitka Spruce F 5662 minus380 340 78 1200 9 8
DE-Meh Mehrstedt Afforestated grassland SN 5128 1066 293 85 547 05 29ES-VDA Vall drsquoAliny a Upland grassland SN 4215 145 1765 71 1064 01 14FI-Lom Lompolojankka Sedge fen SN 6821 2435 269 minus01 500 04 10HU-Bug Bugac Semi-arid grassland SN 4669 1960 111 108 500 05 47T-Amp Amplero Grassland SN 4190 1361 884 96 1365 04 25IT-MBo Monte Bondone Upland grassland SN 4603 1108 1550 55 1189 03 25NL-Hor Horstermeer Natural fen (peat) SN 5203 507 minus2 108 800 25 69PL-wet POLWET Wetland (reeds carex sphagnum) SN 5276 1631 54 89 550 21 49UK-AMo Auchencorth Moss Blanket bog SN 5579 -324 270 76 798 06 21
CH-Oe1 Oensingen Cut Grassland G 4729 773 450 94 1200 06 66DE-Gri Grillenburg Cut Grassland G 5095 1351 375 90 861 07 60DK-Lva Rimi Cut Grassland G 5570 1212 8 92 600 05 35FR-Lq2 Laqueuille Grazed Grassland G 4564 274 1040 75 1100 02 24IE-Ca2 Carlow Grazed Grassland G 5285 -690 56 94 804 02 57IE-Dri Dripsey Grazed Grassland G 5199minus875 187 96 1450 05 40NL-Ca1 Cabauw Grazed Grassland G 5197 493 minus1 111 786 02 99UK-EBu Easter Bush Grazed Grassland G 5587minus321 190 90 870 02 55
BE-Lon Lonzee Crop rotation C 5055 474 165 91 772 09 6DE-Geb Gebesee Crop rotation C 5110 1091 162 101 492 10 55DE-Kli Klingenberg Crop rotation C 5089 1352 478 81 850 22 50DK-Ris Risbyholm Crop rotation C 5553 1210 10 90 575 10 46FR-Gri Grignon Crop rotation C 4884 195 125 111 600 24 62IT-BCi Borgo Cioffi Crop rotation C 4052 1496 20 164 490 30 73IT-Cas Castellaro MaizeRice rotation C 4506 867 89 132 984 28 49UA-Pet Petrodolinskoye Crop Rotation C 4650 3030 66 101 464 06 42UK-ESa East Saltoun Crop rotation C 5590minus284 97 85 700 na5 na
1 See Table A1 in the online Supplement for literature references for each site2 Land useecosystem type F forest SN semi-natural short vegetation G grassland (G) C cropland3 Canopy height mean tree height for F annual maximum value for SN G and C4 Leaf area index annual maximum the measurement type (single-sided projected total) is not specified5 ldquonardquo not available
wwwatmos-chem-physnet1127032011 Atmos Chem Phys 11 2703ndash2728 2011
2710 C R Flechard et al Dry deposition of reactive nitrogen to European ecosystems
values were used preferentially due to the uncertainties inmeasured estimates of LAI A comparison of model defaultvalues of LAI andhc with actual measurements is shown inFig 1c and d
For ulowast and sensible heat flux (H) actual measurementsfrom EC datasets at each site were used whenever possibleand data were otherwise gap-filled from standard meteoro-logical data (cf Sect A3 in Supplement) Measurements ofcanopy wetness were available at very few sites and thusa dynamic surface wetness energy balance model was cou-pled to the modelling framework for most sites a compari-son with actual measurements is shown in Sect A5 of Sup-plement
Alternative model runs were computed to investigate thesensitivity of annual fluxes to input values ofhc and LAIand to surface temperature and relative humidity as detailedin Sects A2 and A4 of the Supplement with the character-istics of the base and sensitivity runs being summarised inTable A2 therein
232 Atmospheric Nr concentration data
Pollutant monitoring by denuder and filter sampling
Ambient Nr concentrations of gaseous NH3 HNO3 andHONO and aerosol NH+4 and NOminus
3 were monitored monthlyat the 55 sites of the inferential network from early 2007 on-wards using DELTA systems (DEnuder for Long-Term At-mospheric sampling described in detail in Sutton et al 2001and Tang et al 2009) (Table 2) Briefly the DELTA sam-pling ldquotrainrdquo consists of two coated borosilicate glass de-nuder tubes in series for scrubbing acidic trace gases (HNO3SO2 HCl HONO) followed by two denuders for NH3 andfinally by a filter-pack assembly with a first impregnated fil-ter to capture aerosol phase anions (NOminus
3 SO2minus
4 Clminus) aswell as base cations (Na+ Mg2+ Ca2+) and a second fil-ter to collect the evolved particulate NH+
4 Air is sampled ata rate of 03ndash04 l minminus1 and directly into the first denuderwith no inlet line to avoid sampling losses Denuders foracid gases and filters for aerosol anions and base cationsare coatedimpregnated with potassium carbonateglycerolwhile for gaseous NH3 and aerosol NH+4 citric acid or phos-phorous acid is used The empirically determined effectivesize cut-off for aerosol sampling is of the order of 45 microm(E Nemitz unpublished data)
The DELTA sampling trains were prepared and as-sembled in seven coordinator laboratories (CEAM SpainCEH United Kingdom FALvTI Germany INRA FranceMHSC Croatia NILU Norway and SHMU Slovakia)sent out to the inferential sites for monthly field exposurethen sent back to the laboratories for denuderfilter extractionand analysis The DELTA systems thus provided monthlymean ambient Nr concentrations for each site of the networkthis paper dealsunless otherwise stated with the data col-
lected during the first two years (2007ndash2008) of the wholemonitoring period (2007ndash2010)
To ensure comparability of data provided by the differ-ent laboratories DELTA intercomparison campaigns werecarried out at yearly intervals at selected sites as part of adefined QAQC programme whereby seven sample trains(one provided by each laboratory) were exposed side by sidefor a month and then extracted and analysed by each lab-oratory (Tang et al 2009) In addition to this full inter-comparison exercise in which the whole sample train man-agement (preparation coating impregnation assembly dis-patching exposure field handling extraction analysis) wastested each laboratory also regularly received synthetic solu-tions for ldquoblindrdquo analysis from three chemical intercompari-son centres CEH Scotland EMEPNILU Norway and theGlobal Atmospheric Watch program (GAW) of the WMOThe results of the first DELTA intercomparisons were pre-sented in Tang et al (2009) an in-depth analysis of the fullconcentration dataset will be published in a companion paper(Tang et al 2011)
In addition to the monthly denuder and filter Nr concentra-tion data provided by DELTA systems ambient NO2 concen-trations were monitored by chemiluminescence on an hourlyor half-hourly basis at a number of sites (BE-Bra FI-Hyy IT-Ren NL-Spe FI-Lom HU-Bug UK-AMo CH-Oe1 UK-EBu FR-Gri IT-Cas) Although NO2 concentrations werenot measured at all sites and although NO2 measurementsbased on a conversion to NO by molybdenum convertersfollowed by O3 chemiluminescence are known to be biasedhigh due to interferences by PAN and HNO3 (Steinbacher etal 2007) the available data are useful to assess the likelymagnitude of ecosystem NO2 uptake relative to total Nr drydeposition and the variability between model predictions forNO2 deposition For the remaining sites mean modelledNO2 concentrations from the EMEP 50 kmtimes 50 km modeloutput for the year 2004 were used
Aerosol size distribution
The extraction of DELTA filters yielded total aerosol con-centrations as the fractions of fine vs coarse aerosols couldnot be determined for each of NH+
4 NOminus
3 or other chemi-cal species For the two aerosolVd schemes (CBED IDEM)that do not explicitly model aerosol size-dependent deposi-tion velocities but instead calculate a species-specific meanVd across the aerosol size range this was not an issue How-ever in both the EMEP-03 and CDRY models aerosolVdis a function of particle diameterDp In EMEP-03 two de-position velocities are calculated one for each of fine (Dp =
03 microm) and coarse (Dp = 4 microm) aerosols independent of thechemical species considered In CDRY species-specific val-ues of the geometric mean mass diameter (DG) and geo-metric standard deviation (GSD) are attributed to both fineand coarse aerosol modes and two log-normal particle size
Atmos Chem Phys 11 2703ndash2728 2011 wwwatmos-chem-physnet1127032011
C R Flechard et al Dry deposition of reactive nitrogen to European ecosystems 2711
distributions are generated on the basis of DG and GSD onefor each mode In both models therefore the fine and coarsefractions of the total aerosol loading measured on the DELTAfilters need to be estimated so that modelledVd is appliedto the concentration in the appropriate size range In theCTM versions of EMEP-03 and CDRY fine and coarse frac-tions are calculated dynamically within the regional chemicalmodel but in the present local-scale application such data arenot available By default and in a first approximation fineaerosol was assumed to account for 94 of total NH+
4 and81 of total NOminus
3 following Ruijgrok et al (1997) realis-ing that in reality this ratio will be site specific especially forNOminus
3 (Zhang et al 2008 Torseth et al 2000) which has alarger contribution from coarse NaNO3 at coastal sites
Corrections for within-canopy concentration data
At most sites of the NEU network air sampling by DELTAsystems provided concentrations at least 1 m above thecanopy However at 10 forest sites (BE-Vie DE-Hai DE-Tha ES-ES1 ES-LMa FI-Sod IT-Ren PT-Mi1 SE-NorSE-Sk2) the DELTA system was actually set up in a clear-ing or in the trunk space typically 15 to 2 mabove the forestfloor This was for practical reasons mostly to facilitate thesafe exchange of sampling trains in challenging winter con-ditions or windy weather The inferential method requires at-mospheric concentrations and turbulence intensity above thecanopy to predict rates of dry deposition to the forest andthus the validity of clearing or below-crown concentrationsas proxies of above-canopy concentrations can be questionedand needs to be examined (Zhang et al 2009 Tuovinen etal 2009) There are very few published within-canopy (ver-tical) NH3 and HNO3 concentration profiles in the literaturefor forests Within-canopy profile data for NH3 have beenobtained mostly in grasslands (Nemitz et al 2009) and cropssuch as oilseed rape (Nemitz et al 2000b) and maize (Bashet al 2010) These data showed consistently larger concen-trations near the ground and below canopy compared withabove the canopy indicative of NH3 sources in the groundand in the leaf litter as well as within the canopy itself es-pecially following fertilisation In forests however soil andleaf litter are less likely to be strong NH3 emitters due to agenerally smaller pH andor N limitations compared with fer-tilised systems and we assume in this study that deposition tothe forest floor prevails We consequently surmise that NH3concentrations measured in clearings and below canopy areconsistently smaller than above treetops in a similar fash-ion to the SO2 and HNO3 data obtained at the Oak Ridgesite of the US AIRMoN inferential network (Hicks 2006)There the towerclearing concentration ratio was on average126 for SO2 134 for HNO3 and 107 for particulate SO2minus
4 There were seasonal variations in the towerclearing ratio es-pecially for SO2 and HNO3 with generally larger values (upto 14ndash15) in the second half of the year and annual lows
(11ndash12) in late winter which were attributed to changes inLAI of the mixed forest although it was concluded that notenough data were available as yet to derive robust correc-tions based on LAI In a first approximation we thus applieda constant correction factor of 13 to NH3 and HNO3 con-centrations measured in clearings or below trees at the afore-mentioned sites for particulate NH+
4 and NOminus
3 we used acorrection factor identical to the mean SO2minus
4 towerclearingratio of 107 reported by Hicks (2006)
233 Modelling and integrating annual fluxes
The inferential models were run on a half-hourly time stepwhich was the frequency of input micrometeorological datain the CarboEurope IP database The atmospheric and sur-face resistance terms the NH3 compensation points (whereapplicable) and the aerosol deposition velocities were com-puted whenever all necessary input data were available forthe 2-year period 2007ndash2008 Half-hourly fluxes were cal-culated from half-hourly exchange parameters (Vd χc) andmonthly gasaerosol DELTA concentrations or hourly datain the case of measured NO2 Note that for the monthlyDELTA data none of the diurnal or day-to-day variations inconcentrations were known except at very few sites whereintensive high resolution measurements were made poten-tial correlations on daily time scales between concentrationandVd could lead to significant systematic bias in the mod-elled fluxes at some sites (Matt and Meyers 1993) but thiswas not investigated here
For cases when all input data were available through-out the 2-year measurement period the monthly and annualfluxes can simply be obtained by adding up all modelledhalf-hourly fluxes In practise however there were at mostsites periods of a few hours to a few days or weeks duringwhich at least one key variable (such as windspeed tempera-ture or relative humidity) was missing eg due to instrumentmalfunction breakdown power cuts or theftvandalism suchthat mechanistic gap-filling for fluxes was precluded A sim-ple upscaling procedure based on the arithmetic mean of allmodelled fluxes multiplied by the total number of 30-minutetime intervals in the year potentially leads to a statisticalbias Thus the approach adopted here consists of computingfor each month the arithmetic mean diurnal cycle from allmodelled half-hourly flux data then scaling up to the wholemonth and adding up 12 monthly fluxes for the annual total
At intensively managed grassland and cropland sites of theNEU network fertilisation occurred once to several times ayear in which net NH3 emissions typically ensued over oneor several weeks and where elevated ambient NH3 concen-trations occurred as a result (eg Flechard et al 2010) Herethe modelled (inferential) NH3 flux data from the fertilisa-tion months were not included in the annual deposition totalfor any of the four models the reason being twofold firstinferential models are primarily deposition models and arenot suited to situations with large NH3 emissions eg from
wwwatmos-chem-physnet1127032011 Atmos Chem Phys 11 2703ndash2728 2011
2712 C R Flechard et al Dry deposition of reactive nitrogen to European ecosystems
Table 2 Summary of ambient Nr concentrations across the NEU inferential network (unit microg N mminus3) Data for NH3 HNO3 NH+
4 and
NOminus
3 are arithmetic means minima and maxima of 24 monthly values over the 2007ndash2008 period Data for NO2 are calculated from hourlyconcentration measurements for some sites (see text) or from modelled EMEP 50times 50 km data
NH3 HNO3 NO2 NH+
4 NOminus
3
Site Code Mean Min Max Mean Min Max Mean Min Max Mean Min Max Mean Min MaxBE-Bra 228 003 943 046 010 128 898 396 1669 134 004 389 087 001 521BE-Vie 037 009 151 013 001 031 338 nalowast na 066 012 182 053 003 306CH-Lae 114 037 255 036 026 064 249 na na 095 043 212 060 018 158CZ-BK1 051 012 095 040 021 078 275 na na 089 012 138 040 022 076DE-Hai 057 006 164 022 011 052 265 na na 094 035 186 044 017 092DE-Hoe 191 060 331 034 013 077 285 na na 102 039 257 050 020 099DE-Tha 062 011 137 028 017 060 282 na na 087 056 135 040 014 084DE-Wet 043 010 101 026 016 042 251 na na 080 043 146 043 019 083DK-Sor 132 037 474 022 006 078 247 na na 072 016 221 077 001 294ES-ES1 156 080 257 032 010 045 188 na na 090 034 194 099 052 195ES-LMa 103 052 208 023 010 050 050 na na 046 015 164 038 018 084FI-Hyy 010 002 027 009 000 016 272 091 883 019 004 052 007 001 030FI-Sod 013 000 061 004 001 012 021 na na 012 000 055 002 000 006FR-Fon 090 027 295 041 024 080 212 na na 096 038 220 068 032 159FR-Hes 089 026 242 035 021 061 199 na na 080 037 154 048 021 094FR-LBr 116 046 517 028 014 045 101 na na 058 024 140 045 026 088FR-Pue 043 012 082 023 011 052 095 na na 046 019 119 030 014 060IT-Col 042 012 098 013 005 031 111 na na 047 016 083 025 006 048IT-Ren 026 005 050 009 003 021 110 030 218 052 003 129 026 002 062IT-Ro2 183 077 751 024 013 034 086 na na 086 051 153 051 030 078IT-SRo 084 030 571 031 011 051 112 na na 090 038 193 062 031 104NL-Loo 344 099 667 027 008 051 741 na na 160 070 526 079 026 142NL-Spe 391 158 674 036 024 052 510 256 974 132 063 221 091 016 162PT-Esp 186 086 440 039 015 082 263 na na 084 045 173 051 004 093PT-Mi1 094 026 249 025 006 096 089 na na 069 024 210 038 020 088RU-Fyo 028 005 051 014 007 029 050 na na 045 018 079 015 006 031SE-Nor 022 002 068 005 001 017 066 na na 025 003 102 010 001 031SE-Sk2 016 002 095 006 002 012 063 na na 021 001 064 010 001 045UK-Gri 027 004 147 012 002 047 048 na na 039 002 176 029 003 149Mean (F) 103 032 283 024 011 051 215 125 692 073 026 175 045 015 119
DE-Meh 148 021 408 029 018 048 267 na na 112 003 166 055 020 092ES-VDA 090 007 528 012 004 049 083 na na 070 009 342 027 002 075FI-Lom 009 001 031 003 000 026 019 000 048 021 000 065 002 000 007HU-Bug 227 071 516 030 012 048 261 153 465 125 063 240 046 015 103IT-Amp 056 019 120 014 007 036 111 na na 048 025 105 022 010 040IT-MBo 074 014 184 022 012 038 177 na na 074 006 218 047 002 113NL-Hor 249 077 528 033 012 052 945 na na 137 054 297 094 043 185PL-wet 095 024 239 025 002 041 145 na na 109 042 285 046 012 113UK-AMo 063 030 122 009 003 023 145 071 246 038 009 097 023 005 056Mean (SN) 112 029 297 020 008 040 239 075 253 082 024 202 040 012 087
CH-Oe1 268 071 651 041 020 071 1089 553 1901 115 050 205 066 034 125DE-Gri 070 012 128 036 017 122 282 na na 089 049 294 047 017 189DK-Lva 126 027 371 020 002 035 247 na na 056 022 137 079 005 308FR-Lq2 111 037 181 014 006 048 065 na na 044 019 136 025 011 070IE-Ca2 156 081 304 010 004 022 075 na na 059 010 187 033 011 108IE-Dri 203 072 494 007 001 017 045 na na 053 005 224 029 005 093NL-Ca1 593 310 1079 041 025 098 945 na na 166 035 495 110 009 216UK-EBu 108 032 217 012 004 024 085 020 196 038 008 087 026 005 059Mean (G) 204 080 428 023 010 055 354 287 1048 078 025 221 052 012 146
BE-Lon 393 100 1446 029 005 047 431 na na 108 004 258 073 009 241DE-Geb 414 050 1341 025 015 033 265 na na 141 005 673 056 018 118DE-Kli 132 024 249 031 014 049 282 na na 105 061 256 053 018 194DK-Ris 432 015 1426 014 002 027 247 na na 058 001 166 044 007 090FR-Gri 316 092 1024 045 018 098 499 195 1101 094 026 256 076 030 201IT-BCi 718 258 2163 038 022 082 126 na na 312 037 1481 073 033 123IT-Cas 342 130 591 044 022 086 112 054 161 238 032 481 143 035 305UA-Pet 250 062 535 036 018 068 100 na na 144 034 952 048 021 076UK-ESa 292 080 1357 012 006 020 239 na na 071 015 318 024 010 041Mean (C) 365 090 1126 030 013 057 256 125 631 141 024 538 066 020 154
lowast ldquonardquo not available
Atmos Chem Phys 11 2703ndash2728 2011 wwwatmos-chem-physnet1127032011
C R Flechard et al Dry deposition of reactive nitrogen to European ecosystems 2713
applied fertiliser but to background conditions (Flechard etal 2010) the special case of fertiliser- or manure-inducedNH3 losses requires a different kind of modelling approach(eg Genermont and Cellier 1997) and is not consideredhere Second applying an inferential model to months whenfertilisation occurred would result in a large deposition flux(due to the elevated NH3 concentration) when net emissionactually occurred thus over-estimating annual depositionThe importance of field NH3 emissions by agricultural man-agement events relative to background exchange is discussedin Sect 33 by comparing model results with actual long-term flux datasets
3 Results and discussion
31 Model evaluation for key exchange variables
311 Gap-filling of friction velocity data
Measured values ofulowast from EC datasets were used prefer-entially for flux modelling whenever possible the predictionof ulowast based on an assumed value ofz0 for vegetation and onmeteorological conditions (Sect A3 Supplement) was usedonly when measured turbulence data were missing This rep-resented on average 21 of the time across the network al-thoughulowast data capture was close to 100 at some sites andless than 60 at others for the period 2007ndash2008
For the gap-filling ofulowast the model base runs used mea-sured values ofhc to calculatez0 while inferential mod-els within the framework of CTMs would normally predictulowast from their own defaulthc values The discrepancies inmodelledulowast are shown in Fig 1 with the different defaultvalues ofhc leading to differentulowast estimates between mod-els across the sites (Fig 1a) The actual use of measuredhc naturally suppressed these differences between models(Fig 1b) with residual inter-model discrepancies being dueto slightly different stability correction functions in the fourmodels Not surprisingly the use of measuredhc (as opposedto model defaults) also considerably improved the agreementbetween modelled and measuredulowast and reduced the scat-ter in the relationship (Fig 1b) even if there was a markedtendency to overestimateulowast over forests at the higher endof the scale The three forest sites whose mean measuredulowast was around 065 m sminus1 (DE-Hai DE-Wet DK-Sor) andwhose mean modelledulowast were 076 083 and 091 m sminus1respectively were 33 m tall beech 22 m tall spruce and 31 mtall beech forests respectively The other forest site whosemeanulowast (051 m sminus1) was largely overestimated (075 m sminus1)
was NL-Spe a mixed species 32 m tall stand dominated inthe near field by Douglas fir These four forests have com-paratively large maximum leaf area indices in the range 5ndash11 m2 mminus2 (Table 1) which may reduce frictional retardationof wind Further the underlying model assumption thatz0 in-creases linearly withhc (with z0 being normally calculated as
one tenth ofhc in CBED EMEP-03 and IDEM) is probablynot valid depending on canopy structure and leaf morphol-ogy andz0 values of 3 m for the aforesaid 30 m tall forestsare therefore unrealistic Another explanation is that mostanemometers over forest are operated within the roughnesssublayer where wind speed is larger than would be predictedon the basis of the logarithmic wind profile thus leading tolarger modelledulowast values This may be different for CTMswhere the reference height is higher (eg 50 m)
Note that in this study ldquomodelledrdquoulowast means a value de-rived from the measured wind speeds and stability functionsvalues ofulowast in the regional application of these models de-pend on the NWP model and sub-grid treatment and mightbe quite different While the CTMs aim to capturehc ulowast andother features relevant for dry deposition over representativelandscapes the comparison shown in Fig 1a is only fullymeaningful to the extent that the limited number of NEUsites may be considered as statistically representative of theirland-use class
312 Stomatal conductance
Stomatal conductance (Gs = inverse of bulk stomatal resis-tance to water vapour) is controlled by leaf surface area andby PAR as well as temperature soil moisture and ambientrelative humidity and therefore strong seasonal cycles areexpected in European conditions The four models do showsome temporal correlation with respect toGs as shown inFig 2 Over forests the mean daytimeGs was modelled tobe generally largest in summer with values of typically 5 to10 mm sminus1 There were clear discrepancies between modelsin summer for forests withGs in CBED and IDEM typi-cally a factor of two larger than in CDRY and EMEP-03 forconiferous forests but the agreement was much better fordeciduous forests (eg DE-Hai DK-Sor FR-Fon FR-Hes)During the other seasons the IDEM model stands out overthe coniferous sites with mean daytimeGs values of typi-cally 10 mm sminus1 almost regardless of the season except inthe more northerly regions while the other three models arerather consistent and show reduced values compared withsummer At selected mediterranean or Southern Europeanconiferous sites where summer heat stress and drought re-duce stomatal exchange in summerGs values predicted byIDEM are actually marginally larger in winter than in sum-mer (eg ES-ES1 FR-LBr IT-SRo)
Over short vegetation the seasonal picture is much morepronounced than in the NEU forest network in which ever-green forests were dominant Strong seasonal cycles in LAIin SN G and C land uses as well as in solar radiation drivethe annual variations inGs with logically annual maxima insummer (Fig 2) The IDEM model predicts much larger (afactor 2 to 4) summer daytime stomatal conductances typ-ically 15ndash30 mm sminus1 than the other models with typically5ndash10 mm sminus1 IDEM also tends to predict higher autumnGsthan the other models especially for crops By contrast the
wwwatmos-chem-physnet1127032011 Atmos Chem Phys 11 2703ndash2728 2011
2714 C R Flechard et al Dry deposition of reactive nitrogen to European ecosystems
51
(D)
(A) (B)
(C)
Measured u (m s-1)
00
02
04
06
08
10
00 02 04 06 08 10
Mod
elle
d u
(m
s-1)
FSN G CCBEDCDRYEMEP-03IDEM
11
Measured u (m s-1)
00
02
04
06
08
10
00 02 04 06 08 10
Mod
elle
d u
(m
s-1)
FSN G CCBEDCDRYEMEP-03IDEM
11
0
5
10
15
20
25
F SN G C
hc
max
(m )
ObservedCBEDCDRYEMEP-03IDEM
0
2
4
6
8
10
F SN G C
LA
I max
(m2 m
-2)
ObservedCBEDCDRYEMEP-03IDEM
(D)
(A) (B)
(C)
Measured u (m s-1)
00
02
04
06
08
10
00 02 04 06 08 10
Mod
elle
d u
(m
s-1)
FSN G CCBEDCDRYEMEP-03IDEM
11
Measured u (m s-1)
00
02
04
06
08
10
00 02 04 06 08 10
Mod
elle
d u
(m
s-1)
FSN G CCBEDCDRYEMEP-03IDEM
11
Measured u (m s-1)
00
02
04
06
08
10
00 02 04 06 08 10
Mod
elle
d u
(m
s-1)
FSN G CCBEDCDRYEMEP-03IDEM
11
Measured u (m s-1)
00
02
04
06
08
10
00 02 04 06 08 10
Mod
elle
d u
(m
s-1)
FSN G CCBEDCDRYEMEP-03IDEM
11
0
5
10
15
20
25
F SN G C
hc
max
(m )
ObservedCBEDCDRYEMEP-03IDEM
0
2
4
6
8
10
F SN G C
LA
I max
(m2 m
-2)
ObservedCBEDCDRYEMEP-03IDEM
1 Figure 1 2
Fig 1 Comparison of measuredulowast (long-term means at each observation site) with inferential model estimates using as input either modeldefault values ofhc (A) or measuredhc at each site(B) Panels(A) and(D) comparison of mean observations and model default valuesof hc and LAI for the different land use types (F forests SN semi-natural G grasslands C croplands) Note that the CDRY model usestabulated ecosystem-specific values ofz0 and does not require hc as a predictor of z0 thus for comparabilitys sake the hc values presentedfor CDRY in Fig 1C were actually calculated by multiplying modelz0 by 10 since the other three models all usez0 =hc10
EMEP-03 model yields the smallest summerGs values par-ticularly in crops in spring and summer owing in part to arather short predicted growing season typically 100 daysoutside of which the soil is assumed to be bare (LAI=0Gs = 0) The four models are otherwise roughly consistentduring the rest of the year with residual stomatal exchangein spring and autumn and a near zeroGs in winter
313 Trace gas and aerosol deposition velocities
Deposition velocities were calculated for the height of theDELTA system inlets in order to infer exchange fluxesdirectly from DELTA concentrations (Eq 1) but sincesampling- and canopy- heights varied between sites and forcomparabilityrsquos sake we present in this section meanVd dataevaluated at a standard height of 3 m aboved + z0 for allF SN G and C ecosystems (Fig 3) With the exception ofNO2 for the Nr species considered hereVd was substantially
larger over forests than over short vegetation regardless ofthe model due to the reduced aerodynamic resistanceRa forrougher forest surfaces (over the same vertical path of 3 m)For NO2 this had no noticeable effect onVd asRc made upthe bulk of the total resistance to dry deposition with up-take being largely limited to the stomatal pathway in the fourmodels
For HNO3 over short vegetation the meanVd was of theorder of 10ndash12 mm sminus1 and very similar between modelssince the non-stomatal resistance was generally considered tobe small though not necessarily negligible (CDRY IDEM)andVd could be approximated to 1(Ra+Rb) as the sum ofatmospheric resistances was much larger thanRc The spreadin meanVd values for each vegetation type (F SN G C) asshown by the range of mean siteVd values from the 5th tothe 95th percentile in Fig 3 thus reflected the range of meanwindspeeds measured at the different sites so that meanVdcould exceed 15 mm sminus1 at the windier sites Over forests
Atmos Chem Phys 11 2703ndash2728 2011 wwwatmos-chem-physnet1127032011
C R Flechard et al Dry deposition of reactive nitrogen to European ecosystems 2715
52
0369
12G
s (m
m s-1
)Winter
0369
12
Gs (
mm
s-1)
Spring
0369
12
Gs (
mm
s-1)
Summer
0369
12
BE-
Bra
BE-
Vie
CH
-Lae
CZ-
BK
1
DE-
Hai
DE-
Hoe
DE-
Tha
DE-
Wet
DK
-Sor
ES-E
S1
ES-L
Ma
FI-H
yy
FI-S
od
FR-F
on
FR-H
es
FR-L
Br
FR-P
ue
IT-C
ol
IT-R
en
IT-R
o2
IT-S
Ro
NL-
Loo
NL-
Spe
PT-E
sp
PT-M
i1
RU
-Fyo
SE-N
or
SE-S
k2
UK
-Gri
Gs (
mm
s-1)
Autumn
F
SN G C
DE-
Meh
ES-V
DA
FI-L
om
HU
-Bug
IT-A
mp
IT-M
Bo
NL-
Hor
PL-w
et
UK
-AM
o
CH
-Oe1
DE-
Gri
DK
-Lva
FR-L
q2
IE-C
a2
IE-D
ri
NL-
Ca1
UK
-EB
u
BE-
Lon
DE-
Geb
DE-
Kli
DK
-Ris
FR-G
ri
IT-B
Ci
IT-C
as
UA
-Pet
UK
-ESa
05
10152025
Gs (
mm
s-1)
Winter
05
10152025
Gs (
mm
s-1)
Spring
05
10152025
Gs (
mm
s-1)
Summer
05
10152025
Gs (
mm
s-1)
Autumn
CBED CDRY EMEP-03 IDEM
0369
12G
s (m
m s-1
)Winter
0369
12
Gs (
mm
s-1)
Spring
0369
12
Gs (
mm
s-1)
Summer
0369
12
BE-
Bra
BE-
Vie
CH
-Lae
CZ-
BK
1
DE-
Hai
DE-
Hoe
DE-
Tha
DE-
Wet
DK
-Sor
ES-E
S1
ES-L
Ma
FI-H
yy
FI-S
od
FR-F
on
FR-H
es
FR-L
Br
FR-P
ue
IT-C
ol
IT-R
en
IT-R
o2
IT-S
Ro
NL-
Loo
NL-
Spe
PT-E
sp
PT-M
i1
RU
-Fyo
SE-N
or
SE-S
k2
UK
-Gri
Gs (
mm
s-1)
Autumn
F0369
12G
s (m
m s-1
)Winter
0369
12
Gs (
mm
s-1)
Spring
0369
12
Gs (
mm
s-1)
Summer
0369
12
BE-
Bra
BE-
Vie
CH
-Lae
CZ-
BK
1
DE-
Hai
DE-
Hoe
DE-
Tha
DE-
Wet
DK
-Sor
ES-E
S1
ES-L
Ma
FI-H
yy
FI-S
od
FR-F
on
FR-H
es
FR-L
Br
FR-P
ue
IT-C
ol
IT-R
en
IT-R
o2
IT-S
Ro
NL-
Loo
NL-
Spe
PT-E
sp
PT-M
i1
RU
-Fyo
SE-N
or
SE-S
k2
UK
-Gri
Gs (
mm
s-1)
Autumn
0369
12G
s (m
m s-1
)Winter
0369
12
Gs (
mm
s-1)
Spring
0369
12
Gs (
mm
s-1)
Summer
0369
12
BE-
Bra
BE-
Vie
CH
-Lae
CZ-
BK
1
DE-
Hai
DE-
Hoe
DE-
Tha
DE-
Wet
DK
-Sor
ES-E
S1
ES-L
Ma
FI-H
yy
FI-S
od
FR-F
on
FR-H
es
FR-L
Br
FR-P
ue
IT-C
ol
IT-R
en
IT-R
o2
IT-S
Ro
NL-
Loo
NL-
Spe
PT-E
sp
PT-M
i1
RU
-Fyo
SE-N
or
SE-S
k2
UK
-Gri
Gs (
mm
s-1)
Autumn
F
SN G C
DE-
Meh
ES-V
DA
FI-L
om
HU
-Bug
IT-A
mp
IT-M
Bo
NL-
Hor
PL-w
et
UK
-AM
o
CH
-Oe1
DE-
Gri
DK
-Lva
FR-L
q2
IE-C
a2
IE-D
ri
NL-
Ca1
UK
-EB
u
BE-
Lon
DE-
Geb
DE-
Kli
DK
-Ris
FR-G
ri
IT-B
Ci
IT-C
as
UA
-Pet
UK
-ESa
05
10152025
Gs (
mm
s-1)
Winter
05
10152025
Gs (
mm
s-1)
Spring
05
10152025
Gs (
mm
s-1)
Summer
05
10152025
Gs (
mm
s-1)
Autumn
CBED CDRY EMEP-03 IDEM
05
10152025
Gs (
mm
s-1)
Winter
05
10152025
Gs (
mm
s-1)
Spring
05
10152025
Gs (
mm
s-1)
Summer
05
10152025
Gs (
mm
s-1)
Autumn
CBED CDRY EMEP-03 IDEM
1 Figure 2 2
3 Fig 2 Comparison of mean modelled daytime bulk stomatal conductances from the four inferential schemes
53
0123456789
10
F SN G C
NO2
05
1015202530354045
F SN G C
Vd (
mm
s-1)
NH3
05
1015202530354045
F SN G C
HNO3
05
1015202530354045
F SN G C
Vd (
mm
s-1)
NH4+
05
1015202530354045
F SN G C
NO3-
CBEDCDRYEMEP-03IDEM
NH3 HNO3 NO2
NH4+ NO3
-
0123456789
10
F SN G C
NO2
05
1015202530354045
F SN G C
Vd (
mm
s-1)
NH3
05
1015202530354045
F SN G C
HNO3
05
1015202530354045
F SN G C
Vd (
mm
s-1)
NH4+
05
1015202530354045
F SN G C
NO3-
CBEDCDRYEMEP-03IDEM
NH3 HNO3 NO2NH3 HNO3 NO2
NH4+ NO3
-NH4+ NO3
-
1 Figure 3 2
3 Fig 3 Overview of mean modelled deposition velocities (evaluated atd +z0+3 m for all sites) for dominant atmospheric Nr species Dataare medians and 5th and 95th percentiles across the sites of meanVd values at each site Note the different scale on the vertical axis for NO2
wwwatmos-chem-physnet1127032011 Atmos Chem Phys 11 2703ndash2728 2011
2716 C R Flechard et al Dry deposition of reactive nitrogen to European ecosystems
by contrast meanVd for HNO3 was typically 25ndash35 mm sminus1with the meanRa at 3 m aboved +z0 being of the order ofa few s mminus1 Here the differences between models inRc forHNO3 (Sect 211) became significant so that the meanVdacross sites in CDRY and IDEM was substantially smaller(sim25 mm sminus1) than in CBED and EMEP-03 (gt35 mm sminus1)
The most significant absolute inter-model differenceshowever were found for NH3 for all vegetation types andfor aerosol NH+4 and NOminus
3 over forests (Fig 3) For un-fertilised vegetation (F SN)Vd for NH3 was a factor 2ndash3larger in CBED and IDEM than in CDRY and EMEP-03The CDRY scheme systematically predicted the smallestVdof the four models for NH3 due to a generally much largernon-stomatal resistance which was taken to be equal to thatfor SO2 There was a relatively small spread of mean siteVdvalues in CBED for F and SN compared with EMEP-03 andIDEM as the CBED scheme used a constantRc of 20 s mminus1
for unfertilised vegetation while in the other models varia-tions inRc were controlled by RHT and sometimes by theratio of SO2 to NH3 ambient concentrations Remarkablyhowever the meanVd for NH3 across sites was almost iden-tical in CBED and IDEM for F and SN There are very fewlong-term micrometeorological NH3 flux datasets over (Eu-ropean) forests from which comprehensive and robust pa-rameterisations may be derived with the bulk of NH3 fluxmeasurements stemming from mainly coniferous stands inthe high N environment of The Netherlands (Wyers and Eris-man 1998) Belgium (Neirynck et al 2005 2007 Neirynckand Ceulemans 2008) and Denmark (Andersen et al 1999)(see also Zhang et al 2010 and Massad 2010 for reviews)and this is clearly reflected in the wide range of depositionvelocities provided by the different models
Over fertilised systems (G C) noVd is provided for NH3in CBED since this uses a compensation point approach butfor the other three models the same hierarchy inVd estimatesis found as for F and SN with IDEM providing the largestvalues about 10 mm sminus1) and CDRY the smallest around5 mm sminus1 (Fig 3)
Aerosol Nr deposition velocities were predicted to be verysmall for short vegetation typically 2ndash3 mm sminus1 with littlevariation between models All models consistently showedslightly largerVd for NOminus
3 than for NH+
4 reflecting the largerfraction of NOminus
3 found in the coarse aerosol mode comparedwith NH+
4 By contrast to short vegetationVd estimatesover forests varied widely different between the four rou-tines with theoretical (Slinn-type) models (CDRY EMEP-03) providing similar estimates of the order of 2ndash5 mm sminus1and the more empirical measurement-based or simplifiedmodels (CBED IDEM) yielding much larger estimates (typ-ically 10ndash25 mm sminus1) Publications from the last 10 yearshave also demonstrated that over forests deposition veloci-ties for particles in the size range 01ndash1 microm which containmost of the atmospheric Nr are much larger than wouldbe expected on the basis of theory with values of typically
10 mm sminus1 (Gallagher et al 1997) or even 50ndash100 mm sminus1
(Wolff et al 2009) Gallagher et al (2002) further showedfrom a compilation of publishedVd data for small aerosols(01ndash02 microm) thatVd was strongly dependent on the rough-ness of vegetation and that measuredVd was typically a fac-tor 10 larger than Slinn-type models not only for forests butacross the range ofz0 values from the various datasets overheathland grassland and arable land However it shouldalso be noted that many of the larger deposition velocities(eg Gallagher et al 1997) have been measured over Speul-der forest (NL-Spe in Table 1) which is a Douglas fir forestswith a projected LAIgt10 this canopy is far denser than thetypical Scots pine or Norway spruce canopies (LAIsim3ndash5)and hence largeVd would be expected (Petroff et al 2008ab) Further apparent emission fluxes are common in fluxdatasets and there are significant difficulties in interpret-ing how far such data are real or represent artifacts (Pryoret al 2007 2008a b) Emerging evidence from chemi-cally resolved particle flux measurements suggests that thevolatilisation of NH4NO3 during deposition may increase ef-fective deposition rates of these compounds and that effec-tive deposition rates for NOminus3 may therefore be significantlylarger than for thermodynamically stable SO2minus
4 (Fowler etal 2009) Such large modelmeasurement discrepancies aswell as the large differences between models (Fig 3) hint atmuch uncertainty regarding aerosolVd especially to forestswhere the large roughness may potentially mean much largeraerosol dry deposition than assumed heretofore
32 Dry deposition of Nr to European ecosystems
Modelled annual dry deposition fluxes of atmospheric Nrare summarised in Table 3 and Fig 4 We approximate Nrdry deposition as the sum of the dominant inorganic speciesie gas NH3 HNO3 and NO2 and aerosol NH+4 and NOminus
3fluxes as no data were available for organic Nr As expectedfrom the model inter-comparison forVd (Fig 3) the annualNr dry deposition estimates are very model dependent withvariations between the largest and smallest estimates at anygiven site reaching typically a factor 2 to 3 (Fig 4) Therewas nonetheless a strong correlation across the sites betweenmodels which was logically driven by the measured atmo-spheric concentrations and meteorology
Note that the results discussed hereafter were obtainedfrom model base runs as outlined earlier (Sect 231) anddetailed in Sect A2ndashA5 and Table A2 of the SupplementAlternative runs shown therein (Fig A3) demonstrate thatthe choice of measured or model default LAI andhc as in-puts to the models has a significant impact on annual fluxesgenerally of the order ofplusmn10 to 20 of the base run flux butsometimes reachingplusmn50 Likewise the use of temperatureand relative humidity data estimated at canopy level (d+z0rsquo)where exchange processes take place rather than data in theambient air above the canopy (base run) has a very largeimpact on NH3 emissions by stomata of grass and crops in
Atmos Chem Phys 11 2703ndash2728 2011 wwwatmos-chem-physnet1127032011
C R Flechard et al Dry deposition of reactive nitrogen to European ecosystems 2717
Table 3 Summary of modelled annual dry deposition fluxes to the sites of the NEU inferential network (unit kg N haminus1 yrminus1) averagedover the two years 2007ndash2008 A minus ldquominusrdquo sign denotes net deposition positive numbers for NH3 in CBED indicate a net emission
CBED CDRY EMEP IDEM
Site NH3 HNO3 NO2 NH+
4 NOminus
3 NH3 HNO3 NO2 NH+
4 NOminus
3 NH3 HNO3 NO2 NH+
4 NOminus
3 NH3 HNO3 NO2 NH+
4 NOminus
3
BE-Bra minus167 minus66 minus25 minus42 minus43 minus53 minus36 minus80 minus10 minus07 minus74 minus65 minus27 minus10 minus15 minus126 minus43 minus79 minus66 minus53BE-Vie minus37 minus24 minus13 minus22 minus30 minus15 minus14 minus46 minus05 minus04 minus21 minus22 minus04 minus04 minus03 minus32 minus16 minus13 minus39 minus43CHminusLae minus79 minus43 minus09 minus26 minus26 minus31 minus24 minus29 minus06 minus04 minus35 minus37 minus01 minus05 minus06 minus63 minus29 minus09 minus61 minus48CZ-BK1 minus34 minus42 minus10 minus22 minus16 minus13 minus28 minus29 minus05 minus02 minus26 minus32 minus03 minus06 minus06 minus32 minus30 minus24 minus39 minus21DE-Hai minus48 minus46 minus10 minus43 minus32 minus14 minus23 minus24 minus09 minus04 minus24 minus42 minus01 minus05 minus04 minus44 minus30 minus11 minus57 minus34DE-Hoe minus148 minus44 minus13 minus33 minus26 minus54 minus26 minus32 minus08 minus04 minus55 minus43 minus03 minus10 minus12 minus96 minus30 minus32 minus45 minus25DE-Tha minus56 minus43 minus12 minus29 minus22 minus22 minus27 minus31 minus07 minus04 minus32 minus40 minus02 minus07 minus08 minus45 minus30 minus28 minus36 minus20DE-Wet minus37 minus45 minus09 minus32 minus28 minus17 minus27 minus42 minus08 minus05 minus25 minus36 minus01 minus09 minus13 minus39 minus28 minus24 minus53 minus37DK-Sor minus98 minus35 minus10 minus31 minus53 minus33 minus18 minus23 minus07 minus06 minus45 minus33 00 minus03 minus04 minus71 minus22 minus10 minus34 minus47ES-ES1 minus126 minus45 minus13 minus25 minus43 minus43 minus30 minus18 minus06 minus06 minus49 minus45 00 minus07 minus18 minus80 minus33 minus18 minus31 minus38ES-LMa minus62 minus19 minus02 minus08 minus11 minus11 minus06 minus02 minus02 minus01 minus22 minus19 00 minus02 minus04 minus25 minus14 minus03 minus07 minus06FI-Hyy minus08 minus11 minus04 minus06 minus03 minus03 minus07 minus28 minus01 minus01 minus04 minus08 minus10 minus01 minus01 minus07 minus07 minus16 minus11 minus04FI-Sod minus10 minus05 minus01 minus03 minus01 minus04 minus04 minus02 minus01 00 minus05 minus02 00 minus01 00 minus10 minus03 minus02 minus05 minus01FR-Fon minus60 minus43 minus10 minus28 minus32 minus17 minus22 minus16 minus06 minus04 minus27 minus42 00 minus03 minus05 minus44 minus31 minus10 minus38 minus32FR-Hes minus58 minus37 minus08 minus22 minus21 minus16 minus18 minus13 minus05 minus03 minus24 minus35 00 minus02 minus03 minus44 minus26 minus10 minus32 minus23FR-LBr minus79 minus30 minus05 minus14 minus18 minus32 minus19 minus12 minus03 minus03 minus31 minus30 00 minus04 minus07 minus59 minus21 minus10 minus27 minus26FR-Pue minus27 minus23 minus05 minus11 minus12 minus06 minus09 minus06 minus03 minus01 minus09 minus23 00 minus03 minus05 minus18 minus16 minus06 minus15 minus11IT-Col minus28 minus14 minus05 minus12 minus10 minus08 minus06 minus07 minus03 minus01 minus11 minus12 00 minus04 minus06 minus20 minus10 minus05 minus29 minus19IT-Ren minus22 minus12 minus03 minus13 minus10 minus08 minus07 minus09 minus03 minus02 minus10 minus09 00 minus05 minus05 minus16 minus08 minus10 minus24 minus14IT-Ro2 minus123 minus25 minus05 minus20 minus18 minus29 minus10 minus05 minus05 minus02 minus44 minus25 00 minus07 minus09 minus68 minus17 minus07 minus37 minus24IT-SRo minus56 minus32 minus06 minus21 minus22 minus18 minus19 minus10 minus05 minus03 minus22 minus32 00 minus06 minus10 minus40 minus22 minus10 minus38 minus30NL-Loo minus257 minus36 minus31 minus51 minus41 minus115 minus24 minus94 minus12 minus07 minus111 minus35 minus23 minus12 minus15 minus206 minus24 minus76 minus80 minus46NL-Spe minus284 minus46 minus15 minus44 minus50 minus99 minus26 minus52 minus10 minus06 minus100 minus45 minus17 minus10 minus17 minus192 minus31 minus43 minus57 minus47PT-Esp minus69 minus19 minus12 minus13 minus13 minus12 minus05 minus10 minus03 minus02 minus23 minus19 minus01 minus03 minus04 minus28 minus15 minus18 minus10 minus07PT-Mi1 minus52 minus20 minus04 minus13 minus12 minus15 minus08 minus05 minus03 minus02 minus21 minus22 00 minus04 minus05 minus30 minus16 minus06 minus20 minus12RU-Fyo minus22 minus20 minus02 minus14 minus07 minus08 minus12 minus06 minus03 minus01 minus12 minus13 00 minus03 minus03 minus23 minus12 minus04 minus27 minus10SE-Nor minus21 minus09 minus03 minus08 minus05 minus09 minus06 minus08 minus02 minus01 minus09 minus07 00 minus02 minus02 minus15 minus06 minus06 minus12 minus06SE-Sk2 minus15 minus11 minus02 minus07 minus05 minus05 minus07 minus07 minus02 minus01 minus07 minus09 00 minus01 minus02 minus10 minus08 minus06 minus12 minus07UK-Gri minus21 minus16 minus02 minus10 minus13 minus07 minus09 minus04 minus02 minus02 minus10 minus15 00 minus02 minus05 minus22 minus09 minus04 minus21 minus21
DE-Meh minus56 minus13 minus08 minus04 minus03 minus26 minus12 minus25 minus05 minus02 minus24 minus13 minus01 minus04 minus05 minus56 minus11 minus21 minus06 minus03ES-VDA minus19 minus03 minus02 minus02 minus01 minus07 minus03 minus05 minus02 minus01 minus09 minus03 00 minus02 minus02 minus20 minus03 minus05 minus04 minus02FI-Lom minus03 minus01 00 minus01 00 minus01 minus01 00 minus01 00 minus01 minus01 00 00 00 minus01 minus01 00 minus01 00HU-Bug minus58 minus09 minus05 minus03 minus02 minus21 minus07 minus11 minus04 minus01 minus26 minus09 minus01 minus03 minus02 minus57 minus08 minus13 minus07 minus02IT-Amp minus11 minus03 minus04 minus01 00 minus04 minus02 minus04 minus01 00 minus05 minus03 00 minus02 minus01 minus11 minus03 minus08 minus05 minus02IT-MBo minus21 minus06 minus04 minus01 minus01 minus07 minus05 minus07 minus02 minus01 minus11 minus06 00 minus03 minus03 minus24 minus05 minus11 minus06 minus04NL-Hor minus139 minus26 minus37 minus07 minus07 minus60 minus22 minus97 minus08 minus05 minus80 minus26 minus17 minus06 minus10 minus169 minus20 minus101 minus12 minus09PL-wet minus45 minus12 minus04 minus04 minus02 minus14 minus08 minus09 minus05 minus02 minus21 minus11 00 minus04 minus03 minus40 minus10 minus12 minus09 minus04UK-AMo minus29 minus06 minus05 minus02 minus02 minus12 minus05 minus11 minus02 minus01 minus15 minus05 00 minus01 minus02 minus32 minus04 minus11 minus02 minus01
CH-Oe1 01 minus10 minus38 minus02 minus02 minus14 minus09 minus59 minus03 minus02 minus19 minus10 minus27 minus02 minus03 minus32 minus09 minus66 minus08 minus05DE-Gri 56 minus11 minus11 minus02 minus02 minus09 minus10 minus20 minus02 minus01 minus13 minus11 minus02 minus02 minus02 minus18 minus10 minus18 minus04 minus02DK-Lva 19 minus09 minus10 minus02 minus05 minus21 minus08 minus22 minus02 minus03 minus21 minus09 00 minus02 minus04 minus45 minus08 minus20 minus03 minus02FR-Lq2 minus02 minus07 minus02 minus02 minus02 minus13 minus06 minus06 minus02 minus01 minus15 minus06 00 minus01 minus02 minus29 minus06 minus04 minus02 minus01IE-Ca2 13 minus04 minus03 minus02 minus01 minus18 minus03 minus06 minus02 minus01 minus18 minus04 00 minus01 minus02 minus43 minus03 minus05 minus03 minus02IE-Dri minus22 minus04 minus02 minus02 minus02 minus35 minus04 minus05 minus02 minus01 minus38 minus04 00 minus02 minus03 minus93 minus04 minus04 minus03 minus01NL-Ca1 minus58 minus16 minus40 minus06 minus06 minus95 minus15 minus83 minus06 minus04 minus98 minus16 minus22 minus04 minus06 minus191 minus14 minus70 minus07 minus05UK-EBu minus02 minus05 minus03 minus01 minus01 minus12 minus05 minus07 minus02 minus01 minus11 minus05 00 minus01 minus02 minus26 minus04 minus06 minus02 minus01
BE-Lon 05 minus11 minus14 minus07 minus06 minus30 minus09 minus36 minus04 minus03 minus31 minus11 minus04 minus02 minus01 minus61 minus09 minus30 minus07 minus04DE-Geb 15 minus09 minus09 minus08 minus04 minus25 minus07 minus19 minus05 minus02 minus22 minus09 minus01 minus02 minus01 minus55 minus07 minus18 minus08 minus03DE-Kli 19 minus12 minus09 minus08 minus05 minus17 minus10 minus24 minus04 minus02 minus20 minus12 minus01 minus02 minus01 minus36 minus10 minus19 minus06 minus03DK-Ris minus19 minus03 minus07 minus03 minus03 minus37 minus03 minus16 minus02 minus01 minus41 minus03 00 minus02 minus01 minus67 minus03 minus15 minus07 minus03FR-Gri 10 minus15 minus08 minus06 minus06 minus29 minus12 minus28 minus03 minus03 minus29 minus15 minus06 minus01 minus02 minus62 minus13 minus20 minus04 minus04IT-BCi 16 minus18 minus05 minus23 minus07 minus62 minus13 minus11 minus13 minus03 minus57 minus18 00 minus05 minus02 minus163 minus15 minus11 minus20 minus04IT-Cas 41 minus08 minus06 minus05 minus04 minus19 minus06 minus06 minus03 minus03 minus21 minus08 00 minus05 minus04 minus39 minus07 minus10 minus29 minus18UA-Pet minus02 minus08 minus02 minus07 minus03 minus14 minus06 minus06 minus04 minus01 minus19 minus07 00 minus04 minus01 minus29 minus07 minus05 minus14 minus04UK-ESa na na na na na na na na na na na na na na na na na na na na
lowast ldquonardquo not available
the CBED model (Fig A3 of Supplement) A full sensitiv-ity analysis of the models is beyond the scope of this paperbut these results show that models have different sensitivitiesto input data and that the various land use classes responddifferently These tests also demonstrate that uncertainties ininferential dry deposition estimates could be reduced by theon-site recording of vegetation parameters (LAIhc) Theuncertainty associated with surface potentials (T RH) de-pends on the experimental conditions for the data on whichthe paramerisations were originally based For non-stomatal
resistances ambient (eg 2 m above canopy) values have of-ten been used though not always (eg Flechard et al 2010)while for the measurement of leaf stomatal conductancestemperature is measured in situ in a leaf cuvette
Over F and SN ecosystems the largest Nr dry deposi-tion estimates were consistently given by CBED and IDEMwhich were largely in agreement while the EMEP-03 andCDRY fluxes were typically a factor of 2 smaller Thelargest annual Nr dry deposition to forests was derived forThe Netherlands (NL-Loo NL-Spe) and Belgium (BE-Bra)
wwwatmos-chem-physnet1127032011 Atmos Chem Phys 11 2703ndash2728 2011
2718 C R Flechard et al Dry deposition of reactive nitrogen to European ecosystems
54
F
SN G C
-45-35-25-15
-55
BE-
Bra
BE-
Vie
CH
-Lae
CZ-
BK
1D
E-H
aiD
E-H
oeD
E-Th
aD
E-W
etD
K-S
orES
-ES1
ES-L
Ma
FI-H
yyFI
-Sod
FR-F
onFR
-Hes
FR-L
Br
FR-P
ueIT
-Col
IT-R
enIT
-Ro2
IT-S
Ro
NL-
Loo
NL-
Spe
PT-E
spPT
-Mi1
RU
-Fyo
SE-N
orSE
-Sk2
UK
-Gri
kg N
ha-1
y-1
-45-35-25-15
-55
DE-
Meh
ES-V
DA
FI-L
omH
U-B
ugIT
-Am
pIT
-MB
oN
L-H
orPL
-wet
UK
-AM
o
CH
-Oe1
DE-
Gri
DK
-Lva
FR-L
q2IE
-Ca2
IE-D
riN
L-C
a1U
K-E
Bu
BE-
Lon
DE-
Geb
DE-
Kli
DK
-Ris
FR-G
riIT
-BC
iIT
-Cas
UA
-Pet
UK
-ESa
kg N
ha-1
y-1
CBED CDRY EMEP-03 IDEM
Ann
ual N
rdr
y de
posi
tion
(kg
N h
a-1yr
-1)
F
SN G C
-45-35-25-15
-55
BE-
Bra
BE-
Vie
CH
-Lae
CZ-
BK
1D
E-H
aiD
E-H
oeD
E-Th
aD
E-W
etD
K-S
orES
-ES1
ES-L
Ma
FI-H
yyFI
-Sod
FR-F
onFR
-Hes
FR-L
Br
FR-P
ueIT
-Col
IT-R
enIT
-Ro2
IT-S
Ro
NL-
Loo
NL-
Spe
PT-E
spPT
-Mi1
RU
-Fyo
SE-N
orSE
-Sk2
UK
-Gri
kg N
ha-1
y-1
-45-35-25-15
-55
DE-
Meh
ES-V
DA
FI-L
omH
U-B
ugIT
-Am
pIT
-MB
oN
L-H
orPL
-wet
UK
-AM
o
CH
-Oe1
DE-
Gri
DK
-Lva
FR-L
q2IE
-Ca2
IE-D
riN
L-C
a1U
K-E
Bu
BE-
Lon
DE-
Geb
DE-
Kli
DK
-Ris
FR-G
riIT
-BC
iIT
-Cas
UA
-Pet
UK
-ESa
kg N
ha-1
y-1
CBED CDRY EMEP-03 IDEM
Ann
ual N
rdr
y de
posi
tion
(kg
N h
a-1yr
-1)
1 Figure 4 2
3 Fig 4 Modelled annual Nr dry deposition to NEU monitoring sites Data are calculated as the sum of NH3 HNO3 aerosol NH+4 and NOminus
3fluxes from DELTA measurements plus NO2 dry deposition from modelled (EMEP 50times 50 km) or measured NO2 concentrations
while remote boreal forests (FI-Hyy FI-Sod SE-Nor) re-ceived the smallest inputs Similar differences occurred inSN ecosytems with less than 1 kg N haminus1 yrminus1 at FI-Lomcompared with about 15ndash25 kg N haminus1 yrminus1 at NL-Hor Drydeposition of Nr to short semi-natural vegetation was dom-inated by NH3 except in CDRY contributing typically 50ndash75 of total dry deposition inputs depending on the model(Fig 5) Despite similar concentrations overall (Table 2) therelative contribution of NH3 was less over F than over SNtypically only 30ndash40 either because aerosol depositionrates were larger especially in CBED and IDEM (Fig 3)or because HNO3 fluxes were large being of the same or-der as NH3 over forests in the CDRY and EMEP-03 models(Fig 5)
Although the deposition velocity of NO2 was small com-pared with that of NH3 and HNO3 (Fig 3) the comparativelylarge ambient NO2 concentrations at a few sites (BE-BraFI-Hyy IT-Ren NL-Spe CH-Oe1 FR-Gri) resulted in NO2contributing a large ndash and sometimes dominant ndash fraction oftotal Nr dry deposition at some sites (Fig 5) especially withCDRY In a scoping study of 14 short-term inferential cam-paigns over 8 CAPMoN sites in Eastern and Central CanadaZhang et al (2009) estimated that the combined dry depo-sition of NO2 PAN and other NOy species contributed be-tween 4 and 18 of total (dry + wet) Nr deposition Inthat study NO2 contributed 35 of Nr dry deposition while
PAN + PPN contributed 6 NO 5 HNO3 4 aerosolNOminus
3 6 other NOy species 11 aerosol NH+4 26 andNH3 just 7 (fractions averaged across the 14 sites) Mostsites of the NEU network however were located in remoteor rural landscapes and although NO2 concentrations werenot measured everywhere it may be assumed that NO2 gen-erally contributed less than 10ndash20 of dry Nr deposition asobserved at eg IT-Col FI-Lom UK-AMo HUBug despitethe larger NO2 share predicted by CDRY (Fig 5) The esti-mated NO2 contribution was especially small and often evennought with the EMEP-03 routine due to the implementa-tion of the 4 ppb threshold (Sect 211) HONO was gener-ally not detectable except at roadside (eg CH-Oe1) and sub-urban sites (FR-Gri FR-Fon) but concentrations were verysmall and may partly have resulted from a sampling artefactand HONO deposition is neglected here also given that in-ferential modelling of HONO is very uncertain due to thepossibility of heterogeneous production at surfaces
Over managed grassland and crops the compensationpoint approach in CBED allowed a few sites to be netannual emitters of NH3 and even of Nr (eg DE-GriIT-Cas) in background conditions (without accounting forfertiliser- or grazing-induced emissions) while the othermodels consistently predicted a net Nr sink of the order of 5ndash15 kg N haminus1 yrminus1 The two agricultural sites with the largest(monthly mean and maximum) ambient NH3 concentrations
Atmos Chem Phys 11 2703ndash2728 2011 wwwatmos-chem-physnet1127032011
C R Flechard et al Dry deposition of reactive nitrogen to European ecosystems 2719
55
F SN G CCBED
CDRY
EMEP-03
IDEM
NH3 HNO3 NO2 NH4+ NO3--50-25
0255075
100
BE-
Bra
BE-
Vie
CH
-Lae
CZ-
BK
1D
E-H
aiD
E-H
oeD
E-Th
aD
E-W
etD
K-S
orES
-ES1
ES-L
Ma
FI-H
yyFI
-Sod
FR-F
onFR
-Hes
FR-L
Br
FR-P
ueIT
-Col
IT-R
enIT
-Ro2
IT-S
Ro
NL-
Loo
NL-
Spe
PT-E
spPT
-Mi1
RU
-Fyo
SE-N
orSE
-Sk2
UK
-Gri
DE-
Meh
ES-V
DA
FI-L
omH
U-B
ugIT
-Am
pIT
-MB
oN
L-H
orPL
-wet
UK
-AM
o
CH
-Oe1
DE-
Gri
DK
-Lva
FR-L
q2IE
-Ca2
IE-D
riN
L-C
a1U
K-E
Bu
BE-
Lon
DE-
Geb
DE-
Kli
DK
-Ris
FR-G
riIT
-BC
iIT
-Cas
UA
-Pet
UK
-ESa
0255075
1000
255075
1000
255075
100
BE-
Bra
BE-
Vie
CH
-Lae
CZ-
BK
1D
E-H
aiD
E-H
oeD
E-Th
aD
E-W
etD
K-S
orES
-ES1
ES-L
Ma
FI-H
yyFI
-Sod
FR-F
onFR
-Hes
FR-L
Br
FR-P
ueIT
-Col
IT-R
enIT
-Ro2
IT-S
Ro
NL-
Loo
NL-
Spe
PT-E
spPT
-Mi1
RU
-Fyo
SE-N
orSE
-Sk2
UK
-Gri
DE-
Meh
ES-V
DA
FI-L
omH
U-B
ugIT
-Am
pIT
-MB
oN
L-H
orPL
-wet
UK
-AM
o
CH
-Oe1
DE-
Gri
DK
-Lva
FR-L
q2IE
-Ca2
IE-D
riN
L-C
a1U
K-E
Bu
BE-
Lon
DE-
Geb
DE-
Kli
DK
-Ris
FR-G
riIT
-BC
iIT
-Cas
UA
-Pet
UK
-ESaR
elat
ive
cont
ribu
tion
to to
tal N
r dr
y de
posit
ion
F SN G CCBED
CDRY
EMEP-03
IDEM
NH3 HNO3 NO2 NH4+ NO3--50-25
0255075
100
BE-
Bra
BE-
Vie
CH
-Lae
CZ-
BK
1D
E-H
aiD
E-H
oeD
E-Th
aD
E-W
etD
K-S
orES
-ES1
ES-L
Ma
FI-H
yyFI
-Sod
FR-F
onFR
-Hes
FR-L
Br
FR-P
ueIT
-Col
IT-R
enIT
-Ro2
IT-S
Ro
NL-
Loo
NL-
Spe
PT-E
spPT
-Mi1
RU
-Fyo
SE-N
orSE
-Sk2
UK
-Gri
DE-
Meh
ES-V
DA
FI-L
omH
U-B
ugIT
-Am
pIT
-MB
oN
L-H
orPL
-wet
UK
-AM
o
CH
-Oe1
DE-
Gri
DK
-Lva
FR-L
q2IE
-Ca2
IE-D
riN
L-C
a1U
K-E
Bu
BE-
Lon
DE-
Geb
DE-
Kli
DK
-Ris
FR-G
riIT
-BC
iIT
-Cas
UA
-Pet
UK
-ESa
0255075
1000
255075
1000
255075
100
BE-
Bra
BE-
Vie
CH
-Lae
CZ-
BK
1D
E-H
aiD
E-H
oeD
E-Th
aD
E-W
etD
K-S
orES
-ES1
ES-L
Ma
FI-H
yyFI
-Sod
FR-F
onFR
-Hes
FR-L
Br
FR-P
ueIT
-Col
IT-R
enIT
-Ro2
IT-S
Ro
NL-
Loo
NL-
Spe
PT-E
spPT
-Mi1
RU
-Fyo
SE-N
orSE
-Sk2
UK
-Gri
DE-
Meh
ES-V
DA
FI-L
omH
U-B
ugIT
-Am
pIT
-MB
oN
L-H
orPL
-wet
UK
-AM
o
CH
-Oe1
DE-
Gri
DK
-Lva
FR-L
q2IE
-Ca2
IE-D
riN
L-C
a1U
K-E
Bu
BE-
Lon
DE-
Geb
DE-
Kli
DK
-Ris
FR-G
riIT
-BC
iIT
-Cas
UA
-Pet
UK
-ESa
F SN G CCBED
CDRY
EMEP-03
IDEM
NH3 HNO3 NO2 NH4+ NO3--50-25
0255075
100
BE-
Bra
BE-
Vie
CH
-Lae
CZ-
BK
1D
E-H
aiD
E-H
oeD
E-Th
aD
E-W
etD
K-S
orES
-ES1
ES-L
Ma
FI-H
yyFI
-Sod
FR-F
onFR
-Hes
FR-L
Br
FR-P
ueIT
-Col
IT-R
enIT
-Ro2
IT-S
Ro
NL-
Loo
NL-
Spe
PT-E
spPT
-Mi1
RU
-Fyo
SE-N
orSE
-Sk2
UK
-Gri
DE-
Meh
ES-V
DA
FI-L
omH
U-B
ugIT
-Am
pIT
-MB
oN
L-H
orPL
-wet
UK
-AM
o
CH
-Oe1
DE-
Gri
DK
-Lva
FR-L
q2IE
-Ca2
IE-D
riN
L-C
a1U
K-E
Bu
BE-
Lon
DE-
Geb
DE-
Kli
DK
-Ris
FR-G
riIT
-BC
iIT
-Cas
UA
-Pet
UK
-ESa
0255075
1000
255075
1000
255075
100
BE-
Bra
BE-
Vie
CH
-Lae
CZ-
BK
1D
E-H
aiD
E-H
oeD
E-Th
aD
E-W
etD
K-S
orES
-ES1
ES-L
Ma
FI-H
yyFI
-Sod
FR-F
onFR
-Hes
FR-L
Br
FR-P
ueIT
-Col
IT-R
enIT
-Ro2
IT-S
Ro
NL-
Loo
NL-
Spe
PT-E
spPT
-Mi1
RU
-Fyo
SE-N
orSE
-Sk2
UK
-Gri
DE-
Meh
ES-V
DA
FI-L
omH
U-B
ugIT
-Am
pIT
-MB
oN
L-H
orPL
-wet
UK
-AM
o
CH
-Oe1
DE-
Gri
DK
-Lva
FR-L
q2IE
-Ca2
IE-D
riN
L-C
a1U
K-E
Bu
BE-
Lon
DE-
Geb
DE-
Kli
DK
-Ris
FR-G
riIT
-BC
iIT
-Cas
UA
-Pet
UK
-ESaR
elat
ive
cont
ribu
tion
to to
tal N
r dr
y de
posit
ion
1 Figure 5 2
3 Fig 5 Relative contributions of Nr species to total inorganic N dry deposition For G and C data in CBED (top panel) negative percentagesfor NH3 denote net NH3 emissions which are expressed relative to the sum of dry deposition fluxes for the other four Nr species
at NL-Ca1 and IT-BCi (Table 2) are also the sites wheremodelled annual dry deposition is largest possibly in ex-cess of 20 kg N haminus1 yrminus1 This is logical from an inferen-tial modelling point of view but it is quite possible that atsuch sites the large concentration background observed inthe surface layer may result in part from emissions by theunderlying vegetation leaf litter and soil in crops at IT-BCi(Nemitz et al 2000b Bash et al 2010) or grazing animalsin the case of NL-Ca1 If this were the case net ecosystememission could actually prevail at these sites even outsideperiods following fertilisation events The inadequacy ofRcinferential approaches for NH3 (CDRY EMEP-03 IDEM)or even of single layer (χsRw) compensation point mod-elling (CBED) in the case of fertilised and managed agri-cultural systems has long been recognized (Sutton et al1993 Fowler et al 2009) New parameterisations for NH3in CTMs are emerging (Zhang et al 2010 Massad et al2010) which seek to relate the NH3 emission potential tothe plantecosystem N status via total N inputs through at-mospheric N deposition and fertilisation For such systemsthe challenge does not actually reside in the determinationof atmospheric Nr inputs in excess of fertilisation since at-mospheric deposition represent typically less than 10 ofadded fertiliser but rather in the quantification of field NH3emissions and their contribution to regional atmospheric Nrbudgets (Flechard et al 2010)
It should be noted that concentration levels of organic Nrcompounds which were not considered in the present studycan be significant in the troposphere although their sourcessinks and concentrations are not well known Water-solubleorganic N (WSON) contributed typically 20ndash25 of totalgas and particulate Nr in rural air in Scotland (GonzalezBenıtez et al 2010) but WSON speciation and depositionvelocities remain uncertain Published dry deposition mea-surements of PAN point toVd values of the order of 1ndash2 mm sminus1 over grass (Doskey et al 2004) and up to 10ndash15 mm sminus1 over coniferous forest in daytime equivalent toa canopy resistance of the order of 100 s mminus1 (Turnipseedet al 2006 Wolfe et al 2009) suggesting that PAN depo-sition to forests may be much faster than predicted by cur-rent algorithms (eg Zhang et al 2009) With typical PANconcentrations of 01ndash1 ppb Turnipseed et al (2006) calcu-lated that PAN contributed about 20 of daytime summer-time NOy (NO + NO2 + HNO3 + NOminus
3 + PAN) dry depositionat their forest site However considering the strong controlof PAN deposition by stomatal opening and uptake (Doskeyet al 2004) and the consequently reducedVd at night andin winter the contribution of PAN and other known atmo-spheric organic nitrates to total Nr inputs must be minor onthe annual time scale
wwwatmos-chem-physnet1127032011 Atmos Chem Phys 11 2703ndash2728 2011
2720 C R Flechard et al Dry deposition of reactive nitrogen to European ecosystems
33 Comparison with micrometeorological fluxmonitoring datasets within the NITROEUROPEnetwork
The surfaceatmosphere exchange of reactive nitrogen hasbeen investigated and measured at numerous sites in Europeand elsewhere yet this has been done most often campaign-wise with measurements lasting typically a few days to a fewweeks The data thus obtained are invaluable for understand-ing exchange processes and developing parameterisations foratmospheric models but they typically cover only a limitedrange of meteorological conditions atmospheric concentra-tions and vegetation development stages The validation ofinferential models at the ecosystem scale benefits much fromcomparisons with long-term flux measurement datasets asthe wide range of environmental conditions covered is usefulfor highlighting deficiencies in process understanding and forcomparing scaled-up annual estimates with actual measureddry deposition In general such long-term micrometeorolog-ical flux datasets are rare in the case of NH3 and NOx andalmost non-existent for HNO3 and aerosol NH+4 and NOminus
3 For the sites considered in this study there are long-term datafor NH3 and NOx only at 5 and 3 sites respectively whichare discussed in Sects 331 and 332 there are no availablelong-term datasets of HNO3 and aerosol fluxes Aerosol de-position has been measured at NL-Spe (summarised in Rui-jgrok et al 1997) and UK-Amo (Nemitz et al 2002) butannual fluxes were not estimated the focus being on the un-derstanding of variations in deposition velocity
In the few cases when long-term Nr flux estimates areavailable the flux data capture is generally much lower than100 and typically closer to 50 over one year this meansthat measurement-based annual estimates are a combinationof measurements and gap-filling and cannot be treated as ab-solutely accurate reference values and are subject to someuncertainty The procedures typically used in the annualdatasets presented hereafter involved either the calculationof mean monthly diurnal cycles of measured fluxes ensur-ing that season and time of day are properly weighted andaccounted for or the filling of gaps in the flux time seriesusing inferential models with parameters fitted to local con-ditions (eg Flechard et al 2010) or using neural networks(Neyrinck et al 2007)
It should also be noted here that many forest sites of theNEU network have been monitoring wet-only or bulk de-position and throughfall as part of national or internationalinitiatives (eg the ICPForests programme of the CLRTAPhttpwwwicp-forestsorg) which by difference betweenabove- and below-canopy fluxes have been used to provideestimates of dry deposition However uncertainties are largedue to canopy interactions (Lovett and Lindberg 1993 Zim-mermann et al 2006 Neirynck et al 2007 Simpson etal 2006b) and such data cannot be used reliably for modelvalidation
331 NH3
Only two forest sites (BE-Bra NL-Spe) within the NEU net-work have actually monitored annual NH3 dry deposition inthe past using the flux-gradient technique (Fig 6) The mea-surements by Neirynck et al (2007) at BE-Bra suggested anannual deposition input of nearlyminus20 kg N haminus1 yrminus1 whichis larger than the output of any of the four models in thepresent study (Table 3) whose ensemble average is onlyof the order ofminus10 kg N haminus1 yrminus1 (Fig 6) Only part ofthe difference may be explained by the larger mean NH3concentration (30 microg mminus3) at the time of the flux measure-ments in 1999ndash2001 (Neirynck et al 2007) than in the NEUDELTA dataset (23 microg mminus3) in 2007ndash2008 A clear indica-tion that especially CDRY and EMEP-03 both largely under-estimated NHX (NH3 + NH+
4 ) dry deposition at BE-Bra withannual fluxes of the order ofminus6 to minus8 kg N haminus1 yrminus1 (Ta-ble 3) is provided by a comparison with throughfall dataMeasured wet deposition of NHX was 7 kg N haminus1 yrminus1 atBE-Bra which together with dry deposition from CDRYor EMEP-03 would total around 15 kg NHX-N haminus1 yrminus1while the measured throughfall was actually 18 kg NHX-N haminus1 yrminus1 over the same time period (J Neirynck personalcommunication 2011)
The comparison is more favourable at NL-Spe wherethe measured dry deposition in 1995 ofminus179 kg NH3-N haminus1 yrminus1 (Erisman et al 1996) is well in the range of thefour model estimates in the NEU dataset and close to the en-semble mean (minus169 kg NH3-N haminus1 yrminus1) (Fig 6) with thedifference in mean concentrations between the two periodsbeing consistent with the modelmeasurement difference Astriking element in the comparison of BE-Bra with NL-Spe isthe roughly equal measured annual NH3 dry deposition at thetwo sites (minus196 vsminus179 kg NH3-N haminus1 yrminus1) while themean concentration was about 50 larger at NL-Spe point-ing to a much smallerRc at BE-Bra since the annual meanulowast
was identical (051 m sminus1) at the two sites The much smallermean NH3SO2 molar ratio at BE-Bra (29) than at NL-Spe(111) has been held responsible for the difference in mea-suredRc for NH3 (Neirynck et al 2005) but the effect ofleaf surface chemistry on deposition rates is not adequatelyreflected in most dry deposition models Flux measurementsat BE-Bra during 1999ndash2001 showed a reducedRc for NH3and largerRc for SO2 during winter when the NH3SO2 mo-lar ratio was below 1 in summer this ratio was larger than3 andRc for SO2 was correspondingly smaller whileRc forNH3 was increased (J Neyrinck personal communication2011) Because in Europe the total acid concentration is notnecessarily dominated by SO2 the molar ratio of NH3 to thesum of the main atmospheric strong acids (SO2 HNO3 HCl)is actually a better proxy for linking surface resistance to thepollution climate (Flechard et al 1999) this ratio was al-most a factor of 3 smaller at BE-Bra (16) than at NL-Spe(45) with BE-Bra being the second most acidic site of theNEU network after CZ-BK1
Atmos Chem Phys 11 2703ndash2728 2011 wwwatmos-chem-physnet1127032011
C R Flechard et al Dry deposition of reactive nitrogen to European ecosystems 2721
56
19
-23-12
170
-30-16-25-22
-179-169-196
-105
06 08
27 2435
11 13 14
4539
2330
-30
-25
-20
-15
-10
-5
0
5
10
15
20
BE-
Bra
Mod
(N
EU)
BE-
Bra
Mea
s (1
)
NL-
Spe
Mod
(N
EU)
NL-
Spe
Mea
s (2
)
UK
-AM
o M
od (
NEU
)
UK
-AM
o M
eas
(3)
CH
-Oe1
Mod
(N
EU)
CH
-Oe1
Mea
s (4
)
CH
-Oe1
Mea
s (5
)
UK
-EB
u M
od (
NEU
)
UK
-EB
u M
eas
(6)
UK
-EB
u M
eas
(7)
Ann
ual N
H3 F
lux
(kg
N h
a-1 y
r-1)
0
2
4
6
8
10
12
14
16
18
20
NH
3 con
cent
ratio
n (micro
g N
m-3
)
NH3 fluxNH3 concentration
1 Figure 6 2
Fig 6 Comparison of modelled annual NH3 exchange from NEU network DELTA data with measured estimates from historical long-termmicrometeorological flux datasets For five monitoring sites the ensemble average of CBED CDRY EMEP-03 and IDEM is shown witherror bars showing the range (min max) of model estimates (1) Neirynck et al 2007 (2) Erisman et al (1996) (3) Flechard (1998) (4)and (5) data from Flechard et al (2010) showing (4) the annual NH3 flux for background conditions (outside fertilisation events) and (5)the net emission flux from the whole dataset (6) and (7) data from Milford (2004) with (6) the annual dry deposition calculated from thenet overall flux (7) minus the gross annual emission of 42 kg N haminus1 yrminus1 due to grassland management activities (fertilisation cuts) Thesecondary axis shows the mean concentrations during the NEU reference period (2007ndash2008) as well as during the flux monitoring periods
At the only NEU semi-natural site with a long-term NH3flux dataset (UK-AMo) (Flechard 1998) measured annualdry deposition in 1995 (minus25 kg N haminus1 yrminus1) is compatiblewith the range of model estimates in NEU for the 2007ndash2008 reference period and within 10 of the models en-semble mean (minus22 kg N haminus1 yrminus1) For agricultural sys-tems in the NEU network comparisons can only be madeat the managed grasslands CH-Oe1 and UK-EBu For thesefertilised cut andor grazed systems a comparison of mea-surements with inferential models is only meaningful in con-ditions of background NH3 exchange ie discarding mea-sured NH3 emission fluxes that follow the application ofmanure slurry or mineral fertilisers as these processes arenot currently considered nor implemented in inferential rou-tines At CH-Oe1 the overall net measured NH3 budgetwas +17 kg N haminus1 yrminus1 and driven by a gross annual NH3emission by applied cattle slurry of +20 kg N haminus1 yrminus1 butduring most of the year background exchange amounted toa deposition ofminus3 kg N haminus1 yrminus1 (Flechard et al 2010)which is in the range of model predictions within NEU ofminus32 to +01 kg N haminus1 yrminus1 (Table 3) Equally at UK-EButhe overall annual measured NH3 flux was a net emission of+19 kg N haminus1 yrminus1 but discarding the gross NH3 emissionsof +42 kg N haminus1 yrminus1 mostly due to mineral fertiliser andurea applications (Milford et al 2004) one may calculate a
background annual dry deposition ofminus23 kg N haminus1 yrminus1also within the range of the four model estimates basedon NEU 2007ndash2008 data (minus26 to minus02 kg N haminus1 yrminus1Table 3)
332 NOx
The only available annual NOx budget estimates based onlong-term flux measurements are those at BE-Bra NL-Speand UK-Amo NOx flux monitoring was also carried out at anumber of other sites within the NEU project (eg CH-Oe1FR-Gri HU-Bug) but the results were still being analysedand unavailable at the time of writing
The results for BE-Bra NL-Spe and UK-Amo are sum-marised in Table 4 At UK-Amo NOx flux monitoringhas shown that NO2 dry deposition fluxes were small inthe rangeminus1 to minus5 ng NOx-N mminus2 sminus1 but also that theexchange was bi-directional with small NO2 emissions insummer daytime (Fowler et al 1998) This results fromNO emission by the underlying soil with the oxidation byO3 to NO2 generating an effective compensation point forNO2 deposition at low ambient NO2 concentrations theecosystem is a net source of NOx to the atmosphere (Pile-gaard et al 2001) In reality it is at the soil level that atrue compensation point exists for NO which is driven by
wwwatmos-chem-physnet1127032011 Atmos Chem Phys 11 2703ndash2728 2011
2722 C R Flechard et al Dry deposition of reactive nitrogen to European ecosystems
Table 4 Annual NOx exchange based on flux measurements at three NEU sites and comparison with model results for NO2
Measurement-based annual NOx flux Modelled annual NO2 dry deposition1
(kg N haminus1 yrminus1) (kg N haminus1 yrminus1)
Site Above-canopy NOx flux Soil NO emission Average of 4 models (range)(measurement years) (measurement years) (2007ndash2008)
BE-Bra +25 (1999ndash2001)2 Not measured minus53 (minus25 tominus80)
NL-Spe minus28 (1995)3 +292 (2009)4 minus32 (minus15 tominus52)+346 (2008)4
+66 (2002ndash2003)5
+84 (1993)6
UK-Amo minus06 (1995)3 Not measured minus07 (0 tominus11)
1 This study2 Neyrinck et al (2007)3 Erisman et al (1996)4 A Frumau personal communication (2011)5 Pilegaard et al (2006)6 Dorsey et al (2004) flux scaled up from only 3 daysrsquo measurements
microbial nitrification processes close to the surface Giventhe oligotrophic ecosystem and wet to water-logged peatysoil at UK-Amo however the soil NO emission potentialis very low so that the net annual NOx flux is downward andlargely dominated by NO2 stomatal uptake Bearing this inmind the measurement-based NOx dry deposition estimateof minus06 kg NOx-N haminus1 yrminus1 is comparable with the modelensemble average ofminus07 kg NO2-N haminus1 yrminus1 (Table 4)
By contrast the annual measurement-based NOx bud-get for BE-Bra (above the forest canopy) is a net emissionof +25 kg NOx-N haminus1 yrminus1 This has been interpreted asthe result of large NO emissions by the forest floor in thisnitrogen-saturated Scots pine stand (Neyrinck et al 2007)with the within-canopy oxidation by O3 of NO to NO2resulting in a net apparent NO2 evolution from the standDownward NO2 fluxes were only observed at high ambi-ent NO2 concentrations (gt10ndash15 microg NO2-N mminus3) High soilNO emissions non-stationarity and chemical reactions inthe air column between the soil canopy and measurementtower in polluted environments hinder the interpretation ofthe total NOx flux (which is a conserved quantity) into itsNO and NO2 parts (Fowler et al 1998) thus no reliableNO2 dry deposition estimate could be derived for BE-Bra(Neyrinck et al 2007)
Above canopy NOx flux monitoring at NL-Spe pointedto a net annual sink ofminus28 kg NOx-N haminus1 yrminus1 for theyear 1995 (Erisman et al 1996) While this informa-tion also does not allow a direct comparison with modelledNO2 dry deposition from our study and is subject to sub-stantial uncertainty associated with the use of chemilumi-nescence and potential interferences by other NOy speciesit can be set against available soil NO emission (dynamicchambers) data which have been obtained at NL-Spe as
part of several studies over the last two decades (Table 4)Early results from 1993 yielded an annual soil NO emis-sion of +84 kg NO-N haminus1 yrminus1 (Dorsey et al 2004) butthis was based on only a few days data in mid-summerLater as part of the NOFRETETE project and based ona more substantial dataset covering al seasons Pilegaardet al (2006) provided an annual estimate of +66 kg NO-N haminus1 yrminus1 for 2002ndash2003 Unpublished results from theNEU project itself and thus contemporaneous with our mod-elling study indicate still lower annual soil NO emissionsof the order of +3 kg NO-N haminus1 yrminus1 for the years 2008ndash2009 (Table 4) (A Frumau ECN The Netherlands person-nal communication 2011)
The comparison of net ecosystem NOx fluxes and soil NOemissions can only provide a likely range for the annual NO2deposition from the atmosphere Dorsey et al (2004) showedthat a large fraction (around 58 on average) of the emit-ted NO escaped out of the trunk space to react within andabove the canopy at NL-Spe but the fraction that was actu-ally re-captured by foliage is unknown Assuming a meaninter-annual soil NO emission of the order of +5 kg NO-N haminus1 yrminus1 the maximum possible ecosystem NOx-N emis-sion would thus be +29 kg NOx-N haminus1 yrminus1 requiring agross atmospheric NO2 dry deposition of (minus28ndash29 =)ndash57 kg NO2-N haminus1 yrminus1 to yield the observed net NOx flux(1995 data) Conversely if all the NO emitted from soil wasrecycled internally in the ecosystem then the actual NO2 de-position from the atmosphere would only beminus28 kg NO2-N haminus1 yrminus1 which is in the range of values predicted by theinferential models
Atmos Chem Phys 11 2703ndash2728 2011 wwwatmos-chem-physnet1127032011
C R Flechard et al Dry deposition of reactive nitrogen to European ecosystems 2723
These data illustrate the complex nature of NOx deposi-tion the inability of current inferential models to deal withbi-directional exchange and the difficulty of finding long-term NO2 deposition datasets to validate models Net NOxdeposition only occurs at NO2 concentrations in excess ofthe canopy compensation point this mechanism is only in-cluded in a rudimentary manner (4 ppb threshold) in theEMEP-03 model A mechanistic treatment of this effect ininferential models requires the knowledge of the magnitudeof soil NO emissions and of within-canopy chemistry andexchange The prediction of soil NO emissions on the basison N deposition and other environmental factors (Pilegaardet al 2006) could provide a first step in the direction of anintegrated ecosystem NOx exchange approach
34 Reducing uncertainties in Nr dry deposition
The uncertainty of modelled Nr dry deposition at the regionalscale results from the combined uncertainties in concentra-tions of Nr species and in their respective deposition (or ex-change) velocities Establishing a monitoring network forNH3 HNO3 HONO and aerosol NH+4 and NOminus
3 concentra-tions at the continental scale in Europe has been a significantstep forward even if the basic setup did not include NOxand other Nr species except at a few more intensive measure-ment stations Continent-scale networks of a similar sizeeg EMEP (EMEP 2009 Torseth et al 2001) CASTNet(Sickles and Shadwick 2007 Baumgardner et al 2002) andCAPMoN (Zhang et al 2009) have long placed the empha-sis on acidifying gases (SO2 HNO3 NOx) deposition andaerosol-phase Nr (NH+
4 and NOminus
3 ) but have not included thegasparticle partitioning of NHx This has been measuredat selected sites as part of research projects (Erisman et al1996 Zimmermann et al 2006 Neirynck et al 2007) andhas been used to evaluate the output of regional atmosphericmodels at selected sites (Zhang et al 2009) but data on spe-ciated NH3 and NH+
4 concentrations at regional scales havebeen sparse and irregular outside of a few national initiatives(Bleeker et al 2009) High time-resolution measurementswith aerosol mass spectrometer measurements are also be-coming available (Laj et al 2009) although one limitation isthat to date only (ultra-) fine particles can be captured coarsenitrate is not typically measured at the same sites The mon-itoring data gathered as part of NEU allow a large-scale in-vestigation of the relative contributions of NH3 and NH+
4 aswell as HNO3 and NOminus
3 to total dry deposition despite thelarge uncertainties and discrepancies associated with infer-ential models and they also provide important ground vali-dation data for CTMs
The differences in deposition velocities between mod-els (Fig 3) results from both the natural variability in sur-face resistances found in existing Nr flux datasets lead-ing to different parameterisations and from the rarity andcomplexities of flux datasets The physical biological andchemical exchange mechanisms involved are too complex to
model explicitly and completely from first principles so thatparamerisations tend to be empirical but dependent on fewdatasets without the confidence that the statistics of largeor robust numbers afford The recent efforts by Zhang etal (2010) and Massad et al (2010) to bring together the exist-ing NH3 flux and compensation point datasets into coherentand comprehensive exchange schemes for the main ecosys-tem types point in the right direction Significant gaps inknowledge remain especially with respect to surface chem-istry canopy cycling soillittervegetation interactions man-agement practices for agricultural systems which will not bebridged without a more extensive coverage of NH3 fluxesSpecifically more long-term (annual) datasets are needed fora wide variety of land uses including broadleaf forests cropsand legume-rich grasslands located in a wider range of pol-lution climates with semi-arid and tropical regions a prior-ity and also in high NH3 environments such as in the nearvicinity of animal housing Within the NitroEurope IP inten-sive Nr (NH3 HNO3 NOx NOminus
3 NH+
4 ) flux measurementsto improve process understanding at a few core sites of thenetwork have been complemented at other sites by low-costmethods for Nr concentrations (DELTA) and also for fluxes(COTAG or COnditional Time-Averaged Gradient Famu-lari et al 2010) this could serve as a blueprint for a futureEuropean Nr monitoring and modelling strategy
4 Conclusions
Inferential modelling with four dry deposition routines wasapplied to estimate annual Nr fluxes at the ecosystem scaleacross the NitroEurope inferential network Differences be-tween models were reviewed in terms of canopy characteris-tics for the main land use types of derived friction velocityof stomatal conductance and of deposition velocities and ex-change rates for five dominant inorganic Nr chemical speciesin the atmosphere (NH3 HNO3 NO2 and aerosol NH+4 andNOminus
3 ) Differences in stomatal conductances between mod-els are large but this is only decisive for NO2 which is as-sumed to be mainly deposited through stomata Howeverthese models are also routinely used for other pollutant gasessuch as SO2 and O3 for which the stomatal share in the to-tal deposition is also large (see Fowler et al 2009 and ref-erences therein) For water-soluble gases such as NH3 andHNO3 parameterisations of non-stomatal resistances are themain sources of inter-model discrepancies in deposition ve-locities which can reach a factor of 3 between models forNH3 For aerosol Nr deposition to forests empirical andmeasurement-oriented parameterisations predict depositionrates that are a factor 5ndash10 larger than theoretical modelsAs a result both the total modelled Nr fluxes and the sharesof individual Nr species in the overall Nr dry depositionare extremely model-dependent The few NH3 flux datasetsavailable for comparison within this study were within therange of models and broadly comparable with the ensemble
wwwatmos-chem-physnet1127032011 Atmos Chem Phys 11 2703ndash2728 2011
2724 C R Flechard et al Dry deposition of reactive nitrogen to European ecosystems
average but model validation generally suffers from a seri-ous lack of long-term Nr flux monitoring data over differentvegetation types
Inferential modelling was originally based on the con-cept of uni-directional exchange (deposition from the atmo-sphere) and has traditionally viewed vegetation elementsand soil more or less as physical receptors with a given sur-face roughness chemical sink strength and aerosol captureefficiency with little regard to underlying biological and bio-chemical processes The discipline is currently undergoinga paradigm shift recognising the need to increasingly cou-ple ecosystem modelling including soillittervegetation cy-cling as well as cropgrass management and fertilisation tosurfaceatmosphere bi-directional exchange frameworks es-pecially with respect to NH3 and NOx Here compensationpoints need to be made dependent on the N status of theecosystem whether fertilised or unfertilised characterisingemission potentials that interact with advected air massesMajor developments are also needed to better deal with in-canopy air chemistry and phase partitioning that affect the netexchange of NH3 and HNO3 versus NH4NO3 aerosol Sim-ilarly the roles of O3 deposition and emission of biogenicvolatile organic compounds on net NOx fluxes in ecosystemsneed to be better understood Although not considered inthis study uncertainties in wet deposition estimates includ-ing the lack of WSON data add to the total uncertainty in theNr deposition predicted by CTMs
Supplementary material related to thisarticle is available online athttpwwwatmos-chem-physnet1127032011acp-11-2703-2011-supplementpdf
AcknowledgementsThe authors gratefully acknowledge financialsupport by the European Commission (NitroEurope-IP project017841) Many thanks are due to all environmental chemistsand scientists involved in running the DELTA network notleast N van Dijk I Simmons (CEH) U Dammgen J Conrad(FALvTI) V Djuricic S Vidic (MHSC) M Mitosinkova(SHMU) M J Sanz P Sanz J V Chorda (CEAM) M Ferm(IVL) Y Fauvel (INRA) T H Uggerud and the late J E Hanssen(NILU) The assistance of A Freibauer and D Papale in establish-ing this successful partnership with CarboEurope-IP and facilitatingaccess to micrometeorological data was much appreciated and wealso thank all principal investigators managers and operators ofCarboEurope-IP sites for their individual contributions includingR Ceulemans J Neirynck M Aubinet C Moureaux N Buch-mann W Eugster S Etzold C Ammann A Neftel C SpirigM Jocher M V Marek R Czerny W Kutsch E D SchultzeO Kolle C Bernhofer C Rebmann A Don C Don S MullerK Butterbach-Bahl N Bruggemann L Lotte Soerensen K Pile-gaard A Ibrom K Larsen P Soslashrensen H Soegaard A CarraraM T Sebastia T Vesala T Laurila A Lohila E DufreneJ Y Pontailler P Cellier B Loubet S Masson A GranierB Longdoz P Gross D Loustau C Lambrot J F SoussanaK Klumpp O Darsonville S Rambal J M Ourcival Z Tuba
L Horvath M Jones M Saunders F Albanito B Roth G KielyP Leahy N Foley R Valentini G Matteucci P Stefani D Gi-anelle A Cescatti V Magliulo T Bertolini G Seufert G MancaA Meijide Orive S Minerbi L Montagnani W BaumgartnerC Valtingoier E Moors W C M van den Bulk A HensenA Frumau A J Dolman D Hendriks J Olejnik B H ChojnickG B A Pita J S Pereira R Lobo do Vale J Banza A VarlaginA Lindroth M Molder P Vestin J Moncrieff R ClementW Medinets and S Medinets The meteorological data of thestate forest De Inslag (Brasschaat Belgium) have been processedfrom data kindly provided by the Research Institute for Nature andForest (INBO Belgium)
Edited by A S H Prevot
References
Andersen H V Hovmand M Hummelshoslashj P and Jensen N OMeasurements of ammonia concentrations fluxes and dry depo-sition velocities to a spruce forest 1991ndash1995 Atmos Environ33 1367ndash1383 1999
Baldocchi D D Hicks B B and Camara P A canopy stomatalresistance model for gaseous deposition to vegetated surfacesAtmos Environ 21 91ndash101 1987
Bash J O Walker J T Katul G G Jones M R Nemitz Emand Robarge WP Estimation of In-Canopy Ammonia Sourcesand Sinks in a Fertilized Zea mays Field Environ Sci Technol44 1683ndash1689 2010
Bates R G and Pinching G D Dissociation constant of aqueousammonia at 0 to 50C from E m f studies of the ammoniumsalt of a weak acid Am Chem J 72 1393ndash1396 1950
Baumgardner R E Lavery Jr T F Rogers C M and Isil S SEstimates of the Atmospheric Deposition of Sulfur and NitrogenSpecies Clean Air Status and Trends Network 1990ndash2000 En-viron Sci Technol 36 2614ndash2629 2002
Bleeker A Reinds G J Vermeulen A T de Vries W andErisman J W Critical loads and resent deposition thresholdsof nitrogen and acidity and their exceedances at the level II andlevel I monitoring plots in Europe ECN report ECN-Cndash04-117Petten The Netherlands December 2004
Bleeker A Sutton M A Acherman B Alebic-Juretic AAneja V P Ellermann T Erisman J W Fowler D FagerliH Gauger T Harlen K S Hole L R Horvath L Mi-tosinkova M Smith R I Tang Y S and van Pul A Link-ing Ammonia Emission Trends to Measured Concentrations andDeposition of Reduced Nitrogen at different Scales in At-mospheric Ammonia Detecting emission changes and environ-mental impacts edited by Sutton M A Reis S and BakerS M H Springer 123ndash180 2009
Burkhardt J Flechard C R Gresens F Mattsson M JongejanP A C Erisman J W Weidinger T Meszaros R Nemitz Eand Sutton M A Modelling the dynamic chemical interactionsof atmospheric ammonia with leaf surface wetness in a managedgrassland canopy Biogeosciences 6 67ndash84doi105194bg-6-67-2009 2009
Dasgupta P K and Dong S Solubility of ammonia in liquid wa-ter and generation of trace levels of standard gaseous ammoniaAtmos Environ 20 565ndash570 1986
Atmos Chem Phys 11 2703ndash2728 2011 wwwatmos-chem-physnet1127032011
C R Flechard et al Dry deposition of reactive nitrogen to European ecosystems 2725
de Vries W Solberg S Dobbertin M Sterba H Laubhahn DReinds G J Nabuurs G J Gundersen P and Sutton M AEcologically implausible carbon response Nature 451 E1ndashE3doi101038nature06579 2008
Dolman A J Valentini R and Freibauer A (eds) TheContinental-Scale Greenhouse Gas Balance of Europe SpringerEcological Series 203 390 pp ISBN 978-0-387-76568-6Springer New York 2008
Dorsey J R Duyzer J H Gallagher M W Coe H PilegaardK Weststrate J H Jensen N O and Walton S Oxidizednitrogen and ozone interaction with forests I Experimental ob-servations and analysis of exchange with Douglas fir Q J RoyMeteor Soc 130 1941ndash1955 2004
Doskey P V Rao Kotamarthi V Fukui Y Cook D R Breit-beil F W and Wesely M L Air-surface exchange of peroxy-acetyl nitrate at a grassland site J Geophys Res 109 D10310doi1010292004JD004533 2004
Emberson L Ashmore M Simpson D Tuovinen J-P andCambridge H Modelling and mapping ozone deposition in Eu-rope Water Air Soil Poll 130 577ndash582 2001
EMEP (European Monitoring and Evaluation Programme) Trans-boundary Acidification Eutrophication and Ground Level Ozonein Europe in 2007 EMEP Report 12009 available athttpwwwemepintpublreports2009statusreport1 2009pdf Nor-wegian Meteorological Institute 2009
Erisman J W and Wyers G P Continuous measurements of sur-face exchange of SO2 and NH3 implications for their possi-ble interaction in the deposition process Atmos Environ 27A1937ndash1949 1993
Erisman J W van Pul A and Wyers P Parametrization of sur-face resistance for the quantification of atmospheric depositionof acidifying pollutants and ozone Atmos Environ 28 2595ndash2607 1994
Erisman J W Mennen M G Fowler D Flechard C RSpindler G Gruner A Duyzer J H Ruigrok W andWyers G P Towards development of a deposition monitor-ing network for air pollution in Europe Report n 722108015RIVM The Netherlandshttprivmopenrepositorycomrivmbitstream10029104321722108015pdf 1996
Erisman J W Vermeulen A Hensen A Flechard C Damm-gen U Fowler D Sutton M Grunhage L and Tuovinen JP Monitoring and modelling of biosphereatmosphere exchangeof gases and aerosols in Europe Environ Pollut 133 403ndash4132005
Erisman J W Bleeker A Galloway J and Sutton M A Re-duced nitrogen in ecology and the environment Environ Pollut150 140ndash149 2007
Fagerli H and Aas W Trends of nitrogen in air and precipitationModel results and observations at EMEP sites in Europe 1980ndash2003 Environ Pollut 154 448ndash461 2008
Famulari D Fowler D Nemitz E Hargreaves K J Storeton-West R L Rutherford G Tang Y S Sutton M A andWeston K J Development of a low-cost system for measur-ing conditional time-averaged gradients of SO2 and NH3 Envi-ron Monit Assess 161 11ndash27doi101007s10661-008-0723-6 2010
Farquhar G D Firth P M Wetselaar R and Weir B On thegaseous exchange of ammonia between leaves and the environ-ment determination of the ammonia compensation point Plant
Physiol 66 710ndash714 1980Flechard C R Turbulent exchange of ammonia above vegetation
Nottingham University 231 pp 1998Flechard C R and Fowler D Atmospheric ammonia at a moor-
land site II Long term surfaceatmosphere micrometeorologicalflux measurements Q J Roy Meteor Soc 124 759ndash791 1998
Flechard C R Fowler D Sutton M A and Cape J N Adynamic chemical model of bi-directional ammonia exchangebetween semi-natural vegetation and the atmosphere Q J RoyMeteor Soc 125 2611ndash2641 1999
Flechard C R Spirig C Neftel A and Ammann C The annualammonia budget of fertilised cut grassland - Part 2 Seasonalvariations and compensation point modeling Biogeosciences 7537ndash556doi105194bg-7-537-2010 2010
Fowler D Flechard C Skiba U Coyle M and Cape J N Theatmospheric budget of oxidized nitrogen and its role in ozoneformation and deposition New Phytol 139 11ndash23 1998
Fowler D Flechard C Cape J N Storeton-West R L andCoyle M Measurements of ozone deposition to vegetationquantifying the flux the stomatal and non-stomatal componentsWater Air Soil Poll 130 63ndash74 2001
Fowler D Pilegaard K Sutton M A Ambus P Raivonen MDuyzer J Simpson D and 50 others Atmospheric composi-tion change EcosystemsndashAtmosphere interactions Atmos Env-iron 43 5193ndash5267 2009
Gallagher M W Beswick K M Duyzer J Westrate HChoularton T W and Hummelshoslashj P Measurements ofaerosol fluxes to Speulder forest using a micrometeorologicaltechnique Atmos Environ 31 359ndash373 1997
Gallagher M W Nemitz E Dorsey J R Fowler D SuttonM A Flynn M and Duyzer J H Measurements and pa-rameterisations of small aerosol deposition velocities to grass-land arable crops and forests Influence of surface roughnesslength on deposition J Geophys Res 107(D12) 8-1ndash8-10doi1010292001JD000817 2002
Galloway J N Aber J D Erisman J W Seitzinger S PHowarth R W Cowling E B and Cosby B J The Nitro-gen Cascade BioScience 53(4) 341ndash356 2003
Garland J A The dry deposition of sulphur dioxide to land andwater surfaces P R Soc London A354 245ndash268 1977
Ge X Wexler A S and Clegg S L Atmospheric Amines ndash PartI A Review Atmos Environ 45 524ndash546 2011
Genermont S and Cellier P A mechanistic model for estimat-ing ammonia volatilization from slurry applied to bare soil AgrForest Meteorol 88 145ndash167 1997
Gonzalez Benıtez J M Cape J N and Heal M R Gaseous andparticulate water-soluble organic and inorganic nitrogen in ruralair in southern Scotland Atmos Environ 44 1506ndash1514 2010
Hicks B B Dry deposition to forests ndash On the use of data fromclearings Agr Forest Meteorol 136 214ndash221 2006
Jarvis P G The interpretation of the variations in leaf water po-tential and stomatal conductance found in canopies in the fieldPhilos T Roy Soc B273 593ndash610 1976
Joutsenoja T Measurements of aerosol deposition to a cereal cropin Measurements and Modelling of Gases and Aerosols to Com-plex Terrain NERC Report GR37259 edited by Choularton TW Nat Environ Res Counc UK 1992
Laj P Klausen J Bilde M Plaszlig-Duelmer C Pappalardo GClerbaux C Baltensperger U and 46 others Measuring atmo-
wwwatmos-chem-physnet1127032011 Atmos Chem Phys 11 2703ndash2728 2011
2726 C R Flechard et al Dry deposition of reactive nitrogen to European ecosystems
spheric composition change Atmos Environ 43 5351ndash54142009
Lovett G M and Lindberg S E Atmospheric deposition andcanopy interactions of nitrogen in forests Can J Forest Res23 1603ndash1616 1993
Magnani F Mencuccini M Borghetti M Berbigier PBerninger F Delzon S Grelle A Hari P Jarvis P G Ko-lari P Kowalski A S Lankreijer H Law B E LindrothA Loustau D Manca G Moncrieff J B Rayment MTedeschi V Valentini R and Grace J The human footprintin the carbon cycle of temperate and boreal forests Nature 447848ndash851 2007
Massad R S Loubet B Tuzet A and Cellier P Relation-ship between ammonia stomatal compensation point and nitro-gen metabolism in arable crops Current status of knowledge andpotential modelling approaches Environ Pollut 154 390ndash4032008
Massad R-S Nemitz E and Sutton M A Review and param-eterisation of bi-directional ammonia exchange between vegeta-tion and the atmosphere Atmos Chem Phys 10 10359ndash10386doi105194acp-10-10359-2010 2010
Matt D R and Meyers T P On the use of the inferentialtechnique to estimate dry deposition of SO2 Atmos Environ27A(4) 493ndash501 1993
Meyers T P Finkelstein P L Clarke J Ellestad T G and SimsP A multilayer model for inferring dry deposition using stan-dard meteorological measurements J Geophys Res 103(22)645ndash661 1998
Milford C Dynamics of atmospheric ammonia exchange withintensively-managed grassland PhD Thesis University of Ed-inburgh 230 pp 2004
Monteith J L and Unsworth M H Principles of EnvironmentalPhysics 2nd edition Edward Arnold London 291 pp 1990
Nemitz E Sutton M A Schjoerring J K Husted S and WyersG P Resistance modelling of ammonia exchange over oilseedrape Agr Forest Meteorol 105 405ndash425 2000a
Nemitz E Sutton M A Gut A San Jose R Husted Sand Schjoslashrring J K Sources and sinks of ammonia withinan oilseed rape canopy Agr Forest Meteorol 105 385ndash4042000b
Nemitz E Milford C and Sutton MA A two-layercanopy compensation point model for describing bi-directionalbiosphere-atmosphere exchange of ammonia Q J Roy MeteorSoc 127 815ndash833 2001
Nemitz E Gallagher M W Duyzer J H and Fowler D Mi-crometeorological measurements of particle deposition veloc-ities to moorland vegetation Q J Roy Meteor Soc 128A2281ndash2300 2002
Nemitz E Loubet B Lehmann B E Cellier P Neftel AJones S K Hensen A Ihly B Tarakanov S V and Sut-ton M A Turbulence characteristics in grassland canopies andimplications for tracer transport Biogeosciences 6 1519ndash1537doi105194bg-6-1519-2009 2009
Neirynck J and Ceulemans R Bidirectional ammonia exchangeabove a mixed coniferous forest Environ Pollut 154 424ndash4382008
Neirynck J Kowalski A S Carrara Am and Ceulemans RDriving forces for ammonia fluxes over mixedforest subjected tohigh deposition loads Atmos Environ 39 5013ndash5024 2005
Neirynck J Kowalski A S Carrara A Genouw G BerghmansP and Ceulemans R Fluxes of oxidised and reduced nitro-gen above a mixed coniferous forest exposed to various nitrogenemission sources Environ Pollut 149 31ndash43 2007
Personne E Loubet B Herrmann B Mattsson M SchjoerringJ K Nemitz E Sutton M A and Cellier P SURFATM-NH3 a model combining the surface energy balance and bi-directional exchanges of ammonia applied at the field scale Bio-geosciences 6 1371ndash1388doi105194bg-6-1371-2009 2009
Petroff A Mailliat A Amielh M and Anselmet F Aerosoldry deposition on vegetative canopies Part I Review of presentknowledge Atmos Environ 42 3625ndash3653 2008a
Petroff A Mailliat A Amielh M and Anselmet F Aerosoldry deposition on vegetative canopies Part II A new modellingapproach and applications Atmos Environ 42 3654ndash36832008b
Pilegaard K Airndashsoil exchange of NO NO2 and O3 in forestsWater Air Soil Poll Focus 1 79ndash88 2001
Pilegaard K Skiba U Ambus P Beier C Bruggemann NButterbach-Bahl K Dick J Dorsey J Duyzer J GallagherM Gasche R Horvath L Kitzler B Leip A Pihlatie MK Rosenkranz P Seufert G Vesala T Westrate H andZechmeister-Boltenstern S Factors controlling regional differ-ences in forest soil emission of nitrogen oxides (NO and N2O)Biogeosciences 3 651ndash661doi105194bg-3-651-2006 2006
Pryor S C Larsen S E Sorensen L L Barthelmie R JGroenholm T Kulmala M Launiainen S Rannik U andVesala T Particle fluxes over forests Analyses of flux meth-ods and functional dependencies J Geophys Res 112 D07205doi1010292006JD008066 2007
Pryor S C Gallagher M Sievering H Larsen S E BarthelmieR J Birsan F Nemitz E Rinne J Kulmala M GroenholmT Taipale R and Vesala T A review of measurement andmodelling results of particle atmosphere-surface exchange Tel-lus 60 42ndash75 2008a
Pryor S C Larsen S E Sorensen L L and Barthelmie R JParticle fluxes above forests Observations methodological con-siderations and method comparisons Environ Poll 152 667ndash678 2008b
Ruijgrok W Tieben H and Eisinga P The dry deposition ofparticles to a forest canopy a comparison of model and experi-mental results Atmos Environ 31 399ndash415 1997
Schjoslasherring J K Husted S and Mattsson M Physiological pa-rameters controlling plant-atmosphere ammonia exchange At-mos Environ 32 491ndash498 1998
Schwede D Zhang L Vet R and Lear G An intercomparisonof the deposition models used in the CASTNET and CAPMoNnetworks Atmos Environ 45 1337ndash1346 2011
Seinfeld J H and Pandis S N Atmospheric chemistry andphysics From Air Pollution to climate Change Second editionJohn Wiley and Sons Inc 2006
Sickles J E and Shadwick D S Seasonal and regional air qualityand atmospheric deposition in the eastern United States J Geo-phys Res 112 D17302doi1010292006JD008356 2007
Simpson D Fagerli H Jonson J E Tsyro S Wind P andTuovinen J-P Transboundary Acidification Eutrophicationand Ground Level Ozone in Europe Part I Unified EMEP ModelDescription EMEP Status Report 2003 ISSN 0806-4520 DetMeteorologisk Institutt Oslo 2003
Atmos Chem Phys 11 2703ndash2728 2011 wwwatmos-chem-physnet1127032011
C R Flechard et al Dry deposition of reactive nitrogen to European ecosystems 2727
Simpson D Butterbach-Bahl K Fagerli H Kesik M SkibaU and Tang S Deposition and Emissions of Reactive Nitrogenover European Forests A Modelling Study Atmos Environ 405712ndash5726 2006a
Simpson D Fagerli H Hellsten S Knulst J C and WestlingO Comparison of modelled and monitored deposition fluxesof sulphur and nitrogen to ICP-forest sites in Europe Biogeo-sciences 3 337ndash355doi105194bg-3-337-2006 2006b
Simpson D Gauss M Tsyro S and Valdebenito A ModelUpdates In ldquoTransboundary acidification eutrophication andground level ozone in Europerdquo EMEP Status Report 12010 TheNorwegian Meteorological Institute Oslo Norway available atwwwemepint 105ndash109 2010
Slinn W G N Predictions for particle deposition to vegetativecanopies Atmos Environ 16 1785ndash1794 1982
Smith R I Fowler D Sutton M A Flechard C and Coyle MRegional estimation of pollutant gas deposition in the UK modeldescription sensitivity analyses and outputs Atmos Environ34 3757ndash3777 2000
Steinbacher M Zellweger C Schwarzenbach B Bugmann SBuchmann S Ordonez C Prevot A S H and HueglinC Nitrogen oxides measurements at rural sites in SwitzerlandBias of conventional measurement techniques J Geophys ResD11307doi1010292006JD007971 2007
Sutton M A Fowler D Moncrieff J B and Storeton-WestR L The exchange of atmospheric ammonia with vegetatedsurfaces II Fertilized vegetation Q J Roy Meteor Soc 1191047ndash1070 1993
Sutton M A Burkhardt J K Guerin D Nemitz E and FowlerD Development of resistance models to describe measurementsof bi-directional ammonia surface atmosphere exchange AtmosEnviron 32(3) 473ndash480 1998
Sutton M A Tang Y S Miners B and Fowler D A new dif-fusion denuder system for long-term regional monitoring of at-mospheric ammonia and ammonium Water Air Soil Poll Focus1 145ndash156 2001
Sutton M A Nemitz E Erisman JW Beier C Butterbach-Bahl K Cellier P de Vries W Cotrufo F Skiba U DiMarco C Jones S Laville P Soussana J F Loubet BTwigg M Famulari D Whitehead J Gallagher M W Nef-tel A Flechard C R Herrmann B Calanca P L Schjo-erring J K Daemmgen U Horvath L Tang Y S Em-mett BA Tietema A Penuelas J Kesik M BrueggemannN Pilegaard K Vesala T Campbell C L Olesen J EDragosits U Theobald M R Levy P Mobbs D C MilneR Viovy N Vuichard N Smith J U Smith P BergamaschiP Fowler D and Reis S Challenges in quantifying biosphere-atmosphere exchange of nitrogen species Environ Pollut 150125ndash139 2007
Sutton M A Simpson D Levy P E Smith R I Reis S vanOijen M and de Vries W Uncertainties in the relationshipbetween atmospheric nitrogen deposition and forest carbon se-questration Glob Change Biol 14 2057ndash2063 2008
Tang Y S Simmons I van Dijk N Di Marco C NemitzE Dammgen U Gilke K Djuricic V Vidic S Gliha ZBorovecki D Mitosinkova M Hanssen J E Uggerud T HSanz M J Sanz P Chorda J V Flechard C R FauvelY Ferm M Perrino C and Sutton M A European scaleapplication of atmospheric reactive nitrogen measurements in a
low-cost approach to infer dry deposition fluxes Agr EcosystEnviron 133 183ndash195 2009
Tang Y S Dammgen U Conrad J Djuricic V Vidic SFlechard C R Mitosinkova M Sanz M J Uggerud T HBorovecki D Chorda J V Fauvel Y Gilke K Gliha ZSanz P Simmons I van Dijk N Ferm M Nemitz E andSutton M A Temporal and spatial variability in reactive inor-ganic trace gas and aerosol concentrations across Europe AtmosChem Phys Discuss in preparation 2011
Torseth K Semb A Schaug J Hanssen J and Aamlid DProcesses affecting deposition of oxidised nitrogen and associ-ated species in the coastal areas of Norway Atmos Environ 34207ndash217 2000
Torseth K Aas W and Solberg S Trends in airborne suplhurand nitrogen compounds in Norway during 1985ndash1996 in rela-tion to air mass origin Water Air Soil Poll 130 1493ndash14982001
Tuovinen J-P Emberson L and Simpson D Modellingozone fluxes to forests for risk assessment status andprospects Annals of Forest Science 66 401 401p1ndash401p14doi101051forest2009024 2009
Turnipseed A A Huey L G Nemitz E Stickel R Higgs JTanner D J Slusher D L Sparks J P Flocke F and Guen-ther A Eddy covariance fluxes of peroxyacetyl nitrates (PANs)and NOy to a coniferous forest J Geophys Res 111 D09304doi1010292005JD006631 2006
UNECE Protocol to the 1979 Convention on long-range trans-boundary air pollution to abate acidification eutrophication andground-level ozone United Nations Economic Commission forEurope Genevahttpwwwuneceorgenvlrtapmultih1htm1999
van Jaarsveld J A The Operational Priority Substances modelDescription and validation of OPS-Pro 41 RIVM report5000450012004 RIVM Bilthoven the Netherlands 2004
Vieno M The use of an Atmospheric Chemistry-Transport Model(FRAME) over the UK and the development of its numerical andphysical schemes PhD thesis University of Edinburgh 2005
Wesely M L Parameterization of surface resistances to gaseousdry deposition in regional-scale numerical models Atmos Env-iron 23 1293ndash1304 1989
Wesely M L and Hicks B B Some factors that affect the depo-sition rates of sulfur dioxide and similar gases on vegetation JAir Poll Cont Assoc 27 1110ndash1116 1977
Wesely M L and Hicks B B A review of the current status ofknowledge on dry deposition Atmos Environ 34 2261ndash22822000
Wesely M L Cook D R Hart R L and Speer R E Mea-surements and parameterization of particle sulfur deposition overgrass J Geophys Res 90 2131ndash2143 1985
Wichink Kruit R J van Pul W A J Sauter F J van den BroekM Nemitz E Sutton M A Krol M and Holtslag A AM Modelling the surface-atmosphere exchange of ammoniaAtmos Environ 44(7) 945ndash957 2010
Wolfe G M Thornton J A Yatavelli R L N McKay MGoldstein A H LaFranchi B Min K-E and Cohen R CEddy covariance fluxes of acyl peroxy nitrates (PAN PPN andMPAN) above a Ponderosa pine forest Atmos Chem Phys 9615ndash634doi105194acp-9-615-2009 2009
Wolff V Trebs I Foken T and Meixner F X Exchange of
wwwatmos-chem-physnet1127032011 Atmos Chem Phys 11 2703ndash2728 2011
2728 C R Flechard et al Dry deposition of reactive nitrogen to European ecosystems
reactive nitrogen compounds concentrations and fluxes of to-tal ammonium and total nitrate above a spruce canopy Biogeo-sciences 7 1729ndash1744doi105194bg-7-1729-2010 2010
Wu Y Brashers B Finkelstein P L and Pleim J E A multi-player biochemical dry deposition model I Model formulationJ Geophys Res 108(D1) 4013doi1010292002JD0022932003
Wu Y Walker J Schwede D Peters-Lidard C Dennis R andRobarge W A new model of bi-directional ammonia exchangebetween the atmosphere and biosphere Ammonia stomatal com-pensation point Agr Forest Meteorol 149 263ndash280 2009
Wyers G P and Erisman J W Ammonia exchange over conifer-ous forest Atmos Environ 32 441ndash451 1998
Zhang L Gong S Padro J and Barrie L A size-segragatedparticle dry deposition scheme for an atmospheric aerosol mod-ule Atmos Environ 35 549ndash560 2001
Zhang L Brook J R and Vet R A revised parameterizationfor gaseous dry deposition in air-quality models Atmos ChemPhys 3 2067ndash2082doi105194acp-3-2067-2003 2003
Zhang L Vet R Wiebe A Mihele C Sukloff B ChanE Moran M D and Iqbal S Characterization of the size-segregated water-soluble inorganic ions at eight Canadian ruralsites Atmos Chem Phys 8 7133ndash7151doi105194acp-8-7133-2008 2008
Zhang L Vet R OrsquoBrien J M Mihele C Liang Z andWiebe A Dry deposition of individual nitrogen species ateight Canadian rural sites J Geophys Res 114 D02301doi1010292008JD010640 2009
Zhang L Wright L P and Asman W AH Bi-directional air-surface exchange of atmospheric ammonia - A review of mea-surements and a development of a big-leaf model for applicationsin regional-scale air-quality models J Geophys ResndashAtmosdoi1010292009JD013589 in press 2010
Zimmermann F Plessow K Queck R Bernhofer Cand Matschullat J Atmospheric N- and S-fluxes toa spruce forest-Comparison of inferential modelling andthe throughfall method Atmos Environ 40 4782ndash4796doi101016jatmosenv200603056 2006
Atmos Chem Phys 11 2703ndash2728 2011 wwwatmos-chem-physnet1127032011
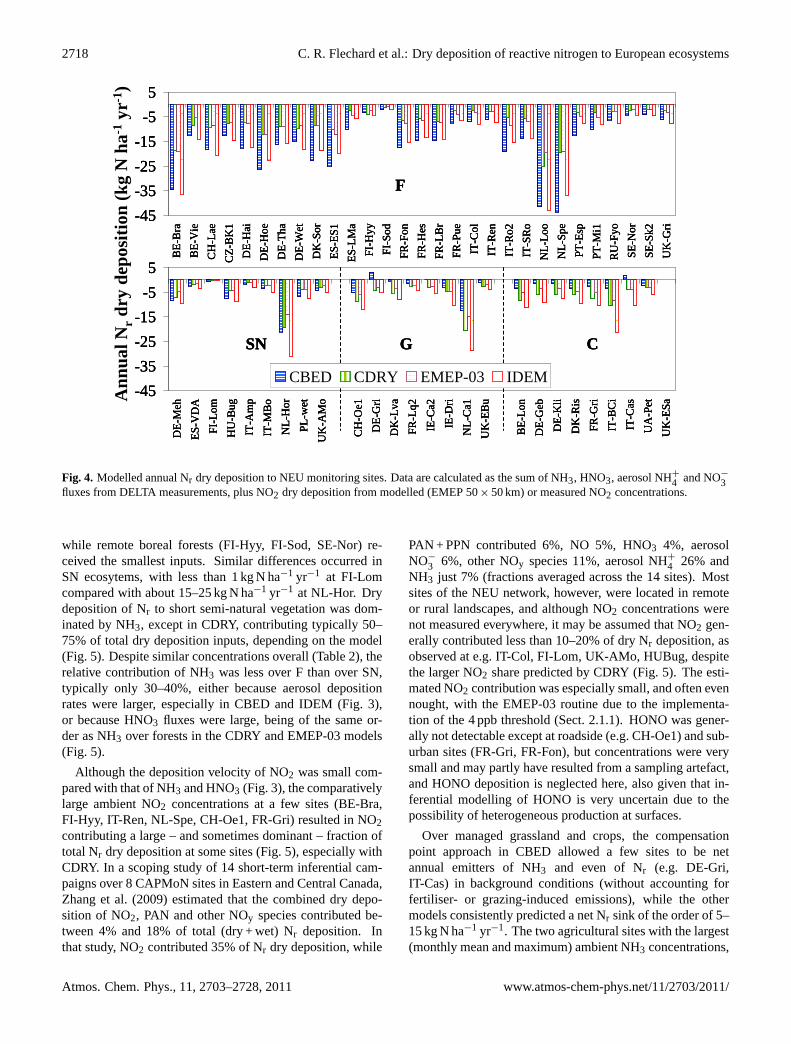