dsd-int 2015 - application of delft3 d to lake geneva - frederic soulignac
TRANSCRIPT

1: The French National Institute for Agricultural Research - Inra Lake Hydrobiology Unit, Thonon-les-Bains, France
Application of Delft3D to Lake Geneva: towards the assessment of the representativeness of one
sampling location in large lakes
Delft3D User Meeting - 04 November 2015
Frédéric Soulignac1, P.-A. Danis2,10, D. Bouffard3, V. Chanudet4, E. Dambrine5, Y. Guenand6, B. Guillermin1,
T. Harmel7,10,2, B. Ibelings8, I. Kiefer3, D. Trevisan1, R. Uittenbogaard9 and O. Anneville1
3 4 5 6 7 8 9 10
2: The French National Agency for Water and Aquatic Environments

Context
• In 2000, the European Parliament set out the European Water Framework Directive for managing and protecting water bodies in Europe.
• Classification of water bodies into ecological status
• For lakes, the assessment of this status is based on: – Biological indicators
– Physical-chemical indicators
– Hydro-morphological indicators
• Sampling method – Integrated samples in the euphotic zone over the deepest point of the lake
– At least 4 observations per year over the growing season
• Spatial heterogeneities in large lakes
• Representativeness of those data versus the whole lake needs to be verified (Kiefer et al. , 2015)
Introduction Material and methods Results Conclusion
2

Objective and method
• Does spatial heterogeneities in large lakes bias our estimation of their ecological status ?
• Chlorophyll-a
• To combine
– Data analysis of in-situ and remote satellite data
– 3D modeling
Introduction Material and methods Results Conclusion
3

Lake Geneva
Introduction Material and methods Results Conclusion
Image adapted from http://www.cipel.org
Monitoring station SHL2
Lake Geneva catchment (7 419 km2)
Catchment of the Rhône river after Lake Geneva
Rivers
Border France-Switzerland
Lake Geneva Altitude = 372 m Surface area = 580 km2
Mean depth = 153 m Max depth = 309 m Rhône inflow = 182 m3/s Rhône outflow = 250 m3/s Residence time = 11 years Volume = 89 km3
4 Lake Geneva provides numerous ecosystem services.

Data
• In-situ lake monitoring
– 1 station: SHL2 (deepest point, 309 m)
– 1 or 2 samples per month since 1963
– CTD and dissolved oxygen vertical profiles (1 m resolution)
– Physical-chemical parameters at 20 depths between surface and bottom
– Chlorophyll-a concentration at 10 depths between surface and 30 m depth
– Phytoplankton abundance and composition (0-18 m depth-integrated)
– Zooplankton abundance and composition (0-50 m depth-integrated)
• Satellite: MERIS sensor (https://earth.esa.int/)
– Processing done with FUB WeW algorithm (Schroeder et al., 2007)
– 624 images of surface chlorophyll-a concentration from 2002 to 2012 (300 m resolution)
Introduction Material and methods Results Conclusion
Monitoring point SHL2
5
Satellite images processed by Isabel Kiefer, EPFL, Lausanne, Switzerland

Chlorophyll-a measurements
In-situ at SHL2 Satellite
Introduction Material and methods Results Conclusion
11/04/2010
SHL2
6
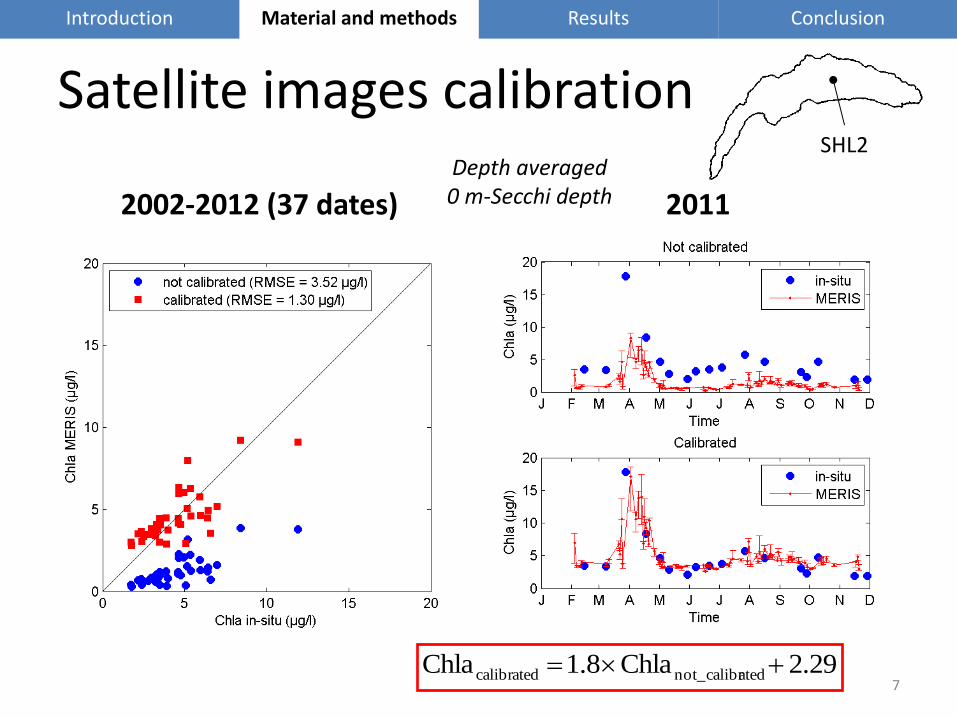
Satellite images calibration
2002-2012 (37 dates) 2011
Introduction Material and methods Results Conclusion
SHL2
2.29Chla8.1Chla atednot_calibrcalibrated 7
Depth averaged 0 m-Secchi depth

Satellite correction
Not calibrated Calibrated
Introduction Material and methods Results Conclusion
2.29Chla8.1Chla atednot_calibrcalibrated
8 But what does really see the satellite ?

What does see the satellite ?
In-situ at SHL2 Satellite (calibrated)
Introduction Material and methods Results Conclusion
Satellite does not see algal development below Sd.
SHL2
9

Processes: • Ocean heat flux model • k-ε turbulence closure model • BLOOM phytoplankton module • Grazing of phytoplankton by zooplankton • Nitrification and denitrification • Mineralization and settling of detritus • Light extinction by phytoplankton • Reaeration
State variables: • Water temperature • Nutrients: NH4, NO3, PO4, SiO2 • Phytoplankton: Diatoms and Green algae • Dissolved oxygen • Detritus (POC, PON, POP)
Delft3D set-up
Introduction Material and methods Results Conclusion
Hydrodynamics Delft3D-Flow
Initial conditions
Simulation results
Forcing: • Meteorology • Rivers (flow) • Transparency
Ecology Delft3D-ECO
Forcing: • Photosynthetically active radiation • Rivers (composition) • Grazing by zooplankton
Simulation results
10
Initial conditions
Hydrodynamic grid: curvilinear grids, 400 m resolution, Z-layers Ecological grid: 3 x 3 horizontal aggregated
Hydrodynamics set-up by Damien Bouffard, EPFL, Lausanne, Switzerland

Model parameters
11
Introduction Material and methods Results Conclusion
Parameter Value
Delft3D-Flow
Secchi depth 5 m
Wind drag coefficient For young waves and limited fetch (Smith, 1991)
Cd = 0.001 if U ≤ 3 m/s 10*Cd = 0.63 + 0.12*U if U > 3 m/s
Stanton number 0.00145 (default)
Dalton number 0.0015 (default)
Coefficient for the free convection 0.14 (default)
Background horizontal viscosity and diffusivity of heat 10 m2 s-1
Background vertical viscosity and diffusivity of heat 10-6 m2 s-1
Ozmidov length 0 m (default)
Delft3D-ECO
Background extinction of visible light 0.12 m-1
Mineralisation rate 0.04 d-1
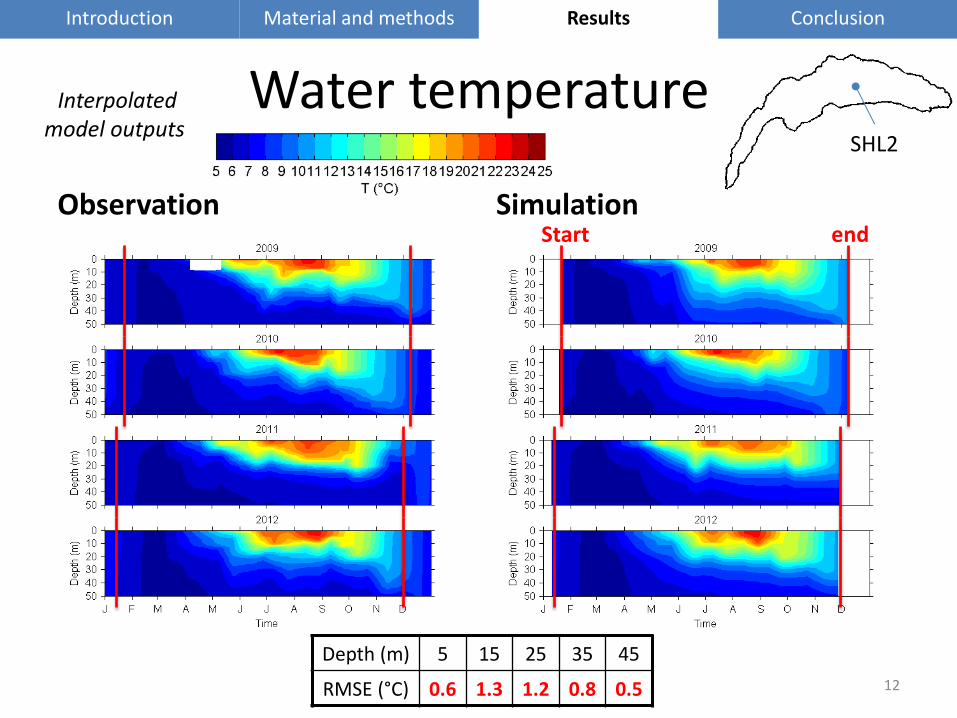
Water temperature
Observation Simulation
12
Introduction Material and methods Results Conclusion
SHL2
Start end
Interpolated model outputs
Depth (m) 5 15 25 35 45
RMSE (°C) 0.6 1.3 1.2 0.8 0.5

Water temperature
13
Introduction Material and methods Results Conclusion
SHL2
Model reproduces well the water temperature in 2010, 2011 and 2012.
Hourly model outputs
In 2009, problem with data used to force the model.

Chlorophyll-a
14
Introduction Material and methods Results Conclusion
SHL2
The model overestimates the algal development in spring. The model reproduces well the chlorophyll-a concentration from May to September.
Depth averaged 0-30 m

Chlorophyll-a
Observation Simulation
Introduction Material and methods Results Conclusion
15
21/04/2011
Observation at 10 o’clock in the morning Simulation: update of the BLOOM module at midnight
The model succeeded in reproducing several observed spatial heterogeneities.
Depth averaged 0 m-Secchi depth

Chlorophyll-a
Observation Simulation
Introduction Material and methods Results Conclusion
16
05/05/2011
Observation at 10 o’clock in the morning Simulation: update of the BLOOM module at midnight
Depth averaged 0 m-Secchi depth
The model succeeded in reproducing several observed spatial heterogeneities.

Chlorophyll-a
Observation Simulation
Introduction Material and methods Results Conclusion
17
10/08/2011
Observation at 10 o’clock in the morning Simulation: update of the BLOOM module at midnight
Depth averaged 0 m-Secchi depth
The model succeeded in reproducing several observed spatial heterogeneities.

Towards the assessment of representativeness of one monitoring station
Introduction Material and methods Results Conclusion
18
Depth averaged 0-30 m

Conclusions and perspectives
• The model reproduced well the water temperature.
• The model succeeded in catching several observed spatial heterogeneities of Chlorophyll-a by the satellite.
• To improve model performances (until the end of 2015)
– Algal development onset in spring is very sensitive to the hydrodynamics
• To use the model (2016)
– To assess the representativeness of one lake monitoring station in large lakes
– To better understand the reoligotrophication process in Lake Geneva: long-term phytoplankton dynamics with phosphorus concentration decreasing
– To analyse impacts of extreme climate events (storms, heat waves)
– Temporal variability of spatial heterogeneities
Introduction Material and methods Results Conclusion
19

1: The French National Institute for Agricultural Research - Inra Lake Hydrobiology Unit, Thonon-les-Bains, France
Thank You !
Delft3D User Meeting - 04 November 2015
Frédéric Soulignac1, P.-A. Danis2,10, D. Bouffard3, V. Chanudet4, E. Dambrine5, Y. Guenand6, B. Guillermin1,
T. Harmel7,10,2, B. Ibelings8, I. Kiefer3, D. Trevisan1, R. Uittenbogaard9 and O. Anneville1
3 4 5 6 7 8 9 10
2: The French National Agency for Water and Aquatic Environments